Embed Size (px)
Citation preview
s
C e n t e r f o r E f f e c t i v e O r g a n i zU n i v e r s i t y o f S o u t h e r n C a l i
(2 1 3) 7 4 0 - 9 8http://www
Center for Effective Organization
PAY PRACTICES IN
FORTUNE 1000 CORPORATIONS
CEO PUBLICATION G 03-20 (448)
EDWARD E. LAWLER III
Center for Effective Organizations Marshall School of Business
University of Southern California
August 2003
a t i o n s - M a r s h a l l S c h o o l o f B u s i n e s s f o r n i a - L o s A n g e l e s, C A 9 0 0 8 9 – 0 8 0 6 1 4 FAX (213) 740-4354
.marshall.usc.edu/ceo
Pay Practices in Fortune 1000 Corporations
Edward E. Lawler III
University of Southern California
Are the reward systems in major US corporations changing? As part of its triennial
survey of organizational performance improvement efforts, the Center for Effective
Organizations has gathered data on the pay practices of large corporations since 1987. The
results of the five surveys from 1987 to 1999 show, among other things, the tendency for
corporations to increase their use of pay for performance systems, and the decline in the
employment security commitments of corporations (Lawler, Mohrman and Benson, 2001).
The period from 1999 to 2002 was one of considerable change in US corporations.
The dot-com bust, corporate scandals, and increasing concern about stock option overhangs
all occurred during this period. In order to track how much these and other events changed
the pay practices of large US corporations, the Center for Effective Organizations conducted
its sixth triennial survey of employee involvement and reward system practices in 2002.
Methodology
Surveys were mailed to most of the Fortune 1000 corporations in 2002. As in the
previous five surveys, the mailings went to the CEO with the request that he or she either
complete it or give it to somebody who is knowledgeable about their corporate practices.
The same questions about pay practices that were asked in the previous surveys were
included in the 2002 survey. As in the past, definition of the practices was provided in a
glossary case (Exhibit 1). For each practice, the respondents were asked to indicate the
percentage of their employees who are covered by it.
1
Forty-eight percent of the questionnaire responses were received from somebody in
the human resources organization, while 13% were received from the chief executive officer.
The remainder came from a variety of other members of the organization. The response rate
was approximately 16% (149 respondents), which matched closely the response rate in the
last two surveys. The comparison between the characteristics of the companies responding in
2002 and those responding to earlier surveys shows that they represent comparable samples.
In comparison to the overall Fortune 1000 sample, the companies responding in 2002 were
slightly larger than those not responding.
Pay for Performance
Table 1 presents the results for the pay for performance reward system practices
studied. The results show an overall movement toward more pay for performance in 2002.
This continues the trend of most pay for performance systems gaining popularity since 1987.
The largest gain is in individual incentive plans. They cover many more individuals
today than they did in 1987 and, indeed, more than they did in 1999. Obviously,
organizations are doing more to tie individual performance to pay, and doing it in ways that
use variable pay. This, of course, is in line with the many articles and books which suggest
that variable pay is the best way to relate pay to performance (see e.g. Lawler, 2000;
Zingheim and Schuster, 2000).
It is somewhat surprising that organizations have chosen to increase the use of pay for
performance at the individual level given the increased adoption of teams and other practices
which suggest that the use of collective incentive plans might be more appropriate. The
movement toward the use of teams and other approaches to employee involvement does
show up in the increased popularity of work team incentives. In 1990, only 59% of the
2
company had group plans while in 2002 82% had them. They have increased in popularity in
every study since 1990, and they gained slightly in popularity from 1999 to 2002. However,
in terms of absolute level of popularity, they are behind individual incentives.
Gainsharing plans also show a significant increase from 1987 to 2002. However,
their popularity is not close to that of work group or individual incentives, and their increase
in popularity since 1993 has been relatively small. This probably reflects the fact that
gainsharing simply is not applicable to all organizations, and that its growth is limited by its
structure and its requirements for metrics. Further, it is has been applied most frequently in
manufacturing settings, and the Fortune 1000 companies have few and fewer manufacturing
employees and operations.
Profit sharing shows a slight increase from 1999 to 2002, and a larger increase from
1987. It is widely adopted, with 71% of the corporations using it, a small increase from its
use in 1987. When it is used, it often covers almost all employees in an organization.
Employee stock ownership plans have the highest level of coverage among the pay
for performance plans. They are second only to individual incentive plans in terms of the
percentage of companies that use them. Like profit sharing plans, they are in over 70% of
US corporations, and when they are installed they, more than any other approach, cover all of
the employees in an organization (see Rosen, Klein & Young, 1986, for more information on
stock ownership).
Stock option plans are less popular than stock ownership plans (mean of 3.2 vs. 4.3),
but among the financial incentive plans they are second to only individual incentive plans in
terms of the percent of corporations which have them. Despite the publicity surrounding
those corporations which give stock options to all employees, only nine-percent of
3
corporations report that they give options to all their employees. This is in noticeable
contrast to stock ownership plans where 33% of the corporations report that their stock
option plans cover all employees. It is also interesting to note that option plans did not gain
in popularity from 1999 to 2002, perhaps because of the poor performance of the stock
market and growing concerns about option overhang and option expensing (for more
information on option plans, see Blasi, Kruse & Bernstein, 2003).
The major conclusion about stock option plans, therefore, seems to be that they are
not increasing in popularity and are restricted to, in most cases, a relatively small percentage
of the employees in most organizations. The most common answer to the question of percent
covered is 1 – 20%. This undoubtedly reflects the fact that stock option plans tend to go to
the top executive group, not to all employees.
The most popular performance based reward plans are non-monetary recognition
plans. They have grown in popularity since 1990, and are in almost all corporations. Only
four-percent of the corporations report that they have no non-monetary recognition rewards
for performance. Despite their popularity, corporations do not necessarily cover all
employees with them. Only 25% of the corporations report that they cover 100% of their
employees with non-monetary rewards for performance.
Table 2 shows the concentration of pay for performance programs in corporations. It
shows that since 1990 more and more organizations are adopting multiple pay for
performance systems. As of 2002, only 14% had none of the pay for performance practices
studied covering 40% or more of their employees; a noticeable change from 1990, when 29%
had none of them covering more than 40% or more of their employees. As of 2002, 62%
used two or more of the practices with more than 40% of their employees, while in 1990 only
4
34% used two or more of the practices. This further emphasizes the point that organizations
are increasingly using multiple pay for performance practices.
Overall, the results in Table 1 and Table 2 show an increasing tendency for
organizations to tie rewards to performance. There are more individuals covered by
individual reward for performance plans, group and team reward plans, stock ownership
plans, profit sharing plans and stock option plans than there ever have been in U.S.
corporations.
There are some major important differences in the adoption patterns of the various
approaches to rewarding performance. Stock ownership plans and non-monetary recognition
plans tend to cover more of the employees in an organization than any other kind of reward
for performance plan. Stock option plans and work group incentives, although used by a
relatively high percentage of companies, tend to cover a relatively small percentage of the
employees in an organization when they are adopted. Often, they cover only 1 – 20% of the
employees. In the case of work teams this most likely reflects the fact that many people do
not work in teams. In the case of stock option plans, it most likely reflects the fact that stock
options are still predominantly a reward vehicle that is used with senior management.
Reward Practice Adoption
Table 3 shows the adoption rates of five additional reward system practices. These
practices were studied because of their association with one or more organizational
improvement efforts, for example, employee involvement. As with the pay for performance
practices, the results here show some change in popularity since 1987.
Clearly the biggest growth is in the use of flexible or cafeteria-style benefits. The use
of this type of benefit plan seems to have peaked in 1999, but they continued to be very
5
popular in 2002. They likely will continue to be popular because they recognize the
individual differences that exist in the workforce and the value that employees place on
choice. There is some increase in the popularity of all-salary pay systems, but the difference
between 1987 and 2002 is not significant. There is a relative large increase from 1999 to
2002, perhaps reflecting the changing nature of work (more white collar) and management
(more participative) in the United States.
The adoption of open pay information shows little change from 1993, when the
survey first asked about it. Knowledge and skill-based pay shows some increase since 1987,
but it has been stable since 1993.
Finally, there is a dramatic decline in the popularity of employment security
commitments on the part of organizations. This decline clearly began in the late 1980’s, and
continues. Most of the decline occurred from 1987 to 1996. Those organizations that have
any type of employment security typically cover only a relatively small percentage of their
workforce. This probably reflects the tendency of organizations to think in terms of having
some core employees who are particularly critical to the long-term success of the
organization, and therefore deserve or command a more stable employment commitment.
Finally it is interesting to note that a few companies (6 percent) still offer employment
security to all their employees.
Knowledge Management
Beginning in 1999, our triennial survey included items concerned with knowledge
management. Two of these items look specifically at the relationship between knowledge
management and reward systems. Table 4 presents these results. It shows a noticeable
increase from 1999 to 2002 in the practice of giving rewards for developing knowledge
6
assets, and for sharing knowledge assets. These still are not particularly common practices,
but they do seem to be on the increase.
The increased use of rewards for developing and sharing knowledge may be at least
partially explained by its positive impact. As is shown in Table 5, there is a significant
correlation between the use of these reward practices and the effectiveness level of a
knowledge management effort. When organizations reward knowledge development and
knowledge sharing their knowledge management programs are more successful. Compared
to other knowledge management practices, for example Internet access, using rewards to
encourage better knowledge management is a relatively infrequently utilized practice despite
its positive relationship with effectiveness. This suggests that organizations can significantly
improve their knowledge management programs by more actively using rewards to support
them.
Predictors of Adoption
In order to understand why organizations adopt reward practices, the tri-annual
survey asks organizations about their business strategy, organizational performance
improvement strategies, and their change management strategies. Although questions in
these three areas show strong relationships to the adoption of many employee involvement,
total quality and reengineering practices, they tend not to be strongly related to the adoption
of pay for performance reward practices. This was true in the first year these questions were
asked, 1996, as well as in 1999, and it is once again in 2002 (see Lawler, Mohrman &
Benson, 2001, for the 1996 and 1999 results). Several significant correlations in the 2002
results are worth mentioning, however.
7
In the case of improvement strategies, there seems to be a consistent tendency for
organizational structure changes to be related to the adoption of pay for performance
practices. For example, outsourcing, using teams, adding and subtracting business units are
all related to the greater use of rewards for performance. There also are several important
relationships with respect to change strategies. The strongest relationship involves the
degree to which organizations have a clearly stated business strategy that underlies their
change efforts. Those organizations that do have a clearly stated business strategy are more
likely to use pay for performance practices. In many respects this is not surprising, since
having a clear business strategy provides the necessary foundation for pay for performance
systems. Without a clear strategy it is difficult to know what kind of performance to reward
and, therefore, what kind of pay for performance systems to build and develop.
The triennial survey, in addition to asking about rewards system practices, asks about
other practices which support employee involvement and organizational effectiveness. It
asks about the degree of information sharing, about the commitment of the organization to
knowledge development, and about power sharing work design practices (Lawler, 1998). An
analysis of these data from the 2002 survey show some significant relationships between the
adoption of reward system practices and employee involvement practices having to do with
information, knowledge and power. Not surprisingly, open pay information correlated
significantly with the sharing of other kinds of business information, and with two
organizational reward level pay for performance practices: stock ownership and profit
sharing. The use of knowledge/skill-based pay correlated significantly with a commitment to
knowledge development, as well as with the use of such power sharing practices as work
8
teams and job enrichment. Finally, power sharing correlated significantly with the adoption
of profit sharing plans.
The overall picture that appears is one which shows that the adoption of numerous
reward system practices in 2002 is related to management practices having to do with
information sharing, knowledge development and power sharing. This supports the
argument in the employee involvement literature that to have an effective employee
involvement program, individuals need to have rewards, information, knowledge and power.
Apparently, some organizations are committed to moving all four of these features of
employee involvement to an increasing number of their employees.
Conclusion and Future Direction
Without question, the most dramatic trend since 1987 is the increased adoption by
Fortune 1000 corporations of pay for performance programs. At the head of the list of
programs that have increased are individual incentive plans. In 1987, only five-percent of the
companies had over 60% of their employees on individual incentive plans. In 2002, 33% had
over 60% of their employees on individual incentive plans. Also increasing significantly
since 1987 is the use of stock option plans, employee stock ownership plans, profit sharing
plans, gainsharing plans, and group and team incentives. Thus, it is fair to say that pay for all
kinds of performance, individual, group, business unit and organization wide is more popular
today than it was in 1987.
The most interesting question at this point in time is whether the popularity of pay for
performance plans will continue to grow. There currently is room for all types of pay for
performance plans to be adopted by more organizations. Only employee stock ownership
plans typically cover 60% or more of the employees, and 27% of companies do not even
9
have one. Given the increased performance pressures that organizations are likely to face in
the years ahead, greater use of pay for performance seems likely. It continues to be a
potentially powerful way to affect behavior in complex organizations. The key question, of
course, is how the popularity of the different types of pay for performance plans is likely to
change.
Stock option plans obviously face a number of challenges. Their value is increasingly
being questioned and shareholders are increasingly suggesting that they are being overused.
More and more companies are expensing them, and as a result they may be resistant to
granting large numbers of options. This may well lead to an increase in the use of stock
ownership plans and perhaps a further growth in the use of profit sharing plans, since they
are alternative ways to tie reward levels to company performance. Finally, there may well be
a continued significant increase in the use of work group and team incentives. Organizations
are increasingly using teams, and the best way to motivate effective team performance often
is to reward them for their performance.
There is no reason to expect that the reward practices that are not related to paying for
performance will show a significant increase in their use. If anything, one of them,
employment security, is most likely to continue to decline in usage. It simply does not fit
today’s work environment and the kind of employment deal that most organizations can
legitimately commit to (Lawler, 2003). There may well be an increase in knowledge and
skill-based pay or, more likely, at least in competency based pay in companies that employ
large numbers of knowledge workers. Competency-based pay may also be used more
frequently with managers if more and more companies use competency-based leadership
development approaches. Paying the person instead of the job increasingly makes sense
10
because of the increase in knowledge work and the importance of organizations managing
the skills and competencies of individuals. This suggests there may also be an increase in the
use of rewards for knowledge development and sharing knowledge. Rewarding this type of
behavior fits well with the increased desire of organizations to gain competitive advantage by
creating knowledge and managing it more effectively.
Overall, the reward practices in organizations are more likely to evolve than they are
to radically change. Change in reward systems is difficult and a traumatic experience for
most organizations, so it is unrealistic to expect rapid and radical change. Indeed as our
comparison of the 1987 practices with 2002 practices shows change in comprehensible and
explainable ways does occur, but it takes time.
11
References
Blasi, J., Kruse, D., & Bernstein, A. (2003). In the Company of Owners. New York: Basic. Lawler, E. E., III. (2000). Rewarding Excellence. San Francisco: Jossey-Bass. Lawler, E. E., III. (2003). Treat People Right!: How Organizations and Individuals Can Propel Each Other Into a Virtuous Spiral of Success. San Francisco: Jossey-Bass. Lawler, E. E., III, Mohrman, S. A., & Benson, G. S. (2001). Organizing for High Performance: The CEO Report on Employee Involvement, TQM, Reengineering, and Knowledge Management in Fortune 1000 Companies. San Franicsco: Jossey-Bass. Rosen, C., Klein, K. J., & Young, K. M. (1986). Employee Ownership in America: The Equity Solution. Lexington, MA: D. C. Heath & Company. Zingheim, P. K., & Schuster, J. R. (2000). Pay People Right! San Francisco: Jossey- Bass.
12
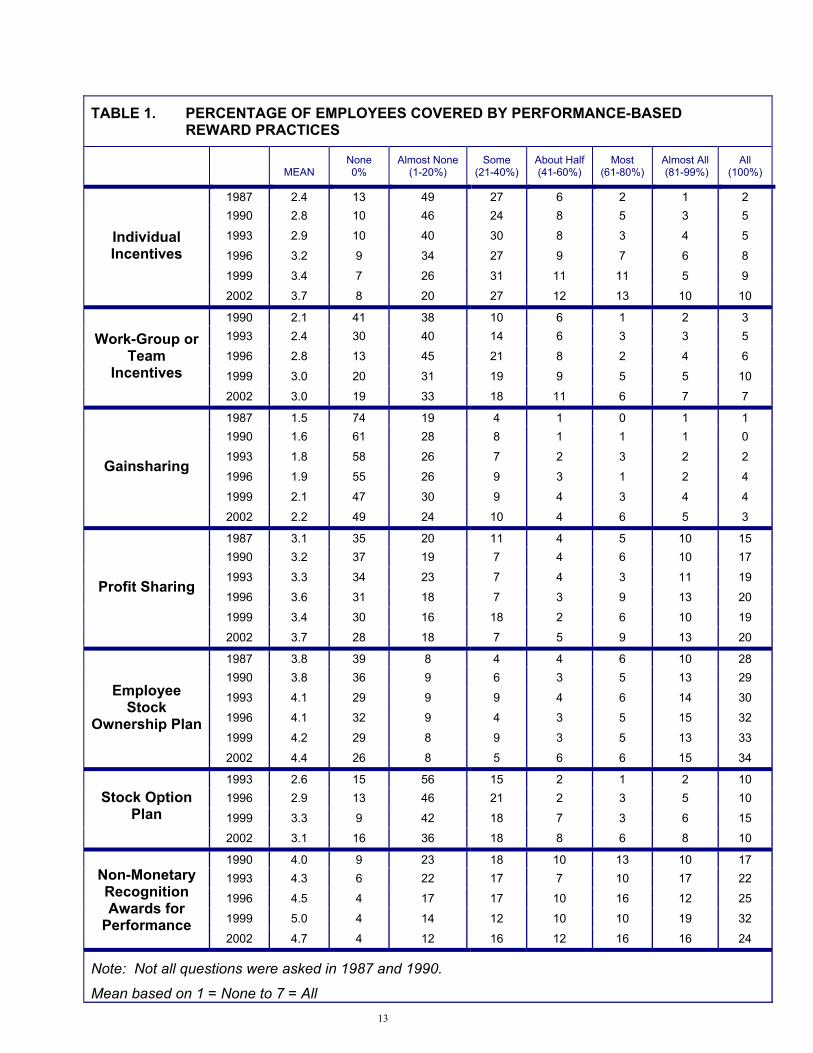
TABLE 1. PERCENTAGE OF EMPLOYEES COVERED BY PERFORMANCE-BASED REWARD PRACTICES
MEAN None 0%
Almost None (1-20%)
Some (21-40%)
About Half (41-60%)
Most (61-80%)
Almost All (81-99%)
All (100%)
1987 2.4 13 49 27 6 2 1 2 1990 2.8 10 46 24 8 5 3 5
1993 2.9 10 40 30 8 3 4 5
1996 3.2 9 34 27 9 7 6 8
1999 3.4 7 26 31 11 11 5 9
Individual Incentives
2002 3.7 8 20 27 12 13 10 10
1990 2.1 41 38 10 6 1 2 3 1993 2.4 30 40 14 6 3 3 5
1996 2.8 13 45 21 8 2 4 6
1999 3.0 20 31 19 9 5 5 10
Work-Group or Team
Incentives 2002 3.0 19 33 18 11 6 7 7
1987 1.5 74 19 4 1 0 1 1 1990 1.6 61 28 8 1 1 1 0
1993 1.8 58 26 7 2 3 2 2
1996 1.9 55 26 9 3 1 2 4
1999 2.1 47 30 9 4 3 4 4
Gainsharing
2002 2.2 49 24 10 4 6 5 3
1987 3.1 35 20 11 4 5 10 15 1990 3.2 37 19 7 4 6 10 17
1993 3.3 34 23 7 4 3 11 19
1996 3.6 31 18 7 3 9 13 20
1999 3.4 30 16 18 2 6 10 19
Profit Sharing
2002 3.7 28 18 7 5 9 13 20
1987 3.8 39 8 4 4 6 10 28 1990 3.8 36 9 6 3 5 13 29
1993 4.1 29 9 9 4 6 14 30
1996 4.1 32 9 4 3 5 15 32
1999 4.2 29 8 9 3 5 13 33
Employee Stock
Ownership Plan
2002 4.4 26 8 5 6 6 15 34
1993 2.6 15 56 15 2 1 2 10 1996 2.9 13 46 21 2 3 5 10
1999 3.3 9 42 18 7 3 6 15
Stock Option Plan
2002 3.1 16 36 18 8 6 8 10
1990 4.0 9 23 18 10 13 10 17 1993 4.3 6 22 17 7 10 17 22
1996 4.5 4 17 17 10 16 12 25
1999 5.0 4 14 12 10 10 19 32
Non-Monetary Recognition Awards for
Performance 2002 4.7 4 12 16 12 16 16 24
Note: Not all questions were asked in 1987 and 1990.
Mean based on 1 = None to 7 = All 13
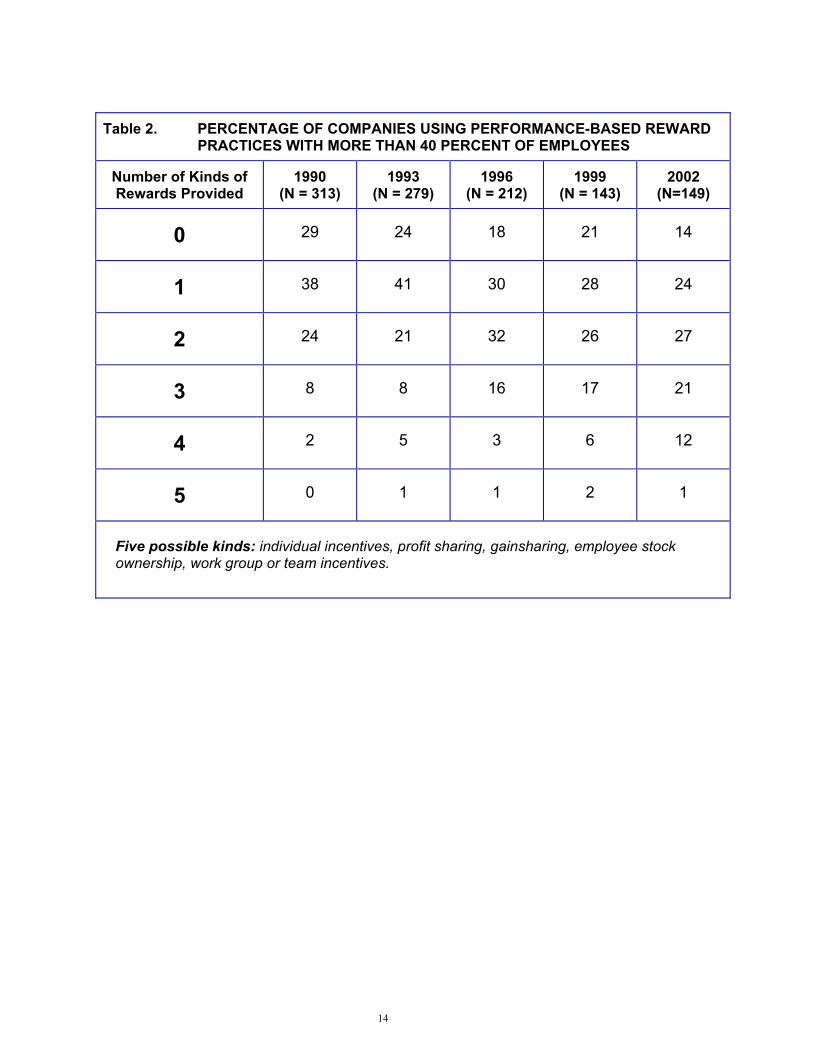
Table 2. PERCENTAGE OF COMPANIES USING PERFORMANCE-BASED REWARD PRACTICES WITH MORE THAN 40 PERCENT OF EMPLOYEES
Number of Kinds of Rewards Provided
1990 (N = 313)
1993 (N = 279)
1996 (N = 212)
1999 (N = 143)
2002 (N=149)
0 29 24 18 21 14
1 38 41 30 28 24
2 24 21 32 26 27
3 8 8 16 17 21
4 2 5 3 6 12
5 0 1 1 2 1
Five possible kinds: individual incentives, profit sharing, gainsharing, employee stock ownership, work group or team incentives.
14
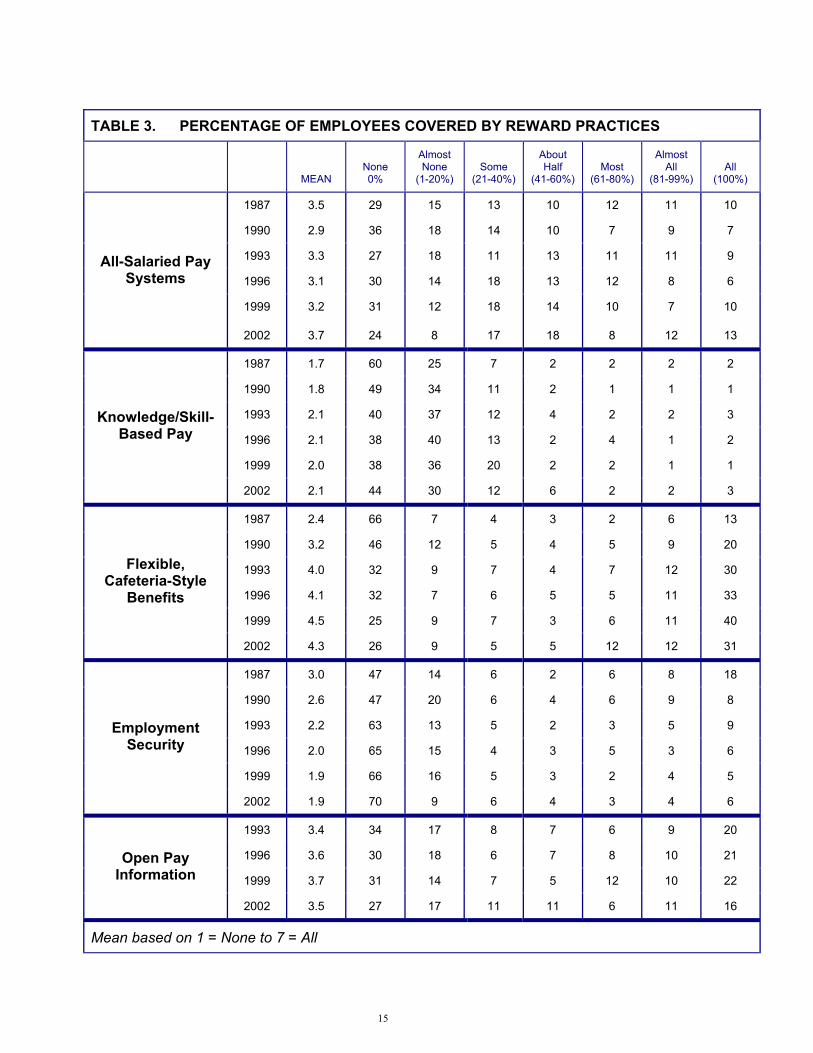
TABLE 3. PERCENTAGE OF EMPLOYEES COVERED BY REWARD PRACTICES
MEAN
None 0%
Almost None
(1-20%)
Some
(21-40%)
About Half
(41-60%)
Most
(61-80%)
Almost All
(81-99%)
All
(100%)
1987 3.5 29 15 13 10 12 11 10
1990 2.9 36 18 14 10 7 9 7
1993 3.3 27 18 11 13 11 11 9
1996 3.1 30 14 18 13 12 8 6
1999 3.2 31 12 18 14 10 7 10
All-Salaried Pay Systems
2002 3.7 24 8 17 18 8 12 13
1987 1.7 60 25 7 2 2 2 2
1990 1.8 49 34 11 2 1 1 1
1993 2.1 40 37 12 4 2 2 3
1996 2.1 38 40 13 2 4 1 2
1999 2.0 38 36 20 2 2 1 1
Knowledge/Skill-Based Pay
2002 2.1 44 30 12 6 2 2 3
1987 2.4 66 7 4 3 2 6 13
1990 3.2 46 12 5 4 5 9 20
1993 4.0 32 9 7 4 7 12 30
1996 4.1 32 7 6 5 5 11 33
1999 4.5 25 9 7 3 6 11 40
Flexible, Cafeteria-Style
Benefits
2002 4.3 26 9 5 5 12 12 31
1987 3.0 47 14 6 2 6 8 18
1990 2.6 47 20 6 4 6 9 8
1993 2.2 63 13 5 2 3 5 9
1996 2.0 65 15 4 3 5 3 6
1999 1.9 66 16 5 3 2 4 5
Employment Security
2002 1.9 70 9 6 4 3 4 6
1993 3.4 34 17 8 7 6 9 20
1996 3.6 30 18 6 7 8 10 21
1999 3.7 31 14 7 5 12 10 22
Open Pay Information
2002 3.5 27 17 11 11 6 11 16
Mean based on 1 = None to 7 = All
15
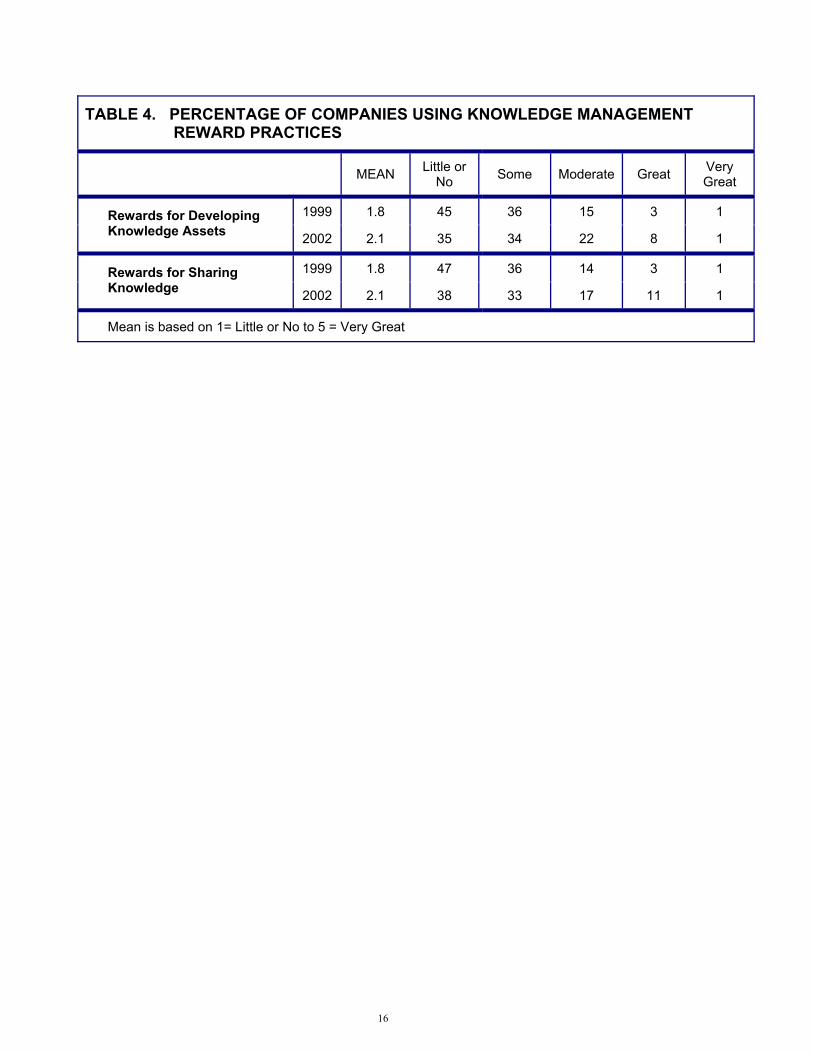
TABLE 4. PERCENTAGE OF COMPANIES USING KNOWLEDGE MANAGEMENT REWARD PRACTICES
MEAN Little or No Some Moderate Great Very
Great
1999 1.8 45 36 15 3 1 Rewards for Developing Knowledge Assets 2002 2.1 35 34 22 8 1
1999 1.8 47 36 14 3 1 Rewards for Sharing Knowledge 2002 2.1 38 33 17 11 1
Mean is based on 1= Little or No to 5 = Very Great
16
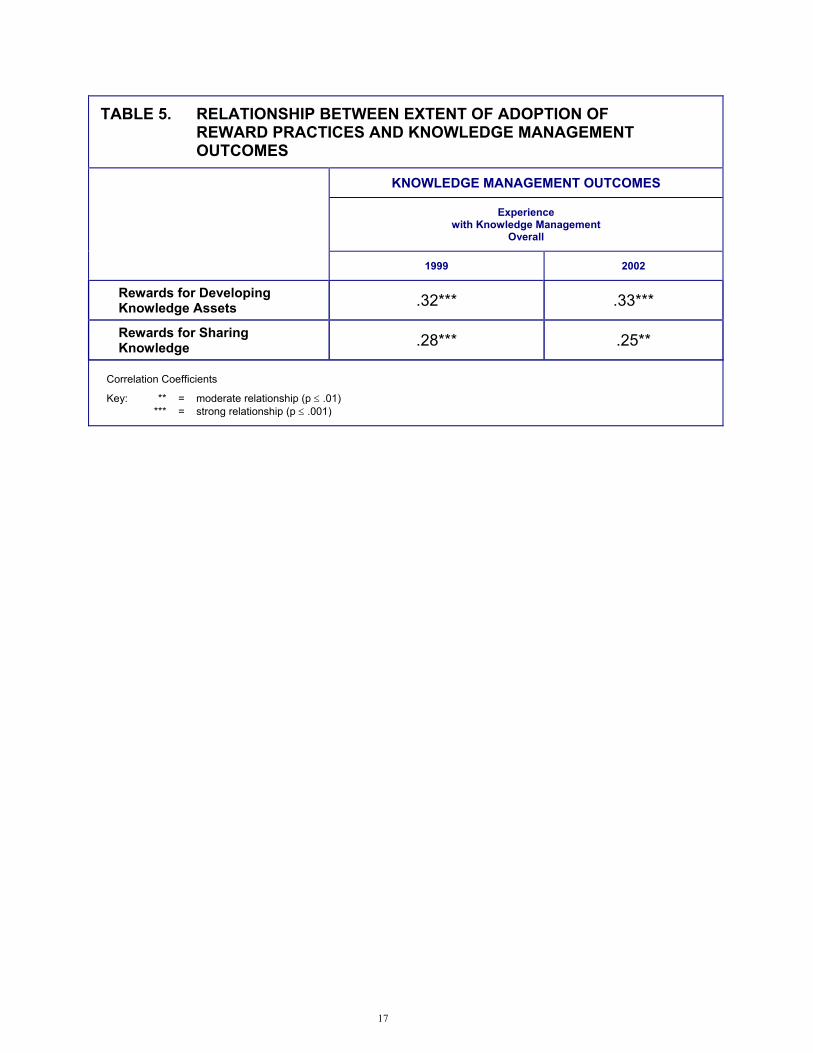
TABLE 5. RELATIONSHIP BETWEEN EXTENT OF ADOPTION OF REWARD PRACTICES AND KNOWLEDGE MANAGEMENT OUTCOMES
KNOWLEDGE MANAGEMENT OUTCOMES
Experience with Knowledge Management
Overall
1999 2002
Rewards for Developing Knowledge Assets .32*** .33***
Rewards for Sharing Knowledge .28*** .25**
Correlation Coefficients
Key: ** = moderate relationship (p ≤ .01) *** = strong relationship (p ≤ .001)
17
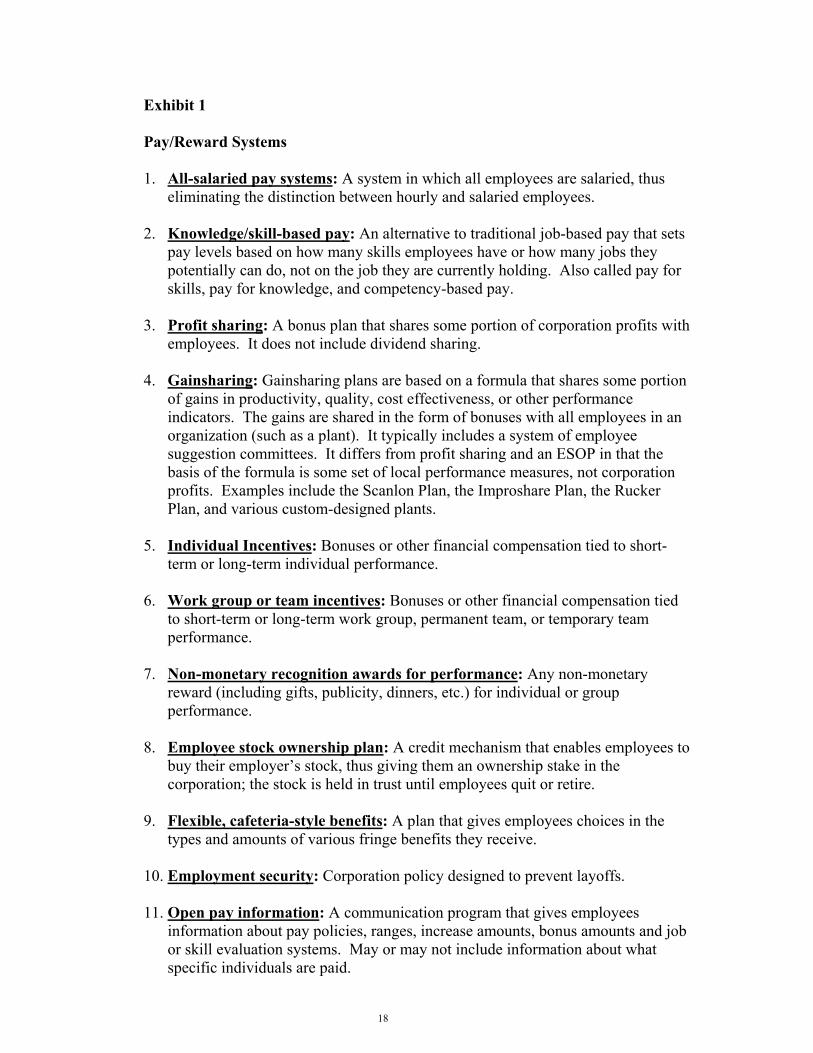
Exhibit 1
Pay/Reward Systems
1. All-salaried pay systems: A system in which all employees are salaried, thus eliminating the distinction between hourly and salaried employees.
2. Knowledge/skill-based pay: An alternative to traditional job-based pay that sets
pay levels based on how many skills employees have or how many jobs they potentially can do, not on the job they are currently holding. Also called pay for skills, pay for knowledge, and competency-based pay.
3. Profit sharing: A bonus plan that shares some portion of corporation profits with
employees. It does not include dividend sharing. 4. Gainsharing: Gainsharing plans are based on a formula that shares some portion
of gains in productivity, quality, cost effectiveness, or other performance indicators. The gains are shared in the form of bonuses with all employees in an organization (such as a plant). It typically includes a system of employee suggestion committees. It differs from profit sharing and an ESOP in that the basis of the formula is some set of local performance measures, not corporation profits. Examples include the Scanlon Plan, the Improshare Plan, the Rucker Plan, and various custom-designed plants.
5. Individual Incentives: Bonuses or other financial compensation tied to short-
term or long-term individual performance.
6. Work group or team incentives: Bonuses or other financial compensation tied to short-term or long-term work group, permanent team, or temporary team performance.
7. Non-monetary recognition awards for performance: Any non-monetary
reward (including gifts, publicity, dinners, etc.) for individual or group performance.
8. Employee stock ownership plan: A credit mechanism that enables employees to
buy their employer’s stock, thus giving them an ownership stake in the corporation; the stock is held in trust until employees quit or retire.
9. Flexible, cafeteria-style benefits: A plan that gives employees choices in the
types and amounts of various fringe benefits they receive.
10. Employment security: Corporation policy designed to prevent layoffs.
11. Open pay information: A communication program that gives employees information about pay policies, ranges, increase amounts, bonus amounts and job or skill evaluation systems. May or may not include information about what specific individuals are paid.
18

19
12. Stock option plan: A plan that gives employees the opportunity to purchase company stock at a previously established price.