Embed Size (px)
Citation preview

1
CENTER FOR EDUCATION AND CAREER INNOVATION Demand and Supply Analysis: Works Council Region 5
PHASE 1 – NOVEMBER 2014

2
Project Overview
Project Overview
Section 1: Overview of Demand • Page 6
Section 2: Overview of Supply • Page 23
Section 2A: Overview of Graduating CTE Seniors by Pathway
Section 2B: Overview of CTE Enrollments and Concentrators by Pathway and District
Section 2C: Overview of Postsecondary Supply
Section 3: Overview of Demand Supply Alignment • Page 74
CONTENTS
3
Project Overview
INTRODUCTION
The Center for Education and Career Innovation commissioned an analysis of regional labor market demand and talent supply in Indiana. This is the report of that analysis and a presentation of the data.
The purpose of the report is to provide information to the state’s eleven Works Councils to help them understand the characteristics of employment demand by key economic sectors in their regions and their regional capacity of supply to meet that demand. The report shows data on the scale of demand, or job openings, by key occupational areas tied to the sectors. The report also shows data on educational credential production at the secondary and postsecondary level. These supply-side data provide a comprehensive picture of the scale and type of program completions from major educational institutions within a region.
These data are intended to support a discussion among members of the Councils and their regional partners. Council members and their partners should use local knowledge to describe, embellish, and understand the data in their context. For example, industry groups and businesses will be able to help describe and provide insights on the skills in demand in the economy. For their part, educators will be able to help describe the nature of educational programs and the outcomes.
Our hope is that these discussions, with the data, will help the Councils plan and identify priorities in their regions. If needed, CECI may be able to offer technical assistance to help each region interpret and form its own conclusions and recommendations from the data.
INTRODUCTION
4
Project Overview
INTRODUCTION, Cont.
There are three major sections to the report. The first section describes demand for talent in the regional economy. The second section describes the production of credentials, or degrees, in career and technical education secondary systems as well as postsecondary colleges and universities. The final section of the report presents side-by-side data on the demand in key sectors and occupations with data on the supply of talent from secondary and postsecondary institutions. This side-by-side look at the alignment between demand and supply is a quantitative approach to display what others have remarked on anecdotally that it is hard for employers to fill open jobs and find the right skill sets to match requirements.
Like all data reports, this one includes a number of caveats:
All demand-side data are a combination of forecasts for job openings and real-time job postings in each occupational group. While these are some of the best and most readily available data in the market, they are not comprehensive and readers should not take them as exact measures of demand. That is, they are good measures of the scale of demand but may not capture all sources and variances of demand in the economy. Whenever possible, we have noted these qualifications in the narrative.
For their part, the supply-side data obtained from state and federal sources also contain some anomalies. For example, in secondary CTE there is variation between state-level organization and accounting of the data and district level use of the data. That may lead to some differences in program identification and categorization. Nonetheless, the data as a whole accurately reflect overall program emphasis and concentration in a region. Whenever possible, we have noted where possible anomalies in the data may occur.
INTRODUCTION

5
Project Overview
INTRODUCTION, Cont.
Finally, the labor market is complex and there are many ways students and workers gain skills and find jobs. Our approach focuses on the path to skill attainment and employment that involves the secondary and postsecondary educational system. These are the systems upon which the Works Councils have been asked to focus. They also are the biggest areas of public investment and produce the largest numbers of talent supply for a region. However, there are other sources of skill and talent development that feed the labor market, such as apprenticeships and non-academic professional development and industry training programs. Our report does not attempt to quantify these other sources of talent development, in part because these sources lack standardized and comparable data. So, while this analysis neither fully captures the complexity of the labor market nor all the different sources of talent supply, it focuses on those sources most relevant to the policy focus of the Works Councils and arguably provide the biggest supply of talent to a region.
The Center for Education and Career Innovation commissioned FutureWorks, a national firm focused on research and policy development, to compile the data and lead the research for this report. CECI and FutureWorks would like to acknowledge the contributions of the Works Councils and the feedback, observations and assistance they gave in earlier iterations of these data. We would also like to acknowledge the assistance, cooperation and collaboration in providing data and advice from the following organizations: Indiana Department of Education, Office of Career and Technical Education; Indiana Commission for Higher Education; Indiana Department of Workforce Development; Ivy Tech Community College, Department of Institutional Research; Indiana Economic Development Corporation; Indiana Association of Career and Technical Education Directors; Central Indiana Corporate Partnership and Bio-Crossroads, Conexus, and TechPoint; and, regional workforce and economic development organizations across the state.
INTRODUCTION

6
SECTION 1
Overview of Demand

7
Overview of Demand
SECTION OVERVIEW
This section presents labor market demand estimates for major occupational groups in the regional economy. These data help give a picture of demand for key occupational groups that are important to business, individuals and the regional economy.
The demand data on occupational groups are organized first by those tied to targeted industry sectors in the regional economy (see next page for list of targeted sectors). A second additional list of all “other” occupational groups, some of them with substantial demand and some emerging in the economy, are presented after the occupational groups organized by targeted industry sector.
The data are presented in tables that include estimates of demand, earning potential, number of total jobs, and education typically required for each occupational group. The Works Council and its partners can use these data elements to identify priority occupational groups, answering questions such as:
» which occupational groups are most important to current and future wealth creation in the economy,
» which have substantial demand,
» which have career earning potential, and
» what kind of education is required.
SECTION 1

8
Overview of Demand
TARGETED INDUSTRY SECTOR LIST FOR CENTRAL INDIANA
Industry sector targets identified in the region include:
• Healthcare,
• Manufacturing (including defense and advance manufacturing),
• Information technology,
• Finance and insurance,
• Life sciences,
• Alternative energy and construction, and
• Transportation, distribution and logistics.
Occupations not closely tied to these industry targets are included in “Other” occupation group tables.
SECTION 1

9
Overview of Demand
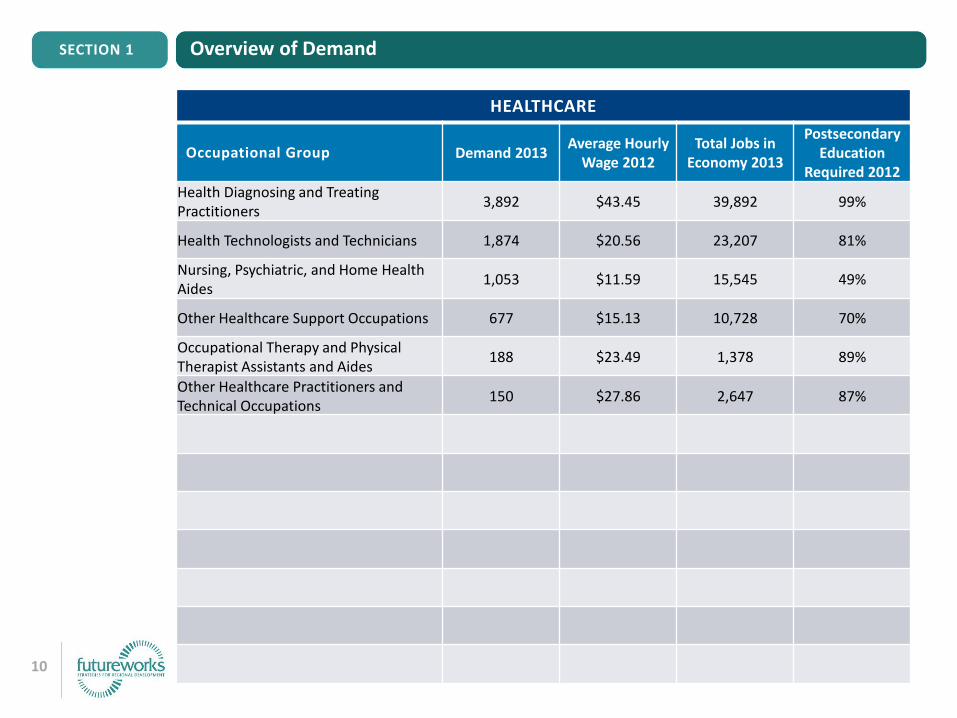
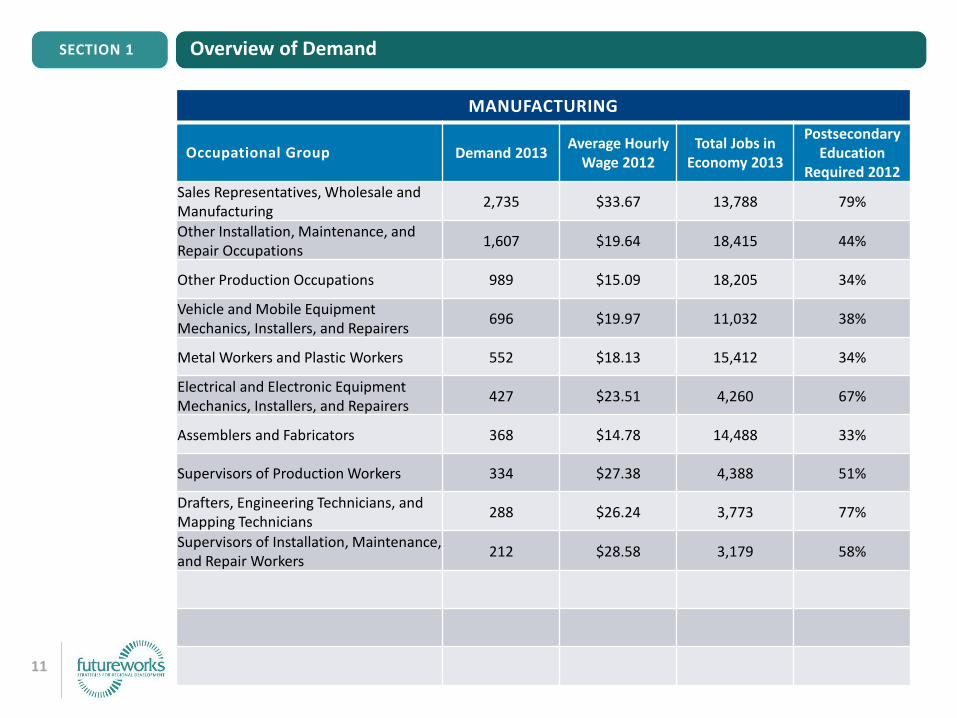
WHAT’S INCLUDED IN THE DEMAND DATA
Counties in the region include Boone, Hamilton, Hancock, Hendricks, Johnson, Madison, Marion, Morgan, and Shelby.
Data on 96 occupational groups organized by regional industry clusters.
Data elements include:
» Demand 2013. Regional job openings due to growth, retirements, and job postings.
» Average Hourly Wage 2012. Occupational group wages in the region.
» Total Jobs 2013. Total number of jobs in the regional economy.
» Postsecondary Education Required 2012. National proportion of the occupation that requires some type of postsecondary education (some college, two-year degree, four-year degree, or higher).
Definitions and technical notes describing the data are in the page following the tables.
SECTION 1
10
Overview of DemandSECTION 1
HEALTHCARE
Occupational Group Demand 2013Average Hourly
Wage 2012Total Jobs in
Economy 2013
PostsecondaryEducation
Required 2012
Health Diagnosing and Treating Practitioners
3,892 $43.45 39,892 99%
Health Technologists and Technicians 1,874 $20.56 23,207 81%
Nursing, Psychiatric, and Home Health Aides
1,053 $11.59 15,545 49%
Other Healthcare Support Occupations 677 $15.13 10,728 70%
Occupational Therapy and Physical Therapist Assistants and Aides
188 $23.49 1,378 89%
Other Healthcare Practitioners and Technical Occupations
150 $27.86 2,647 87%
11
Overview of DemandSECTION 1
MANUFACTURING
Occupational Group Demand 2013Average Hourly
Wage 2012Total Jobs in
Economy 2013
PostsecondaryEducation
Required 2012
Sales Representatives, Wholesale and Manufacturing
2,735 $33.67 13,788 79%
Other Installation, Maintenance, and Repair Occupations
1,607 $19.64 18,415 44%
Other Production Occupations 989 $15.09 18,205 34%
Vehicle and Mobile Equipment Mechanics, Installers, and Repairers
696 $19.97 11,032 38%
Metal Workers and Plastic Workers 552 $18.13 15,412 34%
Electrical and Electronic Equipment Mechanics, Installers, and Repairers
427 $23.51 4,260 67%
Assemblers and Fabricators 368 $14.78 14,488 33%
Supervisors of Production Workers 334 $27.38 4,388 51%
Drafters, Engineering Technicians, and Mapping Technicians
288 $26.24 3,773 77%
Supervisors of Installation, Maintenance, and Repair Workers
212 $28.58 3,179 58%

12
Overview of DemandSECTION 1
MANUFACTURING (continued)
Occupational Group Demand 2013Average Hourly
Wage 2012Total Jobs in
Economy 2013
PostsecondaryEducation
Required 2012
Food Processing Workers 202 $13.08 2,731 26%
Textile, Apparel, and Furnishings Workers
146 $11.36 2,995 23%
Printing Workers and Related 97 $15.69 2,280 41%
Plant and System Operators 88 $25.24 1,976 56%
Woodworkers 48 $14.33 1,060 28%

13
Overview of DemandSECTION 1
INFORMATION TECHNOLOGY
Occupational Group Demand 2013Average Hourly
Wage 2012Total Jobs in
Economy 2013
PostsecondaryEducation
Required 2012
Computer Occupations 5,886 $35.40 24,351 94%
14
Overview of DemandSECTION 1
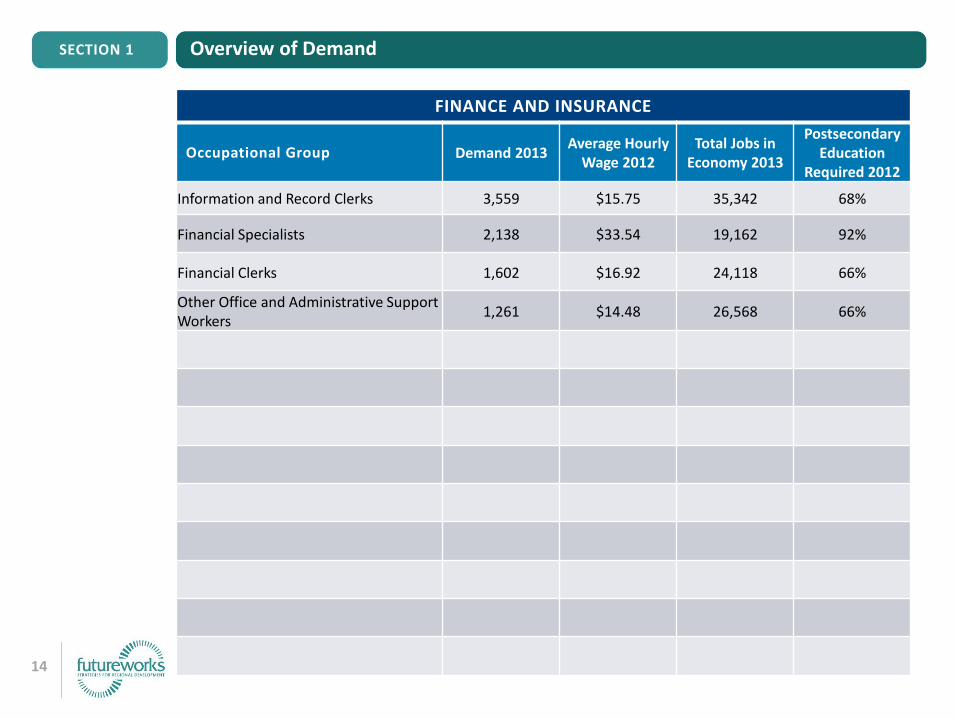
FINANCE AND INSURANCE
Occupational Group Demand 2013Average Hourly
Wage 2012Total Jobs in
Economy 2013
PostsecondaryEducation
Required 2012
Information and Record Clerks 3,559 $15.75 35,342 68%
Financial Specialists 2,138 $33.54 19,162 92%
Financial Clerks 1,602 $16.92 24,118 66%
Other Office and Administrative Support Workers
1,261 $14.48 26,568 66%
15
Overview of DemandSECTION 1
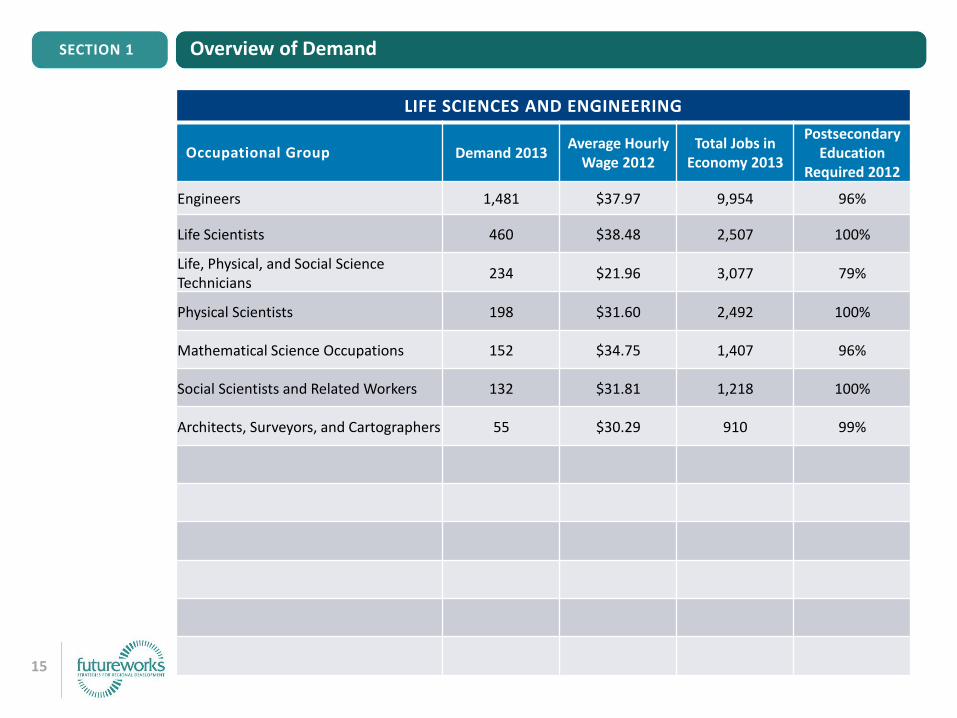
LIFE SCIENCES AND ENGINEERING
Occupational Group Demand 2013Average Hourly
Wage 2012Total Jobs in
Economy 2013
PostsecondaryEducation
Required 2012
Engineers 1,481 $37.97 9,954 96%
Life Scientists 460 $38.48 2,507 100%
Life, Physical, and Social Science Technicians
234 $21.96 3,077 79%
Physical Scientists 198 $31.60 2,492 100%
Mathematical Science Occupations 152 $34.75 1,407 96%
Social Scientists and Related Workers 132 $31.81 1,218 100%
Architects, Surveyors, and Cartographers 55 $30.29 910 99%
16
Overview of DemandSECTION 1
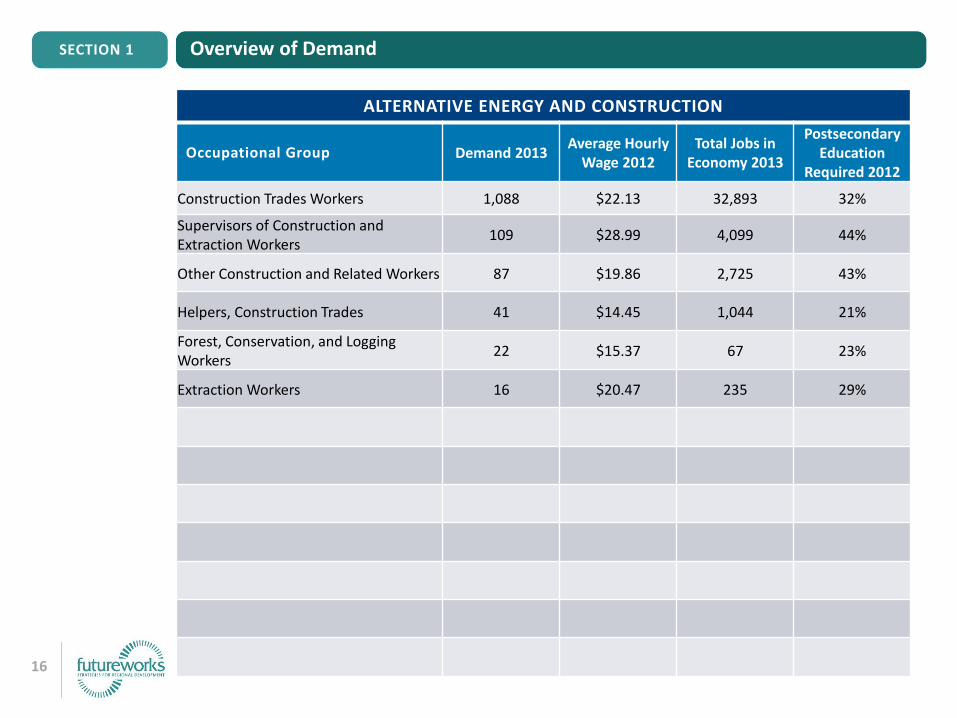
ALTERNATIVE ENERGY AND CONSTRUCTION
Occupational Group Demand 2013Average Hourly
Wage 2012Total Jobs in
Economy 2013
PostsecondaryEducation
Required 2012
Construction Trades Workers 1,088 $22.13 32,893 32%
Supervisors of Construction and Extraction Workers
109 $28.99 4,099 44%
Other Construction and Related Workers 87 $19.86 2,725 43%
Helpers, Construction Trades 41 $14.45 1,044 21%
Forest, Conservation, and Logging Workers
22 $15.37 67 23%
Extraction Workers 16 $20.47 235 29%

17
Overview of DemandSECTION 1
TRANSPORTATION, DISTRIBUTION AND LOGISTICS
Occupational Group Demand 2013Average Hourly
Wage 2012Total Jobs in
Economy 2013
PostsecondaryEducation
Required 2012
Motor Vehicle Operators 2,966 $17.14 31,536 35%
Material Moving Workers 2,183 $13.01 45,932 28%
Material Recording, Scheduling, Dispatching, and Distributing Workers
1,651 $15.42 27,707 49%
Supervisors of Transportation and Material Moving Workers
236 $25.65 3,750 56%
Other Transportation Workers 159 $12.37 2,801 45%
Air Transportation Workers 122 $41.29 2,763 90%
Rail Transportation Workers 24 $26.31 761 55%
18
Overview of DemandSECTION 1
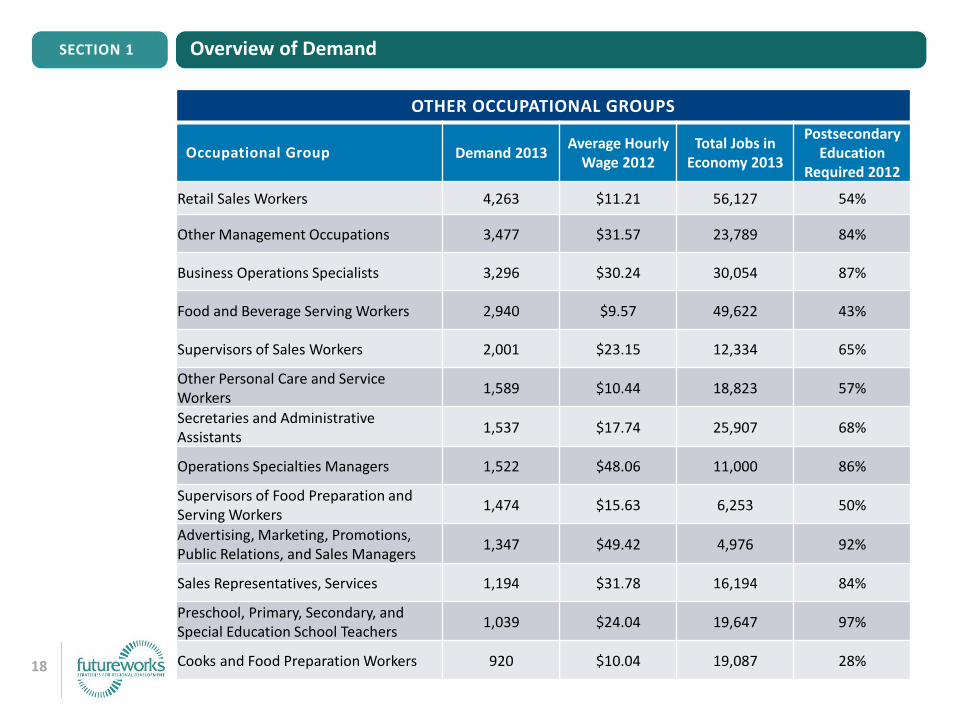
OTHER OCCUPATIONAL GROUPS
Occupational Group Demand 2013Average Hourly
Wage 2012Total Jobs in
Economy 2013
PostsecondaryEducation
Required 2012
Retail Sales Workers 4,263 $11.21 56,127 54%
Other Management Occupations 3,477 $31.57 23,789 84%
Business Operations Specialists 3,296 $30.24 30,054 87%
Food and Beverage Serving Workers 2,940 $9.57 49,622 43%
Supervisors of Sales Workers 2,001 $23.15 12,334 65%
Other Personal Care and Service Workers
1,589 $10.44 18,823 57%
Secretaries and Administrative Assistants
1,537 $17.74 25,907 68%
Operations Specialties Managers 1,522 $48.06 11,000 86%
Supervisors of Food Preparation and Serving Workers
1,474 $15.63 6,253 50%
Advertising, Marketing, Promotions, Public Relations, and Sales Managers
1,347 $49.42 4,976 92%
Sales Representatives, Services 1,194 $31.78 16,194 84%
Preschool, Primary, Secondary, and Special Education School Teachers
1,039 $24.04 19,647 97%
Cooks and Food Preparation Workers 920 $10.04 19,087 28%

19
Overview of Demand: OtherSECTION 1
OTHER OCCUPATIONAL GROUPS
Occupational Group Demand 2013Average Hourly
Wage 2012Total Jobs in
Economy 2013
PostsecondaryEducation
Required 2012
Building Cleaning and Pest Control Workers
919 $10.48 24,652 27%
Art and Design Workers 784 $20.03 4,618 87%
Top Executives 773 $62.45 12,340 83%
Counselors, Social Workers, and Other Community and Social Service Specialists
760 $21.64 8,889 90%
Other Protective Service Workers 739 $13.13 9,367 58%
Personal Appearance Workers 678 $12.01 5,900 45%
Other Sales and Related Workers 651 $20.26 6,153 73%
Supervisors of Office and Administrative Support Workers
646 $25.95 9,458 74%
Lawyers, Judges, and Related Workers 590 $48.38 5,739 99%
Other Food Preparation and Serving Related Workers
562 $8.90 8,423 30%
Postsecondary Teachers 555 $33.71 7,783 100%
Media and Communication Workers 469 $24.22 5,212 93%
Other Education, Training, and Library Occupations
387 $12.63 7,975 73%
20
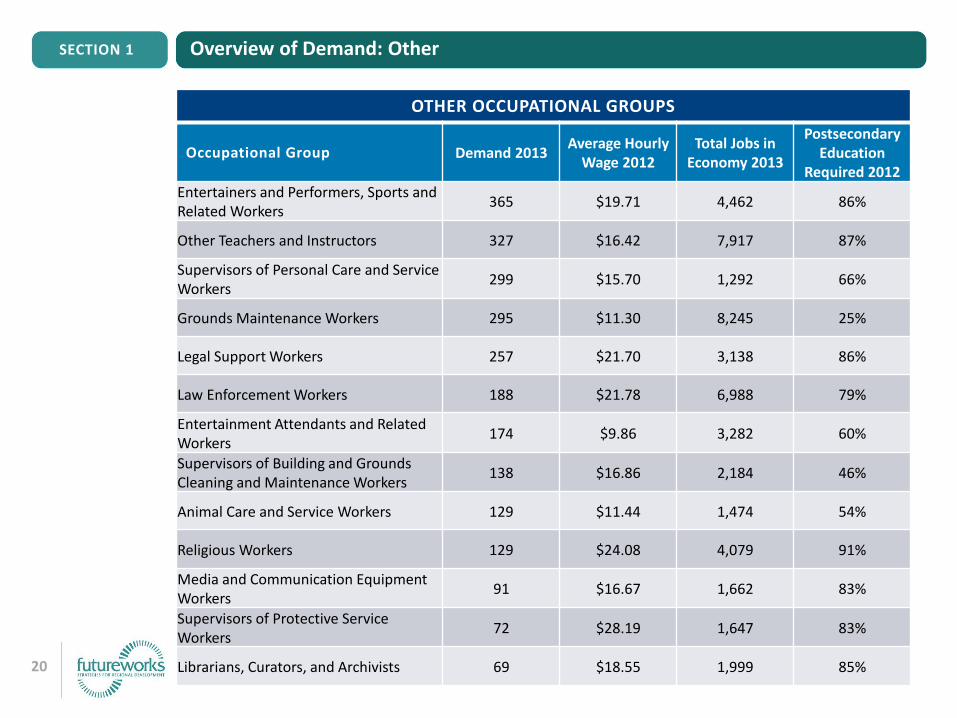
Overview of Demand: OtherSECTION 1
OTHER OCCUPATIONAL GROUPS
Occupational Group Demand 2013Average Hourly
Wage 2012Total Jobs in
Economy 2013
PostsecondaryEducation
Required 2012
Entertainers and Performers, Sports and Related Workers
365 $19.71 4,462 86%
Other Teachers and Instructors 327 $16.42 7,917 87%
Supervisors of Personal Care and Service Workers
299 $15.70 1,292 66%
Grounds Maintenance Workers 295 $11.30 8,245 25%
Legal Support Workers 257 $21.70 3,138 86%
Law Enforcement Workers 188 $21.78 6,988 79%
Entertainment Attendants and Related Workers
174 $9.86 3,282 60%
Supervisors of Building and Grounds Cleaning and Maintenance Workers
138 $16.86 2,184 46%
Animal Care and Service Workers 129 $11.44 1,474 54%
Religious Workers 129 $24.08 4,079 91%
Media and Communication Equipment Workers
91 $16.67 1,662 83%
Supervisors of Protective Service Workers
72 $28.19 1,647 83%
Librarians, Curators, and Archivists 69 $18.55 1,999 85%

21
Overview of Demand: OtherSECTION 1
OTHER OCCUPATIONAL GROUPS
Occupational Group Demand 2013Average Hourly
Wage 2012Total Jobs in
Economy 2013
PostsecondaryEducation
Required 2012
Fire Fighting and Prevention Workers 69 $24.31 3,036 83%
Agricultural Workers 62 $11.83 1,870 19%
Baggage Porters, Bellhops, and Concierges
36 $11.83 284 55%
Communications Equipment Operators 31 $12.78 934 55%

22
Overview of Demand
DEFINITIONS AND TECHNICAL NOTES
The occupational groups in the tables are a category of worker and profession identified as part of the Standard Occupational Classification (SOC) system at the 3-digit level used by federal statistical agencies. A list of the occupations that make up the 3-digit SOC occupations can be found at http://www.bls.gov/oes/current/oes_stru.htm.
The demand data for each occupational group includes the following variables:
» Demand 2013. Demand is a calculation of projected annual job openings (Bureau of Labor Statistics) and real-time job postings (Burning Glass Labor Insight) for occupations in the Economic Growth Region (EGR).
» Average Hourly Wage 2012. This the average hourly wage for the occupation in the EGR from the U.S. Bureau of Labor Statistics.
» Total Jobs 2013. This is the total number of jobs in the region in 2013 from the U.S. Bureau of Labor Statistics using data from the Quarterly Census on Employment and Wages (QCEW).
» Postsecondary Education Required 2012. This is a national proportion of the occupation that requires some type of postsecondary education (some college, two-year degree, four-year degree, or higher) in 2012 from the U.S. Bureau of Labor Statistics.
FutureWorks included data on all 3-digit occupations tied to the targeted industry cluster in the tables. In the “Other Occupations” tables, FutureWorks only included data on those 3-digit occupations that had a Total Demand 2013 that was greater than 25 jobs.
SECTION 1

23
SECTION 2
Overview of Supply
24
Overview of Supply
SECTION OVERVIEW
In this section, we present data on enrollments and outcomes of educational institutions. The focus is on: secondary Career and Technical Education (CTE) districts, and on postsecondary institutions at the sub-baccalaureate and baccalaureate levels. In general, these comprise the core of the talent supply pipeline (see chart below) and are the major sources of talent development for individual who will enter the labor market.
Secondary CTE Data: Secondary CTE data are presented for enrollments and concentrators in charts and tables. The charts and tables are organized by the CTE Districts assigned to the region. We follow the definitions and terms used by DOE and DWD and their conventions used to collect the data (see terminology page).” All data is supplied by DWD.
First we present CTE data on ‘graduating seniors who are concentrators in a CTE pathway.’ This gives a sense of the completions and total output of CTE systems in the regions. Then, as supplemental information, we present information on the total enrollments and completions for CTE programs in districts. This gives a sense of the scale of CTE programming in the regions. Together these provide a picture of the scale and output of CTE programming.
All the data are presented for the Works Council region. In some cases the secondary CTE districts span regional boundaries. If that occurs, we have included these districts in multiple regions. While this introduces some duplication among regions, it may also represent potential sources of talent within a region. Showing the potential breadth of talent supply in the region is the intention of the analysis.
It is important to note that the data include CTE courses offered at the career centers (dedicated CTE facilities) and CTE courses offered in other high schools within the CTE districts. This will have a significant impact on the total enrollments and concentrators reported for a CTE district.
SECTION 2
25
Overview of Supply
SECTION OVERVIEW, Cont.
Postsecondary Education: Postsecondary education outcome data are shown for Indiana colleges and the major academic credentials awarded: short-term certificates, certificates between one-and two-years of study, associate, Bachelor’s and Master’s degrees. All postsecondary data are from the federal Integrated Postsecondary Education Data System (IPEDS).
Assessing the contributions of colleges and universities to the talent supply is complex. In part, that is because many colleges serve regional, statewide, national and international markets. We have made the following decisions about which colleges to include in our analysis: • All colleges and universities located in a region are included in the analysis of the regional
supply of talent;• State flagship institutions (Purdue, Indiana University) and an additional group of colleges
that are either large or have a clear statewide and national focus are reported separately from any region because it is not possible to accurately allocate the potential supply of talent from those institutions to a specific region.
• Vincennes University and Rose-Hulman Institute of Technology are included for each region because of their contributions to the talent supply in each region.
These criteria mean that some postsecondary credentials from some colleges are over-represented or under-represented in a given region. However, we believe the general approach offers the Works Councils a reasonable picture of the supply of talent in or available to their region from Indiana colleges and universities.
SECTION 2
26
Overview of SupplySECTION 2
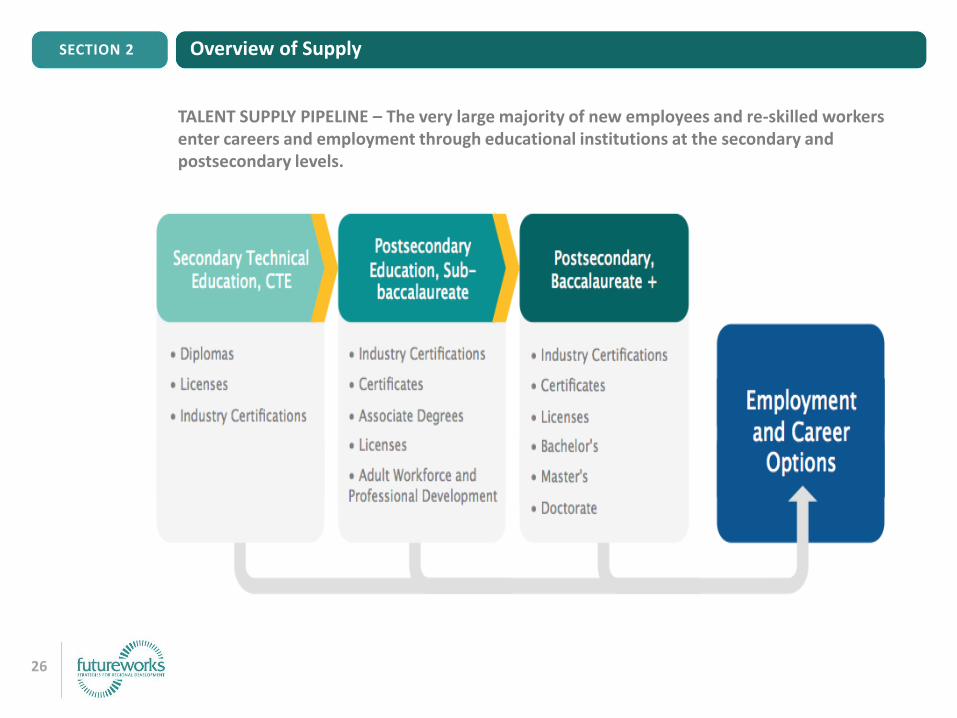
TALENT SUPPLY PIPELINE – The very large majority of new employees and re-skilled workers enter careers and employment through educational institutions at the secondary and postsecondary levels.
27
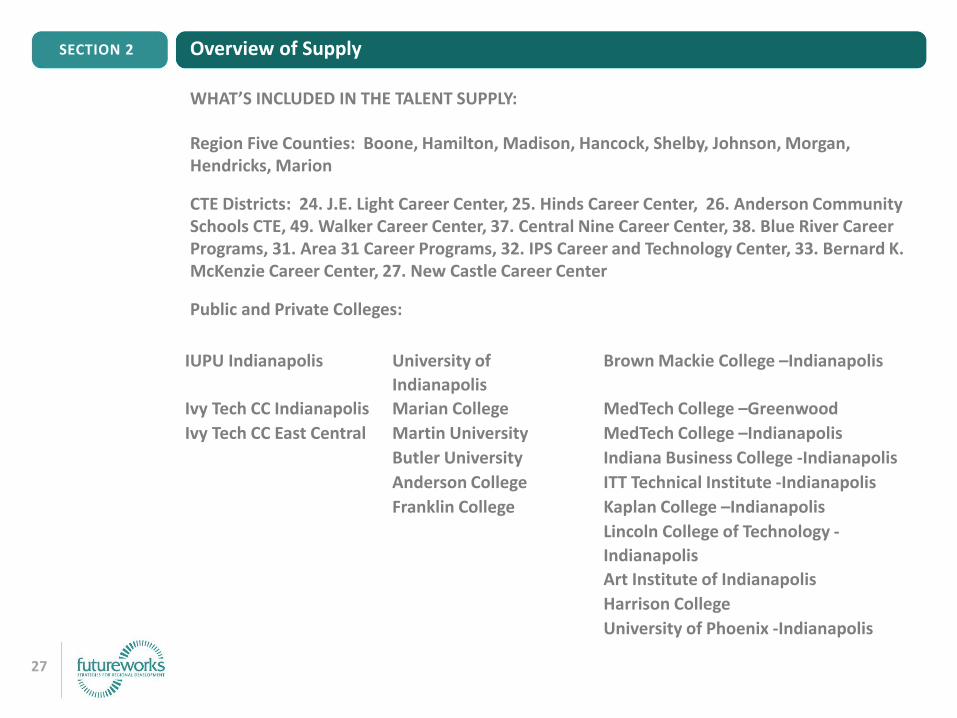
WHAT’S INCLUDED IN THE TALENT SUPPLY:
Region Five Counties: Boone, Hamilton, Madison, Hancock, Shelby, Johnson, Morgan, Hendricks, Marion
CTE Districts: 24. J.E. Light Career Center, 25. Hinds Career Center, 26. Anderson Community Schools CTE, 49. Walker Career Center, 37. Central Nine Career Center, 38. Blue River Career Programs, 31. Area 31 Career Programs, 32. IPS Career and Technology Center, 33. Bernard K. McKenzie Career Center, 27. New Castle Career Center
Public and Private Colleges:
IUPU Indianapolis University of
Indianapolis
Brown Mackie College –Indianapolis
Ivy Tech CC Indianapolis Marian College MedTech College –Greenwood
Ivy Tech CC East Central Martin University MedTech College –Indianapolis
Butler University Indiana Business College -Indianapolis
Anderson College ITT Technical Institute -Indianapolis
Franklin College Kaplan College –Indianapolis
Lincoln College of Technology -
Indianapolis
Art Institute of Indianapolis
Harrison College
University of Phoenix -Indianapolis
SECTION 2 Overview of Supply

28
Overview of Supply
IMPORTANT EDUCATION TERMINOLOGY
A number of definitions of commonly used educational terminology will help the Works Council understand the data presented in this section. The terminology includes:
Secondary Career and Technical Education:
-Secondary CTE Enrollment: Any student who takes a CTE course.
-Secondary CTE Concentrator: Any student who has completed at least 6 credits of coursework in a CTE pathway.
-Secondary CTE Pathway: A group of courses related to a technology or occupational field that is approved by the US Department of Education and also by states and: An occupation labeled as High Wage and Moderate/High Demand in Indiana, or 2) An occupation within the eight emerging career areas identified in the Indiana Strategic Skills Initiative, or 3) An occupation approved by the Indiana Department of Education.
Postsecondary Education:
-Post Secondary Certificate Less than One Year of Study): An academic certificate of less than 30 credits.
-Post Secondary Certificate of One to Two Years Study): An academic certificate of more than 30 credits but less than an Associate Degree.
Associate Degree: An academic degree of approximately 60 to 68 credits of coursework.
SECTION 2

29
SECTION 2A
Overview of Graduating CTE Seniors by Pathway

30
Overview of Graduating Seniors with a CTE Concentration in a Pathway
GRADUATING SENIORS WITH A CTE CONCENTRATION
In the following table and charts we describe CTE senior concentrators in the Works Council region. In a subsequent section, we will describe the alignment of these graduating senior concentrators by pathway with demand in the regional labor market.
DWD identifies ‘would be seniors’ as students who are preparing to graduate at the end of an academic year. These are students who will graduate and then enter employment, postsecondary education, or some other status.
Senior concentrators are students in their final year of high school who have a concentration in a CTE pathway. A senior concentrator will almost always be counted in one pathway. The most important purpose of the data is to describe the pathways in which graduating students are concentrating and the relative scale of their choices. Therefore, we focus on the concentrations of seniors as measures of institutional outcomes. In aggregate, graduating senior concentrators represent the annual total CTE output of the districts, region, and the state’s CTE system. This is a measure of the supply of talent into the labor market.
DOE and DWD identify about 50 pathways in several occupational clusters for concentrators. The next page shows the current configuration of clusters and their respective pathways.
Use in the supply demand analysis: Because these data are for 2013, records of employment or entry into postsecondary data are not yet available. Our use of the data intend to display the numbers of students in a pathway (or cluster) who are completing twelfth grade and graduating.
Note: These data include CTE courses offered at the CTE career centers (dedicated CTE facilities) and comprehensive high schools within the respective CTE districts. This will have an impact on the total numbers of enrollments and concentrators reported for each CTE district.
SECTION 2A

31
Overview of Pathways and Clusters SECTION 2A
CTE Cluster CTE Pathway - Focus CTE Cluster CTE Pathway - Focus
Agriculture
Agribusiness
Health Science
Biomedical
Horticulture & Landscape Biotechnology
Life Sciences-Animal Science Dental
Life Sciences-Food Science Dietetics & Nutrition Science
Life Sciences-Natural Resources Health Career Specialties
Life Sciences Nursing
Architecture & Construction
Facilities-Building and Facilities Management Veterinary
Facilities-Facility Maintenance
Hospitality & Human Services
Cosmetology
Facilities-Facilities Management Culinary Arts
Construction Trades-General Hospitality Management
Construction Trades-Electrical Human & Social Services
Construction Trades-Heavy EquipmentInformation Technology
PC Networking & Support-Networking
Construction Trades-HVAC PC Networking & Support-PC Support
Drafting and Design-Architectural PC Programming
Drafting and Design-Mechanical
Manufacturing & Logistics
Advanced Manufacturing
Arts, AV Technology and Communication
Visual Arts-Photography Electronics
Visual Arts-Fashion, Textile & Design Engineering
Visual Arts-Visual Communication Logistics & Supply Chain Management
Web & Digital Communication-Media Machine Tool
Web & Digital Communication-Radio/TV Welding
Business and Marketing
Business Administration-Accounting
Public Safety
Criminal Justice
Business Administration-Management EMT/Paramedic
Business Administration-Entrepreneurship Fire & Rescue
Business Administration-Hospitality
Transportation
Automotive Collision Repair
Business Administration-Marketing Automotive Technology
Business Administration-Sports/Entertainment Aviation
Education and Training
Early Childhood Education Diesel Services Technology
Education Careers Recreation & Mobile Equipment
Tractor Trailer Operations
32
Overview of Graduating Senior Concentrators SECTION 2A
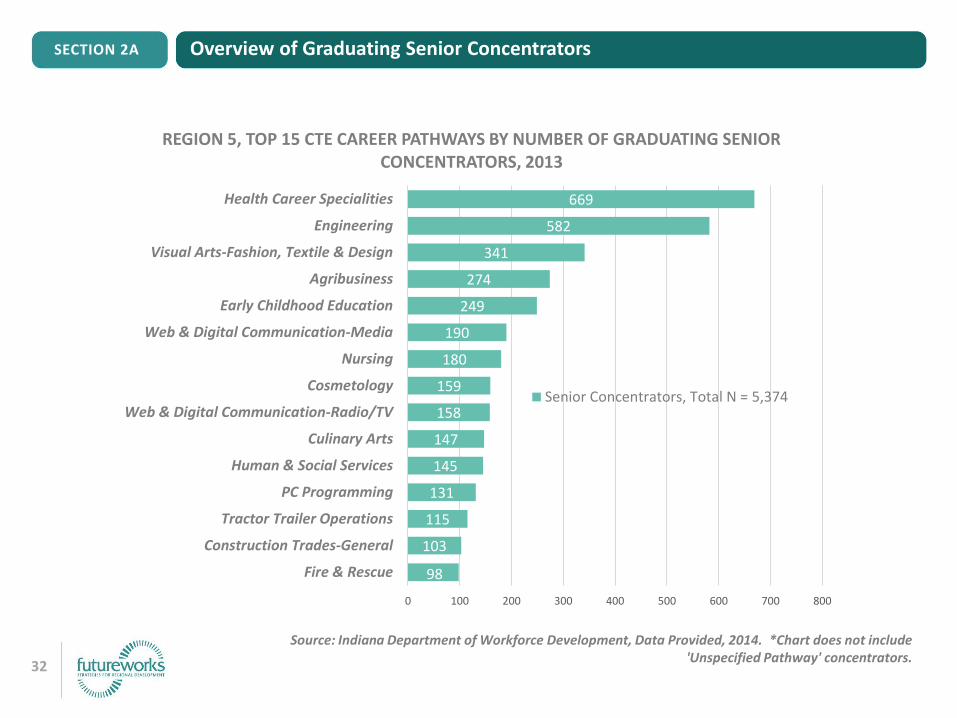
Source: Indiana Department of Workforce Development, Data Provided, 2014. *Chart does not include 'Unspecified Pathway' concentrators.
98
103
115
131
145
147
158
159
180
190
249
274
341
582
669
0 100 200 300 400 500 600 700 800
Fire & Rescue
Construction Trades-General
Tractor Trailer Operations
PC Programming
Human & Social Services
Culinary Arts
Web & Digital Communication-Radio/TV
Cosmetology
Nursing
Web & Digital Communication-Media
Early Childhood Education
Agribusiness
Visual Arts-Fashion, Textile & Design
Engineering
Health Career Specialities
REGION 5, TOP 15 CTE CAREER PATHWAYS BY NUMBER OF GRADUATING SENIOR CONCENTRATORS, 2013
Senior Concentrators, Total N = 5,374
33
Overview of Graduating Senior Concentrators SECTION 2A
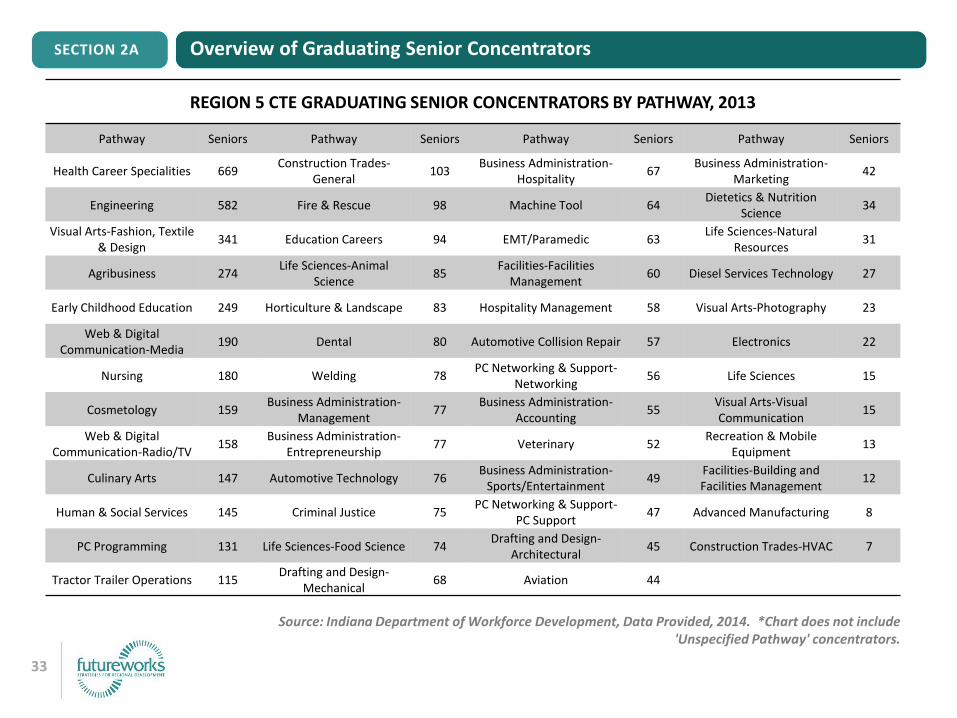
Source: Indiana Department of Workforce Development, Data Provided, 2014. *Chart does not include 'Unspecified Pathway' concentrators.
REGION 5 CTE GRADUATING SENIOR CONCENTRATORS BY PATHWAY, 2013
Pathway Seniors Pathway Seniors Pathway Seniors Pathway Seniors
Health Career Specialities 669Construction Trades-
General103
Business Administration-Hospitality
67Business Administration-
Marketing42
Engineering 582 Fire & Rescue 98 Machine Tool 64Dietetics & Nutrition
Science34
Visual Arts-Fashion, Textile & Design
341 Education Careers 94 EMT/Paramedic 63Life Sciences-Natural
Resources31
Agribusiness 274Life Sciences-Animal
Science85
Facilities-Facilities Management
60 Diesel Services Technology 27
Early Childhood Education 249 Horticulture & Landscape 83 Hospitality Management 58 Visual Arts-Photography 23
Web & Digital Communication-Media
190 Dental 80 Automotive Collision Repair 57 Electronics 22
Nursing 180 Welding 78PC Networking & Support-
Networking56 Life Sciences 15
Cosmetology 159Business Administration-
Management77
Business Administration-Accounting
55Visual Arts-Visual Communication
15
Web & Digital Communication-Radio/TV
158Business Administration-
Entrepreneurship77 Veterinary 52
Recreation & Mobile Equipment
13
Culinary Arts 147 Automotive Technology 76Business Administration-
Sports/Entertainment49
Facilities-Building and Facilities Management
12
Human & Social Services 145 Criminal Justice 75PC Networking & Support-
PC Support47 Advanced Manufacturing 8
PC Programming 131 Life Sciences-Food Science 74Drafting and Design-
Architectural45 Construction Trades-HVAC 7
Tractor Trailer Operations 115Drafting and Design-
Mechanical68 Aviation 44

34
SECTION 2B
Overview of CTE Enrollments and Concentrators by Pathway and District
35
SECTION 2B Overview of CTE Enrollments and Concentrators
CTE DISTRICT ENROLLMENTS AND CONCENTRATORS
In this section, we describe total enrollments and concentrators in CTE districts and in regions. Although, different in definition that the graduating senior concentrators as an outcome measure, these data do provide an additional view of CTE within Indiana and within regions. The tables here show enrollments and concentrations by pathways in districts and by regions.
DOE and DWD identify an enrollment as a CTE course taken by student. In a CTE district, enrollments present a picture of the overall scale and volume of CTE courses offered and taken by students. Because state and federal funds are distributed to districts based on enrollments, this is an important statistic to gauge the scale of public investment in CTE in districts.
Concentrators are simply students who have taken enough credits in a cluster of CTE courses to qualify as a concentrator. In these tables concentrators are likely to be Juniors and Seniors.
Both enrollments and concentrators, in these data, include duplication (one student may be enrolled in two or more courses and will thus count as two enrollments). In addition, students may be assigned to a concentration simply by virtue of having taken a related group of courses whether or not they had intentions of concentrating in a CTE field. Moreover, the relationship between the number of enrollments and number of concentrators cannot be strictly interpreted as a percentage of concentrators to enrollments.
Note: These data include CTE courses offered at the CTE career centers (dedicated CTE facilities) and comprehensive high schools within the respective CTE districts. This will have an significant impact on the total numbers of enrollments and concentrators reported for each CTE district.

36
REGION FIVE CTE COURSE ENROLLMENTS AND CONCENTRATORS BY DISTRICT
DistrictTotal CTE
EnrollmentsTotal Enrollments in CTE Pathways
Total Concentrators
in CTE Pathways
#31- Ben Davis Career and Technical 12197 3792 902
#24 - J. Everett Light Career Center 10827 4629 4198
#37 - Central Nine Career Center 9194 3098 1621
#36 - Hoosier Hills Career Center 5501 1599 712
#49 - Walker Career Center 5065 1686 663
#27 - New Castle Area Voc. School 2672 1127 455
#26 - Anderson Community Schools 2653 695 99
#33 - McKenzie Career Center 2546 933 372
#32 - Career & Technical High School 1681 796 346
#38 - Blue River Career Programs 1168 356 247
#25 - Hinds Career Center 1083 426 215
SECTION 2B Overview of Supply
Source: Indiana Department of Workforce Development, Data Provided, 2014.

37
Overview of SupplySECTION 2B
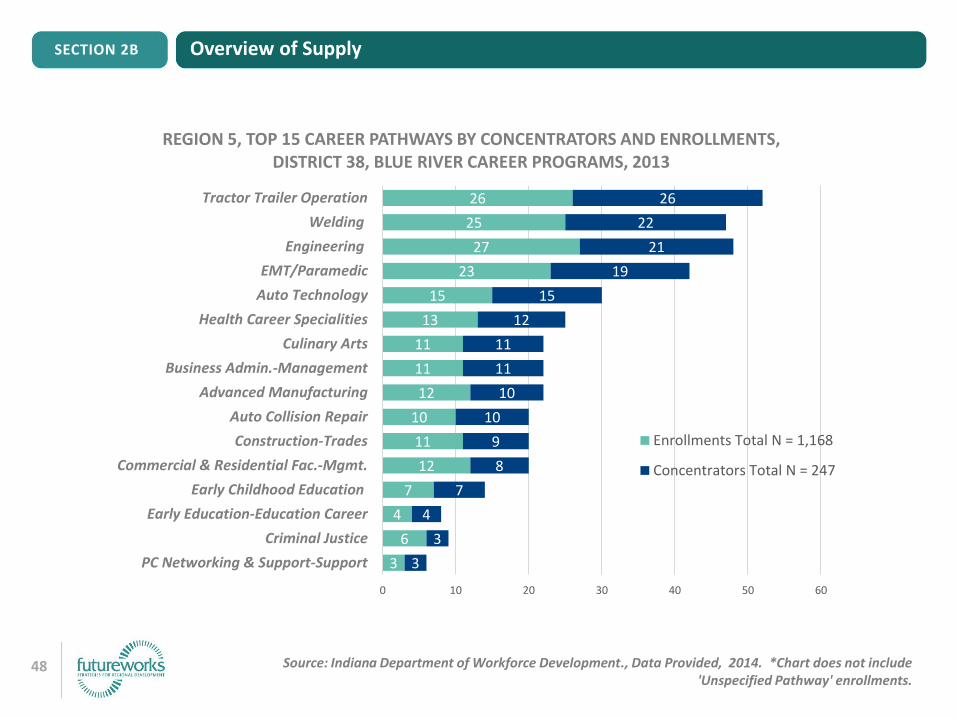
Source: Indiana Department of Workforce Development, Data Provided, 2014. *Chart does not include 'Unspecified Pathway' enrollments.
378
390
401
468
555
588
622
630
635
647
727
769
823
908
1078
1344
2965
375
232
140
332
160
150
141
155
134
108
128
289
245
200
647
243
1196
0 500 1000 1500 2000 2500 3000 3500 4000 4500
Tractor Trailer Operation
Welding
Human and Social Services
Cosmetology
Life Sciences-Animal Science
Horticulture & Landscape
Business Admin.-Accounting
Early Education-Education Career
Web & Digital Comm.-RadioTV
Agribusiness
PC Programming
Culinary Arts
Business Admin.-Management
Web & Digital Comm.-Media
Engineering
Visual Arts-Fashion
Health Career Specialities
REGION 5, TOP 15 CAREER PATHWAYS BY CONCENTRATORS AND ENROLLMENTS, ALL DISTRICTS, 2013
Enrollments Total N = 54,587
Concentrators Total N = 9,830
38
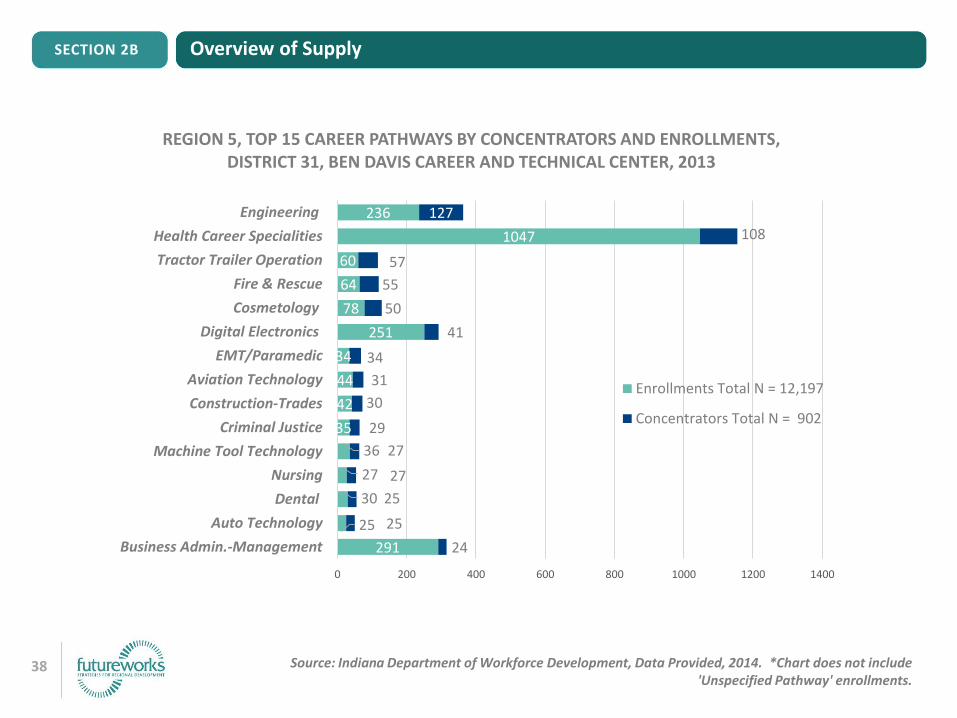
Overview of SupplySECTION 2B
Source: Indiana Department of Workforce Development, Data Provided, 2014. *Chart does not include 'Unspecified Pathway' enrollments.
291
25
30
27
36
35
42
44
34
251
78
64
60
1047
236
24
25
25
27
27
29
30
31
34
41
50
55
57
108
127
0 200 400 600 800 1000 1200 1400
Business Admin.-Management
Auto Technology
Dental
Nursing
Machine Tool Technology
Criminal Justice
Construction-Trades
Aviation Technology
EMT/Paramedic
Digital Electronics
Cosmetology
Fire & Rescue
Tractor Trailer Operation
Health Career Specialities
Engineering
REGION 5, TOP 15 CAREER PATHWAYS BY CONCENTRATORS AND ENROLLMENTS, DISTRICT 31, BEN DAVIS CAREER AND TECHNICAL CENTER, 2013
Enrollments Total N = 12,197
Concentrators Total N = 902

39
Overview of SupplySECTION 2B
Source: Indiana Department of Workforce Development, Data Provided, 2014. *Chart does not include 'Unspecified Pathway' enrollments.
112
91
97
118
114
194
141
158
200
191
181
275
211
449
259
85
91
97
102
114
117
136
138
158
176
181
190
191
199
258
0 100 200 300 400 500 600 700
Culinary Arts
PC Networking & Support
Nursing
Cosmetology
Human and Social Services
Life Sciences-Animal Science
Business Admin.-Accounting
Business Admin.-Marketing…
Web & Digital Comm.-Media
Early Childhood Education
Business Admin.-Entrepreneurship
Engineering
Business Admin.-Marketing
Visual Arts-Fashion
Health Career Specialities
REGION 5, TOP 15 CAREER PATHWAYS BY CONCENTRATORS AND ENROLLMENTS, DISTRICT 24, J. EVERETT LIGHT CAREER CENTER, 2013
Enrollments Total N = 10,827
Concentrators Total N = 4,198
40
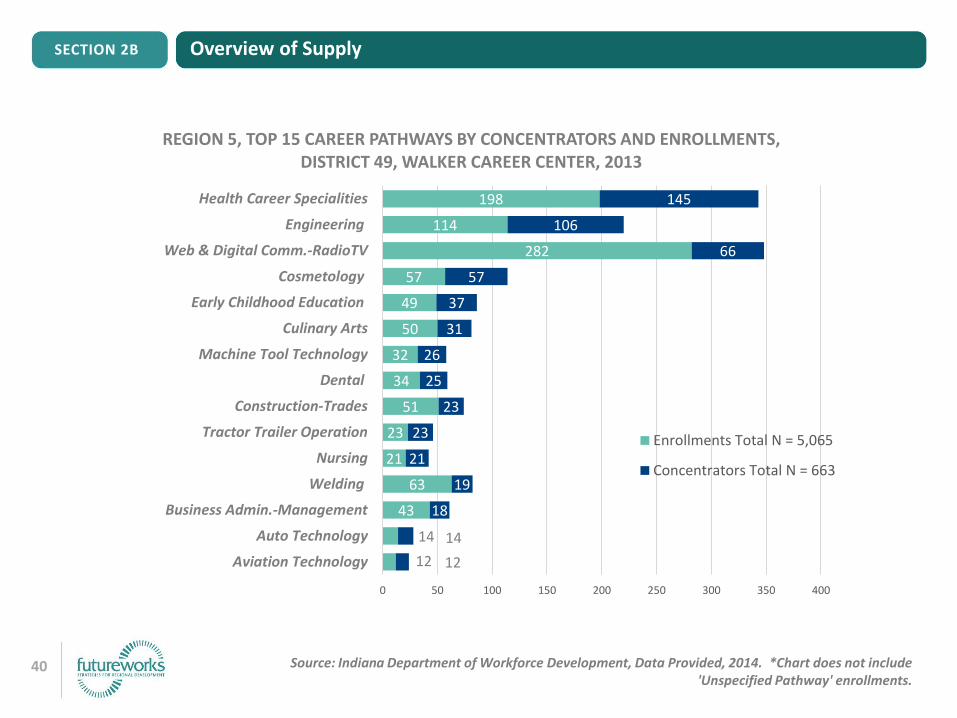
Overview of SupplySECTION 2B
Source: Indiana Department of Workforce Development, Data Provided, 2014. *Chart does not include 'Unspecified Pathway' enrollments.
12
14
43
63
21
23
51
34
32
50
49
57
282
114
198
12
14
18
19
21
23
23
25
26
31
37
57
66
106
145
0 50 100 150 200 250 300 350 400
Aviation Technology
Auto Technology
Business Admin.-Management
Welding
Nursing
Tractor Trailer Operation
Construction-Trades
Dental
Machine Tool Technology
Culinary Arts
Early Childhood Education
Cosmetology
Web & Digital Comm.-RadioTV
Engineering
Health Career Specialities
REGION 5, TOP 15 CAREER PATHWAYS BY CONCENTRATORS AND ENROLLMENTS, DISTRICT 49, WALKER CAREER CENTER, 2013
Enrollments Total N = 5,065
Concentrators Total N = 663
41
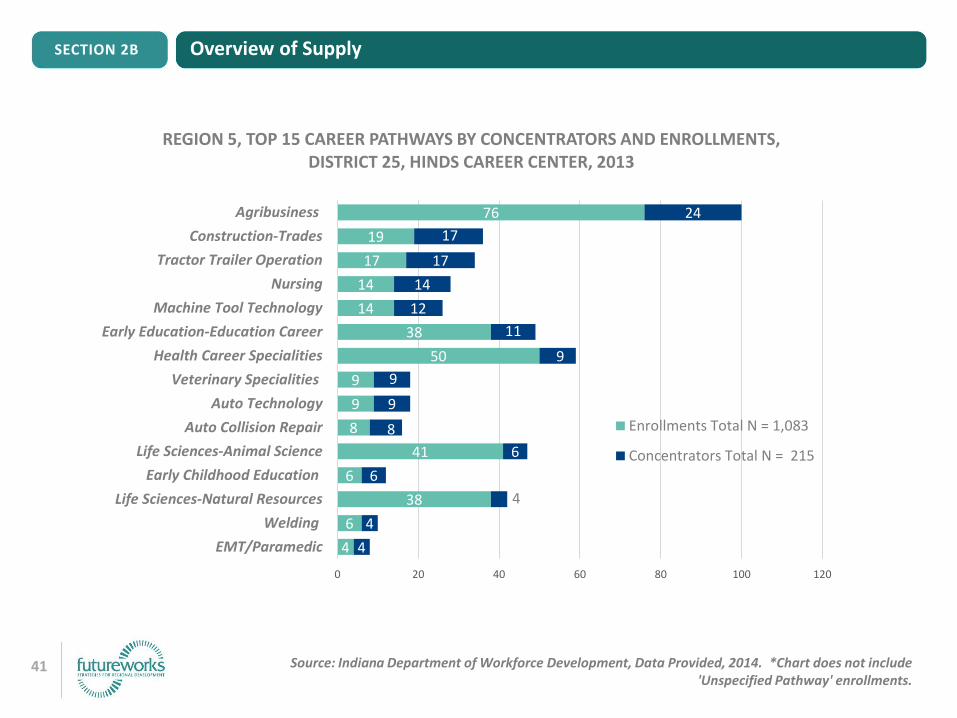
Overview of SupplySECTION 2B
Source: Indiana Department of Workforce Development, Data Provided, 2014. *Chart does not include 'Unspecified Pathway' enrollments.
4
6
38
6
41
8
9
9
50
38
14
14
17
19
76
4
4
4
6
6
8
9
9
9
11
12
14
17
17
24
0 20 40 60 80 100 120
EMT/Paramedic
Welding
Life Sciences-Natural Resources
Early Childhood Education
Life Sciences-Animal Science
Auto Collision Repair
Auto Technology
Veterinary Specialities
Health Career Specialities
Early Education-Education Career
Machine Tool Technology
Nursing
Tractor Trailer Operation
Construction-Trades
Agribusiness
REGION 5, TOP 15 CAREER PATHWAYS BY CONCENTRATORS AND ENROLLMENTS, DISTRICT 25, HINDS CAREER CENTER, 2013
Enrollments Total N = 1,083
Concentrators Total N = 215
42
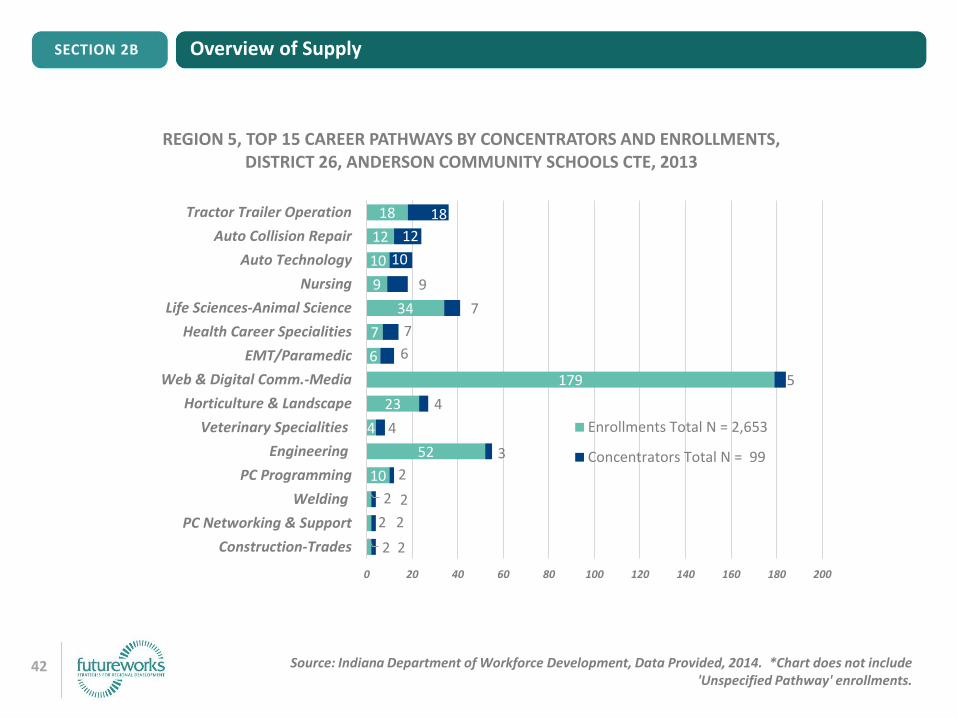
Overview of SupplySECTION 2B
Source: Indiana Department of Workforce Development, Data Provided, 2014. *Chart does not include 'Unspecified Pathway' enrollments.
2
2
2
10
52
4
23
179
6
7
34
9
10
12
18
2
2
2
2
3
4
4
5
6
7
7
9
10
12
18
0 20 40 60 80 100 120 140 160 180 200
Construction-Trades
PC Networking & Support
Welding
PC Programming
Engineering
Veterinary Specialities
Horticulture & Landscape
Web & Digital Comm.-Media
EMT/Paramedic
Health Career Specialities
Life Sciences-Animal Science
Nursing
Auto Technology
Auto Collision Repair
Tractor Trailer Operation
REGION 5, TOP 15 CAREER PATHWAYS BY CONCENTRATORS AND ENROLLMENTS, DISTRICT 26, ANDERSON COMMUNITY SCHOOLS CTE, 2013
Enrollments Total N = 2,653
Concentrators Total N = 99
43
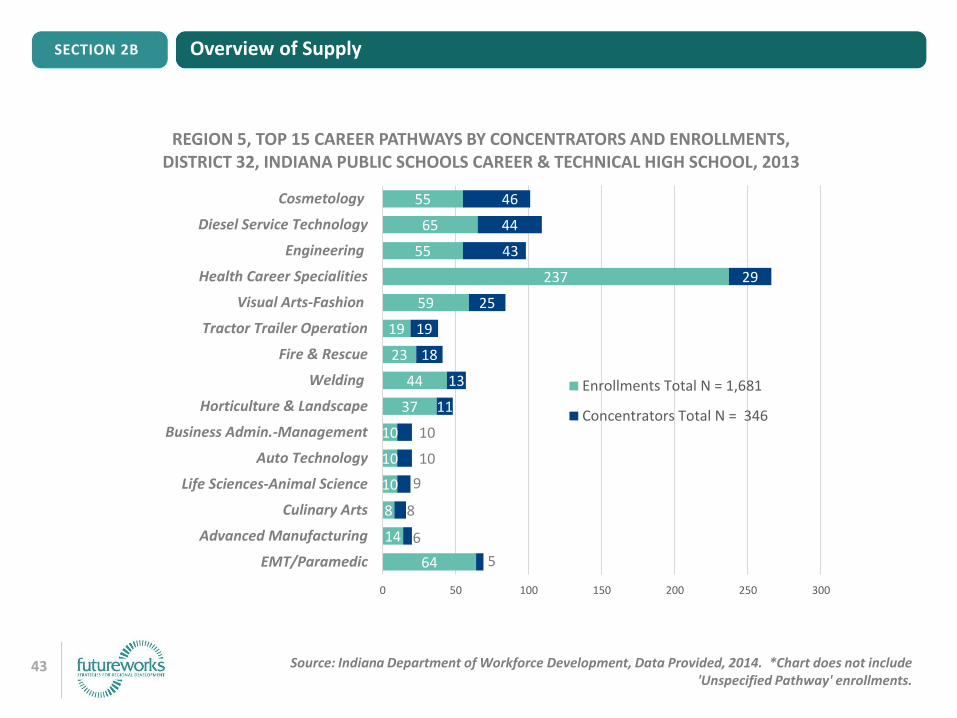
Overview of SupplySECTION 2B
Source: Indiana Department of Workforce Development, Data Provided, 2014. *Chart does not include 'Unspecified Pathway' enrollments.
64
14
8
10
10
10
37
44
23
19
59
237
55
65
55
5
6
8
9
10
10
11
13
18
19
25
29
43
44
46
0 50 100 150 200 250 300
EMT/Paramedic
Advanced Manufacturing
Culinary Arts
Life Sciences-Animal Science
Auto Technology
Business Admin.-Management
Horticulture & Landscape
Welding
Fire & Rescue
Tractor Trailer Operation
Visual Arts-Fashion
Health Career Specialities
Engineering
Diesel Service Technology
Cosmetology
REGION 5, TOP 15 CAREER PATHWAYS BY CONCENTRATORS AND ENROLLMENTS, DISTRICT 32, INDIANA PUBLIC SCHOOLS CAREER & TECHNICAL HIGH SCHOOL, 2013
Enrollments Total N = 1,681
Concentrators Total N = 346

44
Overview of SupplySECTION 2B
Source: Indiana Department of Workforce Development, Data Provided, 2014. *Chart does not include 'Unspecified Pathway' enrollments.
7
7
10
10
10
17
14
160
20
93
22
101
57
81
122
7
7
10
10
10
11
14
14
20
21
22
23
25
50
116
0 50 100 150 200 250
Auto Technology
Machine Tool Technology
Auto Collision Repair
Aviation Technology
Business Admin.-Marketing
Advanced Manufacturing
Tractor Trailer Operation
Business Admin.-Management
Culinary Arts
Web & Digital Comm.-Media
Early Childhood Education
Cosmetology
Early Education-Education Career
Engineering
Health Career Specialities
REGION 5, TOP 15 CAREER PATHWAYS BY CONCENTRATORS AND ENROLLMENT, DISTRICT 33, BERNARD K. MCKENZIE CAREER CENTER, 2013
Enrollments Total N = 2,546
Concentrators Total N = 372
45
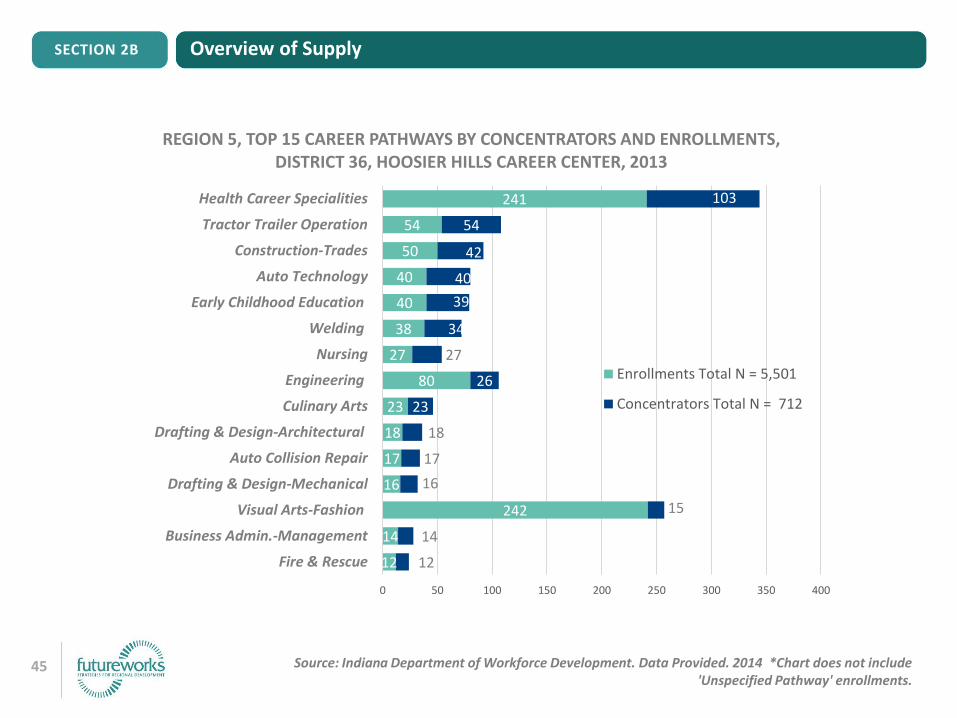
Overview of SupplySECTION 2B
Source: Indiana Department of Workforce Development. Data Provided. 2014 *Chart does not include 'Unspecified Pathway' enrollments.
12
14
242
16
17
18
23
80
27
38
40
40
50
54
241
12
14
15
16
17
18
23
26
27
34
39
40
42
54
103
0 50 100 150 200 250 300 350 400
Fire & Rescue
Business Admin.-Management
Visual Arts-Fashion
Drafting & Design-Mechanical
Auto Collision Repair
Drafting & Design-Architectural
Culinary Arts
Engineering
Nursing
Welding
Early Childhood Education
Auto Technology
Construction-Trades
Tractor Trailer Operation
Health Career Specialities
REGION 5, TOP 15 CAREER PATHWAYS BY CONCENTRATORS AND ENROLLMENTS, DISTRICT 36, HOOSIER HILLS CAREER CENTER, 2013
Enrollments Total N = 5,501
Concentrators Total N = 712
46
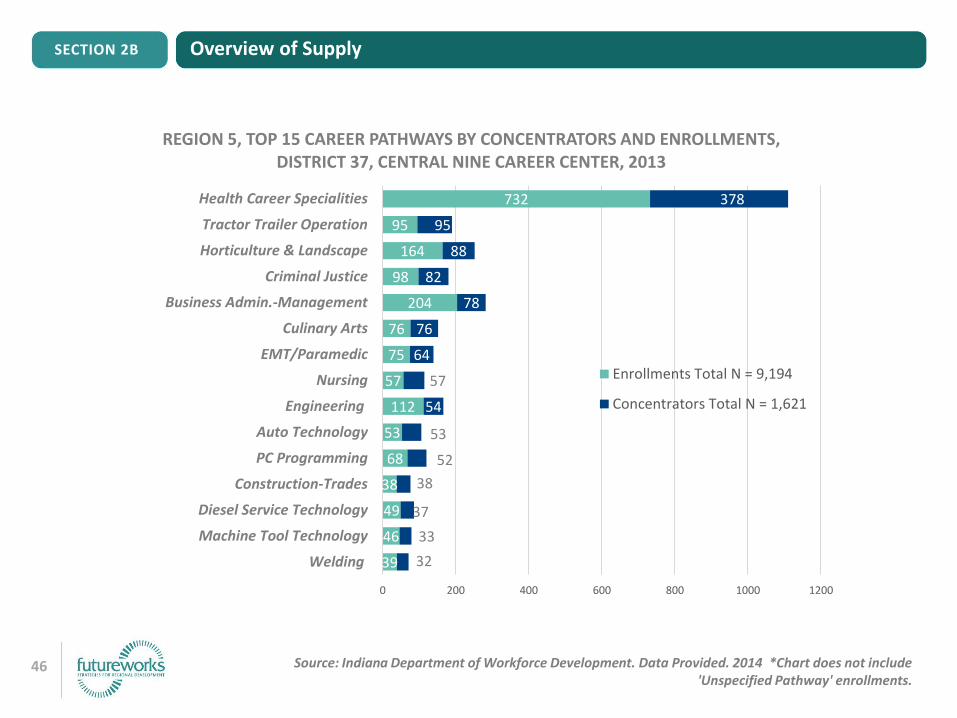
Overview of SupplySECTION 2B
Source: Indiana Department of Workforce Development. Data Provided. 2014 *Chart does not include 'Unspecified Pathway' enrollments.
39
46
49
38
68
53
112
57
75
76
204
98
164
95
732
32
33
37
38
52
53
54
57
64
76
78
82
88
95
378
0 200 400 600 800 1000 1200
Welding
Machine Tool Technology
Diesel Service Technology
Construction-Trades
PC Programming
Auto Technology
Engineering
Nursing
EMT/Paramedic
Culinary Arts
Business Admin.-Management
Criminal Justice
Horticulture & Landscape
Tractor Trailer Operation
Health Career Specialities
REGION 5, TOP 15 CAREER PATHWAYS BY CONCENTRATORS AND ENROLLMENTS, DISTRICT 37, CENTRAL NINE CAREER CENTER, 2013
Enrollments Total N = 9,194
Concentrators Total N = 1,621
47
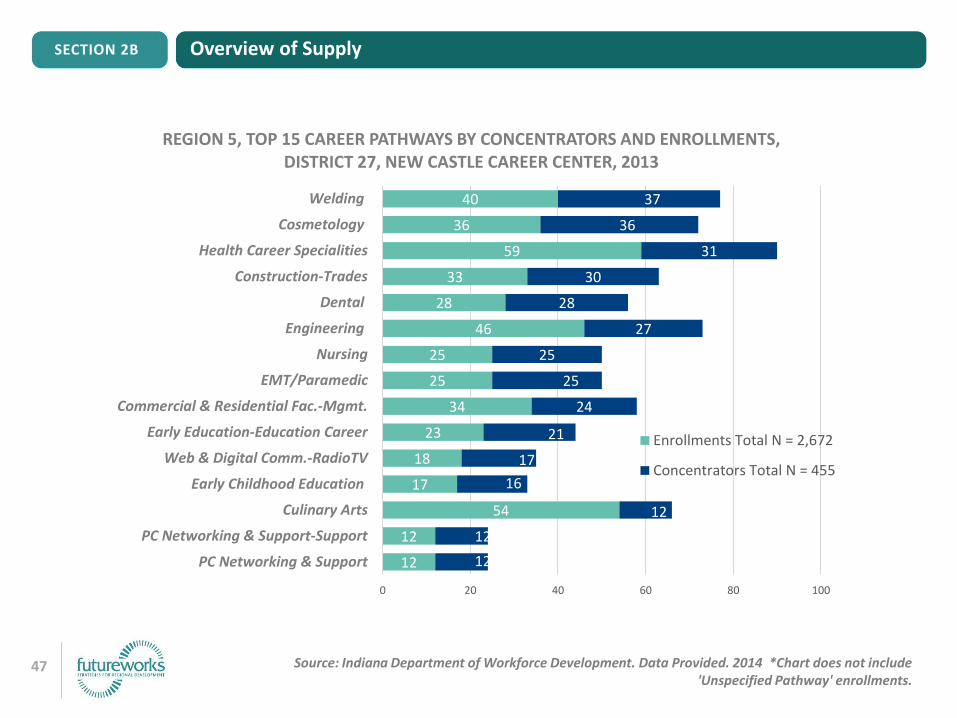
Overview of SupplySECTION 2B
Source: Indiana Department of Workforce Development. Data Provided. 2014 *Chart does not include 'Unspecified Pathway' enrollments.
12
12
54
17
18
23
34
25
25
46
28
33
59
36
40
12
12
12
16
17
21
24
25
25
27
28
30
31
36
37
0 20 40 60 80 100
PC Networking & Support
PC Networking & Support-Support
Culinary Arts
Early Childhood Education
Web & Digital Comm.-RadioTV
Early Education-Education Career
Commercial & Residential Fac.-Mgmt.
EMT/Paramedic
Nursing
Engineering
Dental
Construction-Trades
Health Career Specialities
Cosmetology
Welding
REGION 5, TOP 15 CAREER PATHWAYS BY CONCENTRATORS AND ENROLLMENTS, DISTRICT 27, NEW CASTLE CAREER CENTER, 2013
Enrollments Total N = 2,672
Concentrators Total N = 455
48
Overview of SupplySECTION 2B
Source: Indiana Department of Workforce Development., Data Provided, 2014. *Chart does not include 'Unspecified Pathway' enrollments.
3
6
4
7
12
11
10
12
11
11
13
15
23
27
25
26
3
3
4
7
8
9
10
10
11
11
12
15
19
21
22
26
0 10 20 30 40 50 60
PC Networking & Support-Support
Criminal Justice
Early Education-Education Career
Early Childhood Education
Commercial & Residential Fac.-Mgmt.
Construction-Trades
Auto Collision Repair
Advanced Manufacturing
Business Admin.-Management
Culinary Arts
Health Career Specialities
Auto Technology
EMT/Paramedic
Engineering
Welding
Tractor Trailer Operation
REGION 5, TOP 15 CAREER PATHWAYS BY CONCENTRATORS AND ENROLLMENTS, DISTRICT 38, BLUE RIVER CAREER PROGRAMS, 2013
Enrollments Total N = 1,168
Concentrators Total N = 247

49
SECTION 2C
Overview of Postsecondary Supply

50
Overview of Postsecondary Supply
SECTION OVERVIEW
In this section, we present data on student completions for select public and private postsecondary educational institutions located in the Works Council region. The charts that follow show the number of graduates and type of credentials awarded by certificate and degrees in the top programs of study for the region as a whole and each institution.
The Works Councils can use these data to identify program areas that produce the most graduates, identify the type of credentials being awarded, and compare student output (completions) to regional and statewide demand in the economy.
The following colleges and universities are included in the analysis for this region: » Anderson University » Brown Mackie College – Indianapolis» Butler University » Franklin College» Harrison College- Indianapolis» IUPU- Indianapolis» ITT Technical Institute» Ivy Tech Community College-Central Indiana» Kaplan College» Lincoln College of Technology» Marian University» Martin University » MedTech College» The Art Institute of Indianapolis» University of Indianapolis» University of Phoenix
SECTION 2C
51
Overview of Postsecondary Supply
SECTION OVERVIEW, Cont.
We have included Rose-Hulman Institute of Technology and Vincennes University as part of the region because they are important sources of technical education and serve students across Indiana. Excluded from the analysis are postsecondary institutions with less than 300 students, all cosmetology, massage, and therapeutic proprietary schools, religious training schools, and any college that is not included in the National Center for Educational Statistics database. The analysis is limited to accredited colleges and universities located within Indiana.
The data in the charts show the total graduates, or student completions, from these institutions by field of study. The field of study is federally defined by the Classification of Instructional Programs coding system used for U.S. colleges that disperse student financial aid.
Our sample includes 90 Indiana public and private colleges and universities that enroll just over 450,000 students. These institutions awarded 91,540 credentials in 2013. They ranged from short term academic certificates to master’s degrees. As comparison for the region, the first two charts in this section includes total completers in the top 15 programs of study for all 93 public and private postsecondary institutions in Indiana.
Colleges and universities award a variety of credentials to students and workers in the Indiana workforce. We show data on academic, credit bearing credentials including certificates representing less than one full year of study (about 30 credits or less); certificates representing between one- and two-years of study (between 30 and about 48 credits); associate degrees, bachelor’s degrees, and master’s degrees. We do not include professional development and skills training certificates, non-credit programs, or industry-based certifications. Even though these programs can be important sources of talent, their data sources are not consistent and vary in terms of access, which make their use beyond the scope of this project.
SECTION 2C
52
Overview of Postsecondary SupplySECTION 2C
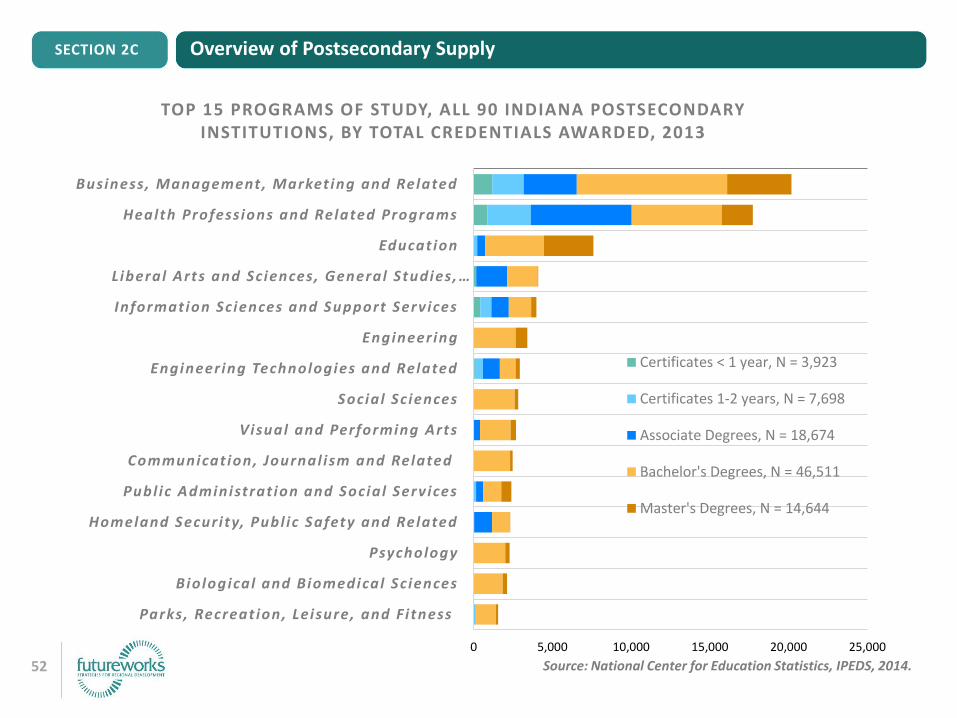
Source: National Center for Education Statistics, IPEDS, 2014.
0 5,000 10,000 15,000 20,000 25,000
Business, Management, Market ing and Related
Health Professions and Related Programs
Educat ion
Liberal Arts and Sciences, General Studies, …
Information Sciences and Support Services
Engineering
Engineering Technologies and Related
Social Sc iences
Visual and Performing Arts
Communicat ion, Journal ism and Related
Publ ic Administrat ion and Social Services
Homeland Securi ty, Publ ic Safety and Related
Psychology
Biological and Biomedical Sc iences
Parks, Recreat ion, Leisure, and F i tness
TOP 15 PROGRAMS OF STUDY, ALL 90 INDIANA POSTSECONDARY INSTITUTIONS, BY TOTAL CREDENTIALS AWARDED, 2013
Certificates < 1 year, N = 3,923
Certificates 1-2 years, N = 7,698
Associate Degrees, N = 18,674
Bachelor's Degrees, N = 46,511
Master's Degrees, N = 14,644

53
Overview of Postsecondary SupplySECTION 2C
Source: National Center for Education Statistics, IPEDS, 2014.
8%
8%7%
6%
5%
4%
3%
3%
3%3%
2%2%2% 2%
2%
TOP 15 PROGRAMS OF STUDY, ALL 90 INDIANA POSTSECONDARY INSTITUTIONS, AWARDS IN FIELDS AS PERCENTAGES OF ALL CREDENTIALS AWARDED, 2013
Business, Management, Marketing and Related
Health Professions and Related Programs
Education
Liberal Arts and Sciences, General Studies, Humanities
Information Sciences and Support Services
Engineering
Engineering Technologies and Related
Social Sciences
Visual and Performing Arts
Communication, Journalism and Related
Public Administration and Social Services
Homeland Security, Public Safety and Related
Psychology
Biological and Biomedical Sciences
Parks, Recreation, Leisure, and FitnessTotal Credentials Awarded, All Programs, N = 91,540
54
Overview of Postsecondary SupplySECTION 2C
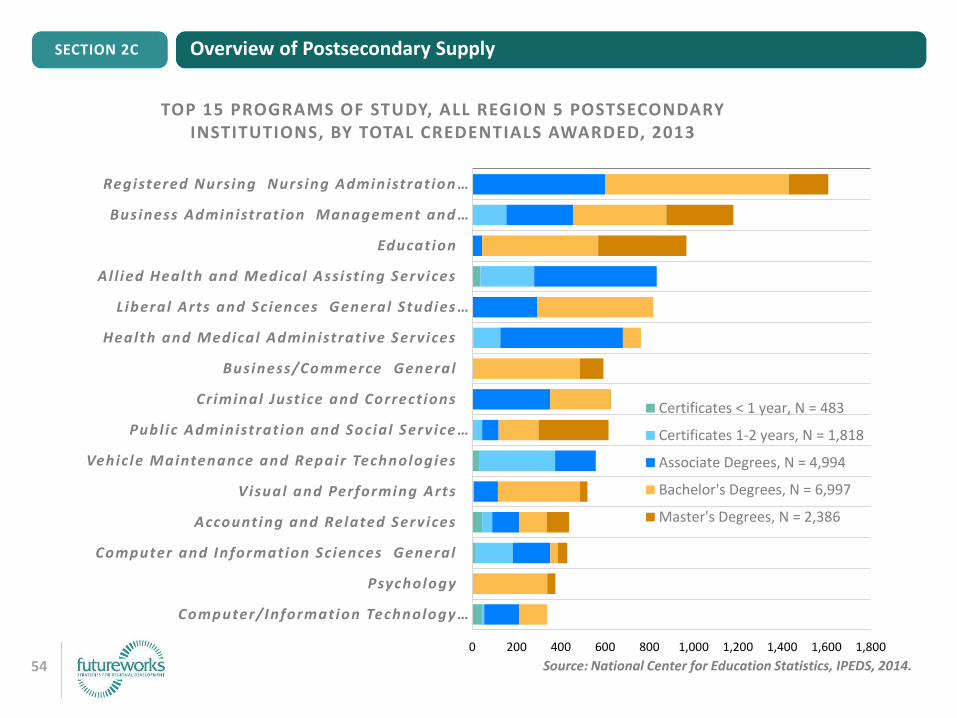
Source: National Center for Education Statistics, IPEDS, 2014.
0 200 400 600 800 1,000 1,200 1,400 1,600 1,800
Registered Nursing Nursing Administrat ion …
Business Administrat ion Management and …
Educat ion
Al l ied Health and Medical Assist ing Services
Liberal Arts and Sciences General Studies …
Health and Medical Administrat ive Services
Business/Commerce General
Cr iminal Just ice and Correct ions
Publ ic Administrat ion and Social Service …
Vehicle Maintenance and Repair Technologies
Visual and Performing Arts
Account ing and Related Services
Computer and Information Sciences General
Psychology
Computer/Information Technology …
TOP 15 PROGRAMS OF STUDY, ALL REGION 5 POSTSECONDARY INSTITUTIONS, BY TOTAL CREDENTIALS AWARDED, 2013
Certificates < 1 year, N = 483
Certificates 1-2 years, N = 1,818
Associate Degrees, N = 4,994
Bachelor's Degrees, N = 6,997
Master's Degrees, N = 2,386
55
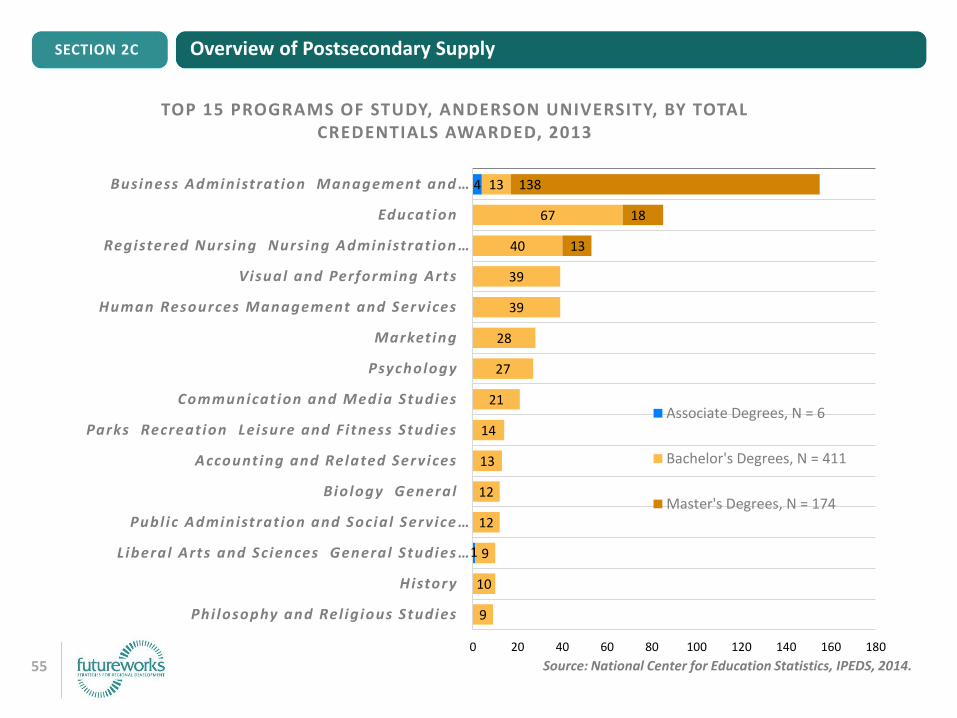
Overview of Postsecondary SupplySECTION 2C
Source: National Center for Education Statistics, IPEDS, 2014.
4
1
13
67
40
39
39
28
27
21
14
13
12
12
9
10
9
138
18
13
0 20 40 60 80 100 120 140 160 180
Business Administrat ion Management and …
Educat ion
Registered Nursing Nursing Administrat ion …
Visual and Performing Arts
Human Resources Management and Services
Market ing
Psychology
Communicat ion and Media Studies
Parks Recreat ion Leisure and F i tness Studies
Account ing and Related Services
Biology General
Publ ic Administrat ion and Social Service …
Liberal Arts and Sciences General Studies …
History
Phi losophy and Rel ig ious Studies
TOP 15 PROGRAMS OF STUDY, ANDERSON UNIVERSITY, BY TOTAL CREDENTIALS AWARDED, 2013
Associate Degrees, N = 6
Bachelor's Degrees, N = 411
Master's Degrees, N = 174
56
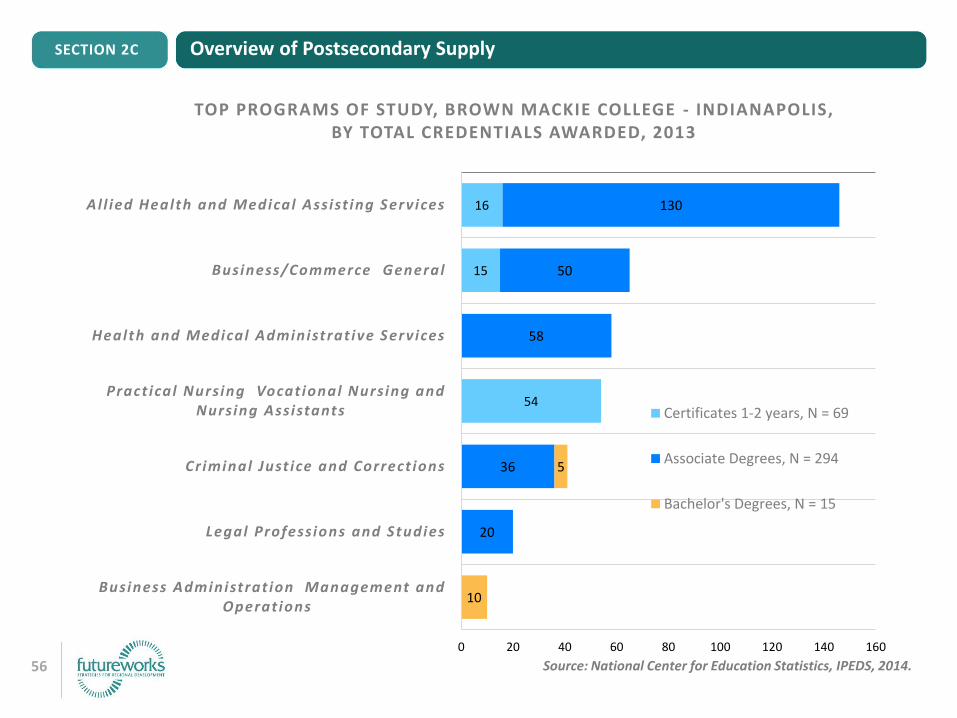
Overview of Postsecondary SupplySECTION 2C
Source: National Center for Education Statistics, IPEDS, 2014.
16
15
54
130
50
58
36
20
5
10
0 20 40 60 80 100 120 140 160
Al l ied Health and Medical Assist ing Services
Business/Commerce General
Health and Medical Administrat ive Services
Pract ical Nursing Vocat ional Nursing and Nursing Assistants
Criminal Just ice and Correct ions
Legal Professions and Studies
Business Administrat ion Management and Operat ions
TOP PROGRAMS OF STUDY, BROWN MACKIE COLLEGE - INDIANAPOLIS, BY TOTAL CREDENTIALS AWARDED, 2013
Certificates 1-2 years, N = 69
Associate Degrees, N = 294
Bachelor's Degrees, N = 15

57
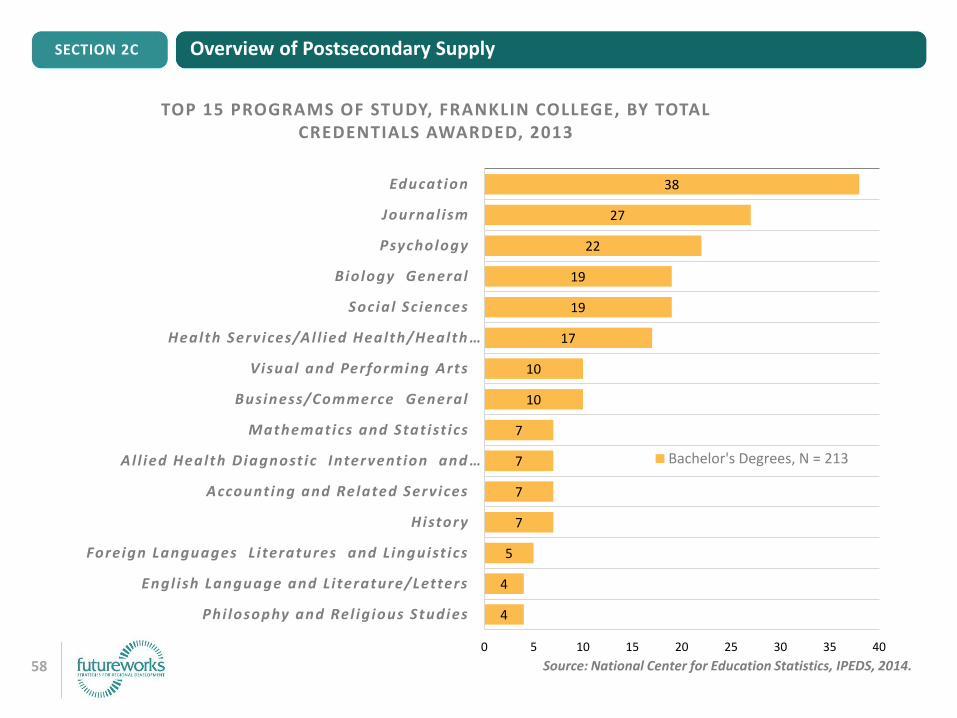
Overview of Postsecondary SupplySECTION 2C
Source: National Center for Education Statistics, IPEDS, 2014.
108
45
74
55
50
31
40
19
37
36
34
23
23
23
55
45
7
46
11
19
0 20 40 60 80 100 120 140 160 180
Educat ion
Al l ied Health Diagnost ic Intervent ion and …
Visual and Performing Arts
Social Sc iences
Market ing
Business Administrat ion Management and …
Account ing and Related Services
Finance and F inancial Management Services
Engl ish Language and Li terature/Letters
Chemistry
Biology General
Psychology
Publ ic Relat ions Advert is ing and Appl ied …
Communicat ion Disorders Sciences and …
History
TOP 15 PROGRAMS OF STUDY, BUTLER UNIVERSITY, BY TOTAL CREDENTIALS AWARDED, 2013
Associate Degrees, N = 2
Bachelor's Degrees, N = 695
Master's Degrees, N = 183
58
Overview of Postsecondary SupplySECTION 2C
Source: National Center for Education Statistics, IPEDS, 2014.
38
27
22
19
19
17
10
10
7
7
7
7
5
4
4
0 5 10 15 20 25 30 35 40
Educat ion
Journal ism
Psychology
Biology General
Social Sc iences
Health Services/Al l ied Health/Health …
Visual and Performing Arts
Business/Commerce General
Mathematics and Stat ist ics
Al l ied Health Diagnost ic Intervent ion and …
Account ing and Related Services
History
Foreign Languages L i teratures and L inguist ics
Engl ish Language and Li terature/Letters
Phi losophy and Rel ig ious Studies
TOP 15 PROGRAMS OF STUDY, FRANKLIN COLLEGE, BY TOTAL CREDENTIALS AWARDED, 2013
Bachelor's Degrees, N = 213
59
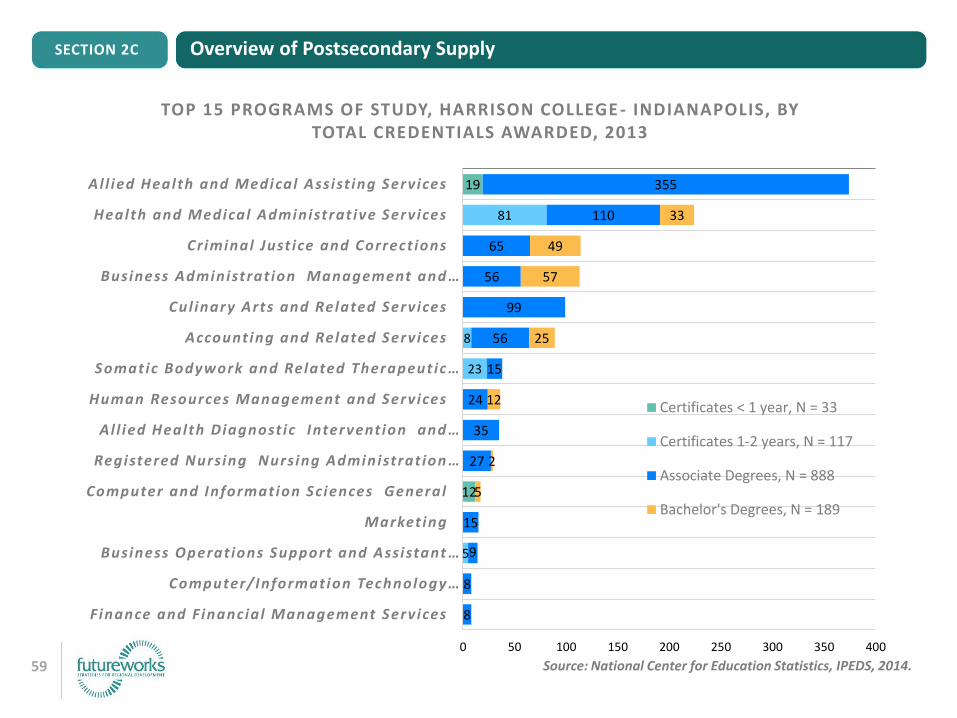
Overview of Postsecondary SupplySECTION 2C
Source: National Center for Education Statistics, IPEDS, 2014.
19
12
81
8
23
5
355
110
65
56
99
56
15
24
35
27
15
9
8
8
33
49
57
25
12
2
5
0 50 100 150 200 250 300 350 400
Al l ied Health and Medical Assist ing Services
Health and Medical Administrat ive Services
Criminal Just ice and Correct ions
Business Administrat ion Management and …
Cul inary Arts and Related Services
Account ing and Related Services
Somatic Bodywork and Related Therapeut ic …
Human Resources Management and Services
Al l ied Health Diagnost ic Intervent ion and …
Registered Nursing Nursing Administrat ion …
Computer and Information Sciences General
Market ing
Business Operat ions Support and Assistant …
Computer/Information Technology …
Finance and F inancial Management Services
TOP 15 PROGRAMS OF STUDY, HARRISON COLLEGE - INDIANAPOLIS, BY TOTAL CREDENTIALS AWARDED, 2013
Certificates < 1 year, N = 33
Certificates 1-2 years, N = 117
Associate Degrees, N = 888
Bachelor's Degrees, N = 189
60
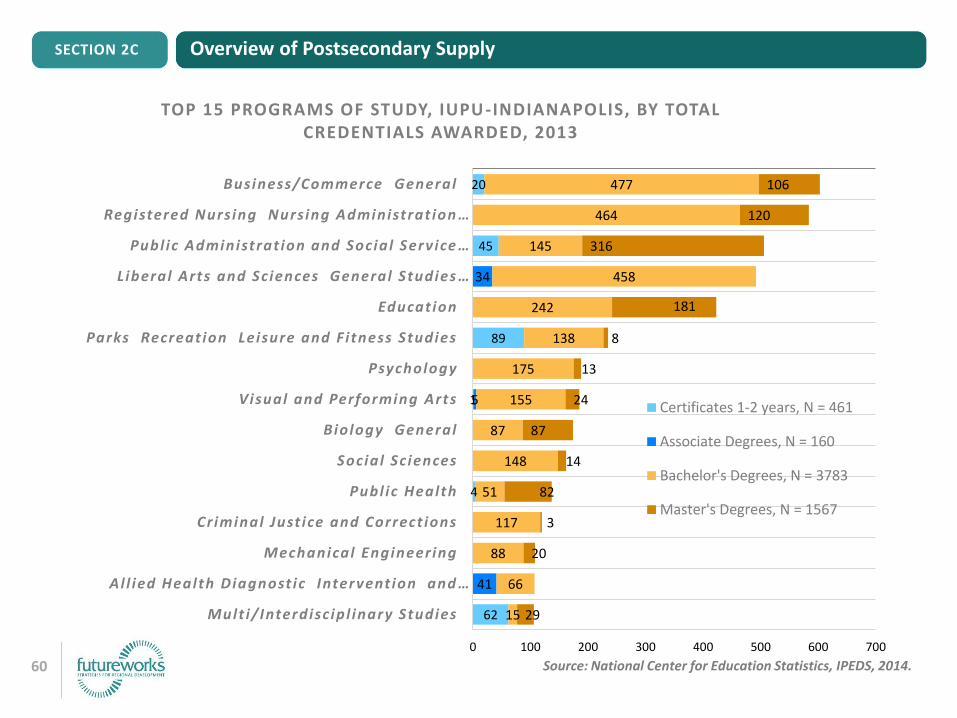
Overview of Postsecondary SupplySECTION 2C
Source: National Center for Education Statistics, IPEDS, 2014.
20
45
89
1
4
62
34
5
41
477
464
145
458
242
138
175
155
87
148
51
117
88
66
15
106
120
316
181
8
13
24
87
14
82
3
20
29
0 100 200 300 400 500 600 700
Business/Commerce General
Registered Nursing Nursing Administrat ion …
Publ ic Administrat ion and Social Service …
Liberal Arts and Sciences General Studies …
Educat ion
Parks Recreat ion Leisure and F i tness Studies
Psychology
Visual and Performing Arts
Biology General
Social Sc iences
Publ ic Health
Criminal Just ice and Correct ions
Mechanical Engineering
Al l ied Health Diagnost ic Intervent ion and …
Mult i/Interdisc ip l inary Studies
TOP 15 PROGRAMS OF STUDY, IUPU-INDIANAPOLIS, BY TOTAL CREDENTIALS AWARDED, 2013
Certificates 1-2 years, N = 461
Associate Degrees, N = 160
Bachelor's Degrees, N = 3783
Master's Degrees, N = 1567
61
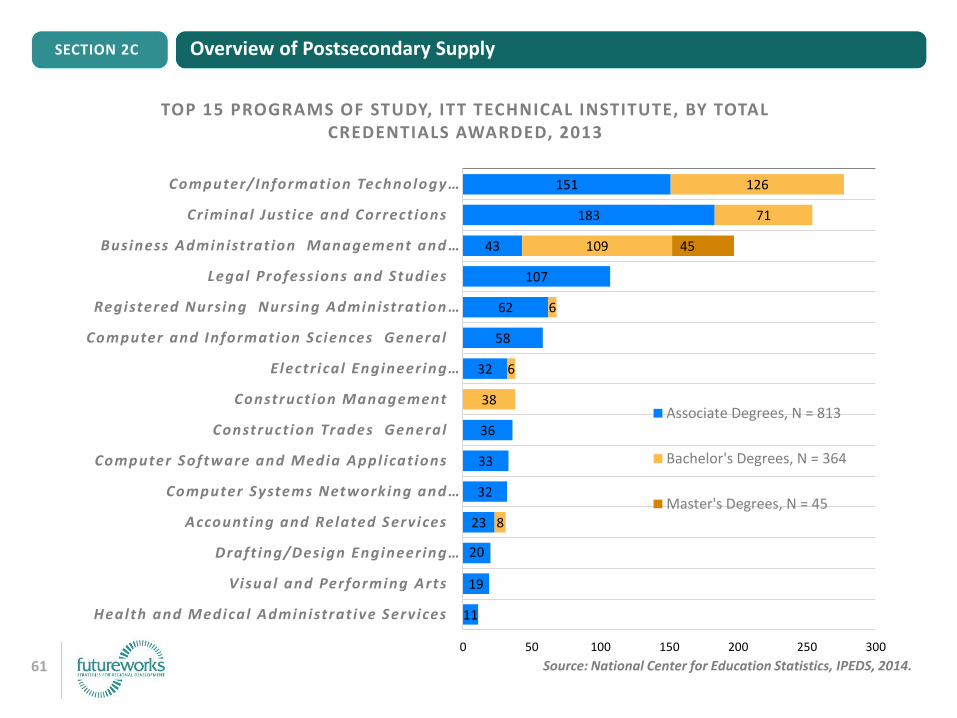
Overview of Postsecondary SupplySECTION 2C
Source: National Center for Education Statistics, IPEDS, 2014.
151
183
43
107
62
58
32
36
33
32
23
20
19
11
126
71
109
6
6
38
8
45
0 50 100 150 200 250 300
Computer/Information Technology …
Criminal Just ice and Correct ions
Business Administrat ion Management and …
Legal Professions and Studies
Registered Nursing Nursing Administrat ion …
Computer and Information Sciences General
E lectr ical Engineering …
Construct ion Management
Construct ion Trades General
Computer Software and Media Appl icat ions
Computer Systems Networking and …
Account ing and Related Services
Draft ing/Design Engineering …
Visual and Performing Arts
Health and Medical Administrat ive Services
TOP 15 PROGRAMS OF STUDY, ITT TECHNICAL INSTITUTE, BY TOTAL CREDENTIALS AWARDED, 2013
Associate Degrees, N = 813
Bachelor's Degrees, N = 364
Master's Degrees, N = 45
62
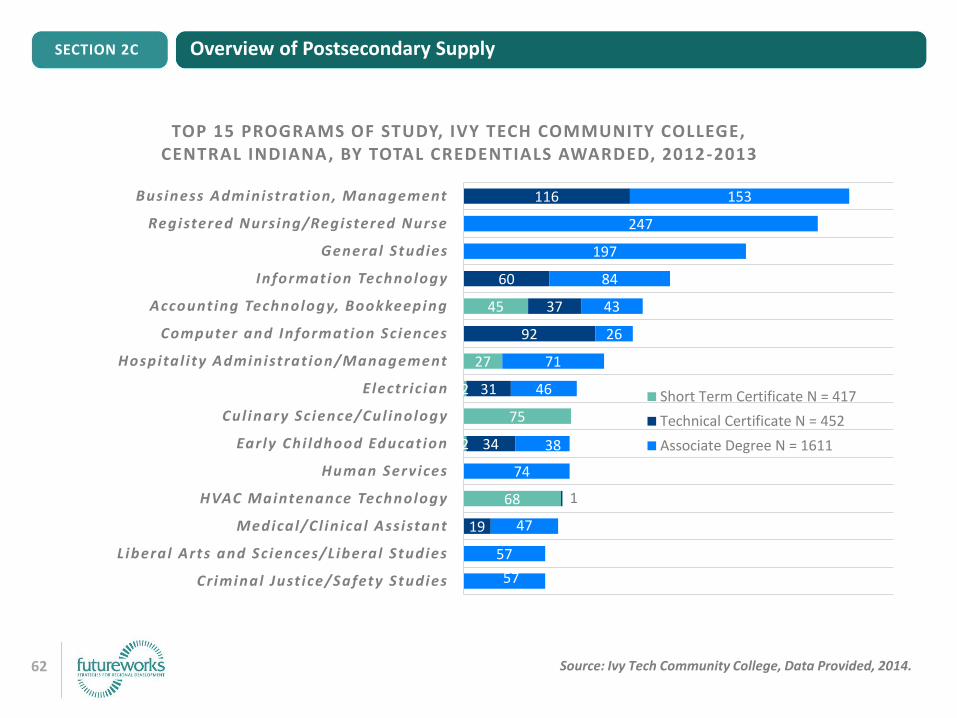
Overview of Postsecondary SupplySECTION 2C
Source: Ivy Tech Community College, Data Provided, 2014.
45
27
2
75
2
68
116
60
37
92
31
34
1
19
153
247
197
84
43
26
71
46
0
38
74
47
57
57
Business Administrat ion, Management
Registered Nursing/Registered Nurse
General Studies
Information Technology
Accounting Technology, Bookkeeping
Computer and Information Sciences
Hospital i ty Administrat ion/Management
Electr ic ian
Cul inary Science/Cul inology
Early Chi ldhood Educat ion
Human Services
HVAC Maintenance Technology
Medical/Cl in ical Assistant
Liberal Arts and Sciences/Liberal Studies
Criminal Just ice/Safety Studies
TOP 15 PROGRAMS OF STUDY, IVY TECH COMMUNITY COLLEGE, CENTRAL INDIANA, BY TOTAL CREDENTIALS AWARDED, 2012-2013
Short Term Certificate N = 417
Technical Certificate N = 452
Associate Degree N = 1611
63
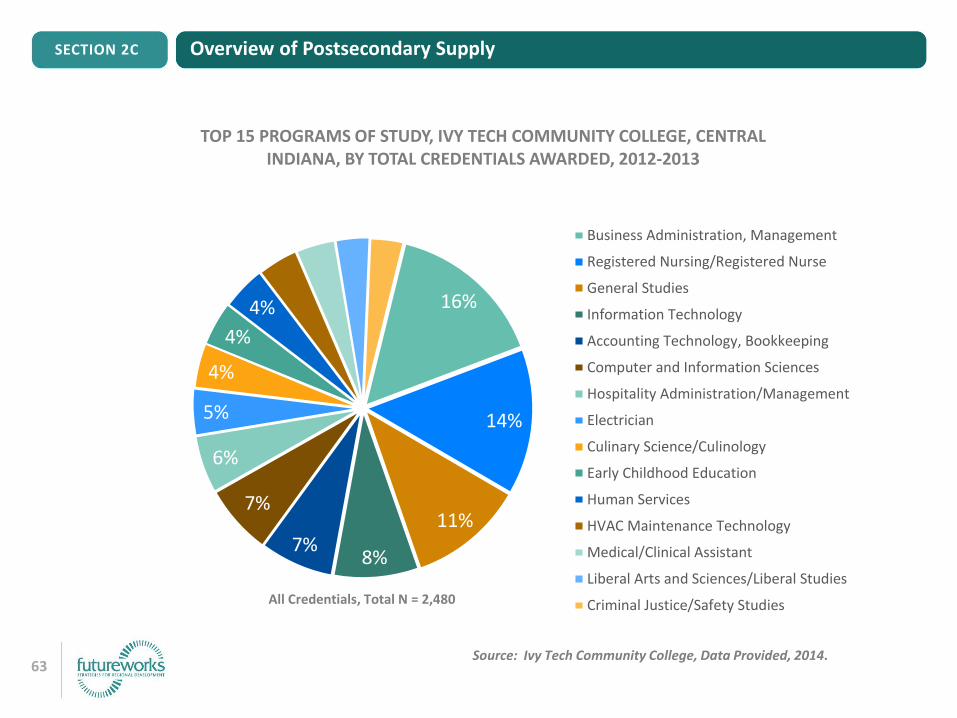
Overview of Postsecondary SupplySECTION 2C
Source: Ivy Tech Community College, Data Provided, 2014.
16%
14%
11%
8%7%
7%
6%
5%
4%
4%
4%
TOP 15 PROGRAMS OF STUDY, IVY TECH COMMUNITY COLLEGE, CENTRAL INDIANA, BY TOTAL CREDENTIALS AWARDED, 2012-2013
Business Administration, Management
Registered Nursing/Registered Nurse
General Studies
Information Technology
Accounting Technology, Bookkeeping
Computer and Information Sciences
Hospitality Administration/Management
Electrician
Culinary Science/Culinology
Early Childhood Education
Human Services
HVAC Maintenance Technology
Medical/Clinical Assistant
Liberal Arts and Sciences/Liberal Studies
Criminal Justice/Safety StudiesAll Credentials, Total N = 2,480
64
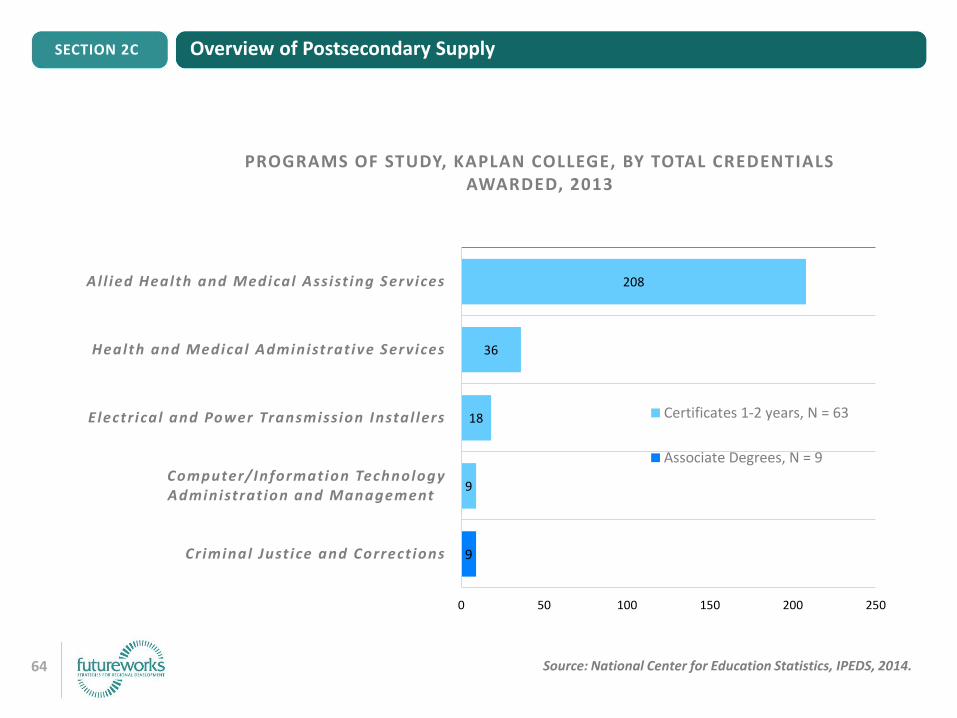
Overview of Postsecondary SupplySECTION 2C
Source: National Center for Education Statistics, IPEDS, 2014.
208
36
18
9
9
0 50 100 150 200 250
Al l ied Health and Medical Assist ing Services
Health and Medical Administrat ive Services
Electr ical and Power Transmission Instal lers
Computer/Information Technology Administrat ion and Management
Criminal Just ice and Correct ions
PROGRAMS OF STUDY, KAPLAN COLLEGE, BY TOTAL CREDENTIALS AWARDED, 2013
Certificates 1-2 years, N = 63
Associate Degrees, N = 9
65
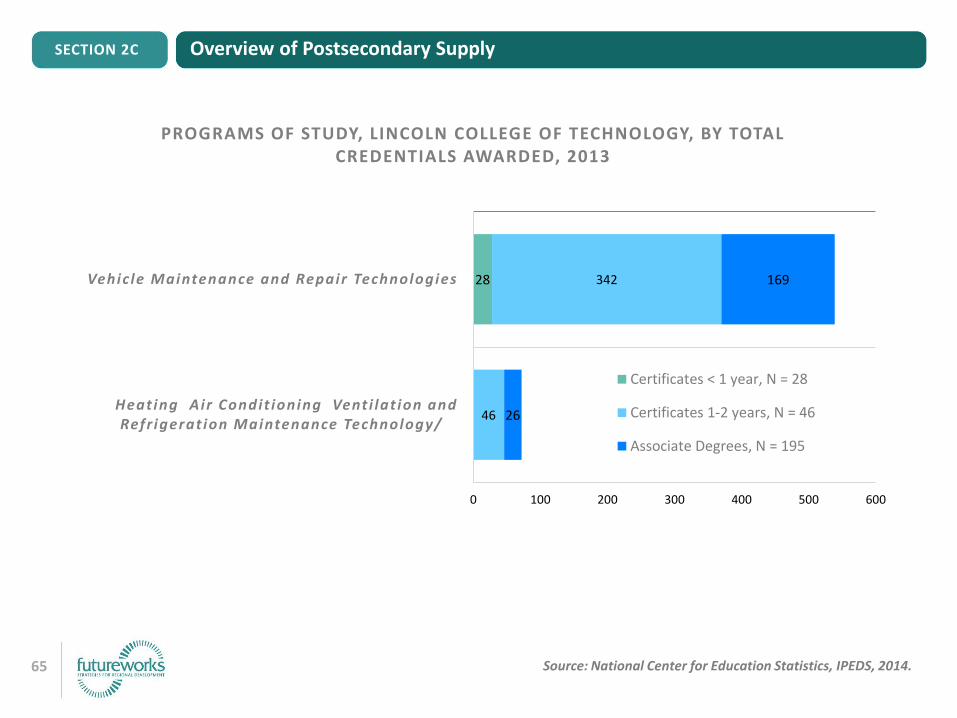
Overview of Postsecondary SupplySECTION 2C
Source: National Center for Education Statistics, IPEDS, 2014.
28 342
46
169
26
0 100 200 300 400 500 600
Vehicle Maintenance and Repair Technologies
Heat ing Air Condit ioning Vent i lat ion and Refr igerat ion Maintenance Technology/
PROGRAMS OF STUDY, LINCOLN COLLEGE OF TECHNOLOGY, BY TOTAL CREDENTIALS AWARDED, 2013
Certificates < 1 year, N = 28
Certificates 1-2 years, N = 46
Associate Degrees, N = 195
66
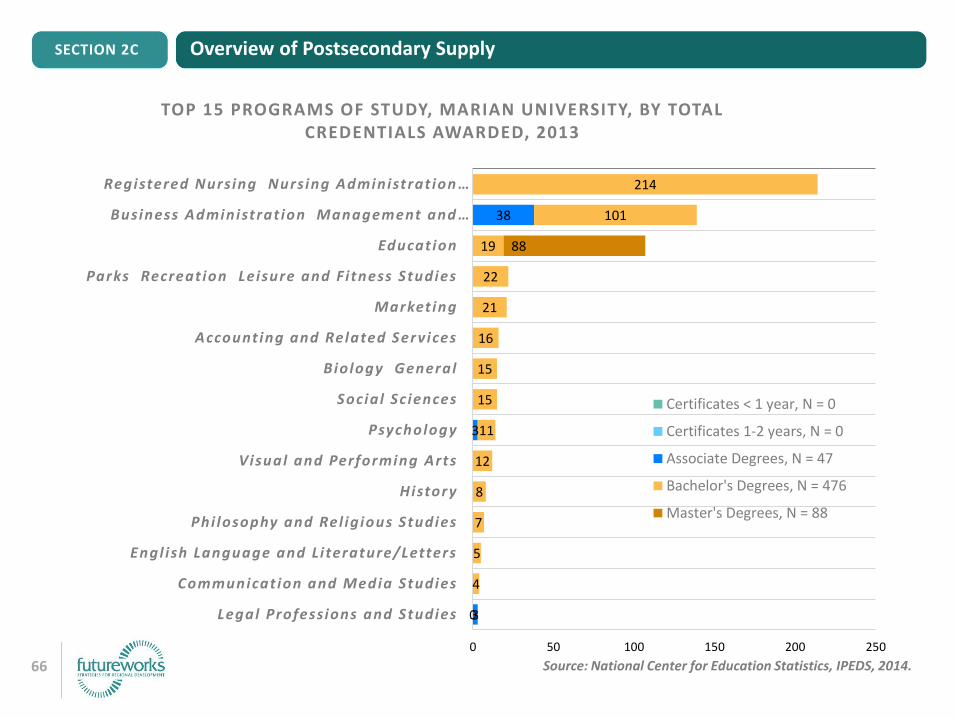
Overview of Postsecondary SupplySECTION 2C
Source: National Center for Education Statistics, IPEDS, 2014.
0
38
3
3
214
101
19
22
21
16
15
15
11
12
8
7
5
4
88
0 50 100 150 200 250
Registered Nursing Nursing Administrat ion …
Business Administrat ion Management and …
Educat ion
Parks Recreat ion Leisure and F i tness Studies
Market ing
Account ing and Related Services
Biology General
Social Sc iences
Psychology
Visual and Performing Arts
History
Phi losophy and Rel ig ious Studies
Engl ish Language and Li terature/Letters
Communicat ion and Media Studies
Legal Professions and Studies
TOP 15 PROGRAMS OF STUDY, MARIAN UNIVERSITY, BY TOTAL CREDENTIALS AWARDED, 2013
Certificates < 1 year, N = 0
Certificates 1-2 years, N = 0
Associate Degrees, N = 47
Bachelor's Degrees, N = 476
Master's Degrees, N = 88
67
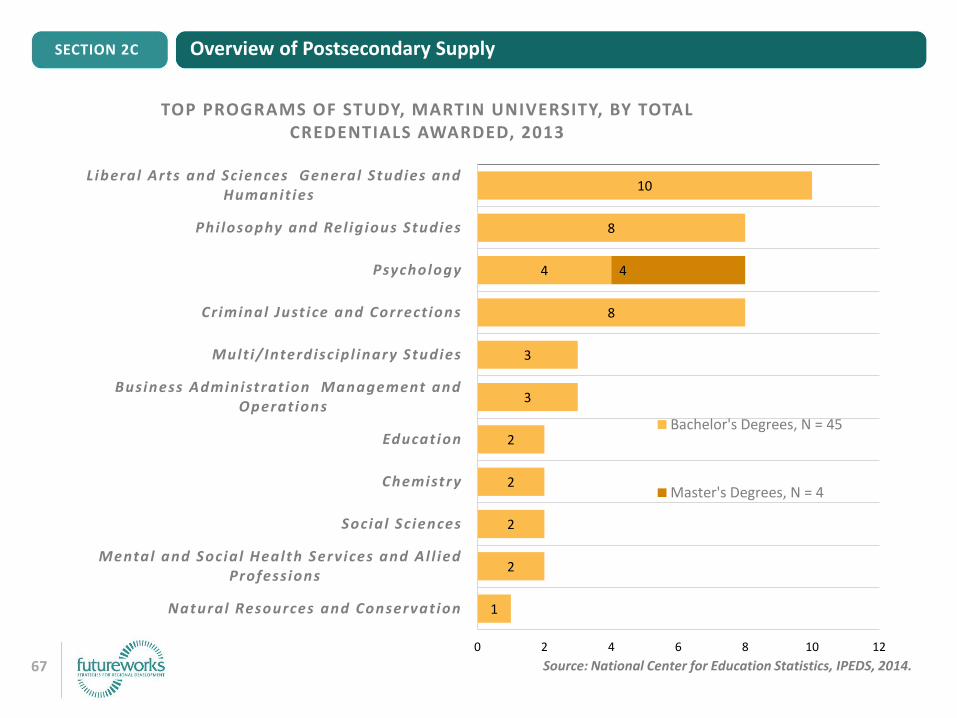
Overview of Postsecondary SupplySECTION 2C
Source: National Center for Education Statistics, IPEDS, 2014.
10
8
4
8
3
3
2
2
2
2
1
4
0 2 4 6 8 10 12
Liberal Arts and Sciences General Studies and Humanit ies
Phi losophy and Rel ig ious Studies
Psychology
Criminal Just ice and Correct ions
Mult i/Interdisc ip l inary Studies
Business Administrat ion Management and Operat ions
Educat ion
Chemistry
Social Sc iences
Mental and Social Health Services and Al l ied Professions
Natural Resources and Conservat ion
TOP PROGRAMS OF STUDY, MARTIN UNIVERSITY, BY TOTAL CREDENTIALS AWARDED, 2013
Bachelor's Degrees, N = 45
Master's Degrees, N = 4
68
Overview of Postsecondary SupplySECTION 2C
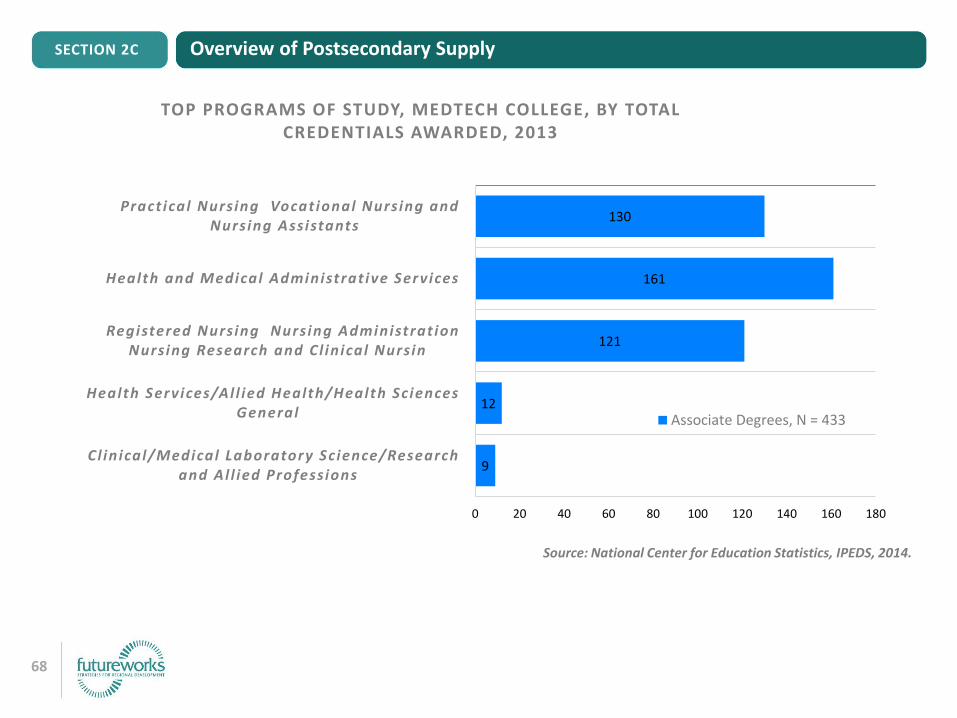
Source: National Center for Education Statistics, IPEDS, 2014.
130
161
121
12
9
0 20 40 60 80 100 120 140 160 180
Pract ical Nursing Vocat ional Nursing and Nursing Assistants
Health and Medical Administrat ive Services
Registered Nursing Nursing Administrat ion Nursing Research and Cl in ical Nursin
Health Services/Al l ied Health/Health Sciences General
Cl in ical/Medical Laboratory Science/Research and Al l ied Professions
TOP PROGRAMS OF STUDY, MEDTECH COLLEGE, BY TOTAL CREDENTIALS AWARDED, 2013
Associate Degrees, N = 433
69
Overview of Postsecondary SupplySECTION 2C
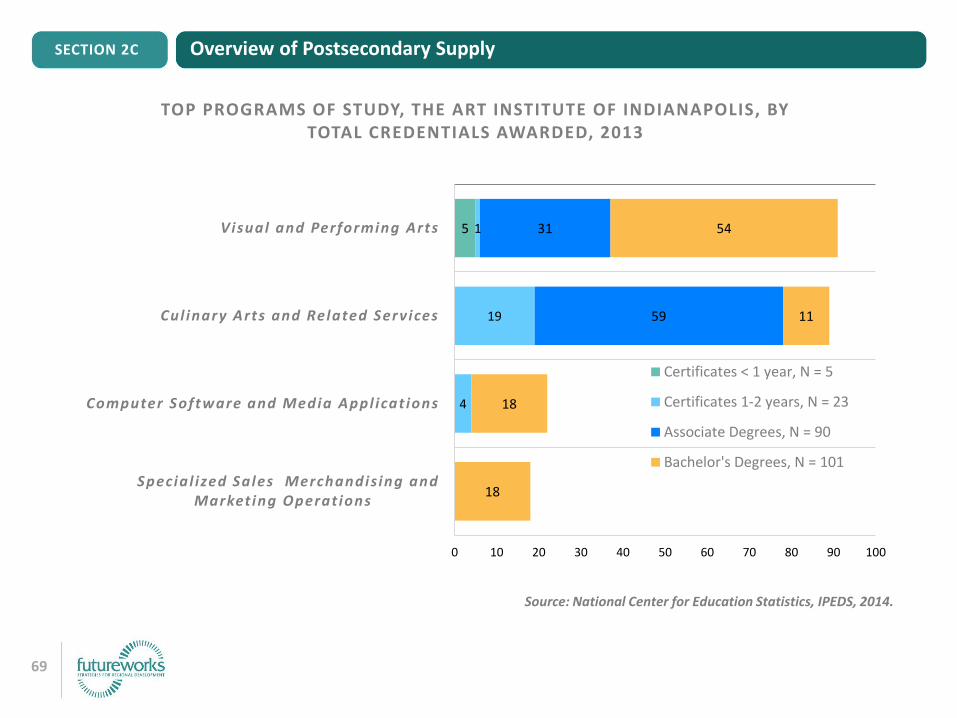
Source: National Center for Education Statistics, IPEDS, 2014.
5 1
19
4
31
59
54
11
18
18
0 10 20 30 40 50 60 70 80 90 100
Visual and Performing Arts
Cul inary Arts and Related Services
Computer Software and Media Appl icat ions
Special ized Sales Merchandising and Market ing Operat ions
TOP PROGRAMS OF STUDY, THE ART INSTITUTE OF INDIANAPOLIS, BY TOTAL CREDENTIALS AWARDED, 2013
Certificates < 1 year, N = 5
Certificates 1-2 years, N = 23
Associate Degrees, N = 90
Bachelor's Degrees, N = 101
70
Overview of Postsecondary SupplySECTION 2C
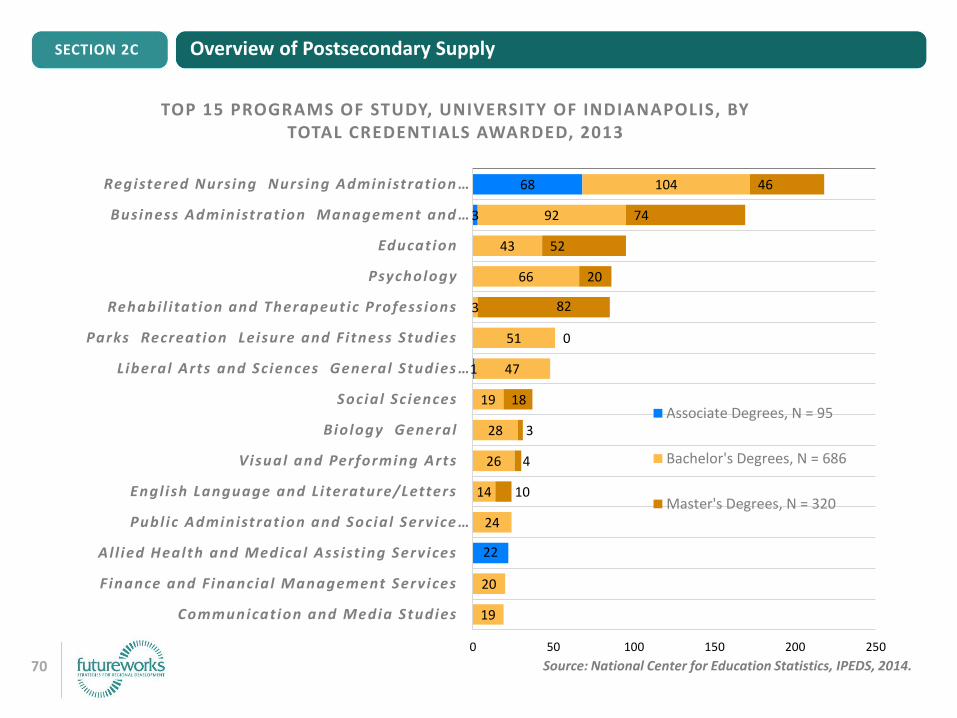
Source: National Center for Education Statistics, IPEDS, 2014.
68
3
1
22
104
92
43
66
3
51
47
19
28
26
14
24
20
19
46
74
52
20
82
0
18
3
4
10
0 50 100 150 200 250
Registered Nursing Nursing Administrat ion …
Business Administrat ion Management and …
Educat ion
Psychology
Rehabi l i tat ion and Therapeut ic Professions
Parks Recreat ion Leisure and F i tness Studies
Liberal Arts and Sciences General Studies …
Social Sc iences
Biology General
Visual and Performing Arts
Engl ish Language and Li terature/Letters
Publ ic Administrat ion and Social Service …
Al l ied Health and Medical Assist ing Services
Finance and F inancial Management Services
Communicat ion and Media Studies
TOP 15 PROGRAMS OF STUDY, UNIVERSITY OF INDIANAPOLIS, BY TOTAL CREDENTIALS AWARDED, 2013
Associate Degrees, N = 95
Bachelor's Degrees, N = 686
Master's Degrees, N = 320
71
Overview of Postsecondary SupplySECTION 2C
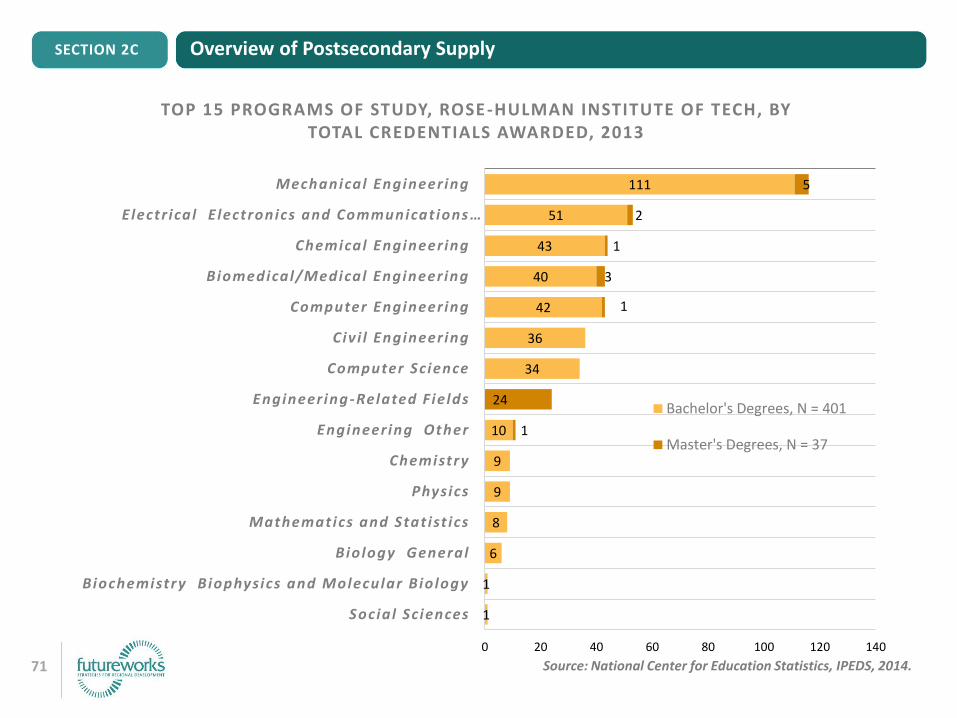
Source: National Center for Education Statistics, IPEDS, 2014.
111
51
43
40
42
36
34
10
9
9
8
6
1
1
5
2
1
3
1
24
1
0 20 40 60 80 100 120 140
Mechanical Engineering
Electr ical E lectronics and Communicat ions …
Chemical Engineering
Biomedical/Medical Engineering
Computer Engineering
Civi l Engineering
Computer Science
Engineering -Related F ields
Engineering Other
Chemistry
Physics
Mathematics and Stat ist ics
Biology General
Biochemistry Biophysics and Molecular Biology
Social Sc iences
TOP 15 PROGRAMS OF STUDY, ROSE-HULMAN INSTITUTE OF TECH, BY TOTAL CREDENTIALS AWARDED, 2013
Bachelor's Degrees, N = 401
Master's Degrees, N = 37
72
Overview of Postsecondary SupplySECTION 2C
Source: National Center for Education Statistics, IPEDS, 2014.
7
2
1
36
6
16
49
558
139
88
21
70
36
60
51
33
44
42
35
29
29
22
49
31
0 100 200 300 400 500 600
Liberal Arts General Studies Humanit ies
Registered Nursing and Nursing Admin
Criminal Just ice and Correct ions
Educat ion
Bui ld ing/Construct ion F in ishing Management …
Industr ia l Product ion Technologies/Technic ians
Vehicle Maintenance and Repair Technologies
Business Administrat ion
Precis ion Metal Working
Pract ical Nursing and Nursing Assistants
Natural Resources and Conservat ion
Business/Commerce General
Publ ic Administrat ion and Social Service …
Ground Transportat ion
Al l ied Health and Medical Assist ing Services
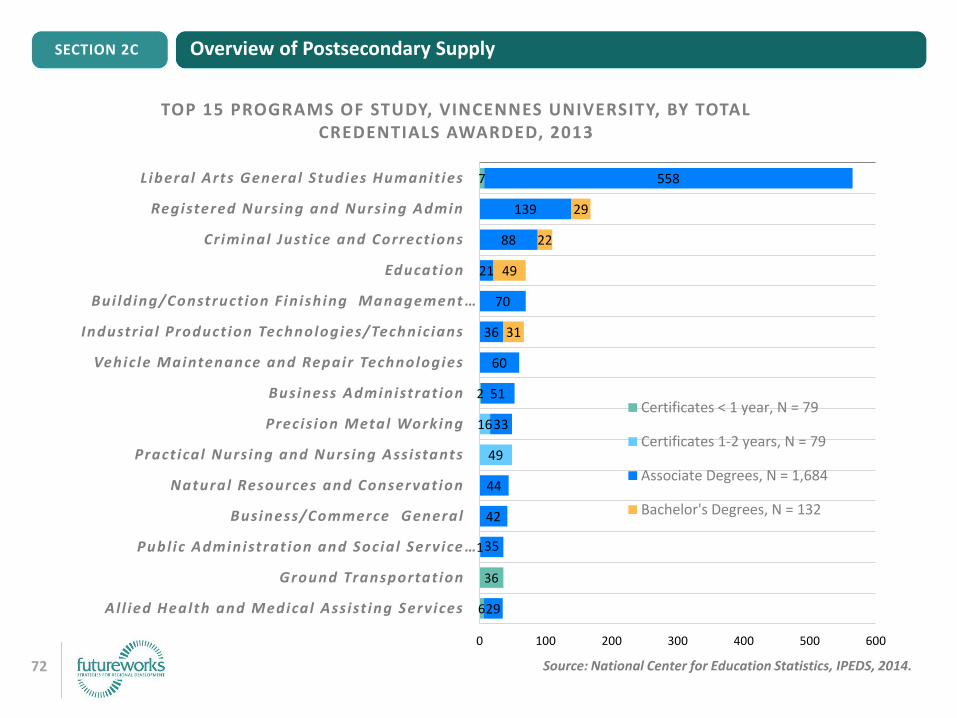
TOP 15 PROGRAMS OF STUDY, VINCENNES UNIVERSITY, BY TOTAL CREDENTIALS AWARDED, 2013
Certificates < 1 year, N = 79
Certificates 1-2 years, N = 79
Associate Degrees, N = 1,684
Bachelor's Degrees, N = 132
73
Overview of Postsecondary Supply
DEFINITIONS AND TECHNICAL NOTES, POSTSECONDARY INSTITUTIONS
All data on postsecondary credentials are from the U.S. Department of Education, Institute of Education Sciences, National Center for Education Statistics, Integrated Postsecondary Education Data System (IPEDS) for 2013. Collected for this research in September, 2014.
Regional and statewide data for Ivy Tech Community College are provided by Ivy Tech Community College, Office of Institutional Research for 2012-2013.
For more detailed discussion of the employment patterns of Indiana college graduates and their likelihood of remaining employed in the state after graduation, see reports by the Indiana Business Research Center, Indiana University, such as “How Education Pays: The Work Outcomes of Indiana’s Postsecondary Graduates,” November, 2011, and a report commissioned by the Central Indiana Corporate Partnership, “Competitive Economic Advantage: The Opportunity to Win the Global Competition for College Educated Talent,” July, 2013.
SECTION 2C

74
SECTION 3
Overview of Demand Supply Alignment
75
Overview of Demand and Supply Alignment
SECTION OVERVIEW:
Our analysis of demand-supply alignment organizes data on demand across key occupational areas and aligns them with data on concentrators from CTE districts and credential output from postsecondary institutions in the region. We present a “Summary Chart of Alignment” of our analysis of demand-supply alignment in this section.
The summary chart, on the next page, shows a high-level picture of demand supply alignment across a number of key occupational areas and is a useful starting point for discussion among members of the Works Council and with employers, educators, government, and civic leaders in the region. The chart will help these partners understand overall labor market demand and the alignment of the supply of talent to meet that demand.
The data included in the chart come from multiple sources:
» The first area is annual demand. Demand data are for 2013 based on FutureWorks calculations of EMSI’s projected job openings from the U.S. Bureau of Labor Statistics in 2013 and Burning Glass Labor Insight’s 2013 real-time job postings. All demand data are specific to the Works Council region.
» The second area is credentials awarded from both regional secondary CTE districts and area postsecondary institutions. The secondary data are Graduating Seniors with a CTE concentration reported to Indiana DOE/DWD for each school district and CTE center in the region. Postsecondary credentials data are credentials awarded from two-year and four-year postsecondary institutions within or nearby the region. All data on postsecondary credentials are from the U.S. Department of Education, Institute of Education Sciences, National Center for Education Statistics, Integrated Postsecondary Education Data System (IPEDS) for 2012.
SECTION 3

76
Overview of Demand and Supply Alignment
SECTION OVERVIEW, CONT.:
The regional demand supply model does not capture every pathway to employment, i.e., apprenticeships, temp agencies, etc. The academic institutional education pathway is our focus.
We recognize that the pathways into employment for many occupations in this analysis, like construction, are non-academic pathways. Determining the supply of non-academic pathways is beyond the scope of this research. Even so, in many cases, these non-academic pathways are changing. Increasingly they involve obtaining a postsecondary credential. For example, many apprenticeships are being linked to academic programs and awards of associate degrees through community colleges. Thus some production of traditionally non-academic occupational training now is being captured by data on degree awards.
To find an example of research in this area see: “Demand Study for Construction Employees” prepared by Mohr Partners Cleveland, W.E. Upjohn Institute for Employment Research, and Weber Murphy Fox for The Construction Diversity Committee, Commission on Economic Inclusion, Greater Cleveland Partnership.
SECTION 3
77
Overview of Demand and Supply Alignment
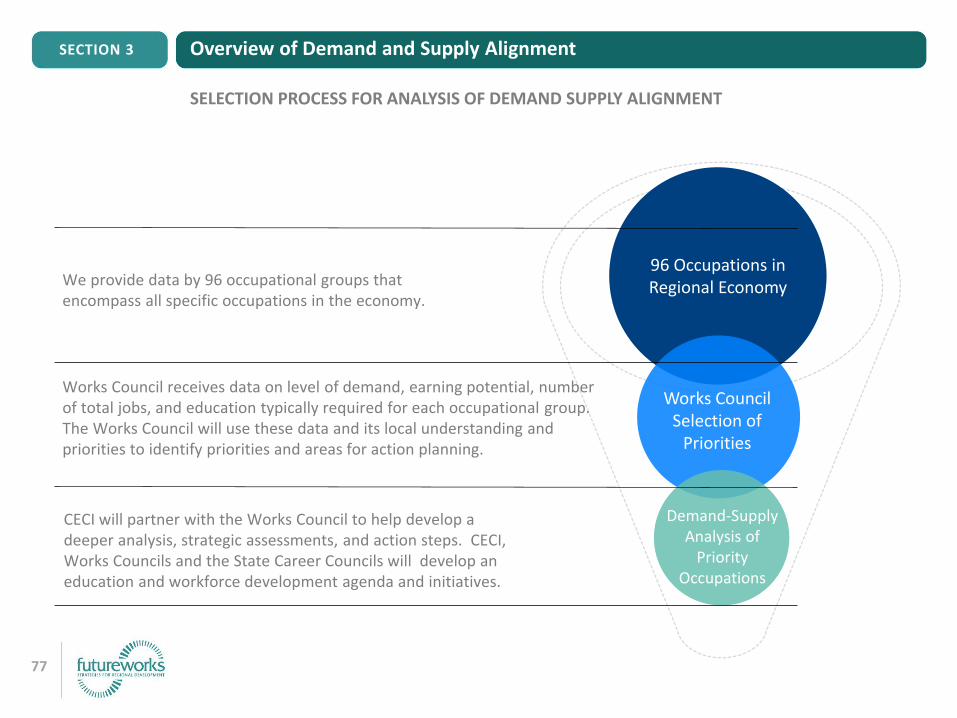
SELECTION PROCESS FOR ANALYSIS OF DEMAND SUPPLY ALIGNMENT
96 Occupations in Regional Economy
Works Council Selection of
Priorities
Demand-Supply Analysis of
Priority Occupations
We provide data by 96 occupational groups that encompass all specific occupations in the economy.
Works Council receives data on level of demand, earning potential, number of total jobs, and education typically required for each occupational group. The Works Council will use these data and its local understanding and priorities to identify priorities and areas for action planning.
CECI will partner with the Works Council to help develop a deeper analysis, strategic assessments, and action steps. CECI, Works Councils and the State Career Councils will develop an education and workforce development agenda and initiatives.
SECTION 3
78
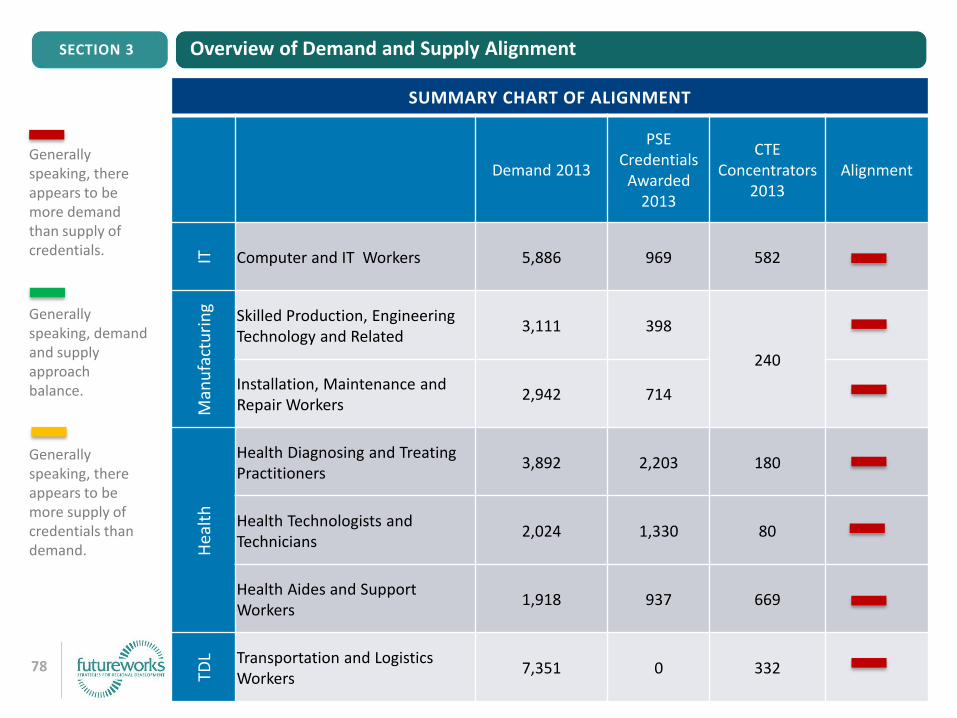
SUMMARY CHART OF ALIGNMENT
Demand 2013
PSE Credentials
Awarded 2013
CTE Concentrators
2013Alignment
IT Computer and IT Workers 5,886 969 582
Man
ufa
ctu
rin
g Skilled Production, Engineering Technology and Related
3,111 398
240
Installation, Maintenance and Repair Workers
2,942 714
Hea
lth
Health Diagnosing and Treating Practitioners
3,892 2,203 180
Health Technologists and Technicians
2,024 1,330 80
Health Aides and Support Workers
1,918 937 669
TDL Transportation and Logistics
Workers7,351 0 332
Generally speaking, there appears to be more demand than supply of credentials.
Generally speaking, demand and supply approach balance.
Generally speaking, there appears to be more supply of credentials than demand.
Overview of Demand and Supply Alignment SECTION 3
79
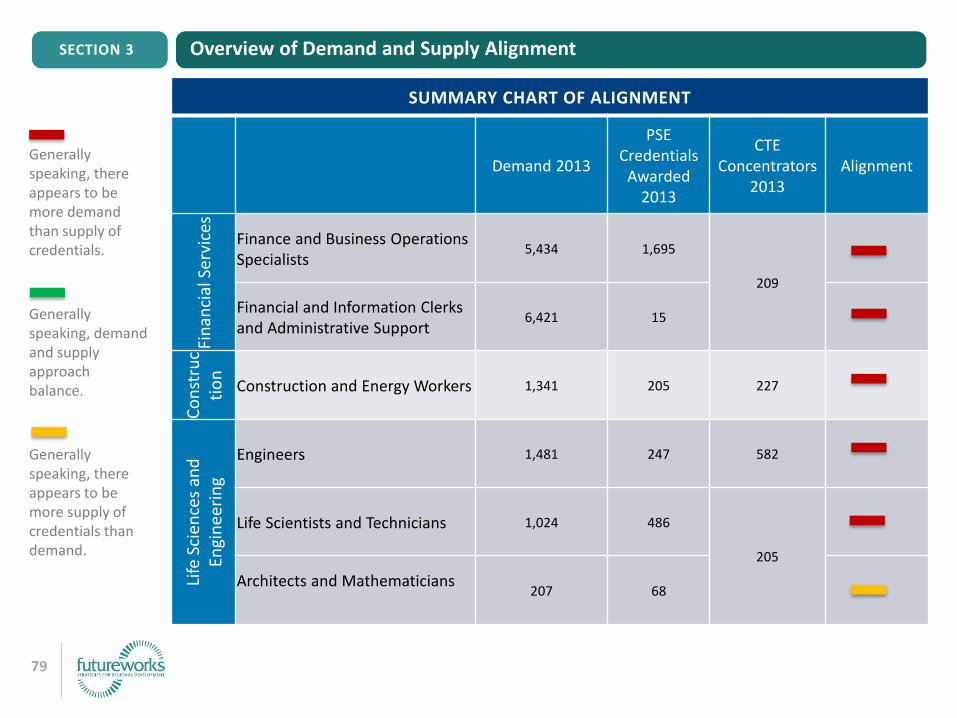
SUMMARY CHART OF ALIGNMENT
Demand 2013
PSE Credentials
Awarded 2013
CTE Concentrators
2013Alignment
Fin
anci
alSe
rvic
es
Finance and Business Operations Specialists
5,434 1,695
209
Financial and Information Clerks and Administrative Support
6,421 15
Co
nst
ruc
tio
n
Construction and Energy Workers 1,341 205 227
Life
Sci
ence
s an
d
Engi
nee
rin
g
Engineers 1,481 247 582
Life Scientists and Technicians 1,024 486
205
Architects and Mathematicians207 68
Generally speaking, there appears to be more demand than supply of credentials.
Generally speaking, demand and supply approach balance.
Generally speaking, there appears to be more supply of credentials than demand.
Overview of Demand and Supply Alignment SECTION 3