Embed Size (px)
Citation preview

CEMENT ROADMAP
Key findingsFour distinct ”reduction levers” are available to the cement sector to reduce CO2 emissions: 1. Thermal and electric efficiency: deployment of existing state-of-the-art
technologies in new cement plants, and retrofit of energy efficiency equipment where economically viable.
2. Alternative fuels: use of less carbon-intensive fossil fuels and more alternative (fossil) fuels and biomass fuels in the cement production process.
3. Clinker substitution: substituting carbon-intensive clinker, an intermediate in cement manufacture, with other, lower-carbon materials with cementitious properties.
4. Carbon capture and storage (CCS): capturing and storing CO2 emissions from cement production.
Cement is a key material for building society’s infrastructure. Demand reduction and/or substitution are not realistic options given growth in developing countries, increasing urbanisation and climate change adaptation needs.
Existing options to reduce emissions in the sector, while helpful, are not sufficient to counteract growth in demand. New products and technologies are needed, including CCS and new cement types.
These new technologies will require a step change in RD&D efforts; the roadmap provides a vision for what is needed between today and 2050.
CCS is a particularly important technology for the cement sector, required to deliver up to half of the emissions reductions needed by 2050. This will require advancement of demonstration projects in the cement sector over the next decade, to learn in parallel with other sectors how to best apply CCS technology at the necessary scale.
The high cost of reducing CO2 emissions in the sector will require markets withlong-term stability and resultant confidence in the pricing of CO2 by those markets.
International collaboration and public-private partnerships must be encouraged to help speed up research, design, development and deployment of necessary new technologies.
© 2
009,
OEC
D/I
EA a
nd
Th
e W
orl
d B
usi
nes
s C
ou
nci
l fo
r Su
stai
nab
le D
evel
op
men
t
Cement roadmap milestones
205020302010 20402020
International Energy Agency www.iea.org/roadmaps
Cement sector CO2 emissions reductionsbelow the baseline, low demand scenario, 2010-2050
1.5
2.0
2.5
Dir
ect
emis
sio
ns
(Gt
Co
2)
Baselineemissions:2.34 Gt
BLUE emissions:1.55 Gt
1.88 Gt
2.332.22
2.20
1.86
Energy efficiency: 10%
Alternative fuel use and other fuel switching: 24%
Clinker substitution: 10%
Carbon capture and storage (CCS): 56%
0
100
%
All of these technologies need to be applied together if the BLUE scenario targets are to be achieved – no one option alone can yield the necessary emissions reductions
CO2 emissions reductions
205020302010 20402020
Cement-to-clinkerratio: 73%
Diffusion of BAT:global energy intensity3.1-3.2 Gt/t clinker
Cement-to-clinker ratio: 71%
Alternative fuel use and fuel switching
Ongoing identificationand classification of suitablealternative fuels
Energy efficiency
Clinker substitution
Carbon capture and storage
R&D - oxyfuelling,gas cleaning:1st CCS pilot plant
R&D into newgrinding equipmentand additives
Assess substitution material properties and evaluate regional availability
R&D - oxyfuelling,gas cleaning: develop oxyfuelling and chemical looping
Demonstration of2 chemical absorption demonstration plants
Mitigation costs USD/tCO2 cement (post combustion/oxyfuelling): 125/na
R&D - oxyfuelling, gas cleaning: C.A. energy use to fall to 2.2 GJ/t
Deployment: all large new kilns with CCS
Mitigation costsUSD/tCO2 cement (post combustion/oxyfuelling): 100/60
Commercial use of membrane technology
Demonstration3 oxyfuel demos, 3 chemicallooping demos
Develop international standards on blended cement use
Diffusion of BAT:phase-out of wet kilns in non-OECD
Diffusion of BAT: international standardfor new kilns
Diffusion of BAT:phase-out of wet kilns in OECD
R&D on fluidisedbed technology
BAT: best available technology; C.A.: chemical absorption
Deployment: 50-70 cement kilnswith CCS
Mitigation costs USD/tCO2 cement (post combustion/oxyfuelling): 100/50
Gt captured: 0.11-0.16 Gt;% CO2 captured: 10-12%
Deployment: 100-200 cement kilns with CCS
Deployment:220-430 cementkilns with CCS
Mitigation costsUSD/tCO2 cement(post combustion/oxyfuelling): 75/40
Gt captured:0.5-1.0 Gt; % CO2
captured: 40-45%
Diffusion of BAT:global energy intensity 3.2-3.4 Gt/t clinker
Implementinternational standards on blended cement use
Research and development (R&D) Demonstration Deployment Commercialisation
Key regional milestones
www.iea.org/roadmaps © 2
009,
OEC
D/I
EA a
nd
Th
e W
orl
d B
usi
nes
s C
ou
nci
l fo
r Su
stai
nab
le D
evel
op
men
t
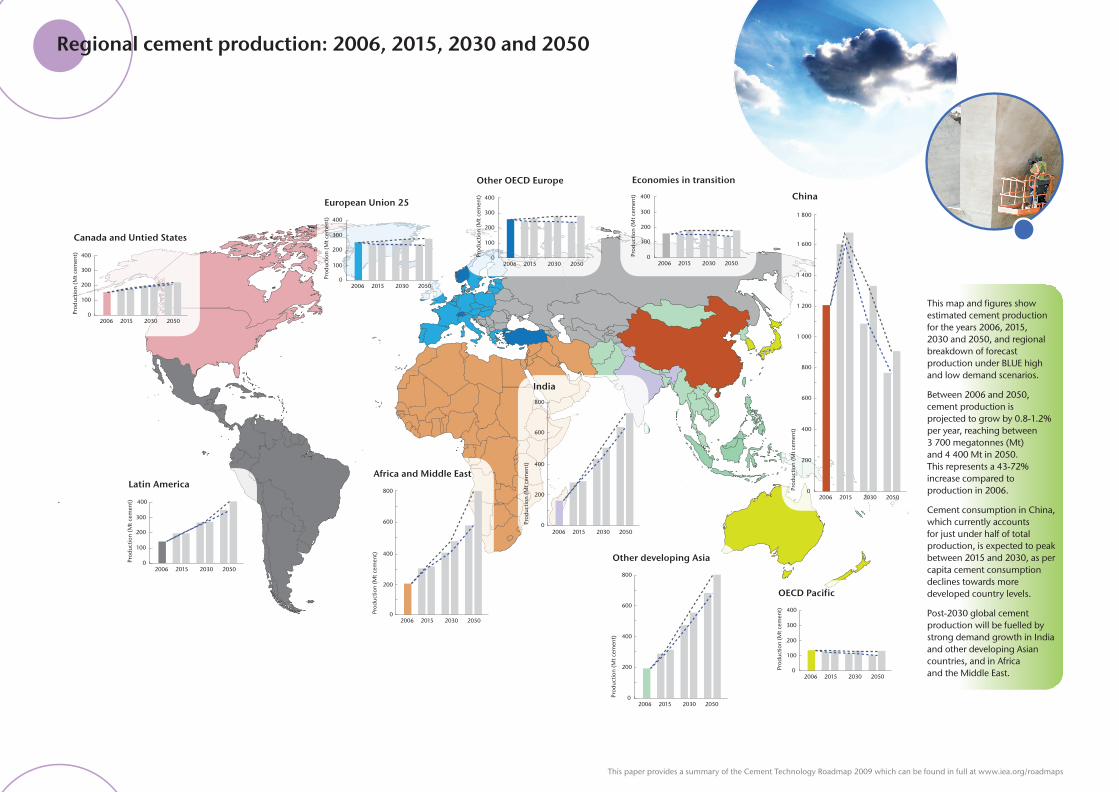
Regional cement production: 2006, 2015, 2030 and 2050
0
100
200
300
400
2006 2015 2030
Prod
uctio
n (M
t cem
ent)
2050
European Union 25
0
100
200
300
400
2006 2015 2030
Prod
uctio
n (M
t cem
ent)
2050
Canada and Untied States
0
100
200
300
400
2006 2015 2030
Prod
uctio
n (M
t cem
ent)
2050
OECD Pacific
0
100
200
300
400
2006 2015 2030
Prod
uctio
n (M
t cem
ent)
2050
Economies in transition
0
100
200
300
400
2006 2015 2030
Prod
uctio
n (M
t cem
ent)
2050
Other OECD Europe
0
100
200
300
400
2006 2015 2030
Prod
uctio
n (M
t cem
ent)
2050
Latin America
This map and figures show estimated cement production for the years 2006, 2015, 2030 and 2050, and regional breakdown of forecast production under BLUE high and low demand scenarios.
Between 2006 and 2050, cement production isprojected to grow by 0.8-1.2% per year, reaching between 3 700 megatonnes (Mt)and 4 400 Mt in 2050.This represents a 43-72% increase compared to production in 2006.
Cement consumption in China, which currently accounts for just under half of total production, is expected to peak between 2015 and 2030, as per capita cement consumption declines towards more developed country levels.
Post-2030 global cement production will be fuelled by strong demand growth in India and other developing Asian countries, and in Africaand the Middle East.
0
200
1 800
1 600
1 400
1 200
1 000
800
600
400
2006 2015 2030
Prod
uctio
n (M
t cem
ent)
2050
China
0
200
400
600
800
2006 2015 2030
Prod
uctio
n (M
t cem
ent)
2050
Africa and Middle East
0
200
400
800
600
2006 2015 2030
Prod
uctio
n (M
t cem
ent)
2050
Other developing Asia
0
200
400
600
800
Prod
uctio
n (M
t cem
ent)
India
2006 2015 2030 2050
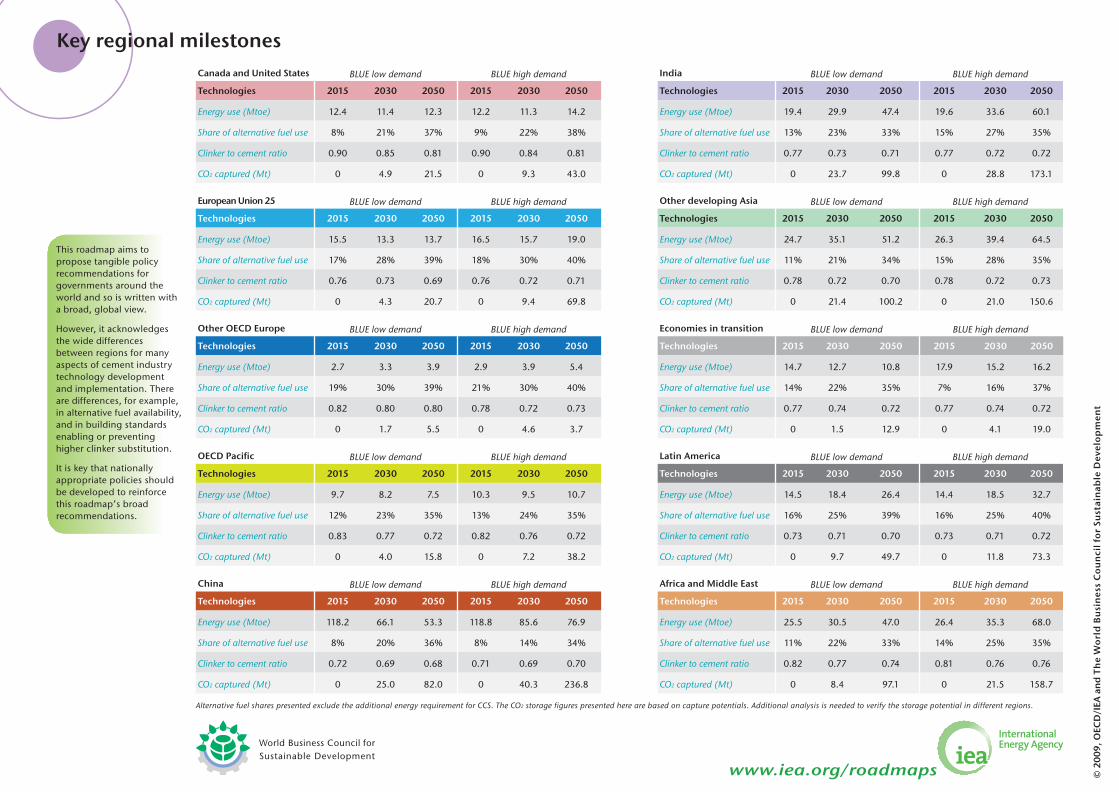
This roadmap aims to propose tangible policy recommendations for governments around the world and so is written witha broad, global view.
However, it acknowledges the wide differences between regions for many aspects of cement industry technology development and implementation. There are differences, for example, in alternative fuel availability, and in building standards enabling or preventing higher clinker substitution.
It is key that nationally appropriate policies should be developed to reinforce this roadmap’s broad recommendations.
Canada and United States BLUE low demand BLUE high demand
Technologies 2015 2030 2050 2015 2030 2050
Energy use (Mtoe) 12.4 11.4 12.3 12.2 11.3 14.2
Share of alternative fuel use 8% 21% 37% 9% 22% 38%
Clinker to cement ratio 0.90 0.85 0.81 0.90 0.84 0.81
CO2 captured (Mt) 0 4.9 21.5 0 9.3 43.0
European Union 25 BLUE low demand BLUE high demand
Technologies 2015 2030 2050 2015 2030 2050
Energy use (Mtoe) 15.5 13.3 13.7 16.5 15.7 19.0
Share of alternative fuel use 17% 28% 39% 18% 30% 40%
Clinker to cement ratio 0.76 0.73 0.69 0.76 0.72 0.71
CO2 captured (Mt) 0 4.3 20.7 0 9.4 69.8
OECD Pacifi c BLUE low demand BLUE high demand
Technologies 2015 2030 2050 2015 2030 2050
Energy use (Mtoe) 9.7 8.2 7.5 10.3 9.5 10.7
Share of alternative fuel use 12% 23% 35% 13% 24% 35%
Clinker to cement ratio 0.83 0.77 0.72 0.82 0.76 0.72
CO2 captured (Mt) 0 4.0 15.8 0 7.2 38.2
China BLUE low demand BLUE high demand
Technologies 2015 2030 2050 2015 2030 2050
Energy use (Mtoe) 118.2 66.1 53.3 118.8 85.6 76.9
Share of alternative fuel use 8% 20% 36% 8% 14% 34%
Clinker to cement ratio 0.72 0.69 0.68 0.71 0.69 0.70
CO2 captured (Mt) 0 25.0 82.0 0 40.3 236.8
Other OECD Europe BLUE low demand BLUE high demand
Technologies 2015 2030 2050 2015 2030 2050
Energy use (Mtoe) 2.7 3.3 3.9 2.9 3.9 5.4
Share of alternative fuel use 19% 30% 39% 21% 30% 40%
Clinker to cement ratio 0.82 0.80 0.80 0.78 0.72 0.73
CO2 captured (Mt) 0 1.7 5.5 0 4.6 3.7
India BLUE low demand BLUE high demand
Technologies 2015 2030 2050 2015 2030 2050
Energy use (Mtoe) 19.4 29.9 47.4 19.6 33.6 60.1
Share of alternative fuel use 13% 23% 33% 15% 27% 35%
Clinker to cement ratio 0.77 0.73 0.71 0.77 0.72 0.72
CO2 captured (Mt) 0 23.7 99.8 0 28.8 173.1
Latin America BLUE low demand BLUE high demand
Technologies 2015 2030 2050 2015 2030 2050
Energy use (Mtoe) 14.5 18.4 26.4 14.4 18.5 32.7
Share of alternative fuel use 16% 25% 39% 16% 25% 40%
Clinker to cement ratio 0.73 0.71 0.70 0.73 0.71 0.72
CO2 captured (Mt) 0 9.7 49.7 0 11.8 73.3
Other developing Asia BLUE low demand BLUE high demand
Technologies 2015 2030 2050 2015 2030 2050
Energy use (Mtoe) 24.7 35.1 51.2 26.3 39.4 64.5
Share of alternative fuel use 11% 21% 34% 15% 28% 35%
Clinker to cement ratio 0.78 0.72 0.70 0.78 0.72 0.73
CO2 captured (Mt) 0 21.4 100.2 0 21.0 150.6
Economies in transition BLUE low demand BLUE high demand
Technologies 2015 2030 2050 2015 2030 2050
Energy use (Mtoe) 14.7 12.7 10.8 17.9 15.2 16.2
Share of alternative fuel use 14% 22% 35% 7% 16% 37%
Clinker to cement ratio 0.77 0.74 0.72 0.77 0.74 0.72
CO2 captured (Mt) 0 1.5 12.9 0 4.1 19.0
Africa and Middle East BLUE low demand BLUE high demand
Technologies 2015 2030 2050 2015 2030 2050
Energy use (Mtoe) 25.5 30.5 47.0 26.4 35.3 68.0
Share of alternative fuel use 11% 22% 33% 14% 25% 35%
Clinker to cement ratio 0.82 0.77 0.74 0.81 0.76 0.76
CO2 captured (Mt) 0 8.4 97.1 0 21.5 158.7
Alternative fuel shares presented exclude the additional energy requirement for CCS. The CO2 storage figures presented here are based on capture potentials. Additional analysis is needed to verify the storage potential in different regions.
This paper provides a summary of the Cement Technology Roadmap 2009 which can be found in full at www.iea.org/roadmaps
Key regional milestones
www.iea.org/roadmaps © 2
009,
OEC
D/I
EA a
nd
Th
e W
orl
d B
usi
nes
s C
ou
nci
l fo
r Su
stai
nab
le D
evel
op
men
t
Regional cement production: 2006, 2015, 2030 and 2050
0
100
200
300
400
2006 2015 2030
Prod
uctio
n (M
t cem
ent)
2050
European Union 25
0
100
200
300
400
2006 2015 2030
Prod
uctio
n (M
t cem
ent)
2050
Canada and Untied States
0
100
200
300
400
2006 2015 2030
Prod
uctio
n (M
t cem
ent)
2050
OECD Pacific
0
100
200
300
400
2006 2015 2030
Prod
uctio
n (M
t cem
ent)
2050
Economies in transition
0
100
200
300
400
2006 2015 2030
Prod
uctio
n (M
t cem
ent)
2050
Other OECD Europe
0
100
200
300
400
2006 2015 2030
Prod
uctio
n (M
t cem
ent)
2050
Latin America
This map and figures show estimated cement production for the years 2006, 2015, 2030 and 2050, and regional breakdown of forecast production under BLUE high and low demand scenarios.
Between 2006 and 2050, cement production isprojected to grow by 0.8-1.2% per year, reaching between 3 700 megatonnes (Mt)and 4 400 Mt in 2050.This represents a 43-72% increase compared to production in 2006.
Cement consumption in China, which currently accounts for just under half of total production, is expected to peak between 2015 and 2030, as per capita cement consumption declines towards more developed country levels.
Post-2030 global cement production will be fuelled by strong demand growth in India and other developing Asian countries, and in Africaand the Middle East.
0
200
1 800
1 600
1 400
1 200
1 000
800
600
400
2006 2015 2030
Prod
uctio
n (M
t cem
ent)
2050
China
0
200
400
600
800
2006 2015 2030
Prod
uctio
n (M
t cem
ent)
2050
Africa and Middle East
0
200
400
800
600
2006 2015 2030
Prod
uctio
n (M
t cem
ent)
2050
Other developing Asia
0
200
400
600
800
Prod
uctio
n (M
t cem
ent)
India
2006 2015 2030 2050
This roadmap aims to propose tangible policy recommendations for governments around the world and so is written witha broad, global view.
However, it acknowledges the wide differences between regions for many aspects of cement industry technology development and implementation. There are differences, for example, in alternative fuel availability, and in building standards enabling or preventing higher clinker substitution.
It is key that nationally appropriate policies should be developed to reinforce this roadmap’s broad recommendations.
Canada and United States BLUE low demand BLUE high demand
Technologies 2015 2030 2050 2015 2030 2050
Energy use (Mtoe) 12.4 11.4 12.3 12.2 11.3 14.2
Share of alternative fuel use 8% 21% 37% 9% 22% 38%
Clinker to cement ratio 0.90 0.85 0.81 0.90 0.84 0.81
CO2 captured (Mt) 0 4.9 21.5 0 9.3 43.0
European Union 25 BLUE low demand BLUE high demand
Technologies 2015 2030 2050 2015 2030 2050
Energy use (Mtoe) 15.5 13.3 13.7 16.5 15.7 19.0
Share of alternative fuel use 17% 28% 39% 18% 30% 40%
Clinker to cement ratio 0.76 0.73 0.69 0.76 0.72 0.71
CO2 captured (Mt) 0 4.3 20.7 0 9.4 69.8
OECD Pacifi c BLUE low demand BLUE high demand
Technologies 2015 2030 2050 2015 2030 2050
Energy use (Mtoe) 9.7 8.2 7.5 10.3 9.5 10.7
Share of alternative fuel use 12% 23% 35% 13% 24% 35%
Clinker to cement ratio 0.83 0.77 0.72 0.82 0.76 0.72
CO2 captured (Mt) 0 4.0 15.8 0 7.2 38.2
China BLUE low demand BLUE high demand
Technologies 2015 2030 2050 2015 2030 2050
Energy use (Mtoe) 118.2 66.1 53.3 118.8 85.6 76.9
Share of alternative fuel use 8% 20% 36% 8% 14% 34%
Clinker to cement ratio 0.72 0.69 0.68 0.71 0.69 0.70
CO2 captured (Mt) 0 25.0 82.0 0 40.3 236.8
Other OECD Europe BLUE low demand BLUE high demand
Technologies 2015 2030 2050 2015 2030 2050
Energy use (Mtoe) 2.7 3.3 3.9 2.9 3.9 5.4
Share of alternative fuel use 19% 30% 39% 21% 30% 40%
Clinker to cement ratio 0.82 0.80 0.80 0.78 0.72 0.73
CO2 captured (Mt) 0 1.7 5.5 0 4.6 3.7
India BLUE low demand BLUE high demand
Technologies 2015 2030 2050 2015 2030 2050
Energy use (Mtoe) 19.4 29.9 47.4 19.6 33.6 60.1
Share of alternative fuel use 13% 23% 33% 15% 27% 35%
Clinker to cement ratio 0.77 0.73 0.71 0.77 0.72 0.72
CO2 captured (Mt) 0 23.7 99.8 0 28.8 173.1
Latin America BLUE low demand BLUE high demand
Technologies 2015 2030 2050 2015 2030 2050
Energy use (Mtoe) 14.5 18.4 26.4 14.4 18.5 32.7
Share of alternative fuel use 16% 25% 39% 16% 25% 40%
Clinker to cement ratio 0.73 0.71 0.70 0.73 0.71 0.72
CO2 captured (Mt) 0 9.7 49.7 0 11.8 73.3
Other developing Asia BLUE low demand BLUE high demand
Technologies 2015 2030 2050 2015 2030 2050
Energy use (Mtoe) 24.7 35.1 51.2 26.3 39.4 64.5
Share of alternative fuel use 11% 21% 34% 15% 28% 35%
Clinker to cement ratio 0.78 0.72 0.70 0.78 0.72 0.73
CO2 captured (Mt) 0 21.4 100.2 0 21.0 150.6
Economies in transition BLUE low demand BLUE high demand
Technologies 2015 2030 2050 2015 2030 2050
Energy use (Mtoe) 14.7 12.7 10.8 17.9 15.2 16.2
Share of alternative fuel use 14% 22% 35% 7% 16% 37%
Clinker to cement ratio 0.77 0.74 0.72 0.77 0.74 0.72
CO2 captured (Mt) 0 1.5 12.9 0 4.1 19.0
Africa and Middle East BLUE low demand BLUE high demand
Technologies 2015 2030 2050 2015 2030 2050
Energy use (Mtoe) 25.5 30.5 47.0 26.4 35.3 68.0
Share of alternative fuel use 11% 22% 33% 14% 25% 35%
Clinker to cement ratio 0.82 0.77 0.74 0.81 0.76 0.76
CO2 captured (Mt) 0 8.4 97.1 0 21.5 158.7
Alternative fuel shares presented exclude the additional energy requirement for CCS. The CO2 storage figures presented here are based on capture potentials. Additional analysis is needed to verify the storage potential in different regions.
This paper provides a summary of the Cement Technology Roadmap 2009 which can be found in full at www.iea.org/roadmaps

CEMENT ROADMAP
Key findingsFour distinct ”reduction levers” are available to the cement sector to reduce CO2 emissions: 1. Thermal and electric efficiency: deployment of existing state-of-the-art
technologies in new cement plants, and retrofit of energy efficiency equipment where economically viable.
2. Alternative fuels: use of less carbon-intensive fossil fuels and more alternative (fossil) fuels and biomass fuels in the cement production process.
3. Clinker substitution: substituting carbon-intensive clinker, an intermediate in cement manufacture, with other, lower-carbon materials with cementitious properties.
4. Carbon capture and storage (CCS): capturing and storing CO2 emissions from cement production.
Cement is a key material for building society’s infrastructure. Demand reduction and/or substitution are not realistic options given growth in developing countries, increasing urbanisation and climate change adaptation needs.
Existing options to reduce emissions in the sector, while helpful, are not sufficient to counteract growth in demand. New products and technologies are needed, including CCS and new cement types.
These new technologies will require a step change in RD&D efforts; the roadmap provides a vision for what is needed between today and 2050.
CCS is a particularly important technology for the cement sector, required to deliver up to half of the emissions reductions needed by 2050. This will require advancement of demonstration projects in the cement sector over the next decade, to learn in parallel with other sectors how to best apply CCS technology at the necessary scale.
The high cost of reducing CO2 emissions in the sector will require markets withlong-term stability and resultant confidence in the pricing of CO2 by those markets.
International collaboration and public-private partnerships must be encouraged to help speed up research, design, development and deployment of necessary new technologies.
© 2
009,
OEC
D/I
EA a
nd
Th
e W
orl
d B
usi
nes
s C
ou
nci
l fo
r Su
stai
nab
le D
evel
op
men
t
Cement roadmap milestones
205020302010 20402020
International Energy Agency www.iea.org/roadmaps
Cement sector CO2 emissions reductionsbelow the baseline, low demand scenario, 2010-2050
1.5
2.0
2.5
Dir
ect
emis
sio
ns
(Gt
Co
2)
Baselineemissions:2.34 Gt
BLUE emissions:1.55 Gt
1.88 Gt
2.332.22
2.20
1.86
Energy efficiency: 10%
Alternative fuel use and other fuel switching: 24%
Clinker substitution: 10%
Carbon capture and storage (CCS): 56%
0
100
%
All of these technologies need to be applied together if the BLUE scenario targets are to be achieved – no one option alone can yield the necessary emissions reductions
CO2 emissions reductions
205020302010 20402020
Cement-to-clinkerratio: 73%
Diffusion of BAT:global energy intensity3.1-3.2 Gt/t clinker
Cement-to-clinker ratio: 71%
Alternative fuel use and fuel switching
Ongoing identificationand classification of suitablealternative fuels
Energy efficiency
Clinker substitution
Carbon capture and storage
R&D - oxyfuelling,gas cleaning:1st CCS pilot plant
R&D into newgrinding equipmentand additives
Assess substitution material properties and evaluate regional availability
R&D - oxyfuelling,gas cleaning: develop oxyfuelling and chemical looping
Demonstration of2 chemical absorption demonstration plants
Mitigation costs USD/tCO2 cement (post combustion/oxyfuelling): 125/na
R&D - oxyfuelling, gas cleaning: C.A. energy use to fall to 2.2 GJ/t
Deployment: all large new kilns with CCS
Mitigation costsUSD/tCO2 cement (post combustion/oxyfuelling): 100/60
Commercial use of membrane technology
Demonstration3 oxyfuel demos, 3 chemicallooping demos
Develop international standards on blended cement use
Diffusion of BAT:phase-out of wet kilns in non-OECD
Diffusion of BAT: international standardfor new kilns
Diffusion of BAT:phase-out of wet kilns in OECD
R&D on fluidisedbed technology
BAT: best available technology; C.A.: chemical absorption
Deployment: 50-70 cement kilnswith CCS
Mitigation costs USD/tCO2 cement (post combustion/oxyfuelling): 100/50
Gt captured: 0.11-0.16 Gt;% CO2 captured: 10-12%
Deployment: 100-200 cement kilns with CCS
Deployment:220-430 cementkilns with CCS
Mitigation costsUSD/tCO2 cement(post combustion/oxyfuelling): 75/40
Gt captured:0.5-1.0 Gt; % CO2
captured: 40-45%
Diffusion of BAT:global energy intensity 3.2-3.4 Gt/t clinker
Implementinternational standards on blended cement use
Research and development (R&D) Demonstration Deployment Commercialisation