Embed Size (px)
Citation preview
© 2014 ISIJ 384
ISIJ International, Vol. 54 (2014), No. 2, pp. 384–391
Cellular Automaton Modeling of Microporosity Formation during Solidification of Aluminum Alloys
Mingfang ZHU,* Zhengyang LI, Dong AN, Qingyu ZHANG and Ting DAI
Jiangsu Key Laboratory for Advanced Metallic Materials, School of Materials Science and Engineering, Southeast University,Nanjing, Jiangsu, 211189 China.
(Received on September 6, 2013; accepted on October 17, 2013)
A two-dimensional (2D) cellular automaton (CA)-finite difference method (FDM) model is proposed tosimulate the dendrite growth and microporosity formation during solidification of aluminum alloys. Themodel involves a three-phase system of liquid, gas, and solid. The growth of both dendrite and gas poreis simulated using a CA approach. The diffusion of solute and hydrogen is calculated using the FDM. Themodel is applied to simulate the formation and interactions of dendrites and micropores in an Al-7wt.%Sialloy. The effects of initial hydrogen concentration and cooling rate on microporosity formation are inves-tigated. It is found that the porosity nuclei with larger size grow preferentially, while the growth of thesmall porosity nuclei is restrained. The competitive growth between porosities and dendrites is alsoobserved. With the increase of initial hydrogen concentration, the incubation time of porosity nucleationand growth decreases, and the percentage of porosity increases, while porosity density does not increaseapparently. With the decrease of cooling rate, porosity nucleates and starts to grow at higher tempera-tures, and the percentage of porosity increases, but the porosity density displays a decreasing trend. Inaddition, at a slower cooling rate, the competitive growth between porosities and dendrites becomesmore evident, leading to a more non-uniform distribution of porosity size, and an increased maximumporosity size. The simulation results agree reasonably with the experimental data in the literature.
KEY WORDS: modeling; solidification; microporosity; cellular automaton; aluminum alloys.
1. Introduction
Aluminum castings are widely used in automobile andaerospace industries and other commercial applications dueto their high strength-to-weight ratio, good corrosion resis-tance, and relatively low raw material cost.1) However, thecasting process can introduce the defect of microporosityinto the components. The porosity defect reduces mechani-cal properties of aluminum castings such as ultimatestrength, yield strength, ductility, and fatigue resistance sig-nificantly, and thus limits their applications, in particular, incritical safety components. It is commonly believed that theoccurrence of the microporosity defect in castings is attrib-uted to two concomitant mechanisms: the inadequate feed-ing of the volumetric shrinkage of liquid, and the insolublehydrogen gas evolution during solidification.2,3)
Because of the fundamental and practical importance,extensive efforts have been devoted to develop models forpredicting the occurrence of porosity in castings. Asreviewed by Lee et al.2) and Stefanescu,3) most models,4–19)
such as analytical solutions, criteria functions, Darcy’s lawcoupled with the conservation and continuity equations, andgas diffusion-controlled pore growth models, focus on pre-dicting the amount of porosity in a solidified casting, but
without graphical morphology output.Researchers also developed various models that can pro-
vide direct views of the evolution of porosity formation andthe interplay between gas pores and the solidified phase.20–31)
Huang et al.,20) Lee et al.,21–24) and Dong et al.25) developedthe cellular automaton (CA) coupled with hydrogen diffusion-controlled growth models to simulate the meso-scale mor-phologies of grain structure and porosity in two and threedimensions. Sasikumar et al.26) proposed a diffusion-basedCA model to simulate the initiation and growth of hydrogenpores from pre-existing bubbles in a solidifying eutectic Al–Si melt. It is found that small pre-existing bubbles have aquiescent stage of very slow growth until a critical supersat-uration is built up, followed by a stage of rapid growth.Because of the artificial anisotropy caused by the CA squaremesh, the simulated bubbles show the non-realistic squareshape. In addition, the model did not include the simulationof dendrite growth. The hydrogen for bubble growth comesin from the bottom boundary. Karagadde et al.27) adopted anew level-set (LS) approach to simulate the growth andmovement of hydrogen bubbles under free growth condi-tions in a melt. Nevertheless, the model also could notdescribe the coupling growth of dendrite and porosity,either. Meidani et al.28,29) developed the two and threedimensional phase-field (PF) models to describe the non-spherical morphology of pores constrained by a solid net-work that consists of a symmetric array of dendrite arms
* Corresponding author: E-mail: [email protected]: http://dx.doi.org/10.2355/isijinternational.54.384
ISIJ International, Vol. 54 (2014), No. 2
385 © 2014 ISIJ
generated in the beginning of simulations. The influence ofthe dendrite arm spacing (DAS) and the solid fraction on themorphology of a pore was studied. Wu et al.30) and Chen etal.31) constructed lattice Boltzmann method (LBM)-CA cou-pled model to simulate dendrite growth and bubble forma-tion during solidification. The simulation results reproducesome physical phenomena, including dendritic competitivegrowth, the preferential nucleation locations of bubbles andbubble growth, coalescence, and motion in the liquid chan-nels.
In the present work a CA-FDM coupled model is pro-posed, which includes a complete time-dependent interac-tion of dendrite solidification, the nucleation and growth ofporosities, solute and hydrogen partitions at the interface,and the diffusion of both solute and hydrogen, to simulatethe dendrite growth and microporosity formation. The mod-el is adopted to simulate the nucleation and growth ofmicroporosity, the interactions between dendrites andmicropores, as well as the microsegregation evolution ofboth hydrogen and solute silicon during solidification of anAl-7wt.%Si alloy. The effects of initial hydrogen contentand cooling rate on microporosity formation and morpholo-gy are investigated. The simulation results are comparedwith the experimental data reported in the literature.
2. Governing Equations and Numerical Algorithm
2.1. Model DescriptionThe emphasis of the present work is to simulate the
microporosity formation due to the differences in hydrogensolubility in the solid and liquid phases, while solidificationshrinkage is ignored. Hydrogen is far less soluble in solidaluminum than in liquid aluminum. During solidification ofaluminum alloys, the growing dendrites reject not only sol-ute but also hydrogen atoms into the surrounding liquidphase. When the hydrogen concentration in liquid exceedsa critical supersaturation level, the excess atomic hydrogenis separated to form gas pores. Then, the formed poresbecome sinks for the supersaturated gas in liquid. The grow-ing dendrites and gas pores produce an hydrogen gradientahead of the solid/liquid (S/L) and gas/liquid (G/L) interfac-es. The growing dendrites also yield solute gradient aheadof the S/L interface. Thus, hydrogen and solute transport takesplace in the domain. The effects of buoyancy, Marangoniflow, and external forces are not involved in the presentmodel. Therefore, the formed gas porosity is stationary, andthe hydrogen and solute transport is controlled by pure dif-fusion. In addition, the temperature in the domain isassumed to be uniform and cooled down with a cooling rate.The eutectic solidification is not considered, and the simu-lations are stopped when the temperature is cooled down tothe eutectic temperature.
2.2. Porosity NucleationPore nucleation can occur when the gas dissolved in the
liquid, Cl(H), exceeds a critical supersaturation level.3) Inthe present work, a stochastic model is adopted to describeporosity nucleation. The ratio of the local hydrogen concen-tration and the local saturation in liquid phase, Sn=Cl(H)/Sl(H), is taken as the criterion for porosity nucleation. It isassumed that the number of gas pore nuclei can be evaluated
by the distribution function dn/dS that is given by
........ (1)
where Nmax is the maximum pore nucleation density, Smax
and Smin are the maximum and minimum porosity nucleationsaturation, respectively, which could be measured by exper-iment,10,24) Sn is the critical saturation criterion for porositynucleation, Cl(H) and Sl (H) are the local hydrogen concen-tration (mol/m3) and the local hydrogen saturation in liquid,respectively. When the local hydrogen saturation is satisfiedwith the pore nucleation condition, a pore with a certainradius is nucleated.10)
According to Sievert’s law, the hydrogen saturation in liq-uid, Sl(H), of Al–Si alloys can be calculated by10)
.............. (2)
where Pg is the internal pressure of a gas pore, Pref is the ref-erence pressure and it is taken as the standard atmosphericpressure, namely, Pref =1 atm in the present work, Wsi is themass fraction of solute Si, and T is the temperature in thedomain.
In the present work, the internal pressure of a gas pore,Pg, only includes the effects of the atmospheric pressure andsurface energy pressure, but the effects of the metallostaticpressure and shrinkage pressure are neglected. Thus, Pg inthe two dimensions can be calculated by
............................. (3)
where λLG is the surface tension of the liquid/gas interface,and rp is the pore radius. The radii of gas pore nuclei formedunder different hydrogen saturations are also calculatedusing Eqs. (2) and (3).
2.3. Microporosity and Dendrite GrowthIn the present work, a CA approach is adopted to simulate
the growth of both gas pores and dendrites. The two dimen-sional domain is divided into a uniform square arrangementof cells. Each cell is characterized by different variables ofhydrogen concentration, solute concentration, crystallo-graphic orientation of a dendrite, temperature, phase frac-tions (solid, liquid, and gas), and states including liquid cell(fg+fs=0), gas cell (fg=1), solid cell (fs=1), the gas/solid (G/S)interface cell (fg+fs=1), the gas/liquid (G/L) interface cell(0<fg<1, and fs=0), the solid/liquid (S/L) interface cell(0<fs<1, and fg=0), and the gas/liquid/solid (G/L/S) inter-face cell (0<fg+fs<1), where fg and fs are the gas fraction andsolid fraction, respectively. The cells that belong to a samepore share the characteristics of this pore, including thequantity of hydrogen, the internal pressure and the volumeof the pore. Because of the effect of surface tension, the gaspores grow spherically when they are fully enveloped by theliquid. However, the shapes of pores become irregular afterthey encounter dendrites. In the present 2D model, theequivalent radius of a pore denoted as A, , can be evalu-ated by
dn
dS
N
S SC H S H S
C H S H S
max
max minl l n
l l n
= −>( )
≤( )
⎧
⎨⎪
⎩⎪( )
; ( ) ( )
; ( ) ( )0
S HP
Plg
ref
TWSi
( ). .
=− + −⎛
⎝⎜
⎞⎠⎟
102760
2 96 0 0119
P Prg refLG
p
= +λ
rpA
© 2014 ISIJ 386
ISIJ International, Vol. 54 (2014), No. 2
............................. (4)
where Vc is the cell volume, and is the sum of gas frac-
tions of all cells that are located at the pore A.The gas inside a pore is assumed to obey the ideal gas
law. Thus, the gas volume increment of the pore A, ΔVA, inone time step interval can be calculated by
........................ (5)
where is the quantity of hydrogen absorbed by allG/L interface cells of the pore A, and R is the gas constant.Therefore, the gas volume increment of the G/L interfacecell (i, j)A that is located at the pore A can be evaluated by
.................... (6)
where Gg(i, j)A is the geometrical factor of the G/L interfacecell (i, j)A, J denotes all G/L interface cells of the pore A,
and is the sum of geometrical factors of all G/L interface
cells of the pore A. The geometrical factor Gg is related tothe state of neighbor cells, which is defined by
,
.......................................... (7)
where S I and S II indicate the state of the nearest neighborcells and the second-nearest neighbor cells, respectively,and fg is the gas fraction of neighbor cells. The geometricalfactor defined by Eq. (7) is used to account for the effect ofneighbor cell state on pore growth. Equation (7) also reflectsthe consideration that the geometrical relation between cellsis proportional to the cell spacing, i.e., the effect of the sec-ond nearest neighbor cells is weaker than those of the near-est cells.
At one time step interval, Δt, the gas fraction incrementof the G/L interface cell (i, j) can be calculated by
.......................... (8)
Thus, at time tn, the gas fraction of the G/L interface cell(i, j) can be calculated by
..................... (9)
where N indicates the number of iterations after the cellbecomes an interface cell, namely, when the cell is capturedas a G/L interface cell, N is set as 1. As N increases, the gasfraction in this G/L interface cell increases. At the end ofeach time step, the gas fraction of each cell is updatedaccording to Eq. (9). When , the cell (i, j) trans-forms its state from the G/L interface to gas pore and getsthe same pore index as its gas neighbor. This newly formedgas cell in turn captures a set of its liquid neighbors to bethe new G/L interface cells. The pore growth will thus con-
tinue in the next time step.The growth of dendrites is driven by the local undercool-
ing. The total local undercooling at the S/L interface at timet, ΔT(t), is given by
.... (10)
where Tl is the liquidus temperature, T(t) and C(t) are thelocal temperature and local solute concentration at time t,respectively, m is the liquidus slope, C0 is the initial compo-sition, and Γ(θ ) is the Gibbs-Thomson coefficient incorpo-rated with the anisotropy of surface energy. The interfacemean curvature K(t) is calculated using the counting-cellmethod.32)
The interface growth velocity, Vg, and local undercoolingare related by the classical sharp interface model33,34)
..........................(11)
where μk is the interface kinetics coefficient incorporatedwith the kinetic anisotropy.
For an fcc-lattice crystal of Al–Si alloys used in the pres-ent simulations, it exhibits a four-fold anisotropy of thekinetics and surface energy at the S/L interface.
............ (12)
.............. (13)
where , δ k, , and δ t are the average interface kineticcoefficient, the degree of the kinetic anisotropy, the averageGibbs-Thomson coefficient, and the degree of the surfaceenergy anisotropy, respectively. θ is the angle between thenormal of the S/L interface and the horizontal direction, andθ 0 is the preferred growth orientation of the dendrite. Theangle θ can be calculated according to the gradient of solidfraction at the S/L interface using the following equation.
...................... (14)
The growth velocities of the S/L interface cells are calcu-lated by Eqs. (10)–(14). The increment of solid fraction ofan interface cell at one time step could thus been evaluatedfrom crystal growth velocity, Vg, as follows
........................... (15)
where Δt is the time step, Δx is the cell spacing, and Gs is ageometrical factor related to the states of neighboring cells,defined by an equation with an identical form of Eq. (7).The only difference is that the gas fraction, fg, in Eq. (7) isreplaced by the solid fraction, fs.
According to Eq. (15), at time tn, the solid fraction of theS/L interface cell labeled as (i, j) can be calculated by
........... (16)
At the end of each time step, the solid fraction of each cellis updated according to Eq. (16). When , cell(i, j) transforms its state from interface to solid and gets thesame crystallographic orientation index as its solid neighbor.This newly solidified cell in turn captures a set of its liquidneighbors to be the new S/L interface cells. The solidifica-
r
V f
pA
c gA=∑π
fgA∑
ΔV R HRT
PA
G LA
g
= ⋅( ) /
R H G LA( ) /
Δ ΔV i j VG i j
GA A g
A
gA
J
( , )( , )
= ⋅∑
GgA
J∑
G S Sg mI
mmII
m
= +⎛
⎝⎜
⎞
⎠⎟
⎡
⎣⎢
⎤
⎦⎥
= =∑ ∑min ,1
1
2
1
21
4
1
4
S Sf
fI II g
g
,( )
( )=
<
=
⎧⎨⎪
⎩⎪
0 1
1 1
ΔΔ
f i jV i j
Vgc
( , )( , )
=
f i jV i j
Vgt
t
cn
Nn
n( )
( )
( , )( , )
==
∑ Δ
1
f i jgtn( ) ( , ) = 1
Δ Γ ΚT t T T t m C t C tl( ) ( ) ( ( ) ) ( ) ( )= − + ⋅ − −0 θ
V T tg k= ⋅μ θ( ) ( )Δ
μ θ μ δ θ θk k k( ) cos= + −( )⎡⎣ ⎤⎦{ }1 4 0
Γ Γ( ) cosθ δ θ θ= − −( )⎡⎣ ⎤⎦{ }1 4 0t
μk Γ
θ =∂∂
∂∂
⎛
⎝⎜
⎞
⎠⎟arctan
f
y
f
xs s
ΔΔ
Δf GV
xts s
g=
f i j G i jV i j
xts
t t gt
n
Nn n
n
( ) ( )( )
( , ) ( , )( , )
==
∑ ΔΔ
1
f i jstn( ) ( , ) = 1
ISIJ International, Vol. 54 (2014), No. 2
387 © 2014 ISIJ
tion will thus continue in the next time step.
2.4. Solute and Hydrogen TransportAs dendrite grows, the solute and hydrogen partitions
take place between liquid and solid at the S/L interface. Onthe other hand, the growing gas pores absorb the supersatu-rated hydrogen at the G/L interface. Thus, the solute andhydrogen gradients are yielded ahead of the S/L and G/Linterfaces, leading to the solute and hydrogen diffusion. Thegoverning equation for solute and hydrogen diffusion withinthe entire domain is given by
............ (17)
where Ci(X) is the concentration, Di(X) is the diffusion coef-ficient, X is Si or H and represents solute silicon or hydro-gen, the subscript i is s or l and indicates solid or liquid,respectively. The second term on the right hand side of Eq.(17), R(X), denotes the effect of solute or hydrogen partitionat the interface on the concentration fields. For the solute Siconcentration field, R(Si) indicates the amount of soluterejected at the S/L interface. For the hydrogen concentrationfield calculation, R(H) includes hydrogen partitions at the S/Linterface, R(H)S/L, and the G/L interface, R(H)G/L.
When solid phase grows, the solute and hydrogen parti-tions between liquid and solid at the S/L interface are con-sidered according to
......................... (18)
where kX, , and are the partition coefficientand the interface concentrations of solute Si or hydrogen insolid and liquid phases, respectively. Therefore, at one timestep interval, the increment of solid fraction, Δfs, at the S/Linterface will release the amount of solute Si, R(Si), andhydrogen, R(H)S/L, which could be evaluated by
and ,respectively.
On the other hand, at the G/L interface, when the localhydrogen concentration, Cl(H), is higher than the localhydrogen saturation in liquid, Sl(H), the supersaturatedhydrogen will be absorbed by the gas pore. Thus, at onetime step interval, the amount of hydrogen absorbed by apore donated as A through the G/L interface cells, ,could be evaluated by
........ (19)
where J denotes all G/L interface cells of the pore A, and, , , and represent the solid fraction,
gas fraction, hydrogen concentration, and hydrogen solubil-ity in liquid, respectively, at the G/L interface cell that islocated at pore A.
Equation (17) is solved using an explicit finite differencescheme, and the zero-flux boundary condition is adopted.The time step, Δt, is determined by
........... (20)
where Dl(Si) is the diffusion coefficient of solute Si in liquidphase, and Δfs,max is the maximum increment of solid frac-tion in one time step. Since the diffusion coefficient of
hydrogen in liquid is about two orders of magnitude largerthan that of solute Si, the stable time step for the hydrogenconcentration field calculation is about two orders of mag-nitude smaller than that determined by Eq. (20). To increasethe computational efficiency, two different time steps areadopted in the simulations. The time step for hydrogen dif-fusion, ΔtH, is determined by ΔtH = Δx2/4.5Dl(H), whereDl(H) is the diffusion coefficient of hydrogen in liquid. Ifthe ratio of two time steps is Nt =Δt/ΔtH, the calculation ofhydrogen diffusion is run for Nt times using the time step tH.Then, the diffusion of solute silicon, and the growth of den-drites and gas pores are calculated using Δt for one timestep.
2.5. Coupling Growth of Microporosity and DendriteDendritic growth is simulated by solving the Eqs. (10)–
(16). At this stage, the solid fraction increment, Δfs, evalu-ated by Eq. (15) will give rise to the solute and hydrogenpartitions around the S/L interface according Eq. (18). Therejected amount of solute Si and hydrogen, ΔC(X) =
is added to the remaining liquid in thesame interface cell and its surrounding neighbor cells. Theoverall conservation of solute Si and hydrogen in thedomain is maintained. Then the solute and hydrogen con-centration fields are calculated by solving Eq. (17). Withdendrites growing, the concentration of dissolved hydrogenin the liquid phase increases. When the local hydrogensupersaturation reaches a certain level given by Eq. (1), porenuclei occur with the radii evaluated by Eqs. (2) and (3).Then, the increment of gas fraction at the G/L interface iscalculated using Eqs. (2)–(8) and (19). Meanwhile, the radiiof gas pores are updated by Eq. (4). This series of calcula-tions are repeated until the end of simulation. Consequently,the physical mechanisms of a complete time-dependentinteraction of dendrite growth, the nucleation and growth ofporosities, solute and hydrogen partitions at the interface,and the diffusion of solute and hydrogen is embedded in thepresent model.
The physical property parameters used in the simulationsare listed in Table 1.
3. Results and Discussion
3.1. Effect of Initial Hydrogen ConcentrationThe proposed model is applied to simulate gas porosity
formation during solidification of an Al-7wt.%Si alloy. Thecalculation domain consists of a 300×300 mesh with a uni-form mesh size Δx=3 μm. The porosity nucleation parame-ters used are as follows: the maximum pore nucleation den-sity Nmax=1×10¹¹ m–3, the minimum and maximum porenucleation saturations Smin=1.6 and Smax=2.3, and the criti-cal saturation criterion Sn=1.2. These porosity nucleationparameters are taken as constant in all simulations in thepresent work. The initial hydrogen concentration is0.55 mol/m3 and the cooling rate is set to be 5°C/s. At thebeginning of the simulation, several solid seeds with variouscrystallographic orientations are randomly assigned in thecalculation domain. Figure 1 presents the evolution ofporosities and dendrites of an Al-7wt.%Si alloy shown inhydrogen concentration and solute Si fields, respectively.The numbers in Figs. 1(a)–1(d) indicate the local hydrogen
∂∂
= ⋅∇ +C X
tD X C X R Xii i
( )( ) ( ) ( )2
C X k C Xs X l∗ ∗=( ) ( )
C Xs∗( ) C Xl
∗( )
R Si( ) =f C Si ks l Si−( )( )∗Δ ( ) 1 R H f C H k
S L s l H( ) = −( )( )∗/
( )Δ 1
R H G LA( ) /
R H f f C H S H VG LA
gA
sA
JlA
lA
c( ) ( )( ( ) ( ))/ = − − −∑ 1
fsA fg
A C HlA ( ) S Hl
A ( )
ΔΔ
Δt
x
D Si fl s
=×
⎧⎨⎪
⎩⎪
⎫⎬⎪
⎭⎪min
. ( ),. ,
2
4 5
1
4 5 max
Δf C X C Xs l s∗ ∗−( )( ) ( )
© 2014 ISIJ 388
ISIJ International, Vol. 54 (2014), No. 2
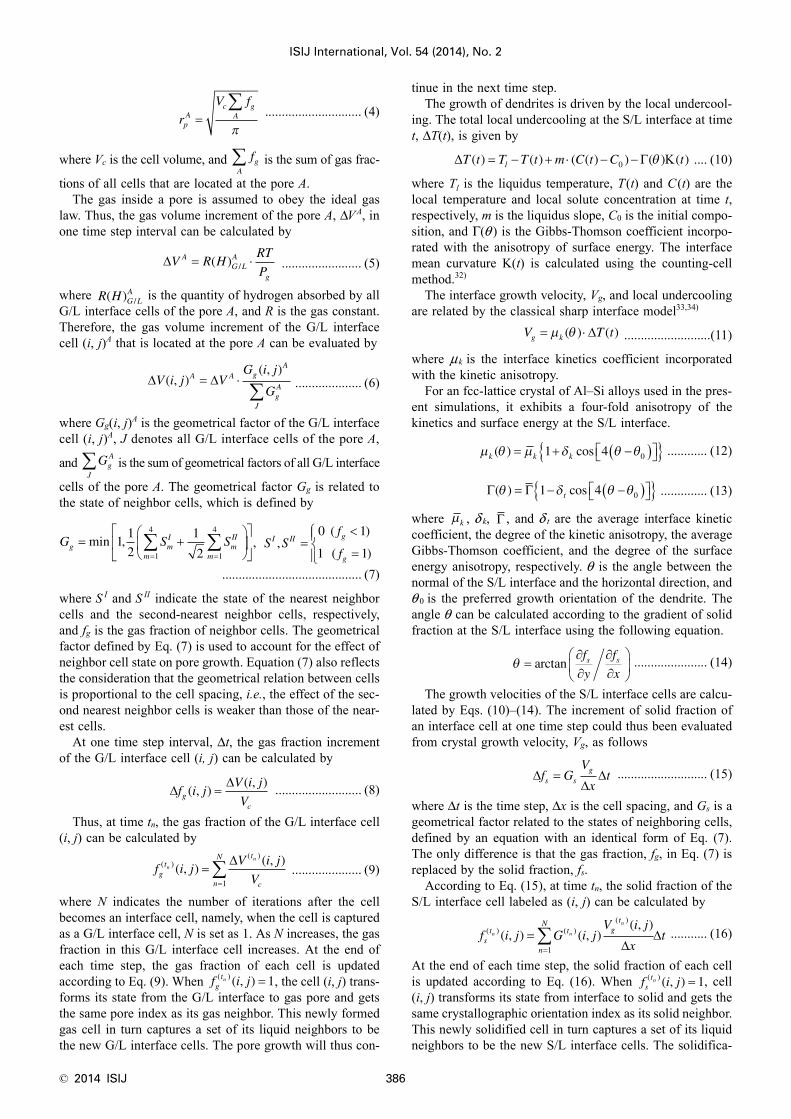
concentration. It can be seen from Fig. 1 that with temper-ature decreasing, dendrites grow, with developing the mainarms along their crystallographic orientations, and sidebranching of the secondary arms. The concentration of sol-ute Si in liquid phase increases and it is obviously enrichedat the S/L interface. When the temperature is cooled downto the eutectic temperature, the concentration of solute Si is
increased to the eutectic composition of 12.7wt.%Si asshown in Fig. 1(h). On the other hand, hydrogen concentra-tion in liquid is also increased with dendrite growth, but itis less enriched at the S/L interface compared to the Si con-centration. This is because the hydrogen diffusivity is abouttwo orders of magnitude larger than the Si diffusivity. Whenhydrogen concentration in liquid is increased to be higherthan the supersaturation for porosity nucleation, several gaspore nuclei with different radii appear when the temperatureis cooled down to about 603°C as shown in Fig. 1(b). Sinceporosity nucleation consumes some hydrogen atoms, thehydrogen concentration in Fig. 1(b) is a little lower than thatin Fig. 1(a). With temperature continuously decreasing anddendrite growing, the hydrogen concentration in liquidincreases, leading to the growth of gas pores, as shown inFigs. 1(c) and 1(d). It is noted that some small pore nucleinearly do not grow even when the temperature is cooleddown to the eutectic temperature, although the local hydro-gen concentration around the small pore nuclei is actuallyhigher than that around the larger pores. As shown in Fig.1(c), the local hydrogen concentration close to the two smallpores, and to the two relative larger pores, is around0.73 mol/m3 and 0.61 mol/m3, respectively. Nevertheless,the two relatively large pores are able to grow, while the twosmall pores cannot grow as shown in Fig. 1(d). Accordingto Eq. (3), the internal pressure Pg of a small pore is largerthan that of a large pore, resulting in a larger solubility Sl(H)of small pore than that of large pore (Eq. (2)). According toEqs. (5) and (19), the larger the internal pressure Pg and sol-ubility Sl(H), the smaller the gas volume increment ΔV. Con-sequently, the growth kinetics of small pores is lower thanthat of large pores. Comparing Figs. 1(c) with 1(d), it alsocan be seen that when the temperature is decreased from592°C to 577°C, the hydrogen concentration in liquiddecreases, and the latter is even lower than the initial hydro-
Table 1. Physical parameters of an Al-7wt.%Si alloys used in thesimulation.
Parameter and unit Value Ref.
liquidus temperature, Tl, K 896.1 calculated
eutectic temperature, Teu, K 850.2 22)
liquidus slope, m, K/(mass)% –6.0 35)
diffusion coefficient of Siin liquid, Dl(Si), m2/s 1.1×10⁻⁵exp(–5 696/T) 36)
diffusion coefficient of Siin solid, Ds(Si), m2/s 2.02×10⁻⁴exp(–16 069/T) 36)
diffusion coefficient of Hin liquid, Dl(H), m2/s 3.8×10⁻⁶exp(–2 315/T) 5)
diffusion coefficient of Hin solid, Ds(H), m2/s 1.1×10⁻⁵exp(–4 922/T) 5)
partition coefficient of Si, kSi 0.117 35)
partition coefficient of H, kH 0.069 16)
surface tension, λLG, N/m 0.889 37)
average interface kineticcoefficient, , m/(s·K) 1.0×10⁻⁴ estimated
degree of the surfaceenergy anisotropy, δ t
0.3 32)
degree of the kineticanisotropy, δ k
0.3 32)
average Gibbs-Thomsoncoefficient, , m·K 1.7×10⁻⁷ 36)
μk
Γ
Fig. 1. Evolution of microporosity and dendrite growth of an Al-7wt.%Si with a cooling rate of 5°C/s and an initial hydro-gen concentration of 0.55 mol/m3 at different temperatures: (a, e) 605.5°C, Fs=15%, Fg=0; (b, f) 602.8°C, Fs=25%,Fg=0.2%; (c, g) 591.6°C, Fs=48%, Fg=0.578%; (d, h) 577°C, Fs=53%, Fg=1.426%; (a–d) H concentration field, (e–h) Si concentration field (Numbers in Figs. 1 (a)–1(d) show the local H concentration in liquid phase. Fs and Fg arethe total solid fraction and percentage of porosity in the domain, respectively). (Online version in color.)
ISIJ International, Vol. 54 (2014), No. 2
389 © 2014 ISIJ
gen concentration of 0.55 mol/m3. It is understandable thatthe growing porosities consume hydrogen atoms in liquid.
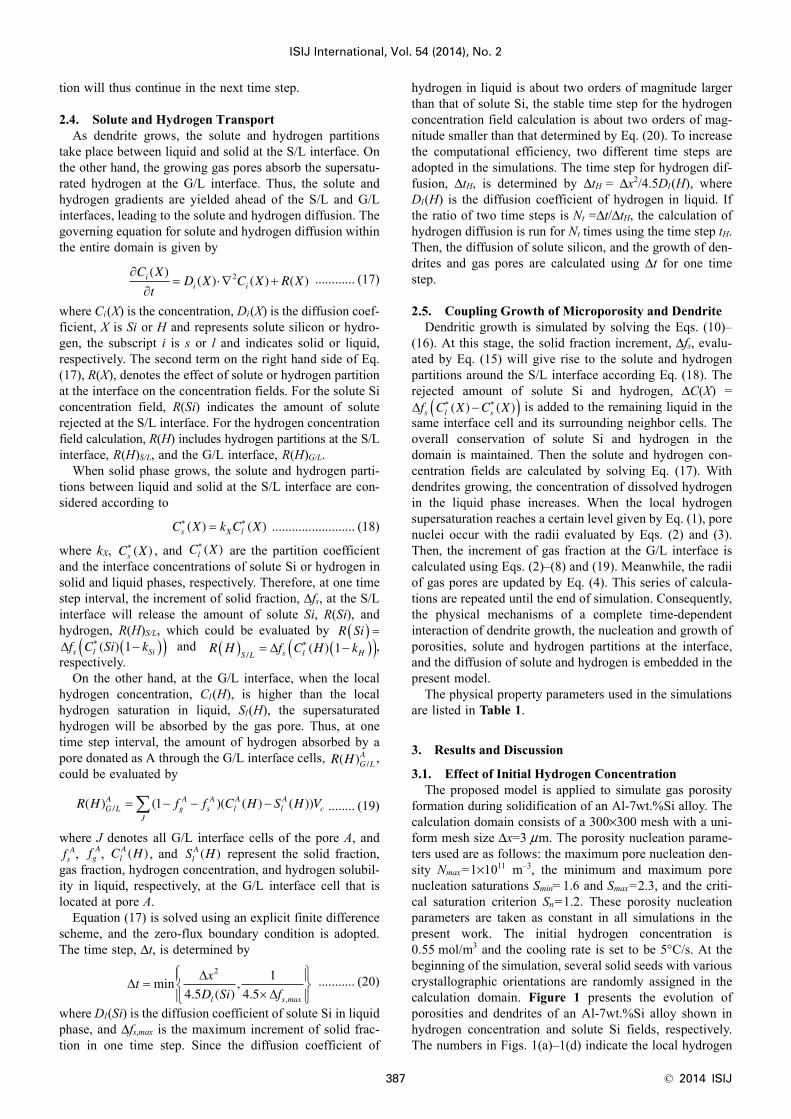
Figure 2 shows the the evolution of porosity and dendritegrowth of an Al-7wt.%Si alloy with an initial hydrogen con-centration of 0.65 mol/m3. The other simulation conditionsare identical with those of Fig. 1. It is noticed that in the ear-ly stage, the small pores grow spherically, because of theeffect of the G/L interfacial tension. After the pores contactand impinge on dendrites, the growth space of pores isrestricted by the complex dendrite network, and thus thepore shape becomes non-spherical. On the other hand, den-drite growth might also be impacted by the nearby pores. Asshown in Figs. 2(b)–2(f), one dendritic main arm growingdownwards is blocked and split by a nearby pore. Since thegrowing pores become sinks for the supersaturated hydro-gen in liquid, the local hydrogen concentration close topores is lower than that far away from pores as shown inFig. 2(d). When the temperature is cooled down fromaround 609°C to 600°C, the overall hydrogen concentrationin the domain increases as shown in Figs. 2(a)–2(d). How-ever, when the temperature is further decreased, the hydro-gen concentration decreases.
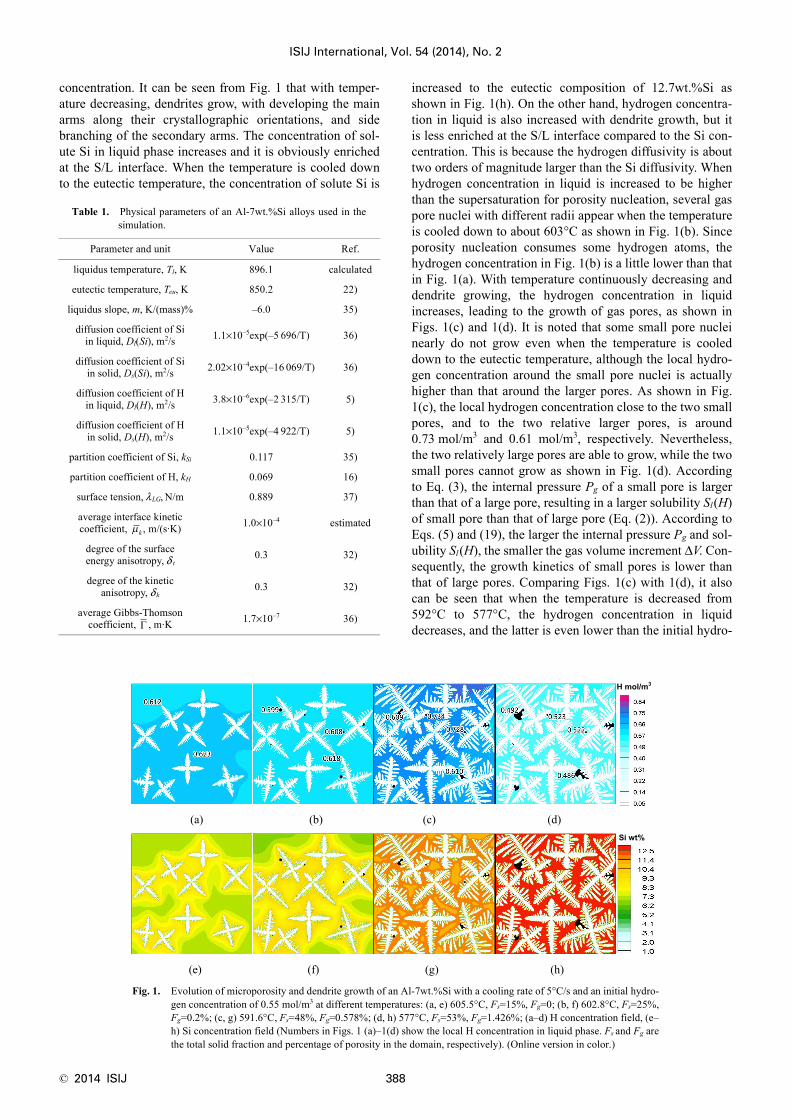
Figure 3 shows the solid fraction and percentage ofporosity varying with temperature for the case of Fig. 2. Asshown, during the temperature change from 610°C to600°C, the increase rate of solid fraction is much larger thanthat of the percentage of porosity. When the temperature islower than around 600°C, the percentage of porosityincreases rapidly, while the increase rate of solid fractionslows down. Accordingly, in the early stage of solidifica-tion, the hydrogen concentration in liquid increases due tothe fast dendrite growth. Then the hydrogen concentrationdecreases, because in the late stage, dendrite growth velocitydecreases, whereas pore growth rate increases. ComparingFig. 2 with Fig. 1, it is found that with a higher initial hydro-gen concentration, pore nucleation takes place at a higher
temperature, and the final pore size is larger, while theporosity number does not increase evidently. This is coinci-dental with the experimental results obtained by James37)
and Mitrasinovic et al.38) When the temperature is higherthan about 600°C, the hydrogen concentration in liquid ofFig. 2 is higher than that in Fig. 1. However, when the tem-perature is cooled down to 591.6–577°C, the hydrogen con-centration in liquid of Fig. 2 becomes lower than that of Fig.1. This is because in the temperature range of 591.6 to577°C, the total percentage of porosity of Fig. 2 is markedlyhigher than that in Fig. 1. It is evident that the higher per-centage of porosity consumes more atomic hydrogen, lead-ing to a lower hydrogen concentration in liquid, even thoughthe initial hydrogen concentration of Fig. 2 is higher thanthat of Fig. 1.
Figure 4 shows the percentage of porosity varying withsolidification time at a cooling rate of 2°C/s and variousinitial hydrogen concentrations. The other simulation condi-
Fig. 2. Evolution of microporosity, dendrite growth, and hydrogen concentration field of an Al-7wt.%Si with a coolingrate of 5°C/s and an initial hydrogen concentration of 0.65 mol/m3 at temperatures: (a) 608.8°C, Fs=6%, Fg=0.2%;(b) 605.1°C, Fs=5%, Fg=0.207%; (c) 602.4°C, Fs=25%, Fg=0.212%; (d) 599.5°C, Fs=36%, Fg=0.341%; (e)591.6°C, Fs=47%, Fg=1.34%; (f) 577°C, Fs=52.2%, Fg=2.065% (Numbers in the figures show the local H concen-tration in liquid phase. Fs and Fg are the total solid fraction and percentage of porosity in the domain, respectively).(Online version in color.)
Fig. 3. Solid fraction and percentage of porosity as a function oftemperature with a cooling rate of 5°C/s and an initialhydrogen concentration of 0.65 mol/m3.
© 2014 ISIJ 390
ISIJ International, Vol. 54 (2014), No. 2
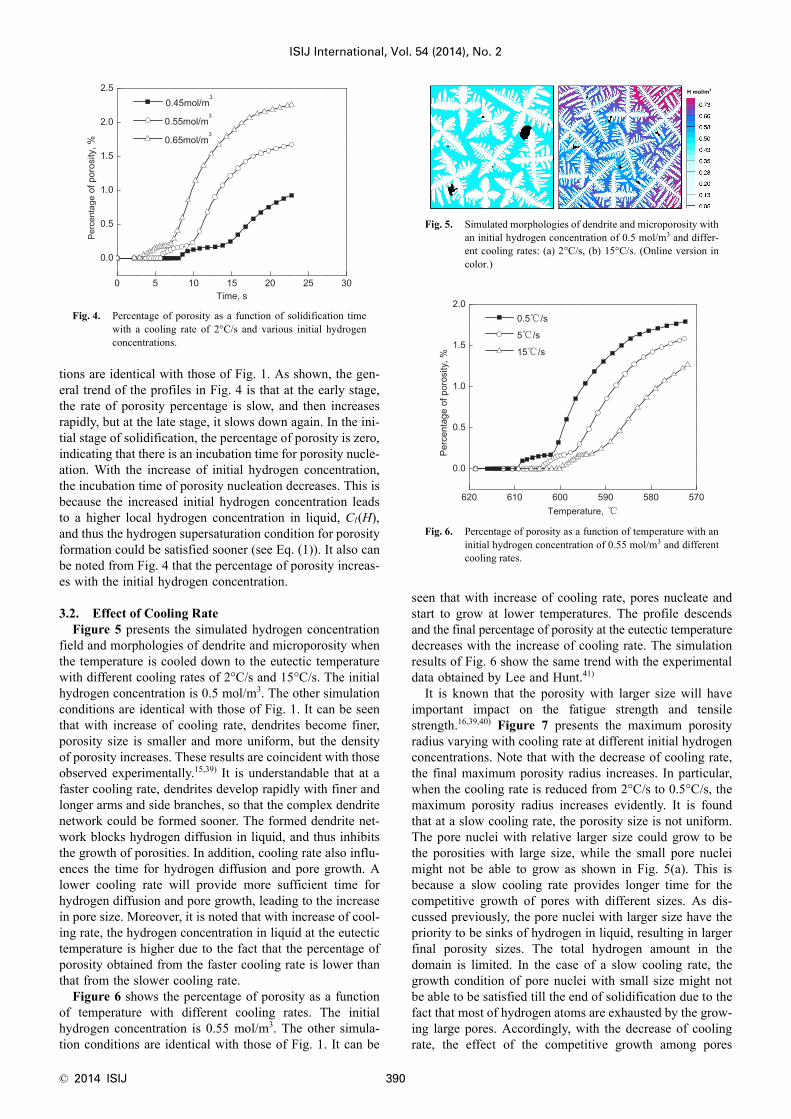
tions are identical with those of Fig. 1. As shown, the gen-eral trend of the profiles in Fig. 4 is that at the early stage,the rate of porosity percentage is slow, and then increasesrapidly, but at the late stage, it slows down again. In the ini-tial stage of solidification, the percentage of porosity is zero,indicating that there is an incubation time for porosity nucle-ation. With the increase of initial hydrogen concentration,the incubation time of porosity nucleation decreases. This isbecause the increased initial hydrogen concentration leadsto a higher local hydrogen concentration in liquid, Cl(H),and thus the hydrogen supersaturation condition for porosityformation could be satisfied sooner (see Eq. (1)). It also canbe noted from Fig. 4 that the percentage of porosity increas-es with the initial hydrogen concentration.
3.2. Effect of Cooling RateFigure 5 presents the simulated hydrogen concentration
field and morphologies of dendrite and microporosity whenthe temperature is cooled down to the eutectic temperaturewith different cooling rates of 2°C/s and 15°C/s. The initialhydrogen concentration is 0.5 mol/m3. The other simulationconditions are identical with those of Fig. 1. It can be seenthat with increase of cooling rate, dendrites become finer,porosity size is smaller and more uniform, but the densityof porosity increases. These results are coincident with thoseobserved experimentally.15,39) It is understandable that at afaster cooling rate, dendrites develop rapidly with finer andlonger arms and side branches, so that the complex dendritenetwork could be formed sooner. The formed dendrite net-work blocks hydrogen diffusion in liquid, and thus inhibitsthe growth of porosities. In addition, cooling rate also influ-ences the time for hydrogen diffusion and pore growth. Alower cooling rate will provide more sufficient time forhydrogen diffusion and pore growth, leading to the increasein pore size. Moreover, it is noted that with increase of cool-ing rate, the hydrogen concentration in liquid at the eutectictemperature is higher due to the fact that the percentage ofporosity obtained from the faster cooling rate is lower thanthat from the slower cooling rate.
Figure 6 shows the percentage of porosity as a functionof temperature with different cooling rates. The initialhydrogen concentration is 0.55 mol/m3. The other simula-tion conditions are identical with those of Fig. 1. It can be
seen that with increase of cooling rate, pores nucleate andstart to grow at lower temperatures. The profile descendsand the final percentage of porosity at the eutectic temperaturedecreases with the increase of cooling rate. The simulationresults of Fig. 6 show the same trend with the experimentaldata obtained by Lee and Hunt.41)
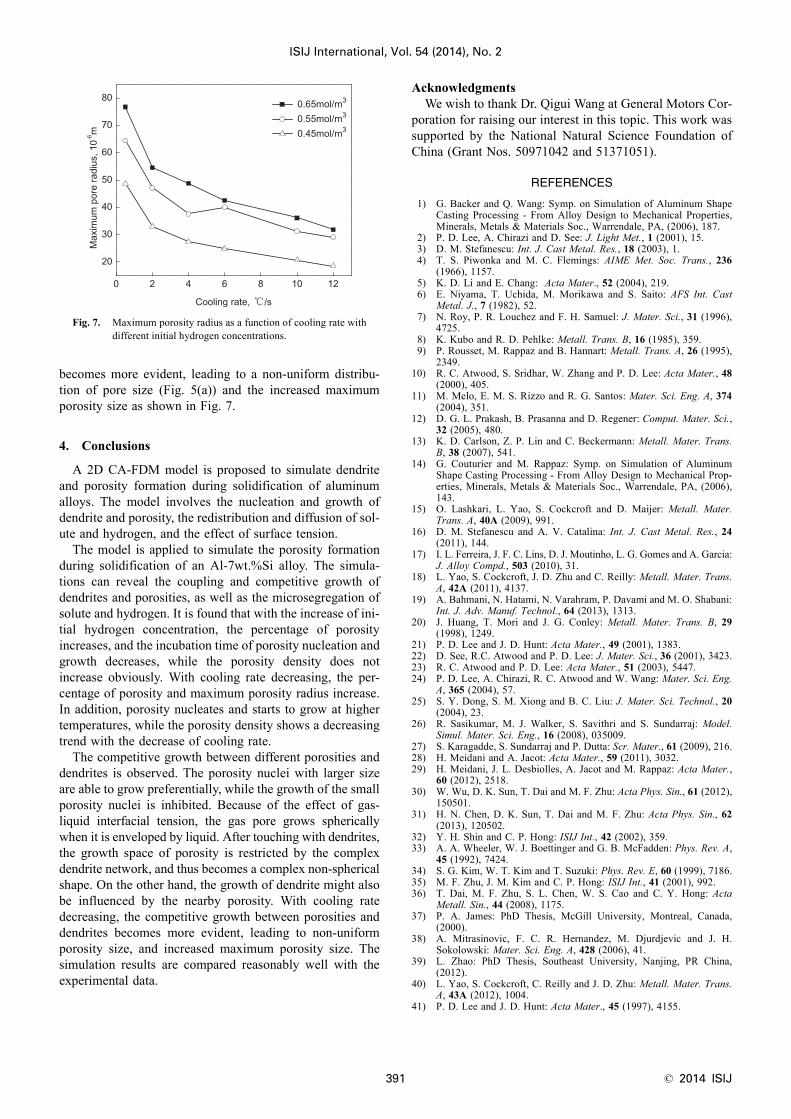
It is known that the porosity with larger size will haveimportant impact on the fatigue strength and tensilestrength.16,39,40) Figure 7 presents the maximum porosityradius varying with cooling rate at different initial hydrogenconcentrations. Note that with the decrease of cooling rate,the final maximum porosity radius increases. In particular,when the cooling rate is reduced from 2°C/s to 0.5°C/s, themaximum porosity radius increases evidently. It is foundthat at a slow cooling rate, the porosity size is not uniform.The pore nuclei with relative larger size could grow to bethe porosities with large size, while the small pore nucleimight not be able to grow as shown in Fig. 5(a). This isbecause a slow cooling rate provides longer time for thecompetitive growth of pores with different sizes. As dis-cussed previously, the pore nuclei with larger size have thepriority to be sinks of hydrogen in liquid, resulting in largerfinal porosity sizes. The total hydrogen amount in thedomain is limited. In the case of a slow cooling rate, thegrowth condition of pore nuclei with small size might notbe able to be satisfied till the end of solidification due to thefact that most of hydrogen atoms are exhausted by the grow-ing large pores. Accordingly, with the decrease of coolingrate, the effect of the competitive growth among pores
Fig. 4. Percentage of porosity as a function of solidification timewith a cooling rate of 2°C/s and various initial hydrogenconcentrations.
Fig. 5. Simulated morphologies of dendrite and microporosity withan initial hydrogen concentration of 0.5 mol/m3 and differ-ent cooling rates: (a) 2°C/s, (b) 15°C/s. (Online version incolor.)
Fig. 6. Percentage of porosity as a function of temperature with aninitial hydrogen concentration of 0.55 mol/m3 and differentcooling rates.
ISIJ International, Vol. 54 (2014), No. 2
391 © 2014 ISIJ
becomes more evident, leading to a non-uniform distribu-tion of pore size (Fig. 5(a)) and the increased maximumporosity size as shown in Fig. 7.
4. Conclusions
A 2D CA-FDM model is proposed to simulate dendriteand porosity formation during solidification of aluminumalloys. The model involves the nucleation and growth ofdendrite and porosity, the redistribution and diffusion of sol-ute and hydrogen, and the effect of surface tension.
The model is applied to simulate the porosity formationduring solidification of an Al-7wt.%Si alloy. The simula-tions can reveal the coupling and competitive growth ofdendrites and porosities, as well as the microsegregation ofsolute and hydrogen. It is found that with the increase of ini-tial hydrogen concentration, the percentage of porosityincreases, and the incubation time of porosity nucleation andgrowth decreases, while the porosity density does notincrease obviously. With cooling rate decreasing, the per-centage of porosity and maximum porosity radius increase.In addition, porosity nucleates and starts to grow at highertemperatures, while the porosity density shows a decreasingtrend with the decrease of cooling rate.
The competitive growth between different porosities anddendrites is observed. The porosity nuclei with larger sizeare able to grow preferentially, while the growth of the smallporosity nuclei is inhibited. Because of the effect of gas-liquid interfacial tension, the gas pore grows sphericallywhen it is enveloped by liquid. After touching with dendrites,the growth space of porosity is restricted by the complexdendrite network, and thus becomes a complex non-sphericalshape. On the other hand, the growth of dendrite might alsobe influenced by the nearby porosity. With cooling ratedecreasing, the competitive growth between porosities anddendrites becomes more evident, leading to non-uniformporosity size, and increased maximum porosity size. Thesimulation results are compared reasonably well with theexperimental data.
AcknowledgmentsWe wish to thank Dr. Qigui Wang at General Motors Cor-
poration for raising our interest in this topic. This work wassupported by the National Natural Science Foundation ofChina (Grant Nos. 50971042 and 51371051).
REFERENCES
1) G. Backer and Q. Wang: Symp. on Simulation of Aluminum ShapeCasting Processing - From Alloy Design to Mechanical Properties,Minerals, Metals & Materials Soc., Warrendale, PA, (2006), 187.
2) P. D. Lee, A. Chirazi and D. See: J. Light Met., 1 (2001), 15.3) D. M. Stefanescu: Int. J. Cast Metal. Res., 18 (2003), 1.4) T. S. Piwonka and M. C. Flemings: AIME Met. Soc. Trans., 236
(1966), 1157.5) K. D. Li and E. Chang: Acta Mater., 52 (2004), 219.6) E. Niyama, T. Uchida, M. Morikawa and S. Saito: AFS Int. Cast
Metal. J., 7 (1982), 52.7) N. Roy, P. R. Louchez and F. H. Samuel: J. Mater. Sci., 31 (1996),
4725.8) K. Kubo and R. D. Pehlke: Metall. Trans. B, 16 (1985), 359.9) P. Rousset, M. Rappaz and B. Hannart: Metall. Trans. A, 26 (1995),
2349.10) R. C. Atwood, S. Sridhar, W. Zhang and P. D. Lee: Acta Mater., 48
(2000), 405.11) M. Melo, E. M. S. Rizzo and R. G. Santos: Mater. Sci. Eng. A, 374
(2004), 351.12) D. G. L. Prakash, B. Prasanna and D. Regener: Comput. Mater. Sci.,
32 (2005), 480.13) K. D. Carlson, Z. P. Lin and C. Beckermann: Metall. Mater. Trans.
B, 38 (2007), 541.14) G. Couturier and M. Rappaz: Symp. on Simulation of Aluminum
Shape Casting Processing - From Alloy Design to Mechanical Prop-erties, Minerals, Metals & Materials Soc., Warrendale, PA, (2006),143.
15) O. Lashkari, L. Yao, S. Cockcroft and D. Maijer: Metall. Mater.Trans. A, 40A (2009), 991.
16) D. M. Stefanescu and A. V. Catalina: Int. J. Cast Metal. Res., 24(2011), 144.
17) I. L. Ferreira, J. F. C. Lins, D. J. Moutinho, L. G. Gomes and A. Garcia:J. Alloy Compd., 503 (2010), 31.
18) L. Yao, S. Cockcroft, J. D. Zhu and C. Reilly: Metall. Mater. Trans.A, 42A (2011), 4137.
19) A. Bahmani, N. Hatami, N. Varahram, P. Davami and M. O. Shabani:Int. J. Adv. Manuf. Technol., 64 (2013), 1313.
20) J. Huang, T. Mori and J. G. Conley: Metall. Mater. Trans. B, 29(1998), 1249.
21) P. D. Lee and J. D. Hunt: Acta Mater., 49 (2001), 1383.22) D. See, R.C. Atwood and P. D. Lee: J. Mater. Sci., 36 (2001), 3423.23) R. C. Atwood and P. D. Lee: Acta Mater., 51 (2003), 5447.24) P. D. Lee, A. Chirazi, R. C. Atwood and W. Wang: Mater. Sci. Eng.
A, 365 (2004), 57.25) S. Y. Dong, S. M. Xiong and B. C. Liu: J. Mater. Sci. Technol., 20
(2004), 23.26) R. Sasikumar, M. J. Walker, S. Savithri and S. Sundarraj: Model.
Simul. Mater. Sci. Eng., 16 (2008), 035009.27) S. Karagadde, S. Sundarraj and P. Dutta: Scr. Mater., 61 (2009), 216.28) H. Meidani and A. Jacot: Acta Mater., 59 (2011), 3032.29) H. Meidani, J. L. Desbiolles, A. Jacot and M. Rappaz: Acta Mater.,
60 (2012), 2518.30) W. Wu, D. K. Sun, T. Dai and M. F. Zhu: Acta Phys. Sin., 61 (2012),
150501.31) H. N. Chen, D. K. Sun, T. Dai and M. F. Zhu: Acta Phys. Sin., 62
(2013), 120502.32) Y. H. Shin and C. P. Hong: ISIJ Int., 42 (2002), 359.33) A. A. Wheeler, W. J. Boettinger and G. B. McFadden: Phys. Rev. A,
45 (1992), 7424.34) S. G. Kim, W. T. Kim and T. Suzuki: Phys. Rev. E, 60 (1999), 7186.35) M. F. Zhu, J. M. Kim and C. P. Hong: ISIJ Int., 41 (2001), 992.36) T. Dai, M. F. Zhu, S. L. Chen, W. S. Cao and C. Y. Hong: Acta
Metall. Sin., 44 (2008), 1175.37) P. A. James: PhD Thesis, McGill University, Montreal, Canada,
(2000).38) A. Mitrasinovic, F. C. R. Hernandez, M. Djurdjevic and J. H.
Sokolowski: Mater. Sci. Eng. A, 428 (2006), 41.39) L. Zhao: PhD Thesis, Southeast University, Nanjing, PR China,
(2012).40) L. Yao, S. Cockcroft, C. Reilly and J. D. Zhu: Metall. Mater. Trans.
A, 43A (2012), 1004.41) P. D. Lee and J. D. Hunt: Acta Mater., 45 (1997), 4155.
Fig. 7. Maximum porosity radius as a function of cooling rate withdifferent initial hydrogen concentrations.