Embed Size (px)
Citation preview
1
Cell-Specific Computational Modeling of the PIM pathway in Acute
Myeloid Leukemia
Dana Silverbush1,2^, Shaun Grosskurth3^, Dennis Wang4, Francoise Powell3, Bertie
Gottgens5, Jonathan Dry3* and Jasmin Fisher2,6*
1Department of Computer Science, Tel-Aviv University, Tel-Aviv, Israel;
2Microsoft Research, Cambridge, UK;
3AstraZeneca Oncology IMED, Waltham MA;
4AstraZeneca Oncology IMED, Cambridge UK;
5Department of Haematology, Cambridge Institute for Medical Research & Wellcome
Trust and MRC Stem Cell Institute, University of Cambridge, UK;
6Department of Biochemistry, University of Cambridge, UK
^ These authors contributed equally to this work
*To whom correspondence should be addressed:
[email protected] and [email protected]
Running title: Cell-Specific Computational Models of Acute Myeloid Leukemia
Disclosure of Potential Conflicts of Interest: The authors have read and understood
the AACR journal policy on reporting conflicts of interest and have no conflicts to
disclose.
on March 27, 2018. © 2016 American Association for Cancer Research.cancerres.aacrjournals.org Downloaded from
Author manuscripts have been peer reviewed and accepted for publication but have not yet been edited. Author Manuscript Published OnlineFirst on December 13, 2016; DOI: 10.1158/0008-5472.CAN-16-1578

2
Abstract
Personalized therapy is a major goal of modern oncology, as patient responses vary
greatly even within a histologically defined cancer subtype. This is especially true in
acute myeloid leukemia (AML), which exhibits striking heterogeneity in molecular
segmentation. When calibrated to cell-specific data, executable network models can
reveal subtle differences in signaling that help explain differences in drug response.
Furthermore, they can suggest drug combinations to increase efficacy and combat
acquired resistance. Here we experimentally tested dynamic proteomic changes and
phenotypic responses in diverse AML cell lines treated with pan-PIM kinase inhibitor
and fms related tyrosine kinase 3 (FLT3) inhibitor as single agents and in
combination. We constructed cell-specific executable models of the signaling axis,
connecting genetic aberrations in FLT3, tyrosine kinase 2 (TYK2), platelet derived
growth factor receptor alpha (PDGFRA), and fibroblast growth factor receptor 1
(FGFR1) to cell proliferation and apoptosis via the PIM and PI3K kinases. The
models capture key differences in signaling that later enabled them to accurately
predict the unique proteomic changes and phenotypic responses of each cell line.
Furthermore, using cell-specific models, we tailored combination therapies to
individual cell lines and successfully validated their efficacy experimentally.
Specifically, we showed that cells mildly responsive to PIM inhibition exhibited
increased sensitivity in combination with PIK3CA inhibition. We also used the model
to infer the origin of PIM resistance engineered through prolonged drug treatment of
MOLM16 cell lines and successfully validated experimentally our prediction that this
resistance can be overcome with AKT1/2 inhibition.
on March 27, 2018. © 2016 American Association for Cancer Research.cancerres.aacrjournals.org Downloaded from
Author manuscripts have been peer reviewed and accepted for publication but have not yet been edited. Author Manuscript Published OnlineFirst on December 13, 2016; DOI: 10.1158/0008-5472.CAN-16-1578
3
Introduction
The potential of personalized medicine is dependent on our ability to translate the
molecular context of patients’ tumors into interpretable clinical outcomes. Successful
steps have been taken to accurately predict tumor progression and response to
treatment from molecular disease markers [1,2]. Using tumor cell line based
compound screening, we can provide robust readouts of cellular responses to multiple
compounds. This information can be used to systematically train computational
models of the molecular signaling pathways contributing to drug sensitivity and
resistance in various cancer settings, and to propose novel drug targets and
combination approaches. Cell line screens have provided some success in explaining
or predicting drug responses by driver gene mutations [2,3,4]; however in many cases
the true mechanism of resistance remains elusive or more complex. Most predictive
methods routinely used today employ correlative statistics or feature-based learning
techniques such as machine learning, while network methods remain scarce despite
their potential for extracting mechanistic insights and actionable biomarkers.
The molecular heterogeneity within cancer types further complicates the prediction of
tumor cell behavior determining a patient's drug response. Multiple somatic
mutations, epigenetic events or otherwise deregulated gene/protein expression may
contribute to driving the disease. This is true in acute myeloid leukemia (AML),
where patients may harbor somatic mutations in a number of potential oncogenes
including FLT3, MLL, TYK2, FGFR1, PDGFRA, IDH1, DNMT3A, impacting
expression of downstream signaling for example through PIM kinases [5,6,7]. FLT3
internal tandem duplications (FLT3-ITD) and PIM over-expression are associated
with poor prognosis in AML patients, motivating the development of small molecule
inhibitors targeting these proteins [8,9]. Incomplete signaling inhibition or the
on March 27, 2018. © 2016 American Association for Cancer Research.cancerres.aacrjournals.org Downloaded from
Author manuscripts have been peer reviewed and accepted for publication but have not yet been edited. Author Manuscript Published OnlineFirst on December 13, 2016; DOI: 10.1158/0008-5472.CAN-16-1578
4
presence of multiple molecular alterations that reduce a tumors dependency on any
one target may result in drug resistance [10,11]. This may be overcome through
rational drug combinations; however optimal approaches are rarely obvious and high
throughput combination screening is complex and expensive with limited success
shown.
With an aging population, the incidence of AML is increasing, with the number of
new cases per year approaching 20,000 in the USA alone. AML therefore presents a
large unmet clinical need, with overall 5-year survival rates remaining at around 25%.
Most patients will respond to initial cytoreductive therapy but a large proportion will
relapse with emergence of drug-resistant clones. Given that bone marrow
transplantation as the only curative therapy is not an option for many patients, a better
understanding of the regulatory pathways causing leukaemic transformation and in
particular the emergence of resistance will be essential to improve treatment outcomes
in AML.
Computational simulations of cancer cell signaling have the potential to overcome
both the limitation of cell line diversity and in-vitro screening throughput.
Computational modeling approaches can be used to capture and integrate knowledge
with molecular and phenotypic data to better understand the genetic and signaling
dependencies determining a drug’s mechanism of action. The models should be
unique to the tumor cell context, include key proteins and their interactions whilst
accounting for influential gene mutations, and would ideally extend to other
molecules involved in cell signaling. Execution of such models should demonstrate
the intracellular signaling activity as it is triggered by different mutations and
different therapeutic modalities, resulting in different cell phenotypes.
on March 27, 2018. © 2016 American Association for Cancer Research.cancerres.aacrjournals.org Downloaded from
Author manuscripts have been peer reviewed and accepted for publication but have not yet been edited. Author Manuscript Published OnlineFirst on December 13, 2016; DOI: 10.1158/0008-5472.CAN-16-1578

5
Computational models based around Boolean networks, pioneered by Kauffman [12]
as a model for genetic regulatory networks, have been demonstrated for interpretation
of large data sets as well as for drug discovery [13,14,15]. In these models,
relationships are represented in a dynamic network with discrete time steps. Signaling
molecules represented by nodes in a network can have two states (hence a Boolean
network) and edges are directed and may be activating or inhibitory, however this can
over-simplify biological signaling where molecules often exist in multiple states with
interactions that are rarely binary. Qualitative Networks (QN) make an extension to
Boolean networks to allow variables to range over larger discrete domains by
replacing Boolean functions with algebraic functions [16] (further details in
supplementary methods). Specifically the graphical tool Bio Model Analyzer (BMA)
[17] (available at http://biomodelanalyzer.org/) has previously been used to
encapsulate chronic myeloid leukemia (CML) cell signaling information from >150
publications in a QN model [18] able to then successfully recapitulate multiple
independent experimental results. Another extention to Boolean networks is provided
by Quantitative Modeling approaches, allowing variables to range over non-discrete
values and so capturing more complex relationships, but only feasible for much
smaller, well-studied systems [19].
In this study, we use QNs to model the protein signaling connecting genetic
aberrations in FLT3, TYK2, PDGFRA or FGFR1 to cell proliferation/apoptosis via
the PIM and PI3K kinases for four AML cell lines, accounting for their unique
genetic and phenotypic diversity. Construction and analysis of the biological QN
model was achieved in BMA [17]. By incorporating cell-specific context switches in
the model for four cell lines, we were able to accurately model response and
resistance to a pan-PIM kinase inhibitor AZD1208 and the FLT3 inhibitor AC220 and
on March 27, 2018. © 2016 American Association for Cancer Research.cancerres.aacrjournals.org Downloaded from
Author manuscripts have been peer reviewed and accepted for publication but have not yet been edited. Author Manuscript Published OnlineFirst on December 13, 2016; DOI: 10.1158/0008-5472.CAN-16-1578

6
validated experimentally our predictions. The model provides a useful tool for AML
research, and the approach offers value to drug discovery and early development.
on March 27, 2018. © 2016 American Association for Cancer Research.cancerres.aacrjournals.org Downloaded from
Author manuscripts have been peer reviewed and accepted for publication but have not yet been edited. Author Manuscript Published OnlineFirst on December 13, 2016; DOI: 10.1158/0008-5472.CAN-16-1578

7
Materials and Methods
Reagents
AZD1208, AZD6244, and AZD5363 were synthesized by AstraZeneca R&D
(Waltham, MA) and diluted in dimethyl sulfoxide (Sigma-Aldrich). AC220 and
GDC0941 were purchased externally.
Cell line treatment
Cell lines (CMK, EOL1, HL60, KASUMI3, KG1A, MOLM13, MOLM16,
MONOMAC6, MV411, NOMO1, OCIAML2, OCIM1, and OCIM2) were purchased
from American Type Culture Collection (ATCC, http://www.atcc.org/) cell bank and
passaged in our laboratory for fewer than 6 months after receipt or
resuscitation. ATCC uses morphology, karyotyping, and PCR based approaches to
confirm the identity of human cell lines and to rule out both intra- and interspecies
contamination.
All cells were cultured and assayed as previously described in [8] and in supplemental
methods.
Growth inhibition calculation
For single agent, GI50 were calculated from the ratio of the 72 hour treatment to 72
hour DMSO control, after subtraction of the Day 0 data from each measurement. The
dose-response data were fitted using Xlfit (Microsoft Excel). For combination,
percent growth inhibition was determined using the Chalice software with values of 0
to 100% indicating anti-proliferation (fewer number of cells than the vehicle control
but greater than or equal to the number of cells at the start of treatment) and values of
101 to 200% indicating cell death (fewer cells than at the start of treatment). Day 0
values were subtracted from the Day 3 treatments. The combination Indexes (CI) and
on March 27, 2018. © 2016 American Association for Cancer Research.cancerres.aacrjournals.org Downloaded from
Author manuscripts have been peer reviewed and accepted for publication but have not yet been edited. Author Manuscript Published OnlineFirst on December 13, 2016; DOI: 10.1158/0008-5472.CAN-16-1578
8
Synergy scores were determined using the software program Chalice (Zalicus) and CI
determination was made at the ED50 value. Synergy was determined by the Loewe
additivity model.
Full methods for gene expression microarray; whole exome DNA sequencing; and
Theranositcs proteomics are in the Supplemental Methods, brief description follows.
Gene expression microarray
Cell line lysate was generated from logarithmic growing CMK, EOL1, HL60,
KASUMI3, KG1A, MOLM13, MOLM16, MONOMAC6, MV411, NOMO1,
OCIAML2, OCIM1, and OCIM2 cell lines. Lysate was sent to Expression Analysis
(http://www.expressionanalysis.com/) for gene expression analysis on Affymetrix
Human Genome U133 Plus 2.0 Array. Expression results were fRMA normalized,
log2 transformed, and expression was averaged by gene symbol across probesets.
Whole exome DNA sequencing
Cell lines lysate was generated from logarithmic growing CMK, EOL1, HL60,
KASUMI3, KG1A, MOLM13, MOLM16, MONOMAC6, MV411, NOMO1,
OCIAML2, OCIM1, and OCIM2. Lysate was sent to Expression Analysis
(http://www.expressionanalysis.com/) for whole exome DNA sequencing, and
processed with the BCBio pipeline (https://bcbio-nextgen.readthedocs.org). Paired
analysis of the parental and resistant cell lines was performed to using FreeBayes
[20], MuTect [21], and VarDict (GitHub) to call resistance specific mutations.
Theranostics Health reverse phased protein array
Cells were treated with AZD1208 or AC220 as single agent or in combination for 3 or
24 hours. Lysate was prepared and shipped to Theranostics Health (Rockville,
Maryland) for reverse phased protein array experiments.
on March 27, 2018. © 2016 American Association for Cancer Research.cancerres.aacrjournals.org Downloaded from
Author manuscripts have been peer reviewed and accepted for publication but have not yet been edited. Author Manuscript Published OnlineFirst on December 13, 2016; DOI: 10.1158/0008-5472.CAN-16-1578
9
Protein Array data transformation for executable network model construction
The relative linear log2 RPPA values were categorized for use in executable network
modelling (Fig S1) on a 5 point scale from 0-4 fitted to the distribution of the values
(Table S1).
Protein western blots
Cells were treated with AZD1208, AZ5363, or AC220 as single agent, combination,
or resistance as experimentally described. Whole cell extracts were fractionated by
SDS-PAGE and transferred to a nitrocellulose membrane in transfer buffer (500mM
Glycine, 50mM TrisHCl, 0.01% SDS, 10% methanol) buffer at 20Volts for 90
minutes using a semi-dry transfer apparatus according to the manufacturer’s protocols
(Invitrogen). The membranes are blocked with 10% nonfat milk in TBS-T (10 mM
Tris, pH 8.0, 150 mM NaCl, 0.5% Tween 20) for 1 hour and washed three times
with TBS-T and exposed to primary antibodies in 5% milk in TBS-T against
pPRAS40 (CST 2997), p4EBP1 Ser 65 (CST 9451), pBAD (CST 9296), pp70S6
(CST 9206), pS6 (CST 4858), pERK (CST 9106), pelF4B (CST 8151), pAKT(CST
4058), α-tubulin (CST 2144) or β-actin (CST 4970) at 4 °C O/N. Membranes are
washed three times for 10 minutes and incubated with a 1:10000 dilution of
horseradish peroxidase-conjugated anti-mouse or anti-rabbit antibodies (CST 7074)
for 1 hour at room temperature. After washing the membranes three times for ten
minutes, signals were visualized using the ECL system (Thermo Scientific).
PhosphoScan mass-spectrometry
on March 27, 2018. © 2016 American Association for Cancer Research.cancerres.aacrjournals.org Downloaded from
Author manuscripts have been peer reviewed and accepted for publication but have not yet been edited. Author Manuscript Published OnlineFirst on December 13, 2016; DOI: 10.1158/0008-5472.CAN-16-1578
10
We confirmed the robusteness of our finding for MOLM16 cells treated with 2 uM
AZD1208 for 3 hours (Table S2) by applying a LC-MS/MS phosphorylation
proteomic approach. Additional details are provided in the Supplementary Note.
Targeted treatment of AML cell lines
We investigated phenotypic and cell signaling responses by reverse-phased protein
arrays (RPPA). Since the PIM gene family is often over-expressed [22,23,24] and
FLT3-ITD’s are prevalent in AML [7], we treated the cells with the pan-PIM kinase
inhibitor AZD1208 and the potent selective FLT3 inhibitor AC220 (Qizartinib) as
monotherapy and in combination [25] and compared AML cell lines were treated with
DMSO, 1uM AZD1208, 6nM AC220, or the respective combination, for 3 or 24
hours. Lysates were generated, protein values were assessed by RPPA and quadrant
median normalized (QMN) protein levels calculated (Table S3). Statistically
significant total protein and phosphorylation changes were determined by log2 QMN
differences greater than or equal to 0.5 and Wilcoxon Rank Sum Tests p-values less
than or equal to 0.1 (Table S4).
on March 27, 2018. © 2016 American Association for Cancer Research.cancerres.aacrjournals.org Downloaded from
Author manuscripts have been peer reviewed and accepted for publication but have not yet been edited. Author Manuscript Published OnlineFirst on December 13, 2016; DOI: 10.1158/0008-5472.CAN-16-1578

11
Results
AML cell lines show differential sensitivity to PIM inhibition
To identify potential genetic alterations associated with sensitivity to the pan-PIM
kinase inhibitor AZD1208, we surveyed gene variants by whole exome DNA
sequencing (Table S5) and prioritized by AML disease relevance [7]. Although cells
sensitive to AZD1208 do harbor AML relevant PDGFRA, FGFR1, FLT3, and MLL
genetic variants, only a small number of cell lines harbor the same variant, thereby
failing to reach statistical significance in association to drug response (Fig 1A). Basal
cell line PIM1 mRNA expression tends to be higher in sensitive lines, as previously
shown at the protein level [8], underlying the importance of compound target
expression alongside the interplay with genetic alterations for sensitivity. However
cells harboring pathway relevant genetic alterations or over-expressing PIM exhibit
varied response to treatment, calling for a deeper examination of the cell signaling
relating genotype to phenotype to provide a better understanding of the molecular
dependencies underlying PIM inhibitor sensitivity in AML cell lines.
Cell type-specific differences in PIM pathway signaling in response to treatment
Given the wide variability of response to therapeutic agents across AML cell lines, we
explored the differences in phospho-protein signaling downstream of PIM for AML
cell lines MOLM16, MV411, EOL1 and KG1A. Reverse phase protein array (RPPA)
measurements taken 24 hours post AZD1208 treatment reproduced published findings
[8] of reduced BAD phosphorylation in the MOLM16 cell line, and reduced S6
pS235/236 in EOL1 (Fig 1B). To estimate response of cell lines, growth inhibition
was quantified according to the number of viable cells after culturing with different
concentrations of AZD1208 and FLT3 inhibitor, AC220, in combination (Fig 1C, Fig
S2). Directional de-phosphorylation signaling trends seen in RPPA for BRAF pS445,
on March 27, 2018. © 2016 American Association for Cancer Research.cancerres.aacrjournals.org Downloaded from
Author manuscripts have been peer reviewed and accepted for publication but have not yet been edited. Author Manuscript Published OnlineFirst on December 13, 2016; DOI: 10.1158/0008-5472.CAN-16-1578
12
EIF4B pS406, MTOR pS2481 and global BAD phosphorylation were confirmed by
PhosphoScan mass-spectrometry in MOLM16 cells after 3 hour treatment with
AZD1208 (Table S6).
Building a generalized model of PIM signaling in AML
In order to model the observed genotypic and phenotypic differences between the
AML cell lines, we proposed a workflow for developing a cell-specific context
network model using the BMA tool from cell line molecular information (Fig 2). We
generated an initial generalized model from the manual curation of 68 publications
(Table S7) for AML cell line. The initial model contains a canonical set of 64
interactions among 32 interacting proteins connected to 2 cell phenotypes/behaviors
of apoptosis and cell proliferation (http://www.bioc.cam.ac.uk/fisher/aml -
GeneralModel.json, Table S8). All values at nodes range from 0 to 4 to represent the
phosphorylation activity from the transformed RPPA data, with 0 representing low to
no activity and 4 representing abnormal over activity. The cellular behavior outcome
for each disease state is reflected by the two terminal downstream nodes, which model
the outcome for cellular abnormal proliferation and apoptosis rates. The generalized
model of AML signaling was able to capture only partial abnormal cell behavior for
untreated cells, capturing the abnormal low apoptosis levels for both MOLM16 and
MV411, and showing an increase in proliferation, yet not capturing the magnitude of
the increase. In addition, known perturbations such as simulating inhibition of PIMs
in the model, showed the expected trend line of decreased proliferation, yet did not
exhibit the expected effect on apoptosis levels.
on March 27, 2018. © 2016 American Association for Cancer Research.cancerres.aacrjournals.org Downloaded from
Author manuscripts have been peer reviewed and accepted for publication but have not yet been edited. Author Manuscript Published OnlineFirst on December 13, 2016; DOI: 10.1158/0008-5472.CAN-16-1578
13
Introducing cell-specific context in QN models
We incorporated multiple gene mutation switches
(http://www.bioc.cam.ac.uk/fisher/aml - CellSpecificAML.json, Table 1) to construct
cell-specific context model. We iteratively refined the target function for each internal
node to reflect the levels of phosphorylation activity as measured by the transformed
RPPA data for each cell line as well as the qualitative activity reported in the
literature in accordance to gene mutations. A cell-specific context in the model is
simulated by setting the switches for the driver mutations found in that cell to 1, while
all other switches to mutations that were assessed as non-driver are set to 0 (Table
S9). As a result of different set of mutations “turned on” the protein activity exhibited
by the model will differ between cell lines (Table S10). Additional details on data
processing and model construction are in the Supplementary notes.
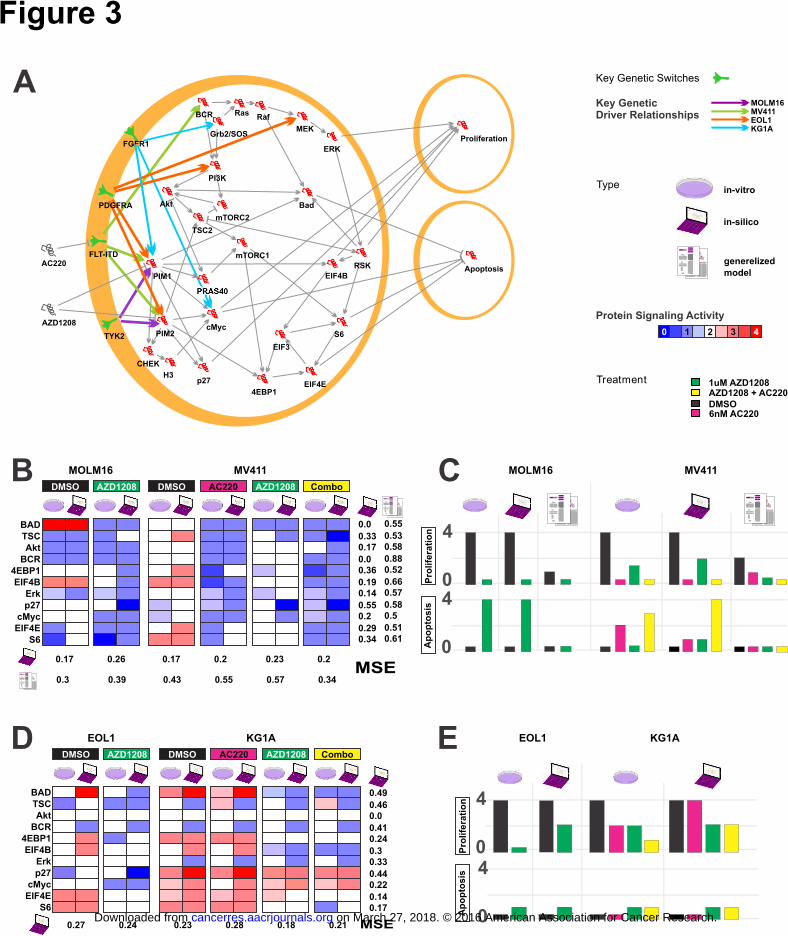
Excutable QN model validated by cell type-specific signaling behaviour
The executable QN model (Fig 3A) was built on the RPPA and growth inhibition of
MOLM16 and MV411 cell lines, harboring TYK2 mutation and FLT3-ITD
respectively (Fig 1B). For each cell line across each treatment (Fig 3B), the mean
square error (MSE) observed between the transformed RPPA values and modeled
signaling activity ranged from 0.15 to 0.21 and median of 0.17 (0.3 to 0.57 in the
generalized model, median of 0.41), with the lowest seen for MV411 cell line treated
with AZD1208 + AC220 combination and the highest for the MOLM16 cell line
treated with AZD1208. Meanwhile across each protein, the MSE observed between
the transformed RPPA values and each protein signaling activity ranged from 0 to
0.36 and median of 0.29 (0.41 to 0.88 in the generalized model, median of 0.58), with
the lowest seen for BAD and BCR and the highest seen for 4EBP1.
on March 27, 2018. © 2016 American Association for Cancer Research.cancerres.aacrjournals.org Downloaded from
Author manuscripts have been peer reviewed and accepted for publication but have not yet been edited. Author Manuscript Published OnlineFirst on December 13, 2016; DOI: 10.1158/0008-5472.CAN-16-1578
14
Equally as important, the cell-specific context model performed well in predicting
cellular response as measured both by growth inhibition and markers of reduced
proliferation and increased apoptosis (Fig 1B-C). The model accurately predicted (Fig
3C) the reduction in proliferation as a result of treatment with AZD1208 single agent,
AC220 single agent, and drug combinations in MV411 cells. Although under
predicting the magnitude of increase in apoptosis for AC220 single agent, the model
accurately predicted the directional responses with increases in apoptosis for
AZD1208 single agent, AC220 single agent, and combination treatments in MV411
cells.
In addition to predicting differential phenoptypic responses in each cell line, the
model highlights key signaling events that may underlie the mechanism for each. We
validated the robustness of events suggested for MOLM16 using mass-spectrometry.
Most importantly, the mass-spectrometry corroborated the decreased EIF4B pS406
phosphorylation after AZD1208 treatment, contributing to decrease in proliferation,
as well as the decrease in BAD pS112 and pS155 after AZD1208 treatment, which
increases apoptosis. A key differentiating feature of MOLM16 cell lines is the lack of
hyperactivity from the MAPK (Ras Raf MEK ERK) and AKT-mTORC1 pathways
post AZD1208 treatment, supported by dephosphorylation at downstream BRAF
pS445 and MTOR pS2481 in the mass-spectrometry data.
Testing the adaptability of the model to new cell-specific contexts, we "turned on" the
genetic alterations FIP1L1-PDGFRA fusion and FGFR1 fusion, matching EOL1 and
KG1A cell lines respectively. The apoptosis range was expanded to span the full
dynamic range seen in these cell lines, yet no further refinement of the model was
performed. The model reflected the cellular signaling changes observed in RPPA data
(Fig 3D) where the MSE ranged from 0.18 to 0.28 with the lowest seen for EOL1 cell
on March 27, 2018. © 2016 American Association for Cancer Research.cancerres.aacrjournals.org Downloaded from
Author manuscripts have been peer reviewed and accepted for publication but have not yet been edited. Author Manuscript Published OnlineFirst on December 13, 2016; DOI: 10.1158/0008-5472.CAN-16-1578

15
line treated with single agent AZD1208 and the highest for the KG1A cell line treated
in combination with AC220. Across each protein, the MSE observed between each
protein signaling activity and the transformed RPPA values ranged from 0 to 0.58,
with the lowest seen for AKT and the highest seen for p27. The model also performed
well in predicting cellular response (Fig 3E). For the proliferation and apoptosis cell
behaviors, the model accurately predicted the cellular responses seen in KG1A for
AZD1208, AC220, and combination treatments, as well as the cell behaviors for
EOL1 with AZD1208 treatment (AC220 was not tested for EOL1).
The model also replicated variations in sensitivity, such as EOL1 reacting with
reduced apoptosis to PIM inhibition when compared to MOLM16.
Novel signaling components proposed through model refinement
A by-product of refining the QN model to capture cell type-specific signaling is a
graphical and descriptive representation of cell specific signaling dynamics between
proteins in the network (Fig 3A). By simulating the QN model, we were able to test
our assumptions regarding the signaling dependencies between proteins, as described
by the target functions (Table 1). For instance, despite FLT3-ITD being upstream of
PIM1, the effect revealed by the iterative optimization of the model was less than
other interacting proteins, also suggested by the RPPA measurements (Fig 1A)
leading to BAD over-activity in MOLM16 but not MV411. The target function of
AKT shows that it is dependent on the activity of the FLT3-ITD and FGFR1 fusion,
reflecting the accumulation of evidences for AKT/mTOR pathway role in AML
(suggested previously by [8]). The target function of S6 reflects the dominant over
activation of it via AKT-mTOR pathway, additive to the activity of MAPK pathway,
and leading to anti-apoptotic cell behavior of MV411 and KG1A. At the same time
the target function of BAD accumulates with activity of MAPK pathway and of PIM1
on March 27, 2018. © 2016 American Association for Cancer Research.cancerres.aacrjournals.org Downloaded from
Author manuscripts have been peer reviewed and accepted for publication but have not yet been edited. Author Manuscript Published OnlineFirst on December 13, 2016; DOI: 10.1158/0008-5472.CAN-16-1578

16
direct phosphorylation of all three sites of BAD [26] leading to the anti-apoptotic
behavior observed in MOLM16.
In silico virtual experimentation with AML cell models can replicate
independently reported data
As a first independent test of the AML cell-specific model, we assessed its ability to
replicate in-silico a sample of protein and phenotypic cell line responses to drug
treatment reported in the literature but not used as part of model construction or
refinement. We replicated each in-vitro experiment by turning on a respected set of
mutations and adding the new examined inhibitor to the model, then observing the
predicted protein expression. All eight protein changes were successfully predicted
(Table S11). The model successfully predicted cell specific response to compounds
including: failure of a MEK inhibitor to induce apoptosis in EOL1 [27]; insensitivity
of KG1A to the combination of AKT, PDK1 and FLT3 inhibitors [28]; and the
growth inhibition induced on EOL1 by combining PIM and AKT inhibition [11]. The
decrease in cell proliferation of MV411 in response to mTORC [29] inhibitor was not
recaptulated; however the authors of [29] attribute the decrease in proliferation to
eIF4E decreased expression which was accurately replicated by the model.
on March 27, 2018. © 2016 American Association for Cancer Research.cancerres.aacrjournals.org Downloaded from
Author manuscripts have been peer reviewed and accepted for publication but have not yet been edited. Author Manuscript Published OnlineFirst on December 13, 2016; DOI: 10.1158/0008-5472.CAN-16-1578
17
AML cell-specific model predicts synergistic drug combinations with the PIM
inhibitor
To assess the potential to prioritize synergistic combinations through in silico
hypothesis testing with these models we assessed the PIM inhibitor AZD1208, the
AKT inhibitor AZD5363, MEK inhibitor selumetinib (AZD6244, ARRY-142886),
FLT3 inhibitor AC220, and PI3K inhibitor AZ2426 across the 4 AML cell lines (Fig
4A, Fig S3) also summarized in Table S12. For each cell line we simulated inhibiton
of the drug targets first as single agents and then as combinations with PIM inhibition.
We validated each combination in each cell line experimentaly across a dose range for
each agent (Fig 4B).
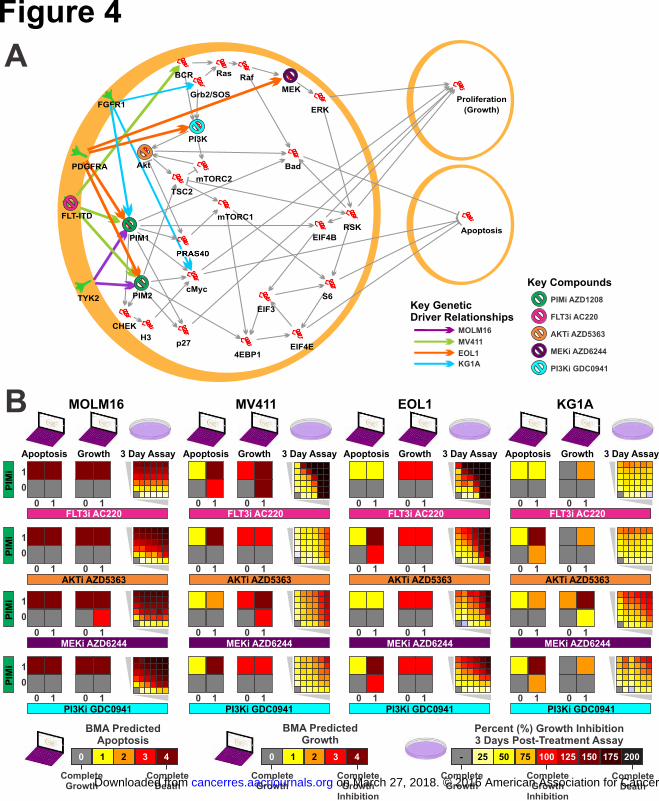
The MOLM16 cell line was correctly predicted to be hyper-sensitive to the PIM
inhibitor resulting in almost complete cell kill, and no additional effect was predicted
in combination with other inhibitors.
In contrast, the MV411 context model, which habors a FLT3-ITD, correctly predicted
a strong synergy between AZD1208 and AC220 combination attributed to apoptotic
effect, evident even at lower dosage of combined treatments. Very weak synergy with
mild apoptosis was correctly predicted in MV411 in combination with either MEK or
PI3K inhibition.
Meanwhile, EOL1 was correctly predicted to gain apoptotic synergic effect with the
PIM and AKT inhibitor combination, as well as the PIM and PI3K inhibitor
combination. Surprisingly, and the only synergy of the 16 combinations not predicted
by the model, EOL1 also exibited a synergic effect with the AZD1208 and AC220
combination. AC220 efficacy has previously only been reported in FLT3 driven
tumors, however these data suggest efficacy from AC220 in PDGFRA mutated
on March 27, 2018. © 2016 American Association for Cancer Research.cancerres.aacrjournals.org Downloaded from
Author manuscripts have been peer reviewed and accepted for publication but have not yet been edited. Author Manuscript Published OnlineFirst on December 13, 2016; DOI: 10.1158/0008-5472.CAN-16-1578
18
tumors potetnially through inhibition of PDGFRA driven AKT/PI3K and MAPK
signaling.
Finally, in the KG1A model, which harbors an activating FGFR1 fusion, we did not
see a co-occurrence of high apoptosis and high growth inhibition for any of the
combination treatments, validated as well by the in-vitro assays. Our model suggests
that the persistant insensitivity of KG1A may be derived by the high levels of cMyc,
which is not directly targeted by any of the combinations.
Executable QN model identify alternative susceptibilities in AZD1208 resistant
cells
Four separate populations of MOLM16 cells were made resistant to PIM inhibition by
growth in the presence of increasing doses of the compound over a four month period
until resulting cell populations were able to maintain growth at 1uM AZD1208. While
the parental MOLM16 cell has a 50nM GI50 in a 3 day MTS proliferation assay, all
four resistant populations had GI50s greater than 9uM to AZD1208 over the same 3
day growth period (Fig S4A). RPPA measurements were taken for the parental and
resistant cell lines.
We predicted candidate genetic causes of resistance by iteratively perturbing all
individual and pairs of nodes in the parental MOLM16 model, and choosing those
leading to similar signaling activity and phenotype as observed in the resistant
populations, quantified by lower MSE (Fig S4B, S4C). This resulted in four different
resistant contexts, one for each resistant cell population (Fig 5A). All contexts show
over-activation through RAS/PI3K as well as AKT/MTOR signaling, supported by
RPPA (Fig S4B). Interestingly, the different resistance contexts differ in their strength
of altered signaling where resistant cell population R1 has a higher activity for both
on March 27, 2018. © 2016 American Association for Cancer Research.cancerres.aacrjournals.org Downloaded from
Author manuscripts have been peer reviewed and accepted for publication but have not yet been edited. Author Manuscript Published OnlineFirst on December 13, 2016; DOI: 10.1158/0008-5472.CAN-16-1578
19
pathways and resistant cell population R3 has lower activity for the AKT pathway.
The predicted and observed pathway signaling suggests increased signaling activity
through 4EBP1, EIF4B, S6, and BAD contributing to resistance. In particular it
highlights AKT-S6 pathway as a major cause for the decreased apoptosis compared to
MOLM16 parental when treated with AZD1208.
Whole exome DNA-seq was performed to identify potential protein altering genetic
variants that could be driving the AZD1208 resistance. All variant calls with
significant differences from the parental line (Table S13) were further parsed to
highlight genes encoding proteins that have BIOGRID interactions (Table S14) to the
RAS/PI3K and/or the AKT/MTOR signaling pathways (Fig 5B).
Using the four resistant MOLM16 context models, we predicted possible treatments
to overcome resistance by simulating inhibition at each point through systematic
addition of an inhibitor node to the network. In line with signalling changes,
introduction of an AKT inhibitor AZD5363 to the resistant populations was predicted
to overcome the AZD1208 resistance by blocking the abnormal PRAS40, 4EBP1 and
S6 activity (Fig 5D). To test this prediction, parental MOLM16 and AZD1208
resistant populations were treated with and without 1uM AZD5363 for 1 hour. The
resistant populations responded to AKT inhibition with AZD5363 by decreased
pS235/235 S6 ribosomal protein and pT246 PRAS40 (Fig 5D), providing strong
evidence for inhibition of AKT/MTOR signaling. The decrease in AKT/MTOR
signaling was accompanied with an increase in cleaved PARP, indicating increased
apoptosis and highlighting the dependency on this signaling pathway during
AZD1208 resistance in MOLM16 cells.
on March 27, 2018. © 2016 American Association for Cancer Research.cancerres.aacrjournals.org Downloaded from
Author manuscripts have been peer reviewed and accepted for publication but have not yet been edited. Author Manuscript Published OnlineFirst on December 13, 2016; DOI: 10.1158/0008-5472.CAN-16-1578

20
Alternative qualitative modeling techniques
Qualitative models provide coarse-grained descriptions useful for systems whose
mechanistic underpinnings remain incomplete. The range of qualitative modeling
approaches provide two major types of simplifications: Boolean models relax the
activity of biological entities to binary (ON or OFF), alternatively the relation of
entities may be relaxed to simple logic operators (AND, OR, NOT). We explored the
use of alternative approaches and robustness of findings by building a Boolean model
and an AND/OR model via the same pipeline. For single agent PIM-inhibitor
treatment the Boolean model was able to reasonably predict the proliferation and
apoptotic responses in MOLM16 and KG1a, partially predicted proliferation response
in EOL1, but poorly predicted responses in MV411 (Fig S5). The MV411 cell line
was correctly predicted to response well to FLT3 inhibition. The model was not,
however, able to predict treatment combination synergies (Fig S5). Since the Boolean
model is simpler and easier to construct than a qualitative model it offers a useful tool
for investigating single agent treatment in larger networks.
The AND/OR gated model recaptured most of the responses to single treatments, as
well as synergistic combinations, revalidating the predictions made by our model (Fig
S6). The synergistic response of KG1a to the combination of AZD1208 and AC220
was the only response not recaptured. This phenotype is likely derived by S6 additive
activity from the MAPK pathway and AKT- mTORC1, which cannot be accurately
described using AND/OR gates. AND/OR models may be generated by automated
tools [30], and can serve well as an initial model scaffold. However more complex
relationships such as those in our model between BAD, S6, 4EBP1, TSC2 and EIF4B
in AML need to be further refined.
on March 27, 2018. © 2016 American Association for Cancer Research.cancerres.aacrjournals.org Downloaded from
Author manuscripts have been peer reviewed and accepted for publication but have not yet been edited. Author Manuscript Published OnlineFirst on December 13, 2016; DOI: 10.1158/0008-5472.CAN-16-1578

21
Discussion
The success of personalizing treatments for AML patients by tailoring to respective
genetic alterations that characterize cancer subtypes has so far been limited.
Moreover, drug responses seen in genetically matched patients or representative cell
lines show considerable diversity [10,7]. By integrating both genomic and baseline
proteomic data from AML cell lines with known tumor-driving genetic events we
generated an AML network model capturing cell-context-specific signaling in the
PIM kinase pathway. We developed a workflow methodology for constructing a
network model with cell-specific context switches, which focuses on iterative
refinement of the target function to reflect literature and experimental evidences.
Users may also consider applying automated tools to decipher the target functions,
such as CellNOpt-cFL tool developed by Morris et al. [30], and follow by manual
refinement of the target functions.
The resulting cell-specific model captures cell specific signaling and response to
cancer therapeutics, and provide virtual cell line models in which to test hypotheses
for tailored therapy in silico. The cell-specific model significantly reduced the
prediction error for both the baseline training data and on-treatment changes in protein
expression compared to the generalized model. This is unsurprising since a
generalized AML model insufficiently explains the heterogeneity in the mutational
landscape and protein-signaling dynamics reported across different cell lines, for
example a lack of signaling through AKT unique to cells with mutations in TYK2.
The cell-specific model accurately and directly recapitulated published experimental
results for reported changes in expression in all 8 cases, and 9 out of 10 responses in
cell behavior. These results are particularly remarkable when considering the potential
on March 27, 2018. © 2016 American Association for Cancer Research.cancerres.aacrjournals.org Downloaded from
Author manuscripts have been peer reviewed and accepted for publication but have not yet been edited. Author Manuscript Published OnlineFirst on December 13, 2016; DOI: 10.1158/0008-5472.CAN-16-1578
22
variability in signaling and phenotypic output over time, and the focus of these
models on the cells steady state reflected by model stability.
We progressed to experimentally validate predictions made with the cell-specific
model. The MV411 context model captured the signaling impact of the FLT3-ITD to
correctly predict induction of apoptosis after treatment with PIM and PI3K inhibitors,
and no effect with PI3K inhibitor alone [11]. For the cell line KG1A we identified
contribution of high cMyc activity to cell proliferation, and correctly predicted
insensitivity to inhibition of targets thought to be elevated by the FGFR fusion [28]
including AKT, PDK1 and FLT3. The EOL1 context model identified previously
unreported combination synergy between PIM and PI3KCA inhibitors, validated
through increased tumor growth inhibition. This could lead to patients treated with
lower doses of the inhibitors if the same efficacy is achieved by combinations, and
thereby, reducing the risk of toxicity.
Model discrepancies highlight potential gaps in the captured network knowledge, and
hypotheses that warrant further investigation. For example, our model fails to capture
BCR and ERK overexpression following treatment in EOL1 and KG1a cell lines.
This cannot be resolved through simple optimization of the current network,
suggesting a potential gap in our knowledge of how the MAPK pathway influences
these mechanisms (Fig 3D). We found that Siendones et al. [31] had also previously
hypothesized the coexistence of transduction signal event, triggering the MAPK
pathway independent of the FLT-ITD event, and coupled with poor response to FLT3
inhibitor. Investigating this discrepancy may shed new light on the resistance
mechanism of these patients to FLT inhibitors.
Furthermore, using the MOLM16 context model we were able to systematically
explore genetic changes that may render the cell resistant to PIM inhibition. Exome
on March 27, 2018. © 2016 American Association for Cancer Research.cancerres.aacrjournals.org Downloaded from
Author manuscripts have been peer reviewed and accepted for publication but have not yet been edited. Author Manuscript Published OnlineFirst on December 13, 2016; DOI: 10.1158/0008-5472.CAN-16-1578

23
sequencing and subsequent drug combination treatment of MOLM16 cell populations
with acquired resistance to AZD1208 confirmed our predicted mechanistic
dependency on AKT signaling and AKT inhibition as a second line therapy to
overcome resistance.
By accurately predicting drug responses and combination synergies, and providing the
mechanistic insight on the proteins driving the response, we highlight the ability of
simulated models and virtual experimentation to prioritize effective therapies
accompanied with associated predictive and dynamic biomarkers. Successful drug
combinations could significantly augment therapy options for AML patients by
overcoming innate and acquired resistance to drugs. Simulated qualitative models
potentially offer a virtual platform to screen, discover and prioritize drug
combinations in silico, focusing experimental approaches to validation.
Comprehensive genetic diagnosis using targeted exome sequencing is already
entering the clinic in major teaching hospitals. When coupled with emerging mass
cytometry analysis (PMID: 26095251), all the biological information to build patient
specific qualitative networks models may soon be available from frontline diagnostics
data.
Taken together, the complexity of signaling pathways and the large number of
resistance mechanisms mean that executable cellular models which are easily and
quickly interpretable, like the ones we have presented here, are key for pinpointing
potential combination therapies for different cancer types and subtypes. Furthermore,
scaling these executable models to simulate patient-specific cancers paves the way for
improved personalized treatments and enhanced precision medicine choices.
on March 27, 2018. © 2016 American Association for Cancer Research.cancerres.aacrjournals.org Downloaded from
Author manuscripts have been peer reviewed and accepted for publication but have not yet been edited. Author Manuscript Published OnlineFirst on December 13, 2016; DOI: 10.1158/0008-5472.CAN-16-1578

24
Acknowledgments
We would like to thank Dennis Huszar and Kirsten McEachern for their knowledge
surrounding the PIM signaling network, Mika Ahdesmaki for performance of the
DNA-seq alignment and variant calling, and Greg O’Connor for generation of the
AZD1208 resistant MOLM16 cells. A central element of this study relied on single
agents and combination cell line treatment; in particular we would like to thank
Suping Wang and Erica Keaton for AZD1208 combination screen data, Keith Dillman
for sample preparation and Western validation for FLT3 combinations & resistant cell
lines; all from AstraZeneca. We would also like to thank Bloodwise for supporting
BG, and the Israeli ministry of science, technology and space and Edmond J. Safra
Center for Bioinformatics at Tel-Aviv University for supporting DS.
on March 27, 2018. © 2016 American Association for Cancer Research.cancerres.aacrjournals.org Downloaded from
Author manuscripts have been peer reviewed and accepted for publication but have not yet been edited. Author Manuscript Published OnlineFirst on December 13, 2016; DOI: 10.1158/0008-5472.CAN-16-1578
25
References
[1] B Majumder, U Baraneedharan, S Thiyagarajan, P Radhakrishnan, H
Narasimhan, M Dhandapani, N Brijwani, D D Pinto, A Prasath, B U Shanthappa,
A Thayakumar, R Surendran, G K Babu, A M Shenoy, M A Kuriakose, G
Bergth, P Horowitz , "Predicting clinical response to anticancer drugs using an ex
vivo platform that captures tumour heterogeneity," Nature Communications, vol.
6, p. ncomms7169, 2015.
[2] JC Costello,LM Heiser,E Georgii,M Gönen,MP Menden,NJ Wang,M Bansal,M
Ammad-ud-din,P Hintsanen,SA Khan,JP Mpindi,O Kallioniemi,A Honkela,T
Aittokallio,K Wennerberg,NCI DREAM Community,J Collins,D Gallahan,D
Sing,JS Rodriguez,S KaKaski,JW Gray,G Stolovitzky , "A community effort to
assess and improve drug sensitivity prediction algorithms," Nature
biotechnology, pp. 32(12):1202-12., 2014.
[3] P Geeleher, NJ Cox, RS Huang. , "Clinical drug response can be predicted using
baseline gene expression levels and in vitro drug sensitivity in cell lines.,"
Genome Biology, pp. 15(3):R47., 2014.
[4] B Yadav, T Pemovska, A Szwajda, E Kulesskiy, M Kontro, R Karjalainen, MM
Majumder, D Malani, A Murumägi, J Knowles, K Porkka, C Heckman, O
Kallioniemi, K Wennerberg, T Aittokallio. , "Quantitative scoring of differential
drug sensitivity for individually optimized anticancer therapies.," Scientific
Reports, pp. 4:5193., 2014.
[5] G Marcucci, T Haferlach, H Döhner. , "Molecular genetics of adult acute
myeloid leukemia: prognostic and therapeutic implications.," Journal of clinical
oncology, pp. 29(5):475-86., 2011.
on March 27, 2018. © 2016 American Association for Cancer Research.cancerres.aacrjournals.org Downloaded from
Author manuscripts have been peer reviewed and accepted for publication but have not yet been edited. Author Manuscript Published OnlineFirst on December 13, 2016; DOI: 10.1158/0008-5472.CAN-16-1578

26
[6] H Wang, H Hu, Q Zhang, Y Yang, Y Li, Y Hu, X Ruan, Y Yang, Z Zhang, C
Shu, J Yan, EK Wakeland, Q Li, S Hu, X Fang. , "Dynamic transcriptomes of
human myeloid leukemia cells.," Genomics., pp. 102(4):250-6., 2013.
[7] Cancer Genome Atlas Research Network TCGA, "Genomic and epigenomic
landscapes of adult de novo acute myeloid leukemia.," The New England journal
of medicine, pp. 30;368(22):2059-74, 2013.
[8] EK Keeton, K McEachern, KS Dillman, S Palakurthi, Y Cao, MR Grondine, S
Kaur, S Wang, Y Chen, A Wu, M Shen, FD Gibbons, ML Lamb, X Zheng, RM
Stone, DJ Deangelo, LC Platanias, LA Dakin, H Chen, PD Lyne, D Huszar. ,
"AZD1208, a potent and selective pan-Pim kinase inhibitor, demonstrates
efficacy in preclinical models of acute myeloid leukemia.," Blood, pp.
123(6):905-13, 2014.
[9] KM Kampa-Schittenhelm, MC Heinrich, F Akmut, H Döhner, K Döhner, MM
Schittenhelm. , "Quizartinib (AC220) is a potent second generation class III
tyrosine kinase inhibitor that displays a distinct inhibition profile against mutant-
FLT3, -PDGFRA and -KIT isoforms.," Mol Cancer., pp. 12:19., 2013.
[10] JM Klco, DH Spencer, CA Miller, M Griffith, TL Lamprecht, M O'Laughlin, C
Fronick, V Magrini, RT Demeter, RS Fulton, WC Eades, DC Link, TA Graubert,
MJ Walter, ER Mardis, JF Dipersio, RK Wilson, TJ Ley. , "Functional
heterogeneity of genetically defined subclones in acute myeloid leukemia.,"
Cancer Cell., pp. 25(3):379-92., 2014.
[11] K Meja, C Stengel, R Sellar, D Huszar, BR Davies, RE Gale, DC Linch, A
Khwaja. , "PIM and AKT kinase inhibitors show synergistic cytotoxicity in acute
myeloid leukaemia that is associated with convergence on mTOR and MCL1
on March 27, 2018. © 2016 American Association for Cancer Research.cancerres.aacrjournals.org Downloaded from
Author manuscripts have been peer reviewed and accepted for publication but have not yet been edited. Author Manuscript Published OnlineFirst on December 13, 2016; DOI: 10.1158/0008-5472.CAN-16-1578

27
pathways.," British journal of haematology, pp. 167(1):69-79., 2014.
[12] S Kauffman, "Homeostasis and Differentiation in Random Genetic Control
Networks," Nature, pp. 177-178, 1969.
[13] S Kauffman, "Metabolic stability and epigenesis in randomly constructed genetic
nets," Journal of Theoretical Biology, pp. 437-467, 1969.
[14] S Huang, "Gene expression profiling, genetic networks, and cellular states: an
integrating concept for tumorigenesis and drug discovery," Journal of molecular
medicine, pp. 469-480, 1999.
[15] L Sanchez, D Thieffry. , "A logical analysis of the Drosophila gap-gene system,"
Journal of theoretical biology, pp. 115-141, 2001.
[16] MA Schaub, TA Henzinger, J Fisher. , "Qualitative networks: a symbolic
approach to analyze biological signaling networks," BMC Systems Biology, p. 4+,
2007.
[17] D Benque, S Bourton, C Cockerton, B Cook, J Fisher, S Ishtiaq, N Piterman, A
Taylor, M Y Vardi , "Bma: Visual Tool for Modeling and Analyzing Biological
Networks," Computer Aided Verification (CAV), pp. 686–692, 2012.
[18] Benjamin A. Hall, David Benque, Byron Cook, Samin Ishtiaq, Nir Piterman,
Alex Taylor, Moshe Vardi, Steffen Koschmieder, Berthold Gottgens & Jasmin
Fisher Ryan Chuang, "Drug Target Optimization in Chronic Myeloid Leukemia
Using Innovative Computational Platform," Scientific Reports, vol. 5, February
2015.
[19] Assieh Saadatpour and Réka Albert, "A comparative study of qualitative and
quantitative dynamic models of biological regulatory networks," EPJ Nonlinear
Biomedical Physics, June 2016.
on March 27, 2018. © 2016 American Association for Cancer Research.cancerres.aacrjournals.org Downloaded from
Author manuscripts have been peer reviewed and accepted for publication but have not yet been edited. Author Manuscript Published OnlineFirst on December 13, 2016; DOI: 10.1158/0008-5472.CAN-16-1578

28
[20] E Garrison, G Marth. , "Haplotype-based variant detection from short-read
sequencing.," arXiv preprint arXiv, p. 1207.3907, 2012.
[21] K Cibulskis, MS Lawrence, SL Carter, A Sivachenko, D Jaffe, C Sougnez, S
Gabriel, M Meyerson, ES Lander, G Getz. , "Sensitive detection of somatic point
mutations in impure and heterogeneous cancer samples.," Nature biotechnology,
pp. 31(3):213-9., 2013.
[22] R Amson, F Sigaux, S Przedborski, G Flandrin, D Givol, A Telerman , "The
human protooncogene product p33pim is expressed during fetal hematopoiesis
and in diverse leukemias.," Proceedings of the National Academy of Sciences of
the United States of America, pp. 86(22):8857-61, 1989.
[23] J Asano, A Nakano, A Oda, H Amou, M Hiasa, K Takeuchi, H Miki, S
Nakamura, T Harada, S Fujii, K Kagawa, I Endo, K Yata, A Sakai, S Ozaki, T
Matsumoto, M Abe , "The serine/threonine kinase Pim-2 is a novel anti-apoptotic
mediator in myeloma cells.," Leukemia, pp. 25(7):1182-8, 2011.
[24] M Mizuki, J Schwable, C Steur, C Choudhary, S Agrawal, B Sargin, B Steffen, I
Matsumura, Y Kanakura, FD Böhmer, C Müller-Tidow, WE Berdel, H Serve. ,
"Suppression of myeloid transcription factors and induction of STAT response
genes by AML-specific Flt3 mutations," Blood, pp. 101(8):3164-73, 2003.
[25] PP Zarrinkar, RN Gunawardane, MD Cramer, MF Gardner, D Brigham, B Belli,
MW Karaman, KW Pratz, G Pallares, Q Chao, KG Sprankle, HK Patel, M Levis,
RC Armstrong, J James, SS Bhagwat. , "AC220 is a uniquely potent and
selective inhibitor of FLT3 for the treatment of acute myeloid leukemia (AML).,"
Blood, pp. 114(14):2984-92, 2009.
[26] LL Yuan, AS Green, S Bertoli, F Grimal, V Mansat-De Mas, C Dozier, J
on March 27, 2018. © 2016 American Association for Cancer Research.cancerres.aacrjournals.org Downloaded from
Author manuscripts have been peer reviewed and accepted for publication but have not yet been edited. Author Manuscript Published OnlineFirst on December 13, 2016; DOI: 10.1158/0008-5472.CAN-16-1578

29
Tamburini, C Récher, C Didier, S Manenti. , "Pim kinases phosphorylate Chk1
and regulate its functions in acute myeloid leukemia.," Leukemia., pp. 28(2):293-
301., 2014.
[27] C Nishioka, T Ikezoe, J Yang, A Yokoyama. , "Inhibition of MEK/ERK
signaling induces apoptosis of acute myelogenous leukemia cells via inhibition
of eukaryotic initiation factor 4E-binding protein 1 and down-regulation of Mcl-
1.," Apoptosis., pp. 15(7):795-804., 2010.
[28] Z Zeng, IJ Samudio, W Zhang, Z Estrov, H Pelicano, D Harris, O Frolova, N
Hail, W Chen, SM Kornblau, P Huang, Y Lu, GB Mills, M Andreeff, M
Konopleva , "Simultaneous inhibition of PDK1/AKT and Fms-like tyrosine
kinase 3 signaling by a small-molecule KP372-1 induces mitochondrial
dysfunction and apoptosis in acute myelogenous leukemia," Cancer Research,
pp. 3737-3746, 2006.
[29] L Willems, N Chapuis, A Puissant, TT Maciel, AS Green, N Jacque, C Vignon, S
Park, S Guichard, O Herault, A Fricot, O Hermine, IC Moura, Auberger P, N
Ifrah, F Dreyfus, D Bonnet, C Lacombe, P Mayeux, D Bouscary, J Tamburini ,
"The dual mTORC1 and mTORC2 inhibitor AZD8055 has anti-tumor activity in
acute myeloid leukemia," Leukemia, pp. 1195–1202, 2012.
[30] J Saez-Rodriguez, D C. Clarke, P K. Sorger, D A. Lauffenburger M K. Morris,
"Training Signaling Pathway Maps to Biochemical Data with Constrained Fuzzy
Logic: Quantitative Analysis of Liver Cell Responses to Inflammatory Stimuli,"
PLoS computational biology, March 2011.
[31] N. Barbarroja, L. A. Torres, P. Buendía, F. Velasco, G. Dorado, A. Torres, and
C. López-Pedrera E. Siendones, "Inhibition of Flt3-activating mutations does not
prevent constitutive activation of ERK/Akt/STAT pathways in some AML cells:
on March 27, 2018. © 2016 American Association for Cancer Research.cancerres.aacrjournals.org Downloaded from
Author manuscripts have been peer reviewed and accepted for publication but have not yet been edited. Author Manuscript Published OnlineFirst on December 13, 2016; DOI: 10.1158/0008-5472.CAN-16-1578

30
a possible cause for the limited effectiveness of monotherapy with small-
molecule inhibitors.," Hematological oncology, vol. 25, pp. 30-37, March 2007.
on March 27, 2018. © 2016 American Association for Cancer Research.cancerres.aacrjournals.org Downloaded from
Author manuscripts have been peer reviewed and accepted for publication but have not yet been edited. Author Manuscript Published OnlineFirst on December 13, 2016; DOI: 10.1158/0008-5472.CAN-16-1578
31
Table 1. Target functions for AML cell specific calibrated AML model.
Target functions are associated to the nodes and aim to capture biological
relationships. MAX function corresponds to independent activation by upstream
proteins, while MIN corresponds to dependent activation, such that the effect is
governed by the lower expression of the two upstream proteins. + corresponds to
an additive effect, and * is used to assign magnitude of effect. Table S1 extends
this table and includes the Generalized Model and experimental and literature
supporting evidences for each target function.
Protein/Node Cell-Specific Model Target Function PIM1 max(3/4*FltITD,TYK2,3/4*PDGFRA,FGFR1) PIM2 max(FltITD,1/2*TYK2,1/2*PDGFRA) BAD 1/2*RSK+1/2*PIM1 EIF4B min(3,RSK+1/2*PIM1) EIF3 min(EIF4E,EIF4B) 4EBP1 2/3*mTORC1+1/6*EIF3+1/6*PIM2 EIF4E max(1/2*4EBP1,S6) S6 1/8*RSK+3/4*mTORC1+1/8*EIF3 BCR max(1, 1/2*FltITD) Grb2/SOS max(BCR,1/2*FGFR1) RAS min(Grb2/SOS,BCR) PI3K max(BCR,Grb2/SOS,1/2*PDGFRA) RAF AVG(RAS) MEK AVG(RAF) ERK max(MEK,1/2*PDGFRA) RSK AVG(ERK) AKT max(PI3K,mTORC2) mTORC2 AVG(PI3K) mTORC1 1/2*PRAS40+TSC2 TSC2 1/2*((PIM2-1)+1/2*Akt) PRAS40 1/4*PIM1+5/4*Akt CHK max(PIM1,PIM2) H3 AVG(CHK) cMyc max(3/4*FGFR1,max(1,1/4*(max(PIM1,PIM2) + H3)) P27 max(1,var(cMyc)*(var(cMyc)-Proliferation (EIF4B-2)+1/2*ERK+2/3*p27+2/3*cMyc
on March 27, 2018. © 2016 American Association for Cancer Research.cancerres.aacrjournals.org Downloaded from
Author manuscripts have been peer reviewed and accepted for publication but have not yet been edited. Author Manuscript Published OnlineFirst on December 13, 2016; DOI: 10.1158/0008-5472.CAN-16-1578

32
Apoptosis !MAX(BAD, S6, 1/2*BAD + cMyc + S6 + 2*EIF4E))
on March 27, 2018. © 2016 American Association for Cancer Research.cancerres.aacrjournals.org Downloaded from
Author manuscripts have been peer reviewed and accepted for publication but have not yet been edited. Author Manuscript Published OnlineFirst on December 13, 2016; DOI: 10.1158/0008-5472.CAN-16-1578
33
Figure 1. AML cell lines sensitive to the PIM inhibitor AZD1208 have diverse
genotypes. (A) GI50 (uM) waterfall plot and molecular oncoprint illustrating the
diverse pharmacological response of AML cells after 72 hours AZD1208 treatment as
well as PIM expression and AML disease relevant mutations. Boxed cell lines names
indicate responding cell lines further investigated. (B) Protein expression measured by
reverse-phase protein array (RPPA) in treated and untreated cell lines show
heterogeneity in signaling responses through various pathways. (C) MV411, with an
active FLT3-ITD, shows varied responses to concentrations of AZD1208 and/or
AC220 for 72 hours. The number of viable cells was determined by Alamar Blue
measurements where the values represent percent growth inhibition.
on March 27, 2018. © 2016 American Association for Cancer Research.cancerres.aacrjournals.org Downloaded from
Author manuscripts have been peer reviewed and accepted for publication but have not yet been edited. Author Manuscript Published OnlineFirst on December 13, 2016; DOI: 10.1158/0008-5472.CAN-16-1578

34
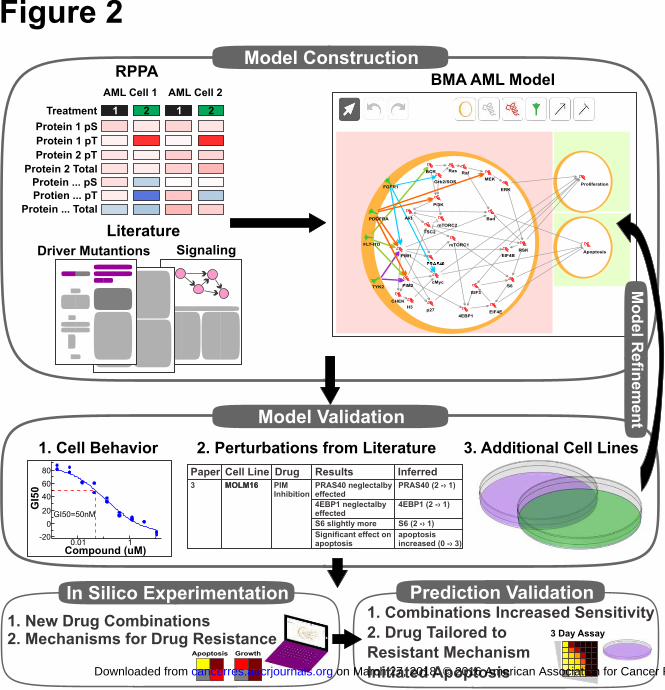
Figure 2. Schematic workflow of cell-specific model construction in BMA. Motifs
and interactions curated from the literature are used to build a Qualitative Network in
the BMA tool. The model was calibrated with the results of RPPA experiments for
two cell lines with different AML-driving mutations. The model is designed to
represent the general AML pathways, and provide a cell-specific context by “turning-
on“ a specific set of mutations. The mutations impact outgoing interactions, thus
activating the pathways in a mutation-specific manner, resulting in mutation-specific
phosphorylation activity throughout the pathways leading to specific cellular
behavior. The model is iteratively refined by testing and comparing to the cell
behavior measured as a response to different perturbations for the two cell lines. The
model robustness was tested against perturbations from the literature performed on
the explored mutations, and unseen cell lines incorporated automatically into the
model. The model is then used for in-silico experimentation in order to test novel drug
combinations, infer the source and mechanism for drug resistance, and predict drug
response in resistant cell lines and suggest treatment for resistance.
on March 27, 2018. © 2016 American Association for Cancer Research.cancerres.aacrjournals.org Downloaded from
Author manuscripts have been peer reviewed and accepted for publication but have not yet been edited. Author Manuscript Published OnlineFirst on December 13, 2016; DOI: 10.1158/0008-5472.CAN-16-1578
35
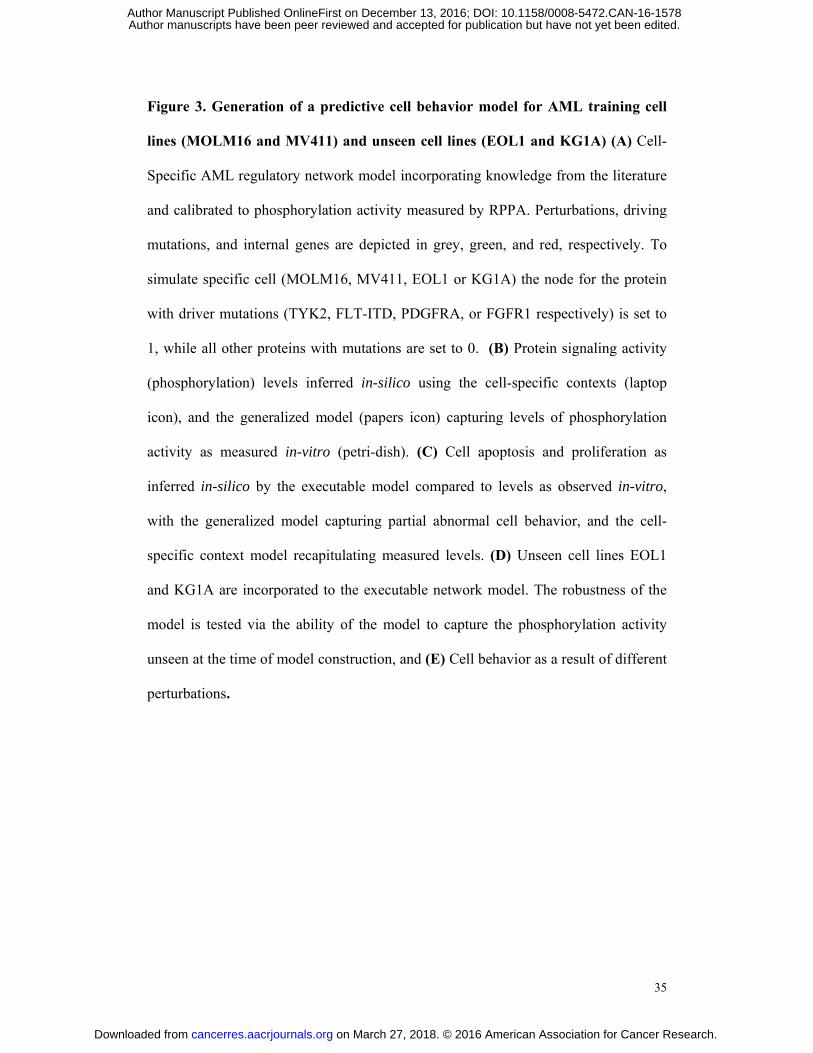
Figure 3. Generation of a predictive cell behavior model for AML training cell
lines (MOLM16 and MV411) and unseen cell lines (EOL1 and KG1A) (A) Cell-
Specific AML regulatory network model incorporating knowledge from the literature
and calibrated to phosphorylation activity measured by RPPA. Perturbations, driving
mutations, and internal genes are depicted in grey, green, and red, respectively. To
simulate specific cell (MOLM16, MV411, EOL1 or KG1A) the node for the protein
with driver mutations (TYK2, FLT-ITD, PDGFRA, or FGFR1 respectively) is set to
1, while all other proteins with mutations are set to 0. (B) Protein signaling activity
(phosphorylation) levels inferred in-silico using the cell-specific contexts (laptop
icon), and the generalized model (papers icon) capturing levels of phosphorylation
activity as measured in-vitro (petri-dish). (C) Cell apoptosis and proliferation as
inferred in-silico by the executable model compared to levels as observed in-vitro,
with the generalized model capturing partial abnormal cell behavior, and the cell-
specific context model recapitulating measured levels. (D) Unseen cell lines EOL1
and KG1A are incorporated to the executable network model. The robustness of the
model is tested via the ability of the model to capture the phosphorylation activity
unseen at the time of model construction, and (E) Cell behavior as a result of different
perturbations.
on March 27, 2018. © 2016 American Association for Cancer Research.cancerres.aacrjournals.org Downloaded from
Author manuscripts have been peer reviewed and accepted for publication but have not yet been edited. Author Manuscript Published OnlineFirst on December 13, 2016; DOI: 10.1158/0008-5472.CAN-16-1578

36
Figure 4. Validation of predicted synergistic combinations of drugs reveals new
effective treatment strategies. (A) Cell-Specific AML model is used to test
combinations of drugs and predict cell behavior in a cell specific manner. A drug or a
combination of drugs is simulated by partially or fully nullifying the target functions
of their targets, and can be done automatically and efficiently with a large number of
candidates. (B) Predicted cell behavior of apoptosis and proliferations is validated via
growth inhibition of AML cell lines cultured with the indicated concentration ranges
of AZD1208 and/or tested combined inhibitor after 72 hours. Predicted synergic
effect, as seen for EOL1 cell line with PIM and AKT and PIM and PI3K inhibitors, is
used to prioritize combinations.
on March 27, 2018. © 2016 American Association for Cancer Research.cancerres.aacrjournals.org Downloaded from
Author manuscripts have been peer reviewed and accepted for publication but have not yet been edited. Author Manuscript Published OnlineFirst on December 13, 2016; DOI: 10.1158/0008-5472.CAN-16-1578
37
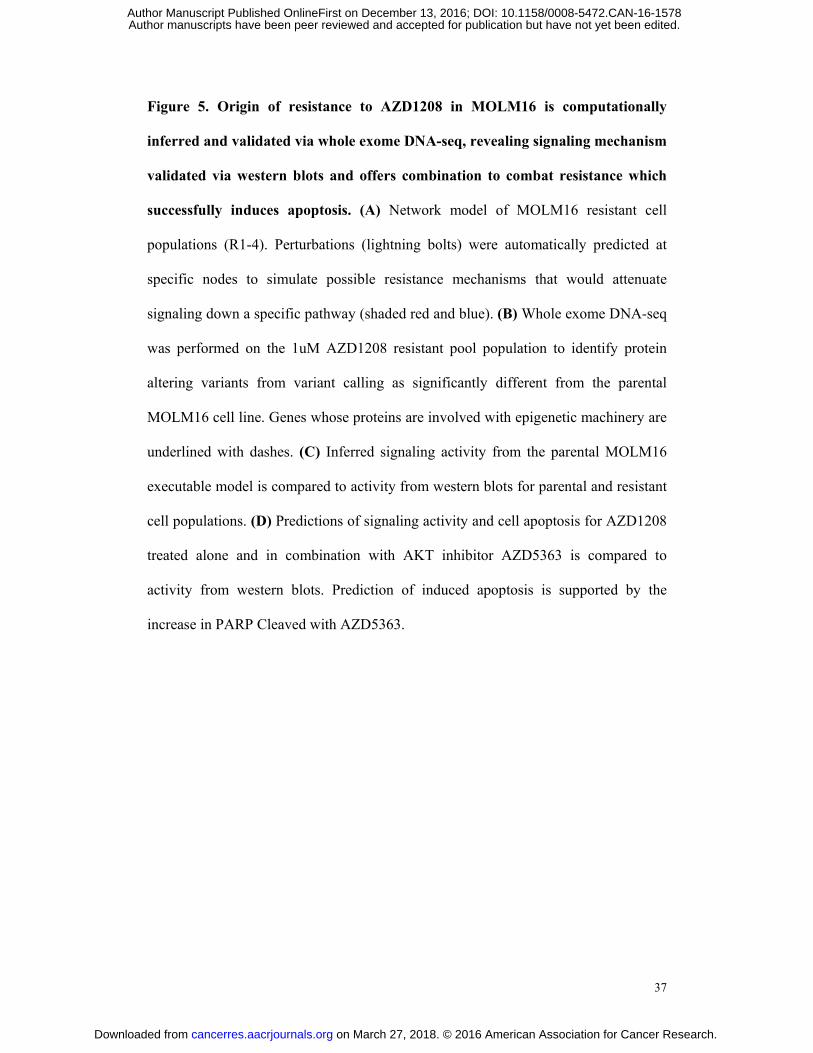
Figure 5. Origin of resistance to AZD1208 in MOLM16 is computationally
inferred and validated via whole exome DNA-seq, revealing signaling mechanism
validated via western blots and offers combination to combat resistance which
successfully induces apoptosis. (A) Network model of MOLM16 resistant cell
populations (R1-4). Perturbations (lightning bolts) were automatically predicted at
specific nodes to simulate possible resistance mechanisms that would attenuate
signaling down a specific pathway (shaded red and blue). (B) Whole exome DNA-seq
was performed on the 1uM AZD1208 resistant pool population to identify protein
altering variants from variant calling as significantly different from the parental
MOLM16 cell line. Genes whose proteins are involved with epigenetic machinery are
underlined with dashes. (C) Inferred signaling activity from the parental MOLM16
executable model is compared to activity from western blots for parental and resistant
cell populations. (D) Predictions of signaling activity and cell apoptosis for AZD1208
treated alone and in combination with AKT inhibitor AZD5363 is compared to
activity from western blots. Prediction of induced apoptosis is supported by the
increase in PARP Cleaved with AZD5363.
on March 27, 2018. © 2016 American Association for Cancer Research.cancerres.aacrjournals.org Downloaded from
Author manuscripts have been peer reviewed and accepted for publication but have not yet been edited. Author Manuscript Published OnlineFirst on December 13, 2016; DOI: 10.1158/0008-5472.CAN-16-1578

-1.33 (25%)
2.82 (75%)4EBP1 pS65
BAD pS112
BCR pY177
ERK1/2 pT202/Y204
GSK3 BETA A/B pS21/9
GSK3 BETA pS9
IGFI RECEPTOR BETA Total
PARP Cleaved
PRAS40 pT246
PTEN pS380
S6 Ribo. Prot. pS240/244
MOLM16 EOL1 KG1A MV411
Log2 QMN Protein Value
0.15 (Median)
S6 Ribo. Prot. pS235/236
DM
SO
AZ
D1208
DM
SO
AZ
D1208
DM
SO
AZ
D1208
AC
220
Co
mb
o.
DM
SO
AZ
D1208
AC
220
Co
mb
o.
4.90 (Max)
-3.41 (Min)
(0.25mg/ml spots)
Wilcoxon Rank SumTest Versus DMSO
raw p-value >0.1 or<log2 0.5 difference
raw p-value <0.1 &>log2 0.5 difference
C
AA
ZD
1208 G
I50 (
uM
)
1uM
0
0.03
0.3
3
15
MO
LM
16
EO
L1
KA
SU
MI3
KG
1A
MV
411
CM
K
HL
60
MO
LM
13
MO
NO
MA
C6
NO
MO
1
OC
IAM
L2
OC
IM1
OC
IM2
PIM1
PIM2
PIM3
FLT3
JAK2
KIT
KRAS
NRAS
TYK2
DNMT3A
IDH1
PHF6
MLL
TP53
Sensitivity
Sensitive (GI50<1uM)
Insensitive (5uM<GI50)
Expression Array (Log2)
Exp. <=7
7< Exp. <=8
8< Exp. <=9
9< Exp. <=10
10> Exp.
Mutation Relevance
Complex�Cancer
Fusion�Cancer
PTD�Cancer
ITD�Cancer
Missense�Cancer
Missense�Unlikely
Silent None
Exo
me D
NA
-Seq
Mu
tati
on
s
Missense�Unknown
Fusion�Active
FGFR1
PDGFRA
Exp
ressio
nA
rray
B
Figure 1
on March 27, 2018. © 2016 American Association for Cancer Research.cancerres.aacrjournals.org Downloaded from
Author manuscripts have been peer reviewed and accepted for publication but have not yet been edited. Author Manuscript Published OnlineFirst on December 13, 2016; DOI: 10.1158/0008-5472.CAN-16-1578
Protein 1 pS
Protein 1 pT
Protein 2 pT
Protein 2 Total
Protein ... pS
Protien ... pT
Protein ... Total
Treatment
AML Cell 1 AML Cell 2
1 1
RPPA
2 2
Model Validation
1. Cell Behavior
0.01
Compound (uM)1
-20
0
20
40
60
80
GI50=50nM
GI5
0
2. Perturbations from Literature 3. Additional Cell Lines
Paper Cell Line Drug Results Inferred3 MOLM16 PIM
InhibitionPRAS40 neglectalbyeffected
MOLM16 PRAS40 (2 -› 1)
4EBP1 neglectalbyeffected
4EBP1 (2 -› 1)
S6 slightly more S6 (2 -› 1)
Significant effect onapoptosis
apoptosisincreased (0 -› 3)
1. New Drug Combinations2. Mechanisms for Drug Resistance
Prediction ValidationIn Silico Experimentation1. Combinations Increased Sensitivity
2. Drug Tailored to
Resistant Mechanism
Initiated Apoptosis
Literature
Driver Mutantions Signaling
BMA AML Model
Model Construction
PIM2
H3
CHEK
cMyc
p27
4EBP1EIF4E
EIF3
mTORC1
mTORC2
TSC2
Akt
S6
RasRaf
Grb2/SOSMEK
PI3K
Bad
ERK
EIF4B
RSK Apoptosis
Proliferation
TYK2
FLT-ITD
PDGFRA
FGFR1
PIM1
BCR
Mo
del R
efin
em
en
t
Apoptosis Growth
3 Day Assay
Figure 2
on March 27, 2018. © 2016 American Association for Cancer Research.cancerres.aacrjournals.org Downloaded from
Author manuscripts have been peer reviewed and accepted for publication but have not yet been edited. Author Manuscript Published OnlineFirst on December 13, 2016; DOI: 10.1158/0008-5472.CAN-16-1578
A
EOL1 KG1A
Pro
life
rati
on
BAD
EOL1 KG1A
TSC
Akt
BCR
4EBP1
EIF4B
Erk
p27
cMyc
EIF4E
S6
Ap
op
tosis
D E
MOLM16 MV411
Pro
life
rati
on
BAD
MOLM16 MV411
TSC
Akt
BCR
4EBP1
EIF4B
Erk
p27
cMyc
EIF4E
S6
MSE
Ap
op
tosis
B CDMSO AZD1208 AC220 AZD1208 ComboDMSO
DMSO AZD1208 AC220 AZD1208 ComboDMSO
MOLM16MV411EOL1KG1A
Key GeneticDriver Relationships
PIM2
H3
CHEK
cMyc
p27
4EBP1EIF4E
EIF3
mTORC1
mTORC2
TSC2
Akt
S6
RasRaf
Grb2/SOSMEK
PI3K
Bad
ERK
EIF4B
RSK Apoptosis
Proliferation
TYK2
FLT-ITD
PDGFRA
FGFR1
PIM1
BCR
AZD1208
AC220
6nM AC220
Treatment
DMSO
1uM AZD1208AZD1208 + AC220
0.3 0.39 0.43 0.55 0.57 0.34
0.55
0.53
0.58
0.88
0.52
0.66
0.57
0.58
0.5
0.51
0.61
0
4
0
4
0
4
0
4
0 1 2 3 4
Protein Signaling Activity
Type
in-silico
in-vitro
generelized
model
Figure 3
Key Genetic Switches
0.0
0.33
0.17
0.0
0.36
0.19
0.14
0.55
0.2
0.29
0.34
0.17 0.26 0.17 0.2 0.23 0.2
0.49
0.46
0.0
0.41
0.24
0.3
0.33
0.44
0.22
0.14
0.17
0.27 0.24 0.23 0.28 0.18 0.21 MSEon March 27, 2018. © 2016 American Association for Cancer Research.cancerres.aacrjournals.org Downloaded from
Author manuscripts have been peer reviewed and accepted for publication but have not yet been edited. Author Manuscript Published OnlineFirst on December 13, 2016; DOI: 10.1158/0008-5472.CAN-16-1578
Percent (%) Growth Inhibition3 Days Post-Treatment Assay
25 50-
CompleteGrowth
MV411MOLM16
PIM2
H3
CHEK
cMyc
p27
4EBP1EIF4E
EIF3
mTORC1
mTORC2
TSC2
Akt
S6
RasRaf
Grb2/SOSMEK
PI3K
Bad
ERK
EIF4B
RSK Apoptosis
Proliferation
TYK2
FLT-ITD
PDGFRA
FGFR1
PIM1
BCR
Key GeneticDriver Relationships
MOLM16
MV411
EOL1
KG1A
Key Compounds
PIMi AZD1208
FLT3i AC220
AKTi AZD5363
MEKi AZD6244
PI3Ki GDC0941
EOL1 KG1A
175 200150100 12575
CompleteDeath
CompleteGrowth
Inhibition
(Growth)
1 20
CompleteGrowth
43
CompleteGrowth
Inhibition
BMA PredictedApoptosis
1 20
CompleteGrowth
43
CompleteDeath
A
B
BMA PredictedGrowth
0 1 0 1FLT3i AC220
0 1 0 1AKTi AZD5363
0 1 0 1MEKi AZD6244
0 1 0 1PI3Ki GDC0941
Apoptosis Growth
1
0
0 1 0 1FLT3i AC220
PIM
i
1
0
0 1 0 1AKTi AZD5363
PIM
i
1
0
0 1 0 1MEKi AZD6244
PIM
i
1
0
0 1 0 1PI3Ki GDC0941
PIM
i
Apoptosis Growth 3 Day Assay3 Day Assay
0 1 0 1FLT3i AC220
0 1 0 1AKTi AZD5363
0 1 0 1MEKi AZD6244
0 1 0 1PI3Ki GDC0941
Apoptosis Growth
0 1 0 1FLT3i AC220
0 1 0 1AKTi AZD5363
0 1 0 1MEKi AZD6244
0 1 0 1PI3Ki GDC0941
Apoptosis Growth3 Day Assay 3 Day Assay
Figure 4
on March 27, 2018. © 2016 American Association for Cancer Research.cancerres.aacrjournals.org Downloaded from
Author manuscripts have been peer reviewed and accepted for publication but have not yet been edited. Author Manuscript Published OnlineFirst on December 13, 2016; DOI: 10.1158/0008-5472.CAN-16-1578

TYK2
PIM1
PIM2
H3CHEK
cMyc
p274EBP1
P
EIF4E
EIF3
mTORC1
mTORC2
TSC2
Akt
S6
BCR
Ras
RafMEK
PI3K
Bad
ERK
EIF4BRSK
A
Apoptosis
Proliferation
Grb2/SOS
Parental
Resistant R1
Resistant R2
Resistant R3
Inferred Activation
B
C D
Nodes
P R1 R2 R3 R4
chr11.67168328
chr17.30264479
chr17.30325904
chr19.11447889
chr6.168352185
BRAF
chr9.139400029
chr9.139409118
GeneChromosomePosition
chr7.140500184
MLLT4
NOTCH1
NOTCH1
RAB3D
PPP1CA
SUZ12
SUZ12
Variant Caller FreeBayesMuTect,VarDictFreeBayes,MuTect,VarDict
Resistant R4
RAF
PI3K/AKT
PI3K/AKT
RAS
GRB2/RAS
PI3K/AKT
PI3K/AKT
PI3K/AKT
chr4.107845833 DKK2 PI3K/AKT
NetworkMapping
4EBP1 pS65
BAD pS112
�-Actin
Vinculin
�-Actin
S6 Ribo. Prot.pS235/236
EIF4B pS406
Vinculin
NA
NA
�-Actin
ERK1/2pT202/Y204
P R1 R2 R3 R4
1uM AZD1208
MOLM16Parental (P)/
Resistant (R)
Continuous
P
3 HourAZD1208
EIF4B BMA
S6 BMA
4EBP1 BMA
BAD BMA
ERK BMA
0 1 2 3 4
BMA Predicted Protein Activity
1uM AZD5363
P R1 R2 R3 R4 P R1 R2 R3 R4
1uM AZD12081uM AZD1208
MOLM16
PRAS40 pT246
S6 Ribo. Prot.pS235/236
Actin Total
4EBP1 pS65
Parental/Resistant
Continuous
S6 BMA
PRAS40 BMA
4EBP1 BMA
Apoptosis BMA
PARP Cleaved
Figure 5
on March 27, 2018. © 2016 American Association for Cancer Research.cancerres.aacrjournals.org Downloaded from
Author manuscripts have been peer reviewed and accepted for publication but have not yet been edited. Author Manuscript Published OnlineFirst on December 13, 2016; DOI: 10.1158/0008-5472.CAN-16-1578

Published OnlineFirst December 13, 2016.Cancer Res Dana Silverbush, Shaun Grosskurth, Dennis Wang, et al. acute myeloid leukemiaCell-specific computational modeling of the PIM pathway in
Updated version
10.1158/0008-5472.CAN-16-1578doi:
Access the most recent version of this article at:
Material
Supplementary
http://cancerres.aacrjournals.org/content/suppl/2016/12/09/0008-5472.CAN-16-1578.DC1
Access the most recent supplemental material at:
Manuscript
Authoredited. Author manuscripts have been peer reviewed and accepted for publication but have not yet been
E-mail alerts related to this article or journal.Sign up to receive free email-alerts
Subscriptions
Reprints and
To order reprints of this article or to subscribe to the journal, contact the AACR Publications
Permissions
Rightslink site. Click on "Request Permissions" which will take you to the Copyright Clearance Center's (CCC)
.http://cancerres.aacrjournals.org/content/early/2016/12/09/0008-5472.CAN-16-1578To request permission to re-use all or part of this article, use this link
on March 27, 2018. © 2016 American Association for Cancer Research.cancerres.aacrjournals.org Downloaded from
Author manuscripts have been peer reviewed and accepted for publication but have not yet been edited. Author Manuscript Published OnlineFirst on December 13, 2016; DOI: 10.1158/0008-5472.CAN-16-1578