Embed Size (px)
Citation preview
FP7 ICT-SOCRATES
Cell Outage Management in LTE Networks
COST 2100 TD(09) 941
M. Amirijoo (Ericsson), L. Jorguseski (TNO ICT),
T. Kürner (TU Braunschweig), R. Litjens (TNO ICT),
M. Neuland (TU Braunschweig), L. C. Schmelz (Nokia Siemens Networks),
U. Türke (Atesio)
WWW.FP7-SOCRATES.EU
2/32 2/
Introduction Components in cell outage management First Results on the Controllability Study Concept of X-Map-Estimation Future work
Outline

WWW.FP7-SOCRATES.EU
3/3
The first release of the 3GPP Long Term Evolution (LTE) standard has been finalized
Operators require significant reduction of manual network management for LTE
Introduction of self-organisation functionalities in LTE – Reduces manual network management – Enhances network performance
One aspect that benefits from self-organization is cell outage management (COM), which consists of:
– Cell outage detection – Cell outage compensation
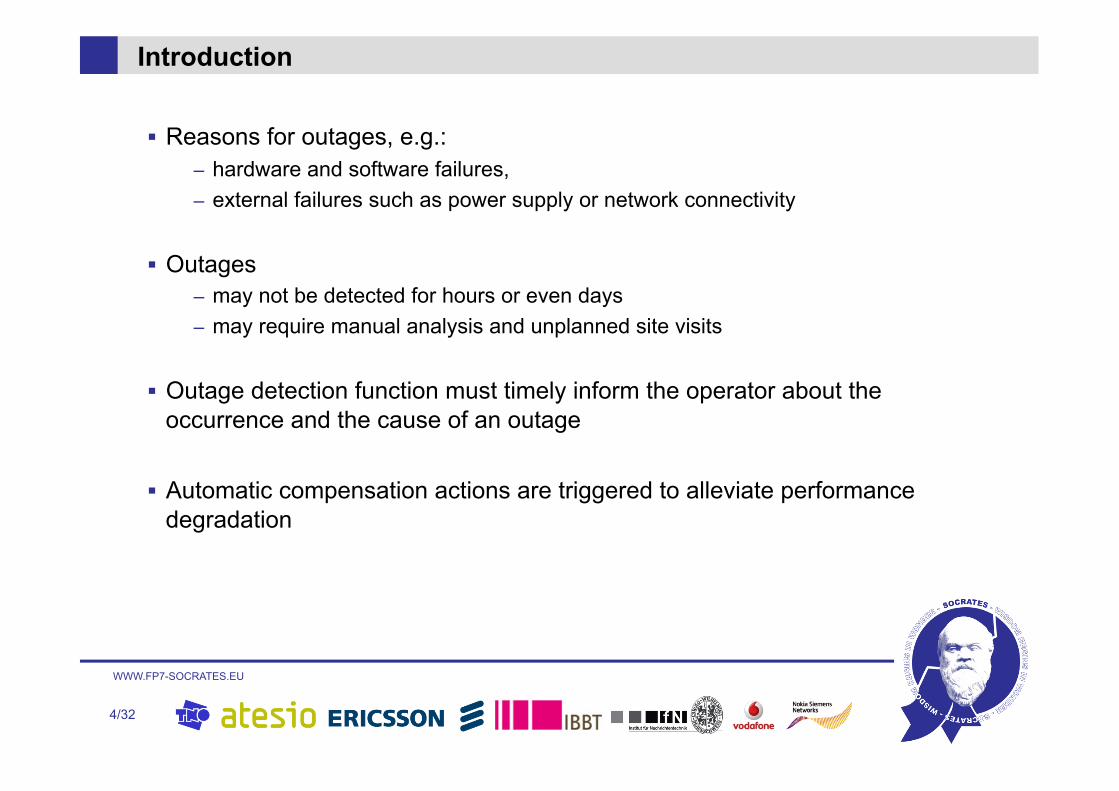
Introduction
WWW.FP7-SOCRATES.EU
4/32
Reasons for outages, e.g.: – hardware and software failures, – external failures such as power supply or network connectivity
Outages – may not be detected for hours or even days – may require manual analysis and unplanned site visits
Outage detection function must timely inform the operator about the occurrence and the cause of an outage
Automatic compensation actions are triggered to alleviate performance degradation
Introduction
WWW.FP7-SOCRATES.EU
5/32
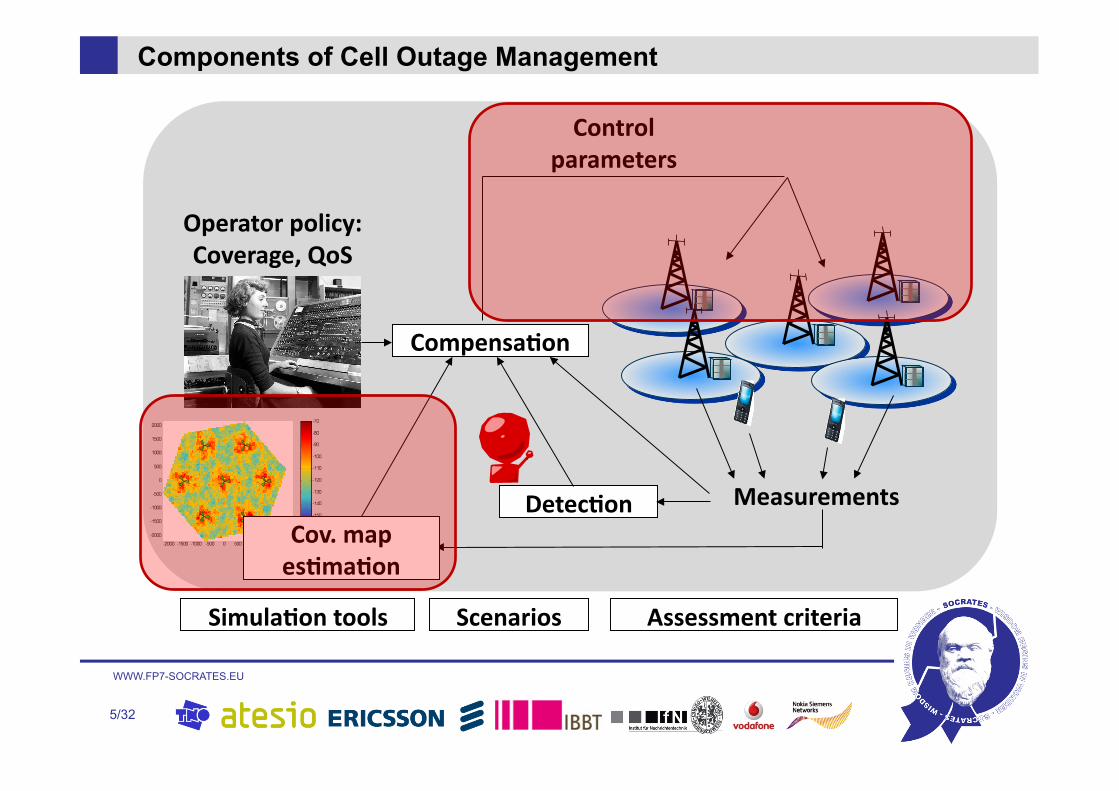
Components of Cell Outage Management
MeasurementsDetec-on
Compensa-on
Operatorpolicy:Coverage,QoS
Controlparameters
Cov.mapes-ma-on
Simula-ontools Scenarios Assessmentcriteria
FP7 ICT-SOCRATES
First Results on Controllability Study

WWW.FP7-SOCRATES.EU
7/32
Simulator
Monte-Carlo based static simulator will be used for cell outage compensation due to
– Simpler modeling and – Faster execution time
At each iteration an eNodeB (sector):
– Samples/gathers performance – Updates radio parameters
The time between two iterations is assumed to be in the order of minutes or tens of minutes
– Small correlation between the samples
– Correlation is ignored
UEgenera-on
SimulatePHY,RRMetc
SamplePerformance
Compensa-onAlgorithm
Finalsnapshot?
NoRo
undofalgorithm
itera-
on
Pathloss(G‐matrix)
CellSelec-on

WWW.FP7-SOCRATES.EU
8/32
Scenarios
Data traffic characterised by requested data rate DL = 1 Mbps and UL = 250 kbps
Quality/Coverage targets – 10th-% DL Throughput > 256 kbps – 10th-% UL Throughput > 128 kbps
Loads – High load: load such that coverage/quality targets are satisfied (46 UEs/cell) – Medium load: 50 % of high load (23 UEs/cell) – Low load: 1 UE/cell
Capacity driven layout – ISD = 500 m – Antenna downtilt = 15º – Consider high load, medium load, low load
Coverage driven layout – ISD = such that coverage/quality targets are satisfied => ISD = 2450 m – Antenna downtilt = 5º – Consider low load
WWW.FP7-SOCRATES.EU
9/32
Definitions
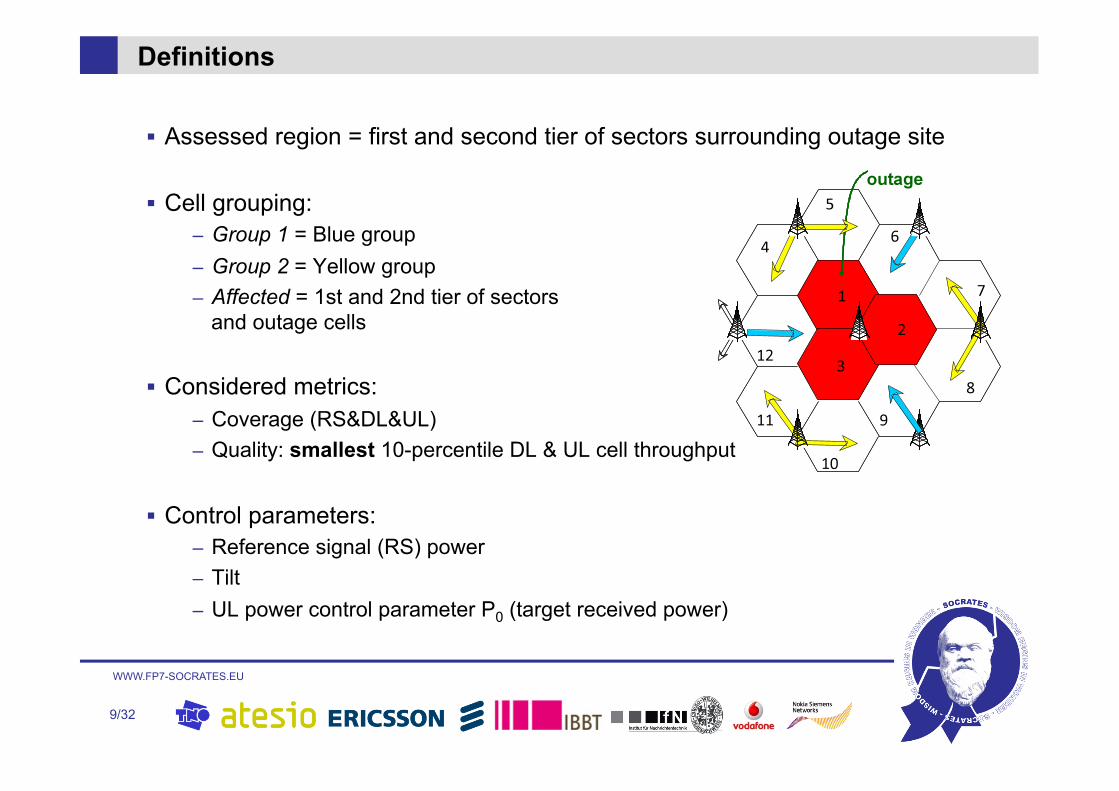
Assessed region = first and second tier of sectors surrounding outage site
Cell grouping: – Group 1 = Blue group – Group 2 = Yellow group – Affected = 1st and 2nd tier of sectors
and outage cells
Considered metrics: – Coverage (RS&DL&UL) – Quality: smallest 10-percentile DL & UL cell throughput
Control parameters: – Reference signal (RS) power – Tilt – UL power control parameter P0 (target received power)

WWW.FP7-SOCRATES.EU
10/32
Coverage Driven Layout – RS Power
Need to increase the RS power to enhance coverage
Group 1 RS power (ratio of nominal power )/ dB Group 1 RS power (ratio of nominal power )/ dB
Gro
up 2
RS
pow
er (r
atio
of n
omin
al p
ower
)/ d
B
WWW.FP7-SOCRATES.EU
11/32
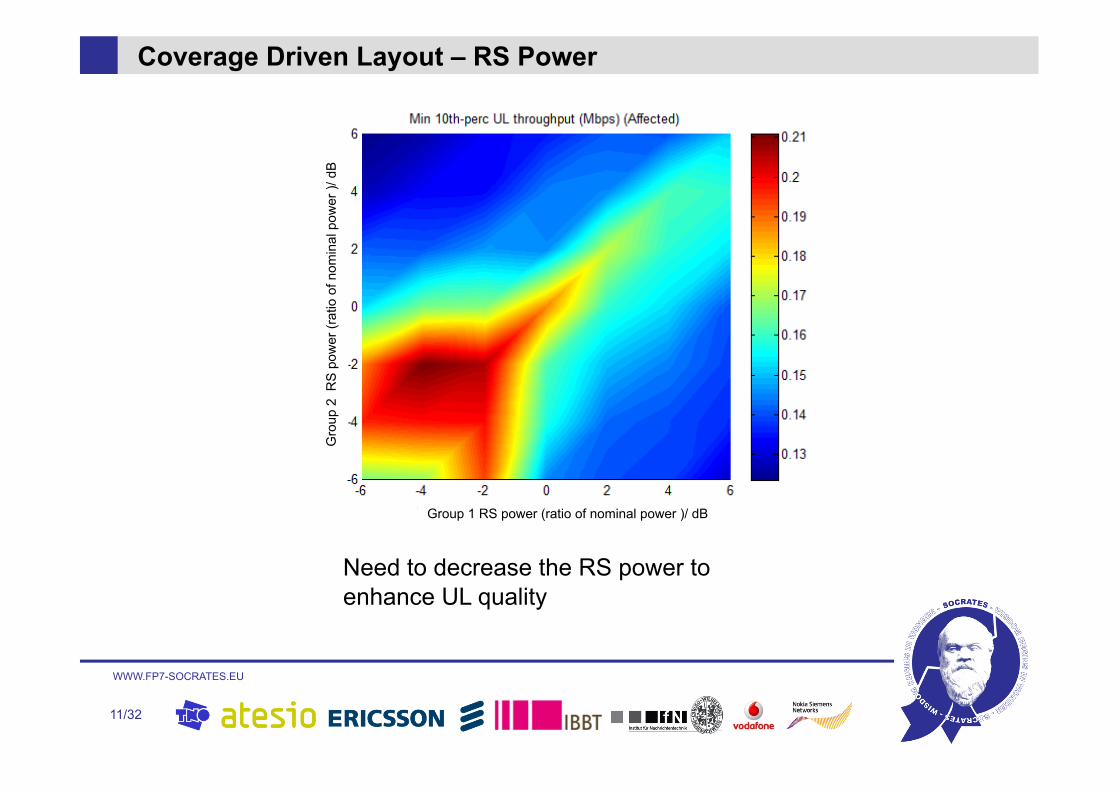
Coverage Driven Layout – RS Power
Need to decrease the RS power to enhance UL quality
Group 1 RS power (ratio of nominal power )/ dB
Gro
up 2
RS
pow
er (r
atio
of n
omin
al p
ower
)/ d
B

WWW.FP7-SOCRATES.EU
12/32
Capacity Driven Layout – High Load
Uptiling improves coverage (nominal tilt = 15 degrees)
WWW.FP7-SOCRATES.EU
13/32
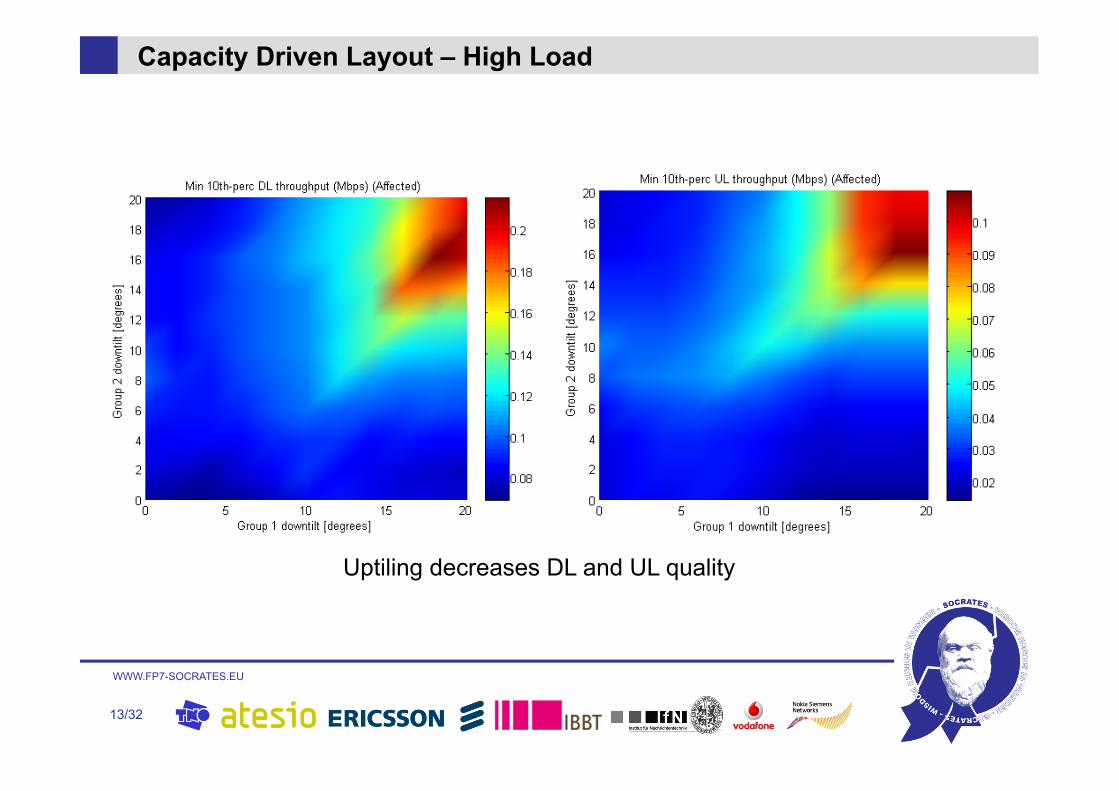
Capacity Driven Layout – High Load
Uptiling decreases DL and UL quality
WWW.FP7-SOCRATES.EU
14/32
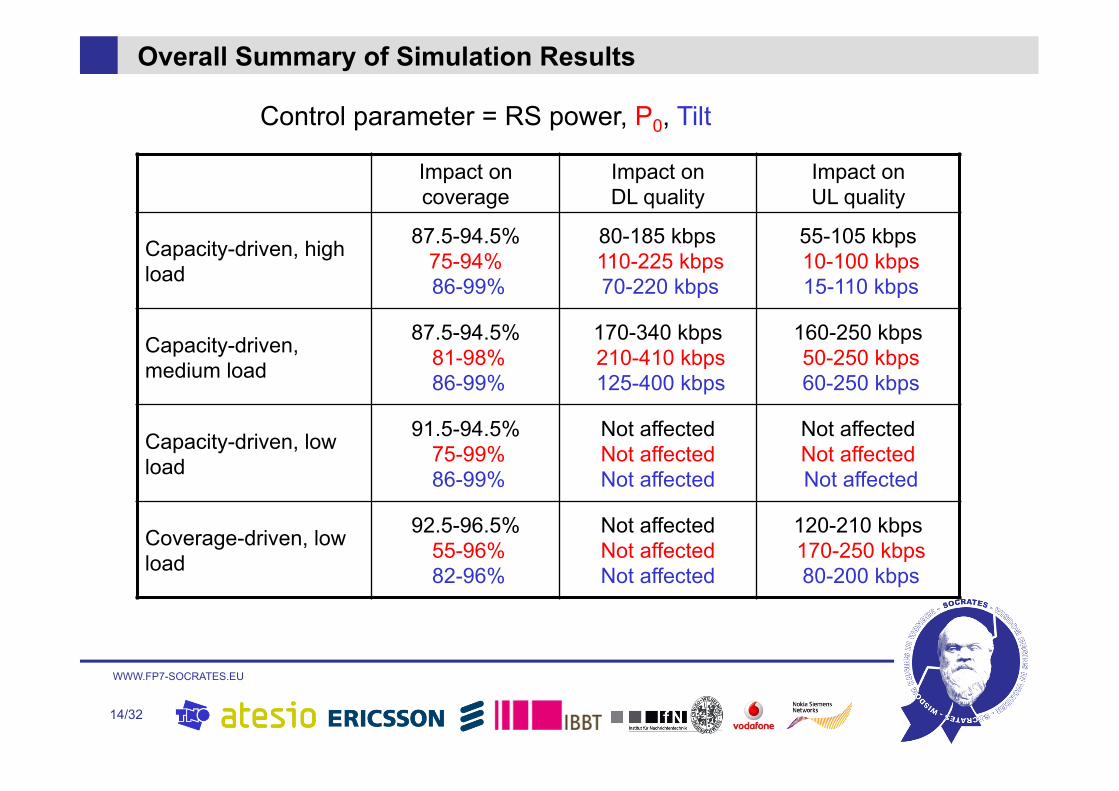
Overall Summary of Simulation Results
Impact on coverage
Impact on DL quality
Impact on UL quality
Capacity-driven, high load
87.5-94.5% 75-94% 86-99%
80-185 kbps 110-225 kbps 70-220 kbps
55-105 kbps 10-100 kbps 15-110 kbps
Capacity-driven, medium load
87.5-94.5% 81-98% 86-99%
170-340 kbps 210-410 kbps 125-400 kbps
160-250 kbps 50-250 kbps 60-250 kbps
Capacity-driven, low load
91.5-94.5% 75-99% 86-99%
Not affected Not affected Not affected
Not affected Not affected Not affected
Coverage-driven, low load
92.5-96.5% 55-96% 82-96%
Not affected Not affected Not affected
120-210 kbps 170-250 kbps 80-200 kbps
Control parameter = RS power, P0, Tilt
WWW.FP7-SOCRATES.EU
15/32
Conclusion
RS power, P0 and tilt have impact on coverage and DL/UL quality – Degree of impact depends on network layout and load
Coverage – Tilt has highest impact – Impact of P0 depends on load – RS power has lowest impact
DL quality – All parameters have impact for capacity driven and high/medium load
UL quality – All parameters have impact for capacity driven and high/medium load – P0 also impacts coverage driven layout (low load)
WWW.FP7-SOCRATES.EU
16/32
Scenario
Hexagonal grid, 19 sites with 3 sectors each eNodeB height = 32 m, UE height = 1.5 m BW = 10 MHz Max BS power = 46 dBm, Max UE power = 25 dBm RS power ~ 10% Ptotal Noise spectral density:
– DL N0 ≈ -199 dBW/Hz – UL -195 dBW/Hz
Pathloss = 128.1 + 37.6 log10(r) [3GPP@2GHz] Shadowing STD = 8dB Shadowing correlation = 0.5 (sites), 1 (sectors) Decorrelation distance = ISD / 15; Minimum coupling loss = 75 dB; 3GPP 3D antenna model
WWW.FP7-SOCRATES.EU
17/32
FP7 ICT-SOCRATES
Concept of X-Map Estimation
WWW.FP7-SOCRATES.EU
18/32
WWW.FP7-SOCRATES.EU Prof. Dr.-Ing. Thomas Kürner, TU Braunschweig
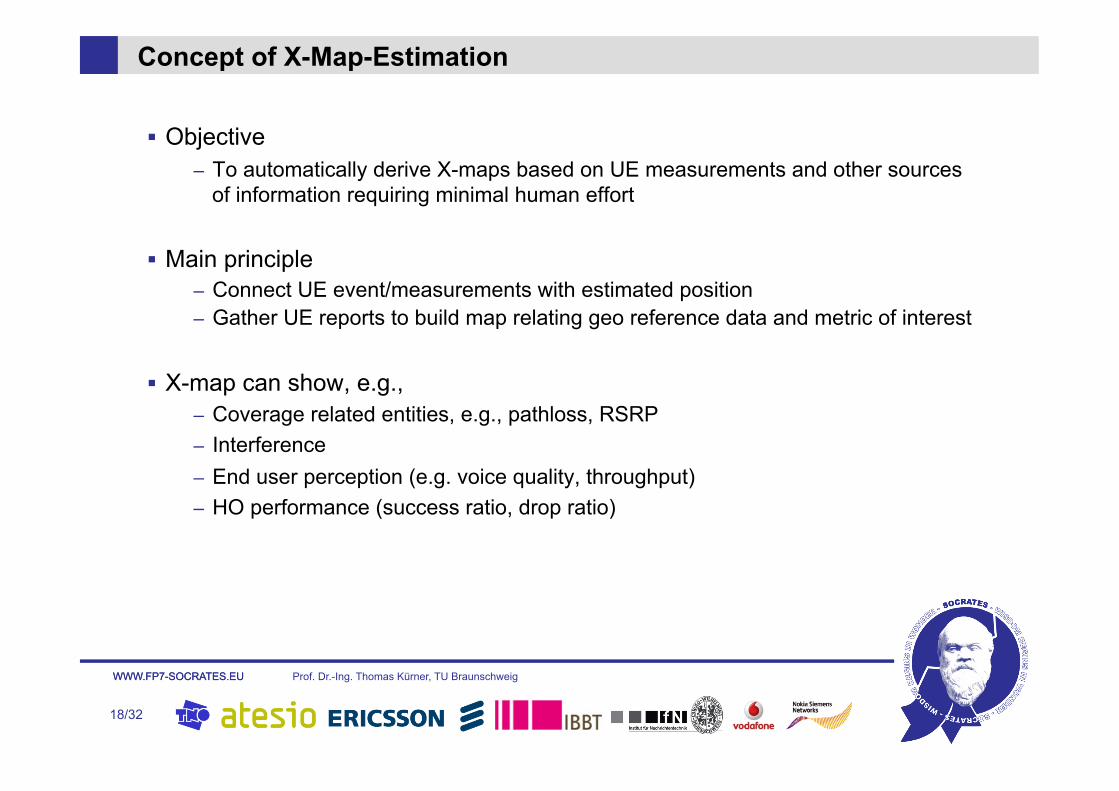
Objective – To automatically derive X-maps based on UE measurements and other sources
of information requiring minimal human effort
Main principle – Connect UE event/measurements with estimated position – Gather UE reports to build map relating geo reference data and metric of interest
X-map can show, e.g., – Coverage related entities, e.g., pathloss, RSRP – Interference – End user perception (e.g. voice quality, throughput) – HO performance (success ratio, drop ratio)
Concept of X-Map-Estimation

WWW.FP7-SOCRATES.EU
19/32
WWW.FP7-SOCRATES.EU Prof. Dr.-Ing. Thomas Kürner, TU Braunschweig
Concept of X-Map-Estimation cont.
A UE delivers a measurement entitiy, e.g. – Reference Signal Received Power (RSRP) – CQI
UE position information is essential in order to derive X-maps

WWW.FP7-SOCRATES.EU
20/32
WWW.FP7-SOCRATES.EU Prof. Dr.-Ing. Thomas Kürner, TU Braunschweig
...
Implementaion of X-Map-Estimation
UE source 1 UE source n
Planning tool
X-Map Est
Measurement entity, Position estimate, Confidence, (RAT)
X-Map
Initial condition
Localization & Measurement Manager
Measurement entity, (Position)
Prediction, Confidence

WWW.FP7-SOCRATES.EU
21/32
WWW.FP7-SOCRATES.EU Prof. Dr.-Ing. Thomas Kürner, TU Braunschweig
Accuracy of X-Map Estimation
Confidence of measurement depends on – Positioning accuracy – Measurement accuracy
Positioning accuracy is a function of, e.g.: – Radio environment (urban, suburban, indoor, outdoor) – Number of measured RBSs – Dynamic range of UE – Positioning technique
SOCRATES – is not interested in developing positioning techniques – assumes that proper positioning techniques are in place – is interested on good position error models

WWW.FP7-SOCRATES.EU
22/32
WWW.FP7-SOCRATES.EU Prof. Dr.-Ing. Thomas Kürner, TU Braunschweig
For LTE three different localisation methods are planned – GPS – Observed Time Difference of Arrival (OTDOA) – Enhanced cell ID positioning methods
Model for the position error based on the Cramér-Rao lower bound
This model is based on the – Geometry of eNodeBs / satellites and the UE – Number of measured signals – Standard deviation of the measurement error
(for GPS: 33.3 ns)
In the following preliminary results for GPS and OTDOA are shown
Position Error Modelling
WWW.FP7-SOCRATES.EU
23/32
WWW.FP7-SOCRATES.EU Prof. Dr.-Ing. Thomas Kürner, TU Braunschweig
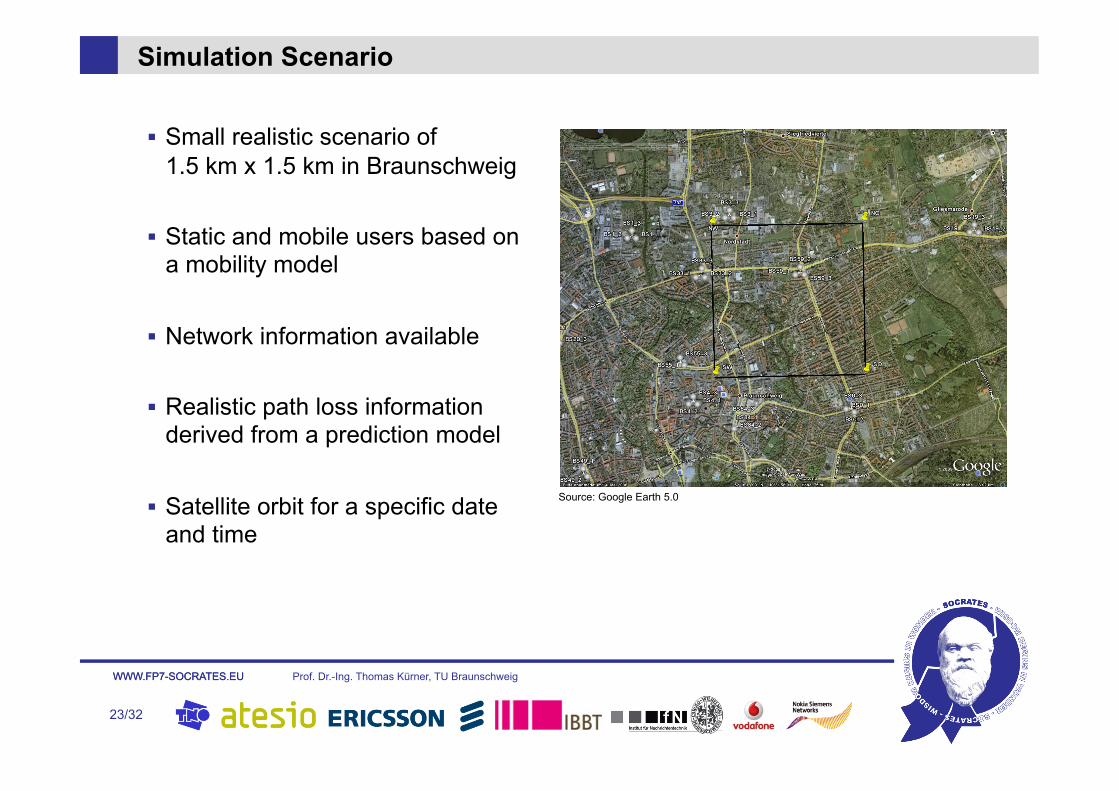
Small realistic scenario of 1.5 km x 1.5 km in Braunschweig
Static and mobile users based on a mobility model
Network information available
Realistic path loss information derived from a prediction model
Satellite orbit for a specific date and time
Simulation Scenario
Source: Google Earth 5.0

WWW.FP7-SOCRATES.EU
24/32
WWW.FP7-SOCRATES.EU Prof. Dr.-Ing. Thomas Kürner, TU Braunschweig
Position Error Modelling - GPS
Application of Ray-Tracing to determine LOS Satellite-MS
WWW.FP7-SOCRATES.EU
25/32
WWW.FP7-SOCRATES.EU Prof. Dr.-Ing. Thomas Kürner, TU Braunschweig
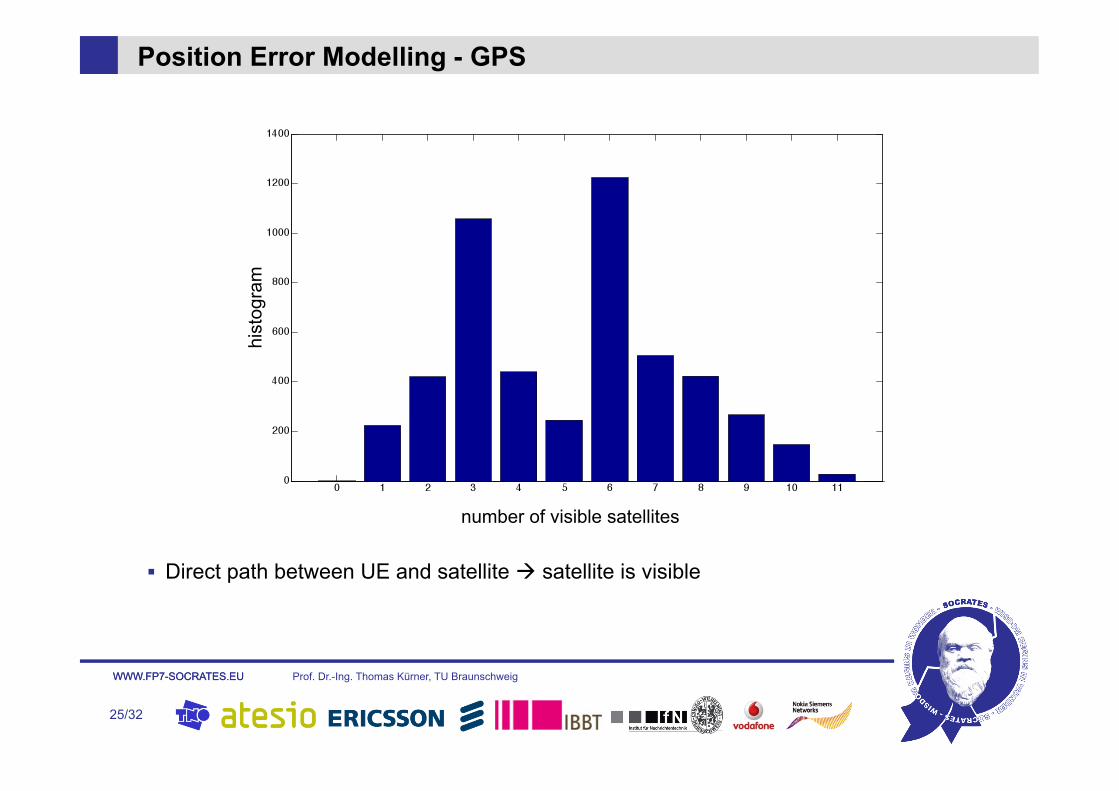
Direct path between UE and satellite satellite is visible
Position Error Modelling - GPS
number of visible satellites
hist
ogra
m

WWW.FP7-SOCRATES.EU
26/32
WWW.FP7-SOCRATES.EU Prof. Dr.-Ing. Thomas Kürner, TU Braunschweig
At the moment successive positions are uncorrelated Next step: applying some kind of filter to get a "flat" route
Position Error Modelling - GPS
WWW.FP7-SOCRATES.EU
27/32
WWW.FP7-SOCRATES.EU Prof. Dr.-Ing. Thomas Kürner, TU Braunschweig
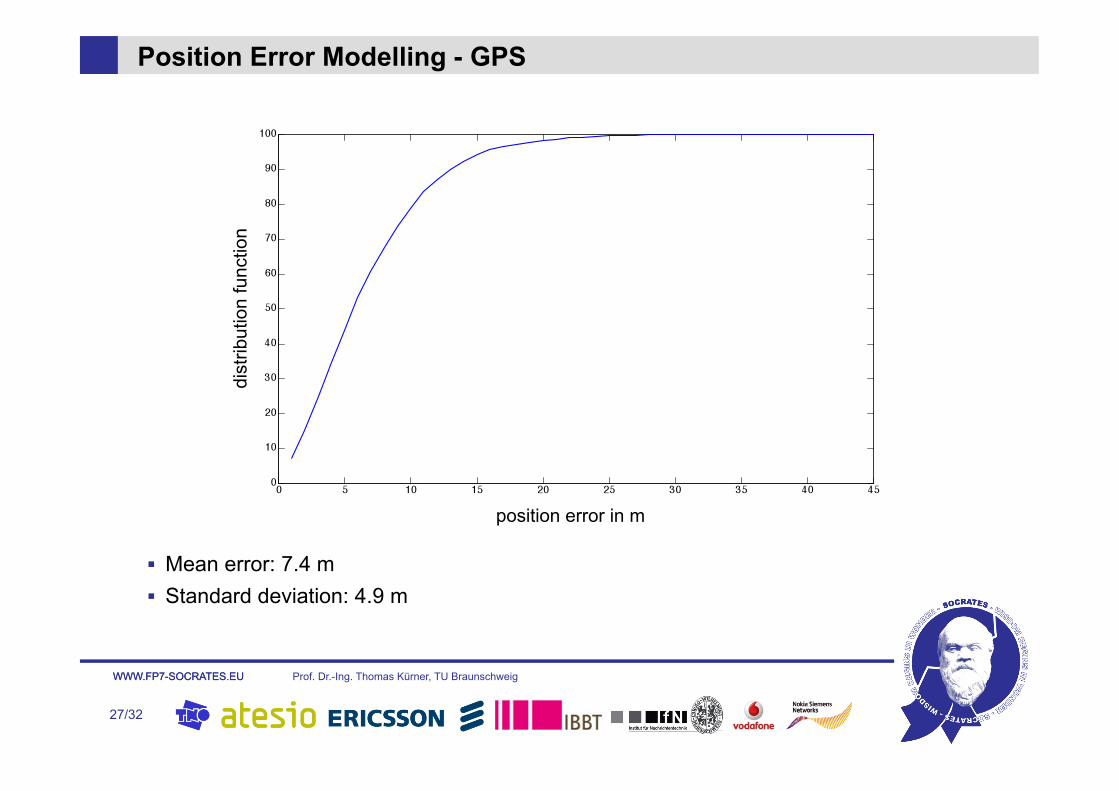
Mean error: 7.4 m Standard deviation: 4.9 m
Position Error Modelling - GPS
position error in m
dist
ribut
ion
func
tion

WWW.FP7-SOCRATES.EU
28/32
WWW.FP7-SOCRATES.EU Prof. Dr.-Ing. Thomas Kürner, TU Braunschweig
Poistion Error Modelling - OTDOA
inter-site distance in km
hist
ogra
m
Statistics on inter-site distance in simulation scenario

WWW.FP7-SOCRATES.EU
29/32
WWW.FP7-SOCRATES.EU Prof. Dr.-Ing. Thomas Kürner, TU Braunschweig
Position Error Modelling - OTDOA
σ = 38.9 ns 5 7 10 15 20 30
mean error 14.9 8.9 3.8 4.5 3.9 3.1
standard deviation 11.4 5.8 6.0 2.8 2.4 1.9
position error in m
dist
ribut
ion
func
tion

WWW.FP7-SOCRATES.EU
30/32
WWW.FP7-SOCRATES.EU Prof. Dr.-Ing. Thomas Kürner, TU Braunschweig
Finalise the position error modelling – Applying filter to get a flat route – Applying OTDOA in case of no GPS position – Determining number of measured eNodeBs based on path loss and SINR – Determining standard deviation of measurement error based on SINR
Modelling UE measurement accuracy
Applying X-Map-Estimation to SON use cases
Determining the required accuracy for SON
Next Steps in Position Error Modelling

WWW.FP7-SOCRATES.EU
31/32
WWW.FP7-SOCRATES.EU Prof. Dr.-Ing. Thomas Kürner, TU Braunschweig
Finalise the position error modelling – Applying filter to get a flat route – Applying OTDOA in case of no GPS position – Determining number of measured eNodeBs based on path loss and SINR – Determining standard deviation of measurement error based on SINR
Modelling UE measurement accuracy
Applying X-Map-Estimation to SON use cases
Determining the required accuracy for SON
Next Steps in Position Error Modelling
?

WWW.FP7-SOCRATES.EU
32/32 32/
M. Amirijoo (Ericsson), [email protected]
L. Jorguseski (TNO ICT), [email protected]
T. Kürner (TU Braunschweig), [email protected] (presenting author)
R. Litjens (TNO ICT), [email protected]
M. Neuland (TU Braunschweig), [email protected]
L. C. Schmelz (Nokia Siemens Networks), [email protected]
U. Türke (Atesio), [email protected]
Contact
Thank you very much for
your attention
FP7 ICT-SOCRATES


![Cell outage management in LTE networks [.pdf]](https://img.dokumen.tips/doc/110x75/584d41631a28ab857390778d/cell-outage-management-in-lte-networks-pdf.jpg)


