Embed Size (px)
Citation preview

CELL DEATH MECHANISMS AT THE ENDOPLASMIC RETICULUM
CELL DEATH MECHANISMS AT THE ENDOPLASMIC RETICULUM
By FEI GENG, M.Sc.
A Thesis Submitted to the School of Graduate Studies in Partial Fulfillment of the
Requirements for the Degree Doctor of Philosophy
McMaster University Copyright by Fei Geng, October 2012
PhD Thesis - Fei Geng McMaster- Biochemistry and Biomedical Sciences
ii
DOCTOR OF PHILOSOPHY (2012) McMaster University
(Biochemistry and Biomedical Sciences) Hamilton, Ontario
TITLE: Cell death mechanisms at the endoplasmic reticulum
AUTHOR: Fei Geng, M.Sc. (Fudan University)
SUPERVISOR: Professor David W. Andrews
NUMBER OF PAGES: xi, 143

PhD Thesis - Fei Geng McMaster- Biochemistry and Biomedical Sciences
iii
ABSTRACT
In the recent years considerable progress has been made to understand how the protein
Bcl-2 regulates apoptosis at the mitochondria. By comparison, the cell death mechanisms
at the endoplasmic reticulum remain unclear. In response to the agents that cause
endoplasmic reticulum stress in breast cancer cells, the cell-cell adhesion molecule E-
cadherin is modified by two independent modifications comprising pro-region retention
and O-glycosylation. Both the modifications on E-cadherin inhibit its cell surface
transport and the resultant loss of E-cadherin on the plasma membrane sensitizes cells to
apoptosis. During this process binding of E-cadherin to type I gamma
phosphatidylinositol phosphate kinase (PIPKIγ), a protein required for E-cadherin
trafficking to the plasma membrane is prevented by O-glycosylation. E-cadherin deletion
mutants that cannot be O-GlcNAcylated continue to bind PIPKIγ, traffick to the cell
surface and delay apoptosis, confirming the biological significance of the modifications
and PIPKIγ binding in the cell death regulation. These results also led me to determine
whether there is a cell death pathway in which commitment to cell death is mediated by
proteins primarily located at the endoplasmic reticulum. The studies show that the growth
of estrogen receptor-positive breast cancer cells in charcoal stripped bovine serum leads
to a form of programmed cell death which is protected by Bcl-2 exclusively localized at
the endoplasmic reticulum instead of the mitochondria. Interestingly, the BH3 mimetic
ABT-737 can abolish the protection mediated by Bcl-2 localized at the endoplasmic
reticulum. Taken together, these studies suggest the novel role of the endoplasmic
reticulum in programmed cell death through the identification and elucidation of the
mechanisms that regulate the cell death pathway at this organelle.
PhD Thesis - Fei Geng McMaster- Biochemistry and Biomedical Sciences
iv
ACKNOWLEDGEMENTS
I wish to thank the following people for specific contributions to this thesis:
In Chaper 3,
Weijia Zhu for the preliminary research work on E-cadherin O-glycosylation
In Chaper 4,
Hetal Brahmbhatt and Frank Chan for their involvement in the optimization of
charcoal stripped bovine serum conditions
In Chaper 5,
Tony Collins for Figure 5.2, Figure 5.3C and Figure 5.4C
Sudeepa Dixit for the classification analysis and feature extraction

PhD Thesis - Fei Geng McMaster- Biochemistry and Biomedical Sciences
v
TABLE OF CONTENTS
Chapter 1 : General Introduction ......................................................................................... 1
1.1 E-cadherin mediated cell adhesion ............................................................................ 2
1.1.1 The E-cadherin expression in cancer .................................................................. 6
1.1.2 Transcriptional and epigenetic regulation of E-cadherin .................................... 7
1.1.3 E-cadherin pro-region processing ....................................................................... 8
1.1.4 Post-translational regulations of E-cadherin ....................................................... 9
1.2 E-cadherin mediated cell survival signaling ............................................................ 12
1.3 Programmed cell death............................................................................................. 13
1.3.1 Apoptosis .......................................................................................................... 13
1.3.2 Endoplasmic reticulum stress ........................................................................... 16
1.3.3 Autophagy ......................................................................................................... 17
1.4 Bcl-2 family proteins localized on the endoplasmic reticulum................................ 18
1.4.1 Antiapoptotic protein Bcl-2 .............................................................................. 20
1.4.2 Bcl-2 binding partners at the endoplasmic reticulum ....................................... 20
1.5 Investigations presented in this thesis ...................................................................... 25
Chapter 2 : Materials and methods .................................................................................... 27
2.1 Materials .................................................................................................................. 28
2.2 Methods .................................................................................................................... 29
Chapter 3 : Multiple post-translational modifications regulate E-cadherin transport during
apoptosis ............................................................................................................................ 43
3.1 Preface ...................................................................................................................... 44
3.2 Introduction .............................................................................................................. 45
3.3 Results ...................................................................................................................... 46
3.4 Discussion ................................................................................................................ 62
Chapter 4 : The characterization of endoplasmic reticulum specific cell death in breast
cancer cells ......................................................................................................................... 76
4.2 Introduction .............................................................................................................. 78
4.3 Results ...................................................................................................................... 79
4.4 Discussion ................................................................................................................ 99
Chapter 5 Measuring cell death responses by automated image analysis....................... 105
5.1 Preface .................................................................................................................... 106
5.2 Introduction ............................................................................................................ 107
5.3 Results .................................................................................................................... 110
5.4 Discussion .............................................................................................................. 121
Chapter 6 : Concluding remarks ...................................................................................... 124
BIBLIOGRAPHY ............................................................................................................ 128
PhD Thesis - Fei Geng McMaster- Biochemistry and Biomedical Sciences
vi
LIST OF FIGURES
Figure 1.1 E-cadherin mediated cell adhesion.. ................................................................... 4
Figure 1.2 Post-translational regulation of E-cadherin. ....................................................... 9
Figure 3.1 E-cadherin undergoes two independent post-translational modifications in
stressed cells.. ..................................................................................................................... 47
Figure 3.2 E-cadherin O-GlcNAcylation inhibits its trafficking to cell surface by
preventing E-cadherin exit from the endoplasmic reticulum. ............................................ 50
Figure 3.3 The polyserine region in the E-cadherin cytoplasmic domain is required for TG
induced E-cadherin O-GlcNAcylation. .............................................................................. 52
Figure 3.4 The E-cadherin-PIPKIγ interaction is intact after pSer region deletion but is
disrupted by O-GlcNAcylation. ......................................................................................... 54
Figure 3.5 Prevention of E-cadherin O-GlcNAcylation maintains both endogenous and
transfected E-cadherin targeting to the plasma membrane.. .............................................. 57
Figure 3.6 Prevention of E-cadherin O-GlcNAcylation maintains E-cadherin function and
protects cells from stress induced apoptosis. ..................................................................... 60
Figure 3.7 Cellular stress induces multiple modifications of E-cadherin that prevent
trafficking to the plasma membrane................................................................................... 63
Figure 3.8 Multiple agonists cause E-cadherin modifications.. ......................................... 66
Figure 3.9 The effect of E-cadherin O-GlcNAcylation or pro-region retention on its
plasma membrane trafficking............................................................................................. 68
Figure 3.10 Functional evaluation of E-cadherin mutants. ................................................ 69
Figure 3.11 The interaction of E-cadherin with β-catenin or γ-catenin is not affected by
the deletion of the pSer region. .......................................................................................... 70
Figure 3.12 Characterization of intracellular transit and cell surface expression of WT E-
cadherin and deletion mutants............................................................................................ 71
Figure 3.13 E-cadΔpSer maintains E-cadherin surface expression after TG treatment. ... 73

PhD Thesis - Fei Geng McMaster- Biochemistry and Biomedical Sciences
vii
Figure 3.14 The effect of stressors on E-cadherin O-GlcNAcylation and plasma
membrane targeting............................................................................................................ 74
Figure 3.15 The prevention of E-cadherin O-GlcNAcylation maintains the formation of
actin cytoskeleton and cell polarity. ................................................................................... 75
Figure 4.1 Growth in CSBS for 10 days led to endoplasmic reticulum-specific cell death
in MCF-7 cells.. ................................................................................................................. 81
Figure 4.2 The protection of Bcl2-ActA and Bcl2-cb5 against cell death induced by CSBS
compared with other tested conditions............................................................................... 84
Figure 4.3 The supplementation of estrogen in CSBS prevents CSBS-induced cell death.
............................................................................................................................................ 86
Figure 4.4 Bax/Bak activation and mitochondrial membrane potential changes during
CSBS-induced cell death in MCF-7 cells.. ........................................................................ 89
Figure 4.5 Bcl2-cb5 protects against CSBS-induced cell death and the addition of ABT-
737 abolishes the protective effect of Bcl2-cb5 and Bcl2-ActA.. ..................................... 92
Figure 4.6 CSBS-induced cell death in estrogen-receptor positive breast cancer cell lines.
............................................................................................................................................ 94
Figure 4.7 The unfolded protein response, autophagy or Bap31 cleavage does not mediate
CSBS-induced cell death.. ................................................................................................. 98
Figure 5.1 Expression of mCherry-BH3 proteins triggers cytochrome c release that is
inhibited by Bcl-XL. ........................................................................................................ 112
Figure 5.2 Comparison of conventional biochemical assays for apoptosis in MCF-7 cells.
.......................................................................................................................................... 116
Figure 5.3 Quantification of apoptosis based on multiparametric analysis of cells stained
with NAO.. ....................................................................................................................... 118
Figure 5.4 Endoplasmic reticulum stress but not autophagy can be quantified based on
multiparametric analysis of cells stained with NAO.. ..................................................... 120

PhD Thesis - Fei Geng McMaster- Biochemistry and Biomedical Sciences
viii
LIST OF TABLES
Table 1.1 Proposed functions of known endoplasmic reticulum localized Bcl-2 family
proteins. .............................................................................................................................. 19
Table 1.2 Bcl-2 binding partners on the endoplasmic reticulum and their corresponding
function. ............................................................................................................................. 21
Table 4.1 Summary of cellular responses after growth in CSBS..................................... 103
Table 4.2 The profile of prognostic markers in breast cancer cell lines examined in Figure
4.6. .................................................................................................................................... 104

PhD Thesis - Fei Geng McMaster- Biochemistry and Biomedical Sciences
ix
LIST OF ABBREVIATIONS AND SYMBOLS
ActD Actinomycin D
AJ Adherens junction
AP Adaptor Protein
ATF6 Activating transcription factor 6
Bap31 B-cell receptor-associated protein 31
BCA Bicinchoninic assay
Bcl-2 B-cell lymphoma 2
BFA Brefeldin A
BIK Bcl-2-interacting killer
BH Bcl-2 homology
Bp Base pair
BSA Bovine serum albumin
CD Cytoplasmic domain
CER Ceramide
CHOP C/EBP homologous protein
CL Cardiolipin
CpG Cytosine-phosphate-guanine
CSBS Charcoal stripped bovine serum
D5 DRAQ5
DNA Deoxyribonucleic acid
DTT Dithiothreitol
EC Extracellular cadherin domain
EMT Epithelial-mesenchymal transition
Endo H Endoglycosidase H
FBS Fetal bovine serum
FI Furin inhibitor

PhD Thesis - Fei Geng McMaster- Biochemistry and Biomedical Sciences
x
FITC Fluorescein isothiocyanate
GlcNAc N-acetylglucosamine
GRP78 Glucose-regulated protein 78
HA Hemagglutinin
HER2 Human epidermal growth factor receptor 2
IB Immunoblot
IP Immunoprecipitation
IP3 Inositol 1,4,5-trisphosphate
IRE1 Inositol-requiring enzyme 1
LC3 Light chain 3
kDa Kilodalton
mAb Monoclonal antibody
MDCK Madin-Darby Canine Kidney
MOMP Mitochondrial outer membrane permeabilization
mRNA Messenger RNA
MUT Mutant
NAF-1 Nutrient-deprivation autophagy factor-1
NAO Acridine Orange 10-nonyl bromide (10-N-nonyl acridine orange)
O-GlcNAc O-linked N-acetylglucosamine
OGT O-GlcNAc transferase
PARP Poly (ADP-ribose) polymerase
PBS Phosphate buffered saline
PERK PKR-like endoplasmic reticulum kinase
PI Propidium iodide
PIPKIγ Type I gamma phosphatidylinositol phosphate kinase
PNGase F Peptide:N-glycosidase F
PR Progesterone receptor
PS Phosphatidylserine

PhD Thesis - Fei Geng McMaster- Biochemistry and Biomedical Sciences
xi
pSer Polyserine
PtdIns(4,5)P2 Phosphatidylinositol(4,5)-bisphosphate
RNA Ribonucleic acid
SDS Sodium dodecyl sulfate
Ser Serine
SERCA Sarcoplasmic/ endoplasmic reticulum calcium ATPase
shRNA Short hairpin RNA
siRNA Small interfering RNA
STS Staurosporine
SVM Support Vector Machines
TAM Tamoxifen
TCA Trichloroacetic acid
TG Thapsigargin
TGN Trans Golgi Network
TM Transmembrane domain
TMRE Tetramethylrhodamine, Ethyl Ester
TRAIL TNF-related apoptosis-inducing ligand
TN Tunicamycin
TNF- Tumor necrosis factor-
Tyr Tyrosine
UPR Unfolded protein response
WGA Wheat germ agglutinin
WT Wild type
XBP-1 X-box-binding protein 1
Δψm Mitochondrial membrane potential

PhD Thesis - Fei Geng McMaster- Biochemistry and Biomedical Sciences
1
Chapter 1 : General Introduction
PhD Thesis - Fei Geng McMaster- Biochemistry and Biomedical Sciences
2
1.1 E-cadherin mediated cell adhesion
Cells do not simply "stick" together to form tissues. Cell adhesion is crucial for the
assembly of individual cells into the three-dimensional tissues of animals. The ability of
cells to form cell contacts, adhere to the extracellular matrix, change morphology, and
migrate is essential for development, wound healing, metastasis, cell survival and the
immune response (Ling, Doughman, Firestone, Bunce, & Anderson, 2002). It is therefore
important to understand how cell-cell adhesion mechanisms evolved and how they have
contributed to the generation of diversity among animal species. A variety of cell
adhesion mechanisms are responsible for assembling cells together and along with their
connections to the internal cytoskeleton, determine the overall architecture of the tissue.
Epithelia in the vertebrates typically have a junctional complex comprising tight
junctions, adherens junctions (AJ), and desmosomes; these junctional types are located in
this order starting from the apical end of the lateral cell-cell contacts (Oda & Takeichi,
2011).
Cell-cell adhesion at adherens junctions is predominantly mediated by cadherins, a
superfamily of transmembrane glycoprotein adhesion molecules. Cadherins are divided
into different sub-classes (such as E-cadherin, N-cadherin, P-cadherin) characterized by
their distinct tissue distributions.
E-cadherin, a type-I single-span transmembrane protein, is an endogenous
adhesion molecule of epithelial cells. It is generally considered to be the prototype of all
cadherins because of its early identification and its thorough characterization, both in
normal and pathological conditions. As early as 1977, Takeichi (Pagano & Takeichi,
1977) proposed that the adhesive properties of the V79 Chinese hamster lung cell line
could be divided into Ca2+
-independent agglutination, and a more physiological Ca2+
-
dependent cell-cell adhesion. By iodinating surface proteins, Takeichi discovered that a
surface protein of about 150 Kilodalton (kDa) was protected by Ca2+
against iodination
and trypsinization. This was probably the first report on E-cadherin and its Ca2+
-
PhD Thesis - Fei Geng McMaster- Biochemistry and Biomedical Sciences
3
dependent adhesion potential. However, at that time this interesting adhesion molecule of
120 kDa was called uvomorulin. In 1984, Yoshida-Noro and Takeichi (Kanno, Sasaki,
Shiba, Yoshida-Noro, & Takeichi, 1984) introduced the name “cadherins” as a more
generic name for this important class of cell-cell adhesion molecules, and over time this
name became generally adopted. E-cadherin obtained its prefix E (for epithelial) when
new antibodies produced by Takeichi’s group revealed the existence of other related
cadherins, like N- (neural) and P- (placental) cadherins, which have distinct
spatiotemporal expression patterns throughout development (van Roy & Berx, 2008).
Mature E-cadherin, with molecular mass of 120 kDa, is composed of a highly
conserved carboxy-terminal cytoplasmic domain, a single-pass transmembrane domain
and an extracellular domain that consists of five tandemly repeated cadherin-motif
subdomains (EC1-EC5), each harbouring two conserved regions representing the putative
calcium binding sites (Beavon, 2000).
The widely accepted model on E-cadherin mediated cell-cell adhesion is the 'linear
zipper' model. This model is based on the crystal structure of the extracellular cadherin
domain (EC) and two dimerization interfaces which were observed in EC (Shapiro, et al.,
1995). One was thought to mediate cis-dimerization formed by binding of the
extracellular domains of two cadherins on the same cell surface (Figure 1.1A), in which
the tryptophan residue of each subunit inserts into a hydrophobic pocket on the other EC1
subunit (Shapiro, et al., 1995). The second putative adhesion dimer interface is trans-
dimerization (Gumbiner, 2005; Takeichi, 2007) formed by binding of extracellular
domains of two cadherins between the EC1 domains on opposing cell surfaces (Figure
1.1A).

PhD Thesis - Fei Geng McMaster- Biochemistry and Biomedical Sciences
4
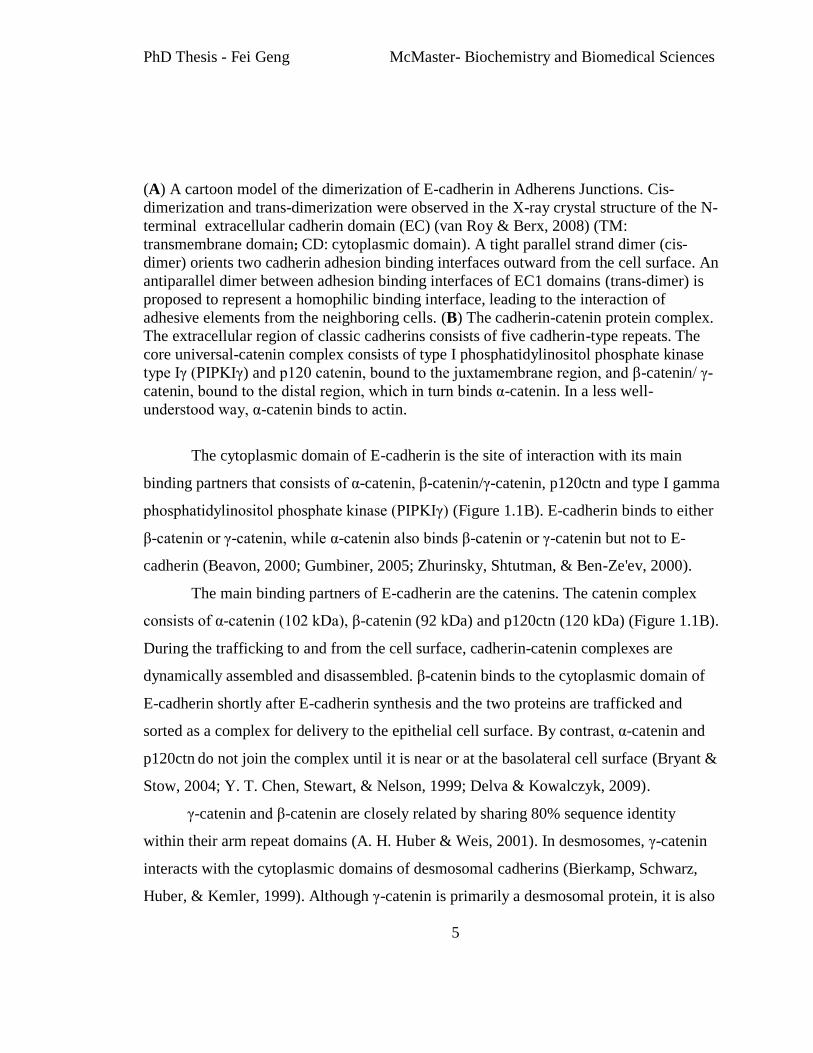
Figure 1.1 E-cadherin mediated cell adhesion. Legend see next page.
A
B
PhD Thesis - Fei Geng McMaster- Biochemistry and Biomedical Sciences
5
(A) A cartoon model of the dimerization of E-cadherin in Adherens Junctions. Cis-
dimerization and trans-dimerization were observed in the X-ray crystal structure of the N-
terminal extracellular cadherin domain (EC) (van Roy & Berx, 2008) (TM:
transmembrane domain; CD: cytoplasmic domain). A tight parallel strand dimer (cis-
dimer) orients two cadherin adhesion binding interfaces outward from the cell surface. An
antiparallel dimer between adhesion binding interfaces of EC1 domains (trans-dimer) is
proposed to represent a homophilic binding interface, leading to the interaction of
adhesive elements from the neighboring cells. (B) The cadherin-catenin protein complex.
The extracellular region of classic cadherins consists of five cadherin-type repeats. The
core universal-catenin complex consists of type I phosphatidylinositol phosphate kinase
type Iγ (PIPKIγ) and p120 catenin, bound to the juxtamembrane region, and β-catenin/ γ-
catenin, bound to the distal region, which in turn binds α-catenin. In a less well-
understood way, α-catenin binds to actin.
The cytoplasmic domain of E-cadherin is the site of interaction with its main
binding partners that consists of α-catenin, β-catenin/γ-catenin, p120ctn and type I gamma
phosphatidylinositol phosphate kinase (PIPKIγ) (Figure 1.1B). E-cadherin binds to either
β-catenin or γ-catenin, while α-catenin also binds β-catenin or γ-catenin but not to E-
cadherin (Beavon, 2000; Gumbiner, 2005; Zhurinsky, Shtutman, & Ben-Ze'ev, 2000).
The main binding partners of E-cadherin are the catenins. The catenin complex
consists of α-catenin (102 kDa), β-catenin (92 kDa) and p120ctn (120 kDa) (Figure 1.1B).
During the trafficking to and from the cell surface, cadherin-catenin complexes are
dynamically assembled and disassembled. β-catenin binds to the cytoplasmic domain of
E-cadherin shortly after E-cadherin synthesis and the two proteins are trafficked and
sorted as a complex for delivery to the epithelial cell surface. By contrast, α-catenin and
p120ctn do not join the complex until it is near or at the basolateral cell surface (Bryant &
Stow, 2004; Y. T. Chen, Stewart, & Nelson, 1999; Delva & Kowalczyk, 2009).
γ-catenin and β-catenin are closely related by sharing 80% sequence identity
within their arm repeat domains (A. H. Huber & Weis, 2001). In desmosomes, γ-catenin
interacts with the cytoplasmic domains of desmosomal cadherins (Bierkamp, Schwarz,
Huber, & Kemler, 1999). Although γ-catenin is primarily a desmosomal protein, it is also
PhD Thesis - Fei Geng McMaster- Biochemistry and Biomedical Sciences
6
found in adherens junctions to a limited extent (Troyanovsky, Chitaev, & Troyanovsky,
1996).
Phosphatidylinositol(4,5)-bisphosphate [PtdIns(4,5)P2] controls the dynamic
turnover of the actin cytoskeleton and focal adhesions, which are crucial to a migrating
cell (Ling, Schill, Wagoner, Sun, & Anderson, 2006). Most PtdIns(4,5)P2 is synthesized
by the type I PIPKs (PIPKIs) in vivo (Stephens, Hughes, & Irvine, 1991). PIPKIγ, the
newest member of the family, was found to be targeted to focal adhesions by an
association with talin. It acts as a signaling scaffold that links Adaptor Protein (AP)
complexes to E-cadherin (Ling, et al., 2007; Ling, et al., 2002). PIPKIγ directly binds to
E-cadherin and modulates E-cadherin trafficking. Thus, depletion of PIPKIγ or disruption
of PIPKIγ binding to either E-cadherin or AP complexes results in defects in E-cadherin
transport and blocks AJ assembly (Ling, et al., 2007).
1.1.1 E-cadherin expression in cancer
Intercellular interactions are critical for the dynamic differentiation processes
activated periodically in normal human breast epithelium throughout life, as well as for
the induction and maintenance of differentiated tissues in adults (Berx & Van Roy, 2001).
Changes in the normal expression pattern of the E-cadherin complex have been found in
various human cancers. In breast cancer, partial or total loss of E-cadherin expression
correlates with loss of markers of differentiated breast tissue, acquisition of invasiveness,
increased tumor grade, metastatic behavior and poor prognoses (Lombaerts, et al., 2006).
E-cadherin mediates cell-cell adhesion by calcium-dependent homotypic
interactions between E-cadherin extracellular domains on opposing membranes of
contacting cells. The 5-10-hour half-life for E-cadherin in confluent epithelial cells make
cell contacts or junctions susceptible to alterations or remodeling by a number of
regulatory mechanisms (Oda & Takeichi, 2011). These mechanisms include: changes in
gene expression; control of the biogenesis, transport or turnover of cell junctions; AJ
formation associated with major changes in cell states, such as the epithelial-

PhD Thesis - Fei Geng McMaster- Biochemistry and Biomedical Sciences
7
mesenchymal transition (EMT). Numerous phenotypic changes occur through the process
of EMT (Savagner, 2001). EMT involving down-regulation of E-cadherin plays a
fundamental role during early steps of invasion and metastasis of carcinoma cells. Upon
downregulation of E-cadherin, epithelial cells acquire a fibroblastic phenotype, which
allows them to dissociate from the epithelium and migrate. This process is essential for
cancer metastasis.
1.1.2 Transcriptional and epigenetic regulation of E-cadherin
E-cadherin dysfunction is a major contributor to the development and progression
of cancers involving epithelial cell types. Such dysfunction can occur through several
molecular mechanisms including mutations of the E-cadherin gene CDH1 (Berx, Becker,
Hofler, & van Roy, 1998); epigenetic silencing through promoter hypermethylation
(Graziano, Humar, & Guilford, 2003), or transcriptional silencing through a variety of
transcriptional repressors that target the CDH1 promoter (Batlle, et al., 2000; Bolos, et al.,
2003; M. A. Huber, Kraut, & Beug, 2005), and by microRNAs, which have been shown
to indirectly regulate the expression of E-cadherin (Pinho, et al., 2011).
Mutational inactivation of CDH1 has been found in 56% of lobular breast
carcinomas (Berx, et al., 1996). Genetic screens identified at least 122 CDH1 germline
mutations (Corso, Marrelli, Pascale, Vindigni, & Roviello, 2012). In addition to a few
missense mutations, the majority of mutations were splice site mutations and truncation
mutations caused by insertions, deletions, and nonsense mutations (Berx, et al., 1998;
Corso, et al., 2012; Schrader, et al., 2011).
Other than mutational inactivation, epigenetic silencing of the CDH1 gene by
aberrant hypermethylation of a promoter-associated cytosine-phosphate-guanine (CpG)
island, a GC-rich sequence of about 1500 base pair (bp) in intron 1 of the human E-
cadherin gene has been identified (Berx, et al., 1995; Graff, Gabrielson, Fujii, Baylin, &
Herman, 2000; Tamura, et al., 2000; Zou, et al., 2009). The mechanistic association
between aberrant CpG island methylation and transcriptional silencing is complicated
PhD Thesis - Fei Geng McMaster- Biochemistry and Biomedical Sciences
8
(Baylin, Herman, Graff, Vertino, & Issa, 1998; Jones, 1996). In normal cells, the
promoter region CpG islands of E-cadherin are unmethylated and maintain a
transcriptionally favorable local chromatin configuration (Graff, et al., 2000). Aberrant
methylation of these normally unmethylated CpG islands is associated with
underacetylated histones and a shift to a transcriptionally repressive chromatin structure
(Graff, et al., 2000).
The transcription of E-cadherin is controlled by both positive- and negative-
regulatory elements located in the 5' proximal sequences of its promoter region (Behrens,
Lowrick, Klein-Hitpass, & Birchmeier, 1991; Cano, et al., 2000; Ringwald, Baribault,
Schmidt, & Kemler, 1991). Zinc-finger transcription repressors of E-cadherin acting
through interaction with specific E-boxes of the proximal promoter, Snail/Slug, E12/47,
ZEB-1, SIP-1 and Twist have been characterized (Cano, et al., 2000; M. A. Huber, et al.,
2005).
MicroRNAs are small non-coding Ribonucleic acid (RNA) molecules that
suppress gene expression mostly by interacting with the 3’ untranslated regions of target
messenger RNAs, which are increasingly implicated in regulating the malignant
progression of cancer. MiR-9, a microRNA which is upregulated in breast cancer cells,
directly targets the E-cadherin-encoding messenger RNA (mRNA) and leads to increased
cell motility and invasiveness (Ma, et al., 2010).
1.1.3 E-cadherin pro-region processing
Newly synthesized E-cadherin is trafficked from the trans Golgi network (TGN) to
the cell surface for incorporation, together with catenins, into AJ complexes. Surface E-
cadherin can be endocytosed. During this process it encounters a variety of trafficking
steps that either recycle it back to the cell surface or target it for degradation (Bryant &
Stow, 2004).
In the E-cadherin trafficking route, the TGN is the first major site for differential
regulation or sorting of newly synthesized E-cadherin. E-cadherin is synthesized as a 140

PhD Thesis - Fei Geng McMaster- Biochemistry and Biomedical Sciences
9
kDa precursor that undergoes transportation from the endoplasmic reticulum to the Golgi
complex followed by cleavage of the pro-region mediated by the proprotein convertase
family at the TGN. The cleavage of the pro-region results in the formation of the
extracellular N-terminal end of the mature molecule (Beavon, 2000). E-cadherin
precursor resulting from the inhibition of pro-region cleavage do not mediate adhesive
function as the extracellular N-terminal end of E-cadherin is essential for the homotypic
calcium-dependent cell-cell adhesion (Ozawa & Kemler, 1990).
Figure 1.2 Post-translational regulation of E-cadherin.
E-cadherin can be post-translationally modified through phosphorylation, N-glycosylation
and O-glycosylation. The phosphorylation of E-cadherin by casein kinase II can occur in
a short stretch of 30 amino acids in the cytoplasmic domain (CD), which contains a
cluster of 8 Serine (Ser) residues. The extracellular domain (EC) of human E-cadherin
contains four potential N-glycosylation sites, which are located in EC4 and EC5. The
modification of O-linked N-acetylglucosamine (O-GlcNAc) in the cytoplasmic domain
has been reported to regulate E-cadherin transport (Zhu, Leber, & Andrews, 2001). These
modifications can modulate E-cadherin mediated cell-cell adhesion at a post-translational
level (Pinho, et al., 2011).
1.1.4 Post-translational regulation of E-cadherin
Beyond the modes of regulation mentioned above, E-cadherin function is tightly
regulated by post-translational modifications including phosphorylation and glycosylation
PhD Thesis - Fei Geng McMaster- Biochemistry and Biomedical Sciences
10
in response to cellular context and signaling (Lilien & Balsamo, 2005; Liwosz, Lei, &
Kukuruzinska, 2006).
The structural integrity of the cadherin-catenin complex is positively and
negatively regulated by kinases that are often up-regulated during dynamic cell
movements in development and in cancer (Daniel & Reynolds, 1997). Tyrosine (Tyr)
phosphorylation of β-catenin at Tyr489 or Tyr654 disrupts binding to cadherin, and
tyrosine phosphorylation of β-catenin at Tyr142 disrupts binding to α-catenin (Rosivatz,
et al., 2002). Three serine residues in the cadherin cytoplasmic domain (Ser684, Ser686
and Ser692) are phosphorylated by the protein kinases casein kinase II and glycogen
synthase kinase 3β, which create additional interactions with β-catenin resulting in a large
increase in the affinity of the interaction. Specifically, in vitro phosphorylation of
cadherin serine residues 834, 836, and 842 enhances the affinity with which β-catenin
binds E-cadherin by 300-fold (Daugherty & Gottardi, 2007)
Glycosylation is an important and common form of post-translational modification
of proteins and involves the enzymatic attachment of glycans to asparagine (N-linked
glycans) and serine or threonine (O-linked glycans) (Nwosu, et al., 2011).
Regarding N-glycosylation, the resulting structures are generally classified into
three principal categories: (1) high-mannose-type, in which only α-mannose residues are
attached to the core structure. The total number of mannose residues is often five to nine.
(2) complex-type, in which N-acetylglucosamine (GlcNAc) residues are linked to the two
α-mannose residues of the core. (3) hybrid- type oligosaccharides have structures
composed of elements characteristic of both high-mannose and complex-type glycans.
The extracellular domain of E-cadherin undergoes extensive N-glycosylation and
contains four potential N-glycosylation sites at asparagine residues 554, 566, 618 and 633
(Liwosz, et al., 2006). Two of the putative N-glycosylation sites of human E-cadherin are
located in extracellular domain 4 (EC4) whereas the other two sites are in EC5 (Figure
1.2).

PhD Thesis - Fei Geng McMaster- Biochemistry and Biomedical Sciences
11
The glycosyltransferases including N-acetylglucosaminyltransferase III, N-
acetylglucosaminyltransferase V, and the α1,6 fucosyltransferase enzyme are involved in
the remodeling of N-glycans on E-cadherin (Geng, Shi, Yuan, & Wu, 2004). The N-
glycan products of these enzymes are bisecting GlcNAc structures, β1,6 Glc-NAc
branched structures and α1,6 fucose N-glycan structure (Geng, et al., 2004; Liwosz, et al.,
2006). N-glycans on E-cadherin destabilize AJ by affecting their molecular organization
(Liwosz, et al., 2006; Pinho, et al., 2011). E-cadherin N-glycosylation variant lacking the
major complex N-glycan exhibits increased association with the actin cytoskeleton and
greater interaction with vinculin, an important component of cell-matrix adhesions (Peng,
Cuff, Lawton, & DeMali, 2010). Likewise, a variant missing both complex and high
mannose/hybrid N-glycans displays an enhanced association with γ-catenin and vinculin
compared with either the wild type or endogenous E-cadherin (Liwosz, et al., 2006). Thus
N-glycans influence the stability of AJs by affecting their molecular organization.
Extensive modification of E-cadherin with complex N-glycans renders the formation of
dynamic but weak AJs, whereas diminished N-glycosylation of E-cadherin promotes the
establishment of stable AJs (Liwosz, et al., 2006).
However, in comparison with glycosylation of the extracellular domains of the
protein, the regulation and consequences of O-glycosylation of the cytoplasmic domain of
E-cadherin have been studied less extensively. O-glycosylation comprises extracellular
O-glycosylation (mucin-type glycosylation) and intracellular O-GlcNAc (O-linked β-N-
acetylglucosamine) modification (Julenius, Molgaard, Gupta, & Brunak, 2005)
O-GlcNAc is a monosaccharide modification abundant on serine and threonine
residues of a multitude of nucleocytoplasmic proteins (Hart, Housley, & Slawson, 2007).
O-GlcNAcylation has been found in almost every intracellular compartment and is
especially abundant on proteins involved in stress responses and energy metabolism (Hart,
et al., 2007). The enzymes responsible for O-GlcNAc addition and removal are OGT (O-
GlcNAc transferase) and O-GlcNAcase (neutral β-N-acetylglucosaminidase), respectively.
PhD Thesis - Fei Geng McMaster- Biochemistry and Biomedical Sciences
12
The cytoplasmic region of E-cadherin is post-translationally modified by O-
GlcNAc in response to treatment of cells with thapsigargin (TG) an irreversible inhibitor
of the sarcoplasmic/endoplasmic reticulum calcium ATPase (SERCA) (Zhu, et al., 2001).
TG is a well-established inducer of endoplasmic reticulum stress (Lytton, Westlin, &
Hanley, 1991) and it decreases E-cadherin-mediated intercellular adhesion by preventing
transport to the plasma membrane by an unidentified mechanism (Zhu, et al., 2001). In
addition to O-GlcNAcylation, TG was suggested to mediate other post-translational
modification(s), as treatment of cells resulted in the apparent molecular weight of E-
cadherin increasing by 20 kDa an increase much larger than the molecular weight of O-
GlcNAc added to serine and threonine residues by OGT (Vosseller, Wells, & Hart, 2001).
The significance and relationship of other modification(s) to O-GlcNAcylation is
unknown. In this thesis I extend these findings by characterizing two independent
modifications of E-cadherin and addressing the relevant biological significance.
1.2 E-cadherin mediated cell survival signaling
E-cadherin mediated cell anchorage not only provides structural anchorage for a
cell but also mediates pivotal cell survival signals (Grossmann, 2002). The disturbance of
cell anchorage will frequently lead to the immediate initiation of a suicide program called
anoikis. This form of programmed cell death is a special form of apoptosis triggered by
the loss of cell anchorage between cells. In chimeric mice, the disruption of cadherin
function in vivo leads to increased prevalence of apoptosis in intestinal epithelial cells. In
primary mouse mammary gland epithelial cells, anoikis is inhibited by preservation of
cell-cell anchorage despite loss of cell-matrix anchorage (Grossmann, 2002).
Upon examination of mammary epithelial cell lines in suspension, Overholtzer et
al. revealed that detachment of mammary epithelial cells from the extracellular matrix
initiates a new pathway of non-apoptotic cell death called entosis in which one cell
invades into another (Overholtzer, et al., 2007; White, 2007). Similar to anoikis, entosis is
E-cadherin dependent and can be inhibited by cadherin-blocking antibodies in MCF-7

PhD Thesis - Fei Geng McMaster- Biochemistry and Biomedical Sciences
13
cells (Overholtzer, et al., 2007), which indicates that E-cadherin mediated cell-cell
adhesion is involved in the regulation of programmed cell death pathways.
1.3 Programmed cell death
Cell death plays an essential role in the development of tissues and organisms
(Danial & Korsmeyer, 2004). Dysregulated cell death is a common feature of many
human diseases, including cancer, stroke and neurodegeneration, and modulation of this
cellular response has proved to be an effective therapeutic strategy. For example, imatinib,
which inhibits the Abl tyrosine kinase that is activated by the Philadelphia translocations
is shown to induce cancer cell death and to be highly effective in the treatment of all
stages of chronic myelogenous leukemia (Capdeville, Buchdunger, Zimmermann, &
Matter, 2002; Gerl & Vaux, 2005). Cell death responses including apoptosis, endoplasmic
reticulum stress and autophagy will be introduced in the following section.
1.3.1 Apoptosis
Apoptotic cells are characterized by the condensation of the nucleus, a decrease in
cell size and plasma membrane blebbing (Kerr, Wyllie, & Currie, 1972; Wyllie, Kerr, &
Currie, 1980). At the molecular level, several common features are often associated with
apoptosis: loss of mitochondrial membrane potential, cytochrome c release, activation of
a family of cysteine proteases called caspases and exposure of phosphatidylserine (PS) to
the extracellular space. The initiation of apoptosis can occur through a variety of both
external and internal cues that are integrated somewhat differently, and hence these
events have been broadly divided into extrinsic and intrinsic pathways (Leber, Geng, Kale,
& Andrews, 2010; Shamas-Din, Brahmbhatt, Leber, & Andrews, 2011).
1.3.1.1 Extrinsic cell death pathway

PhD Thesis - Fei Geng McMaster- Biochemistry and Biomedical Sciences
14
Extrinsic apoptotic pathways are initiated by the binding of extracellular “death”
ligands such as tumour necrosis factor- (TNF-), TNF-related apoptosis-inducing ligand
(TRAIL) or Fas ligand to their respective “death” receptors on the plasma membrane. The
binding of “death” ligands to their receptors results in receptor trimerization and the
recruitment of a variety of adaptor proteins on the cytoplasmic side of the plasma
membrane (Baud & Karin, 2001). Ultimately, for this complex to induce apoptosis, the
recruitment of multiple procaspase-8 molecules is required (Muzio, Stockwell, Stennicke,
Salvesen, & Dixit, 1998). In certain cells, designated as type I cells, activation of caspase-
8 directly leads to the activation of broad spectrum effector caspases such as caspase-3 or
caspase-7, effectively bypassing the decision stage of apoptosis and initiating the
execution stage (Scaffidi, et al., 1998). However, in the majority of cells the activation of
effector caspases by caspase-8 requires the cleavage of Bid, a member of the B-cell
lymphoma 2 (Bcl-2) family of proteins (S. Li, et al., 2002; Yin, et al., 1999), which
inserts into the outer mitochondrial membrane and engages the mitochondrial pathway
(H. Li, Zhu, Xu, & Yuan, 1998; Luo, Budihardjo, Zou, Slaughter, & Wang, 1998).
The extrinsic or “death receptor” pathway of apoptosis is a highly regulated
pathway, and the activation of caspase-8 can be inhibited by a variety of mechanisms,
most of which rely on the transcriptional activity of NF-B which is also activated during
“death receptor” signaling by TNF- and TRAIL (L. Wang, Du, & Wang, 2008).
1.3.1.2 Intrinsic apoptosis pathway
While the initiation of the extrinsic pathway of apoptosis occurs on the plasma
membrane through the actions of “death” ligands, the intrinsic pathway can be initiated
by a variety of mechanisms that disrupt or alter cellular processes at various locations
throughout the cell and is executed through the interactions between the Bcl-2 family
proteins (H. L. Wang, et al., 2007).
The mitochondria are of central importance in the apoptotic process. The
embedded together model proposes that antiapoptotic proteins are able to sequester both
PhD Thesis - Fei Geng McMaster- Biochemistry and Biomedical Sciences
15
activated Bax and Bcl-2 homology 3 (BH3)-only activators on the mitochondria. BH3-
only sensitizers displace Bax and BH3-only activators from the antiapoptotic proteins.
The ‘freed’ Bax can oligomerise whereas the BH3-only activators can bind and recruit
additional Bax, which also oligomerises, resulting in pore formation and mitochondrial
outer membrane permeabilization (MOMP) (Leber, Lin, & Andrews, 2007). Cytochrome
c binds to an adaptor molecule called Apaf-1, which results in the activation of caspases
(Green & Reed, 1998). Smac/Diablo induces apoptosis by de-repressing the inhibitor of
apoptosis proteins, leading to the activation of caspases, which regulate the induction and
execution of apoptosis (van Loo, et al., 2002). Caspases exist as zymogens until they are
cleaved into their active form. They can be divided into two different categories: the
initiator caspases and the executioner caspases. The initiator caspases are activated by a
variety of molecular cues, and the executioner caspases cleave substrates that catalyze the
dismantling of the cell. Caspase-3 and caspase-7, typical executioner caspases, cleave
multiple downstream targets, among which are ICAD, an inhibitor of a nuclease that
assists in nuclear condensation (Enari, et al., 1998) and poly (ADP-ribose) polymerase
(PARP) (Distelhorst & Shore, 2004). Breast cancer MCF-7 cells lack caspase-3 but
undergo mitochondrial-dependent apoptosis via caspase-7 activation (Twiddy, Cohen,
Macfarlane, & Cain, 2006). In MCF-7 cells procaspase-7 is directly cleaved and activated
by the apoptosome complex (Twiddy, et al., 2006). Upon disruption of the outer
mitochondrial membrane, a set of proteins normally found in the space between the inner
and outer mitochondrial membranes is released, including cytochrome c, Smac/DIABLO,
Omi/HtrA2 and endonuclease G (Saelens, et al., 2004). Once in the cytosol, these
apoptogenic proteins trigger the execution of cell death by promoting caspase activation
or by acting as caspase-independent death effectors (Saelens, et al., 2004).
These mechanisms also include cytotoxic drugs that exert stresses on particular
subcellular locations or organelles such as the endoplasmic reticulum. In this respect, the
induction of apoptosis arises through the activation of a characteristic set of BH3-only
PhD Thesis - Fei Geng McMaster- Biochemistry and Biomedical Sciences
16
proteins that relay apoptotic signals to the mitochondrial pathway to induce outer
mitochondrial membrane permeabilization (Fulda & Debatin, 2006).
1.3.2 Endoplasmic reticulum stress
The endoplasmic reticulum has become key player in a variety of apoptotic
signaling pathways (Heath-Engel, Chang, & Shore, 2008). This organelle represents the
primary site for intracellular Ca2+
storage and is the location for the folding and some
post-translational modification of transmembrane and secreted proteins. Disruption of
these functions of the endoplasmic reticulum can be induced pharmacologically through
agents that selectively disturb calcium homeostasis (thapsigargin, TG) (Booth & Koch,
1989) or redox balance (dithiotreitol, DTT) (Jamsa, Simonen, & Makarow, 1994), inhibit
protein modifications (tunicamycin, TN) (Feige & Scheffler, 1987) or disrupt protein
trafficking (brefeldin A, BFA) (Brostrom, Prostko, Gmitter, & Brostrom, 1995). All of
these signals induce protein misfolding and activation of an adaptive stress response
termed the unfolded protein response (UPR). The UPR attempts to increase the folding
capacity of the endoplasmic reticulum through the induction of key proteins involved in
chaperoning, protein folding, and degradation pathways.
Transduction of the UPR pathway occurs through three endoplasmic reticulum
resident proteins that function as primary sensors of endoplasmic reticulum stress: PKR-
like endoplasmic reticulum kinase (PERK) (Harding, Zhang, & Ron, 1999), inositol-
requiring enzyme 1 (IRE1) (Shen, et al., 2001), and activating transcription factor 6
(ATF6) (Haze, Yoshida, Yanagi, Yura, & Mori, 1999). All three of the stress sensors are
transmembrane proteins containing luminal domains that sense the accumulation of
unfolded proteins within the endoplasmic reticulum lumen. In the absence of stress,
glucose-regulated protein 78 (GRP78) is bound to all three, maintaining the sensors in an
inactive configuration (Bertolotti, Zhang, Hendershot, Harding, & Ron, 2000).
Accumulation of unfolded proteins and the altered redox status within the endoplasmic

PhD Thesis - Fei Geng McMaster- Biochemistry and Biomedical Sciences
17
reticulum lumen up-regulate the expression of GRP78 and trigger its dissociation from all
three sensors, leading to the initiation of UPR signal transduction pathways.
IRE1α is a serine-threonine protein kinase and endoribonuclease that, on
activation, initiates the unconventional splicing of the mRNA encoding X-box-binding
protein 1 (XBP-1) (Calfon, et al., 2002). Spliced XBP-1 is a potent transcriptional
activator that increases the expression of a subset of UPR-related genes and thus XBP-1
splicing is an important marker for UPR (Yoshida, 2007). As one of the target gene of
spliced XBP-1, P58IPK
binds and inhibits PERK, thereby providing a negative feedback
loop that relieves a PERK-mediated translational block (Yan et al, 2002).
If the UPR has been successful at this point, the endoplasmic reticulum returns to
normal functioning and the cell survives; however, if the stress persists, relieving the
translational block by P58IPK
might allow the synthesis of pro-apoptotic proteins.
Signaling through PERK, ATF6 and IRE1 can trigger pro-apoptotic signals during
prolonged endoplasmic reticulum stress. However, they do not directly cause cell death
but rather initiate the activation of downstream transcription factor C/EBP homologous
protein (CHOP) by up-regulating its transcription, which further push the cell down the
path of death (Szegezdi, Logue, Gorman, & Samali, 2006).
Activated PERK directly phosphorylates and inhibits the translation initiation
factor eIF2α (thus decreasing protein loading into the endoplasmic reticulum) and induces
expression of the transcription factor ATF4, which increases expression of UPR genes
CHOP and GRP78 (Su & Kilberg, 2008).
1.3.3 Autophagy
Similar to endoplasmic reticulum stress, autophagy is another cellular response
mainly regulated at the endoplasmic reticulum (Heath-Engel, et al., 2008). As a major
intracellular process for the degradation and recycling of proteins and cytoplasmic
damaged organelles, autophagy is essential for maintaining cell survival following a
variety of extracellular and intracellular stimuli including starvation. During autophagy
PhD Thesis - Fei Geng McMaster- Biochemistry and Biomedical Sciences
18
cells form autophagosomes that sequester organelles, proteins or portions of the
cytoplasm for delivery to the lysosome (He and Klionsky, 2009). The sequestered
contents are degraded in the lysosome, allowing cells to eliminate damaged or harmful
components through catabolism and recycling them to maintain nutrient and energy
homeostasis. Autophagy constitutes a major protective mechanism that allows cells to
survive in response to multiple stressors. It also helps organisms defend against
degenerative, inflammatory, infectious and neoplastic diseases (Kroemer, Marino, &
Levine, 2010).
While autophagy is often induced as part of an adaptive response, induction of
autophagy may also lead to cell death (Kundu & Thompson, 2005). Unlike apoptosis,
which is characterized by nuclear condensation and fragmentation without major
structural changes in cytoplasmic organelles, autophagic cell death is a caspase-
independent process characterized by the accumulation of autophagic vacuoles in the
cytoplasm, with extensive degradation of the Golgi complex and the endoplasmic
reticulum preceding destruction of the nucleus (Klionsky & Emr, 2000). The final
effector phase involves the fusion of the autophagosome-enclosed cargo with lysosomes
for catabolism by intralysosomal enzymes (Maiuri, Zalckvar, Kimchi, & Kroemer, 2007).
1.4 Bcl-2 family proteins localized on the endoplasmic reticulum
As a critical regulator of cellular responses including apoptosis, endoplasmic
reticulum stress and autophagy, the Bcl-2 family is classified into the antiapoptotic and
the proapoptotic groups based upon their functions. The antiapoptotic proteins possess
four BH domains and include Bcl-2, Bcl-XL, Bcl-w, Mcl-1 and A1, while the
proapoptotic proteins are divided into two distinct subgroups—the multi-BH region
proteins containing BH regions 1-3 (e.g. Bax, Bak and Bid) (Billen, Shamas-Din, &
Andrews, 2008) and the BH3-only proteins (e.g. Bad, BIK, Bim, Noxa and Puma) which
contain only the BH3 region (Shamas-Din, et al., 2011).

PhD Thesis - Fei Geng McMaster- Biochemistry and Biomedical Sciences
19
The endoplasmic reticulum has emerged as a central player in many cell death
pathways, and evidence of an essential role for Bcl-2 family members at this location is
becoming increasingly apparent (Hetz, 2007; Oakes, Lin, & Bassik, 2006). Interestingly
each class of Bcl-2 family member has its representatives on the endoplasmic reticulum
(antiapoptotic protein Bcl-2 and Bcl-XL, proapoptotic protein Bax and Bak, BH3-only
protein BIK and Puma) and their related functions are listed in Table 1.1.
Bcl-2 family Effect on ER
Ca2+
Effect on UPR
signaling
Effect on
autophagy
Bcl-2, Bcl-XL Attenuates ER
Ca2+
release
No known function Suppress induction
of autophagy via
interacting with
Beclin 1
Bax, Bak Increase ER Ca2+
load and enhance
Ca2+
release
Modulate the UPR
by direct
interaction with
IRE1α
May promote
autophagy
BIK Promote Ca2+
release from the
ER
No known function No known function
Bad No known
function
No known function Promote autophagy
by inhibiting Bcl-2
Puma Promotes ER
Ca2+
depletion
Initiate apoptosis in
neuronal cells
No known function
Nix Increase resting
ER Ca2+
load
No known function Required for
autophagic
maturation
BI-1 Lower resting ER
Ca2+
load
Attenuates UPR by
inhibition of IRE-1
and PERK
signaling
No known function
Table 1.1 Proposed functions of known endoplasmic reticulum localized Bcl-2 family
proteins. ER: endoplasmic reticulum

PhD Thesis - Fei Geng McMaster- Biochemistry and Biomedical Sciences
20
1.4.1 Antiapoptotic protein Bcl-2
The founding member of the Bcl-2 protein family, Bcl-2, was discovered during
molecular analysis of the t14-18 chromosomal translocation in B cell lymphoma
(Tsujimoto, Finger, Yunis, Nowell, & Croce, 1984). Bcl-2 contains four BH regions
(BH1-4) and a carboxyl-terminal hydrophobic sequence called a tail-anchor. Unlike many
other tail-anchor proteins which are targeted to a single subcellular location, Bcl-2 is
localized to the endoplasmic reticulum, and the outer mitochondrial membrane in
mammalian cells (Zhu, et al., 1996). Over the past several years, extensive work has been
done to elucidate the process whereby members of the Bcl-2 protein family at the
mitochondrial outer membrane regulate the decision phase that commits cells to apoptosis
(Leber & Andrews, 2010). In comparison, the molecular mechanisms of Bcl-2 localized
at the endoplasmic reticulum are less studied.
To target Bcl-2 specifically to the outer mitochondrial membrane, a mutant Bcl-2
in which the carboxy terminal hydrophobic tail of Bcl-2 has been replaced by that from
ActA was generated (Zhu, et al., 1996). To target Bcl-2 specifically to the endoplasmic
reticulum membrane, a mutant Bcl-2 (Bcl2-cb5) in which the 21 C-terminal residues of
Bcl-2 were replaced with the C-terminus of rat cytochrome B5 was generated (Zhu, et al.,
1996). To determine whether apoptosis can be inhibited by Bcl-cb5, two spatially distinct
pathways for apoptosis were found to be present in Rat-1 cells (Annis, et al., 2001).
Apoptosis elicited by stimuli that led to a decrease in mitochondrial membrane potential
(Δψm), that precedes cytochrome c release is effectively inhibited by Bcl-cb5. By contrast,
in the same cell type, Bcl-cb5 is not effective at inhibiting apoptosis induced by stimuli
that cause mitochondrial translocation of Bax and redistribution of cytochrome c at a time
when decreased Δψm is not yet apparent (Annis, et al., 2001).
1.4.2 Bcl-2 binding partners at the endoplasmic reticulum
PhD Thesis - Fei Geng McMaster- Biochemistry and Biomedical Sciences
21
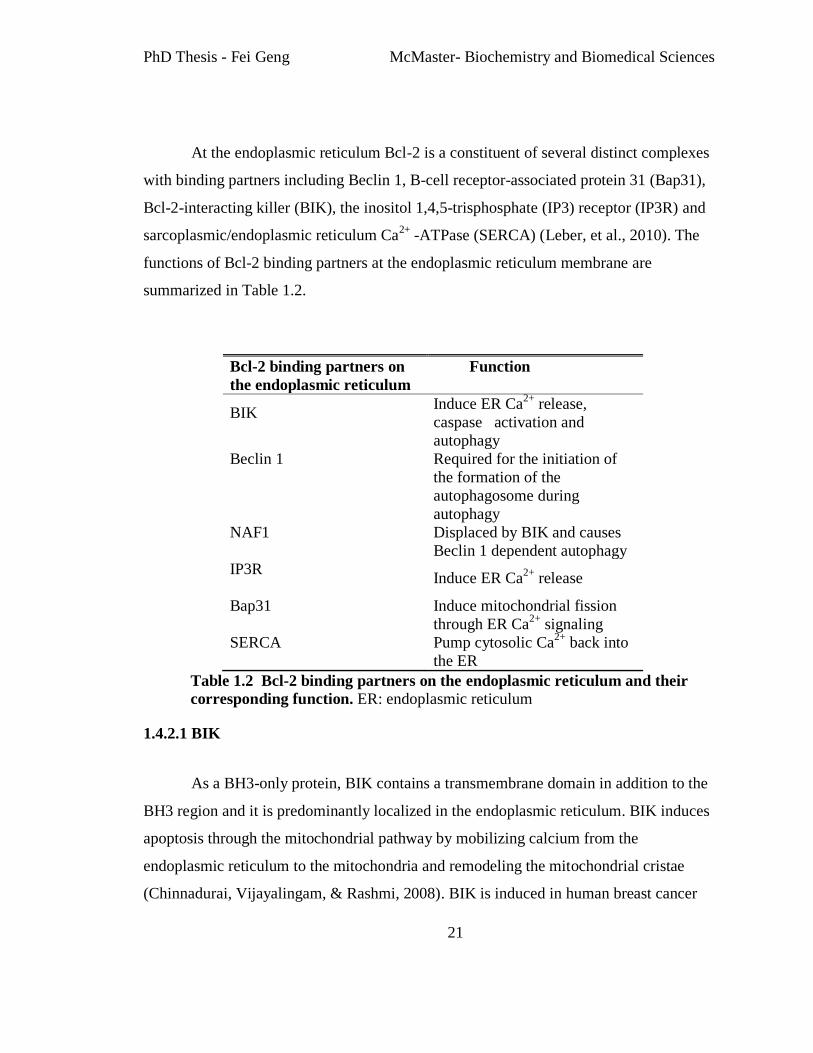
At the endoplasmic reticulum Bcl-2 is a constituent of several distinct complexes
with binding partners including Beclin 1, B-cell receptor-associated protein 31 (Bap31),
Bcl-2-interacting killer (BIK), the inositol 1,4,5-trisphosphate (IP3) receptor (IP3R) and
sarcoplasmic/endoplasmic reticulum Ca2+
-ATPase (SERCA) (Leber, et al., 2010). The
functions of Bcl-2 binding partners at the endoplasmic reticulum membrane are
summarized in Table 1.2.
Bcl-2 binding partners on
the endoplasmic reticulum
Function
BIK Induce ER Ca
2+ release,
caspase activation and
autophagy
Beclin 1 Required for the initiation of
the formation of the
autophagosome during
autophagy
NAF1 Displaced by BIK and causes
Beclin 1 dependent autophagy
IP3R Induce ER Ca
2+ release
Bap31 Induce mitochondrial fission
through ER Ca2+
signaling
SERCA Pump cytosolic Ca2+
back into
the ER
Table 1.2 Bcl-2 binding partners on the endoplasmic reticulum and their
corresponding function. ER: endoplasmic reticulum
1.4.2.1 BIK
As a BH3-only protein, BIK contains a transmembrane domain in addition to the
BH3 region and it is predominantly localized in the endoplasmic reticulum. BIK induces
apoptosis through the mitochondrial pathway by mobilizing calcium from the
endoplasmic reticulum to the mitochondria and remodeling the mitochondrial cristae
(Chinnadurai, Vijayalingam, & Rashmi, 2008). BIK is induced in human breast cancer

PhD Thesis - Fei Geng McMaster- Biochemistry and Biomedical Sciences
22
MCF-7 cells in the absence of estrogen signaling and plays a critical role in the
antiestrogen-provoked breast cancer cell apoptosis (Hur, et al., 2004). BIK-mediated
apoptosis is mediated by selective activation of Bax and enhanced expression of BIK
leads to cell death with autophagic features (Chinnadurai, et al., 2008).
1.4.2.2 Beclin 1
As an essential trigger of autophagy, Beclin 1 was first identified as a binding
partner for Bcl-2 located at the endoplasmic reticulum (Aita, et al., 1999). It has recently
been identified as a BH3-only protein. The overall structure of Beclin 1, as well as its
essential role in autophagosome formation, is evolutionarily conserved throughout all
eukaryotic phyla (Levine, Sinha, & Kroemer, 2008). During nutrient deprivation as a
physiological stimulus of autophagy, Bcl-2 is known to function through inhibition of the
autophagy effector and tumor suppressor Beclin 1 (Pattingre, et al., 2005). The nutrient-
deprivation autophagy factor-1 (NAF-1) was recently demonstrated to be required for
Bcl-2 to antagonize the autophagy regulatory protein Beclin 1 (Chang, Nguyen, Germain,
& Shore, 2010). BH3-only proteins such as Bad, which are known to be induced during
starvation, have been shown to displace Beclin 1 from Bcl-2, leading to the proposal that
a signaling cascade analogous to the release of BH3-only activator proteins by BH3-only
sensitizers to initiate the apoptosis pathway by Bax/Bak activation also extends to
autophagy (Levine, et al., 2008; Maiuri, Criollo, et al., 2007). This suggests BH3
mimetics such as ABT-737 may also be used to probe the mechanisms occurring on the
endoplasmic reticulum.
1.4.2.3 IP3R and SERCA
The cytosolic Ca2+
concentration in resting cells is maintained at low levels by
enzymes that translocate Ca2+
across the plasma membrane or into intracellular stores
(Hanson, Bootman, & Roderick, 2004). The sarcoplasmic/endoplasmic reticulum is the

PhD Thesis - Fei Geng McMaster- Biochemistry and Biomedical Sciences
23
major organelle involved in intracellular Ca2+
homeostasis and signaling. Ca2+
is
sequestered in the sarcoplasmic/endoplasmic reticulum through the action of SERCA
pumps which maintain the luminal Ca2+
concentration at much higher levels than in the
surrounding cytoplasm. Ca2+
signals are generated when Ca2+
is released from the
endoplasmic reticulum via IP3R activation (Rong & Distelhorst, 2008).
IP3R are large tetrameric proteins, each subunit of which projects an amino-
terminal domain into the cytoplasm whereas their membrane spanning carboxy-terminal
regions form an integral Ca2+
channel. IP3 binding by the amino-terminal domains causes
a conformational change that promotes channel opening (Hanson, et al., 2004). Recent
studies have demonstrated that IP3R can also be activated during apoptosis independently
of the production of IP3. This may occur following proteolysis by activated caspase-3
(Hirota, Furuichi, & Mikoshiba, 1999) or caspase-7 (Elkoreh, Blais, Beliveau,
Guillemette, & Denault, 2012). Truncation of IP3R by caspase-3/caspase-7 removes a
large portion of the protein, including the amino-terminal IP3-binding region and other
regulatory domains. The part that remains in the endoplasmic reticulum membrane is a
constitutively active channel that continuously leaks Ca2+
(Hanson, et al., 2004). Bcl-2
has been shown to interact with IP3R and this suppresses Ca2+
release through IP3R and
inhibits Ca2+
uptake by mitochondria without affecting endoplasmic reticulum Ca2+
stores
(Grimm, 2012; Hanson, Bootman, Distelhorst, Wojcikiewicz, & Roderick, 2008).
Bcl-2 preserves endoplasmic reticulum Ca2+
stores by upregulating SERCA gene
expression and by interacting with this pump directly (Dremina, et al., 2004; Kuo, et al.,
1998). The interaction of Bcl-2 with SERCA was further reported to be involved in the
regulation of apoptotic processes through modulation of cytoplasmic and/or endoplasmic
reticulum Ca2+
levels required for the execution of apoptosis (Dremina, et al., 2004).
1.4.2.4 Bap31
Bap31 is a 28-kDa polytopic integral protein of the endoplasmic reticulum
membrane, and like BID, is a preferred substrate of caspase-8 in vitro (Ng, et al., 1997).
PhD Thesis - Fei Geng McMaster- Biochemistry and Biomedical Sciences
24
Upon Fas/CD95 stimulation, Bap31 is cleaved within its cytosolic domain, generating
proapoptotic p20 Bap31 (Nguyen, Breckenridge, Ducret, & Shore, 2000). The p20
caspase cleavage fragment of Bap31 induces Ca2+
release from the endoplasmic reticulum
concomitant with increased Ca2+
uptake by mitochondria. TNF-α stimulation of MCF-7
cells has been shown to result in procaspase-8 processing, which correlated with weak
cleavage of Bap31 (B. Wang, et al., 2003). Bcl2 at the endoplasmic reticulum protects
against a Bax/Bak-independent paraptosis-like cell death pathway initiated via p20Bap31
(Abe, Van Prooyen, Ladasky, & Edidin, 2009; Heath-Engel, Wang, & Shore, 2012).
1.4.2.5 NAF-1
Crosslinking and subsequent mass spectrometry were used to identify proteins that
both bound to Bcl2-cb5 and were displaced by Bik at the endoplasmic reticulum (Chang,
et al., 2010). The most abundant protein found in this search was a previously recognized
type 1 transmembrane protein containing a cytosolic iron-sulfur binding cluster
designated NAF-1. NAF-1 is displaced from Bcl-2 by the endoplasmic reticulum-
restricted BH3-only protein BIK and contributes to regulation of BIK-initiated autophagy,
but not BIK-dependent activation of caspases (Chang, et al., 2010). In co-
immunoprecipitation assays, NAF-1 was also shown to be present in a complex
containing Bcl-2 and IP3R (Chang, et al., 2010) and required for Bcl-2 mediated
maintenance of endoplasmic reticulum Ca2+
homeostasis (Chang, et al., 2012; He, Lam,
McCormick, & Distelhorst, 1997). The presence of NAF-1 in Bcl-2-IP3R complexes has
intriguing implications for both the composition of the Bcl-2 complex at the endoplasmic
reticulum and the potential involvement of NAF-1 in regulating autophagy via IP3R. As
mentioned above, NAF-1 was demonstrated to be required for Bcl-2 to antagonize the
autophagy regulatory protein Beclin 1. Thus, NAF-1 is a Bcl2-associated co-factor that
targets Bcl-2 for antagonism of the autophagy pathway at the endoplasmic reticulum and
may also act as a switch between autophagy and apoptosis at the endoplasmic reticulum
(Leber & Andrews, 2010).

PhD Thesis - Fei Geng McMaster- Biochemistry and Biomedical Sciences
25
1.5 Investigations presented in this thesis
The antiapoptotic function of Bcl-2 at the endoplasmic reticulum confers
resistance to cell death initiated by a variety of stimuli (Annis, et al., 2001; Pattingre, et
al., 2005; X. Wang, Olberding, White, & Li, 2011). The relevant mechanisms however,
have remained elusive and controversial.
Chapter 3 of this thesis reveals the mechanism of two independent modifications
of E-cadherin in response to treatments that cause endoplasmic reticulum stress in breast
cancer cells. Firstly, O-GlcNAc modification of the cytoplasmic domain retains E-
cadherin in the endoplasmic reticulum. Secondly, incomplete processing by proprotein
convertases arrests E-cadherin transport late in the secretory pathway. O-GlyNAcylation
of E-cadherin accelerated apoptosis. Cell stress-induced inactivation of proprotein
convertases inhibited E-cadherin maturation further exacerbating apoptosis. The
modifications of E-cadherin by O-GlcNAcylation and lack of pro-region processing
represent novel mechanisms for the rapid regulation of cell surface transport of E-
cadherin in response to toxic stress.
In the past, the apoptotic cell death that is prevented by Bcl-2 localized at the
mitochondria (Bcl2-ActA) rather than Bcl-2 localized at the endoplasmic reticulum
(Bcl2-cb5) was shown by our lab (Fiebig, Zhu, Hollerbach, Leber, & Andrews, 2006).
My recent data showed that cell death, which followed multiple post-translational
modifications of E-cadherin during TG treatment, was prevented by both Bcl2-ActA and
Bcl2-cb5. Compared with the two types of cell death responses mentioned above, in
Chapter 4 of this thesis we describe a novel type of cell death that was caused by the
extended growth of breast cancer cells in charcoal stripped bovine serum and prevented
only by Bcl2-cb5 and not Bcl2-ActA. Interestingly, the protection mediated by Bcl2-cb5
was abolished by the BH3 mimetic ABT-737. Intriguingly, this cell death was not caused
by any of known cell death responses including UPR, autophagy or Bap31 cleavage.

PhD Thesis - Fei Geng McMaster- Biochemistry and Biomedical Sciences
26
To better examine the cell death described in Chapter 4, Chapter 5 of this thesis
introduces a novel approach using multiparametric image analysis. Compared with the
conventional approaches employed in Chapter 4, Chapter 5 describes a series of features
extracted from the images of cells stained with NAO (Acridine Orange 10-nonyl bromide)
to classify and distinguish cellular responses.
Overall, the investigations presented in this thesis reveal new insights into cell
death mechanisms related to the endoplasmic reticulum, including the multiple post-
translational modifications on E-cadherin and the endoplasmic reticulum-specific cell
death pathway caused by estrogen deprivation. The details presented here provide
valuable new information regarding the significance of cell-cell adhesion regulation
during stress conditions. The characterization of novel cell death mechanisms sheds light
on the ways which Bcl-2 functions at the endoplasmic reticulum.

PhD Thesis - Fei Geng McMaster- Biochemistry and Biomedical Sciences
27
Chapter 2 : Materials and methods

PhD Thesis - Fei Geng McMaster- Biochemistry and Biomedical Sciences
28
2.1 Materials
Human breast cancer cell line MCF-7 cells were grown in α-minimal essential
medium (α-MEM, Invitrogen) supplemented with 10% fetal bovine serum (FBS, Thermo
Scientific). Human breast cancer cell line BT474 andT47D cells were grown in Roswell
Park Memorial Institute (RPMI, Invitrogen) 1640 medium supplemented with 10% FBS
(Thermo Scientific). Madin-Darby Canine Kidney (MDCK) cells and Human breast
cancer cell lines CAMA1, MDA-MB-361, MDA-MB-134, and MDA-MB-415 were
grown in Dulbecco's Modified Eagle Medium (DMEM)/F12 medium (Invitrogen)
supplemented with 10% FBS (Thermo Scientific). Thapsigargin (Invitrogen), Brefeldin A
(Sigma), Tunicamycin (Sigma), Furin Inhibitor Decanoyl-Arg-Val-Lys-Arg-
chloromethylketone (BACHEM), and C2-ceramide (Sigma) were dissolved in
dimethylsulfoxide (DMSO) while DTT (Sigma) was dissolved in dH2O and then they
were diluted into culture medium according to indicated concentration. Leupeptin and
E64d were purchased from Sigma.
The antibodies including mouse monoclonal antibody (mAb) against E-cadherin
cytoplasmic domain (IC) (BD Biosciences) and p120-catenin (BD Biosciences), mouse
mAb against E-cadherin extracellular domain (EC) SHE78-7 (Invitrogen), mouse mAb
against Hemaglutinin (HA) tag (Covance Research Inc), mouse mAb against KDEL
(Enzo Life Sciences), mouse mAb against PARP (Enzo Life Sciences) and β-actin (Santa
Cruz Biotechnology) were used for immunoblots. Wheat germ agglutinin (WGA)-agarose
was obtained from Sigma. For immunoprecipitation, mouse anti-E-cadherin cytoplasmic
domain (BD Biosciences) and mouse mAb against HA tag (Covance Research Inc) were
used. For immunofluorescence, mouse mAb against E-cadherin extracellular domain
SHE78-7 (EC) was used. Antibodies against caspase-7 and light chain 3 (LC3) were
purchased from Cell Signaling. Antibody against activated Bak (AM03) was purchased
from EMD Chemical. Nitrocellulose and PVDF membranes were purchased from Pall

PhD Thesis - Fei Geng McMaster- Biochemistry and Biomedical Sciences
29
Corporation. Chemiluminescence reagent was purchased from Perkin Elmer, while an
ultra-sensitive Enhanced Chemiluminescence reagent was purchased from Millipore.
Bicinchoninic assay (BCA) reagent was purchased from Pierce. Gammabind G Sepharose
beads were purchased from GE Healthcare.
Deoxyribonucleic acid (DNA) primers used for cloning were purchased from
either Sigma Genosis or the Mobix Lab (McMaster University). The DNA modifying
enzymes Pfu DNA polymerase and T4 DNA ligase were purchased from MBI Fermentas.
All other DNA modifying enzymes (including restriction endonucleases) were purchased
from New England Biolabs.
2.2 Methods
Constructs
cDNA for human wild type E-cadherin (E-cad WT) hEcad/pcDNA3 was
provided by Dr. Cara J. Gottardi (Northwestern University, Chicago, IL). E-cadherin
cytoplasmic domain truncated mutant (E-cadΔcyto) was amplified by PCR using 5′ (5′-
ACTCGAGCGGCCGCATGGGCCCTTGGAGCCGCAGC-3′) and 3′ (5′-
GCTGACTCTAGACTATCAAAGAGCGTAATCTGGAACATCGTATGGGTACATA
AGAAACAGCAAGAGCAG -3′) oligonucleotide primers between nucleotides 125 and
2317 as defined as previously (Gottardi, Wong, & Gumbiner, 2001). cDNA encoding E-
cadΔpSer was provided by Dr. Patrick J. Casey (Duke University, Durham, NC). All
these three cDNAs were subcloned into pRc/CMV vectors with a coding sequence for the
HA tag reengineered on the COOH-terminal. All cloning procedures described above
were verified by sequencing (Mobix labs, McMaster University).
Stable expression of WT E-cadherin and E-cadherin variants in MCF-7 cells

PhD Thesis - Fei Geng McMaster- Biochemistry and Biomedical Sciences
30
Plasmids encoding E-cad WT as well as E-cadΔcyto and E-cadΔpSer were
transfected into MCF-7 cells or MDCK cells with ExGen 500 (Fermentas) and colonies
were selected in G418 (500 µg/mL). Stable clones were first isolated with cloning
cylinders, expanded, and screened for protein expression by western analysis. Cell clones
expressing E-cad WT and E-cadherin mutants were screened by immunoblotting using
HA tag antibody and high expression clones were picked for further studies.
Preparation of charcoal stripped bovine serum (CSBS)
To prepare charcoal charcoal stripped FBS, 50 g activated charcoal (Sigma) was
added to 500 mL of FBS (HyClone, Thermo Fisher) and mixed well. The mixture of
charcoal and FBS was incubated at room temperature for 2 hours before it was filtered by
0.2 µm membrane (Pall). CSBS media was made by phenol red-free αMEM (Invitrogen)
supplemented with 10% filtered charcoal stripped FBS.
The growth of cells in CSBS
The growth of cells in CSBS was performed as following. All the MCF-7 cells
were split one day before the treatment and the cell density needs to be around 30%. Day
1: Prior to the treatment, MCF-7 cells were gently washed with 1X Phosphate buffered
saline (PBS) buffer once and then cultured with phenol red-free αMEM supplemented
with 10% charcoal stripped FBS. In addition, MCF-7 cells were also cultured with phenol
red-free αMEM supplemented with 10% charcoal stripped FBS with the addition of 10
nM β-estradiol (Sigma) or 10 µg/mL insulin (Sigma). CSBS media were changed every
two days during the treatment. Day 11: Harvest the cells cultured with phenol red-free
αMEM supplemented with 10% charcoal stripped FBS in the absence or presence of β-
estradiol or insulin and then perform cell death assay.
PhD Thesis - Fei Geng McMaster- Biochemistry and Biomedical Sciences
31
Surface biotinylation assay
To biotin-label cell surface proteins, EZ-Link™ biotin (Thermo Scientific)
dissolved in PBS at 0.5 mg/mL was added to cells for 30 minutes as specified. Then cells
were lysed and 30 µl of streptavidin-conjugated paramagnetic particles (Promega) was
added to 100 µg biotinylated cell lysates, mixed for 6 hours at 4°C and washed three
times with cell lysis buffer. The beads were collected using a paramagnetic isolator and
proteins released by incubation in sodium dodecyl sulfate (SDS) loading buffer at 100°C
for 10 minutes.
PNGase F and Endo H digestion
To perform Peptide: N-glycosidase F (PNGase F) and Endoglycosidase H (Endo
H) digestion, protein bound beads derived from WGA binding or E-cadherin/HA tag
immunoprecipitation were washed with 1% Triton buffer for 3 times and then were
denatured in the denaturing buffer (5% SDS and 10% 2-mercatptoethnaol) for 5 minutes
at 100ºC. Denatured samples were then cooled and mixed with 1/10 volume each of
concentrated PNGase F/Endo H reaction buffer (0.5 M sodium phosphate, pH 7.5, and
10% NP-40). Samples were then digested with 500 units of PNGase F (New England
BioLabs) and Endo H (New England BioLabs) for 3 hours at 37ºC. After this step, the
reaction was stopped by the addition of the sample buffer (New England BioLabs)
containing 2-mercaptoethanol.
TCA precipitation
100% (w/v) Trichloroacetic acid (TCA, Thermo Scientific) was added to the
digestion products to a final concentration of 20%. Then samples were vortexed and kept
on ice for 15 minutes before the centrifugation. The pellets were washed with 50% Ethyl

PhD Thesis - Fei Geng McMaster- Biochemistry and Biomedical Sciences
32
Ether Anhydrous and 50% ethanol. Then pellets were dried in SpeedVac System and
dissolved in SDS loading buffer. The samples were heated at 100°C for 10 minutes before
they were analyzed by immunoblotting.
Immunoprecipitation and immunoblotting
For immunoprecipitation, 1 x 10⁷ cells were lysed in 1 mL of cell lysis buffer
(10 mM Tris-HCl pH 7.5, 1% Triton X-100, 150 mM NaCl) for 15 minutes on ice, and
passed through a 26 gauge needle four times. Cellular debris and nuclei were removed by
centrifugation at 13000 rpm for 10 minutes in a microcentrifuge. Protein concentration
was determined for the supernatant using BCA assay (Thermo Scientific), and 100 µg of
total protein from each sample was immunoprecipitated with 1 µg of anti-E-cadherin or
HA tag antibody. GammaBind G Sepharose (GE Healthcare) was added, and samples
were mixed by rotation for 4 hours at 4°C. For binding with WGA-agarose beads
(Sigma), 100 µg of total protein was incubated with beads, samples mixed by rotation.
Then the beads were pelleted and washed three times before the addition of 10 µl of SDS
loading buffer to the beads and being boiled at 90°C for 10 minutes for immunoblotting.
Proteins were separated on 8% denaturing SDS-PAGE gels and transferred to PVDF
membrane. The membrane was incubated with various primary antibodies diluted by
1:1000. The membrane was then incubated with the corresponding secondary antibody
coupled to horseradish peroxidase (Jackson ImmunoResearch Laboratories Inc) at
1:10000 dilution. Labeled proteins were visualized with Enhanced Chemiluminescence
(Perkin Elmer).
Immunofluorescence
MCF-7 cells were seeded on coverslips and grown as described (Zhu et al., 2001).
Non-permeabilized cells were stained with cell-permeable dye Syto-63 (Invitrogen) as an

PhD Thesis - Fei Geng McMaster- Biochemistry and Biomedical Sciences
33
internal standard for cell number/volume at 37°C for 30 minutes. Eukaryotic cells
incubated with Syto-63 dye generally show cytoplasmic staining as well as nuclear
staining (Wlodkowic, Skommer, & Darzynkiewicz, 2008). After being washed twice in
PBS, cells were fixed with 4% paraformaldehyde and then incubated with E-cadherin
antibody directed against the external domain SHE78-7 (EC) at 37°C for 1 hour, washed
and incubated for 1 hour with fluorescent secondary antibody donkey anti-mouse IgG-
fluorescein isothiocyanate (FITC) (Jackson ImmunoResearch Laboratories Inc) and
observed by confocal microscope (Leica TCS SP5). For ZO-1 staining, cells were pre-
extracted with 0.2% Triton X-100 in 100 mM KCL, 3 mM MgCl2, 1 mM CaCl2, 200 mM
sucrose, and 10 mM Hepes (pH 7.1) for 2 minutes on ice. Then the cells were fixed with
4% paraformaldehyde for 30 minutes, washed twice in PBS for 5 minutes and incubated
with 1% Bovine serum albumin (BSA) in PBS/0.5% Triton X-100 for 30 minutes at room
temperature. Cells were incubated at room temperature with 5 μg/mL anti- ZO-1 antibody
(Invitrogen) for an hour. To visualize the nuclei, cells were stained with 5 µM DRAQ5
(Biostatus) for 30 minutes at room temperature.
Phalloidin staining
To stain F-actin, MCF-7 cells were fixed with 4% paraformaldehyde for 30
minutes, washed twice in PBS for 5 minutes and incubated with 1% BSA in PBS/0.5%
Triton X-100 for 30 minutes at room temperature. Then cells were incubated with Alexa-
488-conjugated phalloidin (Invitrogen) for 30 minutes at room temperature and imaged
on an Opera High Content Screening System (Evotec).
Cell adhesion assay
To assess cell adhesion, we used an assay that measures loss of attachment to a
cell culture dish with lateral shaking. MCF-7 cells expressing E-cad WT and E-cadΔpSer

PhD Thesis - Fei Geng McMaster- Biochemistry and Biomedical Sciences
34
were seeded at the density of 5 × 10⁶ /10-cm dish.
Cells were treated with TG, DMSO
(negative control) and 5 mM EDTA (positive control). Then cells were shaken at 500 rpm
on Thermomixer 5436 (Eppendorf) inside a tissue culture incubator. Floating cells were
counted over time on a hemocytometer at time points of 0, 8, 16, 24 hours after TG
treatment on a Telaval 3 Inverted Microscope (Jena). As the exposure to 5mM EDTA for
30 minutes at 37ºC causes detachment of cells by abrogating all calcium-dependent E-
cadherin function, the percentage of floating cells at each time point was calculated by the
floating cell count in TG treated dish divided by the number of floating cells in EDTA
treated dish.
Confocal microscopy (for E-cadherin staining in Chapter 3)
Fluorescence images were taken at room temperature using a laser-scanning
confocal microscope (Leica TCS SP5) with 63x plan apochromat glycerin immersion
objective (1.3 NA) and steady state photomultiplier tubes (PMTs, Leica Microsystems
Inc) to detect and digitize the image. The coverslips were mounted with mounting
medium (Sigma). The excitation wavelength for FITC was 488 nm with emission
collected at 530 ± 15 nm and the excitation wavelength of Syto 63 was 633 nm with
emission collected at 673 ± 15 nm. A complete set of images were recorded using the
Leica TCS SP5 software by setting and fixing the imaging parameters on the brightest
samples to ensure no saturation. Images were analyzed using Acapella software
(Acapella 2.5, Perkin Elmer). The intensity of E-cadherin staining was normalized against
the Syto 63 intensity to correct for changes in cell shape.
Image analysis and quantification (for E-cadherin staining in Chapter 3)
MCF-7 cells transfected with plasmids encoding Neo (control vector), E-cad
WT and E-cadΔpSer were treated with TG for 0, 5, 10, 15, 20, 25 hours respectively and

PhD Thesis - Fei Geng McMaster- Biochemistry and Biomedical Sciences
35
then were fixed without permeabilization of cell membranes. E-cadherin on the plasma
membrane was stained by FITC (green) and cytoplasmic dye Syto63 (red) was applied as
an internal control. Four cell images were collected for each sample using a
deconvolution microscope all with the same exposure time. Acapella software was used
to capture cellular matter in the green/red channels (for a green-red image, the same
matter was used). The total green intensity and red intensity were collected in the cell area
for each image. For each image we did:
Ratio=Total green intensity/Total red intensity
with replicates and plotted averages for each time period.
Since Syto63 stain (red) should be constant for each cell, we plotted the average value of
red per cellular matter pixel. This was averaged for each time period and plotted.
PARP cleavage assay
During apoptosis PARP is cleaved into 24 kDa and 89 kDa fragments by
caspase-7 in MCF-7 cells and can be degraded by lysosomal proteases to 62 kDa and 55
kDa or 74 kDa and 42 kDa fragments (Gobeil, Boucher, Nadeau, & Poirier, 2001). Thus
loss of full-length PARP is the most appropriate measure of cell death since both cleavage
and degradation are accounted for (Fiebig, et al., 2006). Full length PARP was shown by
immunoblotting using PARP C-2-10 mAb (Enzo Life Sciences) and quantified as
described previously (Fiebig, et al., 2006). The C-2-10 monoclonal antibody recognizes
full-length and 89 kDa caspase cleaved PARP, but does not recognize the cleavage
products of other proteases. Therefore, to assess PARP cleavage by caspase-7 as well as
degradation we measured the decrease in the amount of the full-length PARP. In each
experiment the amount of actin in the samples was also recorded. If the actin blots
indicated uneven loading, transfer or development of the blots then the corresponding
PARP data was not used. To analyze the PARP data, both PARP cleavage and

PhD Thesis - Fei Geng McMaster- Biochemistry and Biomedical Sciences
36
degradation are combined into a single apoptosis index determined by measuring the band
intensities for the full-length PARP in untreated cells (Funtreated), and in cells grown in
CSBS (Ftreated) indicated above the lanes by analysis with ImageJ software (Fiebig, et al.,
2006). For each blot we did:
Apoptosis Index= 100 (1-Ftreated/Funtreated)
with replicates and plotted averages for each treatment
XBP-1 splicing analysis
Cells were lysed and total RNA was isolated using RNA extraction kit (RNAeasy,
Qiagen). Then mRNA was reverse-transcribed from total RNA using the SuperScript-RT
system (Invitrogen). cDNA was used as template for PCR amplification across the
fragment of the XBP-1 cDNA bearing the intron target of IRE1α ribonuclease activity.
Primers used included: human XBP-1, 5’-TTACGAGAGAAAACTCATGGC-3’ and 5’-
GGGTCCAAGTTGTCCAGAATGC-3’. PCR conditions were: 95°C for 5 minute; 95°C
for 30 second; 58°C for 30 second; 72°C for 1 minute; 72°C for 5 minute with 35 cycles
of amplification. A 289 bp amplicon was generated from unspliced XBP-1; a 263 bp
amplicon was generated from spliced XBP-1. PCR products were resolved on a 5%
agarose/1x TAE gel.
Quantitative Real-Time PCR Analysis
Cells were lysed and total RNA was isolated using RNA extraction kit (RNAeasy,
Qiagen, Germany). Then mRNA was reverse-transcribed from total RNA using the
SuperScript RT system (Invitrogen) and aliquots of cDNA were used as template for
quantitative PCR. Primers used included:

PhD Thesis - Fei Geng McMaster- Biochemistry and Biomedical Sciences
37
human Rpl19 mRNA, 5’-ATGTATCACAGCCTGTACCTG-3’ and 5’-
TTCTTGGTCTCTTCCTCCTTG-3’; human Chop mRNA, 5’-
ACCAAGGGAGAACCAGGAAACG-3’ and 5’-TCACCATTCGGTCAATCAGAGC-3’;
human IRE1α mRNA, 5’-TGGGTAAAAAGCAGGACATCTGG-3’ and 5’-
GCATAGTCAAAGTAGGTGGCATTCC-3’; Real time PCR was performed by using
Mastercycler realplex Thermal Cyclers (Eppendorf). Rpl19 mRNA levels, a ribosomal
protein whose transcription is not regulated by endoplasmic reticulum stress, served as an
internal normalization standard. PCR conditions were: 95°C for 5 minute; 95°C for 30
second; 55°C for 30 second; 72°C for 1minute; 78°C for 10 second; 72°C for 5 minute,
with 40 cycles of amplification.
Annexin V/PI double staining (Chapter 3)
Cell survival was also quantified using Annexin V- Alexa Fluor 488 and
propidium iodide (PI) staining. This assay identifies viable cells (Annexin V −/PI−),
apoptotic cells (Annexin V +/PI−) and necrotic cells (Annexin V +/PI+) (Vermes et al.,
1995). MCF-7 cells were washed with cold PBS twice and then resuspended in 1X
Binding Buffer (0.01 M HEPES, pH 7.4; 0.14 M NaCl; 2.5 mM CaCl2) at a concentration
of ~1 x 10⁶ cells/mL. Annexin V Alexa Fluor 488 (Invitrogen) and PI (Sigma) were
added to the cells prior to incubation on ice for 15 minutes. Cells were then analyzed by
flow cytometry (Beckman Coulter Epics Altra).
Annexin V/DRAQ5 staining and image analysis (Chapter 4)
Cells were seeded on coverslips 24 hours prior to the treatment. After growth in
CSBS for 10 days, aspirated the CSBS and added 500 µL 1X Binding Buffer (0.01 M
HEPES, pH 7.4; 0.14 M NaCl; 2.5 mM CaCl2) containing 5 µL Annexin V coupled to
Alexa Fluor488 (Invitrogen) and 5 µM DRAQ5 (Biostatus) for each well. Incubated for
30 minutes at 37ºC and then viewed by confocal microscopy. Acapella software

PhD Thesis - Fei Geng McMaster- Biochemistry and Biomedical Sciences
38
(Acapella 2.5, Perkin Elmer) was used to segment cell objects based upon DRAQ5
staining. The intensity in green channel in the cytoplasm was measured for each object.
For the quantitative determination of Annexin V positivity, two sample sets were
prepared by manually picking 20 objects per sample. The first sample (Sample 1) is of the
objects that showed Annexin V-positive. The second sample (Sample 2) is of those
objects with Annexin V-negative. Sample 1 was employed to find the average value of
the green intensity (Annexin V channel) +/- standard deviation as a comparison with
Sample 2. This provided the lower value for the green intensity of cells that showed
Annexin V-positivity. This value was used as the threshold and all cells with green
channel intensity above this threshold would be labeled Annexin V-positive. The above
mentioned thresholds were used to find the fraction of cells showing Annexin V positivity
per transfected protein (Neo, Bcl2-ActA, Bcl2-cb5, Bcl2-WT) for the entire dataset:
Annexin V positivity (%) = %100count cell Total
cells positive-VAnnexin ofCount
The percentages were then plotted for each transfected protein (Neo, Bcl2-ActA, Bcl2-
cb5, Bcl2-WT) expressing cells after grown in CSBS for 10 days and total cell counts
were shown below corresponding column.
6A7/Cytochrome c staining and image analysis (Chapter 4)
MCF-7 cells expressing Neo, Bcl2-ActA, Bcl2-cb5 and Bcl2-WT were seeded on
coverslips. Then the cells were grown in CSBS for 10 days before they were fixed with
4% paraformaldehyde. To permeabilize cells, they were incubated with 1% Triton X-100
in PBS for 10 minutes at room temperature, and then incubated with affinity-purified
sheep polyclonal antibody directed against cytochrome c and 6A7 antibody against
activated Bax (at a dilution of 1: 1000) or AM03 antibody against activated Bak (at a
dilution of 1: 1000) at 37°C for 1 hour. Then the cells were washed and incubated at 37°C

PhD Thesis - Fei Geng McMaster- Biochemistry and Biomedical Sciences
39
for 1 hour with fluorescent secondary antibody donkey anti-sheep IgG-fluorescein
isothiocyanate (FITC, Jackson ImmunoResearch Laboratories Inc) to stain cytochrome c
and Alexa Fluor 594 Goat Anti-Mouse IgG (H+L) (Invitrogen) to stain activated Bax or
activated Bak. Nuclei were stained with 5 µM DRAQ5 (Biostatus) for 30 minutes at room
temperature.
Fifteen cell images were collected for each transfected protein using a confocal
microscope all with the same exposure time. Acapella software (Acapella 2.5, Perkin
Elmer) was used to segment cell objects based upon DRAQ5 staining. The intensity in
green (cytochrome c) and red (6A7) channels was measured in the cytoplasm for each
object.
Two sample sets were prepared by manually picking 20 objects per sample. The
first sample (Sample 1) is of the objects that showed the release of cytochrome c. The
second sample (Sample 2) is of those objects with intact cytochrome c. Sample 1 was
employed to find the average value of the green intensity (cytochrome c release channel)
+/- standard deviation as a comparison with Sample 2. This provided the upper value for
the green intensity of cells that showed cytochrome c release. This value was used as the
threshold and all cells with green channel intensity below this threshold would be labeled
cytochrome c release positive. The mentioned thresholds were used to find the fraction of
cells showing cytochrome c release per transfected protein (Neo, Bcl2-ActA, Bcl2-cb5
and Bcl2-WT) for the entire dataset:
Cytochrome c Releasing (%) = %100count cell Total
cells released c cytochrome ofCount
The percentages were then plotted for each transfected protein (Neo, Bcl2-ActA, Bcl2-
cb5 and Bcl2-WT) expressing cells after grown in CSBS for 10 days and total cell
numbers were shown below corresponding column.

PhD Thesis - Fei Geng McMaster- Biochemistry and Biomedical Sciences
40
For the quantification of 6A7 staining, similar to Annexin V staining, two sample
set were prepared by manually picking 20 objects per sample. The first sample (Sample 1)
is of the objects that showed 6A7-positive. The second sample (Sample 2) is of those
objects with 6A7-negative. Sample 1 was employed to find the average value of the red
intensity (6A7 channel) +/- standard deviation as a comparison with Sample 2. This
provided the lower value for the red intensity of cells that showed 6A7 positivity. This
value was used as the threshold and all cells with red channel intensity above this
threshold were labeled as 6A7-positive. Thus the fraction of cells showing 6A7 positivity
was calculated as below:
6A7 positivity (%) = %100count cell Total
cells positive-6A7 ofCount
To quantitatively determine the double staining of activated Bak (AM03)/cytochrome c or
tetramethylrhodamine ethyl ester (TMRE) staining, the same approach was applied.
Cell staining and microscopy (Chapter 5)
Cells were stained with either 100 nM nonyl-acridine orange (NAO, Sigma) and 5
µM DRAQ5 (Biostatus) or 1µM PI (Sigma) with 1:1000 Annexin V-AlexaFluor 488
(Invitrogen) and 5 µM DRAQ5 in αMEM. After 30 minutes the cells were washed with
PBS followed by αMEM. The plate was imaged using a Perkin Elmer Opera QEHS high
content screening system maintained at 37°C and 5% CO2 in the imaging chamber.
Images were acquired using a 40× 0.7NA water immersion objective. Images of NAO
and Annexin V-AlexaFluor 488 staining were acquired with 488nm excitation and 540/40
emission filter; PI with 561 nm excitation and 600/40 emission; DRAQ5 with 633 nm
excitation and 680/40 nm emission. The expression vector for the caspase-probe was a
kind donation from Dr. R. Truant (McMaster).

PhD Thesis - Fei Geng McMaster- Biochemistry and Biomedical Sciences
41
The expression of mCherry-BH3 and cytochrome c release image and data analysis
(Chapter 5)
MCF-7 cells and Bcl-XL expressing MCF-7 cells were seeded on coverslips. The
next day, the cells were transfected with plasmids encoding mCherry (vector), or
mCherry fused to the BH3 protein indicated to the left of the panels. The cells were
washed twice in PBS and fixed with 4% paraformaldehyde 24 hours after transfection. To
permeabilize cells, they were incubated with 1% Triton X-100 in PBS for 10 minutes at
room temperature, and then incubated with affinity-purified sheep polyclonal antibody
directed against cytochrome c (1: 1000) at 37°C for 1 hour. Then the cells were washed
and incubated at 37°C for 1 hour with fluorescent secondary antibody (donkey anti-sheep
IgG-fluorescein isothiocyanate (Jackson ImmunoResearch Laboratories Inc), dilution of 1:
500. Nuclei were stained with 5 µM DRAQ5 (Biostatus) for 30 minutes at room
temperature, which was not shown.
Fifteen images of cells were collected for each condition using spinning disk
confocal microscope (Leica Microsystems Inc), all with the same laser settings and
exposure time. Acapella software (Acapella 2.5, Perkin Elmer) was used to automatically
identify cells as well as the nuclear and cytoplasmic areas in the images by segmentation
based on DRAQ5 staining (not shown). Images were scored for mCherry-protein
expression and for cytochrome c release using an automated image analysis program.
Comparison of the red intensity (mCherry-BH3 protein) in transfected and non-
transfected cells (20 of each) was used to set an arbitrary threshold intensity to identify
mCherry-BH3 expressing cells in the population. The same images were used to set a
threshold for the green channel (fluorescein labeled immunostaining for cytochrome c)
based on a linear combination of cytoplasmic staining intensity and standard deviation to
permit automatic assignment for cytochrome c release. Cytochrome c release was then
expressed as the percentage of the cells with mCherry intensity above the red threshold
(expressing a mCherry-BH3 protein) that had cytochrome c intensity and standard

PhD Thesis - Fei Geng McMaster- Biochemistry and Biomedical Sciences
42
deviation below the green threshold (cytochrome c released). The bars on the histogram
indicate the percentage of mCherry positive cells that had released cytochrome c. The
actual number of cells that scored positive for cytochrome c release and the total number
of mCherry positive cells in 15 images is indicated below the bars. Fewer mCherry
positive cells were observed when the BH3-protein induced apoptosis because the dead
cells did not remain on the dish. For example, mCherry-tBid retained significant
cytotoxicity as only 35 mCherry-positive cells were observed, 16 of which had released
cytochrome c. In contrast, in cells expressing the inactive tBid control mutant tBidG94E,
422 mCherry positive cells were observed only 22 of which had released cytochrome c.

PhD Thesis - Fei Geng McMaster- Biochemistry and Biomedical Sciences
43
Chapter 3 : Multiple post-translational modifications regulate E-cadherin transport
during apoptosis

PhD Thesis - Fei Geng McMaster- Biochemistry and Biomedical Sciences
44
3.1 Preface
All of the work presented in this chapter was published in:
Geng F, Zhu W, Anderson RA, Leber B, Andrews DW. (2012) J Cell Sci. 125:2615-25
Permission has been granted by the publishers to reproduce the material here.
PhD Thesis - Fei Geng McMaster- Biochemistry and Biomedical Sciences
45
3.2 Introduction
Epithelial cell-cell adhesion determines tissue organization, and loss of cell adhesion
activates anoikis (Grossmann, 2002; Yap, Crampton, & Hardin, 2007). An important
component of this process is E-cadherin, a single-membrane-spanning protein with a
conserved cytoplasmic domain and divergent extracellular regions composed of five
cadherin domains separated by interdomain Ca2+
binding sites (Gumbiner, 2000).
Cadherins mediate cell-cell adhesion via interactions between N-terminal cadherin
domains on opposing cell surfaces and by organization of the actin cytoskeleton through
α-catenin (Nelson, 2008).
Assembly of E-cadherin based AJ is obligatory for establishment of polarized
epithelia. Rab11 (Lock & Stow, 2005), p120-catenin (Peifer & Yap, 2003), tyrosine
phosphorylation (Behrens, et al., 1993), and ubiquitination (D'Souza-Schorey, 2005)
control the trafficking and assembly of E-cadherin in mammalian cells. Recent studies
have shown that PIPKIγ acts as a signaling scaffold that links an adaptor protein complex
to E-cadherin (Ling, et al., 2007; Ling, et al., 2002). The depletion of PIPKIγ or
disruption of PIPKIγ binding to either E-cadherin or adaptor protein complexes results in
defects in E-cadherin transport and blocks AJ formation (Ling, et al., 2007).
E-cadherin is synthesized as a 140 kDa precursor that undergoes cleavage by
proprotein convertase family proteins associated with the trans-Golgi network (TGN) that
remove an amino-terminal pro-region (Beavon, 2000; Posthaus, et al., 1998). Furin, a
member of the proprotein convertase family, efficiently cleaves the E-cadherin precursor
(Posthaus, et al., 1998). This processing is essential for correct folding of the extracellular
portion of the mature molecule and required to mediate the homotypic calcium-dependent
binding of E-cadherin extracellular domains (Beavon, 2000; Ozawa & Kemler, 1990).
We previously reported that the cytoplasmic domain of E-cadherin is modified by
the addition of O-GlcNAc after treatment of cells with TG, an irreversible inhibitor of the
sarcoplasmic/endoplasmic reticulum calcium ATPase (Denmeade & Isaacs, 2005; Lytton,

PhD Thesis - Fei Geng McMaster- Biochemistry and Biomedical Sciences
46
et al., 1991; Zhu, et al., 2001). In TG treated cells, the apparent molecular weight of E-
cadherin increased by 20 kDa, a molecular weight change unlikely to be due solely to the
addition of O-GlcNAc to serine and threonine residues (Vosseller, et al., 2001; Zhu, et al.,
2001). The nature and functional significance of this other modification are unknown.
We present evidence here that cytoplasmic O-GlcNAcylation blocks exit of E-
cadherin precursors from the endoplasmic reticulum and interferes with PIPKIγ binding.
We identify the second modification as loss of pro-region processing that presumably
results from inhibition of proprotein convertases and show that this is regulated separately
from O-GlcNAcylation. Loss of the plasma membrane localization of E-cadherin
accelerates the induction of apoptosis, as prevention of O-GlcNAcylation by deletion
mutagenesis restored PIPKIγ binding, E-cadherin trafficking, and attenuated apoptosis.
Our data suggest that in response to some agonists, both independent post-translational
modifications contribute to the rapid induction of apoptosis by inhibiting the assembly of
E-cadherin complexes on the plasma membrane.
3.3 Results
E-cadherin is independently modified by O-GlcNAcylation and pro-region retention
We previously reported that in the MCF-7 and MDCK epithelial cells exposure to
TG, an agent that causes endoplasmic reticulum stress by depleting intraluminal calcium,
resulted in the addition of O-GlcNAc to the cytoplasmic domain of E-cadherin. O-
GlcNAcylation was assayed as increased binding of the modified E-cadherin to the
GlcNAc-binding lectin WGA that was abolished by treatment with β-hexosaminidase
(Zhu, et al., 2001). This O-GlcNAcylation pattern is not bound by two monoclonal
antibodies (mAb, 110.6 and RL2) that recognize specific patterns of O-GlcNAcylation
(data not shown). Furthermore, in TG treated cells there is a 20 kDa change in
electrophoretic mobility of E-cadherin (Figure 3.1A, lane 3) suggesting additional
modification(s) may occur when cells are treated with TG (Zhu, et al., 2001).
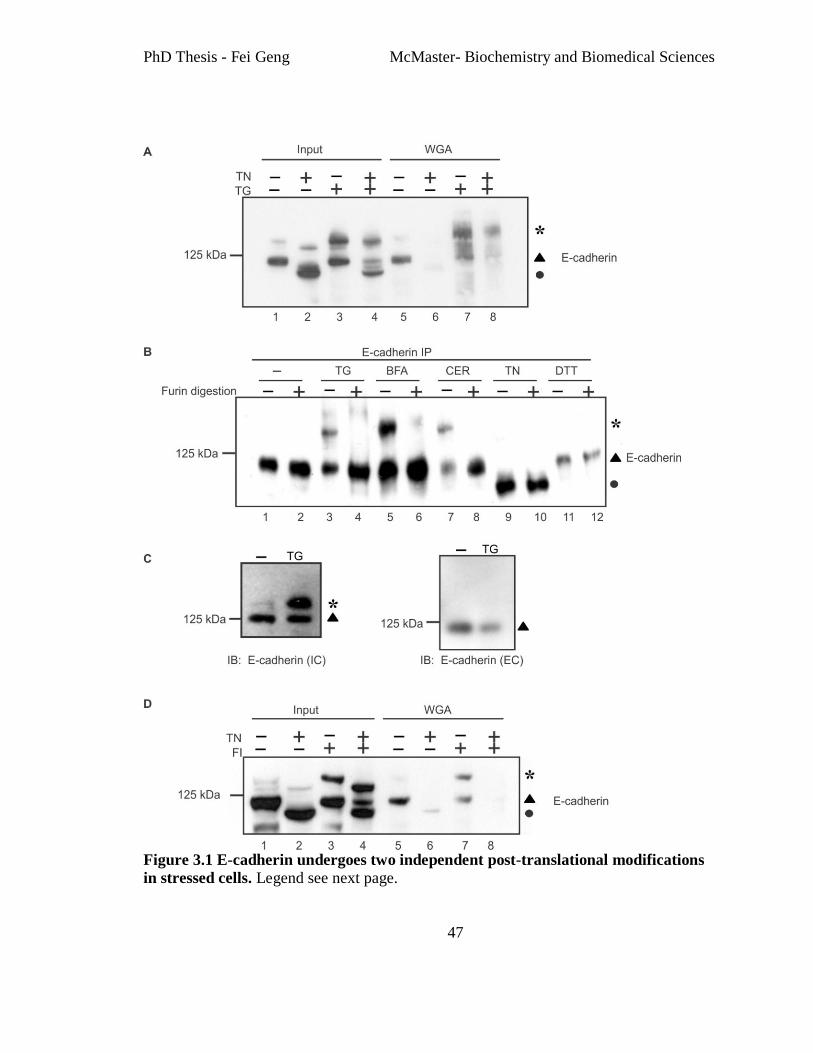
PhD Thesis - Fei Geng McMaster- Biochemistry and Biomedical Sciences
47
Figure 3.1 E-cadherin undergoes two independent post-translational modifications
in stressed cells. Legend see next page.

PhD Thesis - Fei Geng McMaster- Biochemistry and Biomedical Sciences
48
(A) Lysates prepared from MCF-7 cells treated with DMSO control (−), 10 µg/mL TN,
400 nM TG, or both for 24 hours were analyzed by E-cadherin immunoblotting directly
or after WGA binding. In all blots ▲ indicates mature E-cadherin, * indicates modified
E-cadherin and ● indicates E-cadherin with N-glycosylation prevented by TN. (B)
Lysates prepared from MCF-7 cells 400 nM TG for 24 hours, 10 µg/mL BFA for 24
hours, 100 µM CER for 8 hours, 10 µg/mL TN for 48 hours, 10 mM DTT for 6 hours
respectively were immunoprecipitated (IP) with E-cadherin antibody, subjected to furin
digestion, then TCA precipitated and analyzed by immunoblotting for E-cadherin. These
drug treatment conditions apply to all figures unless otherwise specified. (C) MCF-7 cells
without or with TG treatment were analyzed by immunoblotting with an E-cadherin
antibody raised against an epitope in the cytoplasmic domain (IC; unless otherwise
specified, all subsequent E-cadherin immunoblots were probed with this antibody) or E-
cadherin antibody SHE78-7 (EC) recognizing an epitope in the extracellular domain of
mature E-cadherin. (D) Lysates prepared from MCF-7 cells treated with DMSO control
(−), TN, 200 µM furin inhibitor (FI) or both for 24 hours were immunoblotted for E-
cadherin either directly (Input) or after WGA binding (WGA). FI treatment condition
applies to all figures.
To determine if E-cadherin modifications are unique to TG treated cells we tested
a variety of other agents that cause cell stress including TN, DTT, BFA and ceramide
(CER). The addition of TG, BFA and CER but not TN resulted in the appearance of 140
kDa E-cadherin (Figure 3.1B, *), indicating that this modification is common but not an
obligate result of endoplasmic reticulum stress or apoptosis (Figure 3.8A). O-
GlcNAcylation of E-cadherin was examined by binding to WGA a lectin that binds with
high affinity to O-GlcNAc, but with low affinity also binds to N-linked glycans (Natsuka
et al., 2005). To permit unambiguous identification of O-GlcNAc modified proteins, N-
linked glycan formation was inhibited by treating the cells with TN before the
glycoproteins were isolated by binding to WGA agarose. As expected, treatment with TN
prevented N-linked glycosylation of E-cadherin and therefore decreased the molecular
weight of the mature protein (Figure 3.1A, lane 2, ●). Although TN treatment abolished
the binding of 120 kDa E-cadherin (▲) to WGA, a substantial fraction of 140 kDa E-
cadherin still bound to WGA (Figure 3.1A, lane 7 and 8, *), indicating that either 140
kDa E-cadherin is a preferential substrate for O-GlcNAcylation or that O-GlcNAcylation
leads to the increase in apparent molecular weight. Treatment of cells with CER yielded

PhD Thesis - Fei Geng McMaster- Biochemistry and Biomedical Sciences
49
the 140 kDa E-cadherin without O-GlcNAcylation, confirming that most of the apparent
increase in molecular weight is due to a second independent post-translational
modification. Exposure to BFA gave rise to both modifications as did exposure to TG
(Figure 3.8D, 3.8E).
The apparent molecular weight of the modified E-cadherin (140 kDa) is similar to
the molecular weight of an E-cadherin precursor that contains the pro-region normally
removed by proprotein convertases in the trans-Golgi. Therefore, we probed
immunoblots with a monoclonal antibody (SHE78-7, EC) that recognizes an epitope
created by processing E-cadherin to the mature form (Laur, Klingelhofer, Troyanovsky,
& Troyanovsky, 2002). As EC bound the 120 kDa but did not bind to 140 kDa form of E-
cadherin induced by both TG (Figure 3.1C) and BFA (Figure 3.8E) we conclude that the
latter does not contain the epitope characteristic of the mature protein. Furthermore, after
immunoprecipitation (IP) the 140 kDa E-cadherin induced by TG, BFA and CER,
incubation with the proprotein convertase furin yielded a product with the same ~120 kDa
electrophoretic mobility as mature E-cadherin (Figure 3.1B). Therefore, we conclude that
the 140 kDa form of E-cadherin is the pro-form of the protein. Since CER does not lead
to O-GlcNAcylation of E-cadherin, the common effect of these three agents is to inhibit
the activity of a furin-like protease in cells.
To determine the relationship between inhibition of E-cadherin pro-region
cleavage and O-GlcNAcylation, MCF-7 cells were treated with furin inhibitor (FI) and E-
cadherin alterations and the cellular response were analyzed (Hallenberger, et al., 1992).
In contrast to TG, FI did not cause endoplasmic reticulum stress or apoptosis (Figure
3.9A, top two panels), but it inhibited E-cadherin processing in cells, as the 140 kDa form
of E-cadherin was evident (Figure 3.1D, lane 3). As expected for N-glycosylated proteins,
both forms of E-cadherin bound to WGA (Figure 3.1D, lane 7). However in FI treated
cells, binding of both species to WGA was abrogated by TN treatment (Figure 3.1D, lane
8), indicating that the 140 kDa E-cadherin that resulted from furin inhibition was not O-
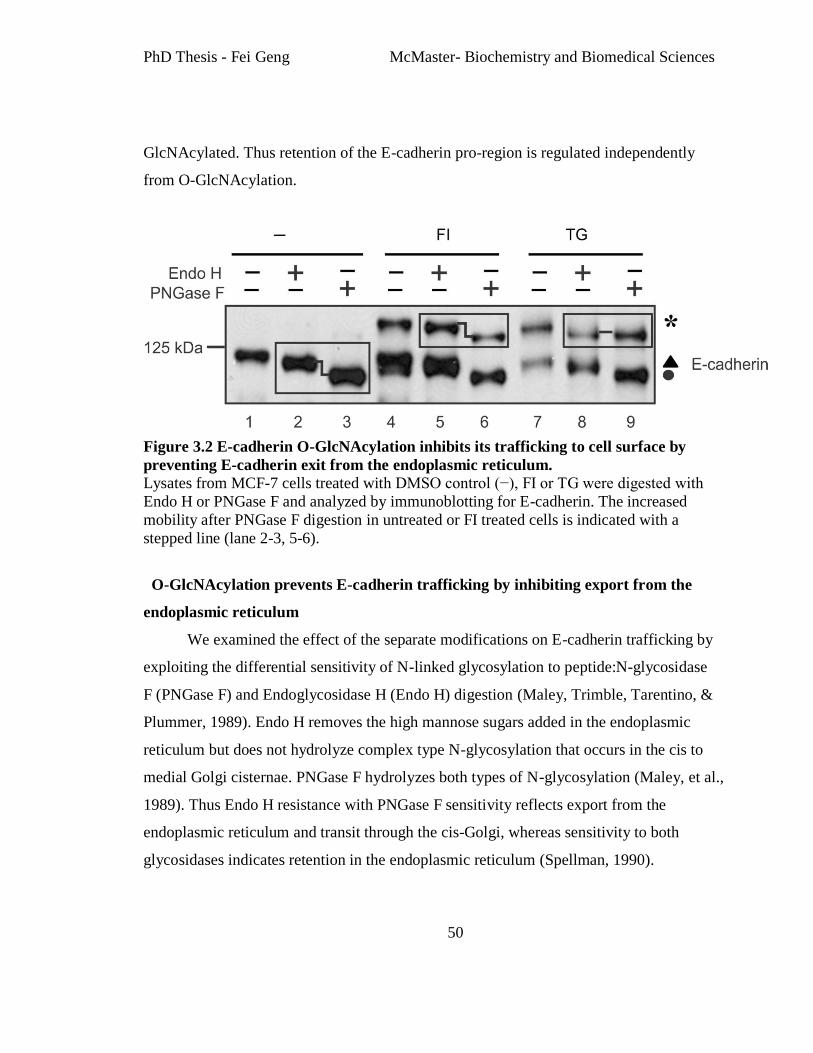
PhD Thesis - Fei Geng McMaster- Biochemistry and Biomedical Sciences
50
GlcNAcylated. Thus retention of the E-cadherin pro-region is regulated independently
from O-GlcNAcylation.
Figure 3.2 E-cadherin O-GlcNAcylation inhibits its trafficking to cell surface by
preventing E-cadherin exit from the endoplasmic reticulum.
Lysates from MCF-7 cells treated with DMSO control (−), FI or TG were digested with
Endo H or PNGase F and analyzed by immunoblotting for E-cadherin. The increased
mobility after PNGase F digestion in untreated or FI treated cells is indicated with a
stepped line (lane 2-3, 5-6).
O-GlcNAcylation prevents E-cadherin trafficking by inhibiting export from the
endoplasmic reticulum
We examined the effect of the separate modifications on E-cadherin trafficking by
exploiting the differential sensitivity of N-linked glycosylation to peptide:N-glycosidase
F (PNGase F) and Endoglycosidase H (Endo H) digestion (Maley, Trimble, Tarentino, &
Plummer, 1989). Endo H removes the high mannose sugars added in the endoplasmic
reticulum but does not hydrolyze complex type N-glycosylation that occurs in the cis to
medial Golgi cisternae. PNGase F hydrolyzes both types of N-glycosylation (Maley, et al.,
1989). Thus Endo H resistance with PNGase F sensitivity reflects export from the
endoplasmic reticulum and transit through the cis-Golgi, whereas sensitivity to both
glycosidases indicates retention in the endoplasmic reticulum (Spellman, 1990).

PhD Thesis - Fei Geng McMaster- Biochemistry and Biomedical Sciences
51
As expected after treatment with either TG or FI, both the processed and pro-
region containing forms of E-cadherin were sensitive to PNGase F (Figure 3.9B). This
indicates that all of the E-cadherin species were N-glycosylated. In addition, the bulk of
the E-cadherin from untreated cells (a control for authentic transport to the plasma
membrane) was resistant to Endo H digestion but sensitive to PNGase F indicative of
efficient export from the endoplasmic reticulum (Figure 3.2, lane 1-3). In FI treated cells,
pro-E-cadherin was also resistant to Endo H digestion and sensitive to PNGase F
digestion, indicating that this protein also exits the endoplasmic reticulum (Figure 3.2,
lane 4-6) even though it does not transit to the cell surface ((Ozawa & Kemler, 1990);
Figure 3.9A, bottom panel, lane 5).Thus retention of the pro-region is not sufficient to
abolish export from the endoplasmic reticulum as expected, since the pro-region is
normally removed later in the secretory pathway. By contrast in lysates from TG treated
cells either Endo H or PNGase F digestion reduced the apparent molecular weight of the
140 kDa modified E-cadherin bands similarly (Figure 3.2, lane 7-9). Taken together with
our previous report showing that TG treatment does not cause a general block in protein
exit from the endoplasmic reticulum (Zhu, et al., 2001), these data indicate that TG
induced O-GlcNAcylation selectively prevents pro-E-cadherin from exiting from the
endoplasmic reticulum.

PhD Thesis - Fei Geng McMaster- Biochemistry and Biomedical Sciences
52
Figure 3.3 The polyserine region in the E-cadherin cytoplasmic domain is required
for TG induced E-cadherin O-GlcNAcylation.
(A) Defined regions of wild type E-cadherin cytoplasmic domain were demonstrated
previously. The corresponding diagram for HA tagged E-cad WT and E-cadΔpSer are
indicated. (B) MCF-7 cells expressing HA tagged E-cad WT (top) and E-cadΔpSer
(bottom) were treated with DMSO control (−), TN, TG or both for 24 hours. Cell lysates
were analyzed by immunoblotting for HA tag (Input) or by WGA binding followed by
immunoblot (IB).
The polyserine (pSer) region is required for O-GlcNAcylation of E-cadherin
On cytoplasmic and nuclear proteins, as well as the cytoplasmic domains of some
transmembrane proteins O-GlcNAc can be attached via the hydroxyl group of serines or

PhD Thesis - Fei Geng McMaster- Biochemistry and Biomedical Sciences
53
threonines (Wells & Hart, 2003). Studies on non-glycosylatable mutants of these target
proteins have increased our understanding of the biological function of O-GlcNAcylation
(Comer & Hart, 2000). To map the region(s) of E-cadherin that are subject to O-
GlcNAcylation, we generated a hemaglutinin (HA) tagged E-cadherin with a deletion of
the pSer region located in cytoplasmic domain (deletion of amino acids 838-853, E-
cadΔpSer) as this sequence is a potential candidate for the multiple O-GlcNAcylation
site(s) required to result in binding to WGA (Figure 3.3A; (Vosseller, et al., 2001)). HA
tagged constructs of wild type E-cadherin (E-cad WT) and a mutant with the entire
cytoplasmic domain deleted (deletion of amino acids 728-882, E-cadΔcyto) served as
controls that can and cannot be O-GlcNAcylated, respectively.
To assess O-GlcNAcylation and pro-region retention MCF-7 and MDCK cell
clones stably expressing the proteins (Figure 3.10) were exposed to TG and/or TN and
whole cell lysates or WGA precipitates were analyzed by immunoblotting as above
(Figure 3.3B). In response to TG treatment the HA-tagged proteins migrated as higher
molecular weight species consistent with pro-region retention as seen with the
endogenous E-cadherin (Figure 3.3B, *). A fraction of the higher molecular weight E-cad
WT protein was also O-GlcNAcylated in response to TG and TN and therefore bound to
WGA (Figure 3.3B, top panel lane 8). In contrast, no detectable E-cadΔpSer bound to
WGA after TG and TN treatment (Figure 3.3B, bottom panel, lane 8) despite the fact that
most of this protein also retained the pro-region (Figure 3.3B, bottom panel, lane 4). The
most likely explanation for loss of O-GlcNAcylation of E-cadΔpSer is that the deleted
region contains the serines that are modified. Alternatively, deletion of the pSer region
may affect the folding and accessibility to O-GlcNAcylation at another site.
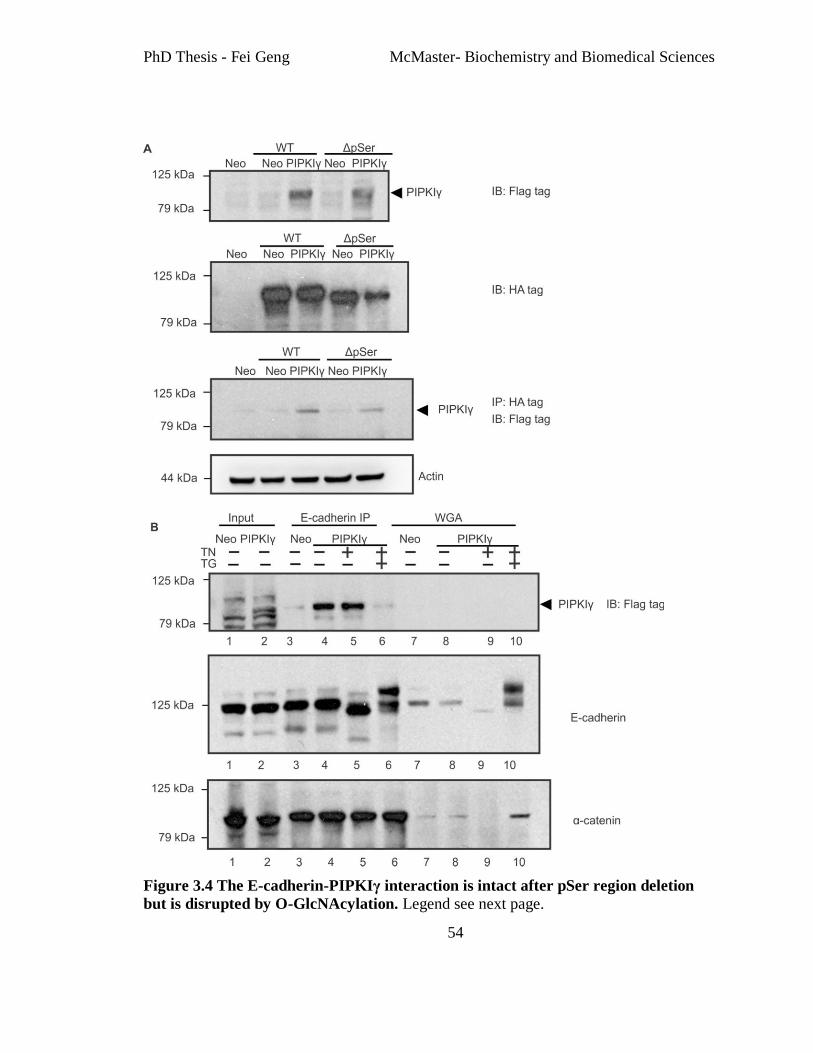
PhD Thesis - Fei Geng McMaster- Biochemistry and Biomedical Sciences
54
Figure 3.4 The E-cadherin-PIPKIγ interaction is intact after pSer region deletion
but is disrupted by O-GlcNAcylation. Legend see next page.

PhD Thesis - Fei Geng McMaster- Biochemistry and Biomedical Sciences
55
(A) HEK 293 cells were cotransfected with either HA tag empty vector (Neo), HA
tagged E-cad WT or E-cadΔpSer and either Flag tag control vector (Neo) or Flag tagged
PIPKIγ. The expression of HA tagged E-cadherin and Flag tagged PIPKIγ was analyzed
by immunoblotting for Flag tag (top panel) and HA tag (the second panel). The
interaction between PIPKIγ and E-cad WT or E-cadΔpSer was analyzed by
immunoprecipitation with HA tag antibody and immunoblotting for Flag tag (the third
panel). Actin blot was provided as loading control (bottom panel). (B) MCF-7 cells
transfected with PIPKIγ or control vector (Neo) were treated with DMSO control (-), TN,
or TN plus TG for 24 hours. Total cell lysates (Input, lanes 1-2), immunoprecipitates with
E-cadherin antibody (lanes 3-6) or WGA pull down (lanes 7-10) were immunoblotted for
Flag tag (top panel), E-cadherin (middle panel) or α -catenin (bottom panel).
O-GlcNAc modified E-cadherin does not bind PIPKIγ
The PIPKIγ interacting region on E-cadherin overlaps with the pSer region
required for O-GlcNAcylation (Ling, et al., 2007). To determine if deletion of the pSer
region from E-cadherin interfered with PIPKIγ binding to E-cadherin, we examined
complex formation in HEK 293 cells cotransfected with plasmids encoding Flag tagged
PIPKIγ and HA tagged E-cadΔpSer or HA tagged E-cad WT (Figure 3.4A, top panel and
the second panel). Immunoprecipitation with HA tag antibody followed by
immunoblotting for Flag tag on PIPKIγ revealed that PIPKIγ bound to E-cadΔpSer and E-
cad WT similarly (Figure 3.4A, the third panel).
To investigate the effect of O-GlcNAc modification of E-cadherin on the
interaction between PIPKIγ and E-cadherin, MCF-7 cells stably expressing Flag tagged
PIPKIγ were treated with TN and TG as above. In MCF-7 cells, the interaction between
PIPKIγ and E-cadherin was not affected by TN (inhibited N-glycosylation) but was
greatly decreased in response to TG (stimulated O-GlcNAcylation) (Figure 3.4B, top
panel, lane 4-6). More importantly, precipitation with WGA revealed that PIPKIγ does
not bind to O-GlcNAc modified E-cadherin (Figure 3.4B, top panel, lane 10).
Overexpression of PIPKIγ did not inhibit O-GlcNAcylation of E-cadherin as it still bound
to WGA (Figure 3.4B, middle panel, lane 10). Because O-GlcNAcylation disrupts the
interaction between E-cadherin and PIPKIγ, we examined whether O-GlcNAcylation
affects the interaction between E-cadherin and α-catenin as a “bridge” to the cytoskeleton

PhD Thesis - Fei Geng McMaster- Biochemistry and Biomedical Sciences
56
(Drees et al., 2005). We noted that α-catenin bound to total E-cadherin in the absence or
presence of TG (Figure 3.4B, bottom panel, lane 4-6) and to O-GlcNAcylated E-cadherin
as indicated by immunoblotting after WGA-Sepharose precipitation (Figure 3.4B, bottom
panel, lane 9-10). We reported previously that treatment with TG did not affect binding of
β-catenin or γ-catenin to E-cadherin (Zhu, et al., 2001). Furthermore, deletion of the pSer
region did not affect the E-cadherin-β-catenin interaction or E-cadherin-γ-catenin
interaction (Figure 3.11), even though phosphorylation on serines in this region of E-
cadherin has been reported to enhance β-catenin binding affinity (Lickert, Bauer, Kemler,
& Stappert, 2000; Stappert & Kemler, 1994). Taken together, these data suggest that O-
GlcNAcylation selectively inhibits E-cadherin binding to PIPKIγ.
Preventing O-GlcNAcylation maintains transport of E-cadherin to the plasma
membrane during cell stress
Because PIPKIγ is essential for trafficking of E-cadherin to the plasma membrane,
we examined the effect of the deletion mutants on the cell surface expression of E-
cadherin after TG exposure. We detected surface proteins by biotinylation, streptavidin
precipitation and subsequent immunoblotting. After exposure of the cells to TG for 24
hours, HA-tagged full-length E-cadherin was not detected at the cell surface (Figure 3.5A,
compare lane 1-2), suggesting a profound block in cell surface transport. In the same
conditions both E-cadΔcyto and E-cadΔpSer transport was reduced by TG treatment but
the mature forms of the proteins continued to be detected on the plasma membrane
(Figure 3.5A). The decrease in intensity of the bands corresponding to E-cadΔcyto and
E-cadΔpSer after treatment with TG is likely due to retention of the unprocessed (pro-
region containing) forms of the proteins at a post-Golgi location in the secretory pathway
as we noted for endogenous E-cadherin (Figure 3.2) and consistent with our previous
observation that transport of unprocessed form is arrested in the late secretory pathway
(Zhu, et al., 2001).

PhD Thesis - Fei Geng McMaster- Biochemistry and Biomedical Sciences
57
Figure 3.5 Prevention of E-cadherin O-GlcNAcylation maintains both endogenous
and transfected E-cadherin targeting to the plasma membrane. Legend see next page.

PhD Thesis - Fei Geng McMaster- Biochemistry and Biomedical Sciences
58
(A) After surface biotinylation, cell surface E-cadherin expression in MCF-7 cells
expressing HA tagged E-cad WT, E-cadΔcyto or E-cadΔpSer were examined by
immunoblotting for HA tag. (B) Lysates from MCF-7 cells expressing HA tagged E-cad
WT, E-cadΔcyto and E-cadΔpSer treated with TG were digested with Endo H or PNGase
F and analyzed by immunoblotting for HA tag. (C) After surface biotinylation, cell
surface E-cadherin expression in MCF-7 cells expressing HA tagged E-cad WT, E-
cadΔcyto or E-cadΔpSer were examined by immunoblotting for E-cadherin with the
antibody (IC) that recognizes cytoplasmic domain on endogenous E-cadherin and E-cad
WT. (D) The relative proportion of transfected or endogenous E-cadherin remaining on
cell membrane after TG treatment for 24 hours. The ratio was calculated based on the
measurements of the intensity of the relevant bands (Figure 3.12C) shown in the
immunoblots of Figure 3.5A, C.
We also noted a separate mechanism whereby the E-cadherin mutants increased
surface expression of E-cadherin. By using a monoclonal antibody to the cytoplasmic
domain that does not recognize either deletion mutant (Figure 3.12A), any cell surface E-
cadherin detected in biotin-labeled cells using this antibody represents endogenous or
transfected wild type protein. Remarkably in TG treated cells, expression of either E-
cadΔcyto or E-cadΔpSer but not WT increased the amount of endogenous mature E-
cadherin on the cell surface (Figure 3.5C, compare lane 4 with lane 6 and 8).
Quantification of multiple blots revealed that this effect of increased cell surface
expression of endogenous E-cadherin is particularly pronounced in cells expressing E-
cadΔcyto (Figure 3.12C). Thus transfection of the non-glycosylatable mutants attenuated
the decrease in total cell surface E-cadherin after TG treatment by two mechanisms:
increased transport of the mutants themselves (Figure 3.5D, dark bars), and by facilitating
the transport or stabilization of endogenous E-cadherin “in trans” (Figure 3.5D, open
bars).
To confirm these results, we also measured the amount of cell surface protein by
immunofluorescence staining of non-permeabilized MCF-7 cells stably expressing either
E-cad WT or E-cadΔpSer. E-cadherin was labeled with an antibody directed against the
extracellular domain (EC) (detecting both WT and mutant E-cadherin equally) and
visualized using a fluorescein labeled secondary antibody (Figure 3.13A). Cell number

PhD Thesis - Fei Geng McMaster- Biochemistry and Biomedical Sciences
59
was estimated by staining with Syto 63 dye. The rate at which the green/red ratio
decreases after TG treatment was used to estimate the rate at which E-cadherin disappears
from the cell surface. Loss of cell surface E-cadherin was significantly greater in cells
expressing exogenous HA tagged E-cad WT than that observed in cells expressing E-
cadΔpSer (Figure 3.13B, p=0.047 by two way ANOVA), consistent with what was
observed with the biotin labeling and immunoblotting results summarized above. In
comparison, BFA and CER that cause O-glycosylation and/or pro-region retention also
prevent E-cadherin transport to the cell surface (Figure 3.14). This is not an invariant
feature of cells undergoing programmed cell death as it is not observed in MCF-7 cells
To examine potential differences in exit from the endoplasmic reticulum during
cell surface trafficking of E-cadherin and the deletion mutants, the sensitivity of N-linked
glycosylation to PNGase F and Endo H digestion was determined. In untreated cells most
exogenous E-cad WT, E-cadΔcyto and E-cadΔpSer was PNGase F sensitive and Endo H
resistant (Figure 3.12B), demonstrating that they exited the endoplasmic reticulum and
proceeded to the Golgi apparatus. By contrast, after treatment with TG, the 140 kDa form
of E-cad WT was sensitive to Endo H digestion, consistent with O-GlcNAcylation
serving as an endoplasmic reticulum retention signal and thereby preventing processing
of E-cadherin in the Golgi (Figure 3.5B, lane 1-3). However, the pro-region containing
forms of both E-cadΔcyto and E-cadΔpSer were Endo H resistant but PNGase F sensitive
(Figure 3.5B, lane 4-6 and 7-9, respectively), indicating that the pro-region containing
forms of the deletion mutants exited the endoplasmic reticulum.Thus O-GlcNAcylation,
not pro-region retention, prevented trafficking from the endoplasmic reticulum to the
Golgi.
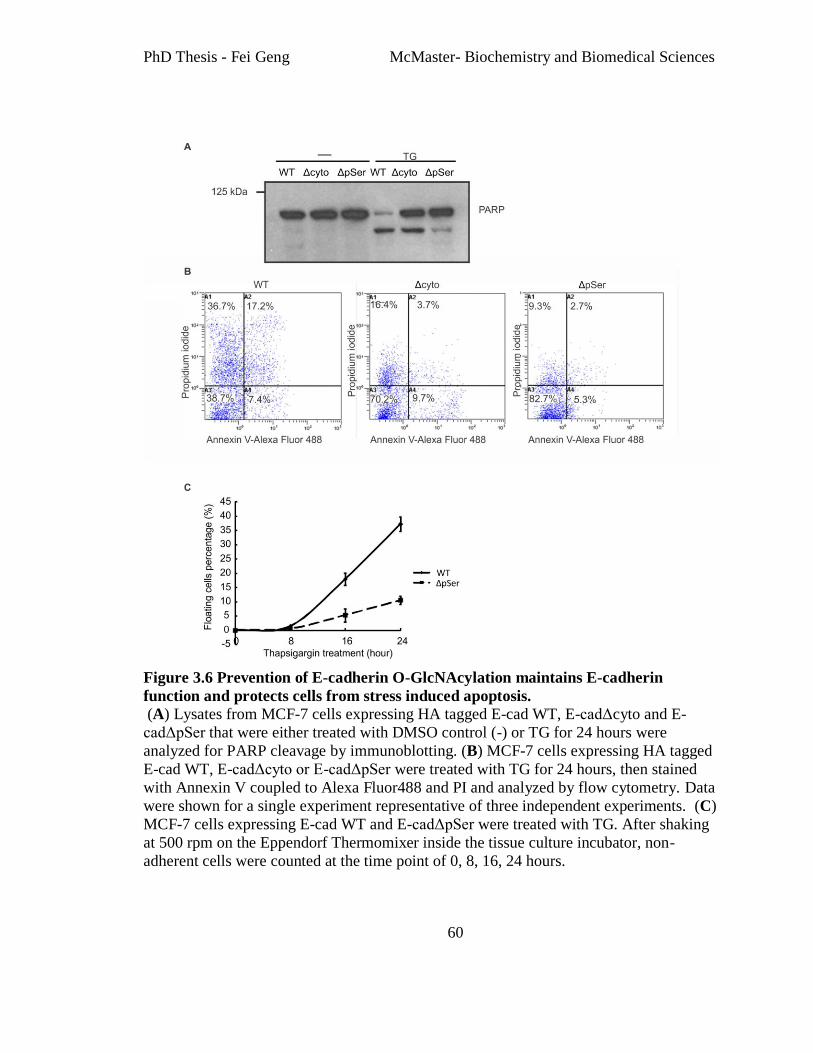
PhD Thesis - Fei Geng McMaster- Biochemistry and Biomedical Sciences
60
Figure 3.6 Prevention of E-cadherin O-GlcNAcylation maintains E-cadherin
function and protects cells from stress induced apoptosis.
(A) Lysates from MCF-7 cells expressing HA tagged E-cad WT, E-cadΔcyto and E-
cadΔpSer that were either treated with DMSO control (-) or TG for 24 hours were
analyzed for PARP cleavage by immunoblotting. (B) MCF-7 cells expressing HA tagged
E-cad WT, E-cadΔcyto or E-cadΔpSer were treated with TG for 24 hours, then stained
with Annexin V coupled to Alexa Fluor488 and PI and analyzed by flow cytometry. Data
were shown for a single experiment representative of three independent experiments. (C)
MCF-7 cells expressing E-cad WT and E-cadΔpSer were treated with TG. After shaking
at 500 rpm on the Eppendorf Thermomixer inside the tissue culture incubator, non-
adherent cells were counted at the time point of 0, 8, 16, 24 hours.

PhD Thesis - Fei Geng McMaster- Biochemistry and Biomedical Sciences
61
Prevention of E-cadherin O-GlcNAcylation maintains E-cadherin function and
delays apoptosis
To investigate the effect of O-GlcNAcylation of E-cadherin on cell death, MCF-7
cells expressing E-cad WT, E-cadΔpSer or E-cadΔcyto were treated with TG and
apoptosis was assessed by PARP cleavage and Annexin V staining. PARP cleavage was
delayed in cells expressing E-cadΔcyto or E-cadΔpSer at a time point at which PARP
cleavage was almost complete and much of the cleaved product was been further
degraded in control cells (Figure 3.6A). Delayed cell death in cells expressing the mutant
forms of E-cadherin that were not O-GlcNAcylation substrates was confirmed by two
color flow cytometric analysis measuring Annexin V-FITC and PI staining (Figure 3.6B).
In these experiments TG treatment reduced the fraction of viable cells expressing E-cad
WT to 38.7% (Annexin V-/PI-) whereas at the same time point 70.2% and 82.7% of the
cells expressing E-cadΔcyto or E-cadΔpSer were viable respectively (Figure 3.6B). Thus
expression of either E-cadΔcyto or E-cadΔpSer substantially reduced TG induced cell
death. To confirm that these changes are not cell line or species specific, we examined the
non-transformed, canine renal epithelial cell line MDCK expressing HA-tagged human E-
cad WT and E-cadΔcyto (Figure 3.10C). Consistent with the results in MCF-7 cells after
treatment with TG, less PARP cleavage was observed for MDCK cells expressing human
E-cadΔcyto than for cells expressing E-cad WT.
To link the modification of E-cadherin with the effect on cell survival, we
directly measured the adhesive activity of E-cad WT and E-cadΔpSer in the presence or
absence of TG treatment (Figure 3.6C). After shaking in an incubator, the percentage of
floating cells was 17% and 37% at 16 and 24 hours of TG treatment respectively, in WT
E-cad expressing cells, but only 5% and 11% in E-cadΔpSer expressing cells. Thus
prevention of O-glycosylation maintains the cell adhesion function of E-cadherin.
Furthermore, F-actin formation and cell polarity were maintained by preventing O-
glycosylation during TG treatment (Figure 3.15).

PhD Thesis - Fei Geng McMaster- Biochemistry and Biomedical Sciences
62
3.4 Discussion
As a critical component of epithelial junctional complex, E-cadherin is known to
be post-translationally modified by phosphorylation and N-glycosylation (Gumbiner,
2005; Jeanes, Gottardi, & Yap, 2008; Liwosz, et al., 2006). As shown here, E-cadherin
can also be modified by O-GlcNAcylation (Zhu, et al., 2001) and retention of the pro-
region. The later effect is likely due to the inhibition of a luminal furin-like protease.
Recent reports indicated that O-GlcNAc transferase (OGT) also has intrinsic proteolytic
activity (Capotosti, et al., 2011). Both enzymatic functions are required sequentially to
activate the mitotic regulator, HCF-1. In our case, selected cellular stressors activate the
transferase activity of OGT while repressing the activity of a separate protease, and these
effects occur in distinct cellular compartments (cytoplasm and endoplasmic reticulum
lumen, respectively). Both of these independently regulated changes have a profound
effect on E-cadherin trafficking and on the susceptibility of cells to apoptosis.
O-GlcNAcylation of E-cadherin inhibits both the binding of PIPKIγ to E-cadherin
(Figure 3.4) and trafficking is blocked in the endoplasmic reticulum. As a result, the N-
linked glycans on the extracellular domain of E-cadherin remain Endo H sensitive while
pro-region which is normally removed by furin like proprotein convertases in the TGN is
retained. Retention of E-cadherin in the endoplasmic reticulum reduced the total amount
of the protein at the cell surface (Figure 3.2 and 3.5) and exacerbated apoptosis.
Consistent with this interpretation, expression of mutant E-cadherin which lacks the pSer
region that we identified as necessary for O-GlcNAcylation (Figure 3.3) prevented
apoptosis induced by drugs that increased O-GlcNAcylation (Figure 3.6). A schematic
overview of these effects is shown in Figure 3.7.
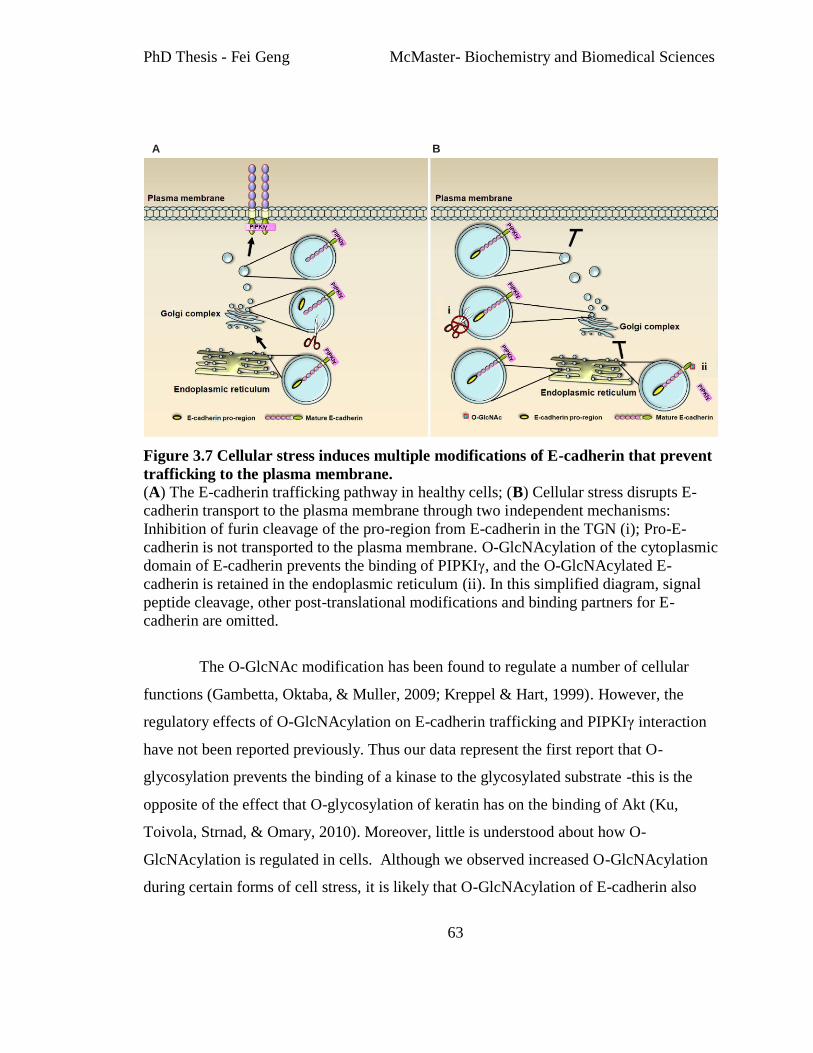
PhD Thesis - Fei Geng McMaster- Biochemistry and Biomedical Sciences
63
A B
Figure 3.7 Cellular stress induces multiple modifications of E-cadherin that prevent
trafficking to the plasma membrane.
(A) The E-cadherin trafficking pathway in healthy cells; (B) Cellular stress disrupts E-
cadherin transport to the plasma membrane through two independent mechanisms:
Inhibition of furin cleavage of the pro-region from E-cadherin in the TGN (i); Pro-E-
cadherin is not transported to the plasma membrane. O-GlcNAcylation of the cytoplasmic
domain of E-cadherin prevents the binding of PIPKIγ, and the O-GlcNAcylated E-
cadherin is retained in the endoplasmic reticulum (ii). In this simplified diagram, signal
peptide cleavage, other post-translational modifications and binding partners for E-
cadherin are omitted.
The O-GlcNAc modification has been found to regulate a number of cellular
functions (Gambetta, Oktaba, & Muller, 2009; Kreppel & Hart, 1999). However, the
regulatory effects of O-GlcNAcylation on E-cadherin trafficking and PIPKIγ interaction
have not been reported previously. Thus our data represent the first report that O-
glycosylation prevents the binding of a kinase to the glycosylated substrate -this is the
opposite of the effect that O-glycosylation of keratin has on the binding of Akt (Ku,
Toivola, Strnad, & Omary, 2010). Moreover, little is understood about how O-
GlcNAcylation is regulated in cells. Although we observed increased O-GlcNAcylation
during certain forms of cell stress, it is likely that O-GlcNAcylation of E-cadherin also

PhD Thesis - Fei Geng McMaster- Biochemistry and Biomedical Sciences
64
occurs in response to less drastic stimuli and therefore, contributes to other forms of
regulation of intracellular adhesion. The E-cadherin-PIPKIγ-AP1B interaction serves as a
foundational signal for exocytic targeting and basolateral sorting of E-cadherin (Ling, et
al., 2007). Furthermore, recent reports indicate that the association of increased PIPKIγ
expression with invasiveness and poor prognosis in breast cancer. This effect may be
mediated by PIPKIγ decreasing the binding of E-cadherin to β-catenin, which in turn can
become transcriptionally competent and activate cell proliferation and metastatic
pathways (Sun, et al., 2010). However, the simplest interpretation of our data
demonstrating O-GlcNAc modification disrupts PIPKIγ binding to E-cadherin (Figure
3.4B) and prevents cell surface transport is that these events are interconnected. The fact
that E-cadΔpSer was not O-GlcNAc modified (Figure 3.3B), continued to bind PIPKIγ
(Figure 3.4A) and transited to the plasma membrane (Figure 3.5) strongly suggests that
inhibition of E-cadherin transport in response to TG is due to O-GlcNAcylation of E-
cadherin rather than some other effect of TG such as loss of endoplasmic reticulum
calcium. This also explains why during TG treatment, E-cadΔpSer continued to target to
the plasma membrane where it delayed apoptosis (Figure 3.5 and 3.6). Although the
adhesion assay time course and the apoptosis data (Figure 3.5 and 3.6) are not directly
comparable, they suggest that loss of adhesion precedes AnnexinV staining. However, it
is difficult to assign a specific time for apoptosis since it is cell autonomous and clearly
more work will be required to fully understand the kinetics of all of the events at the
single cell level.
Adhesion-dependent survival is a fundamental aspect of cell behavior (Gilmore,
Owens, Foster, & Lindsay, 2009). It is not clear why expression of mutants lacking pSer
region or entire cytoplasmic domain of E-cadherin delayed apoptosis in response to
stimuli that trigger O-GlcNAcylation of wild-type E-cadherin. However, both mutants
continued to transit to the cell surface in drug treated cells. It is possible that increased
adhesion for these mutants is sufficient to delay apoptosis in MCF-7 cells. However, we
have also noted that expression of the mutants allows more of the processed endogenous

PhD Thesis - Fei Geng McMaster- Biochemistry and Biomedical Sciences
65
WT E-cadherin to assemble, or remain on the plasma membrane. In the latter case the
survival signal may be mediated by signaling through the intact cytoplasmic tail of
endogenous WT E-cadherin (possibly in mixed complexes), or by a combination of both
increased adhesion and E-cadherin signaling mechanisms.
The endocytic recycling of cell surface E-cadherin is susceptible to oncogenic
dysregulation that is mediated by multiple processes, including the Cbl and Nedd4
ubiquitin ligases that represent potential targets for novel cancer therapies (Mosesson,
Mills, & Yarden, 2008). We have shown here that the initial trafficking and assembly of
the plasma membrane E-cadherin complex is also tightly regulated, and recent work has
indicated that OGT is a good target for pharmaceutical intervention (Gloster, et al., 2011).
Therefore, further dissection and manipulation of the regulatory mechanisms of O-
GlcNAcylation in E-cadherin adhesion in a context of stress have important implications
for diverse disease processes such as apoptosis, development and metastasis.

PhD Thesis - Fei Geng McMaster- Biochemistry and Biomedical Sciences
66
Figure 3.8 Multiple agonists cause E-cadherin modifications. Legend see next page.

PhD Thesis - Fei Geng McMaster- Biochemistry and Biomedical Sciences
67
(A) MCF-7 cells were treated with 400 nM TG for 24 hours, 10 µg/mL BFA for 24 hours,
100 µM CER for 8 hours, 10 µg/mL TN for 24 hours, 10 mM DTT for 6 hours
respectively. Cell lysates were analyzed by immunoblotting and detected proteins are
indicated on the right of the blots. Note that the modification of the E-cadherin is not
directly associated with endoplasmic reticulum stress or apoptosis. TG and DTT both
cause apoptosis, but modified E-cadherin only existed in TG treated cells. TN and BFA
both cause endoplasmic reticulum stress with increased expression of Glucose-regulatory
protein 78 (GRP78), but only the latter causes the E-cadherin modification. (B) The
expression of Bip/GRP78 and PARP cleavage after extended treatment of MCF-7 cells
with TN (10 µg/mL for 48 hours) or DTT (10 mM for 15 hours). (C) Detection of E-
cadherin modification by immunoblotting after treatment of cells with TG or extended
treatment with TN or DTT. (D) Lysates prepared from MCF-7 cells treated with DMSO
control (-), TG, BFA or CER in the absence or presence of TN were analyzed by WGA
binding and immunoblotting for E-cadherin. (E) Lysates prepared from MCF-7 cells
treated with DMSO control (-) and BFA were analyzed by immunoblotting with an E-
cadherin antibody raised against an epitope in the cytoplasmic domain (IC, top panel) or
E-cadherin antibody raised against an epitope in the extracellular domain (EC, bottom
panel).

PhD Thesis - Fei Geng McMaster- Biochemistry and Biomedical Sciences
68
Figure 3.9 The effect of E-cadherin O-GlcNAcylation or pro-region retention on its
plasma membrane trafficking.
(A) FI does not cause endoplasmic reticulum stress or apoptosis. Cell stress and apoptosis
were monitored in cell lysates probed with antibodies to GRP78/GRP94 and PARP as
indicated (top two panels). E-cadherin on the surface of MCF-7 cells treated with TG or
FI was examined by surface biotinylation and immunoblotting (bottom panel,
Biotinylated). The expression of E-cadherin in total cell lysates was shown as control
(bottom panel, Input). (B) Lysates prepared from MCF-7 cells after treatment with
DMSO control (−), TG or FI were immunoprecipitated with E-cadherin antibody or
bound to WGA, digested by PNGase F and then analyzed by immunoblotting.

PhD Thesis - Fei Geng McMaster- Biochemistry and Biomedical Sciences
69
Figure 3.10 Functional evaluation of E-cadherin mutants. (A) The expression profile of HA tagged E-cadherin WT and mutants in MCF-7 cells.
Relative expression of HA tagged E-cad WT and E-cadherin mutants in MCF-7 cells was
shown by immunoblotting for HA tag. (B) E-cadΔcyto is not O-GlcNAcylated in MCF-7
cells. MCF-7 cells expressing HA tagged E-cadΔcyto were treated with DMSO control
(−), TN, TG or both for 24 hours. Cell lysates were analyzed by immunoblotting for HA
tag (Input) or by WGA binding followed by immunoblotting. (C) E-cadΔcyto protects
MDCK cells from TG induced apoptosis. The expression of HA tagged E-cadherin in
MDCK cells transfected with E-cad WT or E-cadΔcyto was analyzed by immunoblotting
for HA tag (top panel). The transfected MDCK cells were treated with TG for 24 hours,
and assessed by immunoblotting for PARP (bottom panel).

PhD Thesis - Fei Geng McMaster- Biochemistry and Biomedical Sciences
70
Figure 3.11 The interaction of E-cadherin with β-catenin or γ-catenin is not affected
by the deletion of the pSer region. (A) Deletion of the pSer region does not affect the E-cadherin-β-catenin interaction. Cell
lysates prepared from the cells stably expressing E-cad WT, E-cadΔcyto and E-cadΔpSer
were immunoprecipitated with HA tag antibody and then blotted with β-catenin antibody.
Deletion of the cytoplasmic domain (E-cadΔcyto) eliminates this interaction, which is
preserved in E-cadΔpSer (top panel). Actin blot was provided as loading control (bottom
panel). (B) The amount of E-cadherin bound to β-catenin is less in cells transfected with
E-cadΔcyto. Cells stably expressing E-cad WT, E-cadΔcyto and E-cadΔpSer were
harvested and cell lysates were immunoprecipitated with antibody to extracellular (EC)
domain of E-cadherin that detects both endogenous and all three transfected E-cadherin,
immunoblotted for β-catenin. The amount of bound β-catenin is decreased in all
transfected cells with E-cadΔcyto (lane 9-10) compared to E-cad WT (lane 7-8) or E-
cadΔpSer (lane 11-12). (C) Deletion of the pSer region does not affect the E-cadherin-γ-
catenin interaction. Cell lysates prepared from the cells stably expressing E-cad WT, E-
cadΔcyto and E-cadΔpSer were immunoprecipitated with HA tag antibody and then
immunoblotted for γ-catenin.
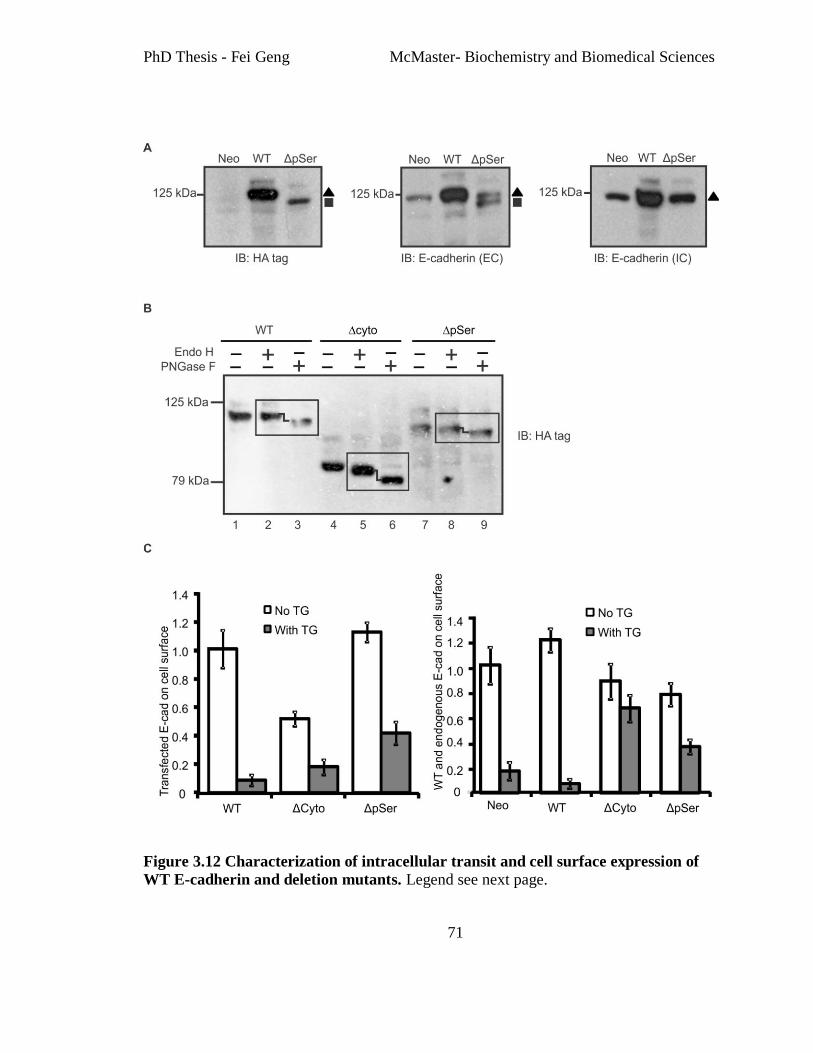
PhD Thesis - Fei Geng McMaster- Biochemistry and Biomedical Sciences
71
Figure 3.12 Characterization of intracellular transit and cell surface expression of
WT E-cadherin and deletion mutants. Legend see next page.

PhD Thesis - Fei Geng McMaster- Biochemistry and Biomedical Sciences
72
(A) The antibody to E-cadherin cytoplasmic domain does not recognize E-cadΔpSer.
Total cell lysates of MCF-7 cells expressing control vector (Neo), WT E-cad and E-
cadΔpSer were analyzed by immunoblotting with HA tag antibody or antibodies with the
epitope on cytoplasmic domain (IC, right panel) or extracellular domain of E-cadherin
(EC, middle panel). As expected, the HA antibody detects E-cadΔpSer as a smaller
species (■) compared to the transfected WT. The EC antibody recognizes both
endogenous (▲) and transfected E-cadΔpSer (■) in E-cadΔpSer cells. Only the
endogenous (▲) E-cadherin is recognized by the IC antibody (right panel) (B) Lysates
from MCF-7 cells expressing HA tagged E-cad WT, E-cadΔcyto and E-cadΔpSer were
digested with Endo H or PNGase F and analyzed by immunoblotting for HA tag. (C)
Measurement of cell surface expression of transfected E-cadherin (representative data as
shown in Figure 3.5A) and WT plus endogenous E-cadherin (representative data as
shown in Figure 3.5C). Band intensities were measured by densitometry using the
histogram feature in image J. Bars represent means ± standard deviation of three
independent experiments, P < 0.05.
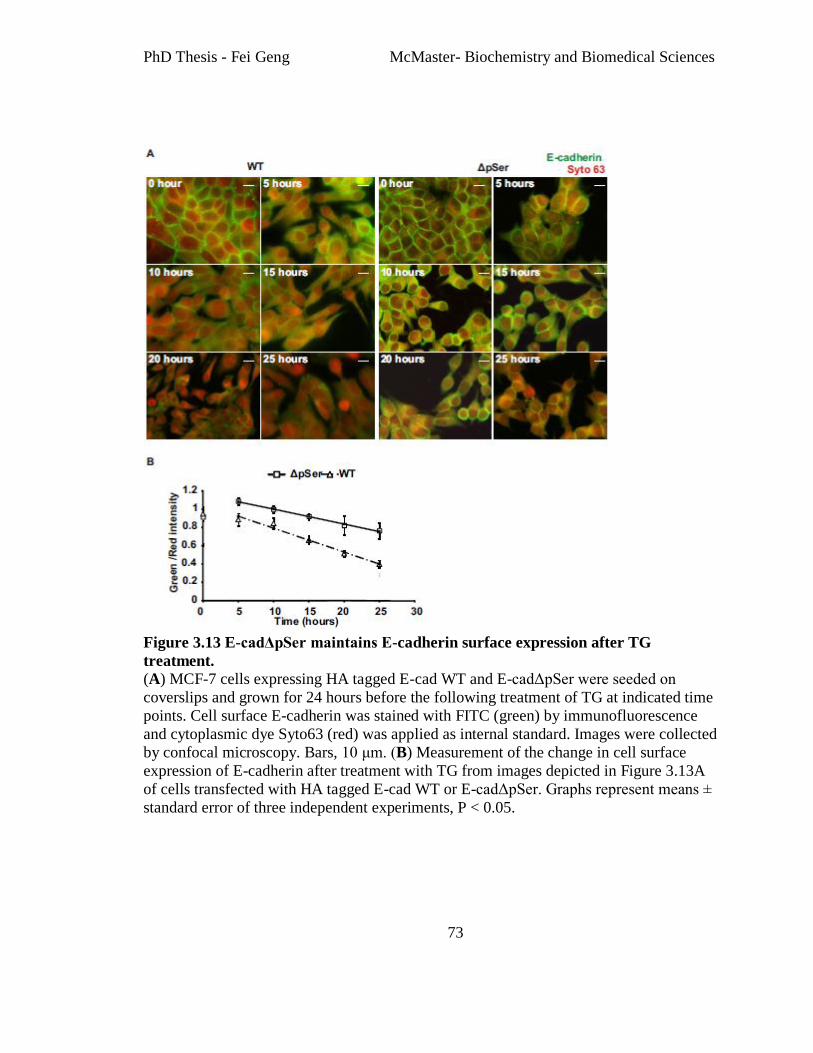
PhD Thesis - Fei Geng McMaster- Biochemistry and Biomedical Sciences
73
Figure 3.13 E-cadΔpSer maintains E-cadherin surface expression after TG
treatment.
(A) MCF-7 cells expressing HA tagged E-cad WT and E-cadΔpSer were seeded on
coverslips and grown for 24 hours before the following treatment of TG at indicated time
points. Cell surface E-cadherin was stained with FITC (green) by immunofluorescence
and cytoplasmic dye Syto63 (red) was applied as internal standard. Images were collected
by confocal microscopy. Bars, 10 μm. (B) Measurement of the change in cell surface
expression of E-cadherin after treatment with TG from images depicted in Figure 3.13A
of cells transfected with HA tagged E-cad WT or E-cadΔpSer. Graphs represent means ±
standard error of three independent experiments, P < 0.05.

PhD Thesis - Fei Geng McMaster- Biochemistry and Biomedical Sciences
74
Figure 3.14 The effect of stressors on E-cadherin O-GlcNAcylation and plasma
membrane targeting.
(A) MCF-7 cells were treated with DMSO control (-), TG, CER, BFA, or 30 ng/mL TNF-
α for 24 hours. Cells were fixed and cell surface E-cadherin was stained with FITC
(green) by immunofluorescence. The cytoplasmic dye Syto63 (red) was applied as
internal standard. Images were collected by confocal microscopy. Bars,10 μm. (B)
Measurement of cell surface expression of E-cadherin of cells treated as described in
Figure 3.14A. Bars represent means ± SD of three independent experiments, P < 0.05.
Thus the three agents that cause O-glycosylation and/or pre-region retention prevent E-
cadherin transport to the cell surface. This is not an invariant feature of cells undergoing
programmed cell death as it is not observed in MCF-7 cells treated with TNF-α.
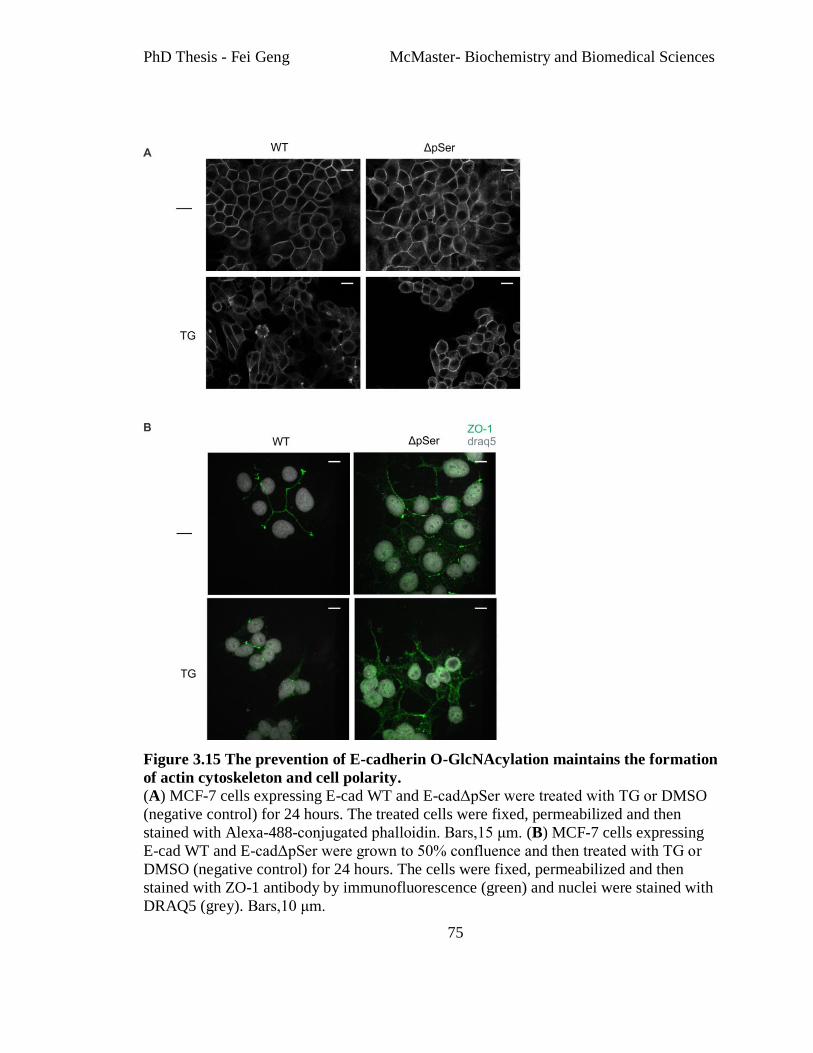
PhD Thesis - Fei Geng McMaster- Biochemistry and Biomedical Sciences
75
Figure 3.15 The prevention of E-cadherin O-GlcNAcylation maintains the formation
of actin cytoskeleton and cell polarity.
(A) MCF-7 cells expressing E-cad WT and E-cadΔpSer were treated with TG or DMSO
(negative control) for 24 hours. The treated cells were fixed, permeabilized and then
stained with Alexa-488-conjugated phalloidin. Bars,15 μm. (B) MCF-7 cells expressing
E-cad WT and E-cadΔpSer were grown to 50% confluence and then treated with TG or
DMSO (negative control) for 24 hours. The cells were fixed, permeabilized and then
stained with ZO-1 antibody by immunofluorescence (green) and nuclei were stained with
DRAQ5 (grey). Bars,10 μm.

PhD Thesis - Fei Geng McMaster- Biochemistry and Biomedical Sciences
76
Chapter 4 : The characterization of endoplasmic reticulum-specific cell death in
breast cancer cells

PhD Thesis - Fei Geng McMaster- Biochemistry and Biomedical Sciences
77
4.1 Preface
Although the modifications of E-cadherin that are induced during stress and the
consequences of these modifications have been characterized by the experiments
described in Chapter 3, the upstream steps that initiate this process are not defined. Our
previous experiments indicate that cell death caused by stress conditions that induce E-
cadherin modifications is prevented to the same extent by Bcl-2 mutant proteins targeted
exclusively to either mitochondria or the endoplasmic reticulum to the same extent. This
suggests that these forms of stress are neither initiated nor executed at specific organelles.
However, we subsequently discovered a unique type of cell death which is prevented
exclusively by Bcl-2 localized on the endoplasmic reticulum. In this chapter, we will
examine this novel pathway and compare it with other stress conditions involving the
endoplasmic reticulum, including those that elicit the E-cadherin modifications described
in Chapter 3.

PhD Thesis - Fei Geng McMaster- Biochemistry and Biomedical Sciences
78
4.2 Introduction
The endoplasmic reticulum is primarily responsible for the synthesis and folding of
secreted and membrane-bound proteins, as well as the biosynthesis of lipids and the
storage of calcium. The endoplasmic reticulum has also emerged as a central player in
other cellular responses including cell stress and programmed cell death pathways. Bcl-2
family members play an important role in regulating programmed cell death from this
location (Hetz, 2007; Oakes, et al., 2006).
The anti-apoptotic protein Bcl-2, the prototype for the Bcl-2 family, is anchored
to membranes by a carboxyl-terminal hydrophobic sequence called a tail-anchor. Unlike
many other tail-anchor proteins that are targeted to a single subcellular location, Bcl-2 is
localized to both the endoplasmic reticulum and the outer mitochondrial membrane in
mammalian cells (Leber, et al., 2010; Zhu, et al., 1996). Over the past several years,
extensive work has been done to elucidate the process whereby members of the Bcl-2
protein family at the mitochondrial outer membrane regulate the decision phase that
commits cells to apoptosis (Shamas-Din, et al., 2011).
When located at the endoplasmic reticulum, Bcl-2 is a constituent of complexes
with binding partners including Bap31, IP3R, BIK and SERCA (Leber, et al., 2010). Bcl-
2 located at the endoplasmic reticulum has been reported to bind to the essential
autophagy protein Beclin 1 and to inhibit Beclin 1- dependent starvation-induced
autophagy (Pattingre, et al., 2005). Recently it has been reported that NAF-1 protein is
required for Bcl-2 to antagonize the autophagy regulatory protein Beclin 1, suggesting
that regulation of autophagy involves a multiprotein complex at the endoplasmic
reticulum (Chang, et al., 2010).
Furthermore, Bcl-2 at the endoplasmic reticulum also regulates other modes of
apoptosis including caspase activation through the interaction with Bap31, and Ca2+
signaling through the interaction with IP3R (Oakes, et al., 2006; Rong & Distelhorst,
2008). Furthermore other Bcl-2 family proteins also regulate apoptosis at this organelle as
they are modified by signals emanating from the endoplasmic reticulum e.g. the pro-

PhD Thesis - Fei Geng McMaster- Biochemistry and Biomedical Sciences
79
apoptotic BH3 proteins Puma and Noxa are important mediators of apoptosis initiated by
UPR (Hetz, 2007; Oakes, et al., 2006).
However, all of these pathways are also inhibited by Bcl-2 proteins located at
mitochondria, suggesting these initiating stimuli eventually transmit pro-apoptotic signals
to mitochondria and rely on interactions at that organelle to commit cells to apoptosis. To
date, there is no known cell death pathway that is mediated primarily by events at the
endoplasmic reticulum. Here we show that estrogen deprivation in estrogen receptor-
positive breast cancer cell lines is a strong candidate for such a process. Aside from its
importance in broadening our understanding of the mechanisms of cell death, the
characterization of this pathway, which is involved in hormonally regulated apoptosis in
breast cancer, may reveal novel drug targets for cancer therapeutics.
4.3 Results
Cell death induced by growth of cells in medium depleted of growth factors is
prevented by Bcl-2 at the endoplasmic reticulum.
To discover a form of cell death which is prevented by Bcl-2 specifically at the
endoplasmic reticulum, we chose MCF-7 cells for our initial studies, as this cell line has
the important feature whereby the endogenous Bcl-2 levels can be dramatically reduced
by growth in estrogen depleted medium (Fiebig, et al., 2006; Teixeira, Reed, & Pratt,
1995).This occurs because Bcl-2 expression is induced by 17β-Estradiol via two estrogen-
responsive elements present in the coding sequence (Perillo, Sasso, Abbondanza, &
Palumbo, 2000). Therefore as a convenient experimental tool, growth of MCF-7 cells in
phenol red-free medium supplemented with Charcoal Stripped Bovine Serum (CSBS) for
5 days reduces the expression of endogenous Bcl-2 by depleting estrogen (and some other
growth factors) from the serum (Fiebig, et al., 2006; Zhu, et al., 2001). By using these
conditions, MCF-7 cells transfected with plasmids expressing Bcl-2 mutants either
exclusively localized at the mitochondria (Bcl2-ActA) or the endoplasmic reticulum
(Bcl2-cb5) can be used to examine the importance of organellar location.

PhD Thesis - Fei Geng McMaster- Biochemistry and Biomedical Sciences
80
For the cell lines we used in subsequent studies, we first confirmed that expression
levels of wild type Bcl-2 (Bcl2-WT) and two Bcl-2 mutant proteins were similar (Figure
4.1A, top panel, lane 2-4). As expected, after estrogen deprivation, the endogenous Bcl-2
is expressed at lower levels than the transfected proteins as assessed by an overexposed
immunoblot (Figure 4.1A, top right blot, compare lane 1 and lane 2-4). Annis et al.
reported that Bcl2-cb5 inhibited cell death when a mitochondrial permeability transition
preceded cytochrome c release, which provides the first hint that there might be a
different pathway from the one in which commitment to cell death is mediated by
proteins at the mitochondria (Annis, et al., 2001). Since Bcl2-ActA and Bcl2-cb5 are
known to be as active as Bcl2-WT expressed at their corresponding organelle targets,
with respect to protecting against apoptotic stimuli that are organelle non-specific (Annis
et al, 2001), this model system should allow us to investigate this unknown pathway.
In pilot studies that led to this series of investigations, we had noticed that cells
expressing Bcl2-cb5 appeared healthier than cells expressing Bcl2-Acta or Bcl2-WT
when grown in CSBS. To examine this effect in more detail, we extended the growth
time in CSBS from 5 days to 10 days (Figure 4.1B-G). Phase contrast micrographs
demonstrated that MCF-7 cells expressing Neo, Bcl2-ActA and Bcl2-WT undergo loss of
adhesion (become round) after growth in CSBS for 10 days while MCF-7 cells expressing
Bcl2-cb5 remain unchanged (Figure 4.1B).

PhD Thesis - Fei Geng McMaster- Biochemistry and Biomedical Sciences
81
Figure 4.1 Growth in CSBS for 10 days led to endoplasmic reticulum-specific cell
death in MCF-7 cells. Legend see next page.

PhD Thesis - Fei Geng McMaster- Biochemistry and Biomedical Sciences
82
(A) Cell lysates containing 20 μg of protein from MCF-7 cells transfected with vector
control (Neo), wild type Bcl-2 protein (Bcl2-WT), mitochondria localized mutant (Bcl2-
ActA) or endoplasmic reticulum localized mutant (Bcl2-cb5), as indicated above the lanes,
were immunoblotted for: Bcl-2 with short exposure (top left blot) and long exposure (top
right blot); the autophagy marker LC3 (the second blot); and the endoplasmic reticulum
chaperone GRP78/94 (the third blot). An actin blot was used to control for equal protein
loading in each lane (bottom blot). (B) Phase contrast microscopic images of MCF-7 cells
expressing vector control (Neo), Bcl2-ActA, Bcl2-cb5 and Bcl2-WT grown in the phenol
red-free medium supplemented with Charcoal Stripped Bovine Serum (CSBS) for 10
days. (C) Transfected MCF-7 cells expressing vector control (Neo), Bcl2-ActA, Bcl2-cb5
and Bcl2-WT were grown in CSBS for 10 days and then the cell lysates were
immunoblotted for PARP. The migration position of the 89 kDa PARP fragment
diagnostic of caspase cleavage is indicated to the left of the blots (ΔPARP, top panel).
An actin immunoblot used as a control for equal protein loading in each lane is shown in
the bottom panel. (D) Quantitative determination of PARP cleavage and degradation in
MCF-7 cells expressing Neo, Bcl2-ActA, Bcl2-cb5 and Bcl2-WT following growth in
CSBS for 10 days. The PARP antibody used for immunoblotting in Figure 4.1C does not
recognize cleavage products generated by other proteases activated during apoptosis.
Therefore, both PARP cleavage and degradation are combined into a single apoptosis
index determined by measuring the band intensities for the116 kDa full-length PARP in
untreated cells (−), and in cells grown in CSBS indicated above the lanes, by analysis
with ImageJ software. Apoptosis Index= 100X (1-Ftreated/Funtreated) (E) MCF-7 cells
expressing Neo, Bcl2-ActA and Bcl2-cb5 were grown in CSBS for 10 days or treated
with 20nM Actinomycin D (ActD) for 24 hours and then stained with Annexin V (green)
and DRAQ5 (white). Representative images are shown. Bar, 30 μm. (F) The percentage
of Annexin V-positive cells in Figure 4.1E determined by image quantification and
supervised classification. (G) Cell lysates of MCF-7 cells expressing Neo, Bcl2-ActA and
Bcl2-cb5 treated with CSBS at day 6 (D6), day 8 (D8) and day 10 (D10) were analyzed
by immunoblotting for caspase-7. MCF-7 cells treated with DMSO control (-) or 33
ng/mL TNF-α/10 µg/mL cycloheximide (TNF-α) for 24 hours were applied as negative
and positive controls for apoptosis.
Consistent with these morphological changes, inspection of PARP immunoblots
revealed disappearance of full-length PARP in Neo control cells (Figure 4.1C, top panel,
lane 2) and disappearance and cleavage of full-length PARP is shown in cells expressing
Bcl2-ActA (Figure 4.1C, top panel, lane 3) compared to intact PARP in Bcl2-cb5 cells
(Figure 4.1C, top panel, lane 4). Accordingly, the quantitative determination of combined
PARP cleavage and degradation indicates a significant decrease of PARP in cells

PhD Thesis - Fei Geng McMaster- Biochemistry and Biomedical Sciences
83
expressing Neo or Bcl2-ActA (Figure 4.1D). The apoptosis index is approximately 90%
and 60% in cells expressing Neo or Bcl2-ActA, respectively, after growth in CSBS for 10
days. By comparison, the apoptosis index is around 20% and less than 10% in cells
expressing Bcl2-WT and Bcl2-cb5 respectively (Figure 4.1D).
In agreement with the PARP data, over 60% of cells expressing Neo or Bcl2-
ActA became Annexin V-positive (green) after growth in CSBS (Figure 4.1E left panel
and F). Comparatively, less than 10% Bcl2-cb5 cells were Annexin V-positive (Figure
4.1F). However, when cells were exposed to actinomycin D (ActD) which induces a
form of mitochondria specific cell death (Hoye, Davoren, Wipf, Fink, & Kagan, 2008),
only ~10% of Bcl2-ActA cells were Annexin V-positive compared to >60% in Bcl2-cb5
cells (Figure 4.1E right panel and F). Therefore Bcl2-ActA is functional but does not
protect cells from CSBS-induced apoptosis.
MCF-7 cells lack caspase-3 due to a 47-base pair deletion in the caspase-3 gene
(Janicke, Sprengart, Wati, & Porter, 1998), but undergo mitochondrial-dependent
apoptosis via caspase-7 activation (Twiddy, et al., 2006). Caspase-7 is processed/cleaved
by the Apaf-1-caspase-9 apoptosome from procaspase-7 into its active form (Twiddy, et
al., 2006). Cleavage of a small amount of caspase-7 was detected in cells expressing Neo
or Bcl2-ActA at day 8 and day 10 of growth in CSBS (Figure 4.1G, lane 4-5 and lane 7-8),
but not in cells expressing Bcl2-cb5 (Figure 4.1G lane 9-11).
Since all the analyses above were performed after growth in CSBS for 10 days,
we further extended the time period to 21 days and enumerated cells attached to the plate
to assess the duration of the protective effect of Bcl2-cb5. The cell count revealed almost
complete loss of attachment of cells expressing Neo, Bcl2-ActA and Bcl2-WT at this time
point (Figure 4.2A). By contrast, not only did Bcl2-cb5 cells remain attached, they also
increased in number compared to the input before being subjected to CSBS (Figure 4.2A)
thus confirming the profound effect of Bcl2-cb5 against this form of cell death.
We then sought to determine if this specific pathway for cell death is shared by
other known stimuli that elicit forms of endoplasmic reticulum stress (Figure 4.2B).
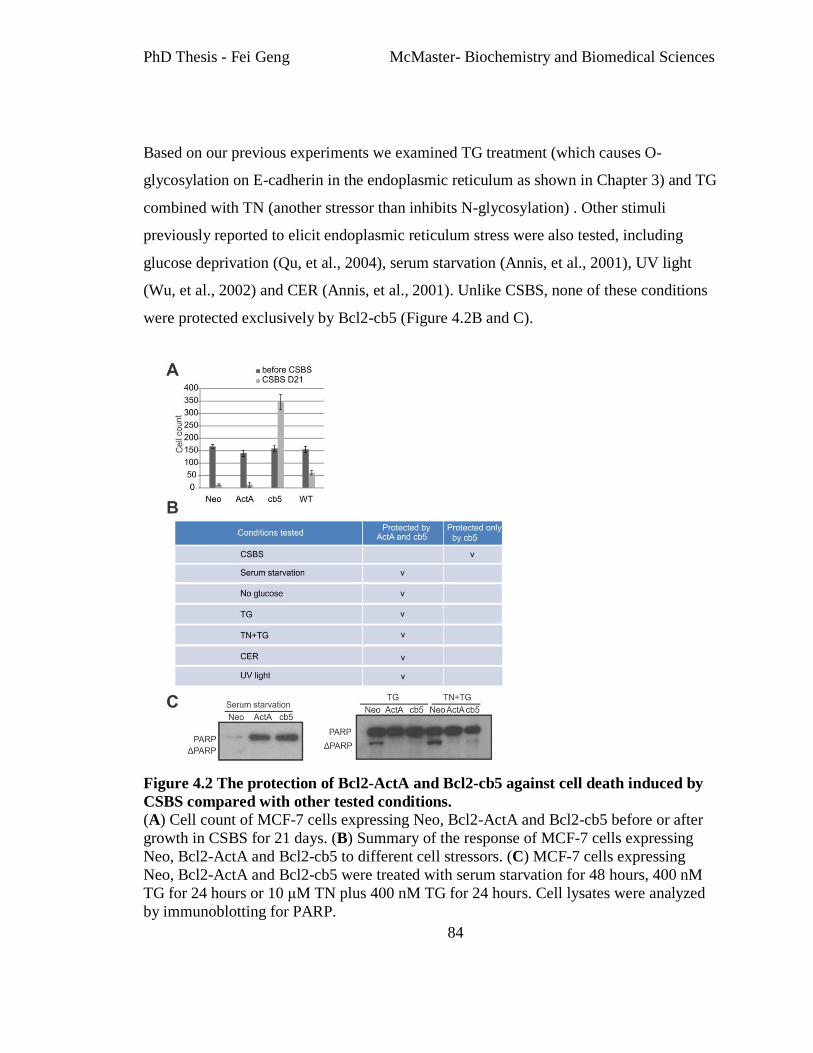
PhD Thesis - Fei Geng McMaster- Biochemistry and Biomedical Sciences
84
Based on our previous experiments we examined TG treatment (which causes O-
glycosylation on E-cadherin in the endoplasmic reticulum as shown in Chapter 3) and TG
combined with TN (another stressor than inhibits N-glycosylation) . Other stimuli
previously reported to elicit endoplasmic reticulum stress were also tested, including
glucose deprivation (Qu, et al., 2004), serum starvation (Annis, et al., 2001), UV light
(Wu, et al., 2002) and CER (Annis, et al., 2001). Unlike CSBS, none of these conditions
were protected exclusively by Bcl2-cb5 (Figure 4.2B and C).
Figure 4.2 The protection of Bcl2-ActA and Bcl2-cb5 against cell death induced by
CSBS compared with other tested conditions.
(A) Cell count of MCF-7 cells expressing Neo, Bcl2-ActA and Bcl2-cb5 before or after
growth in CSBS for 21 days. (B) Summary of the response of MCF-7 cells expressing
Neo, Bcl2-ActA and Bcl2-cb5 to different cell stressors. (C) MCF-7 cells expressing
Neo, Bcl2-ActA and Bcl2-cb5 were treated with serum starvation for 48 hours, 400 nM
TG for 24 hours or 10 μM TN plus 400 nM TG for 24 hours. Cell lysates were analyzed
by immunoblotting for PARP.

PhD Thesis - Fei Geng McMaster- Biochemistry and Biomedical Sciences
85
Supplementation with 17β-Estradiol but not insulin prevents the CSBS-induced cell
death
The data presented above suggest that charcoal stripping removed components
from the serum required for viability of MCF-7 cells. The death of MCF-7 cells occurring
as a consequence of the charcoal stripping of the serum in the growth medium is blocked
by Bcl2-cb5 but not Bcl2-ActA. Therefore, we conclude that this pathway is an
endoplasmic reticulum-specific cell death pathway. What critical component(s) is
removed by this treatment? Previous reports (Dixit & Chang, 1984; Welshons, Grady,
Engler, & Judy, 1992) indicate that activated charcoal treatment removes two separate
factors that known to be relevant for breast cancer cell proliferation: 17β-estradiol
(Pattarozzi, et al., 2008) and insulin (Chappell, et al., 2001). Therefore, we supplemented
CSBS with 17β-estradiol or insulin and examined whether the cells were rescued from
death.
Interestingly supplementation of 17β-estradiol decreased the Annexin V positivity
from > 60% to <10% in Neo control cells, with a similar change noted in Bcl2-ActA
expressing cells as well (Figure 4.3A middle panel and B). By contrast, insulin had no
effect (Figure 4.3A right panel and B). This suggests that 17β-estradiol is the missing
component in the CSBS media and that loss of estrogen signaling activates the
endoplasmic reticulum-specific cell death pathway.

PhD Thesis - Fei Geng McMaster- Biochemistry and Biomedical Sciences
86
Figure 4.3 The supplementation of estrogen in CSBS prevents CSBS-induced cell
death. (A) MCF-7 cells expressing Neo, Bcl2-ActA and Bcl2-cb5 were treated with CSBS in the
presence of no additives (−) or supplemented with 10 nM 17β-estradiol or 100 nM insulin
for 10 days and then stained with Annexin V (green) and DRAQ5 (grey). Representative
images are shown. Bar, 30 μm (B) The percentage of Annexin V-positive cells in Figure
4.3A quantified by image segmentation and classification as described in Chapter 2. The
total cell counts are shown below the corresponding columns.

PhD Thesis - Fei Geng McMaster- Biochemistry and Biomedical Sciences
87
Characterization of CSBS-induced cell death parameters in MCF-7 cells
As this form of cell death differs from any previously reported mode of cell death
we needed to determine how many components it shares with other well-recognized types
of cell death. The expression of either Bax or Bak is required for almost all types of
apoptotic cell death (Wei, et al., 2001; Zong, Lindsten, Ross, MacGregor, & Thompson,
2001). Conveniently there are monoclonal antibodies available that recognize specific
epitopes in either Bax or Bak that are only detectable after the proteins have been
activated (Griffiths, et al., 1999; Lalier, et al., 2007). Thus, these were logical candidates
to investigate. Furthermore cytochrome c is released from the intermembrane space of
mitochondria at the early stage of some forms of cell death which are inhibited only by
Bcl-2 localized at the mitochondria (Q. Chen, Gong, & Almasan, 2000) and the
cytochrome c release occurs at the end stage of some forms of cell death which are
inhibited by both Bcl2-ActA and Bcl2-cb5 (Annis, et al., 2001; Jimbo, et al., 2003;
Kroemer, Dallaporta, & Resche-Rigon, 1998; Tsujimoto & Shimizu, 2007). Therefore we
analyzed the activation of either Bax or Bak and cytochrome c release in all the cell lines
by immunofluorescence using the antibodies 6A7 for activated Bax (red channel of
Figure 4.4A), the AM03 antibody for activated Bak (red channel of Figure 4.4B) and
cytochrome c (green channel in Figure 4.4 A and B). The quantification of the experiment
is shown in Figure 4.5B (Left panel: activated Bax/Cytochrome c release; Right panel:
activated Bak/Cytochrome c release). This analysis indicated that while growth in CSBS
kills both Neo control and Bcl2-ActA cells, different mediators are active. This is evident
as the cytochrome c release as an end point of mitochondrial dysfunction is roughly
comparable (~50% of Neo control cells and ~60% in Bcl2-ActA), activated Bax and/or
Bak mediates this effect in the Neo control cells (50% 6A7 positive and 60% are AM03
positive) whereas these markers are essentially negative (<10% for either 6A7 or AM03)
in Bcl2-ActA cells (Figure 4.5B). These data suggest that under normal circumstances
activation of mitochondrial Bax and/or Bak contributes to cell death in MCF-7 cells
grown in CSBS, but that this step is inhibited by Bcl2-ActA (Figure 4.5B). Nevertheless
PhD Thesis - Fei Geng McMaster- Biochemistry and Biomedical Sciences
88
Bcl2-ActA cells still die, and this cell death is accompanied by significant levels of
cytochrome c release (Figure 4.5B). Whether this is due to the activation of a small
amount of Bax and/or Bak that is too little to be detected in our assay or is due to the cell
death that is Bax/Bak independent cannot be concluded from these studies. However, it is
clear that the “default” form of cell death that is elicited by CSBS likely involves the
canonical form of mitochondrial apoptosis when this is not inhibited. Here the death of
Bcl2-ActA expressing cells in which this default process was inhibited by Bcl2-ActA
uncovered an independent and equally potent parallel pathway (Figure 4.5B). This is
highlighted by further differences: in response to growth in CSBS, Neo control cells
become detached from the dish much more quickly and completely than Bcl2-ActA cells.
Thus many Neo cells are removed during the washing steps of immunostaining. As a
consequence, the quantitative determination of 6A7/Bak/cytochrome c release is an
underestimate for Neo control cells. This might explain the difference in the number of
dead cells in the Annexin V assay (Figure 4.1F) compared to cytochrome c staining as
washing steps are required for cytochrome c staining but not for the Annexin V assay
(Figure 4.5B).
It may appear paradoxical that cytochome c release is prevented by Bcl-2 targeted
to the endoplasmic reticulum but not the mitochondria. However, our laboratory has
previously reported that in Rat-1 fibroblasts some cell death signals are inhibited by Bcl2-
cb5 that trigger loss of the mitochondrial membrane potential (Δψm) thereby causing the
mitochondrial permeability transition (Kroemer, 1999; Kroemer, et al., 1998). Thereafter
the mitochondrial outer membrane will allow release of cytochome c, but not through the
canonical Bax/Bak mediated pore (Annis et al, 2001). To determine whether cell death
induced by CSBS also disrupts membrane potential across the mitochondrial inner
membrane, cells were stained with potentiometric fluorescence probe
tetramethylrhodamine ethyl ester (TMRE) after growth in CSBS for 10 days (Figure
4.4C). This dye provides a convenient measurement of stained with potentiometric
fluorescence changes in Δψm in vitro after isolation or in living cells. Indeed, the results

PhD Thesis - Fei Geng McMaster- Biochemistry and Biomedical Sciences
89
indicate that mitochondrial membrane potential is lost in cells expressing Neo and Bcl2-
ActA but not in Bcl2-cb5 cells (Figure 4.4C). Thus by three separate assays of cell death,
the cytotoxic effects of CSBS were blocked by Bcl2-cb5 but not Bcl2-ActA.
Figure 4.4 Bax/Bak activation and mitochondrial membrane potential changes
during CSBS-induced cell death in MCF-7 cells. Legend see next page.
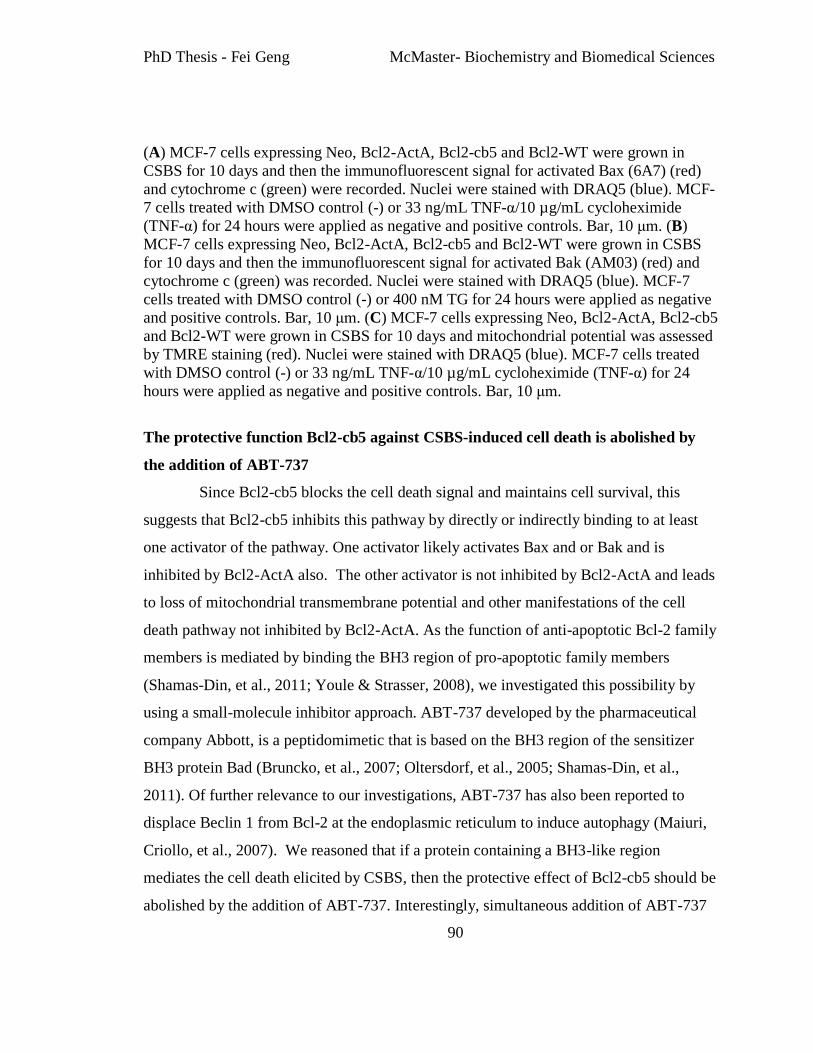
PhD Thesis - Fei Geng McMaster- Biochemistry and Biomedical Sciences
90
(A) MCF-7 cells expressing Neo, Bcl2-ActA, Bcl2-cb5 and Bcl2-WT were grown in
CSBS for 10 days and then the immunofluorescent signal for activated Bax (6A7) (red)
and cytochrome c (green) were recorded. Nuclei were stained with DRAQ5 (blue). MCF-
7 cells treated with DMSO control (-) or 33 ng/mL TNF-α/10 µg/mL cycloheximide
(TNF-α) for 24 hours were applied as negative and positive controls. Bar, 10 μm. (B)
MCF-7 cells expressing Neo, Bcl2-ActA, Bcl2-cb5 and Bcl2-WT were grown in CSBS
for 10 days and then the immunofluorescent signal for activated Bak (AM03) (red) and
cytochrome c (green) was recorded. Nuclei were stained with DRAQ5 (blue). MCF-7
cells treated with DMSO control (-) or 400 nM TG for 24 hours were applied as negative
and positive controls. Bar, 10 μm. (C) MCF-7 cells expressing Neo, Bcl2-ActA, Bcl2-cb5
and Bcl2-WT were grown in CSBS for 10 days and mitochondrial potential was assessed
by TMRE staining (red). Nuclei were stained with DRAQ5 (blue). MCF-7 cells treated
with DMSO control (-) or 33 ng/mL TNF-α/10 µg/mL cycloheximide (TNF-α) for 24
hours were applied as negative and positive controls. Bar, 10 μm.
The protective function Bcl2-cb5 against CSBS-induced cell death is abolished by
the addition of ABT-737
Since Bcl2-cb5 blocks the cell death signal and maintains cell survival, this
suggests that Bcl2-cb5 inhibits this pathway by directly or indirectly binding to at least
one activator of the pathway. One activator likely activates Bax and or Bak and is
inhibited by Bcl2-ActA also. The other activator is not inhibited by Bcl2-ActA and leads
to loss of mitochondrial transmembrane potential and other manifestations of the cell
death pathway not inhibited by Bcl2-ActA. As the function of anti-apoptotic Bcl-2 family
members is mediated by binding the BH3 region of pro-apoptotic family members
(Shamas-Din, et al., 2011; Youle & Strasser, 2008), we investigated this possibility by
using a small-molecule inhibitor approach. ABT-737 developed by the pharmaceutical
company Abbott, is a peptidomimetic that is based on the BH3 region of the sensitizer
BH3 protein Bad (Bruncko, et al., 2007; Oltersdorf, et al., 2005; Shamas-Din, et al.,
2011). Of further relevance to our investigations, ABT-737 has also been reported to
displace Beclin 1 from Bcl-2 at the endoplasmic reticulum to induce autophagy (Maiuri,
Criollo, et al., 2007). We reasoned that if a protein containing a BH3-like region
mediates the cell death elicited by CSBS, then the protective effect of Bcl2-cb5 should be
abolished by the addition of ABT-737. Interestingly, simultaneous addition of ABT-737
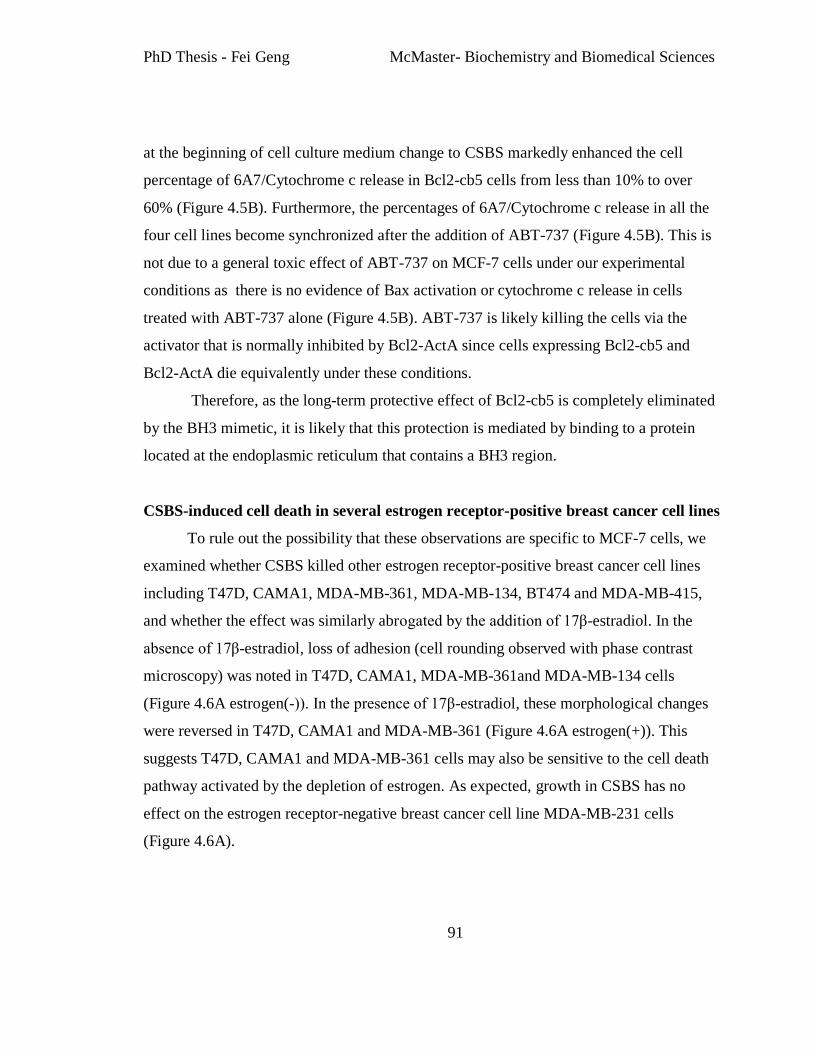
PhD Thesis - Fei Geng McMaster- Biochemistry and Biomedical Sciences
91
at the beginning of cell culture medium change to CSBS markedly enhanced the cell
percentage of 6A7/Cytochrome c release in Bcl2-cb5 cells from less than 10% to over
60% (Figure 4.5B). Furthermore, the percentages of 6A7/Cytochrome c release in all the
four cell lines become synchronized after the addition of ABT-737 (Figure 4.5B). This is
not due to a general toxic effect of ABT-737 on MCF-7 cells under our experimental
conditions as there is no evidence of Bax activation or cytochrome c release in cells
treated with ABT-737 alone (Figure 4.5B). ABT-737 is likely killing the cells via the
activator that is normally inhibited by Bcl2-ActA since cells expressing Bcl2-cb5 and
Bcl2-ActA die equivalently under these conditions.
Therefore, as the long-term protective effect of Bcl2-cb5 is completely eliminated
by the BH3 mimetic, it is likely that this protection is mediated by binding to a protein
located at the endoplasmic reticulum that contains a BH3 region.
CSBS-induced cell death in several estrogen receptor-positive breast cancer cell lines
To rule out the possibility that these observations are specific to MCF-7 cells, we
examined whether CSBS killed other estrogen receptor-positive breast cancer cell lines
including T47D, CAMA1, MDA-MB-361, MDA-MB-134, BT474 and MDA-MB-415,
and whether the effect was similarly abrogated by the addition of 17β-estradiol. In the
absence of 17β-estradiol, loss of adhesion (cell rounding observed with phase contrast
microscopy) was noted in T47D, CAMA1, MDA-MB-361and MDA-MB-134 cells
(Figure 4.6A estrogen(-)). In the presence of 17β-estradiol, these morphological changes
were reversed in T47D, CAMA1 and MDA-MB-361 (Figure 4.6A estrogen(+)). This
suggests T47D, CAMA1 and MDA-MB-361 cells may also be sensitive to the cell death
pathway activated by the depletion of estrogen. As expected, growth in CSBS has no
effect on the estrogen receptor-negative breast cancer cell line MDA-MB-231 cells
(Figure 4.6A).

PhD Thesis - Fei Geng McMaster- Biochemistry and Biomedical Sciences
92
Figure 4.5 Bcl2-cb5 protects against CSBS-induced cell death and the addition of
ABT-737 abolishes the protective effect of Bcl2-cb5 and Bcl2-ActA. Legend see next
page.

PhD Thesis - Fei Geng McMaster- Biochemistry and Biomedical Sciences
93
(A) MCF-7 cells expressing Neo, Bcl2-ActA, Bcl2-cb5 and Bcl2-WT were grown in
CSBS for 10 days in the presence or absence of 5 µM ABT-737 then the
immunofluorescent signal for activated Bax (6A7) (red) and cytochrome c (green) was
recorded. Nuclei were stained with DRAQ5 (blue). Representative images are shown. Bar,
10 μm. (B) Quantitative determination of the percentage of activated Bax
(6A7)/cytochrome c release positive cells in Figure 4.5A by image segmentation and
classification are described in Chapter 2. Cytochrome c intensity was quantified for each
object and classified by automated analysis as having decreased intensity of cytochrome c
staining. The total cell counts are shown below the corresponding columns. (C)
Quantification of activated Bak (AM03)/cytochrome c release positive cells in Figure
4.4B by image segmentation and classification. The total cell counts are shown below the
corresponding columns.
To determine if this novel endoplasmic-reticulum dependent cell death pathway is
a general feature of estrogen receptor-positive breast cancer cell lines T47D cells were
stably transfected with plasmid encoding either Bcl2-cb5, Bcl2-ActA or Neo control and
the mitochondrial membrane potential was measured with TMRE after growth in CSBS
(Figure 4.6B). Similar to what we observed with MCF-7 cells (Figure 4.4C), in T47D
cells loss of mitochondrial membrane potential was noted in 40% of Neo control cells,
50% of Bcl2-ActA cells but < 10% of Bcl2-cb5 cells (Figure 4.6B) confirming the
presence of this pathway.

PhD Thesis - Fei Geng McMaster- Biochemistry and Biomedical Sciences
94
Figure 4.6 CSBS-induced cell death in estrogen-receptor positive breast cancer cell
lines. Legend see next page

PhD Thesis - Fei Geng McMaster- Biochemistry and Biomedical Sciences
95
(A) Phase contrast images of breast cancer cell lines (MCF-7, MDA-MB-415, CAMA1,
BT474, T47D, MDA-MB-134, MDA-MB-361 and MDA-MB-231) grown in CSBS in the
presence or absence of 17β-estradiol. (B) TMRE staining of T47D cells expressing Neo,
Bcl2-ActA and Bcl2-cb5 after the grown in CSBS and image analysis. T47D cells
expressing Neo, Bcl2-ActA, Bcl2-cb5 and Bcl2-WT were grown in CSBS for 10 days
and mitochondrial potential was assessed by TMRE staining (red). Nuclei were stained
with DRAQ5 (blue) (left panel). T47D cells treated with DMSO control (−) or 33 ng/mL
TNF-α/10 µg/mL cycloheximide (TNF-α) for 24 hours were applied as negative and
positive controls. Bar, 10 μm. The intensity of TMRE staining was quantified for each
object and classified by automated analysis as having decreased intensity of TMRE
staining. The procedures of image analysis were performed in accordance with the
procedures in Chapter 2 for cytochrome c release. Total cell counts are shown below the
corresponding columns (right panel).
The unfolded protein response, autophagy or Bap31 cleavage does not mediate
CSBS-induced cell death
Because of the endoplasmic reticulum location of this pathway, we sought to
determine if other known cellular stress pathways that act through this organelle are
involved as potential effectors or modulators. Therefore, to determine whether CSBS
triggered the UPR (Breckenridge, Germain, Mathai, Nguyen, & Shore, 2003), autophagy
(Kroemer, et al., 2010) or Bap31 cleavage (Breckenridge, Stojanovic, Marcellus, & Shore,
2003) we examined GRP78/94 expression, XBP-1splicing and CHOP expression, light
chain 3 (LC3) expression and turnover, and Bap31 expression respectively.
In response to growth in CSBS, the expression of endoplasmic reticulum
chaperone GRP78 and GRP94 are significantly elevated in MCF-7 cells expressing Bcl2-
ActA, Bcl2-cb5 and Bcl2-WT as shown by KDEL blot (Figure 4.7A, top panel, lane 3-5).
In comparison, the expression of GRP78/GRP94 is markedly less in Neo control MCF-7
cells after growth in CSBS (Figure 4.7A, top panel, lane 2).
BFA blocks protein transport from the endoplasmic reticulum and elicits UPR
(Brostrom, et al., 1995), thus it was used as a positive control for XBP-1 splicing and
CHOP expression, the two of effector arms of the UPR. Compared to BFA treated cells,
growth in CSBS for all the cell lines (expressing Neo, Bcl2-ActA, Bcl2-cb5 or Bcl2-WT)

PhD Thesis - Fei Geng McMaster- Biochemistry and Biomedical Sciences
96
did not activate XBP-1 splicing (Figure 4.7B). This indicates that the IRE-1-XBP-1
pathway is not active in CSBS-induced cell death. However, CHOP mRNA levels are
dramatically elevated in cells expressing Bcl2-ActA, Bcl2-cb5 and Bcl2-WT, but not in
the Neo control cells (Figure 4.7C, left panel), consistent with changes in the endoplasmic
reticulum chaperones that are transcriptional targets of CHOP (Figure 4.7A, top
panel).Taken together these data indicate that activation of the UPR does not mediate the
novel death pathway (it is absent in susceptible Neo cells), nor is it protective (absent in
susceptible Bc2-ActA cells).
As another type of cell death involving the endoplasmic reticulum distinct from
the UPR, autophagy is elicited by deprivation of growth factors in Bax- and Bak-deficient
cells (Lum, et al., 2005). As an antagonist of estrogen receptor, TAM is known as
autophagy inducer in MCF-7 cells (de Medina, Silvente-Poirot, & Poirot, 2009).
Interestingly we observed vacuolation, a sign of autophagy in the cells grown in CSBS
(data not shown). Thus, it is plausible that estrogen depletion is part of CSBS-activated
autophagy. During autophagy cleavage of LC3 at the carboxyl-terminus immediately
following synthesis yields the cytosolic LC3-I form which is converted to LC3-II through
lipidation thus facilitating LC3 binding to autophagic vesicles (Klionsky & Emr, 2000).
Hence the conversion of the LC3-1 to LC3-II that occurs during autophagy can be used
as a biochemical assay to measure the induction of autophagy (Kabeya, et al., 2004) and
autophagic flux can be measured by inhibiting LC3-II turnover using the protease
inhibitors (leupeptin and E64D) (Klionsky, et al., 2008).
In the absence of leupeptin and E64D (thereby allowing lysosomal degradation),
CSBS only causes subtle changes of LC3-II in Neo, Bcl2-ActA and Bcl2-cb5 expressing
cells compared to the marked effect noted with TAM (Figure 4.7D, top panel, compare
lanes 4-6 with lane 2). This was confirmed in the presence of leupeptin and E64D by
monitoring LC3 turnover by western blotting (Figure 4.7D). The results demonstrate that
LC3-II increases in the presence of protease inhibitor in Bcl2-ActA, Bcl2-cb5 and Bcl2-
WT expressing cells, but not in Neo control cells (Figure 4.7D, top panel, compare lane

PhD Thesis - Fei Geng McMaster- Biochemistry and Biomedical Sciences
97
8-10 with lane 7). While some variation is found, this suggests a modest activation of
autophagy in cells grown in CSBS.
The data suggest that both autophagy and UPR occur in cells expressing Bcl2-
ActA, Bcl2-cb5 and Bcl2-WT but not in Neo control cells. Whether the decreased
activation of these survival pathways contributed to the cell death elicited by CSBS in
Neo cells (Figure 4.1) is not clear. But the fact that modest activation of both UPR and
autophagy exist in both the surviving Bcl2-cb5 expressing cells, as well as the moribund
Bcl2-ActA cells, indicates that neither of these processes is critically involved in
mediating or inhibiting this novel cell death pathway but are likely reflections of a general
stress response.
Another reported mediator of cell death that is located at the endoplasmic
reticulum is Bap31 (Breckenridge, Stojanovic, et al., 2003; Wakana, et al., 2008). Bap31
is an endoplasmic reticulum transmembrane molecule (Annaert, Becker, Kistner, Reth, &
Jahn, 1997; Wakana, et al., 2008), which contains a pseudo-death effector domain serving
as a docking and activation platform for procaspase-8 (Ng, et al., 1997). After binding
and activation of caspase-8, caspase-8 cleaves off a 20-kDa fragment of Bap31
(Breckenridge, Nguyen, Kuppig, Reth, & Shore, 2002; Ng, et al., 1997). Interestingly,
Bcl-2 binds to Bap31 and prevents the activation of procaspase-8, the generation of the
p20 fragment, and ultimately the transmission of the death signal to the mitochondria. To
investigate the cell signaling involved in the CSBS-induced cell death pathway, we
examined Bap31 cleavage (Figure 4.7E). Unfortunately, even though a distinct band was
obtained by immunoblotting with the antibody used in previous publications, no cleavage
was noted with any treatment (including CSBS) in any of the cell lines (Neo, Bcl2-ActA,
Bcl2-cb5 and Bcl2-WT (Figure 4.7E, lane 3-6). Specifically, treatment with the extrinsic
apoptosis inducers TNF-α and TRAIL, the intrinsic apoptosis inducer staurosporine (STS)
and the UPR inducer BFA at doses and time point that cause significant cell death still did
not elicit Bap31 cleavage (even with the long exposure of the blot Figure 4.7F, top panel
and middle panel). Notably, TNF-α treatment has previously been used as a positive

PhD Thesis - Fei Geng McMaster- Biochemistry and Biomedical Sciences
98
control, as is recommended by the manufacturer. This discrepancy between our clear
results and the published literature on Bap31 cleavage (B. Wang, et al., 2003) remains
unexplained, and does not permit us to unambiguously conclude if it is a relevant player
in our novel pathway.
Figure 4.7 The unfolded protein response, autophagy or Bap31 cleavage does not
mediate CSBS-induced cell death. Legend see next page.

PhD Thesis - Fei Geng McMaster- Biochemistry and Biomedical Sciences
99
(A) MCF-7 cells expressing Neo, Bcl2-ActA, Bcl2-cb5 and Bcl2-WT were grown in
CSBS for 10 days and cell lysates analyzed by immunobloting for KDEL. Lysates from
untreated parental MCF-7 cell are indicated by (−). (B) MCF-7 cells expressing Neo,
Bcl2-ActA, Bcl2-cb5 and Bcl2-WT were grown in CSBS for 10 days and XBP-1 splicing
assay performed by RT-PCR. BFA was used as a positive control for UPR. (C) MCF-7
cells expressing Neo, Bcl2-ActA, Bcl2-cb5 and Bcl2-WT were grown in CSBS for 10
days and the mRNA levels of CHOP monitored by real-time PCR. Rpl, a ribosomal
protein not regulated by endoplasmic reticulum stress, was used as a negative control.
And BFA was used as a positive control for UPR. (D) MCF-7 cells expressing Neo, Bcl2-
ActA, Bcl2-cb5 and Bcl2-WT were grown in CSBS in the presence or absence of
leupeptin and E64D for 10 days and the turnover of LC3 assessed by immunoblot. TAM
is used as positive control for autophagy. An actin immunoblotblot as control for equal
protein loading in each lane is shown. (E) MCF-7 cells expressing Neo were treated with
DMSO control (−) or 33 ng/mL TNF-α/10 µg/mL cycloheximide for 24 hours. MCF-7
cells expressing Neo, Bcl2-ActA, Bcl2-cb5 and Bcl2-WT were grown in CSBS for 10
days and cell lysates were e analyzed by immunoblotting for Bap31. (F) MCF-7 cells
expressing Neo were treated with DMSO control (−), 10 ng/mL TNF-α, TRAIL, 1 µM
STS and 10 µg/mL BFA for 24 hours. Then the cell lysates were analyzed by
immunoblotting for Bap31 and actin.
4.4 Discussion
Estrogen signaling is a complex and important pathway that controls a variety of
functions including cell proliferation, apoptosis and invasion in breast cancer cells
through estrogen receptor (Pearce & Jordan, 2004; Smith & O'Malley, 2004). The classic
function of estrogen receptor is its role as a transactivator of genes involved in normal
cellular function and tumor growth. As a result, the binding of estrogen to its receptor
dynamically modulates the expression of hundreds of genes, some by upregulation and
others by downregulation (Schiff, et al., 2004).
In the absence of estrogen, estrogen receptor is found predominantly in the
nucleus, as part of a multiprotein complex consisting of a dimer of Hsp90 and a p23
monomer. Hsp90 is an ADP/ATP binding protein, which contains a nucleotide-binding
pocket located at the amino terminal side. Once it is in its ATP bound state, Hsp90
recruits co-chaperone p23 which acts as a stabilizer of the complex (Knoblauch &
Garabedian, 1999). Hsp90-based chaperone complex inactivates estrogen receptor’s

PhD Thesis - Fei Geng McMaster- Biochemistry and Biomedical Sciences
100
transcriptional regulatory capabilities and maintains the estrogen receptor in a
conformation competent for steroid binding. Upon binding estrogen, estrogen receptor
dissociates from this complex, dimerizes, and recognizes specific DNA sequences,
termed estrogen-response elements, within the promoters of estrogen-responsive genes
(Klinge, 2001). Once bound to an estrogen-response element, estrogen receptor is
believed to modulate transcription of the linked gene through direct or indirect
interactions with general transcriptional factors (Knoblauch & Garabedian, 1999).
Estrogen receptor is not statically bound to DNA at promoter sites of genes
regulating cell proliferation and differentiation, but rather behaves as a very mobile
protein continuously shuttling between cytoplasm and nucleus (Knoblauch & Garabedian,
1999). This allows the receptor to generate both non-genomic and genomic responses.
Estrogen can increase the expression of several ligands (Umayahara, et al., 1994) which
activate the growth factor receptor pathways (A. V. Lee, Cui, & Oesterreich, 2001; Schiff,
et al., 2004). On the other hand, estrogen signaling downregulates the expression of
epidermal growth factor receptor and human epidermal growth factor receptor 2 (HER2)
while increasing the expression of insulin-like growth factor receptor (Massarweh, et al.,
2008). Therefore, charcoal stripped medium which sequesters growth factors and estrogen
withdrawal can affect a number of pathways due to the downregulation of estrogen
signaling.
Our data show that in the estrogen receptor-positive breast cancer cell line MCF-
7, CSBS-induced cell death is protected by Bcl-2 localized on the endoplasmic reticulum
(Bcl2-cb5) rather than Bcl-2 on the mitochondrial membrane (Bcl2-ActA) (Figure 4.1).
Supplementation with 17β-estradiol prevents CSBS-induced cell death in Neo and Bcl2-
ActA expressing cells (Figure 4.3A), which suggests that loss of estrogen signaling in the
CSBS activates this novel cell death.
The endoplasmic reticulum has been established as an essential site in the
regulation of apoptotic pathways (Szegezdi, et al., 2006). Cell stress stimuli as diverse as
UPR or autophagy activate many of the endoplasmic reticulum-associated signaling

PhD Thesis - Fei Geng McMaster- Biochemistry and Biomedical Sciences
101
pathways including the activation of endoplasmic reticulum-localized BH3-only proteins
and initiator caspases as well as Ca2+
signaling (Heath-Engel, et al., 2008). However, to
date no cell death pathway mediated by the proteins exclusively localized on the
endoplasmic reticulum has been described. Therefore, CSBS-induced cell death is unique
in this respect.
To characterize this novel cell death pathway, we monitored key cellular events
associated with known forms of cell death (Bax/Bak activation, cytochrome c release and
loss of mitochondrial membrane potential). Although cytochrome c release and the loss of
mitochondrial membrane potential occur in both Neo control cells and Bcl2-ActA cells,
significant Bax/Bak activation is detected in Neo cells but not Bcl2-ActA cells (Figure
4.4 and 4.5). Due to the inhibition of Bax/Bak activation by Bcl-2 on the mitochondria,
Bcl2-ActA cells either die from 6A7/Bak independent cell death or activation of residual
amounts of Bax/Bak (Figure 4.4 and 4.5).
By contrast , Bcl-2 on the endoplasmic reticulum blocks this type of cell death as
Bax/Bak activation, cytochrome c release or the loss of the mitochondrial membrane
potential were not detected (Figure 4.4 and 4.5). However, these cells are not completely
unaffected by growth in CSBS, as there is evidence of upregulated endoplasmic reticulum
chaperones (UPR) and elevated LC3 levels (autophagy) (Figure 4.7). Finally, even after
21 days of growth in CSBS, cells expressing Bcl2-cb5 still maintain cell adhesion when
the major population of three other cell lines shows almost complete loss of attachment
(Figure 4.2A). Thus, CSBS induces a form of cell death that is effectively inhibited by
Bcl-2 located at the endoplasmic reticulum and that is augmented by, but does not require
activation of Bax or Bak and is at best poorly inhibited by Bcl-2 at mitochondria.
Although the cell death signal that Bcl2-cb5 blocks remains unclear, it leads to
formation of mitochondrial permeability transition pores. The obvious candidate is Ca2+
but the TG data make this possibility unlikely as this type of cell death is blocked by
Bcl2-ActA, whereas CSBS-induced cell death is not (Figure 4.1, Figure 4.2C). Therefore,
to further dissect this novel cell death pathway we investigated the possible BH3

PhD Thesis - Fei Geng McMaster- Biochemistry and Biomedical Sciences
102
activators by targeting Bcl2-cb5 with peptidomimetic ABT-737. The intriguing
observation that ABT-737 cotreatment with CSBS abolishes the protective effect of Bcl2-
cb5 (Figure 4.5) suggests that Bcl2-cb5 might interact and suppress the activation of a
BH3-only protein(s) on the endoplasmic reticulum membrane and thus maintain the cell
death pathway switched off. Thus in the absence of f Bcl-2 on the endoplasmic reticulum
in cells expressing Neo and Bcl2-ActA, growth in CSBS activates this unknown BH3-
only protein(s) and the latter turns on the cell death pathway in these cells.
As mentioned in the introduction (Chapter 1), the known Bcl-2 binding partners at
the endoplasmic reticulum include the BH3-only proteins BIK and Beclin 1. Since NAF-1
is displaced from the interaction with Bcl-2 at the endoplasmic reticulum by BH3-only
protein BIK, the activator that ABT-737 transactivates could be BIK, Beclin 1 or NAF-1.
Further studies including Small interfering RNA (siRNA) knockdown and protein pull-
down assays will be performed to identify this activator(s). Although IP3R and SERCA
mediate cell death via the modulation of endoplasmic reticulum Ca2+
homeostasis and
both of them interact with Bcl-2 at the endoplasmic reticulum, this mechanism is less
likely to be BH3 region dependent.
We examined the activity of other known stress-related pathways at the
endoplasmic reticulum such as UPR, autophagy or Bap31 cleavage. UPR (shown by
endoplasmic reticulum chaperone protein upregulation and increased transcription of
CHOP) is detected in cells expressing Bcl2-ActA, Bcl2-cb5 and Bcl2-WT, but not Neo
cells (Figure 4.7). Interestingly, autophagy (increased LC3-II levels) is also found in cells
expressing Bcl2-ActA, Bcl2-cb5 and Bcl2-WT, but not in Neo cells (Figure 4.7). Whether
this is due to extensive cell death in Neo control cells or this cell line is subject to a
distinct cell death pathway differing from the other Bcl-2 expressing cell lines is a
question which needs to be answered in the future. Since the presence of UPR or
autophagy does not match the cell death observed in Figure 4.1 (Neo and Bcl2-ActA
expressing cells die while Bcl2-cb5 expressing cells stay alive) this suggests that they are
not directly involved. Unfortunately, technical limitations prevent us from definitively
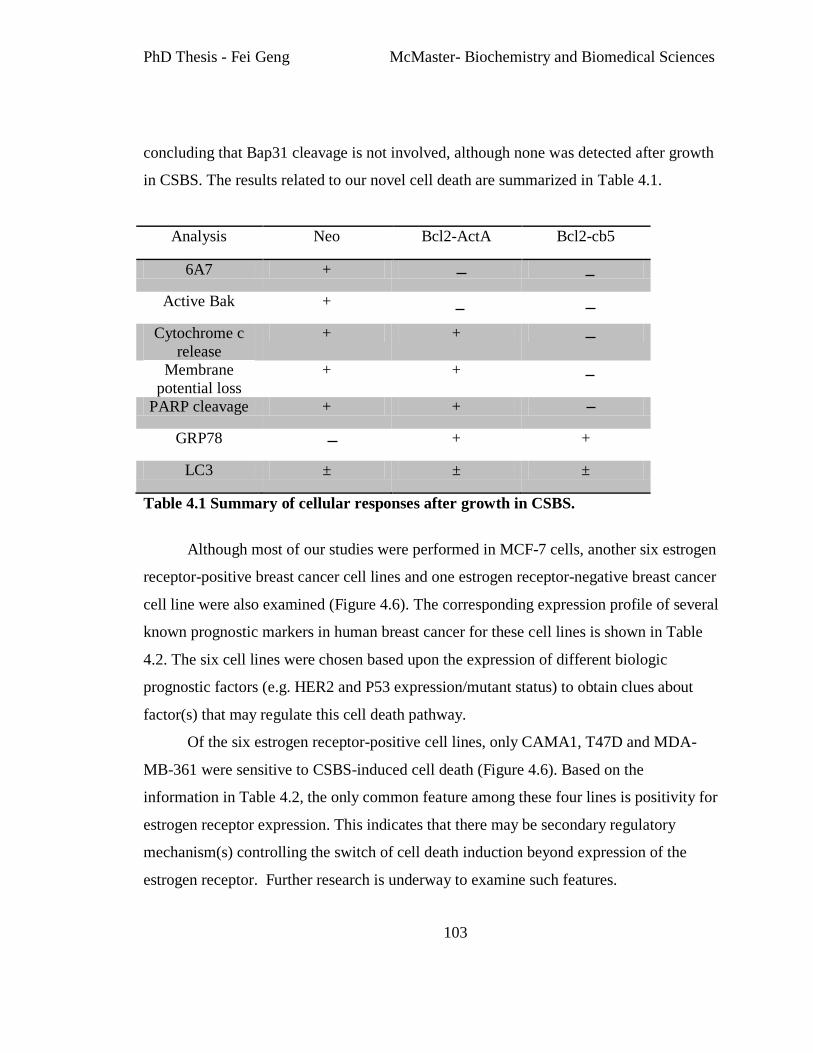
PhD Thesis - Fei Geng McMaster- Biochemistry and Biomedical Sciences
103
concluding that Bap31 cleavage is not involved, although none was detected after growth
in CSBS. The results related to our novel cell death are summarized in Table 4.1.
Analysis Neo Bcl2-ActA Bcl2-cb5
6A7 +
Active Bak +
Cytochrome c
release
+ +
Membrane
potential loss
+ +
PARP cleavage + +
GRP78 + +
LC3 ± ± ±
Table 4.1 Summary of cellular responses after growth in CSBS.
Although most of our studies were performed in MCF-7 cells, another six estrogen
receptor-positive breast cancer cell lines and one estrogen receptor-negative breast cancer
cell line were also examined (Figure 4.6). The corresponding expression profile of several
known prognostic markers in human breast cancer for these cell lines is shown in Table
4.2. The six cell lines were chosen based upon the expression of different biologic
prognostic factors (e.g. HER2 and P53 expression/mutant status) to obtain clues about
factor(s) that may regulate this cell death pathway.
Of the six estrogen receptor-positive cell lines, only CAMA1, T47D and MDA-
MB-361 were sensitive to CSBS-induced cell death (Figure 4.6). Based on the
information in Table 4.2, the only common feature among these four lines is positivity for
estrogen receptor expression. This indicates that there may be secondary regulatory
mechanism(s) controlling the switch of cell death induction beyond expression of the
estrogen receptor. Further research is underway to examine such features.
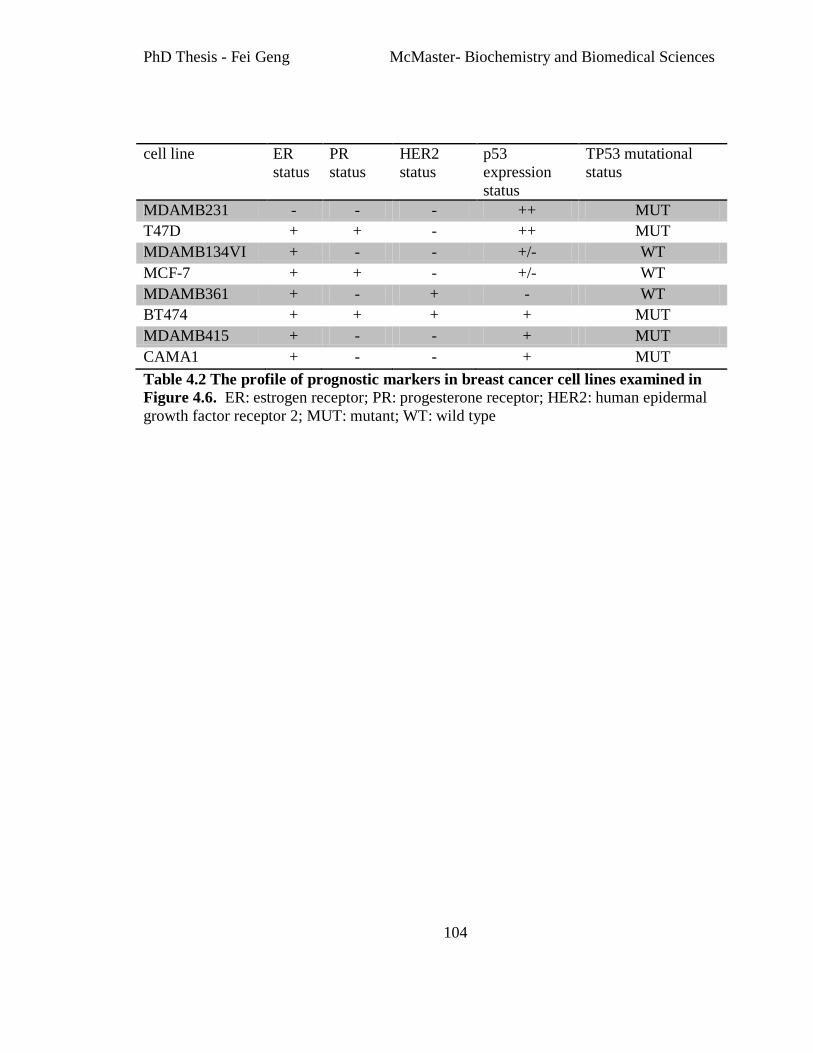
PhD Thesis - Fei Geng McMaster- Biochemistry and Biomedical Sciences
104
cell line ER
status
PR
status
HER2
status
p53
expression
status
TP53 mutational
status
MDAMB231 - - - ++ MUT
T47D + + - ++ MUT
MDAMB134VI + - - +/- WT
MCF-7 + + - +/- WT
MDAMB361 + - + - WT
BT474 + + + + MUT
MDAMB415 + - - + MUT
CAMA1 + - - + MUT
Table 4.2 The profile of prognostic markers in breast cancer cell lines examined in
Figure 4.6. ER: estrogen receptor; PR: progesterone receptor; HER2: human epidermal
growth factor receptor 2; MUT: mutant; WT: wild type

PhD Thesis - Fei Geng McMaster- Biochemistry and Biomedical Sciences
105
Chapter 5 : Measuring cell death responses by automated image analysis

PhD Thesis - Fei Geng McMaster- Biochemistry and Biomedical Sciences
106
5.1 Preface
This chapter is a discussion chapter regarding the use of multiparametric image analysis
to examine apoptosis.
Figure 5.1 presented in this chapter was published in:
Aranovich A, Liu Q, Collins T, Geng F, Dixit S, Leber B, Andrews DW. (2012) Mol.
Cell 45: 754-63
Permission has been granted by the publishers to reproduce the material here.
Figure 5.2, Figure 5.3C and Figure 5.4C are contributed by Tony Collins.

PhD Thesis - Fei Geng McMaster- Biochemistry and Biomedical Sciences
107
5.2 Introduction
Inappropriate cell death has not only been recognized as one of the hallmarks of
cancer (Hanahan & Weinberg, 2000), but also can be responsible for diseases such as
atherosclerosis (Littlewood & Bennett, 2003), Alzheimer’s disease (Cotman & Anderson,
1995; Shimohama, 2000), spinal cord injury (Y. Wang & Qin, 2010) and ischemia (Choi,
1996). Cell death can occur via a range of stresses or signals and result from the
activation of multiple signaling cascades including those characteristic of apoptosis,
endoplasmic reticulum stress and autophagy.
Cells undergoing apoptosis were originally identified based on typical, well-
defined morphological changes, including plasma membrane blebbing, chromatin
condensation, nuclear fragmentation and formation of apoptotic bodies. A common
approach to quantifying apoptosis has been to image cells with a microscope and
manually score cells to determine the fraction of the population undergoing apoptosis.
The subjectivity of this approach combined with the requirement to analyze large
numbers of images can lead to significant drift in these analyses. Apoptosis has also been
characterized by several biochemical parameters including (1) cell surface exposure of PS
on the outer leaflet of the plasma membrane detected by Annexin V staining with the loss
of membrane integrity detected by PI staining; (2) loss of mitochondrial membrane
potential detected by TMRE; (3) release of mitochondrial intermembrane space proteins
such as cytochrome c detected by immunofluorescence, caspase activation detected by a
variety of enzymatic assays including fluorescence lifetime imaging and the cleavage of a
caspase-3/caspase-7 substrate PARP detected by western blot (Galluzzi, et al., 2009).
Ideally apoptosis is quantified and differentiated from other forms of cell death in a
population of cells using both morphological and biochemical markers.
In comparison, endoplasmic reticulum stress, which is caused by disruption of
endoplasmic reticulum homeostasis, leads to the accumulation of unfolded proteins
within the organelle lumen. The endoplasmic reticulum has developed an adaptive
mechanism called the unfolded protein response to counteract compromised protein

PhD Thesis - Fei Geng McMaster- Biochemistry and Biomedical Sciences
108
folding. The UPR attempts to reduce the protein load by decreasing protein synthesis and
increase the folding capacity of the endoplasmic reticulum by up-regulating the
expression of luminal chaperones such as GRP78/GRP94. However, unresolved
endoplasmic reticulum stress results in the activation of apoptosis. Although the unfolded
protein response coordinates the production of endoplasmic reticulum proteins and
membranes (Cox, Chapman, & Walter, 1997; Schuck, Prinz, Thorn, Voss, & Walter,
2009), no well-defined morphological changes are known to mark this response.
Compared with the two types of cellular response above, cells undergoing death
associated with autophagy are characterized by the presence of double membrane
autophagic vacuoles (Klionsky & Emr, 2000). Autophagy is foremost a survival
mechanism that is activated in cells subjected to nutrient or obligate growth factor
deprivation. When cellular stress continues, cell death may continue by autophagy alone,
or else it often becomes associated with features of apoptotic or necrotic cell death.
Morphological and biochemical markers have been determined for autophagy, including
relocalization of LC3 to the autophagosomes and the lipidation of LC3, as detected by
band shift in western blots (Klionsky, et al., 2008).
Although many assays have been developed to quantify specific aspects of these
three cellular responses in the last decades (Galluzzi, et al., 2009), these indicators need to
be integrated to meet the increasing demand for the investigation of the unknowns. The
conventional measurement of various cell death and stress responses is based on
measuring several morphological and biochemical parameters required to identify each
pathway. The difficulty is that even the interpretation of dying cell morphology may be
complex, because in the absence of rescue autophagic cells proceed to a stage called
autophagic cell death, which shares many features of apoptosis (Maiuri, Zalckvar, et al.,
2007). Features considered characteristic of apoptosis can also take place during
endoplasmic reticulum stress induced cell death (Szegezdi, et al., 2006). Often multiple
features are present because the pathways are not mutually exclusive. Finally the reliance

PhD Thesis - Fei Geng McMaster- Biochemistry and Biomedical Sciences
109
on observer judgement for many of these assays makes it difficult to identify
unambiguously the type(s) of cellular responses to any particular agonist.
In Chapter 4 we used a variety of assays including PARP cleavage, KDEL blot
and LC3 blot to probe apoptosis, endoplasmic reticulum stress and autophagy
respectively. To improve this process, Sudeepa Dixit, Tony Collins and I have used
automated image analysis and multiparametric approaches to analyze the feature data to
distinguish cellular responses by statistical analysis. Multiparametric image analysis
algorithms attempt to integrate as much of the information of each cell that can be
extracted. This approach takes a broad variety of measurements (referred to as ‘features’)
from each cell. These are then compared to reference images and each cell classified to
the closest matching reference dataset.
In this chapter I first describe a relatively simple application of this approach that
Sudeepa Dixit and I used to quantitatively determine the proapoptotic activity of
mCherry-BH3 fusion proteins by measuring the expression level of those fusion proteins
and the cytochrome c release in the corresponding cells (Aranovich, et al., 2012). Then
we extended this approach to a more complex problem of deciphering the response of
cells to different small molecules based on multiparametric analysis of images of cells
stained with the lipophillic cationic dye nonyl-acridine-orange (NAO). With the
preference for binding to cardiolipin (CL), NAO has been applied as a probe to visualize
CL enriched membranes such as mitochondria (Mileykovskaya & Dowhan, 2009) an
organelle intimately connected with many forms of cell death. We compared NAO
staining based multiparametric classification with several traditional apoptosis assays and
found that multiparametric classification is both quantitative and of high sensitivity. More
importantly, this approach can measure both apoptosis and endoplasmic reticulum stress,
which suggests its potential application in the quantification of the unknown cell death
pathway induced by estrogen deprivation.
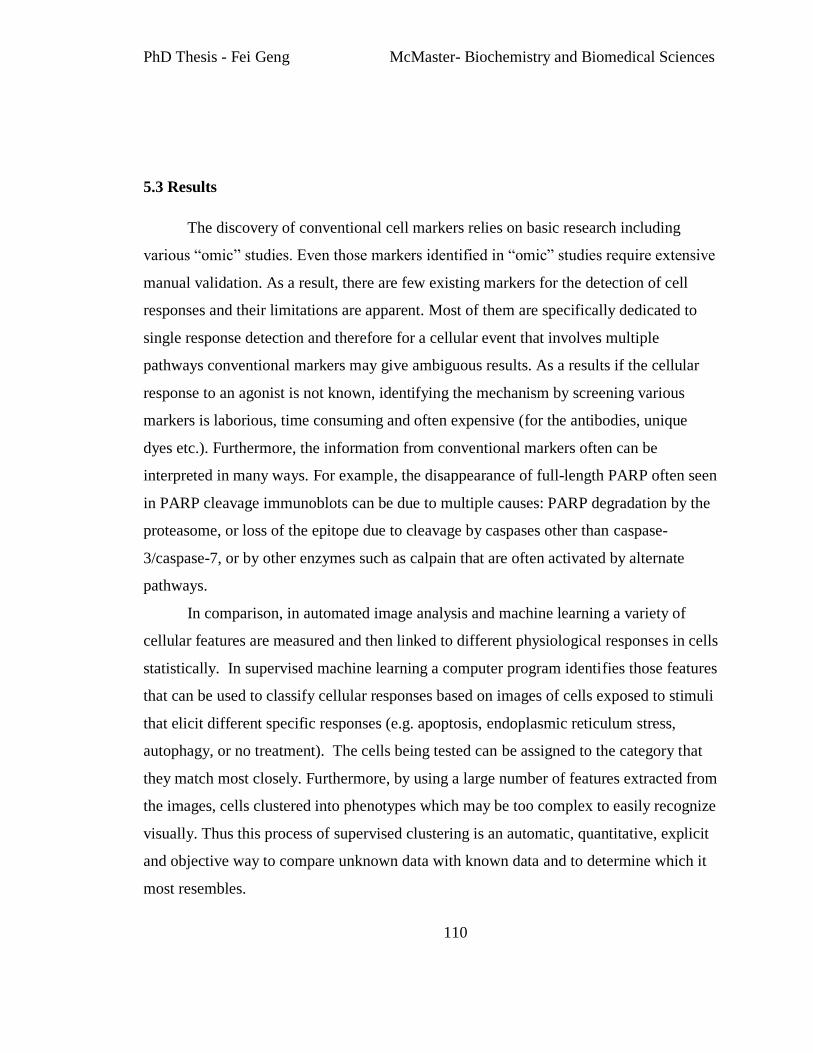
PhD Thesis - Fei Geng McMaster- Biochemistry and Biomedical Sciences
110
5.3 Results
The discovery of conventional cell markers relies on basic research including
various “omic” studies. Even those markers identified in “omic” studies require extensive
manual validation. As a result, there are few existing markers for the detection of cell
responses and their limitations are apparent. Most of them are specifically dedicated to
single response detection and therefore for a cellular event that involves multiple
pathways conventional markers may give ambiguous results. As a results if the cellular
response to an agonist is not known, identifying the mechanism by screening various
markers is laborious, time consuming and often expensive (for the antibodies, unique
dyes etc.). Furthermore, the information from conventional markers often can be
interpreted in many ways. For example, the disappearance of full-length PARP often seen
in PARP cleavage immunoblots can be due to multiple causes: PARP degradation by the
proteasome, or loss of the epitope due to cleavage by caspases other than caspase-
3/caspase-7, or by other enzymes such as calpain that are often activated by alternate
pathways.
In comparison, in automated image analysis and machine learning a variety of
cellular features are measured and then linked to different physiological responses in cells
statistically. In supervised machine learning a computer program identifies those features
that can be used to classify cellular responses based on images of cells exposed to stimuli
that elicit different specific responses (e.g. apoptosis, endoplasmic reticulum stress,
autophagy, or no treatment). The cells being tested can be assigned to the category that
they match most closely. Furthermore, by using a large number of features extracted from
the images, cells clustered into phenotypes which may be too complex to easily recognize
visually. Thus this process of supervised clustering is an automatic, quantitative, explicit
and objective way to compare unknown data with known data and to determine which it
most resembles.

PhD Thesis - Fei Geng McMaster- Biochemistry and Biomedical Sciences
111
An example of multiparametric analysis and classification of images that we used
is the measurement of cell death induced by expression of pro-apoptotic mCherry-BH3
fusion proteins in cells and its prevention by Bcl-XL. I performed the immunostaining
and imaging for cytochrome c and mCherry-BH3 proteins (Figure 5.1A) while Sudeepa
Dixit generated the classification algorithm that I then used to analyze the images (Figure
5.1B). The results published as part of paper that appeared in Aranovich et al. Mol. Cell
2012 are shown in Figure 5.1 (Aranovich, et al., 2012). In this example cells were
classified as either apoptotic or normal based on the parameter of cytochrome c release
from mitochondria. This was scored based on the measured cytoplasm intensity of
immunofluorescence staining for cytochrome c and the standard deviation. In this case, a
low intensity indicated release of cytochrome c. The cytochrome c release percentage was
calculated by the number of objects with released cytochrome c versus the total number
of cells expressing mCherry-BH3 proteins.
An additional criterion that was also useful was the fraction of the cells expressing
detectable BH3 protein. Based on the expression level of mCherry-BH3 fusion protein
identified by measuring the intensity of mCherry, the cells were classified as either BH3
positive or negative. It is noteworthy that the fraction of cells expressing high levels of
the most potent BH3 proteins was low, possibly because this was toxic to the cells.
However, variable transfection efficiency, protein synthesis and folding may also account
for these differences.

PhD Thesis - Fei Geng McMaster- Biochemistry and Biomedical Sciences
112
Figure 5.1 Expression of mCherry-BH3 proteins triggers cytochrome c release that
is inhibited by Bcl-XL. Legend see next page.

PhD Thesis - Fei Geng McMaster- Biochemistry and Biomedical Sciences
113
MCF-7 cells and Bcl-XL expressing MCF-7 cells were seeded on coverslips. The next
day, the cells were transfected with plasmids encoding mCherry (vector), or mCherry
fused to the BH3 protein indicated to the left of the panels. The cells were washed twice
in PBS and stained with antibody against cytochrome c. Nuclei were stained with 5 µM
DRAQ5 for 30 minutes at room temperature (images not shown). (A) Sample images of
MCF-7 cells expressing mCherry-BH3 proteins (red in overlay) immunostained for
cytochrome c (green in overlay). Some cells expressing mCherry-BH3 protein and
showing cytochrome c release are indicated with arrows. tBidG94E is a well
characterized inactive mutant of tBid used as a negative control (Lutter, Perkins, & Wang,
2001). (B) Quantification of cytochrome c release by mCherry-BH3 proteins and
inhibition by Bcl-XL. The inactive tBid mutants tBidG94E and tBid2A (E. F. Lee, et al.,
2008) exhibited negligible cytochrome c releasing activity. However, the 2A mutants of
all three Bim isoforms retained partial Bcl-XL inhibitable pro-apoptotic activity.
The results we obtained show clearly that mCherry-BH3 fusion proteins trigger
cytochrome c release with variable potency, and the expression of Bcl-XL in those cells
inhibits the pro-apoptotic activity.
This relatively simple form of automated image analysis allowed me to apply a
uniform set of objective criteria to the images, greatly facilitating comparison of the
effects of the different BH3 proteins. It also illustrates the power of the approach and
suggested that multiparametric image analysis might be useful to quantify the
endoplasmic reticulum-specific form of cell death in estrogen deprived breast cancer cells
described in Chapter 4. However, since we do not know the distinguishing features of
this type of cell death, we decided to see if machine learning techniques could identify
features of cells stained with relatively non-specific dyes that would distinguish
apoptosis, autophagy and endoplasmic reticulum stress. For these experiments a large
number of cellular features (e.g. texture, intensity and morphology features) were
collected to provide the information for the classification. A useful marker would
distinguish more than one type of cell response. By using drugs at a dose and time point
that induce well characterized physiological responses, the images obtained were used
both to train classifiers and to test the hypothesis that features associated with non-
specific membrane dye can be used to identify different physiological responses in MCF-
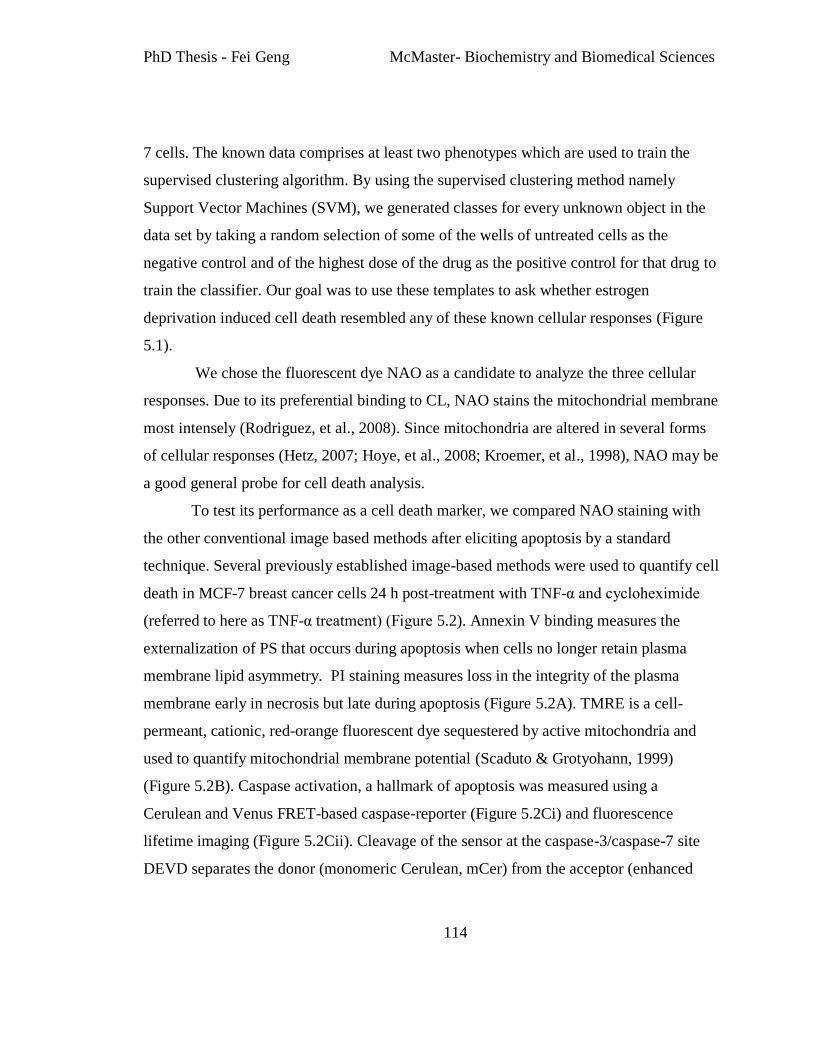
PhD Thesis - Fei Geng McMaster- Biochemistry and Biomedical Sciences
114
7 cells. The known data comprises at least two phenotypes which are used to train the
supervised clustering algorithm. By using the supervised clustering method namely
Support Vector Machines (SVM), we generated classes for every unknown object in the
data set by taking a random selection of some of the wells of untreated cells as the
negative control and of the highest dose of the drug as the positive control for that drug to
train the classifier. Our goal was to use these templates to ask whether estrogen
deprivation induced cell death resembled any of these known cellular responses (Figure
5.1).
We chose the fluorescent dye NAO as a candidate to analyze the three cellular
responses. Due to its preferential binding to CL, NAO stains the mitochondrial membrane
most intensely (Rodriguez, et al., 2008). Since mitochondria are altered in several forms
of cellular responses (Hetz, 2007; Hoye, et al., 2008; Kroemer, et al., 1998), NAO may be
a good general probe for cell death analysis.
To test its performance as a cell death marker, we compared NAO staining with
the other conventional image based methods after eliciting apoptosis by a standard
technique. Several previously established image-based methods were used to quantify cell
death in MCF-7 breast cancer cells 24 h post-treatment with TNF-α and cycloheximide
(referred to here as TNF-α treatment) (Figure 5.2). Annexin V binding measures the
externalization of PS that occurs during apoptosis when cells no longer retain plasma
membrane lipid asymmetry. PI staining measures loss in the integrity of the plasma
membrane early in necrosis but late during apoptosis (Figure 5.2A). TMRE is a cell-
permeant, cationic, red-orange fluorescent dye sequestered by active mitochondria and
used to quantify mitochondrial membrane potential (Scaduto & Grotyohann, 1999)
(Figure 5.2B). Caspase activation, a hallmark of apoptosis was measured using a
Cerulean and Venus FRET-based caspase-reporter (Figure 5.2Ci) and fluorescence
lifetime imaging (Figure 5.2Cii). Cleavage of the sensor at the caspase-3/caspase-7 site
DEVD separates the donor (monomeric Cerulean, mCer) from the acceptor (enhanced

PhD Thesis - Fei Geng McMaster- Biochemistry and Biomedical Sciences
115
YFP, eYFP) abolishing FRET and increasing the fluorescence lifetime of the donor.
Nuclear condensation and cell counts were derived from DRAQ5 stained cells.
DRAQ5 staining images were used to identify the cell nuclei and cytoplasmic
borders in order to quantify the corresponding nuclei and cytoplasmic features for each
cell stained with NAO and DRAQ5. As shown in Figure 5.2D, NAO mainly stains the
mitochondrial membrane, and the difference in staining is apparent between untreated and
TNF-α treated cells. Many features including texture, shape and size of the cytoplasm and
nuclei were recorded, and all were processed by supervised clustering with a support
vector machine (SVM). The Z-factor is a robust measure of the quality of an assay and is
commonly used to assess assays (Zhang, Chung, & Oldenburg, 1999). We quantified Z-
factors and P values for a range of conventional measures of cell death including those
shown in Figure 5.2 A-D as well as our multiparametric classification approaches trained
on untreated cells and the highest dose of TNF-α treated cells as negative and positive
controls, respectively. Among all the assays only the changes in membrane integrity (PI
positivity) was not significant at P<0.01 level. The highest performing conventional assay
was TMRE with a Z-factor of 0.57. Other measures of apoptosis such as cell count,
nuclear condensation (i.e. nuclear area) were poor assays with Z-factor of less than zero
in this assay format. In contrast, NAO-SVM (Z-factor 0.91) outperformed conventional
image based apoptosis assays that focused on single aspects of apoptosis (Figure 5.2E).
Since the Z-factor is reflective of both the assay signal dynamic range and data variation
associated with signal measurements, it is suitable for assay quality assessment (Zhang, et
al., 1999). Thus our result suggests the approach using multiparametric analysis of images
of cells stained with NAO is superior to other image based techniques.
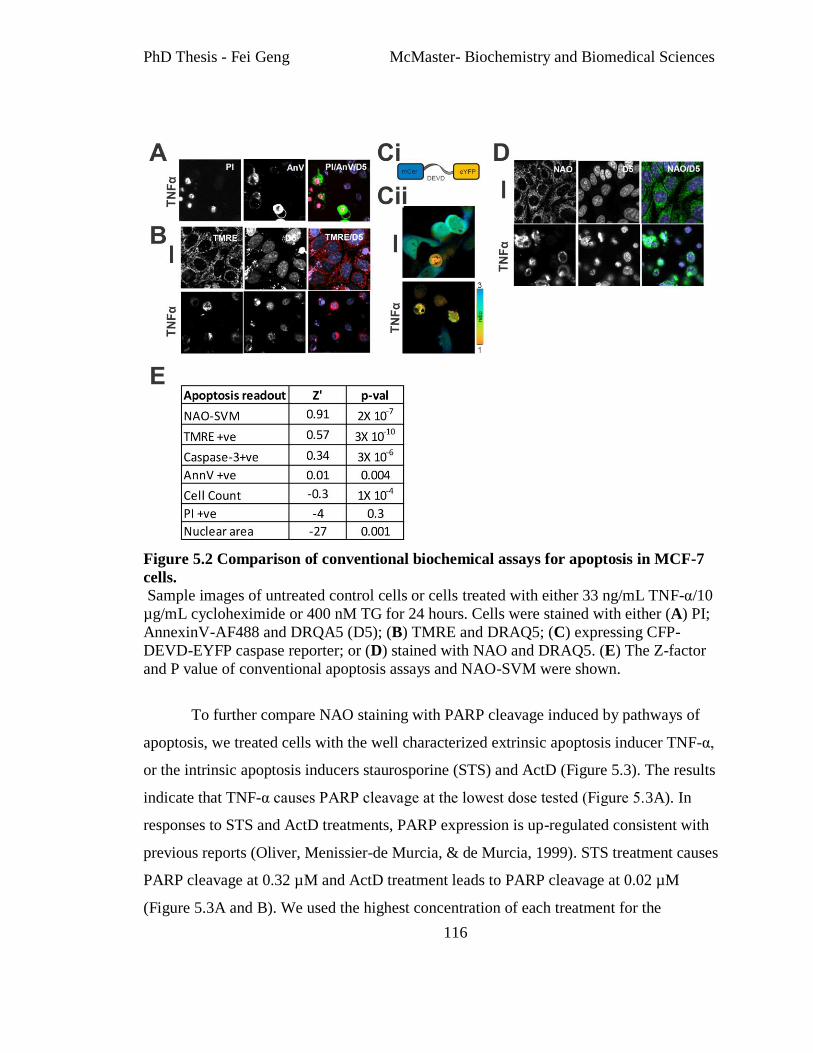
PhD Thesis - Fei Geng McMaster- Biochemistry and Biomedical Sciences
116
Figure 5.2 Comparison of conventional biochemical assays for apoptosis in MCF-7
cells.
Sample images of untreated control cells or cells treated with either 33 ng/mL TNF-α/10
µg/mL cycloheximide or 400 nM TG for 24 hours. Cells were stained with either (A) PI;
AnnexinV-AF488 and DRQA5 (D5); (B) TMRE and DRAQ5; (C) expressing CFP-
DEVD-EYFP caspase reporter; or (D) stained with NAO and DRAQ5. (E) The Z-factor
and P value of conventional apoptosis assays and NAO-SVM were shown.
To further compare NAO staining with PARP cleavage induced by pathways of
apoptosis, we treated cells with the well characterized extrinsic apoptosis inducer TNF-α,
or the intrinsic apoptosis inducers staurosporine (STS) and ActD (Figure 5.3). The results
indicate that TNF-α causes PARP cleavage at the lowest dose tested (Figure 5.3A). In
responses to STS and ActD treatments, PARP expression is up-regulated consistent with
previous reports (Oliver, Menissier-de Murcia, & de Murcia, 1999). STS treatment causes
PARP cleavage at 0.32 µM and ActD treatment leads to PARP cleavage at 0.02 µM
(Figure 5.3A and B). We used the highest concentration of each treatment for the
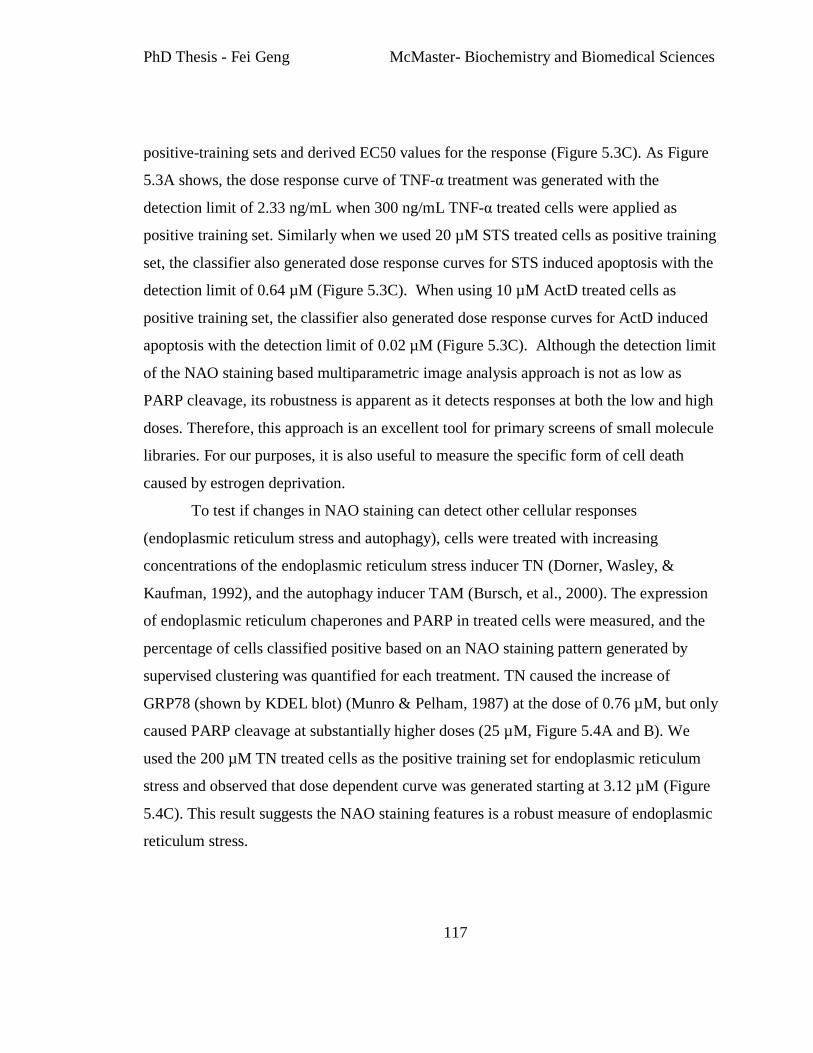
PhD Thesis - Fei Geng McMaster- Biochemistry and Biomedical Sciences
117
positive-training sets and derived EC50 values for the response (Figure 5.3C). As Figure
5.3A shows, the dose response curve of TNF-α treatment was generated with the
detection limit of 2.33 ng/mL when 300 ng/mL TNF-α treated cells were applied as
positive training set. Similarly when we used 20 µM STS treated cells as positive training
set, the classifier also generated dose response curves for STS induced apoptosis with the
detection limit of 0.64 µM (Figure 5.3C). When using 10 µM ActD treated cells as
positive training set, the classifier also generated dose response curves for ActD induced
apoptosis with the detection limit of 0.02 µM (Figure 5.3C). Although the detection limit
of the NAO staining based multiparametric image analysis approach is not as low as
PARP cleavage, its robustness is apparent as it detects responses at both the low and high
doses. Therefore, this approach is an excellent tool for primary screens of small molecule
libraries. For our purposes, it is also useful to measure the specific form of cell death
caused by estrogen deprivation.
To test if changes in NAO staining can detect other cellular responses
(endoplasmic reticulum stress and autophagy), cells were treated with increasing
concentrations of the endoplasmic reticulum stress inducer TN (Dorner, Wasley, &
Kaufman, 1992), and the autophagy inducer TAM (Bursch, et al., 2000). The expression
of endoplasmic reticulum chaperones and PARP in treated cells were measured, and the
percentage of cells classified positive based on an NAO staining pattern generated by
supervised clustering was quantified for each treatment. TN caused the increase of
GRP78 (shown by KDEL blot) (Munro & Pelham, 1987) at the dose of 0.76 µM, but only
caused PARP cleavage at substantially higher doses (25 µM, Figure 5.4A and B). We
used the 200 µM TN treated cells as the positive training set for endoplasmic reticulum
stress and observed that dose dependent curve was generated starting at 3.12 µM (Figure
5.4C). This result suggests the NAO staining features is a robust measure of endoplasmic
reticulum stress.

PhD Thesis - Fei Geng McMaster- Biochemistry and Biomedical Sciences
118
Figure 5.3 Quantification of apoptosis based on multiparametric analysis of cells
stained with NAO.
MCF-7 cells were treated with DMSO control (−), or increasing doses of TNF-α, STS and
ActD. The treated cells were analyzed by immunoblotting against PARP (A). Note: Since
the high doses of all the five treatments caused extensive cell death and protein
degradation, insufficient cells were obtained for lysates (with missing PARP data) for the
following conditions: 150 ng/mL and 300 ng/mL for TNF-α; 10 µM and 20 µM for STS;
5 µM and 10 µM for ActD. (B) Densitometry was performed using Image J for the PARP
blots shown in Panel A. The ratio of cleaved PARP to uncleaved PARP for each
concentration was calculated and plotted. (C) The treated cells were stained with NAO
and then analyzed with multiparametric approach to generate the dose response curve.
Images were acquired at 40x magnification (0.7 NA) and data was extracted from 400
cells per well (on average) and 8 wells per concentration. DMSO controls and the highest
dose of each treatment were used as negative and positive training datasets, respectively.

PhD Thesis - Fei Geng McMaster- Biochemistry and Biomedical Sciences
119
In comparison, the diagnostic 89 kDa fragment of PARP due to caspase-7
cleavage was not detected after TAM treatment, although full-length PARP was clearly
degraded at TAM doses as low as 2.34 µM (Figure 5.4A, right panel). This dose of TAM
causes an increase of LC3 (Figure 5.4A). However, even when we used 75 µM TAM
treated cells as a positive training set for autophagy, no cells were classified as positive
based upon NAO staining below this dose despite the positive results with the diagnostic
LC3 assay .This suggests that a more robust cell content marker with a richer staining
pattern of cellular membranes might be needed for the autophagy detection in the future
studies.
More importantly, a 3-way analysis was performed by training the classifier with
the three training sets including untreated cells, TN treated cells and TNF-α treated cells
(Figure 5.4D). As a result, TN treated cells can be divided into those that have features
that classify them as untreated fraction (no response), or TN treated (endoplasmic
reticulum stress) or TNF-α treated fraction (apoptosis) (Figure 5.4D). Significantly in all
these cells treated identically (with TN) the proportion of cells undergoing endoplasmic
reticulum stress (TN pattern) or apoptosis (TNF-α pattern) is comparable to the
corresponding GRP78 expression and PARP cleavage profile measured after the same TN
treatment (Figure 5.4 A-D left panel).

PhD Thesis - Fei Geng McMaster- Biochemistry and Biomedical Sciences
120
Figure 5.4 Endoplasmic reticulum stress but not autophagy can be quantified based
on multiparametric analysis of cells stained with NAO. Legend see next page.
PhD Thesis - Fei Geng McMaster- Biochemistry and Biomedical Sciences
121
(A) In the left panel, MCF-7 cells were treated with DMSO control (−) and increasing
doses of TN. The treated cells were either analyzed by immunoblotting against PARP
(upper blot) and KDEL (lower blot) or stained with NAO and then analyzed with
multiparametric approach to generate the dose response curve. In the right panel, MCF-7
cells were treated with DMSO control (−) and increasing doses of TAM. The treated cells
were analyzed by immunoblotting against PARP (upper blot) and LC3 (lower blot). Note:
Since the high doses of all the five treatments caused extensive cell death and protein
degradation, insufficient cells were obtained for lysates (with missing PARP data) for the
following conditions: 100 µM and 200 µM for TN; 75 µM, 150 µM, 300 µM and 600 µM
for TAM). (B) Densitometry was performed using Image J for the KDEL and LC3 blots
shown in Panel A. (C) The treated cells were stained with NAO and then analyzed with
multiparametric approach to generate the dose response curve. Images were acquired at
40x magnification (0.7 NA) and data was extracted from 400 cells per well (on average)
and 8 wells per concentration. DMSO controls and the highest dose of each treatment
were used as negative and positive training datasets, respectively. (D) A 3-way analysis
of TN treated cells by training the classifier with DMSO control cells (untreated control),
200 µM TN treated cells (TN treated) and 300 ng/mL TNF-α treated cells (TNF-α treated).
5.4 Discussion
A cell is often considered dead in vitro when it loses plasma-membrane integrity.
However, a cell can be committed to dying long before this point is reached. Initiation of
cell death processes is associated with a wide range of measurable changes within the
cell. Such responses are typically highly context dependent, varying with cell type and
biological environment. Therefore, it is critical to identify the unique characteristics that
can be used to define different types of cellular responses for mechanism studies.
Conventional markers in the past vary from DNA, RNA, protein molecules to
fluorescent reporters which allow end-point detection or real-time detection. The main
drawbacks of the conventional biomarkers are listed as below. First the discovery and
validation of a marker of a specific form of cell death requires the full characterization of
the phenotype from basic research. Such markers are generally not useful to study
unknown phenotypes. For instance, live reporters of caspases and MOMP are only
informative if the cell is dying by apoptosis. Secondly, they are mostly single event-
based. For example, PARP cleavage can only detect apoptosis which activates effector
PhD Thesis - Fei Geng McMaster- Biochemistry and Biomedical Sciences
122
caspase-3 or caspase-7 that result in the cleavage of PARP at a defined site to generate a
fragment that can be conveniently monitored with the PARP antibody. Thus caspase
independent cell death will be non-detectable by PARP cleavage.
The new molecular technologies have allowed us to move from a linear, single
event-based concept of cell death to a greater understanding of the alterations in the entire
cellular context (Spencer & Sorger, 2011).
Because of the variety of fluorescent dyes, dye selection can influence the
sensitivity and accuracy of classification. Why did we choose NAO? First of all, due to its
highly specific interaction with CL it highlights CL-enriched membranes of eukaryotic
cells (Mileykovskaya & Dowhan, 2009). CL is a phospholipid found uniquely in the inner
membrane of mitochondria and at the contact sites between the inner and outer
membranes, representing 13-15% of total mitochondrial phospholipids (Rodriguez, et al.,
2008). Since the mitochondria regulate multiple forms of cell death (Hoye, et al., 2008),
all these properties are reflected in features we extracted from the images of cells stained
with NAO and thus the latter can be direct or indirect measure of cell death. Second, it is
a fairly inexpensive fluorescent dye, allowing future application in high throughput and
high content screening.
The multiparametric image analysis approach based upon the images of cells
stained with NAO was proved to be superior to other image based techniques as shown in
Figure 5.2. It not only can measure extrinsic and intrinsic apoptosis (Figure 5.3C), but
also can measure endoplasmic reticulum stress (Figure 5.4C). More importantly, it could
distinguish and quantitatively distinguish three separate cellular responses within one set
of sample (Figure 5.4D).
Therefore, this approach has potential applications in drug discovery and
mechanistic analysis. By choosing the training sets, this approach is easily applicable to
primary screening during the drug discovery stage. For example, an apoptosis inducer
screening can be set up using TNF-α treated cells as positive training set. Similarly
endoplasmic reticulum stressor screen would use TN treated cells as a positive training

PhD Thesis - Fei Geng McMaster- Biochemistry and Biomedical Sciences
123
set. In the post-discovery stage, this approach might assist in identifying the mechanisms
of interesting hits obtained from the drug screen by using the cellular response
classification.
Furthermore, drug off-target effects can also be detected by this approach. We can
illustrate this by using a screen using kinase inhibitors (drugs) or shRNA targeting
kinases as an example. A kinase inhibitor would affect its target in the treated population
rapidly, but may also have multiple targets. By contrast, the time required for antisense
transcript expression, protein turnover etc. with genetic knockdown, the phenotype would
be more specific but would occur more slowly, thereby providing the cells time to adapt.
By comparing the information extracted from NAO staining images of cells treated with
kinase inhibitor with the cells treated with multiple shRNA/siRNA against the same
kinase, information can be gained concerning the specificity of kinase inhibitor. Taken
together these advantages suggest that this approach has broad application in the field of
drug discovery, such as developing screening platforms, post-screening studies (e.g.
probe the unknown mechanism of interesting hits) and measuring the off-target effect in
combination with library screening.
As shown in Chapter 4, estrogen deprivation induces a novel form of cell death in
breast cancer cells which can be prevented by Bcl-2 localized at the endoplasmic
reticulum instead of Bcl-2 localized at the mitochondria, not caused by endoplasmic
reticulum stress, autophagy or Bap31 cleavage. Since NAO staining based image analysis
approach can analyze, classify and quantitatively determine multiple cellular responses
within the same cellular event, it represents a valuable tool to investigate the unknown
response(s) causing the cell death induced by estrogen deprivation.

PhD Thesis - Fei Geng McMaster- Biochemistry and Biomedical Sciences
124
Chapter 6 : Concluding remarks
PhD Thesis - Fei Geng McMaster- Biochemistry and Biomedical Sciences
125
In multicellular organisms molecules that transduce signals originating from
outside the cell are important determinants of cells fate and behavior. Recent insights
have shown that information can also flow in the opposite direction where intracellular
stresses can modify this apparatus, and in this thesis I have concentrated on the
endoplasmic reticulum as a site where such signaling is mediated, and possibly initiated.
As an potential target of such a pathway, the E-cadherin cell adhesion complex is not only
critical for the formation of cytoskeleton, but also provides survival signals to prevent cell
death (Grossmann, 2002). In response to various stimuli, O-GlcNAc modifications occur
on E-cadherin, β-catenin (Zhu, et al., 2001) and plakoglobin (Hatsell, Medina, Merola,
Haltiwanger, & Cowin, 2003) suggesting that this type of modification regulates the
behavior of the whole complex rather than just one molecule. To begin to analyze this
process the work presented in this thesis focused on characterizing the multiple
modifications of E-cadherin that occur in response to stress. Results obtained led us to
investigate upstream signaling leading to this event, and the involvement of the
endoplasmic reticulum triggered a search for a novel cell death pathway that would be
specific for this organelle.
O-GlcNAc blocks the trafficking of E-cadherin via preventing its binding to PIPKIγ
There are a variety of substrates which are modified by O-GlcNAc and as a
consequence this modification has been used to regulate diverse cellular processes.
(Comer & Hart, 2000), especially noted in stress responses (Hart, et al., 2007),
proteolytic maturation in cell-cycle regulation (Capotosti, et al., 2011) and pluripotency
of embryonic stem cells (Jang, et al., 2012).
We have observed that after the induction of stress response by TG or BFA, newly
synthesized E-cadherin molecules are modified by O-GlcNAc in the endoplasmic
reticulum. As a result, O-GlcNAcylation blocks exit of E-cadherin precursors from the
endoplasmic reticulum and interferes with PIPKIγ binding. Furthermore, we have

PhD Thesis - Fei Geng McMaster- Biochemistry and Biomedical Sciences
126
identified the second modification as loss of pro-region processing that presumably
results from inhibition of proprotein convertases and have shown that this is regulated
independently from O-GlcNAcylation. A deletion mutant of E-cadherin (E-cadΔpSer)
which removes O-GlcNAc modification maintains the interaction with PIPKIγ and
transport of E-cadherin to the plasma membrane during cell stress. Expression of E-
cadΔpSer protects cells from stress induced apoptosis, which suggests that inhibited
trafficking of E-cadherin to plasma membrane as a consequence of the O-GlcNAc
modification promoted cell death.
Growth in CSBS triggered endoplasmic reticulum-specific cell death in breast
cancer cells
Since O-GlcNAcylation on E-cadherin occurs in the endoplasmic reticulum,
whether this is the site of origin of the signal that initiates this response is important.
Endoplasmic reticulum-specific cell death signaling has not (yet) been demonstrated,
whereas endoplasmic reticulum involvement in cell death has been investigated for
decades. This distinction is critical as the former requires the irreversible commitment to
cell death be initiated and mediated by proteins located at the endoplasmic reticulum
while the latter only requires that cell death signaling “goes through” the endoplasmic
reticulum but is executed at other locations. Cellular events such as the UPR (Bernales,
Schuck, & Walter, 2007) and autophagy (Chang, et al., 2010) belong to the latter. In these
cases the downstream cell death signaling of endoplasmic reticulum stress leads to
initiation of the intrinsic apoptosis pathway requiring MOMP (Hetz, 2007). Similarly, the
downstream signaling of autophagic cell death involves the mitochondria as well as the
endoplasmic reticulum (Klionsky & Emr, 2000).
Unlike previously reported pathways (classical apoptosis requiring MOMP, UPR,
autophagy and Bap31 cleavage), cell death induced by growth in CSBS is protected
exclusively by Bcl-2 localized at the endoplasmic reticulum but not at the mitochondria.
It is therefore likely that Bcl-2 at the endoplasmic reticulum interacts with organelle-

PhD Thesis - Fei Geng McMaster- Biochemistry and Biomedical Sciences
127
specific activator(s) to antagonize cell death. And ABT-737 is shown to abolish the
protection by Bcl-2 at the endoplasmic reticulum. This suggests the critical binding
partner(s) is a BH3-only protein(s) sequestered by Bcl2-cb5 cells. Thus in the absence of
Bcl-2 at the endoplasmic reticulum in Neo control cells or Bcl2-ActA cells, this BH3-
only protein is free to activate the endoplasmic reticulum-specific cell death.
All biological networks have similar characteristics. In order to provide important
functions in normal cells under a variety of conditions and stress factors, as well as to
keep the cell alive, these networks must be complex with multiple levels of regulation,
fine tuning capabilities, redundancy, and evolvability (Jordan & O'Malley, 2007).
Collectively these features allow the cell to adapt to cellular stress, toxins, and potentially
hostile environments. Cancer cells exploit these normal functions, which are often altered
genetically during oncogenesis to provide them with a survival advantage and the ability
to escape the effects of treatment. Although the molecular signaling that underlies the
endoplasmic reticulum-specific cell death has yet to be fully elucidated, a detailed
understanding of the activities of Bcl-2 on the endoplasmic reticulum represents an
important lead for the development of future therapeutic interventions for cancers in
which this pathway can be elicited.
The clinical strategy of targeting estrogen receptor-positive breast cancer with a
selective estrogen receptor modulator TAM during the last three decades has saved
hundreds of thousands of lives and been proved to be the cornerstone for breast cancer
treatment (Jordan & O'Malley, 2007; Osborne & Schiff, 2011). However, loss of estrogen
receptor expression in the recurrent breast cancer confers resistance to TAM therapy in
estrogen receptor-positive patients (Kuukasjarvi, Kononen, Helin, Holli, & Isola, 1996;
Naughton, et al., 2007). Therefore, understanding the downstream signaling of estrogen
deprivation induced cell death pathway in this thesis may provide important clues to the
mechanisms of resistance to endocrine therapy given before or after primary surgery to
eradicate distant micrometastases.
PhD Thesis - Fei Geng McMaster- Biochemistry and Biomedical Sciences
128
BIBLIOGRAPHY
Abe, F., Van Prooyen, N., Ladasky, J. J., & Edidin, M. (2009). Interaction of Bap31 and
MHC class I molecules and their traffic out of the endoplasmic reticulum. J
Immunol, 182(8), 4776-4783.
Aita, V. M., Liang, X. H., Murty, V. V., Pincus, D. L., Yu, W., Cayanis, E., et al. (1999).
Cloning and genomic organization of beclin 1, a candidate tumor suppressor gene
on chromosome 17q21. Genomics, 59(1), 59-65.
Annaert, W. G., Becker, B., Kistner, U., Reth, M., & Jahn, R. (1997). Export of
cellubrevin from the endoplasmic reticulum is controlled by BAP31. J Cell Biol,
139(6), 1397-1410.
Annis, M. G., Zamzami, N., Zhu, W., Penn, L. Z., Kroemer, G., Leber, B., et al. (2001).
Endoplasmic reticulum localized Bcl-2 prevents apoptosis when redistribution of
cytochrome c is a late event. Oncogene, 20(16), 1939-1952.
Aranovich, A., Liu, Q., Collins, T., Geng, F., Dixit, S., Leber, B., et al. (2012).
Differences in the mechanisms of proapoptotic BH3 proteins binding to Bcl-XL
and Bcl-2 quantified in live MCF-7 cells. Mol Cell, 45(6), 754-763.
Batlle, E., Sancho, E., Franci, C., Dominguez, D., Monfar, M., Baulida, J., et al. (2000).
The transcription factor snail is a repressor of E-cadherin gene expression in
epithelial tumour cells. Nat Cell Biol, 2(2), 84-89.
Baud, V., & Karin, M. (2001). Signal transduction by tumor necrosis factor and its
relatives. Trends Cell Biol, 11(9), 372-377.
Baylin, S. B., Herman, J. G., Graff, J. R., Vertino, P. M., & Issa, J. P. (1998). Alterations
in DNA methylation: a fundamental aspect of neoplasia. Adv Cancer Res, 72, 141-
196.
Beavon, I. R. (2000). The E-cadherin-catenin complex in tumour metastasis: structure,
function and regulation. Eur J Cancer, 36(13 Spec No), 1607-1620.
Behrens, J., Lowrick, O., Klein-Hitpass, L., & Birchmeier, W. (1991). The E-cadherin
promoter: functional analysis of a G.C-rich region and an epithelial cell-specific
palindromic regulatory element. Proc Natl Acad Sci U S A, 88(24), 11495-11499.
Behrens, J., Vakaet, L., Friis, R., Winterhager, E., Van Roy, F., Mareel, M. M., et al.
(1993). Loss of epithelial differentiation and gain of invasiveness correlates with
tyrosine phosphorylation of the E-cadherin/beta-catenin complex in cells
transformed with a temperature-sensitive v-SRC gene. J Cell Biol, 120(3), 757-
766.
Bernales, S., Schuck, S., & Walter, P. (2007). ER-phagy: selective autophagy of the
endoplasmic reticulum. Autophagy, 3(3), 285-287.
Bertolotti, A., Zhang, Y., Hendershot, L. M., Harding, H. P., & Ron, D. (2000). Dynamic
interaction of BiP and ER stress transducers in the unfolded-protein response. Nat
Cell Biol, 2(6), 326-332.
Berx, G., Becker, K. F., Hofler, H., & van Roy, F. (1998). Mutations of the human E-
cadherin (CDH1) gene. Hum Mutat, 12(4), 226-237.

PhD Thesis - Fei Geng McMaster- Biochemistry and Biomedical Sciences
129
Berx, G., Cleton-Jansen, A. M., Strumane, K., de Leeuw, W. J., Nollet, F., van Roy, F., et
al. (1996). E-cadherin is inactivated in a majority of invasive human lobular breast
cancers by truncation mutations throughout its extracellular domain. Oncogene,
13(9), 1919-1925.
Berx, G., Staes, K., van Hengel, J., Molemans, F., Bussemakers, M. J., van Bokhoven, A.,
et al. (1995). Cloning and characterization of the human invasion suppressor gene
E-cadherin (CDH1). Genomics, 26(2), 281-289.
Berx, G., & Van Roy, F. (2001). The E-cadherin/catenin complex: an important
gatekeeper in breast cancer tumorigenesis and malignant progression. Breast
Cancer Res, 3(5), 289-293.
Bierkamp, C., Schwarz, H., Huber, O., & Kemler, R. (1999). Desmosomal localization of
beta-catenin in the skin of plakoglobin null-mutant mice. Development, 126(2),
371-381.
Billen, L. P., Shamas-Din, A., & Andrews, D. W. (2008). Bid: a Bax-like BH3 protein.
Oncogene, 27 Suppl 1, S93-104.
Bolos, V., Peinado, H., Perez-Moreno, M. A., Fraga, M. F., Esteller, M., & Cano, A.
(2003). The transcription factor Slug represses E-cadherin expression and induces
epithelial to mesenchymal transitions: a comparison with Snail and E47
repressors. J Cell Sci, 116(Pt 3), 499-511.
Booth, C., & Koch, G. L. (1989). Perturbation of cellular calcium induces secretion of
luminal ER proteins. Cell, 59(4), 729-737.
Breckenridge, D. G., Germain, M., Mathai, J. P., Nguyen, M., & Shore, G. C. (2003).
Regulation of apoptosis by endoplasmic reticulum pathways. Oncogene, 22(53),
8608-8618.
Breckenridge, D. G., Nguyen, M., Kuppig, S., Reth, M., & Shore, G. C. (2002). The
procaspase-8 isoform, procaspase-8L, recruited to the BAP31 complex at the
endoplasmic reticulum. Proc Natl Acad Sci U S A, 99(7), 4331-4336.
Breckenridge, D. G., Stojanovic, M., Marcellus, R. C., & Shore, G. C. (2003). Caspase
cleavage product of BAP31 induces mitochondrial fission through endoplasmic
reticulum calcium signals, enhancing cytochrome c release to the cytosol. J Cell
Biol, 160(7), 1115-1127.
Brostrom, M. A., Prostko, C. R., Gmitter, D., & Brostrom, C. O. (1995). Independent
signaling of grp78 gene transcription and phosphorylation of eukaryotic initiator
factor 2 alpha by the stressed endoplasmic reticulum. J Biol Chem, 270(8), 4127-
4132.
Bruncko, M., Oost, T. K., Belli, B. A., Ding, H., Joseph, M. K., Kunzer, A., et al. (2007).
Studies leading to potent, dual inhibitors of Bcl-2 and Bcl-xL. J Med Chem, 50(4),
641-662.
Bryant, D. M., & Stow, J. L. (2004). The ins and outs of E-cadherin trafficking. Trends
Cell Biol, 14(8), 427-434.

PhD Thesis - Fei Geng McMaster- Biochemistry and Biomedical Sciences
130
Bursch, W., Hochegger, K., Torok, L., Marian, B., Ellinger, A., & Hermann, R. S. (2000).
Autophagic and apoptotic types of programmed cell death exhibit different fates
of cytoskeletal filaments. J Cell Sci, 113 ( Pt 7), 1189-1198.
Calfon, M., Zeng, H., Urano, F., Till, J. H., Hubbard, S. R., Harding, H. P., et al. (2002).
IRE1 couples endoplasmic reticulum load to secretory capacity by processing the
XBP-1 mRNA. Nature, 415(6867), 92-96.
Cano, A., Perez-Moreno, M. A., Rodrigo, I., Locascio, A., Blanco, M. J., del Barrio, M.
G., et al. (2000). The transcription factor snail controls epithelial-mesenchymal
transitions by repressing E-cadherin expression. Nat Cell Biol, 2(2), 76-83.
Capdeville, R., Buchdunger, E., Zimmermann, J., & Matter, A. (2002). Glivec (STI571,
imatinib), a rationally developed, targeted anticancer drug. Nat Rev Drug Discov,
1(7), 493-502.
Capotosti, F., Guernier, S., Lammers, F., Waridel, P., Cai, Y., Jin, J., et al. (2011). O-
GlcNAc transferase catalyzes site-specific proteolysis of HCF-1. Cell, 144(3),
376-388.
Chang, N. C., Nguyen, M., Bourdon, J., Risse, P. A., Martin, J., Danialou, G., et al.
(2012). Bcl-2-associated autophagy regulator Naf-1 required for maintenance of
skeletal muscle. Hum Mol Genet, 21(10), 2277-2287.
Chang, N. C., Nguyen, M., Germain, M., & Shore, G. C. (2010). Antagonism of Beclin 1-
dependent autophagy by BCL-2 at the endoplasmic reticulum requires NAF-1.
EMBO J, 29(3), 606-618.
Chappell, J., Leitner, J. W., Solomon, S., Golovchenko, I., Goalstone, M. L., & Draznin,
B. (2001). Effect of insulin on cell cycle progression in MCF-7 breast cancer cells.
Direct and potentiating influence. J Biol Chem, 276(41), 38023-38028.
Chen, Q., Gong, B., & Almasan, A. (2000). Distinct stages of cytochrome c release from
mitochondria: evidence for a feedback amplification loop linking caspase
activation to mitochondrial dysfunction in genotoxic stress induced apoptosis. Cell
Death Differ, 7(2), 227-233.
Chen, Y. T., Stewart, D. B., & Nelson, W. J. (1999). Coupling assembly of the E-
cadherin/beta-catenin complex to efficient endoplasmic reticulum exit and basal-
lateral membrane targeting of E-cadherin in polarized MDCK cells. J Cell Biol,
144(4), 687-699.
Chinnadurai, G., Vijayalingam, S., & Rashmi, R. (2008). BIK, the founding member of
the BH3-only family proteins: mechanisms of cell death and role in cancer and
pathogenic processes. Oncogene, 27 Suppl 1, S20-29.
Choi, D. W. (1996). Ischemia-induced neuronal apoptosis. Curr Opin Neurobiol, 6(5),
667-672.
Comer, F. I., & Hart, G. W. (2000). O-Glycosylation of nuclear and cytosolic proteins.
Dynamic interplay between O-GlcNAc and O-phosphate. J Biol Chem, 275(38),
29179-29182.
PhD Thesis - Fei Geng McMaster- Biochemistry and Biomedical Sciences
131
Corso, G., Marrelli, D., Pascale, V., Vindigni, C., & Roviello, F. (2012). Frequency of
CDH1 germline mutations in gastric carcinoma coming from high- and low-risk
areas: metanalysis and systematic review of the literature. BMC Cancer, 12, 8.
Cotman, C. W., & Anderson, A. J. (1995). A potential role for apoptosis in
neurodegeneration and Alzheimer's disease. Mol Neurobiol, 10(1), 19-45.
Cox, J. S., Chapman, R. E., & Walter, P. (1997). The unfolded protein response
coordinates the production of endoplasmic reticulum protein and endoplasmic
reticulum membrane. Mol Biol Cell, 8(9), 1805-1814.
D'Souza-Schorey, C. (2005). Disassembling adherens junctions: breaking up is hard to
do. Trends Cell Biol, 15(1), 19-26.
Danial, N. N., & Korsmeyer, S. J. (2004). Cell death: critical control points. Cell, 116(2),
205-219.
Daniel, J. M., & Reynolds, A. B. (1997). Tyrosine phosphorylation and cadherin/catenin
function. Bioessays, 19(10), 883-891.
Daugherty, R. L., & Gottardi, C. J. (2007). Phospho-regulation of Beta-catenin adhesion
and signaling functions. Physiology (Bethesda), 22, 303-309.
de Medina, P., Silvente-Poirot, S., & Poirot, M. (2009). Tamoxifen and AEBS ligands
induced apoptosis and autophagy in breast cancer cells through the stimulation of
sterol accumulation. Autophagy, 5(7), 1066-1067.
Delva, E., & Kowalczyk, A. P. (2009). Regulation of cadherin trafficking. Traffic, 10(3),
259-267.
Denmeade, S. R., & Isaacs, J. T. (2005). The SERCA pump as a therapeutic target:
making a "smart bomb" for prostate cancer. Cancer Biol Ther, 4(1), 14-22.
Distelhorst, C. W., & Shore, G. C. (2004). Bcl-2 and calcium: controversy beneath the
surface. Oncogene, 23(16), 2875-2880.
Dixit, V., & Chang, T. M. (1984). In vitro and clinical studies of the removal of cortisol,
thyroxine, insulin, and thyroid-stimulating hormone by coated charcoal
haemoperfusion. Life Support Syst, 2(4), 238-244.
Dorner, A. J., Wasley, L. C., & Kaufman, R. J. (1992). Overexpression of GRP78
mitigates stress induction of glucose regulated proteins and blocks secretion of
selective proteins in Chinese hamster ovary cells. EMBO J, 11(4), 1563-1571.
Dremina, E. S., Sharov, V. S., Kumar, K., Zaidi, A., Michaelis, E. K., & Schoneich, C.
(2004). Anti-apoptotic protein Bcl-2 interacts with and destabilizes the
sarcoplasmic/endoplasmic reticulum Ca2+-ATPase (SERCA). Biochem J, 383(Pt
2), 361-370.
Elkoreh, G., Blais, V., Beliveau, E., Guillemette, G., & Denault, J. B. (2012). Type 1
inositol-1,4,5-trisphosphate receptor is a late substrate of caspases during
apoptosis. J Cell Biochem, 113(8), 2775-2784.
Enari, M., Sakahira, H., Yokoyama, H., Okawa, K., Iwamatsu, A., & Nagata, S. (1998). A
caspase-activated DNase that degrades DNA during apoptosis, and its inhibitor
ICAD. Nature, 391(6662), 43-50.

PhD Thesis - Fei Geng McMaster- Biochemistry and Biomedical Sciences
132
Feige, J. J., & Scheffler, I. E. (1987). Analysis of the protein glycosylation defect of a
temperature-sensitive cell cycle mutant by the use of mutant cells overexpressing
the human epidermal growth factor receptor after transfection of the gene. J Cell
Physiol, 133(3), 461-470.
Fiebig, A. A., Zhu, W., Hollerbach, C., Leber, B., & Andrews, D. W. (2006). Bcl-XL is
qualitatively different from and ten times more effective than Bcl-2 when
expressed in a breast cancer cell line. BMC Cancer, 6, 213.
Fulda, S., & Debatin, K. M. (2006). Extrinsic versus intrinsic apoptosis pathways in
anticancer chemotherapy. Oncogene, 25(34), 4798-4811.
Galluzzi, L., Aaronson, S. A., Abrams, J., Alnemri, E. S., Andrews, D. W., Baehrecke, E.
H., et al. (2009). Guidelines for the use and interpretation of assays for monitoring
cell death in higher eukaryotes. Cell Death Differ, 16(8), 1093-1107.
Gambetta, M. C., Oktaba, K., & Muller, J. (2009). Essential role of the
glycosyltransferase sxc/Ogt in polycomb repression. Science, 325(5936), 93-96.
Geng, F., Shi, B. Z., Yuan, Y. F., & Wu, X. Z. (2004). The expression of core fucosylated
E-cadherin in cancer cells and lung cancer patients: prognostic implications. Cell
Res, 14(5), 423-433.
Gerl, R., & Vaux, D. L. (2005). Apoptosis in the development and treatment of cancer.
Carcinogenesis, 26(2), 263-270.
Gilmore, A. P., Owens, T. W., Foster, F. M., & Lindsay, J. (2009). How adhesion signals
reach a mitochondrial conclusion--ECM regulation of apoptosis. Curr Opin Cell
Biol, 21(5), 654-661.
Gloster, T. M., Zandberg, W. F., Heinonen, J. E., Shen, D. L., Deng, L., & Vocadlo, D. J.
(2011). Hijacking a biosynthetic pathway yields a glycosyltransferase inhibitor
within cells. Nat Chem Biol, 7(3), 174-181.
Gobeil, S., Boucher, C. C., Nadeau, D., & Poirier, G. G. (2001). Characterization of the
necrotic cleavage of poly(ADP-ribose) polymerase (PARP-1): implication of
lysosomal proteases. Cell Death Differ, 8(6), 588-594.
Gottardi, C. J., Wong, E., & Gumbiner, B. M. (2001). E-cadherin suppresses cellular
transformation by inhibiting beta-catenin signaling in an adhesion-independent
manner. J Cell Biol, 153(5), 1049-1060.
Graff, J. R., Gabrielson, E., Fujii, H., Baylin, S. B., & Herman, J. G. (2000). Methylation
patterns of the E-cadherin 5' CpG island are unstable and reflect the dynamic,
heterogeneous loss of E-cadherin expression during metastatic progression. J Biol
Chem, 275(4), 2727-2732.
Graziano, F., Humar, B., & Guilford, P. (2003). The role of the E-cadherin gene (CDH1)
in diffuse gastric cancer susceptibility: from the laboratory to clinical practice.
Ann Oncol, 14(12), 1705-1713.
Green, D. R., & Reed, J. C. (1998). Mitochondria and apoptosis. Science, 281(5381),
1309-1312.

PhD Thesis - Fei Geng McMaster- Biochemistry and Biomedical Sciences
133
Griffiths, G. J., Dubrez, L., Morgan, C. P., Jones, N. A., Whitehouse, J., Corfe, B. M., et
al. (1999). Cell damage-induced conformational changes of the pro-apoptotic
protein Bak in vivo precede the onset of apoptosis. J Cell Biol, 144(5), 903-914.
Grimm, S. (2012). The ER-mitochondria interface: the social network of cell death.
Biochim Biophys Acta, 1823(2), 327-334.
Grossmann, J. (2002). Molecular mechanisms of "detachment-induced apoptosis--
Anoikis". Apoptosis, 7(3), 247-260.
Gumbiner, B. M. (2000). Regulation of cadherin adhesive activity. J Cell Biol, 148(3),
399-404.
Gumbiner, B. M. (2005). Regulation of cadherin-mediated adhesion in morphogenesis.
Nat Rev Mol Cell Biol, 6(8), 622-634.
Hallenberger, S., Bosch, V., Angliker, H., Shaw, E., Klenk, H. D., & Garten, W. (1992).
Inhibition of furin-mediated cleavage activation of HIV-1 glycoprotein gp160.
Nature, 360(6402), 358-361.
Hanahan, D., & Weinberg, R. A. (2000). The hallmarks of cancer. Cell, 100(1), 57-70.
Hanson, C. J., Bootman, M. D., Distelhorst, C. W., Wojcikiewicz, R. J., & Roderick, H.
L. (2008). Bcl-2 suppresses Ca2+ release through inositol 1,4,5-trisphosphate
receptors and inhibits Ca2+ uptake by mitochondria without affecting ER calcium
store content. Cell Calcium, 44(3), 324-338.
Hanson, C. J., Bootman, M. D., & Roderick, H. L. (2004). Cell signalling: IP3 receptors
channel calcium into cell death. Curr Biol, 14(21), R933-935.
Harding, H. P., Zhang, Y., & Ron, D. (1999). Protein translation and folding are coupled
by an endoplasmic-reticulum-resident kinase. Nature, 397(6716), 271-274.
Hart, G. W., Housley, M. P., & Slawson, C. (2007). Cycling of O-linked beta-N-
acetylglucosamine on nucleocytoplasmic proteins. Nature, 446(7139), 1017-1022.
Hatsell, S., Medina, L., Merola, J., Haltiwanger, R., & Cowin, P. (2003). Plakoglobin is
O-glycosylated close to the N-terminal destruction box. J Biol Chem, 278(39),
37745-37752.
Haze, K., Yoshida, H., Yanagi, H., Yura, T., & Mori, K. (1999). Mammalian transcription
factor ATF6 is synthesized as a transmembrane protein and activated by
proteolysis in response to endoplasmic reticulum stress. Mol Biol Cell, 10(11),
3787-3799.
He, H., Lam, M., McCormick, T. S., & Distelhorst, C. W. (1997). Maintenance of
calcium homeostasis in the endoplasmic reticulum by Bcl-2. J Cell Biol, 138(6),
1219-1228.
Heath-Engel, H. M., Chang, N. C., & Shore, G. C. (2008). The endoplasmic reticulum in
apoptosis and autophagy: role of the BCL-2 protein family. Oncogene, 27(50),
6419-6433.
Heath-Engel, H. M., Wang, B., & Shore, G. C. (2012). Bcl2 at the endoplasmic reticulum
protects against a Bax/Bak-independent paraptosis-like cell death pathway
initiated via p20Bap31. Biochim Biophys Acta, 1823(2), 335-347.

PhD Thesis - Fei Geng McMaster- Biochemistry and Biomedical Sciences
134
Hetz, C. A. (2007). ER stress signaling and the BCL-2 family of proteins: from adaptation
to irreversible cellular damage. Antioxid Redox Signal, 9(12), 2345-2355.
Hirota, J., Furuichi, T., & Mikoshiba, K. (1999). Inositol 1,4,5-trisphosphate receptor type
1 is a substrate for caspase-3 and is cleaved during apoptosis in a caspase-3-
dependent manner. J Biol Chem, 274(48), 34433-34437.
Hoye, A. T., Davoren, J. E., Wipf, P., Fink, M. P., & Kagan, V. E. (2008). Targeting
mitochondria. Acc Chem Res, 41(1), 87-97.
Huber, A. H., & Weis, W. I. (2001). The structure of the beta-catenin/E-cadherin complex
and the molecular basis of diverse ligand recognition by beta-catenin. Cell,
105(3), 391-402.
Huber, M. A., Kraut, N., & Beug, H. (2005). Molecular requirements for epithelial-
mesenchymal transition during tumor progression. Curr Opin Cell Biol, 17(5),
548-558.
Hur, J., Chesnes, J., Coser, K. R., Lee, R. S., Geck, P., Isselbacher, K. J., et al. (2004).
The Bik BH3-only protein is induced in estrogen-starved and antiestrogen-
exposed breast cancer cells and provokes apoptosis. Proc Natl Acad Sci U S A,
101(8), 2351-2356.
Jamsa, E., Simonen, M., & Makarow, M. (1994). Selective retention of secretory proteins
in the yeast endoplasmic reticulum by treatment of cells with a reducing agent.
Yeast, 10(3), 355-370.
Jang, H., Kim, T. W., Yoon, S., Choi, S. Y., Kang, T. W., Kim, S. Y., et al. (2012). O-
GlcNAc regulates pluripotency and reprogramming by directly acting on core
components of the pluripotency network. Cell Stem Cell, 11(1), 62-74.
Janicke, R. U., Sprengart, M. L., Wati, M. R., & Porter, A. G. (1998). Caspase-3 is
required for DNA fragmentation and morphological changes associated with
apoptosis. J Biol Chem, 273(16), 9357-9360.
Jeanes, A., Gottardi, C. J., & Yap, A. S. (2008). Cadherins and cancer: how does cadherin
dysfunction promote tumor progression? Oncogene, 27(55), 6920-6929.
Jimbo, A., Fujita, E., Kouroku, Y., Ohnishi, J., Inohara, N., Kuida, K., et al. (2003). ER
stress induces caspase-8 activation, stimulating cytochrome c release and caspase-
9 activation. Exp Cell Res, 283(2), 156-166.
Jones, P. A. (1996). DNA methylation errors and cancer. Cancer Res, 56(11), 2463-2467.
Jordan, V. C., & O'Malley, B. W. (2007). Selective estrogen-receptor modulators and
antihormonal resistance in breast cancer. J Clin Oncol, 25(36), 5815-5824.
Julenius, K., Molgaard, A., Gupta, R., & Brunak, S. (2005). Prediction, conservation
analysis, and structural characterization of mammalian mucin-type O-
glycosylation sites. Glycobiology, 15(2), 153-164.
Kabeya, Y., Mizushima, N., Yamamoto, A., Oshitani-Okamoto, S., Ohsumi, Y., &
Yoshimori, T. (2004). LC3, GABARAP and GATE16 localize to autophagosomal
membrane depending on form-II formation. J Cell Sci, 117(Pt 13), 2805-2812.
PhD Thesis - Fei Geng McMaster- Biochemistry and Biomedical Sciences
135
Kanno, Y., Sasaki, Y., Shiba, Y., Yoshida-Noro, C., & Takeichi, M. (1984). Monoclonal
antibody ECCD-1 inhibits intercellular communication in teratocarcinoma PCC3
cells. Exp Cell Res, 152(1), 270-274.
Kerr, J. F., Wyllie, A. H., & Currie, A. R. (1972). Apoptosis: a basic biological
phenomenon with wide-ranging implications in tissue kinetics. Br J Cancer,
26(4), 239-257.
Klinge, C. M. (2001). Estrogen receptor interaction with estrogen response elements.
Nucleic Acids Res, 29(14), 2905-2919.
Klionsky, D. J., Abeliovich, H., Agostinis, P., Agrawal, D. K., Aliev, G., Askew, D. S., et
al. (2008). Guidelines for the use and interpretation of assays for monitoring
autophagy in higher eukaryotes. Autophagy, 4(2), 151-175.
Klionsky, D. J., & Emr, S. D. (2000). Autophagy as a regulated pathway of cellular
degradation. Science, 290(5497), 1717-1721.
Knoblauch, R., & Garabedian, M. J. (1999). Role for Hsp90-associated cochaperone p23
in estrogen receptor signal transduction. Mol Cell Biol, 19(5), 3748-3759.
Kreppel, L. K., & Hart, G. W. (1999). Regulation of a cytosolic and nuclear O-GlcNAc
transferase. Role of the tetratricopeptide repeats. J Biol Chem, 274(45), 32015-
32022.
Kroemer, G. (1999). Mitochondrial control of apoptosis: an overview. Biochem Soc
Symp, 66, 1-15.
Kroemer, G., Dallaporta, B., & Resche-Rigon, M. (1998). The mitochondrial death/life
regulator in apoptosis and necrosis. Annu Rev Physiol, 60, 619-642.
Kroemer, G., Marino, G., & Levine, B. (2010). Autophagy and the integrated stress
response. Mol Cell, 40(2), 280-293.
Ku, N. O., Toivola, D. M., Strnad, P., & Omary, M. B. (2010). Cytoskeletal keratin
glycosylation protects epithelial tissue from injury. Nat Cell Biol, 12(9), 876-885.
Kundu, M., & Thompson, C. B. (2005). Macroautophagy versus mitochondrial
autophagy: a question of fate? Cell Death Differ, 12 Suppl 2, 1484-1489.
Kuo, T. H., Kim, H. R., Zhu, L., Yu, Y., Lin, H. M., & Tsang, W. (1998). Modulation of
endoplasmic reticulum calcium pump by Bcl-2. Oncogene, 17(15), 1903-1910.
Kuukasjarvi, T., Kononen, J., Helin, H., Holli, K., & Isola, J. (1996). Loss of estrogen
receptor in recurrent breast cancer is associated with poor response to endocrine
therapy. J Clin Oncol, 14(9), 2584-2589.
Lalier, L., Cartron, P. F., Juin, P., Nedelkina, S., Manon, S., Bechinger, B., et al. (2007).
Bax activation and mitochondrial insertion during apoptosis. Apoptosis, 12(5),
887-896.
Laur, O. Y., Klingelhofer, J., Troyanovsky, R. B., & Troyanovsky, S. M. (2002). Both the
dimerization and immunochemical properties of E-cadherin EC1 domain depend
on Trp(156) residue. Arch Biochem Biophys, 400(1), 141-147.
Leber, B., & Andrews, D. W. (2010). Closing in on the link between apoptosis and
autophagy. F1000 Biol Rep, 2, 88.

PhD Thesis - Fei Geng McMaster- Biochemistry and Biomedical Sciences
136
Leber, B., Geng, F., Kale, J., & Andrews, D. W. (2010). Drugs targeting Bcl-2 family
members as an emerging strategy in cancer. Expert Rev Mol Med, 12, e28.
Leber, B., Lin, J., & Andrews, D. W. (2007). Embedded together: the life and death
consequences of interaction of the Bcl-2 family with membranes. Apoptosis,
12(5), 897-911.
Lee, A. V., Cui, X., & Oesterreich, S. (2001). Cross-talk among estrogen receptor,
epidermal growth factor, and insulin-like growth factor signaling in breast cancer.
Clin Cancer Res, 7(12 Suppl), 4429s-4435s; discussion 4411s-4412s.
Lee, E. F., Czabotar, P. E., van Delft, M. F., Michalak, E. M., Boyle, M. J., Willis, S. N.,
et al. (2008). A novel BH3 ligand that selectively targets Mcl-1 reveals that
apoptosis can proceed without Mcl-1 degradation. J Cell Biol, 180(2), 341-355.
Levine, B., Sinha, S., & Kroemer, G. (2008). Bcl-2 family members: dual regulators of
apoptosis and autophagy. Autophagy, 4(5), 600-606.
Li, H., Zhu, H., Xu, C. J., & Yuan, J. (1998). Cleavage of BID by caspase 8 mediates the
mitochondrial damage in the Fas pathway of apoptosis. Cell, 94(4), 491-501.
Li, S., Zhao, Y., He, X., Kim, T. H., Kuharsky, D. K., Rabinowich, H., et al. (2002).
Relief of extrinsic pathway inhibition by the Bid-dependent mitochondrial release
of Smac in Fas-mediated hepatocyte apoptosis. J Biol Chem, 277(30), 26912-
26920.
Lickert, H., Bauer, A., Kemler, R., & Stappert, J. (2000). Casein kinase II
phosphorylation of E-cadherin increases E-cadherin/beta-catenin interaction and
strengthens cell-cell adhesion. J Biol Chem, 275(7), 5090-5095.
Lilien, J., & Balsamo, J. (2005). The regulation of cadherin-mediated adhesion by
tyrosine phosphorylation/dephosphorylation of beta-catenin. Curr Opin Cell Biol,
17(5), 459-465.
Ling, K., Bairstow, S. F., Carbonara, C., Turbin, D. A., Huntsman, D. G., & Anderson, R.
A. (2007). Type I gamma phosphatidylinositol phosphate kinase modulates
adherens junction and E-cadherin trafficking via a direct interaction with mu 1B
adaptin. J Cell Biol, 176(3), 343-353.
Ling, K., Doughman, R. L., Firestone, A. J., Bunce, M. W., & Anderson, R. A. (2002).
Type I gamma phosphatidylinositol phosphate kinase targets and regulates focal
adhesions. Nature, 420(6911), 89-93.
Ling, K., Schill, N. J., Wagoner, M. P., Sun, Y., & Anderson, R. A. (2006). Movin' on up:
the role of PtdIns(4,5)P(2) in cell migration. Trends Cell Biol, 16(6), 276-284.
Littlewood, T. D., & Bennett, M. R. (2003). Apoptotic cell death in atherosclerosis. Curr
Opin Lipidol, 14(5), 469-475.
Liwosz, A., Lei, T., & Kukuruzinska, M. A. (2006). N-glycosylation affects the molecular
organization and stability of E-cadherin junctions. J Biol Chem, 281(32), 23138-
23149.
Lock, J. G., & Stow, J. L. (2005). Rab11 in recycling endosomes regulates the sorting and
basolateral transport of E-cadherin. Mol Biol Cell, 16(4), 1744-1755.
PhD Thesis - Fei Geng McMaster- Biochemistry and Biomedical Sciences
137
Lombaerts, M., van Wezel, T., Philippo, K., Dierssen, J. W., Zimmerman, R. M.,
Oosting, J., et al. (2006). E-cadherin transcriptional downregulation by promoter
methylation but not mutation is related to epithelial-to-mesenchymal transition in
breast cancer cell lines. Br J Cancer, 94(5), 661-671.
Lum, J. J., Bauer, D. E., Kong, M., Harris, M. H., Li, C., Lindsten, T., et al. (2005).
Growth factor regulation of autophagy and cell survival in the absence of
apoptosis. Cell, 120(2), 237-248.
Luo, X., Budihardjo, I., Zou, H., Slaughter, C., & Wang, X. (1998). Bid, a Bcl2
interacting protein, mediates cytochrome c release from mitochondria in response
to activation of cell surface death receptors. Cell, 94(4), 481-490.
Lutter, M., Perkins, G. A., & Wang, X. (2001). The pro-apoptotic Bcl-2 family member
tBid localizes to mitochondrial contact sites. BMC Cell Biol, 2, 22.
Lytton, J., Westlin, M., & Hanley, M. R. (1991). Thapsigargin inhibits the sarcoplasmic
or endoplasmic reticulum Ca-ATPase family of calcium pumps. J Biol Chem,
266(26), 17067-17071.
Ma, L., Young, J., Prabhala, H., Pan, E., Mestdagh, P., Muth, D., et al. (2010). miR-9, a
MYC/MYCN-activated microRNA, regulates E-cadherin and cancer metastasis.
Nat Cell Biol, 12(3), 247-256.
Maiuri, M. C., Criollo, A., Tasdemir, E., Vicencio, J. M., Tajeddine, N., Hickman, J. A.,
et al. (2007). BH3-only proteins and BH3 mimetics induce autophagy by
competitively disrupting the interaction between Beclin 1 and Bcl-2/Bcl-X(L).
Autophagy, 3(4), 374-376.
Maiuri, M. C., Zalckvar, E., Kimchi, A., & Kroemer, G. (2007). Self-eating and self-
killing: crosstalk between autophagy and apoptosis. Nat Rev Mol Cell Biol, 8(9),
741-752.
Maley, F., Trimble, R. B., Tarentino, A. L., & Plummer, T. H., Jr. (1989).
Characterization of glycoproteins and their associated oligosaccharides through
the use of endoglycosidases. Anal Biochem, 180(2), 195-204.
Massarweh, S., Osborne, C. K., Creighton, C. J., Qin, L., Tsimelzon, A., Huang, S., et al.
(2008). Tamoxifen resistance in breast tumors is driven by growth factor receptor
signaling with repression of classic estrogen receptor genomic function. Cancer
Res, 68(3), 826-833.
Mileykovskaya, E., & Dowhan, W. (2009). Cardiolipin membrane domains in
prokaryotes and eukaryotes. Biochim Biophys Acta, 1788(10), 2084-2091.
Mosesson, Y., Mills, G. B., & Yarden, Y. (2008). Derailed endocytosis: an emerging
feature of cancer. Nat Rev Cancer, 8(11), 835-850.
Munro, S., & Pelham, H. R. (1987). A C-terminal signal prevents secretion of luminal ER
proteins. Cell, 48(5), 899-907.
Muzio, M., Stockwell, B. R., Stennicke, H. R., Salvesen, G. S., & Dixit, V. M. (1998). An
induced proximity model for caspase-8 activation. J Biol Chem, 273(5), 2926-
2930.
PhD Thesis - Fei Geng McMaster- Biochemistry and Biomedical Sciences
138
Naughton, C., MacLeod, K., Kuske, B., Clarke, R., Cameron, D. A., & Langdon, S. P.
(2007). Progressive loss of estrogen receptor alpha cofactor recruitment in
endocrine resistance. Mol Endocrinol, 21(11), 2615-2626.
Nelson, W. J. (2008). Regulation of cell-cell adhesion by the cadherin-catenin complex.
Biochem Soc Trans, 36(Pt 2), 149-155.
Ng, F. W., Nguyen, M., Kwan, T., Branton, P. E., Nicholson, D. W., Cromlish, J. A., et
al. (1997). p28 Bap31, a Bcl-2/Bcl-XL- and procaspase-8-associated protein in the
endoplasmic reticulum. J Cell Biol, 139(2), 327-338.
Nguyen, M., Breckenridge, D. G., Ducret, A., & Shore, G. C. (2000). Caspase-resistant
BAP31 inhibits fas-mediated apoptotic membrane fragmentation and release of
cytochrome c from mitochondria. Mol Cell Biol, 20(18), 6731-6740.
Nwosu, C. C., Seipert, R. R., Strum, J. S., Hua, S. S., An, H. J., Zivkovic, A. M., et al.
(2011). Simultaneous and extensive site-specific N- and O-glycosylation analysis
in protein mixtures. J Proteome Res, 10(5), 2612-2624.
Oakes, S. A., Lin, S. S., & Bassik, M. C. (2006). The control of endoplasmic reticulum-
initiated apoptosis by the BCL-2 family of proteins. Curr Mol Med, 6(1), 99-109.
Oda, H., & Takeichi, M. (2011). Evolution: structural and functional diversity of cadherin
at the adherens junction. J Cell Biol, 193(7), 1137-1146.
Oliver, F. J., Menissier-de Murcia, J., & de Murcia, G. (1999). Poly(ADP-ribose)
polymerase in the cellular response to DNA damage, apoptosis, and disease. Am J
Hum Genet, 64(5), 1282-1288.
Oltersdorf, T., Elmore, S. W., Shoemaker, A. R., Armstrong, R. C., Augeri, D. J., Belli,
B. A., et al. (2005). An inhibitor of Bcl-2 family proteins induces regression of
solid tumours. Nature, 435(7042), 677-681.
Osborne, C. K., & Schiff, R. (2011). Mechanisms of endocrine resistance in breast
cancer. Annu Rev Med, 62, 233-247.
Overholtzer, M., Mailleux, A. A., Mouneimne, G., Normand, G., Schnitt, S. J., King, R.
W., et al. (2007). A nonapoptotic cell death process, entosis, that occurs by cell-
in-cell invasion. Cell, 131(5), 966-979.
Ozawa, M., & Kemler, R. (1990). Correct proteolytic cleavage is required for the cell
adhesive function of uvomorulin. J Cell Biol, 111(4), 1645-1650.
Pagano, R. E., & Takeichi, M. (1977). Adhesion of phospholipid vesicles to Chinese
hamster fibroblasts. Role of cell surface proteins. J Cell Biol, 74(2), 531-546.
Pattarozzi, A., Gatti, M., Barbieri, F., Wurth, R., Porcile, C., Lunardi, G., et al. (2008).
17beta-estradiol promotes breast cancer cell proliferation-inducing stromal cell-
derived factor-1-mediated epidermal growth factor receptor transactivation:
reversal by gefitinib pretreatment. Mol Pharmacol, 73(1), 191-202.
Pattingre, S., Tassa, A., Qu, X., Garuti, R., Liang, X. H., Mizushima, N., et al. (2005).
Bcl-2 antiapoptotic proteins inhibit Beclin 1-dependent autophagy. Cell, 122(6),
927-939.
Pearce, S. T., & Jordan, V. C. (2004). The biological role of estrogen receptors alpha and
beta in cancer. Crit Rev Oncol Hematol, 50(1), 3-22.

PhD Thesis - Fei Geng McMaster- Biochemistry and Biomedical Sciences
139
Peifer, M., & Yap, A. S. (2003). Traffic control: p120-catenin acts as a gatekeeper to
control the fate of classical cadherins in mammalian cells. J Cell Biol, 163(3),
437-440.
Peng, X., Cuff, L. E., Lawton, C. D., & DeMali, K. A. (2010). Vinculin regulates cell-
surface E-cadherin expression by binding to beta-catenin. J Cell Sci, 123(Pt 4),
567-577.
Perillo, B., Sasso, A., Abbondanza, C., & Palumbo, G. (2000). 17beta-estradiol inhibits
apoptosis in MCF-7 cells, inducing bcl-2 expression via two estrogen-responsive
elements present in the coding sequence. Mol Cell Biol, 20(8), 2890-2901.
Pinho, S. S., Seruca, R., Gartner, F., Yamaguchi, Y., Gu, J., Taniguchi, N., et al. (2011).
Modulation of E-cadherin function and dysfunction by N-glycosylation. Cell Mol
Life Sci, 68(6), 1011-1020.
Posthaus, H., Dubois, C. M., Laprise, M. H., Grondin, F., Suter, M. M., & Muller, E.
(1998). Proprotein cleavage of E-cadherin by furin in baculovirus over-expression
system: potential role of other convertases in mammalian cells. FEBS Lett, 438(3),
306-310.
Qu, L., Huang, S., Baltzis, D., Rivas-Estilla, A. M., Pluquet, O., Hatzoglou, M., et al.
(2004). Endoplasmic reticulum stress induces p53 cytoplasmic localization and
prevents p53-dependent apoptosis by a pathway involving glycogen synthase
kinase-3beta. Genes Dev, 18(3), 261-277.
Ringwald, M., Baribault, H., Schmidt, C., & Kemler, R. (1991). The structure of the gene
coding for the mouse cell adhesion molecule uvomorulin. Nucleic Acids Res,
19(23), 6533-6539.
Rodriguez, M. E., Azizuddin, K., Zhang, P., Chiu, S. M., Lam, M., Kenney, M. E., et al.
(2008). Targeting of mitochondria by 10-N-alkyl acridine orange analogues: role
of alkyl chain length in determining cellular uptake and localization.
Mitochondrion, 8(3), 237-246.
Rong, Y., & Distelhorst, C. W. (2008). Bcl-2 protein family members: versatile regulators
of calcium signaling in cell survival and apoptosis. Annu Rev Physiol, 70, 73-91.
Rosivatz, E., Becker, I., Specht, K., Fricke, E., Luber, B., Busch, R., et al. (2002).
Differential expression of the epithelial-mesenchymal transition regulators snail,
SIP1, and twist in gastric cancer. Am J Pathol, 161(5), 1881-1891.
Saelens, X., Festjens, N., Vande Walle, L., van Gurp, M., van Loo, G., & Vandenabeele,
P. (2004). Toxic proteins released from mitochondria in cell death. Oncogene,
23(16), 2861-2874.
Savagner, P. (2001). Leaving the neighborhood: molecular mechanisms involved during
epithelial-mesenchymal transition. Bioessays, 23(10), 912-923.
Scaduto, R. C., Jr., & Grotyohann, L. W. (1999). Measurement of mitochondrial
membrane potential using fluorescent rhodamine derivatives. Biophys J, 76(1 Pt
1), 469-477.
Scaffidi, C., Fulda, S., Srinivasan, A., Friesen, C., Li, F., Tomaselli, K. J., et al. (1998).
Two CD95 (APO-1/Fas) signaling pathways. Embo J, 17(6), 1675-1687.

PhD Thesis - Fei Geng McMaster- Biochemistry and Biomedical Sciences
140
Schiff, R., Massarweh, S. A., Shou, J., Bharwani, L., Mohsin, S. K., & Osborne, C. K.
(2004). Cross-talk between estrogen receptor and growth factor pathways as a
molecular target for overcoming endocrine resistance. Clin Cancer Res, 10(1 Pt
2), 331S-336S.
Schrader, K. A., Masciari, S., Boyd, N., Salamanca, C., Senz, J., Saunders, D. N., et al.
(2011). Germline mutations in CDH1 are infrequent in women with early-onset or
familial lobular breast cancers. J Med Genet, 48(1), 64-68.
Schuck, S., Prinz, W. A., Thorn, K. S., Voss, C., & Walter, P. (2009). Membrane
expansion alleviates endoplasmic reticulum stress independently of the unfolded
protein response. J Cell Biol, 187(4), 525-536.
Shamas-Din, A., Brahmbhatt, H., Leber, B., & Andrews, D. W. (2011). BH3-only
proteins: Orchestrators of apoptosis. Biochim Biophys Acta, 1813(4), 508-520.
Shapiro, L., Fannon, A. M., Kwong, P. D., Thompson, A., Lehmann, M. S., Grubel, G., et
al. (1995). Structural basis of cell-cell adhesion by cadherins. Nature, 374(6520),
327-337.
Shen, X., Ellis, R. E., Lee, K., Liu, C. Y., Yang, K., Solomon, A., et al. (2001).
Complementary signaling pathways regulate the unfolded protein response and
are required for C. elegans development. Cell, 107(7), 893-903.
Shimohama, S. (2000). Apoptosis in Alzheimer's disease--an update. Apoptosis, 5(1), 9-
16.
Smith, C. L., & O'Malley, B. W. (2004). Coregulator function: a key to understanding
tissue specificity of selective receptor modulators. Endocr Rev, 25(1), 45-71.
Spellman, M. W. (1990). Carbohydrate characterization of recombinant glycoproteins of
pharmaceutical interest. Anal Chem, 62(17), 1714-1722.
Spencer, S. L., & Sorger, P. K. (2011). Measuring and modeling apoptosis in single cells.
Cell, 144(6), 926-939.
Stappert, J., & Kemler, R. (1994). A short core region of E-cadherin is essential for
catenin binding and is highly phosphorylated. Cell Adhes Commun, 2(4), 319-327.
Stephens, L. R., Hughes, K. T., & Irvine, R. F. (1991). Pathway of
phosphatidylinositol(3,4,5)-trisphosphate synthesis in activated neutrophils.
Nature, 351(6321), 33-39.
Su, N., & Kilberg, M. S. (2008). C/EBP homology protein (CHOP) interacts with
activating transcription factor 4 (ATF4) and negatively regulates the stress-
dependent induction of the asparagine synthetase gene. J Biol Chem, 283(50),
35106-35117.
Sun, Y., Turbin, D. A., Ling, K., Thapa, N., Leung, S., Huntsman, D. G., et al. (2010).
Type I gamma phosphatidylinositol phosphate kinase modulates invasion and
proliferation and its expression correlates with poor prognosis in breast cancer.
Breast Cancer Res, 12(1), R6.
Szegezdi, E., Logue, S. E., Gorman, A. M., & Samali, A. (2006). Mediators of
endoplasmic reticulum stress-induced apoptosis. EMBO Rep, 7(9), 880-885.
PhD Thesis - Fei Geng McMaster- Biochemistry and Biomedical Sciences
141
Takeichi, M. (2007). The cadherin superfamily in neuronal connections and interactions.
Nat Rev Neurosci, 8(1), 11-20.
Tamura, G., Yin, J., Wang, S., Fleisher, A. S., Zou, T., Abraham, J. M., et al. (2000). E-
Cadherin gene promoter hypermethylation in primary human gastric carcinomas. J
Natl Cancer Inst, 92(7), 569-573.
Teixeira, C., Reed, J. C., & Pratt, M. A. (1995). Estrogen promotes chemotherapeutic
drug resistance by a mechanism involving Bcl-2 proto-oncogene expression in
human breast cancer cells. Cancer Res, 55(17), 3902-3907.
Troyanovsky, R. B., Chitaev, N. A., & Troyanovsky, S. M. (1996). Cadherin binding sites
of plakoglobin: localization, specificity and role in targeting to adhering junctions.
J Cell Sci, 109 ( Pt 13), 3069-3078.
Tsujimoto, Y., Finger, L. R., Yunis, J., Nowell, P. C., & Croce, C. M. (1984). Cloning of
the chromosome breakpoint of neoplastic B cells with the t(14;18) chromosome
translocation. Science, 226(4678), 1097-1099.
Tsujimoto, Y., & Shimizu, S. (2007). Role of the mitochondrial membrane permeability
transition in cell death. Apoptosis, 12(5), 835-840.
Twiddy, D., Cohen, G. M., Macfarlane, M., & Cain, K. (2006). Caspase-7 is directly
activated by the approximately 700-kDa apoptosome complex and is released as a
stable XIAP-caspase-7 approximately 200-kDa complex. J Biol Chem, 281(7),
3876-3888.
Umayahara, Y., Kawamori, R., Watada, H., Imano, E., Iwama, N., Morishima, T., et al.
(1994). Estrogen regulation of the insulin-like growth factor I gene transcription
involves an AP-1 enhancer. J Biol Chem, 269(23), 16433-16442.
van Loo, G., Saelens, X., van Gurp, M., MacFarlane, M., Martin, S. J., & Vandenabeele,
P. (2002). The role of mitochondrial factors in apoptosis: a Russian roulette with
more than one bullet. Cell Death Differ, 9(10), 1031-1042.
van Roy, F., & Berx, G. (2008). The cell-cell adhesion molecule E-cadherin. Cell Mol
Life Sci, 65(23), 3756-3788.
Vosseller, K., Wells, L., & Hart, G. W. (2001). Nucleocytoplasmic O-glycosylation: O-
GlcNAc and functional proteomics. Biochimie, 83(7), 575-581.
Wakana, Y., Takai, S., Nakajima, K., Tani, K., Yamamoto, A., Watson, P., et al. (2008).
Bap31 is an itinerant protein that moves between the peripheral endoplasmic
reticulum (ER) and a juxtanuclear compartment related to ER-associated
Degradation. Mol Biol Cell, 19(5), 1825-1836.
Wang, B., Nguyen, M., Breckenridge, D. G., Stojanovic, M., Clemons, P. A., Kuppig, S.,
et al. (2003). Uncleaved BAP31 in association with A4 protein at the endoplasmic
reticulum is an inhibitor of Fas-initiated release of cytochrome c from
mitochondria. J Biol Chem, 278(16), 14461-14468.
Wang, H. L., Akinci, I. O., Baker, C. M., Urich, D., Bellmeyer, A., Jain, M., et al. (2007).
The intrinsic apoptotic pathway is required for lipopolysaccharide-induced lung
endothelial cell death. J Immunol, 179(3), 1834-1841.

PhD Thesis - Fei Geng McMaster- Biochemistry and Biomedical Sciences
142
Wang, L., Du, F., & Wang, X. (2008). TNF-alpha induces two distinct caspase-8
activation pathways. Cell, 133(4), 693-703.
Wang, X., Olberding, K. E., White, C., & Li, C. (2011). Bcl-2 proteins regulate ER
membrane permeability to luminal proteins during ER stress-induced apoptosis.
Cell Death Differ, 18(1), 38-47.
Wang, Y., & Qin, Z. H. (2010). Molecular and cellular mechanisms of excitotoxic
neuronal death. Apoptosis, 15(11), 1382-1402.
Wei, M. C., Zong, W. X., Cheng, E. H., Lindsten, T., Panoutsakopoulou, V., Ross, A. J.,
et al. (2001). Proapoptotic BAX and BAK: a requisite gateway to mitochondrial
dysfunction and death. Science, 292(5517), 727-730.
Wells, L., & Hart, G. W. (2003). O-GlcNAc turns twenty: functional implications for
post-translational modification of nuclear and cytosolic proteins with a sugar.
FEBS Lett, 546(1), 154-158.
Welshons, W. V., Grady, L. H., Engler, K. S., & Judy, B. M. (1992). Control of
proliferation of MCF-7 breast cancer cells in a commercial preparation of
charcoal-stripped adult bovine serum. Breast Cancer Res Treat, 23(1-2), 97-104.
White, E. (2007). Entosis: it's a cell-eat-cell world. Cell, 131(5), 840-842.
Wlodkowic, D., Skommer, J., & Darzynkiewicz, Z. (2008). SYTO probes in the
cytometry of tumor cell death. Cytometry A, 73(6), 496-507.
Wu, S., Hu, Y., Wang, J. L., Chatterjee, M., Shi, Y., & Kaufman, R. J. (2002). Ultraviolet
light inhibits translation through activation of the unfolded protein response kinase
PERK in the lumen of the endoplasmic reticulum. J Biol Chem, 277(20), 18077-
18083.
Wyllie, A. H., Kerr, J. F., & Currie, A. R. (1980). Cell death: the significance of
apoptosis. Int Rev Cytol, 68, 251-306.
Yap, A. S., Crampton, M. S., & Hardin, J. (2007). Making and breaking contacts: the
cellular biology of cadherin regulation. Curr Opin Cell Biol, 19(5), 508-514.
Yin, X. M., Wang, K., Gross, A., Zhao, Y., Zinkel, S., Klocke, B., et al. (1999). Bid-
deficient mice are resistant to Fas-induced hepatocellular apoptosis. Nature,
400(6747), 886-891.
Yoshida, H. (2007). Unconventional splicing of XBP-1 mRNA in the unfolded protein
response. Antioxid Redox Signal, 9(12), 2323-2333.
Youle, R. J., & Strasser, A. (2008). The BCL-2 protein family: opposing activities that
mediate cell death. Nat Rev Mol Cell Biol, 9(1), 47-59.
Zhang, J. H., Chung, T. D., & Oldenburg, K. R. (1999). A Simple Statistical Parameter
for Use in Evaluation and Validation of High Throughput Screening Assays. J
Biomol Screen, 4(2), 67-73.
Zhu, W., Cowie, A., Wasfy, G. W., Penn, L. Z., Leber, B., & Andrews, D. W. (1996).
Bcl-2 mutants with restricted subcellular location reveal spatially distinct
pathways for apoptosis in different cell types. EMBO J, 15(16), 4130-4141.
Zhu, W., Leber, B., & Andrews, D. W. (2001). Cytoplasmic O-glycosylation prevents cell
surface transport of E-cadherin during apoptosis. EMBO J, 20(21), 5999-6007.

PhD Thesis - Fei Geng McMaster- Biochemistry and Biomedical Sciences
143
Zhurinsky, J., Shtutman, M., & Ben-Ze'ev, A. (2000). Plakoglobin and beta-catenin:
protein interactions, regulation and biological roles. J Cell Sci, 113 ( Pt 18), 3127-
3139.
Zong, W. X., Lindsten, T., Ross, A. J., MacGregor, G. R., & Thompson, C. B. (2001).
BH3-only proteins that bind pro-survival Bcl-2 family members fail to induce
apoptosis in the absence of Bax and Bak. Genes Dev, 15(12), 1481-1486.
Zou, D., Yoon, H. S., Perez, D., Weeks, R. J., Guilford, P., & Humar, B. (2009).
Epigenetic silencing in non-neoplastic epithelia identifies E-cadherin (CDH1) as a
target for chemoprevention of lobular neoplasia. J Pathol, 218(2), 265-272.


![Endoplasmic reticulum[1]](https://img.dokumen.tips/doc/110x75/58ed5fc71a28aba1678b4611/endoplasmic-reticulum1.jpg)


