Embed Size (px)
Citation preview

CECL Webinar Series:
The Roadmap to Success
Cristian deRitis PhD, Sr. Director, Economics SEPTEMBER 2017

Economic Scenarios for CECL, September 2017 2
Moody’s Analytics CECL Webinar Series:
The Roadmap to Success
Today:
Economic Scenarios for CECL: What’s Reasonable and
Supportable?
COMING UP
Empowering Users, Satisfying Auditors | Thursday, October 5

Economic Scenarios for CECL, September 2017 3
Moody’s Analytics CECL Solution SuiteToday’s Focus is on Economic Scenarios

Economic Scenarios for CECL, September 2017 4
Moderator
Dr. Cristian deRitis
Senior Director, Consumer Credit Analytics
Cristian is a senior director who conducts economic analysis and develops
econometric models for a variety of projects. His regular analysis and commentary on
consumer credit, housing and the broader economy appear on Economy.com. He is
regularly quoted in publications such as the Wall Street Journal. Cristian has a PhD in
economics from Johns Hopkins University and is named on two US patents for credit
modeling techniques.
Anna Krayn
Senior Director, Head of Regulatory & Accounting Solutions
Anna is a senior director who manages the regulatory and accounting solutions team
in the Americas. The team is responsible for solutions structuring, leveraging Moody’s
Analytics products and services focusing on impairment, stress testing, and capital
planning solutions. Her primary focus is on financial institutions.
Speaker
Presenters

Economic Scenarios for CECL, September 2017 5
Accounting and Economics Intersect“Incurred loss” model replaced with forward-looking projections
» Institutions will need to measure and record immediately all current
expected credit losses (CECL) over the life of their financial assets
based on:
• Past events, including historical experience
• Current conditions
Reasonable and supportable forecasts
» Could have a large impact on capital and availability of credit.
Goes into effect starting in 2020

Economic Scenarios for CECL, September 2017 6
R&S Forward Looking Scenarios6 considerations for using economic scenarios for CECL
1. FASB Requirements
2. Economic forecast methodology
3. Forecast horizon
4. Number of scenarios
5. Mean reversion
6. Firm-specific scenarios

1 FASB Requirements

Economic Scenarios for CECL, September 2017 8
“The measurement of expected credit losses is based on relevant information about past
events, including historical experience, current conditions, and reasonable and
supportable forecasts that affect the collectability of the reported amount. An entity must
use judgment in determining the relevant information and estimation methods that are
appropriate in its circumstances.”
Amendments allow an entity to revert to historical loss information that is reflective of
the contractual term (considering the effect of prepayments) for periods that are beyond
the time frame for which the entity is able to develop reasonable and supportable
forecasts.”
Source: Page 3, Financial Instruments—Credit Losses (Topic 326), FASB, No. 2016-13,
June 2016
FASB Requirements

Economic Scenarios for CECL, September 2017 9
“Reasonable and Supportable” ForecastsAppears 39 times in Topic 326. Possible Interpretations:
Credit Loss Estimates
» Is the length of observed
historical performance sufficient
to project losses?
» Is observed history of
performance relevant for the
future time horizon?
» Is the methodology used
reasonable and supportable
over the time horizon?
Economic Forecasts
» Are forecasts for forward-looking
drivers econometrically determined?
» Are data with limited history being
extrapolated?
» Are economic cycles being
forecasted in a reasonable fashion?
Both matter
Focus is on Economic Forecasts today.

2 Economic Forecast
Methodology

Economic Scenarios for CECL, September 2017 11
The model should be based on sound, generally accepted economic
and statistical theory
The model should incorporate inter-relationships and feedback effects
among economic variables
– Shock to one factor (e.g. interest rates) impacts all other factors (e.g.
employment) over time
The model should provide information at varying levels of geographic
aggregation to capture local economic effects.
The Moody’s Analytics Economic Forecasting Model
meets these criteria.
Economic Forecast Model Methodology

Economic Scenarios for CECL, September 2017 12
» Uses all available history covering many economic cycles
Monthly unemployment rate back to 1948
» Relies on established forecasting methods
Structural macroeconomic model by Nobel laureate Lawrence Klein
Technique used by Federal Reserve, IMF, and central banks
» Regular back-testing, tracking, and model validation
Moody’s Analytics Forecasting Model

Economic Scenarios for CECL, September 2017 13
Structural Economic Forecasting Model
Exchange rates
Investment
Wages and salaries
Po
pu
latio
n
Prices
GDP
Monetary policy
rate
Imports
Government
Exports
Global GDP
Unemployment rate
Consumption
Employment
Labor force
Potential GDP
Banking
sector
Import
prices
10-yr
yield
Global
prices
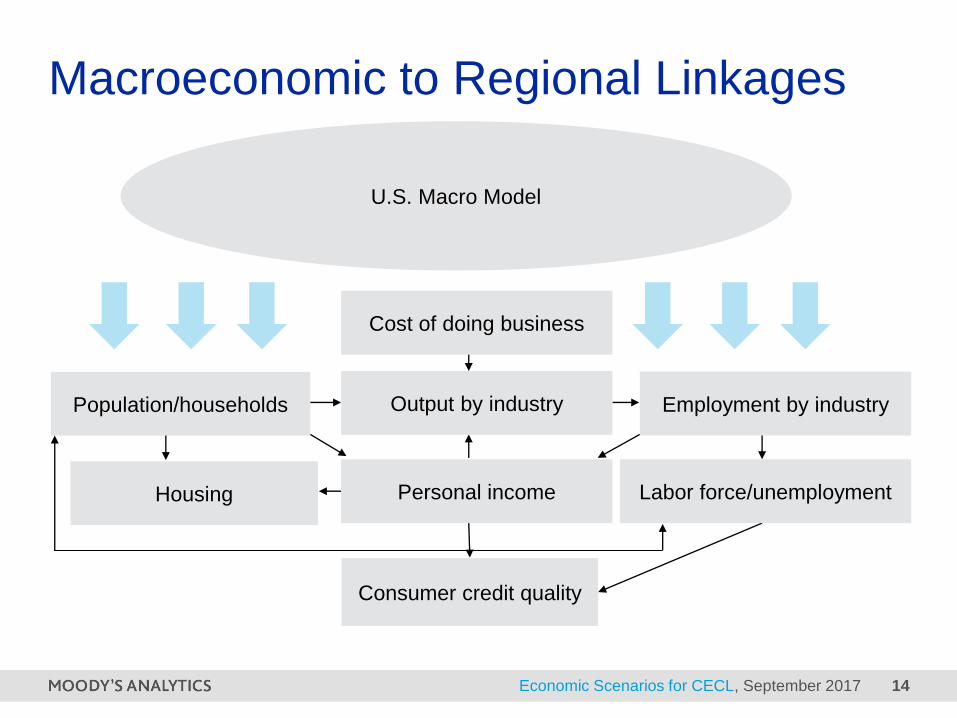
Economic Scenarios for CECL, September 2017 14
Macroeconomic to Regional Linkages
Cost of doing business
Consumer credit quality
Output by industry Employment by industryPopulation/households
Labor force/unemploymentPersonal incomeHousing
U.S. Macro Model

Economic Scenarios for CECL, September 2017 15
-5
-4
-3
-2
-1
0
1
2
3
4
5
15 16 17 18 19
Baseline S1
S2 S3
S4 S5
S6
Model Produces Multiple Scenarios
Sources: BEA, Moody’s Analytics
Real GDP, % year over year

Economic Scenarios for CECL, September 2017 16
A Full Set of ScenariosStandard
Moody’s Analytics BaselineBL
Alternatives
Stronger Near-Term ReboundS1
S2 Slower Near-Term Recovery
S3 Moderate Recession
Protracted SlumpS4
Below Trend Long Term GrowthS5
StagflationS6
Low Oil PriceS8
Next-Cycle RecessionS7
Consensus Baseline (US Only)CBL
*Idiosyncratic and expanded CCAR scenarios also available.

3 Forecast Horizon

Economic Scenarios for CECL, September 2017 18
» Every model has forecast errors
– Understand limitations of all forecasting models
– Forecast errors grow over time due to uncertainty
– Economy is exposed to exogenous external shocks
› Difficult to predict
» Moody’s Analytics economic forecasts return to long-term trend over
period of 2 to 4 years
Forecast Horizon

Economic Scenarios for CECL, September 2017 19
Simple Time Series Model (ARIMA)Real GDP growth rate, % year over year
Sources: Moody’s Analytics
Confidence intervals
widen over time

Economic Scenarios for CECL, September 2017 20
-3
-2
-1
0
1
2
3
4
5
6
17 18 19
Baseline
Scenario 1
Scenario 3
Scenarios Converge To TrendReal GDP growth rate, % year over year
Sources: BEA, Moody’s Analytics
Growth RATES converge; LEVELS do not

4 Number of Scenarios

Economic Scenarios for CECL, September 2017 22
» No specific guidance from FASB
– Future economic conditions have to be incorporated, no prescriptive
approach
– Single scenario may be sufficient: Baseline or Consensus scenario
» IFRS9 – international accounting analogue to CECL – requires
multiple, probability-weighted scenarios
» Best practice in risk management is to measure loss under multiple
scenarios to generate a distribution
» Distribution of losses is skewed
– The “average” economic forecast won’t generate the “average” level
of losses
– Multiple scenarios approximate the distribution
Number of Scenarios

Economic Scenarios for CECL, September 2017 23
0
2
4
6
8
10
12
14
0 12 24 36
Initial Forecast
Realized
Update 1
Update 2
Consensus Unemployment ForecastsUnemployment Rate, %
Sources: BLS, Moody’s Analytics
Time From Start of Forecast (months)

Economic Scenarios for CECL, September 2017 24
0.00
0.10
0.20
0.30
0.40
0.50
0.60
0.70
0 12 24 36
Consensus
Update 1
Update 2
Loss Forecasts Under ConsensusLoss Rate, %
Sources: BEA, Moody’s Analytics
Months on Book (Age)

Economic Scenarios for CECL, September 2017 25
0.00
0.05
0.10
0.15
0.20
0.25
0.30
0.35
0.40
0.45
0 12 24 36 48 60
Baseline S1: OptimisticS3: Pessimistic Prob Weighted
Probability Weighting Loss ForecastsLoss Rate, %
Sources: BEA, Moody’s Analytics
Months on Book (Age)

Economic Scenarios for CECL, September 2017 26
0.00
0.10
0.20
0.30
0.40
0.50
0.60
0 12 24 36
Prob Weighted
Update 1
Update 2
Loss Forecasts with Prob WeightingLoss Rate, %
Sources: BEA, Moody’s Analytics
Months on Book (Age)
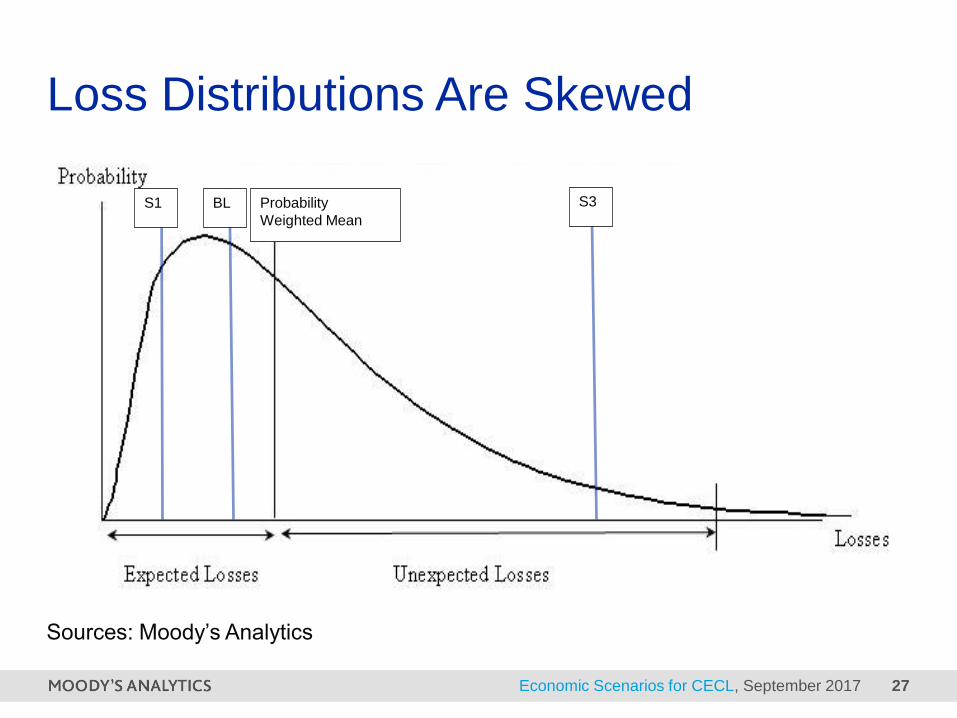
Economic Scenarios for CECL, September 2017 27
Loss Distributions Are Skewed
S1 BL S3
Sources: Moody’s Analytics
Probability
Weighted Mean
5 Mean Reversion

Economic Scenarios for CECL, September 2017 29
» Guidance directs institutions to “revert to historical loss
information” after reasonable and supportable forecast period.
» Open for interpretation
» What is this requirement really addressing?
Forecast uncertainty.
» Options
– Option 0: No need to revert externally if the loss forecasting model already has
reversion built into it
– Option 1: Revert to historical loss rates immediately after the determined forecast
horizon
– Option 2: Revert to historical loss rates gradually after the determined forecast
horizon
Mean Reversion
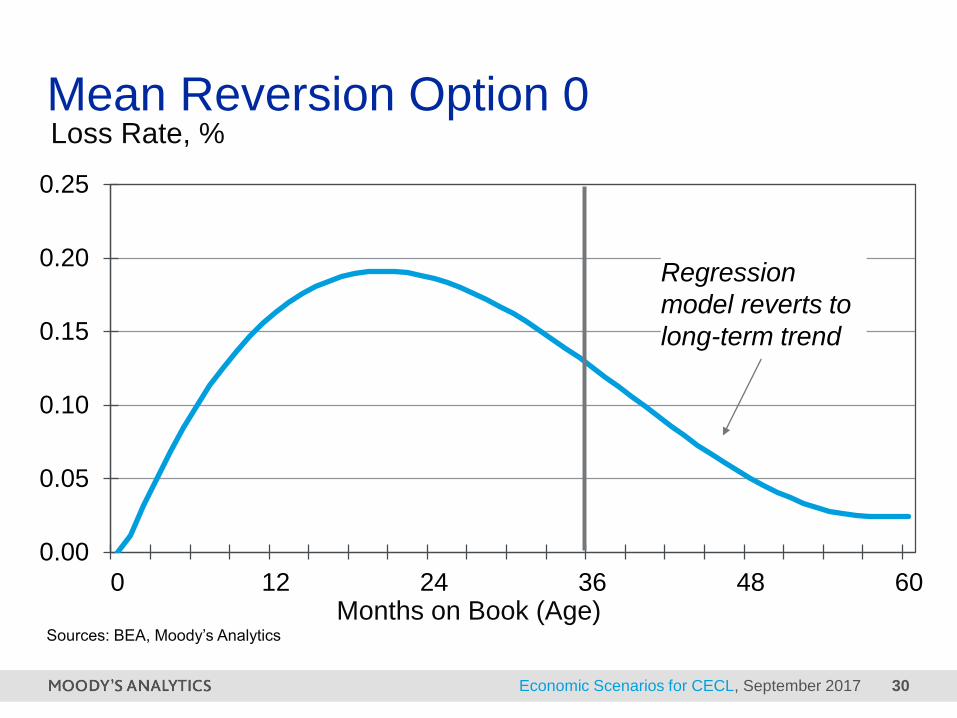
Economic Scenarios for CECL, September 2017 30
0.00
0.05
0.10
0.15
0.20
0.25
0 12 24 36 48 60
Mean Reversion Option 0Loss Rate, %
Sources: BEA, Moody’s Analytics
Months on Book (Age)
Regression
model reverts to
long-term trend

Economic Scenarios for CECL, September 2017 31
0.00
0.05
0.10
0.15
0.20
0.25
0.30
0.35
0 12 24 36 48 60
Forecast History Option 1
Mean Reversion Option 1Loss Rate, %
Sources: BEA, Moody’s Analytics
Months on Book (Age)

Economic Scenarios for CECL, September 2017 32
0.00
0.05
0.10
0.15
0.20
0.25
0.30
0.35
0 12 24 36 48 60
Forecast History Option 2
Mean Reversion Option 2Loss Rate, %
Sources: BEA, Moody’s Analytics
Months on Book (Age)

6 Firm-Specific
Scenarios

Economic Scenarios for CECL, September 2017 34
Firm-Specific Scenarios
» Standard forecast scenarios sufficient for most institutions
» Others will want idiosyncratic scenarios to capture unique risks
– Midwestern regional bank with exposure to agricultural machine
manufacturers and their employees
– Emphasize forecast values for crop prices in scenarios
» With commercially available macroeconomic models, institutions can
specify outlook for specific economic factors.
– Model solves for other factors to generate consistent forecasts
» Economic model insures forecasts are reasonable and supportable.
» Probability weights determined through simulation

Economic Scenarios for CECL, September 2017 35
For the largest institutions,
» Multiple firm-specific economic scenarios provides a wide range of
estimates that can be weighted to derive the loss allowance calculation for
CECL.
» Credit loss models forecast losses over behavioral life of loans in the
portfolio making estimates less sensitive to explicit decisions around the
reasonable forecast period and mean reversion method.
» Multiple scenarios reduce volatility in quarter-to-quarter updates.
Summary of Recommendations
Economic Scenarios for CECL, September 2017 36
For midsize institutions with smaller and/or less complicated portfolios,
» Standardized economic forecasts provide a reasonable solution.
» Running loss forecasts along multiple scenarios and then weighting them
provides a quantitative, defensible approach
» Multiple scenarios reduce volatility in quarter-to-quarter updates.
Summary of Recommendations

Economic Scenarios for CECL, September 2017 37
For institutions with small portfolios or that lack the capability to run multiple loss
forecasts efficiently,
» Single scenario approach is reasonable.
» Set the “reasonable and supportable” forecast horizon at either 2 or 3
years with gradual reversion to average historical losses over a period of
6-12 months.
» Run periodic sensitivity analysis to disclose potential volatility/risks to the
forecast.
Summary of Recommendations

Economic Scenarios for CECL, September 2017 38
Moody’s Analytics CECL Webinar Series:
The Roadmap to SuccessUPCOMING SESSION
Thursday, October 5 Empowering Users, Satisfying Auditors
MORE INFORMATION AND WEBINAR RECORDINGS
WWW.MOODYSANALYTICS.COM/CECL

Risk & Finance Practitioner
Conference 2017Theme: The Rise of Risktech
OCTOBER 22 – 24 | FAIRMONT SCOTTSDALE PRINCESS | SCOTTSDALE, ARIZONA
www.moodysanalytics.com/rfpc17

Want to learn more
or discuss your
situation?
Contact me:
Cristian deRitis, PhD
121 N Walnut St
West Chester PA 19380
+1 610 235 [email protected]
moodysanalytics.com

Economic Scenarios for CECL, September 2017 41
© 2017 Moody’s Corporation, Moody’s Investors Service, Inc., Moody’s Analytics, Inc. and/or their licensors
and affiliates (collectively, “MOODY’S”). All rights reserved.
CREDIT RATINGS ISSUED BY MOODY'S INVESTORS SERVICE, INC. AND ITS RATINGS AFFILIATES
(“MIS”) ARE MOODY’S CURRENT OPINIONS OF THE RELATIVE FUTURE CREDIT RISK OF ENTITIES,
CREDIT COMMITMENTS, OR DEBT OR DEBT-LIKE SECURITIES, AND MOODY’S PUBLICATIONS MAY
INCLUDE MOODY’S CURRENT OPINIONS OF THE RELATIVE FUTURE CREDIT RISK OF ENTITIES,
CREDIT COMMITMENTS, OR DEBT OR DEBT-LIKE SECURITIES. MOODY’S DEFINES CREDIT RISK
AS THE RISK THAT AN ENTITY MAY NOT MEET ITS CONTRACTUAL, FINANCIAL OBLIGATIONS AS
THEY COME DUE AND ANY ESTIMATED FINANCIAL LOSS IN THE EVENT OF DEFAULT. CREDIT
RATINGS DO NOT ADDRESS ANY OTHER RISK, INCLUDING BUT NOT LIMITED TO: LIQUIDITY RISK,
MARKET VALUE RISK, OR PRICE VOLATILITY. CREDIT RATINGS AND MOODY’S OPINIONS
INCLUDED IN MOODY’S PUBLICATIONS ARE NOT STATEMENTS OF CURRENT OR HISTORICAL
FACT. MOODY’S PUBLICATIONS MAY ALSO INCLUDE QUANTITATIVE MODEL-BASED ESTIMATES
OF CREDIT RISK AND RELATED OPINIONS OR COMMENTARY PUBLISHED BY MOODY’S
ANALYTICS, INC. CREDIT RATINGS AND MOODY’S PUBLICATIONS DO NOT CONSTITUTE OR
PROVIDE INVESTMENT OR FINANCIAL ADVICE, AND CREDIT RATINGS AND MOODY’S
PUBLICATIONS ARE NOT AND DO NOT PROVIDE RECOMMENDATIONS TO PURCHASE, SELL, OR
HOLD PARTICULAR SECURITIES. NEITHER CREDIT RATINGS NOR MOODY’S PUBLICATIONS
COMMENT ON THE SUITABILITY OF AN INVESTMENT FOR ANY PARTICULAR INVESTOR. MOODY’S
ISSUES ITS CREDIT RATINGS AND PUBLISHES MOODY’S PUBLICATIONS WITH THE EXPECTATION
AND UNDERSTANDING THAT EACH INVESTOR WILL, WITH DUE CARE, MAKE ITS OWN STUDY AND
EVALUATION OF EACH SECURITY THAT IS UNDER CONSIDERATION FOR PURCHASE, HOLDING,
OR SALE.
MOODY’S CREDIT RATINGS AND MOODY’S PUBLICATIONS ARE NOT INTENDED FOR USE BY
RETAIL INVESTORS AND IT WOULD BE RECKLESS AND INAPPROPRIATE FOR RETAIL INVESTORS
TO USE MOODY’S CREDIT RATINGS OR MOODY’S PUBLICATIONS WHEN MAKING AN
INVESTMENT DECISION. IF IN DOUBT YOU SHOULD CONTACT YOUR FINANCIAL OR OTHER
PROFESSIONAL ADVISER.
ALL INFORMATION CONTAINED HEREIN IS PROTECTED BY LAW, INCLUDING BUT NOT LIMITED TO,
COPYRIGHT LAW, AND NONE OF SUCH INFORMATION MAY BE COPIED OR OTHERWISE
REPRODUCED, REPACKAGED, FURTHER TRANSMITTED, TRANSFERRED, DISSEMINATED,
REDISTRIBUTED OR RESOLD, OR STORED FOR SUBSEQUENT USE FOR ANY SUCH PURPOSE, IN
WHOLE OR IN PART, IN ANY FORM OR MANNER OR BY ANY MEANS WHATSOEVER, BY ANY
PERSON WITHOUT MOODY’S PRIOR WRITTEN CONSENT.
All information contained herein is obtained by MOODY’S from sources believed by it to be accurate and
reliable. Because of the possibility of human or mechanical error as well as other factors, however, all
information contained herein is provided “AS IS” without warranty of any kind. MOODY'S adopts all
necessary measures so that the information it uses in assigning a credit rating is of sufficient quality and from
sources MOODY'S considers to be reliable including, when appropriate, independent third-party sources.
However, MOODY’S is not an auditor and cannot in every instance independently verify or validate
information received in the rating process or in preparing the Moody’s publications.
To the extent permitted by law, MOODY’S and its directors, officers, employees, agents, representatives,
licensors and suppliers disclaim liability to any person or entity for any indirect, special, consequential, or
incidental losses or damages whatsoever arising from or in connection with the information contained herein
or the use of or inability to use any such information, even if MOODY’S or any of its directors, officers,
employees, agents, representatives, licensors or suppliers is advised in advance of the possibility of such
losses or damages, including but not limited to: (a) any loss of present or prospective profits or (b) any loss or
damage arising where the relevant financial instrument is not the subject of a particular credit rating assigned
by MOODY’S.
To the extent permitted by law, MOODY’S and its directors, officers, employees, agents, representatives,
licensors and suppliers disclaim liability for any direct or compensatory losses or damages caused to any
person or entity, including but not limited to by any negligence (but excluding fraud, willful misconduct or any
other type of liability that, for the avoidance of doubt, by law cannot be excluded) on the part of, or any
contingency within or beyond the control of, MOODY’S or any of its directors, officers, employees, agents,
representatives, licensors or suppliers, arising from or in connection with the information contained herein or
the use of or inability to use any such information.
NO WARRANTY, EXPRESS OR IMPLIED, AS TO THE ACCURACY, TIMELINESS, COMPLETENESS,
MERCHANTABILITY OR FITNESS FOR ANY PARTICULAR PURPOSE OF ANY SUCH RATING OR
OTHER OPINION OR INFORMATION IS GIVEN OR MADE BY MOODY’S IN ANY FORM OR MANNER
WHATSOEVER.
Moody’s Investors Service, Inc., a wholly-owned credit rating agency subsidiary of Moody’s Corporation
(“MCO”), hereby discloses that most issuers of debt securities (including corporate and municipal bonds,
debentures, notes and commercial paper) and preferred stock rated by Moody’s Investors Service, Inc. have,
prior to assignment of any rating, agreed to pay to Moody’s Investors Service, Inc. for appraisal and rating
services rendered by it fees ranging from $1,500 to approximately $2,500,000. MCO and MIS also maintain
policies and procedures to address the independence of MIS’s ratings and rating processes. Information
regarding certain affiliations that may exist between directors of MCO and rated entities, and between entities
who hold ratings from MIS and have also publicly reported to the SEC an ownership interest in MCO of more
than 5%, is posted annually at www.moodys.com under the heading “Investor Relations — Corporate
Governance — Director and Shareholder Affiliation Policy.”
Additional terms for Australia only: Any publication into Australia of this document is pursuant to the
Australian Financial Services License of MOODY’S affiliate, Moody’s Investors Service Pty Limited ABN 61
003 399 657AFSL 336969 and/or Moody’s Analytics Australia Pty Ltd ABN 94 105 136 972 AFSL 383569
(as applicable). This document is intended to be provided only to “wholesale clients” within the meaning of
section 761G of the Corporations Act 2001. By continuing to access this document from within Australia, you
represent to MOODY’S that you are, or are accessing the document as a representative of, a “wholesale
client” and that neither you nor the entity you represent will directly or indirectly disseminate this document or
its contents to “retail clients” within the meaning of section 761G of the Corporations Act 2001. MOODY’S
credit rating is an opinion as to the creditworthiness of a debt obligation of the issuer, not on the equity
securities of the issuer or any form of security that is available to retail investors. It would be reckless and
inappropriate for retail investors to use MOODY’S credit ratings or publications when making an investment
decision. If in doubt you should contact your financial or other professional adviser.
Additional terms for Japan only: Moody's Japan K.K. (“MJKK”) is a wholly-owned credit rating agency
subsidiary of Moody's Group Japan G.K., which is wholly-owned by Moody’s Overseas Holdings Inc., a
wholly-owned subsidiary of MCO. Moody’s SF Japan K.K. (“MSFJ”) is a wholly-owned credit rating agency
subsidiary of MJKK. MSFJ is not a Nationally Recognized Statistical Rating Organization (“NRSRO”).
Therefore, credit ratings assigned by MSFJ are Non-NRSRO Credit Ratings. Non-NRSRO Credit Ratings are
assigned by an entity that is not a NRSRO and, consequently, the rated obligation will not qualify for certain
types of treatment under U.S. laws. MJKK and MSFJ are credit rating agencies registered with the
Japan Financial Services Agency and their registration numbers are FSA Commissioner (Ratings) No. 2
and 3 respectively.
MJKK or MSFJ (as applicable) hereby disclose that most issuers of debt securities (including corporate and
municipal bonds, debentures, notes and commercial paper) and preferred stock rated by MJKK or MSFJ (as
applicable) have, prior to assignment of any rating, agreed to pay to MJKK or MSFJ (as applicable) for
appraisal and rating services rendered by it fees ranging from JPY200,000 to approximately
JPY350,000,000.
MJKK and MSFJ also maintain policies and procedures to address Japanese regulatory requirements.