Embed Size (px)
Citation preview

cebupacificair.com
Cebu Air, Inc.4th Quarter and Full Year 2017Results of Operations

Disclaimer
2
The information provided in this presentation is provided only for your reference. Such information has not been independently verified and, as such, is not guaranteed to be accurate nor complete. Neither Cebu Air, Inc. (“CEB” or the “Company”) nor any of its affiliates, shareholders, directors, employees, agents or advisers makes expressed or implied representations or warranties as to the accuracy or completeness of the information contained herein and neither of them shall accept any responsibility or liability (including any third party liability) for any loss or damage, whether or not arising from any error or omission in compiling such information or as a result of any party’s reliance or use of such information. The information and opinions in this presentation are subject to change without notice.
EBITDAR, EBITDA, EBITDAR Margin, EBIT and core net income are not measures of performance under the Philippine Financial Reporting Standards (“PFRS”), and should not be considered in isolation or as alternatives to net income as an indicator of CEB’s operating performance or to cash flow from operating, investing and financing activities as a measure of liquidity, or any other measures of performance under PFRS. Because there are various EBITDAR, EBITDA, EBITDAR Margin, EBIT and core net income calculation methods,CEB’s presentation of these measures may not be comparable to similarly titled measures used by other companies.
This presentation also contains certain “forward-looking statements.” These forward-looking statements include words or phrases such as CEB or its management “believes”, “expects”, “anticipates”, “intends”, “plans”, “foresees”, or other words or phrases of similar import. Similarly, statements that describe CEB’s objectives, plans or goals are also forward-looking statements. All such forward-looking statements are subject to certain risks and uncertainties that could cause actual results to differ materially from those contemplated by the relevant forward-looking statement. Such forward looking statements are made based on management’s current expectations or beliefs as well as assumptions made by, and information currently available to, management. There is no assurance that expectedevents will occur, that projections will be achieved, or that the Company and its management’s assumptions are correct.

Business Updates

Passengers, Seats and Seat Load Factor
Operating Statistics
4
10.0 10.1 9.1 9.7
19.1 19.7
11.5 11.9 10.8 11.6
22.3 23.5
1H16 1H17 2H16 2H17 FY16 FY17
Passengers
Capacity
LoadFactor
Pax: +0.7%Cap: +3.1%
87.2% 85.1% 84.7% 82.9% 86.0% 84.0%
Pax: +6.0%Cap: +8.2%
Pax: +3.2%Cap: +5.6%
Sources: CEB Internal Reports
4th Quarter 2017
Flew 4.9M passengers, up 4.7% YOY, for SLF of 83.6%
ASK was down 1.6% YOY to 6.3B while RPK slightly grew by 0.1% YOY to 5.1B
Full Year 2017
Flew 19.7M passengers, up 3.2% YOY, for SLF of 84%
ASK grew 0.9% YOY to 26.2B while RPK grew 0.4% YOY to 21.3B
Airbus fleet utilization at 12.5 hours/day, 6.2 turns/day
On-time performance posted at 68%, up 8ppts YOY
61 Fleet
62 Destinations
113 Routes

Domestic
4Q17: Flew 3.6M passengers, up 2.1%, for SLF of 85.9%.
FY17: Flew 14.6M passengers, up 1.7%, for SLF of 86.8%
37 destinations, 76 routes, close to 2,000 weekly flights
International
4Q17: Flew 1.3M passengers, up 12.5%, for SLF of 78.1%
FY17: Flew 5.1M passengers, up 7.9%, for SLF of 77.0%.
25 destinations, 37 routes, 500+ weekly flights
Notable passenger growth in key markets with the redeployment of A330 previously for long haul
Remaining LH routes, Sydney and Dubai, continue to outperform both posting SLF at around 81%.
Launched 3x weekly service Manila-Melbourne route starting August 14, 2018
5
Key Markets Pax (000) YOY Cap. Share* SLF
Narita 265 +70% 24% 69%
Incheon 380 +34% 12% 78%
Taipei 280 +34% 18% 73%
Bangkok 230 +23% 25% 79%
Sydney 174 +18% 44% 81%
Hong Kong 1,171 +16% 34% 80%
Dubai 248 -1.6% 25% 82%
Singapore 803 -2% 31% 77%
Market Performance
Source: CAPA Route Capacity Analyser for the week of December 25, 2017
CEB group, 20%
PAL group, 28%
AA group, 6%
Foreign Carriers, 47%
International Market Share FY2017
Source:

6
2017 Initiatives
Customer Care Command Center
Cadet Pilot Training Program
MAX Airport Suite
Investments in Safety through technology Runway Overrun Protection System Wireless Ground Link (WGL) Electronic Flight Bag

Financial Results

4Q17 4Q16 % Change FY17 FY16 % Change
Total Revenue (Php M) 17,698 15,208 16.4% 68,029 61,899 9.9%Passenger Revenue 13,002 11,237 15.7% 49,931 46,593 7.2%Ancillary Revenue 3,381 2,957 14.3% 13,494 11,743 14.9%Cargo Revenue 1,315 1,014 29.7% 4,604 3,564 29.2%
Ave. Yield/passenger 3,363 3,051 10.2% 3,212 3,049 5.3%Average fare 2,669 2,415 10.5% 2,529 2,436 3.8%Ancillary/passenger 694 636 9.2% 683 614 11.3%
Cargo yield / kg 25.6 23.4 9.5% 25.7 23.0 11.9%
ASK (M) 6,297 6,399 -1.6% 26,233 25,989 0.9%
Revenue/ASK (RASK) 2.81 2.38 18.3% 2.59 2.38 8.9%Cost/ASK (CASK) 2.35 1.94 21.3% 2.21 1.91 15.5%CASK - Fuel 0.79 0.62 27.2% 0.75 0.61 22.7%CASK ex-fuel 1.56 1.31 18.5% 1.46 1.30 12.2%
Jet fuel (USD/bbl) average* 72.60 60.58 19.8% 65.31 52.83 23.6%Php/USD average* 50.40 47.50 6.1% 50.40 47.50 6.1%
Income (PHP million)EBITDAR 4,980 4,486 11.0% 22,818 23,625 -3.4%EBIT 2,889 2,801 3.1% 10,134 12,251 -17.3%Pre-tax Core Income 2,624 2,558 2.6% 9,036 11,373 -20.5%Net Income 3,532 2,656 33.0% 7,908 9,754 -18.9%
MarginsEBITDAR Margin 28.1% 29.5% -1.4ppts 33.5% 38.2% -4.6pptsEBIT Margin 16.3% 18.4% -2.1ppts 14.9% 19.8% -4.9pptsPre-tax Core Margin 14.8% 16.8% -2.0ppts 13.3% 18.4% -5.1pptsNet Margin 20.0% 17.5% 2.5ppts 11.6% 15.8% -4.1ppts
8
Income Statement Highlights
*source: Published MOPS and PDS rates

In Millions of PHP 2017 2016 2017 vs 2016
Cash 15,614 10,296 5,317 51.6%
Other current assets 6,078 4,855 1,223 25.2%
Property, plant & equipment 81,279 81,890 (611) -0.7%
Goodwill and others 6,106 3,473 2,633 75.8%
TOTAL ASSETS 109,077 100,514 8,562 8.5%
Current Debt 5,969 7,040 (1,071) -15.2%
Noncurrent Debt 35,013 35,770 (757) -2.1%
Other liabilities 28,309 24,199 4,110 17.0%
TOTAL LIABILITIES 69,291 67,009 2,282 3.4%
EQUITY 39,786 33,505 6,280 18.7%
Cash to Sales Ratio 22.95% 16.63%Current Ratio 0.74x 0.54xNet debt1 to Equity 0.64x 0.97xAdjusted Net debt2 to Equity 1.73x 2.30x
Balance Sheet Highlights
PPE:
- 1 new A330
- 6 new ATR 72-600
- 6 A320 converted into operating lease
- 3 A319 sold
Other assets (current and non-current):
- Advance purchase of Airbus A330 life limited engine parts and advance payments to MRO providers.
Loans breakdown Php vs USD:
2017 2016USD 549M 749M
PHP 13,546M 5,578M
NOTE:1Net debt is total debt less cash and cash equivalents2Adjusted net debt is net debt plus capitalized lease and ARO liability based on the present value of future operating lease commitments. (Previously 1.93x for 2016 based on 7x capitalization multiple).
9

in Millions of PHP 2017
CASHFLOWS FROM OPERATING ACTIVITIES
Income after noncash adjustments 17,601 Net changes in working capital 1,490 Interest and taxes paid – net (1,295)Net cash provided by operating activities 17,795
CASHFLOWS FROM INVESTING ACTIVITIES
Acquisition of PPE net of proceeds from sale (6,133)
Dividends from JVs 125
Other non-current assets (2,781)Net cash used in investing activities (8,789)
CASHFLOWS FROM FINANCING ACTIVITIES
Proceeds from borrowings net of repayments (2,081)
Dividends paid (1,666)Net cash used in financing activities (3,747)
Net foreign exchange difference 58 NET INCREASE IN CASH AND CASH EQUIVALENTS 5,317 CASH AND CASH EQUIVALENTS, beginning 10,296 CASH AND EQUIVALENTS, END 15,613
Cash Flow Highlights
Additions to PPE: Php1.5B in PDPs, and Php13B final payment for 1 A330 and 6 ATR 600
Proceeds from AC sale: 3 A319 and 6 A320 SLBs
Other non-current assets: Php2.8B advance payments for A330 LLPs
Php8.9B Loan availment: for 7 AC deliveries
Php11B loan repayment includes $84.4M prepayment for A320 loans before sale
10

Outlook
12
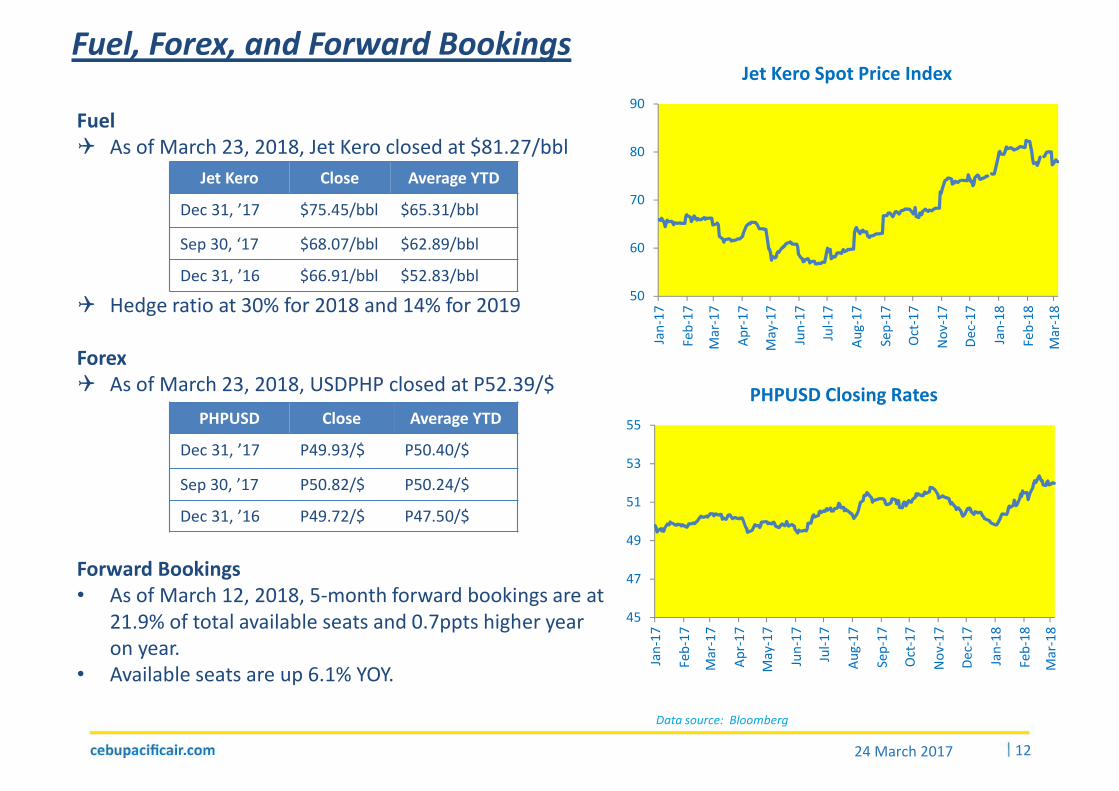
Data source: Bloomberg
Fuel As of March 23, 2018, Jet Kero closed at $81.27/bbl
Hedge ratio at 30% for 2018 and 14% for 2019
Forex As of March 23, 2018, USDPHP closed at P52.39/$
Forward Bookings• As of March 12, 2018, 5-month forward bookings are at
21.9% of total available seats and 0.7ppts higher year on year.
• Available seats are up 6.1% YOY.
Jet Kero Close Average YTD
Dec 31, ’17 $75.45/bbl $65.31/bbl
Sep 30, ‘17 $68.07/bbl $62.89/bbl
Dec 31, ’16 $66.91/bbl $52.83/bbl
PHPUSD Close Average YTD
Dec 31, ’17 P49.93/$ P50.40/$
Sep 30, ’17 P50.82/$ P50.24/$
Dec 31, ’16 P49.72/$ P47.50/$
24 March 2017
Fuel, Forex, and Forward Bookings
50
60
70
80
90
Jan
-17
Feb
-17
Mar
-17
Ap
r-1
7
May
-17
Jun
-17
Jul-
17
Au
g-1
7
Sep
-17
Oct
-17
No
v-1
7
Dec
-17
Jan
-18
Feb
-18
Mar
-18
Jet Kero Spot Price Index
45
47
49
51
53
55
Jan
-17
Feb
-17
Mar
-17
Ap
r-1
7
May
-17
Jun
-17
Jul-
17
Au
g-1
7
Sep
-17
Oct
-17
No
v-1
7
Dec
-17
Jan
-18
Feb
-18
Mar
-18
PHPUSD Closing Rates

13
Finally, for a long term outlook…
Maintain a Conservative and Flexible Fleet Expansion Plan:
Current Fleet of 63:
1 Airbus A319, 1 Airbus A321CEO, 36 Airbus A320, 8 Airbus A330, 8 ATR 72-500, and 9 ATR 72-600
2018: 6 more A321 CEOs, 1 A321 NEO, and 3 more ATR 72-600 deliveries; 8 ATR 72-500 exits
2019-2022: 31 A321 NEO and 4 ATR 72-600 deliveries, and 13 A320 Lease returns

cebupacificair.com
Thank you!


![[Cebu English] Trường Anh ngữ BOC - Cebu](https://img.dokumen.tips/doc/110x75/58754c171a28abb8208b7761/cebu-english-truong-anh-ngu-boc-cebu.jpg)


![[Cebu English] Trường C2 UBEC, Cebu Brochure tiếng Việt](https://img.dokumen.tips/doc/110x75/587505dd1a28ab29208b62af/cebu-english-truong-c2-ubec-cebu-brochure-tieng-viet.jpg)


![[Cebu English] Trường Anh ngữ IMS, TP Cebu, Philippines](https://img.dokumen.tips/doc/110x75/5876cfbf1a28ab1d238b4641/cebu-english-truong-anh-ngu-ims-tp-cebu-philippines.jpg)