Embed Size (px)
Citation preview
Hindawi Publishing CorporationJournal of ChemistryVolume 2013, Article ID 202061, 6 pageshttp://dx.doi.org/10.1155/2013/202061
Research ArticleCdTe Quantum Dots Embedded in Multidentate BiopolymerBased on Salep: Characterization and Optical Properties
Ghasem Rezanejade Bardajee and Zari Hooshyar
Department of Chemistry, Payame Noor University, P.O. Box 19395-3697, Tehran, Iran
Correspondence should be addressed to Ghasem Rezanejade Bardajee; [email protected]
Received 30 April 2013; Revised 28 June 2013; Accepted 28 June 2013
Academic Editor: Fa-Nian Shi
Copyright © 2013 G. Rezanejade Bardajee and Z. Hooshyar.This is an open access article distributed under the Creative CommonsAttribution License, which permits unrestricted use, distribution, and reproduction in any medium, provided the original work isproperly cited.
This paper describes a novelmethod for surfacemodification of water soluble CdTe quantumdots (QDs) by using poly(acrylic acid)grafted onto salep (salep-g-PAA) as a biopolymer. As-prepared CdTe-salep-g-PAA QDs were characterized by Fourier transforminfrared (FT-IR) spectrum, thermogravimetric (TG) analysis, and transmission electron microscopy (TEM). The absorption andfluorescence emission spectra were measured to investigate the effect of salep-g-PAA biopolymer on the optical properties ofCdTe QDs. The results showed that the optical properties of CdTe QDs were significantly enhanced by using salep-g-PAA-basedbiopolymer.
1. Introduction
CdTe quantum dots (QDs) are novel high-efficiency fluores-cencematerials with unique chemical and physical properties[1–3]. They have been increasingly utilized in several techno-logical areas such as solar photovoltaic cells, nanobarcodes,field effect transistors, light emitting diodes, photocatalysis,in vivo biomedical detection fluorescent tags in biology, andchemical and biological sensors [4–9]. In a general way,there are two ways to make CdTe QDs with desired opticalproperties, organometallic and aqueous syntheses [10, 11].Compared with the organic synthesis, aqueous methods forQDs preparation are reasonably simple, economical, andenvironmentally friendly [12–14].
Water-soluble CdTe QDs can be synthesized through theselection of appropriate ligandmolecules such as thioglycolicacid (TGA) and 3-mercaptopropionic acid, but low quan-tum yields (QYs) are typically obtained [15–17]. To removethese defects, surface modification of these water solubleCdTe QDs by polysaccharides is a suitable strategy [18–20].Polysaccharides are the most viable, because the biopoly-mers are basically obtained from natural sources and arebiodegradable. Salep is a nontoxic and stable water-solublepolysaccharide extracted from dried tubers of certain naturalterrestrial orchids possessing interesting gelling properties
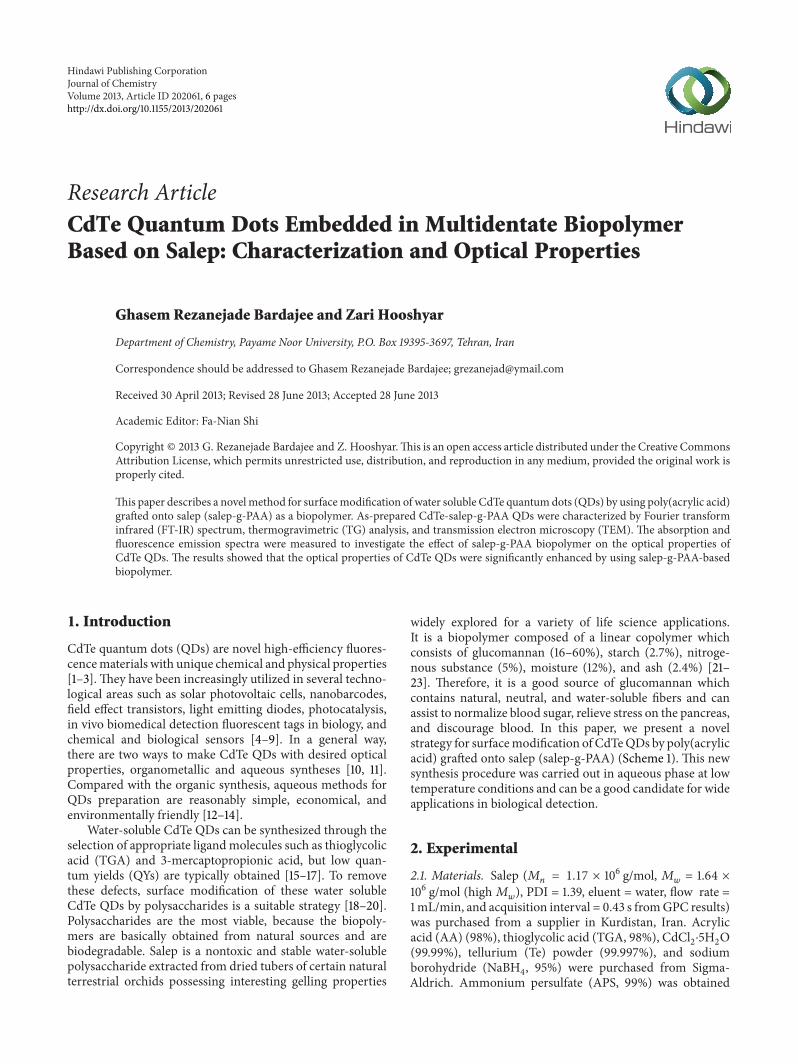
widely explored for a variety of life science applications.It is a biopolymer composed of a linear copolymer whichconsists of glucomannan (16–60%), starch (2.7%), nitroge-nous substance (5%), moisture (12%), and ash (2.4%) [21–23]. Therefore, it is a good source of glucomannan whichcontains natural, neutral, and water-soluble fibers and canassist to normalize blood sugar, relieve stress on the pancreas,and discourage blood. In this paper, we present a novelstrategy for surfacemodification of CdTeQDs by poly(acrylicacid) grafted onto salep (salep-g-PAA) (Scheme 1). This newsynthesis procedure was carried out in aqueous phase at lowtemperature conditions and can be a good candidate for wideapplications in biological detection.
2. Experimental
2.1. Materials. Salep (𝑀𝑛= 1.17 × 10⁶ g/mol, 𝑀
𝑤= 1.64 ×
106 g/mol (high𝑀𝑤), PDI = 1.39, eluent = water, flow rate =
1mL/min, and acquisition interval = 0.43 s fromGPC results)was purchased from a supplier in Kurdistan, Iran. Acrylicacid (AA) (98%), thioglycolic acid (TGA, 98%), CdCl
2⋅5H2O
(99.99%), tellurium (Te) powder (99.997%), and sodiumborohydride (NaBH
4, 95%) were purchased from Sigma-
Aldrich. Ammonium persulfate (APS, 99%) was obtained
2 Journal of Chemistry
O O O O
Salep
(PAA)
CdTe-salep-g-PAA
O O
CdTe
CdTe CdTe CdTe
SO
OH
OH
OHOH
HO
HO
HO
SO
SO
SO
SO
S
O
SO
Salep-g-PAA
O O
OH
O
O
O
HO
OH
OHOH
OH
OHH HH
HO HOH H H HH HHH
H HH
OHO HO HO
O
O
O
O OO O
H H
H H
H
S2O8
2−
−HSO4
−
nn
n
∙ ∙
SO4
−∙
80∘C
Scheme 1: Schematic illustration for the preparation of CdTe- salep-g-PAA QDs.
from Fluka and was used without further purification. Allother chemicals and solvents were of analytical-reagent gradefrom LOBA chemicals (India). Double distilled water wasused to prepare all the solutions.
2.2. Characterization Techniques. UV-vis absorption andfluorescence spectra of the samples were recorded witha Shimadzu UV-visible 1650 PC spectrophotometer anda SCINCO’s fluorescence spectrometer fluoroMate FS-2,respectively.Thermogravimetric (TG) analysis of the sampleswas carried out with a TA Instruments model SDT Q600under a dynamic N
2atmosphere from 35 to 600∘C at a
constant heating rate of 10∘C/min. Transmission electronmicroscopy (TEM) was performed using a Hitachi H-700CTEM. FT-IR spectra of samples in the form of KBr pelletswere recorded using a Jasco 4200 FT-IR spectrophotometer.
2.3. Synthesis of CdTe-TGA QDs. CdTe-TGA QDs wereprepared according to the method described previously [15].Briefly, under N
2atmosphere, deionized water (2.5mL) was
added to Te powder (0.025 g) and 0.025 g of NaBH4under
magnetic stirring at room temperature. After about 2 h, thecolorless solution of NaHTe was prepared. Then, NaHTe wasadded to cadmium chloride solution in the presence of TGAunder N
2atmosphere with a molar ratio of Cd2+ : Te2− : TGA
fixed at 1 : 0.5 : 2.4. After mixing, the solution was heated to100∘C for 1 h, and then CdTe-TGA QDs could be obtained.
2.4. Preparation of CdTe-Salep-g-PAA QDs. The synthesisof salep-g-PAA was as follows: AA (4mL, 5.8mmol) wasadded to a three-neck reactor which contained homoge-nized mixture of salep (1.0 g) in water (80mL). APS (0.09 g(0.4mmol)) in double distilled water (5.0mL) was slightlyadded to the previous solution, while temperature of reactorwas controlled by a thermostated water bath at 80∘C. After30min stirring, the formed viscous solution was dewateredby ethanol (200mL) to remove unreacted monomers and
homopolymers.The synthesized CdTe-TGAQDswere addedto the viscous solution of salep-g-PAA (CdTe-TGA/salep-g-PAA = 1 : 4) (Scheme 1). The solution was stirred for 60minat room temperature to ensure distribution of the CdTeQDs into the biopolymer matrix. Meanwhile, the opticalproperties of the solutionwere studied viaUV-visible absorp-tion and fluorescence measurements at 25∘C. After that, theethanol was added to the solution and centrifuged, and theresidue was collected for further experiments.
3. Results and Discussion
To obtain the optimized reaction conditions, we initiallychanged various reaction parameters including precursorratios, pH values, and refluxing times to find their optimumvalues respecting to higher emission intensity of the resultantCdTe-TGA QDs. For example, changing the refluxing timeshowed that the 1 h heating time has the best efficiency. Inthis regard, to a three-neck round bottom flask containingdeionized water (2.5mL), Te powder (0.025 g) was addedunder N
2atmosphere. Then, the flask was charged with
0.025 g of NaBH4under magnetic stirring at room tem-
perature. After about 2 h, the colorless solution of NaHTewas prepared. The NaHTe solution was added to cadmiumchloride solution (from dissolving 0.11 g CdCl
2in 80mL
deionized water) in the presence of TGA at pH = 8 andunder N
2atmosphere with a molar ratio of Cd2+ : Te2− : TGA
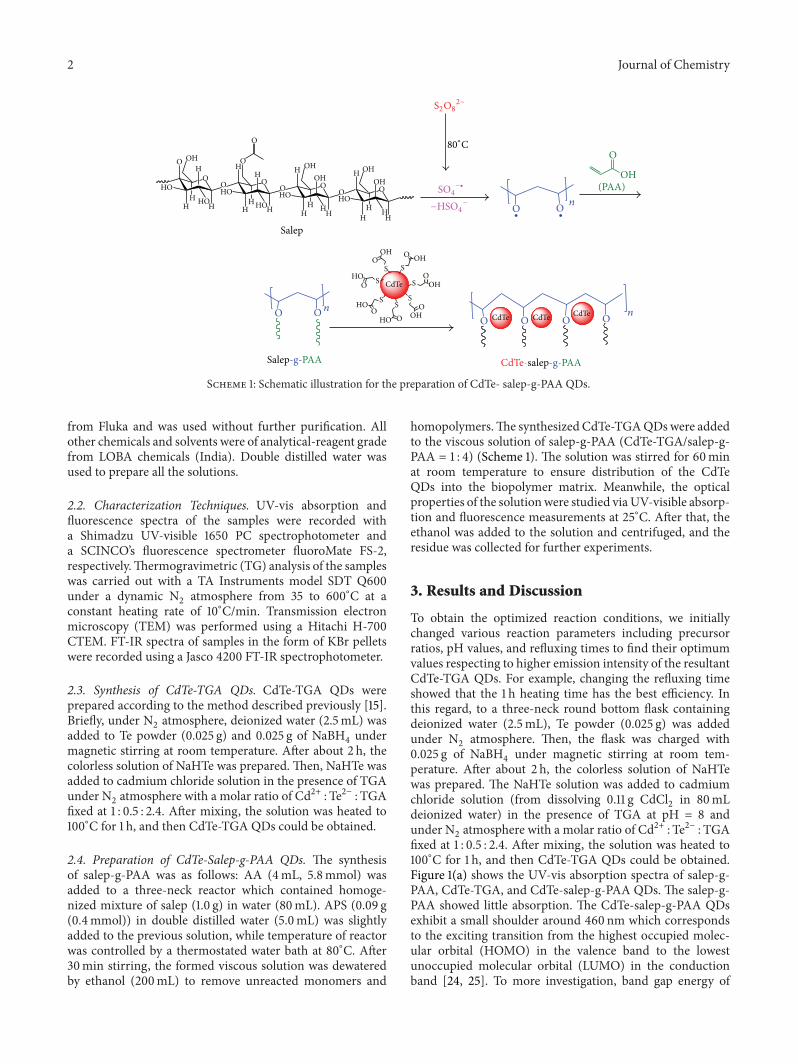
fixed at 1 : 0.5 : 2.4. After mixing, the solution was heated to100∘C for 1 h, and then CdTe-TGA QDs could be obtained.Figure 1(a) shows the UV-vis absorption spectra of salep-g-PAA, CdTe-TGA, and CdTe-salep-g-PAA QDs. The salep-g-PAA showed little absorption. The CdTe-salep-g-PAA QDsexhibit a small shoulder around 460 nm which correspondsto the exciting transition from the highest occupied molec-ular orbital (HOMO) in the valence band to the lowestunoccupied molecular orbital (LUMO) in the conductionband [24, 25]. To more investigation, band gap energy of
Journal of Chemistry 3
400 450 500 550 600 650
0.00
0.05
0.10
0.15
Salep-g-PAA
CdTe-TGA
CdTe-salep-g-PAA
Abso
rban
ce
Wavelength (nm)
−0.05
(a)
3 4 5 60
20
40
60
80
100
CdTe-TGA
CdTe-salep-g-PAA
Tran
smitt
ance
(%)
Energy (eV)
(b)
Figure 1: (a) UV-vis absorption and (b) transmittance spectrum of salep-g-PAA, CdTe-TGA, and CdTe-salep-g-PAA QDs.
450 475 500 525 550 575 600 6250
500
1000
1500
2000
2500
3000
3500
4000
4500
Salep-g-PAA
CdTe-TGA
CdTe-salep-g-PAA
FL in
tens
ity
Wavelength (nm)
Figure 2: Fluorescence spectra of salep-g-PAA, CdTe-TGA, andCdTe-salep-g-PAA QDs (𝜆ex for emission spectra = 380 nm).
1000200030004000 600
c
b
a
Wavenumber (cm−1)
T(%
)
Figure 3: FT-IR spectra of (a) CdTe-TGA QDs, (b) salep-g-PAA,and (c) CdTe- salep-g-PAA QDs.
100 200 300 400 500 6000
20
40
60
80
100
CdTe-salep-g-PAA
Salep-g-PAATG (%)
DTGTG
(%)
0.0
DTG
−2.0
−1.5
−1.0
−0.5
Temperature (∘C)
Figure 4: TG/DTG curves of CdTe-salep-g-PAA and salep-g-PAA.
CdTe-TGA and CdTe-salep-g-PAAQDs was calculated fromthe middle of shoulder in transmittance spectra as they areshown in Figure 1(b). The observed band gap of CdTe-salep-g-PAA QDs is 1.77 eV, which is bigger than the band gapvalue of 1.56 eV for CdTe-TGA QDs. This indicates thatthe CdTe-salep-g-PAA QDs display an obvious blue shiftcompared with the CdTe-TGAQDs, whichmay be attributedto the smaller size of CdTeQDs into salep-g-PAA biopolymermatrix. Brus has developed a popular effective mass modelthat relates particle size (neglecting spatial correlation effects)to the band gap energy of a semiconductor quantum dot [26]:
𝐸𝑔(QDs) = 𝐸
𝑔(bulk) + ( ℎ
2
8𝑅2)
× (1
𝑚𝑒
+1
𝑚ℎ
) −1.8𝑒2
4𝜋𝜀0𝜀𝑅,
(1)
where 𝐸𝑔is the band gap energy of the quantum dot or bulk
solid, R is the quantum dot radius, m𝑒is the effective mass
of the electron in the solid, mℎis the effective mass of the
hole in the solid, and e is the dielectric constant of the solid.
4 Journal of Chemistry
20nm
(a)
0.0 0.5 1.0 1.5 2.0 2.5 3.0 3.5 4.00
2
4
6
8
10
12
14
16
18
20
Num
ber o
f par
ticle
s
Particle diameter (nm)
(b)
20nm
(c)
0.0 0.5 1.0 1.5 2.0 2.5 3.0 3.50
2
4
6
8
10
12
14
Num
ber o
f par
ticle
s
Particle diameter (nm)
(d)
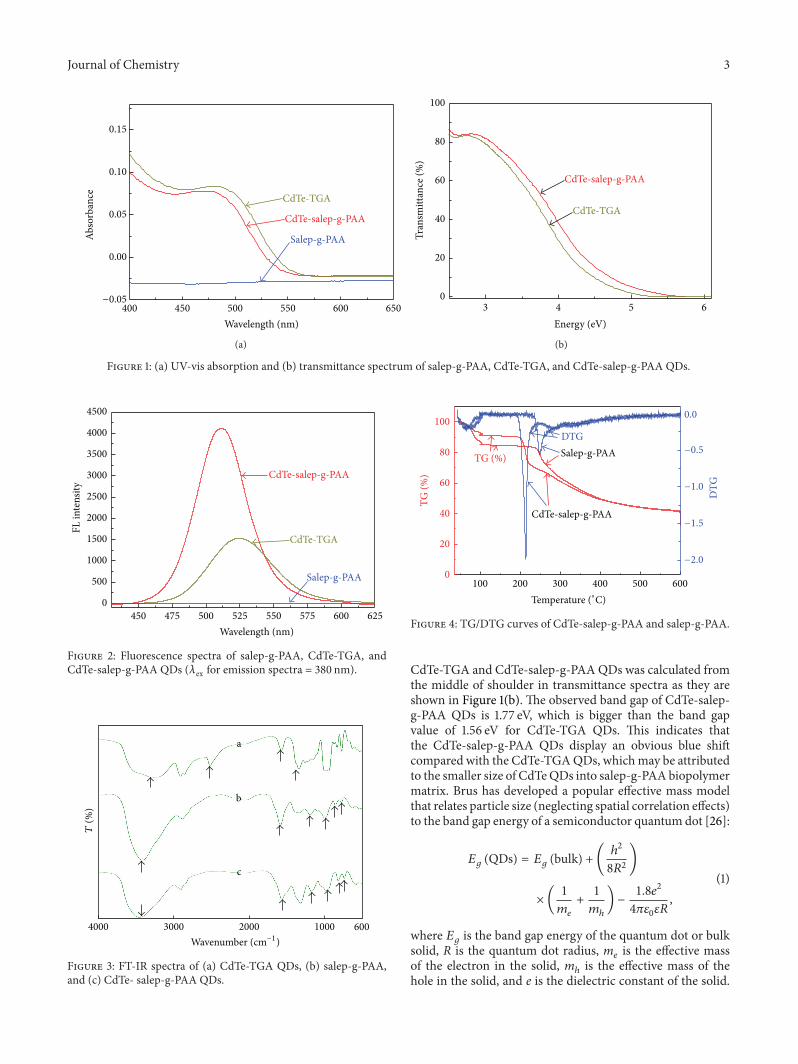
Figure 5: TEM images and the particle size histograms of the (a) and (b) CdTe-TGA QDs and (c) and (d) CdTe-salep-g-PAA QDs.
By taking (1), the average particle diameter of CdTe-TGA andCdTe-salep-g-PAA QDs are estimated as 1.78 and 1.43 nm,respectively.
Figure 2 shows the fluorescence spectra of salep-g-PAA, CdTe-TGA, and CdTe-salep-g-PAA QDs. The excita-tion wavelength was 380 nm. No fluorescence phenomenonwas observed in salep-g-PAA for wavelength ranging from430 nm to 625 nm. Comparing to the CdTe-TGA, the fluo-rescence intensity of CdTe-salep-g-PAA QDs increased andthe emission peak (525 nm) was blue shifted (10 nm). TheQY of the prepared QDs was determined by the comparativemethod, in which rhodamine 6G was used as a referencestandard (QY = 0.90). The absorbance and the integratedfluorescence intensities of five samples of rhodamine 6G andQDs were measured.The slopes of the plot of the absorbanceagainst the integrated fluorescence intensities in water wereobtained and used to calculate the QY according to thefollowing equation:
Φ𝑋= ΦST (
𝑆𝑋
𝑆ST)(𝑛𝑋
𝑛ST)
2
, (2)
where ST and X denote standard (rhodamine 6G) and testsamples, respectively and S is the slope of the line obtainedfrom the plot of the integrated fluorescence intensity versusabsorbance. Φ is QY and n is the refractive index of solvent.TheQY of CdTe-salep-g-PAAQDs was 0.39, which was morethan the QY of CdTe-TGA QDs (0.29). This is because thesalep-g-PAA biopolymer suppressed deep trap emissions bypassivating most of the vacancies and trapping sites on theCdTe QDs surface and resulted in fluorescence dominated byband edge recombination.
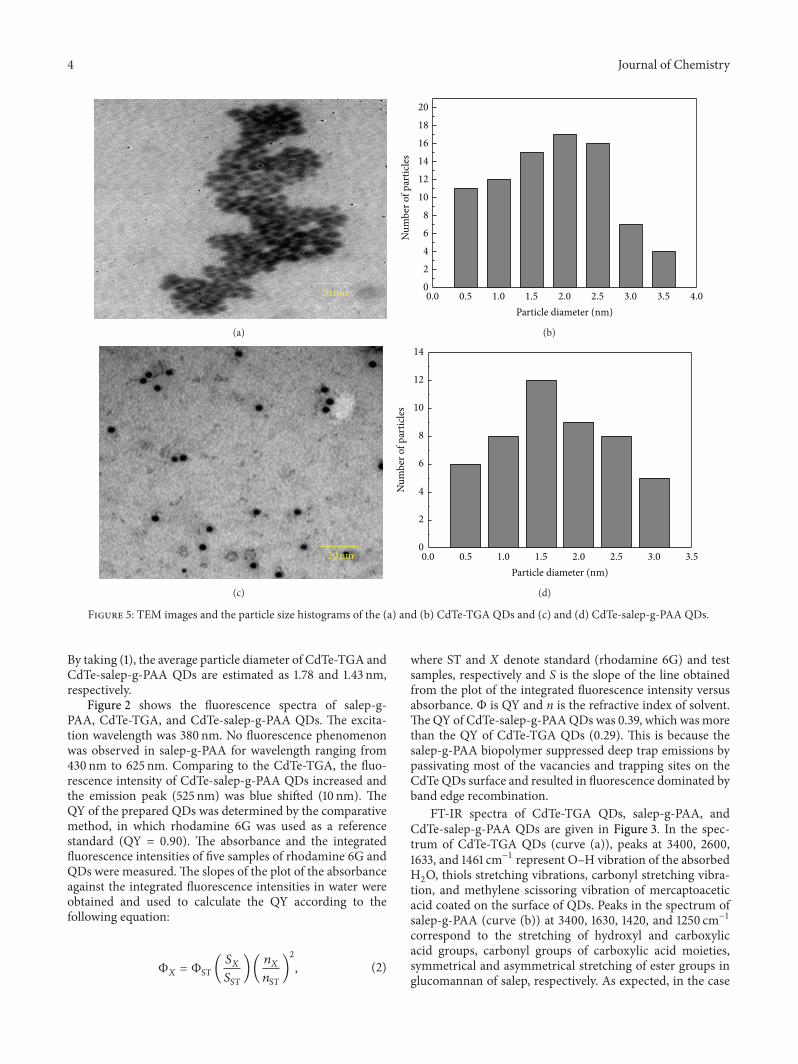
FT-IR spectra of CdTe-TGA QDs, salep-g-PAA, andCdTe-salep-g-PAA QDs are given in Figure 3. In the spec-trum of CdTe-TGA QDs (curve (a)), peaks at 3400, 2600,1633, and 1461 cm−1 represent O–H vibration of the absorbedH2O, thiols stretching vibrations, carbonyl stretching vibra-
tion, and methylene scissoring vibration of mercaptoaceticacid coated on the surface of QDs. Peaks in the spectrum ofsalep-g-PAA (curve (b)) at 3400, 1630, 1420, and 1250 cm−1correspond to the stretching of hydroxyl and carboxylicacid groups, carbonyl groups of carboxylic acid moieties,symmetrical and asymmetrical stretching of ester groups inglucomannan of salep, respectively. As expected, in the case
Journal of Chemistry 5
of the CdTe salep-g-PAA QDs (curve (c)), the characteristicpeaks of CdTe-TGA QDs disappear, and the shape of thespectra is similar to curve (b). However, in the spectrumof CdTe-salep-g-PAA QDs, a little shift in some signals canbe attributed to the chelating of the biopolymer functionalgroups on the surface of QDs.
Figure 4 shows the TG and DTG curves of salep-g-PAAand CdTe-salep-g-PAA in the temperature range from 35 to600∘C. Weight losses of salep-g-PAA occur at two differenttemperatures ranges. The first stage occurs from 35 to 95∘Cwith a weight loss of 17%.The second stage starts from 248∘Cwith a loss of 57%. ForDTG curve of salep-g-PAA, the peak at63∘C in the first range (35 to 95∘C) is resulted from the loss ofwatermolecules adsorbed on salep-g-PAA; whereas, the peakat 248∘C in the second range (248–450∘C) corresponds to thedegradation of salep-g-PAA biopolymer. Compared with theTG curve of salep-g-PAA, there are two obvious alterationsin the TG of CdTe-salep-g-PAA. First, desorption of wateradsorbed in CdTe-salep-g-PAA QDs is shifted to lowertemperature with the introduction of CdTe QDs. There areintermolecular and intramolecular hydrogen bonding whichexisted in the salep-g-PAA. However, this hydrogen bondingmay be broken due to the chelation between CdTe andsalep-g-PAA in solution, leading to the much weaker actionbetweenCdTe-salep-g-PAA andwatermolecules adsorbed inthe obtained QDs. On the other hand, the residual weightsfor raw salep-g-PAA and CdTe-salep-g-PAA QDs are 41 and43wt.%, respectively. Obviously, excess residual componentsfor CdTe-salep-g-PAA indicate that CdTe QDs have beenembedded in salep-g-PAA biopolymer.
Figure 5 provides the TEM images and size distributionsof the CdTe-TGA QDs and CdTe-salep-g-PAA QDs. Asshown in Figure 5, the TEM images illustrate the nearlyspherical and monodispersed CdTe QDs into salep-g-PAAbiopolymer matrix. The diameters of the QDs are estimatedto be 2 nm for the CdTe-TGA QDs and 1.5 nm for CdTe-salep-g-PAA QDs which are in good agreement with theresults obtained from the absorption spectra. Besides, thesmall size of the CdTe-salep-g-PAA QDs would facilitatetheir penetration in biosystems when they have been used asfluorescent biological probes and we will report the in vitrocytotoxicity of CdTe-salep-g-PAA QDs in the near future.
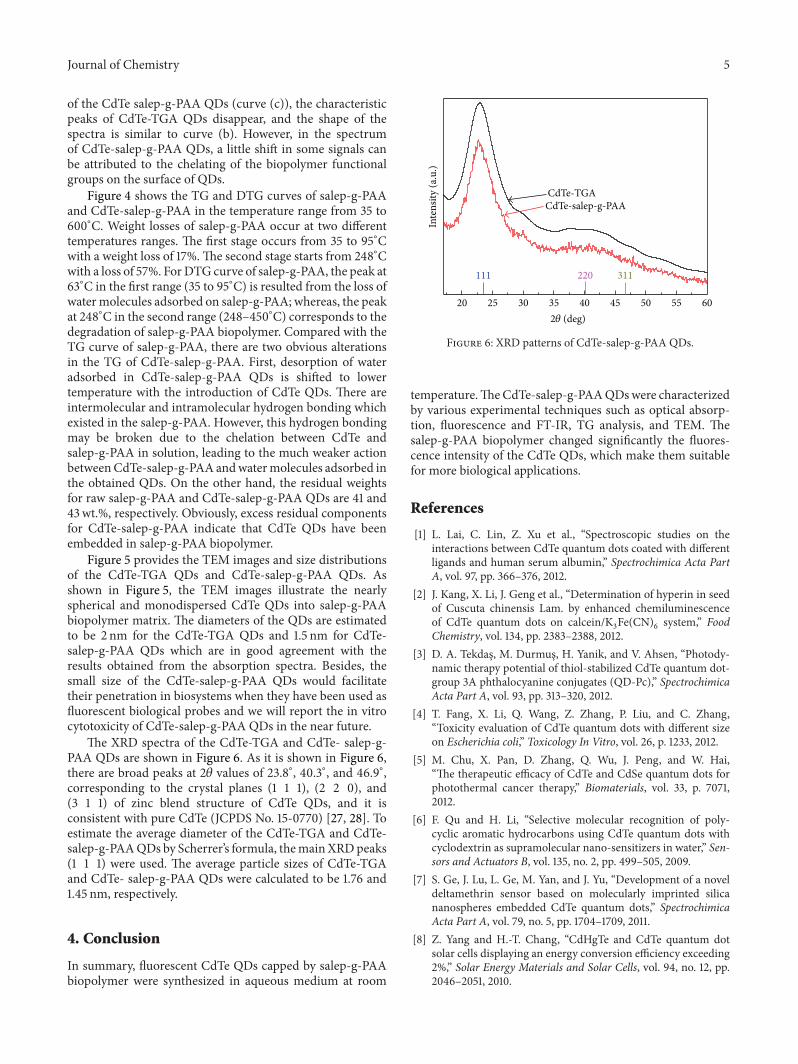
The XRD spectra of the CdTe-TGA and CdTe- salep-g-PAA QDs are shown in Figure 6. As it is shown in Figure 6,there are broad peaks at 2𝜃 values of 23.8∘, 40.3∘, and 46.9∘,corresponding to the crystal planes (1 1 1), (2 2 0), and(3 1 1) of zinc blend structure of CdTe QDs, and it isconsistent with pure CdTe (JCPDS No. 15-0770) [27, 28]. Toestimate the average diameter of the CdTe-TGA and CdTe-salep-g-PAAQDs by Scherrer’s formula, themainXRDpeaks(1 1 1) were used. The average particle sizes of CdTe-TGAand CdTe- salep-g-PAA QDs were calculated to be 1.76 and1.45 nm, respectively.
4. Conclusion
In summary, fluorescent CdTe QDs capped by salep-g-PAAbiopolymer were synthesized in aqueous medium at room
20 25 30 35 40 45 50 55 60
CdTe-salep-g-PAA CdTe-TGA
311220111
Inte
nsity
(a.u
.)
2𝜃 (deg)
Figure 6: XRD patterns of CdTe-salep-g-PAA QDs.
temperature.TheCdTe-salep-g-PAAQDswere characterizedby various experimental techniques such as optical absorp-tion, fluorescence and FT-IR, TG analysis, and TEM. Thesalep-g-PAA biopolymer changed significantly the fluores-cence intensity of the CdTe QDs, which make them suitablefor more biological applications.
References
[1] L. Lai, C. Lin, Z. Xu et al., “Spectroscopic studies on theinteractions between CdTe quantum dots coated with differentligands and human serum albumin,” Spectrochimica Acta PartA, vol. 97, pp. 366–376, 2012.
[2] J. Kang, X. Li, J. Geng et al., “Determination of hyperin in seedof Cuscuta chinensis Lam. by enhanced chemiluminescenceof CdTe quantum dots on calcein/K
3Fe(CN)
6system,” Food
Chemistry, vol. 134, pp. 2383–2388, 2012.[3] D. A. Tekdas, M. Durmus, H. Yanik, and V. Ahsen, “Photody-
namic therapy potential of thiol-stabilized CdTe quantum dot-group 3A phthalocyanine conjugates (QD-Pc),” SpectrochimicaActa Part A, vol. 93, pp. 313–320, 2012.
[4] T. Fang, X. Li, Q. Wang, Z. Zhang, P. Liu, and C. Zhang,“Toxicity evaluation of CdTe quantum dots with different sizeon Escherichia coli,” Toxicology In Vitro, vol. 26, p. 1233, 2012.
[5] M. Chu, X. Pan, D. Zhang, Q. Wu, J. Peng, and W. Hai,“The therapeutic efficacy of CdTe and CdSe quantum dots forphotothermal cancer therapy,” Biomaterials, vol. 33, p. 7071,2012.
[6] F. Qu and H. Li, “Selective molecular recognition of poly-cyclic aromatic hydrocarbons using CdTe quantum dots withcyclodextrin as supramolecular nano-sensitizers in water,” Sen-sors and Actuators B, vol. 135, no. 2, pp. 499–505, 2009.
[7] S. Ge, J. Lu, L. Ge, M. Yan, and J. Yu, “Development of a noveldeltamethrin sensor based on molecularly imprinted silicananospheres embedded CdTe quantum dots,” SpectrochimicaActa Part A, vol. 79, no. 5, pp. 1704–1709, 2011.
[8] Z. Yang and H.-T. Chang, “CdHgTe and CdTe quantum dotsolar cells displaying an energy conversion efficiency exceeding2%,” Solar Energy Materials and Solar Cells, vol. 94, no. 12, pp.2046–2051, 2010.
6 Journal of Chemistry
[9] L. Chen, Z. Qi, R. Chen, Y. Li, and S. Liu, “Sensitive detection ofEpstein-Barr virus-derived latent membrane protein 1 based onCdTe quantum dots-capped silica nanoparticle labels,” ClinicaChimica Acta, vol. 411, no. 23-24, pp. 1969–1975, 2010.
[10] J. Wang and H. Han, “Hydrothermal synthesis of high-qualitytype-II CdTe/CdSe quantum dots with near-infrared fluores-cence,” Journal of Colloid and Interface Science, vol. 351, no. 1,pp. 83–87, 2010.
[11] B. Xing,W.-W. Li, and K. Sun, “A novel synthesis of high qualityCdTe quantum dots with good thermal stability,” MaterialsLetters, vol. 62, no. 17-18, pp. 3178–3180, 2008.
[12] Y.-S. Li, F.-L. Jiang, Q. Xiao et al., “Enhanced photocatalyticactivities of TiO
2nanocomposites doped with water-soluble
mercapto-capped CdTe quantum dots,”Applied Catalysis B, vol.101, no. 1-2, pp. 118–129, 2010.
[13] J. Liu, Z. Shi, Y. Yu, R. Yang, and S. Zuo, “Water-solublemulticolored fluorescent CdTe quantum dots: synthesis andapplication for fingerprint developing,” Journal of Colloid andInterface Science, vol. 342, no. 2, pp. 278–282, 2010.
[14] E. Lee, S. Gwon, Y. Son, and S. Kim, “Optical properties ofphoto- and thermo-responsive aqueous CdTe quantum dots/spironaphthoxazine/poly(N-isopropylacrylamide) hybrid,”Spectrochimica Acta Part A, vol. 97, pp. 806–810, 2012.
[15] T. Zhang, X. Sun, and B. Liu, “Synthesis of positively chargedCdTe quantum dots and detection for uric acid,” SpectrochimicaActa Part A, vol. 79, no. 5, pp. 1566–1572, 2011.
[16] M. A. Jhonsi and R. Renganathan, “Investigations on thephotoinduced interaction of water soluble thioglycolic acid(TGA) capped CdTe quantum dots with certain porphyrins,”Journal of Colloid and Interface Science, vol. 344, no. 2, pp. 596–602, 2010.
[17] Y.-F. Liu and J.-S. Yu, “Selective synthesis of CdTe and highluminescence CdTe/CdS quantum dots: the effect of ligands,”Journal of Colloid and Interface Science, vol. 333, no. 2, pp. 690–698, 2009.
[18] A. Sharma, C. M. Pandey, G. Sumana et al., “Chitosan encapsu-lated quantumdots platform for leukemia detection,”Biosensorsand Bioelectronics, vol. 38, no. 1, pp. 107–113, 2012.
[19] Y. Wang, H. Chen, C. Ye, and Y. Hu, “Synthesis and character-ization of CdTe quantum dots embedded gelatin nanoparticlesvia a two-step desolvation method,” Materials Letters, vol. 62,no. 19, pp. 3382–3384, 2008.
[20] N. Tomczak,D. Janczewski,M.Han, andG. J. Vancso, “Designerpolymer-quantum dot architectures,” Progress in Polymer Sci-ence, vol. 34, no. 5, pp. 393–430, 2009.
[21] K. K. Tekinsen and A. Guner, “Chemical composition andphysicochemical properties of tubera salep produced fromsome Orchidaceae species,” Food Chemistry, vol. 121, no. 2, pp.468–471, 2010.
[22] N. Georgiadis, C. Ritzoulis, E. Charchari, C. Koukiotis, C.Tsioptsias, and C. Vasiliadou, “Isolation, characterization andemulsion stabilizing properties of polysaccharides form orchidroots (salep),” Food Hydrocolloids, vol. 28, no. 1, pp. 68–74, 2012.
[23] A. Pourjavadi, M. e Doulabi, R. Soleyman, S. Sharif, and S.A. Eghtesadi, “Synthesis and characterization of a novel (salepphosphate)-based hydrogel as a carrier matrix for fertilizerrelease,” Reactive and Functional Polymers, vol. 72, no. 10, pp.667–672, 2012.
[24] D. K. Sinha and Y. N. Mohapatra, “Charge trapping andelectroluminescence at quantum dots embedded in a polymermatrix,” Organic Electronics, vol. 13, pp. 1456–1462, 2012.
[25] B. T. Raut, M. A. Chougule, S. Sen, R. C. Pawar, C. S. Lee, andV. B. Patil, “Novel method of fabrication of polyaniline-CdSnanocomposites: structural, morphological and optoelectronicproperties,” Ceramics International, vol. 38, no. 5, pp. 3999–4007, 2012.
[26] W. Trzeciakowski, “Effective-mass approximation in semicon-ductor heterostructures: one-dimensional analysis,” PhysicalReview B, vol. 38, no. 17, pp. 12493–12507, 1988.
[27] G. Gordillo, J. M. Florez, and L. C. Hernandez, “Preparationand characterization of CdTe thin films deposited byCSS,” SolarEnergy Materials and Solar Cells, vol. 37, no. 3-4, pp. 273–281,1995.
[28] Y. Masumoto and K. Sonobe, “Size-dependent energy levels ofCdTe quantumdots,”Physical ReviewB, vol. 56, no. 15, pp. 9734–9737, 1997.

Submit your manuscripts athttp://www.hindawi.com
Hindawi Publishing Corporationhttp://www.hindawi.com Volume 2014
Inorganic ChemistryInternational Journal of
Hindawi Publishing Corporation http://www.hindawi.com Volume 2014
International Journal ofPhotoenergy
Hindawi Publishing Corporationhttp://www.hindawi.com Volume 2014
Carbohydrate Chemistry
International Journal of
Hindawi Publishing Corporationhttp://www.hindawi.com Volume 2014
Journal of
Chemistry
Hindawi Publishing Corporationhttp://www.hindawi.com Volume 2014
Advances in
Physical Chemistry
Hindawi Publishing Corporationhttp://www.hindawi.com
Analytical Methods in Chemistry
Journal of
Volume 2014
Bioinorganic Chemistry and ApplicationsHindawi Publishing Corporationhttp://www.hindawi.com Volume 2014
SpectroscopyInternational Journal of
Hindawi Publishing Corporationhttp://www.hindawi.com Volume 2014
The Scientific World JournalHindawi Publishing Corporation http://www.hindawi.com Volume 2014
Medicinal ChemistryInternational Journal of
Hindawi Publishing Corporationhttp://www.hindawi.com Volume 2014
Chromatography Research International
Hindawi Publishing Corporationhttp://www.hindawi.com Volume 2014
Applied ChemistryJournal of
Hindawi Publishing Corporationhttp://www.hindawi.com Volume 2014
Hindawi Publishing Corporationhttp://www.hindawi.com Volume 2014
Theoretical ChemistryJournal of
Hindawi Publishing Corporationhttp://www.hindawi.com Volume 2014
Journal of
Spectroscopy
Analytical ChemistryInternational Journal of
Hindawi Publishing Corporationhttp://www.hindawi.com Volume 2014
Journal of
Hindawi Publishing Corporationhttp://www.hindawi.com Volume 2014
Quantum Chemistry
Hindawi Publishing Corporationhttp://www.hindawi.com Volume 2014
Organic Chemistry International
ElectrochemistryInternational Journal of
Hindawi Publishing Corporation http://www.hindawi.com Volume 2014
Hindawi Publishing Corporationhttp://www.hindawi.com Volume 2014
CatalystsJournal of