Embed Size (px)
Citation preview

Measuring work preferencesA multidimensional tool to enhance career
self-management
G. Ronald GilbertFlorida International University, Miami, Florida, USA
Ravipreet S. SohiUniversity of Nebraska, Lincoln, Nebraska, USA, and
Adriana G. McEachernFlorida International University, Miami, Florida, USA
Abstract
Purpose – The purpose of this paper is to introduce a multidimensional work preferenceresearch instrument, and to relate scores on these dimensions with subjects’ real world workchoices.
Design/methodology/approach – Repeated samples of 1,002 and 975 adult subjects were used toidentify 17 empirically derived constructs, using both EFA and CFA statistical applications. The CFArevealed measurement invariance among the predicted and measured constructs. The 17 validatedconstructs were culled from career development-related psychology that has variously been identifiedwith learning styles, work interests, work values, and temperament. Using a third sample of 590subjects, MANOVA analyses of work preference scores were conducted with working adults,representing ten different types of work. When the scores on the 17 measures were compared withoccupational choices made by the subjects, significant differences in outcomes were identified,indicating commonality within specific work types.
Research limitations/implications – Because the work preference construct is relatively newand fluid, continuous research is needed to gain greater understanding of the construct and itscharacteristics. Additional sampling and tests for measurement invariance are indicated usingcross-national samples, as well as non-English-speaking languages. Samples from younger,pre-career subjects in secondary schools and representing a wide array of demographiccharacteristics are also needed as the research progresses. In addition, more studies are needed totest for predictive validity, using other unobtrusive performance measures taken at differentpoints in time.
Practical implications – Multiple measures embedded in one tool may prove useful aids to peoplewhen making career choice decisions that are associated with the selection of short-term workplacement, long-term career occupations, and academic fields of study. The development of this toolwill enable career development researchers to examine the relationships of psychological constructsidentified with different fields of psychological measurement, and examine these constructs as theyrelate to classroom, organizational and cross-national contexts.
Originality/value – The creation of a tool consisting of measures from multiple psychological fieldsfor use in short-term career planning, job placement, and enrichment is novel. When combined, themultiple constructs used in this instrument have been found to provide a constellation of usefulindicators that are related to career choice and work placement decisions. The measures are also likelyto be useful in cross-national research contexts.
Keywords Job satisfaction, Personality measurement, Career development, Job enrichment
Paper type Research paper
The current issue and full text archive of this journal is available at
www.emeraldinsight.com/1362-0436.htm
CDI13,1
56
Career Development InternationalVol. 13 No. 1, 2008pp. 56-78q Emerald Group Publishing Limited1362-0436DOI 10.1108/13620430810849542
IntroductionCareer is shifting in concept from the traditional hierarchical, linear, uni-dimensional,and structured form to that which is more self managed, transitional, multi-focused,and without boundaries (Baruch, 2006; Bozionelos, 2001; Harvey and Novicevic, 2006).Changes in career characteristics, and shifts in personal work values throughout one’scareer (Hall, 1996; Patton and McMahan, 1999, p. 182; Smola and Sutton, 2002) compelemployers and workers to be continuously attentive to changing work requirements,new areas of employee skill development, and personal work preferences. Employersshare an interest in understanding employees’ work preferences (Konrad et al., 2000) soas to gain insight about what motivates their workers, and create work environmentsthat will enable their employees to be more productive over time.
Given these changing contexts and continuing challenge to learn what motivatesindividuals on the job, this paper has been written to shed light on the need to identifyone’s work preferences as they relate to one’s suitability for specific workenvironments. Specifically, it introduces the Work Preference Indicator as a new toolto gauge work preferences.
About work preferencesWork preferences are the outcomes individuals desire from their engagement in paidwork (Konrad et al., 2000). They answer the question, “What do I want from the workthat I do?” Or “What do I want my work setting to be like?” (Barker and Kellen, 1998,p. 28). They influence career choice decisions (Brown, 1996) and are criticaldeterminants of job attitudes and work motivation (Brenner et al., 1988). Workpreferences can be used to aid in the understanding of individuals engaged in differenttypes of career related environments (Judge and Ferris, 1992; Kristof-Brown et al., 2005;Werbel and Gilliland, 1999).
The term, “work preference,” is not a tightly defined psychological construct. Itincludes overlapping constructs related to work values (Rounds and Armstrong, 2005;Rowe and Snizek, 1995), job attributes (Konrad et al., 2000), interests (Barrick et al.,2003; Holland, 1997), motivation (Amabile et al., 1994), temperament (McCaulley, 1990),and practical work related considerations (Dowd, 2006). Work preferences influenceshorter-term career choice decisions (Brown, 1996, pp. 337-372). They are said to berelated to job satisfaction (Rounds et al., 1987) and can be used to shed light on theperson-to-work environment fit.
Both employers and careerists have an interest in ensuring that there is a good fitbetween the work environment and one’s psychological characteristics. This has beenconceptualized in the literature as the person-environment (P-E) fit. The P-E fit concept isderived from Lewin’s (1935) person-environment interaction theory. A good fit producespositive individual and organizational outcomes (Sekiguchi, 2006). The closer the fit tothe individual’s job preferences and characteristics of their work environment, thegreater the employee’s work satisfaction (Holland, 1973, p. 9; Rounds et al., 1987), morale,job commitment, and employee productivity (Barrick et al., 2003; McCloy et al., 1994).
Some have suggested that conceptually P-E fit is a complex and multidimensionalconstruct (Jansen and Kristof-Brown, 2006; Law et al., 1998; Sekiguchi, 2006). Variousdimensions of P-E fit have been identified in the literature. These are the person-job (P-J)fit (Edwards, 1991), person-group (P-G) fit (Werbel and Johnson, 2001) and theperson-organization (P-O) fit (Kristof, 1996). The P-J fit matches the knowledge, skills,
Measuring workpreferences
57

and abilities of the person with the job requirements; P-O fit matches the individual withthe characteristics of the organization; and P-G matches individuals with work groups.Studies related to person-to-work environment fit theory demonstrate that individualsvary in their suitability for certain jobs (Simons et al., 2000). Those having specificpsychological characteristics or work preferences are more likely to perform better incertain organizational work environments than are others (Barrick et al., 2003).
Assessing work preferencesCareer related assessment tools provide scientifically based insight about thesuitability of individuals for specific types of work and the best P-E fit for theorganization (Simons et al., 2000). These tools tend to focus on specific areas ofpsychology such as abilities, aptitudes, interests, personality, values, motivation,learning styles, and temperament. Although they are associated with different fields ofpsychology, they are both similar and different from one another (Niles andHarris-Bowlsbey, 2002, p. 65); they are not mutually exclusive.
In the past, many studies have approached person-environment fit from a singleaspect of the work environment (Jansen and Kristof-Brown, 2006), when in reality theindividual responds and reacts to multiple dimensions of the environment, whichwarrant assessment. In this study we introduce a multidimensional tool, the WorkPreference Indicator (WPI), which consists of several constructs drawn from differentfields of psychology that can be used by careerists to help individuals make moreinformed choices about work environments for which they may be better suited.Through the development of this tool we hypothesize that:
H1. Respondents’ ratings on the empirically derived constructs will besignificantly different in terms of: the expressed types of work they wouldprefer and; the type of work environments that they actually select.
If such differentiations are found, they will lend support to the use of the tool forfurther research related to career development and placement dynamics. They will alsosupport the further exploration of the use of the tool to aid individuals who want tolearn more about their work preferences and their own suitability (fit) for jobs that areemerging in highly adaptive and multi skilled organizations.
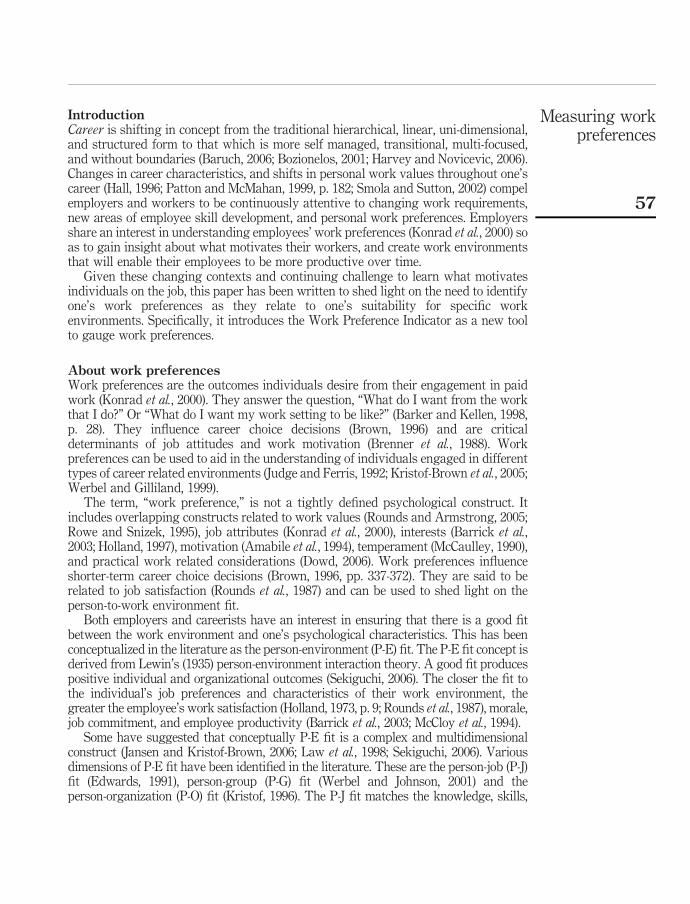
Table I captures some of the more relevant work related psychological assessmentsthat are widely used to enable others to gain insight about their suitability for specificwork related jobs and environments. It was from tools such as these that themultidimensional work preference constructs reported in this paper were selected.
No one tool is suitable for all situations facing careerists and their career coaches.There continues to be a compelling need to build on theories developed in the past,advance them, and create new interventions to meet the changing occupationalcontexts within which careers emerge (Niles and Harris-Bowlsbey, 2002, p. 65). Bybuilding on the strengths of a variety of psychological tools, and combining them intoone instrument consisting of work preference constructs, a broader picture about aperson’s unique characteristics is expected to be developed and can be used byresearchers and others involved in career decision making.
The Work Preference Indicator (WPI) introduced in this study is another effort todevelop a multidimensional tool that can be used to help detect the suitability ofemployees for various work assignments. Rather than administering multiple tools to
CDI13,1
58
Study Focus of study Unique contribution
Rokeach (1973) Values Survey. Developed a valuesmeasurement instrument used to helpwhat people value terminally andinstrumentally
Created an empirically basedquantitative tool to measurework-related values
Super (1970, 1982) Work Values Inventory; WorkImportance StudyUsed to assess the general values aperson seeks to satisfy through variouslife roles
Enlarged understanding of workvalues as they relate to career stageand occupational environments. WISwas cross-national in scope
Holland (1973,1992)
RIASEC. Captured six types ofwork-related personality types. (BigSix): Realistic, investigative, artistic,social, enterprising, conventional
Linked vocational interests to jobfamilies. Identified Big Six measuresthat are associated with “workpersonalities”
Prediger (1976) Identified two work-task dimensions:working with data vs working withideas; working with people vs workingwith things
Found relationships between Holland’shexagonal opposites and his two worktask dimensions
Goldberg (1990,1993)
Big Five personality factors.Extraversion, agreeableness,conscientiousness, neuroticism,openness to experience
Captured the Big Five common factorsin personality measurement. Basedprimarily on factor analyses ofadjectives
Costa and McRae(1992)
NEO Five Factor Inventory. Identifieda hierarchical relationship among theBig Five
Extended Goldberg’s earlier work.Assessed the relationship betweenpersonality factors and careerexploration variables
Myers (1987) MBTI. Developed the Myers-BriggsTemperament Indicator. Measurespsychological types described by Jung.Extroversion-introversion,sensing-intuition; thinking-feeling;judging-perceiving
Created profiles of individuals based ontemperament type. Widely usedpersonality assessment. Includes someassociations with congruent workenvironments
Dunn et al. (1989) Identified dimensions to the study oflearning styles and associated themwith student performance
Identified individual preferences to useof physical senses (auditory, visual,and kinesthetic) to learn
Rounds et al. (1981) Minnesota Importance Questionnaire.Developed six broad factors related towork values: Achievement, comfort,status, altruism, safety, and autonomy
Provided useful guides to anindividual’s work-related values andoccupational environments
Amabile et al.(1994)
Work Preference Inventory. Measuresintrinsic and extrinsic motivationalfactors. Related to work and studentperformance
Identified life course decisions based onindividual motivational orientation.Captured work preferences, especiallyas they relate to creativity
Dowd (2006) Work Preference Match. Includesmultiple measures related topsychological temperament, worktasks, types of supervision,compensation, work culture
Emphasized a multi-dimensional focus.Enables career deciders to relate theirown skills, interests, needs and abilitiesto career options – targeted for thosehaving a change in life circumstance ordisability
Table I.Summary of key
person-environment fitcontributions
Measuring workpreferences
59

assess selected values, temperament, interests, and learning styles, the WPI can beused to gain reading of an individual’s preferences in one relatively succinct tool. Itmeasures key constructs that cut across other well-known psychological models likethose presented in Table I. It also makes possible readily available researchopportunities to compare the relationships of these constructs with one another andwith other factors of interest related to the person-to-work environment fit. As an aid tocareerists, it is not intended to replace the extensive work of Strong (Harmon et al.,1994), Holland (1992), Goldberg (1993), Myers (1987) and other tools that are used toprovide longer term occupational guidance. Rather, it is intended to build on others’contributions and provide relatively easy to generate and valid information that mayguide those interested in shorter term decisions related to on-the-job work placement.
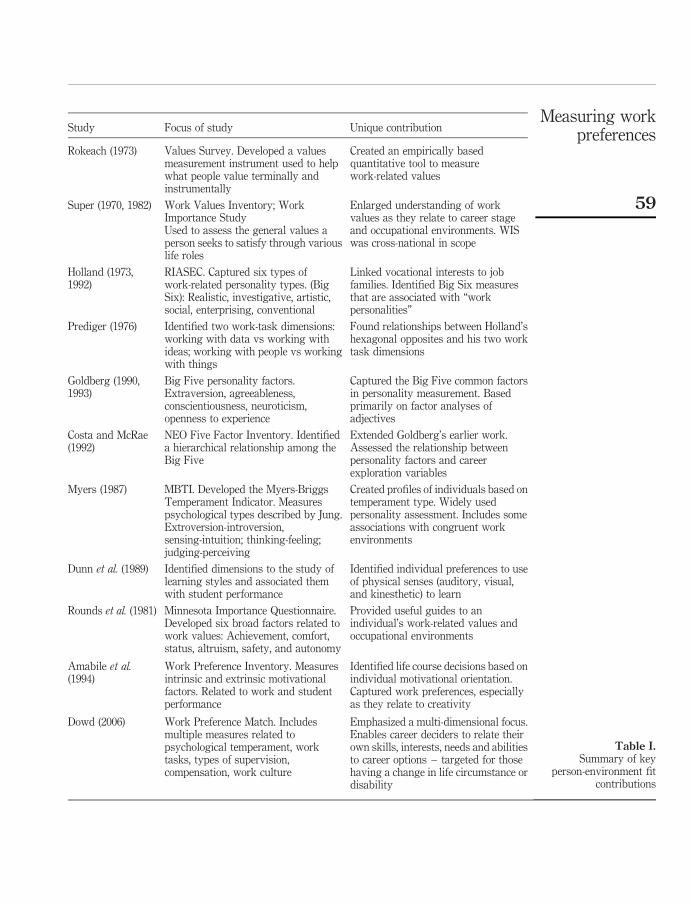
Rationale for the development of the WPIThe WPI was created to fill a gap that was recognized by academic researchers andpractitioners seeking to gain easy-to-use and quick to gauge constructs that pertain toindividual work preferences and their relationship with specific types of work. (Seemethodology section of this paper.) Table II lists the 17 constructs nested in the WPI,along with a short definition and the key conceptual anchors associated with each.
The development of the Work Preference Indicator (WPI)The WPI is a selected response-type instrument consisting of 75 statements derivedfrom well-established constructs associated with career psychology. (See examples ofstatements in Table III.) As shown in Table II, the constructs included in the WPI weredrawn from several different psychological fields. These psychological fields are notmutually exclusive, but represent areas of emphasis employed in psychological testing.
MethodologyWhen developing the instrument, four distinct stages were employed:
(1) conceptualization of the constructs and scale development;
(2) preliminary testing;
(3) establishing reliability, validity and dimensionality; and
(4) retesting and validation of the scale.
For each stage, we used a different sample of respondents to develop/test the scale.
Conceptualization of the constructs and scale developmentFollowing a review of relevant literature from multiple psychological disciplines, wegenerated a list of constructs thought to be potentially useful as aids to help guideindividuals to more suitable work environments.
To verify the relevancy of these constructs, we sought the expert counsel of aprofessional employed by a large employee development center that serves tens ofthousands of employees annually. This professional had used over 40 differentpsychological work related assessment tools in his own work with adults and had agood working understanding of the relative utility of each. He was asked: “Whatinformation would you want to have about an individual’s work preferences in order tohelp you coach or place them in jobs where they would be best suited?” From his
CDI13,1
60

WPI psychological areaof study and construct Definition: prefers to Conceptual anchors
Learning styles:Aurally learning (AURL) Learn at work through open
discussions with others; and others’aural explanations
Individuals process and understandinformation differently (Andersonand Adams, 1992; Fazarro andStevens, 2004) identified aural andvisual learning styles; Dewaele andFurnham (1999) reported arelationship between visual withintroversion; aural withextraversion
Written learning (WRIT) Learn at work by reading writtenmaterial, computers, and othersources of visual information
Work valuesWork independence(INDE)
Work independently and make one’sown decisions; have a lot ofautonomy at work
Douglas and Shepard (2002);Rounds et al. (1981) identified desirefor some to make their owndecisions and work independently
Want to be likeable(LKBL)
Be well liked at work and get alongwell with others. Seeks to be valuedby others at work
Hogan and Hogan (1992) capturedthe value shared by some workers tobe respected and liked by others inthe workplace
Work with others inteams (TEAM)
Work with others to get the workdone; be an effective team player; bean integral part of a high-performingteam; share success with others on awork team
Dunn and Dunn (1999) captured thevalue some employees have forteam-based work
Job fulfillment (JFUL) Have a personally satisfying job; dowork that one feels is important andmeaningful
Amabile et al. (1994) and Malka andChatman (2003) identified the needemployees have for intrinsic rewardand meaning from the work they do
Career ladder (CLAD) Have a clearly defined career ladderspelled out by the organization;know one’s own career potential inthe organization; move up withinthe system
Employees vary in their value forupward mobility within theorganization (Cox and Cooper, 1989;Judge et al., 1995)
Achieve results (RSLT) Achieve results on the job; beeffective at doing one’s work andcontribute to the overall success ofthe organization
McClelland (1985) identified thevalue some employees have to getresults through their work. TheFFM (Costa and McCrae, 1992)includes this as Conscientiousness
Work interests:Helpful to others (HELP) Help others at work; care for others;
be a coach for them; and be ofservice to those with whom theywork
Holland’s (1992) Social; Costa andMcRae’s (1992) Agreeableness; andPrediger’s (1976) People constructsprovide the framework for thismeasure
(continued )
Table II.The 17 constructs
included in the WorkPreference Indicator
Measuring workpreferences
61
responses, we identified 16 constructs that were relevant, and created an initial 77-itemLikert scale representing these constructs. To establish face validity, we tested theinstrument with a pilot sample of 110 students in four college classes and 70 workingadults who were attendees at employee development workshops. The pilot test did not
WPI psychological areaof study and construct Definition: prefers to Conceptual anchors
Work with data (DATA) Work with data; analyze numbers;keep data records
Prediger’s (1976) Data and Holland’s(1992) Conventional and Realisticconstructs provide support for thismeasure
Work with mechanicalthings (MECH)
Work with, study about, build,and/or repair things
Prediger’s (1976) Things, Holland’s(1992) Realistic, constructs providethe conceptual foundation for thismeasure
Work with factualinformation (FACT)
Work with concrete information;study factual information, retain it,and use it at work
The foundation for this construct isassociated with the Conventionalinterest of Holland (1992). It has notbeen specifically identified ininterest literature
Lead others (LEAD) Lead others; be in charge of others;be responsible for the work of ateam; take charge of others
Chan and Drasgow (2001) analyzedthe motivation to lead others. Thismeasure parallels theirAffective-Identity scale ofleadership. It also is similar toMcClelland’s (McClelland andBoyatzis, 1982) Power construct ofmotivation
Personality temperament:Focus on task specificinformation (TASC)
Have clear guidance from others sothey know what is expected of themat work; have helpful training andspecific instructions when taking ona new task
The MBTI (McCaulley, 1990)includes the construct related toSensing. Part of that constructincludes one’s propensity for detailand specific information
Explore ideas (IDEA) Think in terms of ideas andpossibilities; work with conceptsand theories; generate knowledgethrough creative thinking andresearch
The MBTI (McCaulley, 1990)identifies Intuition as an indicator ofone’s attraction to theory andcreativity. The IDEA construct isalso linked to Holland’s (1992)Artistic and Investigativeconstructs
Time management(TIMM)
Have one’s daily work life wellorganized; have daily activitiesplanned ahead of time
Judging is one of four polar oppositeconstructs in the MBTI (McCaulley,1990). It captures one’s need fororganization and predictability
Flexibility (FLEX) Have a lot of personal freedom onthe job; do things without a rigidschedule; work spontaneouslyrather than having one’s work lifewell defined
Perceiving is opposite of Judging inthe MBTI (McCaulley, 1990). Itrefers to one’s need for spontaneityand flexibility. Unlike the MBTI, thetwo constructs in the WPI are notpolar oppositesTable II.
CDI13,1
62

yield any major change to the 16 constructs selected, but did result in some minorchanges in the wording of some of the statements used in the scales.
Preliminary scale testingTo do a preliminary check of the reliability and dimensionality of the scale, we selecteda convenience sample of 783 working adults and 219 college seniors. The workingadults included federal managers and Air Force logisticians (201), municipal andcounty workers (128), welding instructors (19), telephone center supervisors (23),production engineers (84), public mail service employees (57), homecare employees (30),pharmaceutical unit workers (15), Native American organization workers (40), andco-workers of seniors majoring in business who were also gainfully employed (186). Allrespondents participated voluntarily. The college students in the study sample wereseniors majoring in business and attending a large urban university in the USA.
Using this sample, we conducted an Exploratory Factor Analysis (EFA) principalcomponents and varimax rotation. The EFA revealed 16 factors reflecting theoriginally conceptualized constructs, each having eigenvalues greater than 1.0, anditem loadings of 0.60 or higher. No scale items were split loaded with another constructat 0.35 or higher. All 16 constructs had a minimum Cronbach alpha reliability of 0.70(Nunnally and Bernstein, 1994, pp. 264-265).
Of the 77 items that were intended to load on the 16 factors, six variables weredropped because they did not load according to the pre-established standards, orreduced the reliability of a construct, if included. This resulted in a reduction of scaleitems from 77 to 71 that comprised the 16 constructs. Slight wording modificationswere made to some statements in the questionnaire for the purpose of purifying thescales and improving face validity and content validity on a few of the constructs.
A meeting was then held with seven professionals from the same employeedevelopment center. They were interviewed together as a panel to review the structureand theoretical bases of the new WPI, its constructs, and to obtain their opinionsregarding the practicality and utility of the 16 WPI constructs. That meeting served toconfirm the adjudged practicality of the constructs. It yielded a recommendation toconsider adding one more measure pertaining to one’s preference for gathering andretaining factual information. Thus, four new statements were added to the
SD D N A SA
At work it is very important for me to: 1 2 3 4 5Be part of a successful teamIn my job, it is very important for me to be able to: 1 2 3 4 5Care for othersHelp othersAt work, I strongly prefer to learn from: 1 2 3 4 5Written instructionsManuals that I can studyAt work I most prefer to: 1 2 3 4 5Study how things workRepair thingsAnalyze numbersStudy data
Table III.Sample of questionnaire
items
Measuring workpreferences
63

questionnaire, with the expectation that they would measure one’s preference forfactual information.
Confirming reliability, validity and dimensionality of scaleAfter the preliminary scale testing and modification, we conducted a follow-up studybased on a sample of 975 seniors enrolled in randomly selected classes in a large urbanuniversity in the USA, consisting of a broadly diverse student population. The use ofcollege students in this study was approved by a university Institutional Review Boardfor the use of human subjects. The sample included senior level students majoring inaccounting (115), finance (141), information technology (92), management andinternational business (154), marketing (112), nursing (83), criminal justice (29),advertising (119), public relations (20), hospitality management (73) and “other” (37).The students’ average age was 27 years.
The purpose of this follow-up study was to:. verify the reliability of the revised scale;. confirm the factor structure and dimensionality through a Confirmatory Factor
Analysis (CFA) procedure;. establish discriminant and convergent validity; and. verify concurrent validity by testing for significant relationships between the
scale constructs/dimensions and the job preferences of the students.
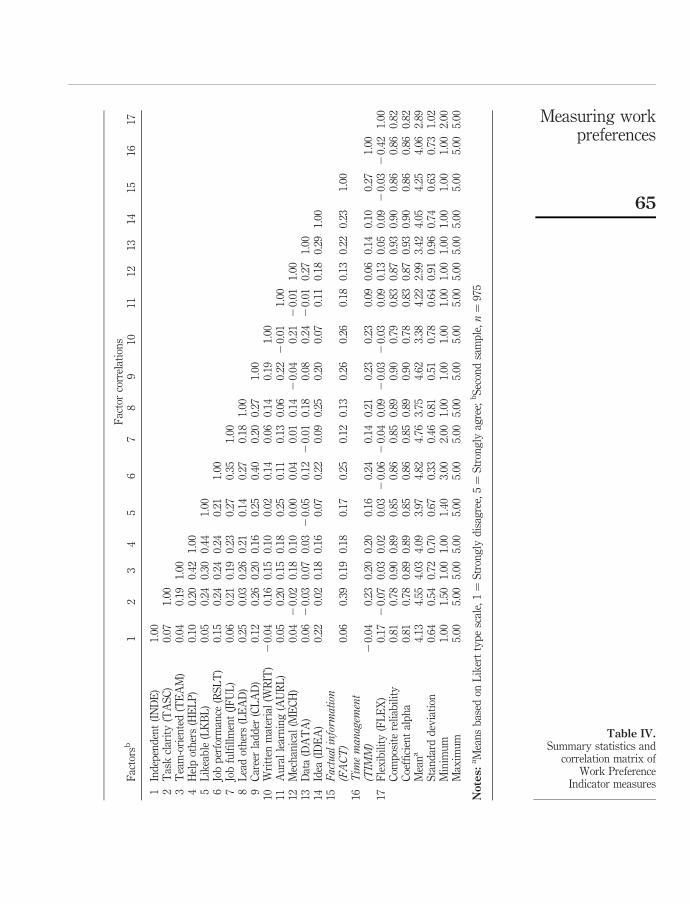
Evidence of reliability: Using the data from the two samples, reliability of the constructswas assessed two ways. First, we examined the item-to-total correlations for each of the17 constructs, and computed their Cronbach coefficient alphas.
The Cronbach alpha scale reliability scores of these 17 constructs ranged from 0.78to 0.93. For two constructs, they were 0.78 and 0.79; all others ranged between 0.83 and0.93. Second, we computed the composite reliability of each construct factor using thestandardized loadings obtained through the Confirmatory Factor Analysis (CFA)procedure described next. Table IV shows the summary statistics, correlations,Cronbach coefficient alphas and the composite reliabilities for the 17 constructs. Bothsets of reliability scores are very similar to each other and exceed the norm of 0.70recommended for early stages of research (Nunnally and Bernstein, 1994, pp. 264-265).
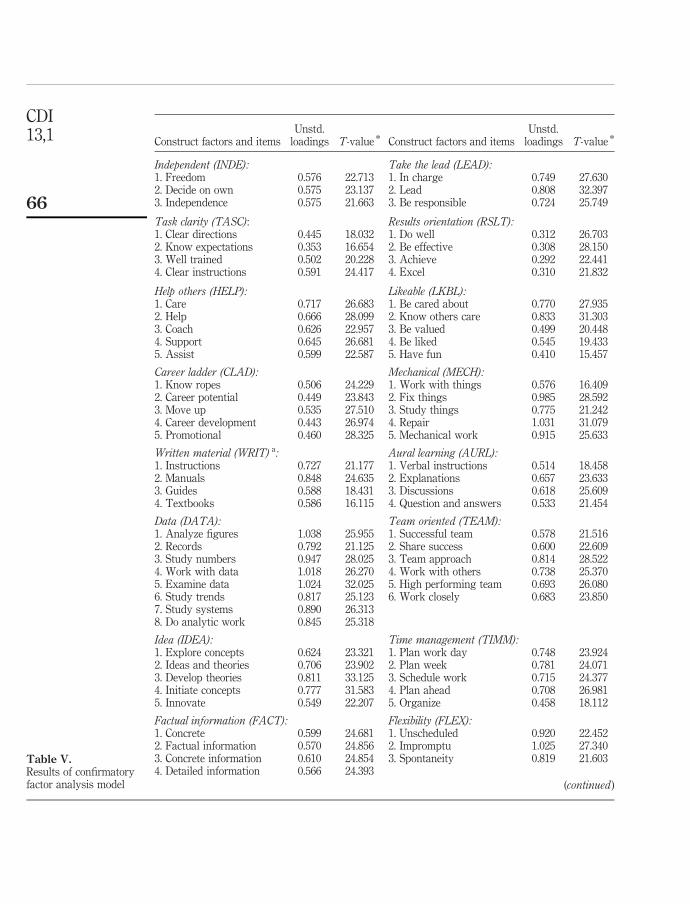
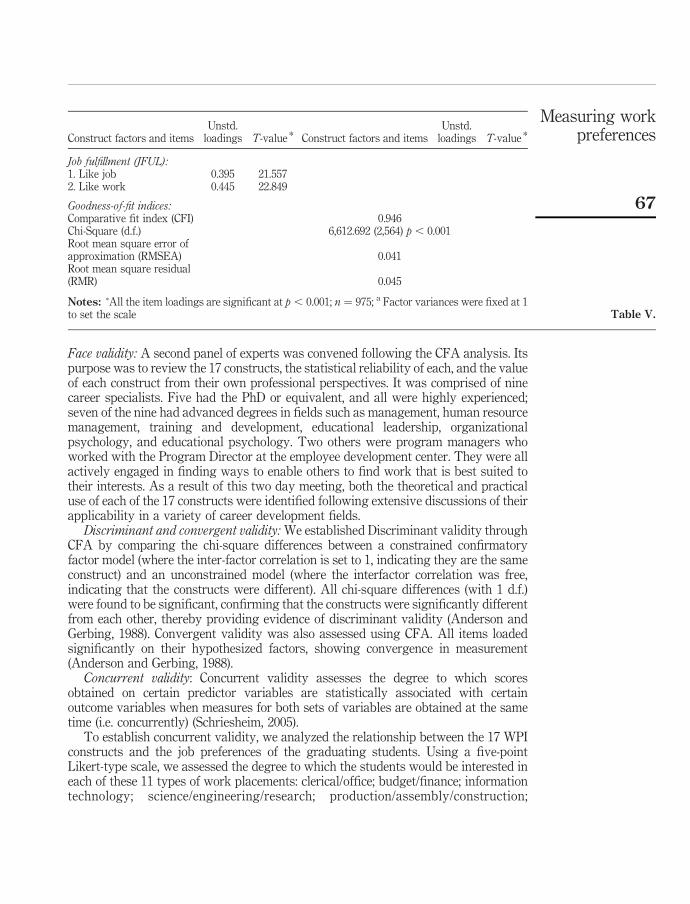
Confirmatory factor analysis: To verify the dimensionality of the scale, weconducted a CFA using Gerbing and Anderson’s (1988) statistical procedure based onstructural equation modeling theory with EQS software. Given the sample size(N ¼ 975), we had enough power to run a CFA model with all 17 factorssimultaneously. All items loaded significantly (p , 0.001) on their hypothesizedfactors. The model had a comparative fit index (CFI) of 0.946. The chi-square was6612.692 (2564 d.f.) ( p , 0.001), which is expected for a model of this size. The rootmean square residual (RMR) was 0.045. The root mean square error of approximation(RMSEA) is 0.041. All these statistics indicated that the CFA model fit the data well(Mulaik et al., 1989). To test for gender related differences, we used Multi-Group LatentVariable Structural Equation modeling, also with EQS. Our analyses showed constructequivalency across the two groups and no significant differences between the men andwomen. Table V provides a detailed summary of the tests for the CFA.
CDI13,1
64
Fac
tor
corr
elat
ion
sF
acto
rsb
12
34
56
78
910
1112
1314
1516
17
1In
dep
end
ent
(IN
DE
)1.
002
Tas
kcl
arit
y(T
AS
C)
0.07
1.00
3T
eam
-ori
ente
d(T
EA
M)
0.04
0.19
1.00
4H
elp
oth
ers
(HE
LP
)0.
100.
200.
421.
005
Lik
eab
le(L
KB
L)
0.05
0.24
0.30
0.44
1.00
6Jo
bp
erfo
rman
ce(R
SL
T)
0.15
0.24
0.24
0.24
0.21
1.00
7Jo
bfu
lfill
men
t(J
FU
L)
0.06
0.21
0.19
0.23
0.27
0.35
1.00
8L
ead
oth
ers
(LE
AD
)0.
250.
030.
260.
210.
140.
270.
181.
009
Car
eer
lad
der
(CL
AD
)0.
120.
260.
200.
160.
250.
400.
200.
271.
0010
Wri
tten
mat
eria
l(W
RIT
)2
0.04
0.16
0.15
0.10
0.02
0.14
0.06
0.14
0.19
1.00
11A
ura
lle
arn
ing
(AU
RL
)0.
050.
200.
150.
180.
250.
110.
130.
060.
222
0.01
1.00
12M
ech
anic
al(M
EC
H)
0.04
20.
020.
180.
100.
000.
040.
010.
142
0.04
0.21
20.
011.
0013
Dat
a(D
AT
A)
0.06
20.
030.
070.
032
0.05
0.12
20.
010.
180.
080.
242
0.01
0.27
1.00
14Id
ea(I
DE
A)
0.22
0.02
0.18
0.16
0.07
0.22
0.09
0.25
0.20
0.07
0.11
0.18
0.29
1.00
15Factualinform
ation
(FACT)
0.06
0.39
0.19
0.18
0.17
0.25
0.12
0.13
0.26
0.26
0.18
0.13
0.22
0.23
1.00
16Tim
emanagement
(TIM
M)
20.
040.
230.
200.
200.
160.
240.
140.
210.
230.
230.
090.
060.
140.
100.
271.
0017
Fle
xib
ilit
y(F
LE
X)
0.17
20.
070.
030.
020.
032
0.06
20.
040.
092
0.03
20.
030.
090.
130.
050.
092
0.03
20.
421.
00C
omp
osit
ere
liab
ilit
y0.
810.
780.
900.
890.
850.
860.
850.
890.
900.
790.
830.
870.
930.
900.
860.
860.
82C
oeffi
cien
tal
ph
a0.
810.
780.
890.
890.
850.
860.
850.
890.
900.
780.
830.
870.
930.
900.
860.
860.
82M
ean
a4.
134.
554.
034.
093.
974.
824.
763.
754.
623.
384.
222.
993.
424.
054.
254.
062.
89S
tan
dar
dd
evia
tion
0.64
0.54
0.72
0.70
0.67
0.33
0.46
0.81
0.51
0.78
0.64
0.91
0.96
0.74
0.63
0.73
1.02
Min
imu
m1.
001.
501.
001.
001.
403.
002.
001.
001.
001.
001.
001.
001.
001.
001.
001.
002.
00M
axim
um
5.00
5.00
5.00
5.00
5.00
5.00
5.00
5.00
5.00
5.00
5.00
5.00
5.00
5.00
5.00
5.00
5.00
Notes:
aM
ean
sb
ased
onL
iker
tty
pe
scal
e,1¼
Str
ong
lyd
isag
ree,
5¼
Str
ong
lyag
ree;
bS
econ
dsa
mp
le,n¼
975
Table IV.Summary statistics and
correlation matrix ofWork Preference
Indicator measures
Measuring workpreferences
65
Construct factors and itemsUnstd.
loadings T-value * Construct factors and itemsUnstd.
loadings T-value *
Independent (INDE): Take the lead (LEAD):1. Freedom 0.576 22.713 1. In charge 0.749 27.6302. Decide on own 0.575 23.137 2. Lead 0.808 32.3973. Independence 0.575 21.663 3. Be responsible 0.724 25.749
Task clarity (TASC): Results orientation (RSLT):1. Clear directions 0.445 18.032 1. Do well 0.312 26.7032. Know expectations 0.353 16.654 2. Be effective 0.308 28.1503. Well trained 0.502 20.228 3. Achieve 0.292 22.4414. Clear instructions 0.591 24.417 4. Excel 0.310 21.832
Help others (HELP): Likeable (LKBL):1. Care 0.717 26.683 1. Be cared about 0.770 27.9352. Help 0.666 28.099 2. Know others care 0.833 31.3033. Coach 0.626 22.957 3. Be valued 0.499 20.4484. Support 0.645 26.681 4. Be liked 0.545 19.4335. Assist 0.599 22.587 5. Have fun 0.410 15.457
Career ladder (CLAD): Mechanical (MECH):1. Know ropes 0.506 24.229 1. Work with things 0.576 16.4092. Career potential 0.449 23.843 2. Fix things 0.985 28.5923. Move up 0.535 27.510 3. Study things 0.775 21.2424. Career development 0.443 26.974 4. Repair 1.031 31.0795. Promotional 0.460 28.325 5. Mechanical work 0.915 25.633
Written material (WRIT) a: Aural learning (AURL):1. Instructions 0.727 21.177 1. Verbal instructions 0.514 18.4582. Manuals 0.848 24.635 2. Explanations 0.657 23.6333. Guides 0.588 18.431 3. Discussions 0.618 25.6094. Textbooks 0.586 16.115 4. Question and answers 0.533 21.454
Data (DATA): Team oriented (TEAM):1. Analyze figures 1.038 25.955 1. Successful team 0.578 21.5162. Records 0.792 21.125 2. Share success 0.600 22.6093. Study numbers 0.947 28.025 3. Team approach 0.814 28.5224. Work with data 1.018 26.270 4. Work with others 0.738 25.3705. Examine data 1.024 32.025 5. High performing team 0.693 26.0806. Study trends 0.817 25.123 6. Work closely 0.683 23.8507. Study systems 0.890 26.3138. Do analytic work 0.845 25.318
Idea (IDEA): Time management (TIMM):1. Explore concepts 0.624 23.321 1. Plan work day 0.748 23.9242. Ideas and theories 0.706 23.902 2. Plan week 0.781 24.0713. Develop theories 0.811 33.125 3. Schedule work 0.715 24.3774. Initiate concepts 0.777 31.583 4. Plan ahead 0.708 26.9815. Innovate 0.549 22.207 5. Organize 0.458 18.112
Factual information (FACT): Flexibility (FLEX):1. Concrete 0.599 24.681 1. Unscheduled 0.920 22.4522. Factual information 0.570 24.856 2. Impromptu 1.025 27.3403. Concrete information 0.610 24.854 3. Spontaneity 0.819 21.6034. Detailed information 0.566 24.393
(continued )
Table V.Results of confirmatoryfactor analysis model
CDI13,1
66
Face validity: A second panel of experts was convened following the CFA analysis. Itspurpose was to review the 17 constructs, the statistical reliability of each, and the valueof each construct from their own professional perspectives. It was comprised of ninecareer specialists. Five had the PhD or equivalent, and all were highly experienced;seven of the nine had advanced degrees in fields such as management, human resourcemanagement, training and development, educational leadership, organizationalpsychology, and educational psychology. Two others were program managers whoworked with the Program Director at the employee development center. They were allactively engaged in finding ways to enable others to find work that is best suited totheir interests. As a result of this two day meeting, both the theoretical and practicaluse of each of the 17 constructs were identified following extensive discussions of theirapplicability in a variety of career development fields.
Discriminant and convergent validity: We established Discriminant validity throughCFA by comparing the chi-square differences between a constrained confirmatoryfactor model (where the inter-factor correlation is set to 1, indicating they are the sameconstruct) and an unconstrained model (where the interfactor correlation was free,indicating that the constructs were different). All chi-square differences (with 1 d.f.)were found to be significant, confirming that the constructs were significantly differentfrom each other, thereby providing evidence of discriminant validity (Anderson andGerbing, 1988). Convergent validity was also assessed using CFA. All items loadedsignificantly on their hypothesized factors, showing convergence in measurement(Anderson and Gerbing, 1988).
Concurrent validity: Concurrent validity assesses the degree to which scoresobtained on certain predictor variables are statistically associated with certainoutcome variables when measures for both sets of variables are obtained at the sametime (i.e. concurrently) (Schriesheim, 2005).
To establish concurrent validity, we analyzed the relationship between the 17 WPIconstructs and the job preferences of the graduating students. Using a five-pointLikert-type scale, we assessed the degree to which the students would be interested ineach of these 11 types of work placements: clerical/office; budget/finance; informationtechnology; science/engineering/research; production/assembly/construction;
Construct factors and itemsUnstd.
loadings T-value * Construct factors and itemsUnstd.
loadings T-value *
Job fulfillment (JFUL):1. Like job 0.395 21.5572. Like work 0.445 22.849
Goodness-of-fit indices:Comparative fit index (CFI) 0.946Chi-Square (d.f.) 6,612.692 (2,564) p , 0.001Root mean square error ofapproximation (RMSEA) 0.041Root mean square residual(RMR) 0.045
Notes: *All the item loadings are significant at p , 0.001; n ¼ 975; a Factor variances were fixed at 1to set the scale Table V.
Measuring workpreferences
67
maintenance/repair; marketing; social/health services; homemaking; creative arts; andmanagement. These two measures (WPI constructs and work placement preferences)were assessed at the same time. The 11 types of work placements were selectedbecause they were representative of a broad range of occupational environments andwere assumed to be readily recognizable to most adults over 18 years of age.
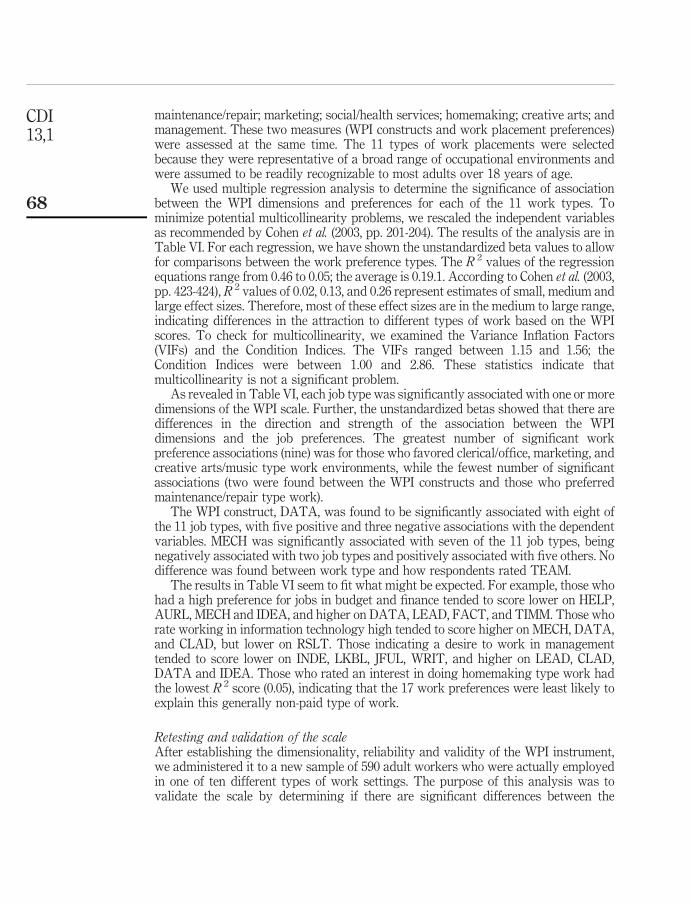
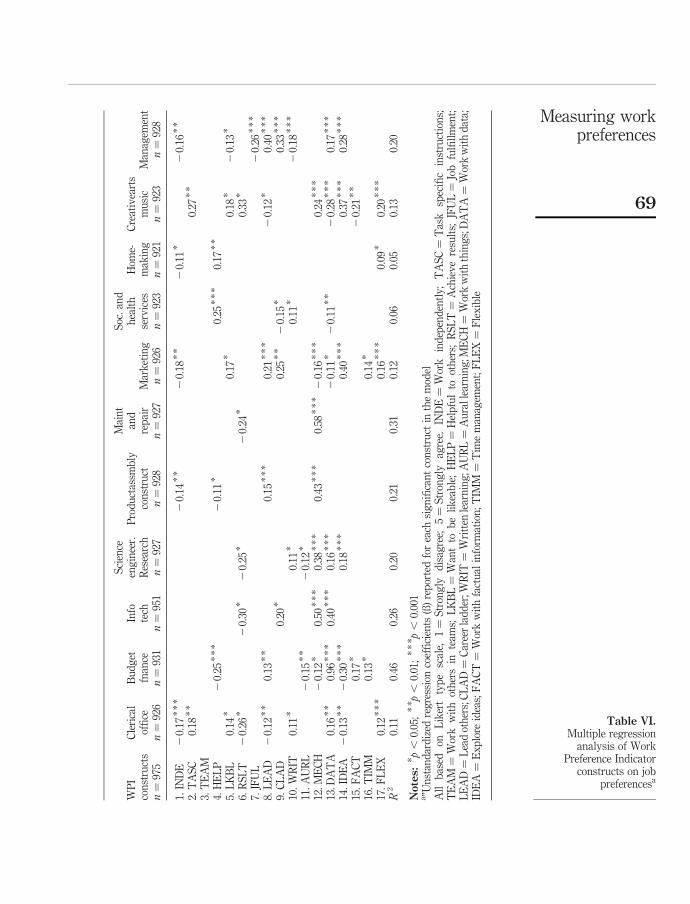
We used multiple regression analysis to determine the significance of associationbetween the WPI dimensions and preferences for each of the 11 work types. Tominimize potential multicollinearity problems, we rescaled the independent variablesas recommended by Cohen et al. (2003, pp. 201-204). The results of the analysis are inTable VI. For each regression, we have shown the unstandardized beta values to allowfor comparisons between the work preference types. The R 2 values of the regressionequations range from 0.46 to 0.05; the average is 0.19.1. According to Cohen et al. (2003,pp. 423-424), R 2 values of 0.02, 0.13, and 0.26 represent estimates of small, medium andlarge effect sizes. Therefore, most of these effect sizes are in the medium to large range,indicating differences in the attraction to different types of work based on the WPIscores. To check for multicollinearity, we examined the Variance Inflation Factors(VIFs) and the Condition Indices. The VIFs ranged between 1.15 and 1.56; theCondition Indices were between 1.00 and 2.86. These statistics indicate thatmulticollinearity is not a significant problem.
As revealed in Table VI, each job type was significantly associated with one or moredimensions of the WPI scale. Further, the unstandardized betas showed that there aredifferences in the direction and strength of the association between the WPIdimensions and the job preferences. The greatest number of significant workpreference associations (nine) was for those who favored clerical/office, marketing, andcreative arts/music type work environments, while the fewest number of significantassociations (two were found between the WPI constructs and those who preferredmaintenance/repair type work).
The WPI construct, DATA, was found to be significantly associated with eight ofthe 11 job types, with five positive and three negative associations with the dependentvariables. MECH was significantly associated with seven of the 11 job types, beingnegatively associated with two job types and positively associated with five others. Nodifference was found between work type and how respondents rated TEAM.
The results in Table VI seem to fit what might be expected. For example, those whohad a high preference for jobs in budget and finance tended to score lower on HELP,AURL, MECH and IDEA, and higher on DATA, LEAD, FACT, and TIMM. Those whorate working in information technology high tended to score higher on MECH, DATA,and CLAD, but lower on RSLT. Those indicating a desire to work in managementtended to score lower on INDE, LKBL, JFUL, WRIT, and higher on LEAD, CLAD,DATA and IDEA. Those who rated an interest in doing homemaking type work hadthe lowest R 2 score (0.05), indicating that the 17 work preferences were least likely toexplain this generally non-paid type of work.
Retesting and validation of the scaleAfter establishing the dimensionality, reliability and validity of the WPI instrument,we administered it to a new sample of 590 adult workers who were actually employedin one of ten different types of work settings. The purpose of this analysis was tovalidate the scale by determining if there are significant differences between the
CDI13,1
68
WP
Ico
nst
ruct
sC
leri
cal
offi
ceB
ud
get
fnan
ceIn
fote
ch
Sci
ence
eng
inee
r.R
esea
rch
Pro
du
ctas
smb
lyco
nst
ruct
Mai
nt
and
rep
air
Mar
ket
ing
Soc
.an
dh
ealt
hse
rvic
esH
ome-
mak
ing
Cre
ativ
eart
sm
usi
cM
anag
emen
tn¼
975
n¼
926
n¼
931
n¼
951
n¼
927
n¼
928
n¼
927
n¼
926
n¼
923
n¼
921
n¼
923
n¼
928
1.IN
DE
20.
17*
**
20.
14*
*2
0.18
**
20.
11*
20.
16*
*
2.T
AS
C0.
18*
*0.
27*
*
3.T
EA
M4.
HE
LP
20.
25*
**
20.
11*
0.25
**
*0.
17*
*
5.L
KB
L0.
14*
0.17
*0.
18*
20.
13*
6.R
SL
T2
0.26
*2
0.30
*2
0.25
*2
0.24
*0.
33*
7.JF
UL
20.
26*
**
8.L
EA
D2
0.12
**
0.13
**
0.15
**
*0.
21*
**
20.
12*
0.40
**
*
9.C
LA
D0.
20*
0.25
**
20.
15*
0.33
**
*
10.
WR
IT0.
11*
0.11
*0.
11*
20.
18*
**
11.
AU
RL
20.
15*
*2
0.12
*
12.
ME
CH
20.
12*
0.50
**
*0.
38*
**
0.43
**
*0.
58*
**
20.
16*
**
0.24
**
*
13.D
AT
A0.
16*
*0.
96*
**
0.40
**
*0.
16*
**
20.
11*
20.
11*
*2
0.28
**
*0.
17*
**
14.
IDE
A2
0.13
**
20.
30*
**
0.18
**
*0.
40*
**
0.37
**
*0.
28*
**
15.
FA
CT
0.17
*2
0.21
**
16.
TIM
M0.
13*
0.14
*
17.
FL
EX
0.12
**
*0.
16*
**
0.09
*0.
20*
**
R2
0.11
0.46
0.26
0.20
0.21
0.31
0.12
0.06
0.05
0.13
0.20
Notes:
* p,
0.05
;*
* p,
0.01
;*
** p
,0.
001
a”U
nst
and
ard
ized
reg
ress
ion
coef
fici
ents
(ß)
rep
orte
dfo
rea
chsi
gn
ifica
nt
con
stru
ctin
the
mod
elA
llb
ased
onL
iker
tty
pe
scal
e,1¼
Str
ong
lyd
isag
ree;
5¼
Str
ong
lyag
ree.
IND
E¼
Wor
kin
dep
end
entl
y;
TA
SC¼
Tas
ksp
ecifi
cin
stru
ctio
ns;
TE
AM
¼W
ork
wit
hot
her
sin
team
s;L
KB
L¼
Wan
tto
be
lik
eab
le;
HE
LP¼
Hel
pfu
lto
oth
ers;
RS
LT¼
Ach
iev
ere
sult
s;JF
UL¼
Job
fulfi
llm
ent;
LE
AD¼
Lea
dot
her
s;C
LA
D¼
Car
eer
lad
der
;WR
IT¼
Wri
tten
lear
nin
g;A
UR
L¼
Au
rall
earn
ing
;ME
CH¼
Wor
kw
ith
thin
gs;
DA
TA¼
Wor
kw
ith
dat
a;ID
EA¼
Ex
plo
reid
eas;
FA
CT¼
Wor
kw
ith
fact
ual
info
rmat
ion
;T
IMM
¼T
ime
man
agem
ent;
FL
EX¼
Fle
xib
le
Table VI.Multiple regression
analysis of WorkPreference Indicator
constructs on jobpreferencesa
Measuring workpreferences
69

ratings on the WPI constructs and the types of work adult workers had actually chosento perform.
This sample included HR managers (34) who were in mid-level professionalpositions, Municipal bus drivers (56), Clerical workers in a correctional setting (51),Customer service workers from banking and hotels (132), Directors of social and healthservice agencies (102) having more senior positions, Executives of a public utilitycompany (17) having very senior positions within a very large company, Finance andpayroll workers (33) ranging from those having CPA’s to payroll clerks, Productionand assembly workers in an aluminum company (91), Welding Educators (43) whoworked in vocational education and academic settings, and Fire fighters working in alarge metropolitan area (31). The total sample was 590 and an entirely new sample ofrespondents than that used for the EFA and CFA analysis.
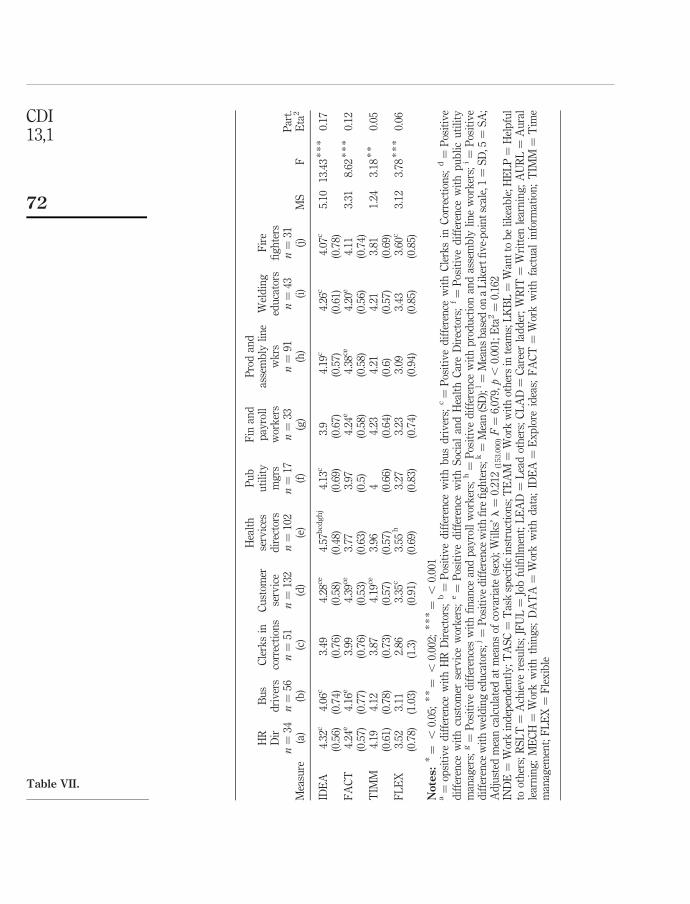
These respondents were asked to complete the WPI by the first author whenattending adult training and education sessions conducted by him, and did sovoluntarily. No randomization of their selection was possible. Due to the nature of theselection of these samples (convenience), they cannot be assumed to represent theuniverse of employees in their types of work. However, the differences on the 17 WPIconstructs found based on the respondents’ ten work types aid in the further validationof the WPI instrument, for their choice of employment occurred at a different time(before) than when they took the WPI. Table VII shows the differences in WPI ratingsbased on the subjects’ types of work. It reflects the work preference scores and the typeof work respondents performed in jobs that they had already chosen for purposes oftheir own employment.
The MANOVA analysis revealed significant difference in work preferences basedon the type of work the subjects were engaged in professionally (Wilks’ l ¼ 0.212
(153.000) F ¼ 6,079, p , 0.001; Eta2 ¼ 0.162). Of the 17 WPI measures, 16 were found todiffer significantly ( p ¼ ,0.05). These findings provide empirical evidence that pointstoward a commonality in work preferences among employees who perform similartypes of work, and, collectively, employees who engaged in similar work differ fromthose in other job placement settings. It lends further support for the workinghypothesis of this study that the 17 constructs can be used to assess work preferencesand their suitability for specific types of work.
The findings add additional evidence to validate the utility of the 17 constructs thatcomprise the WPI and give support for its use in further research. It appears that theWPI can be used to help careerists and their employers gain insight about theirpotential fit with specific types of work placements within the organization, as well asoccupations they may opt to pursue.
While the samples employed in the two analyses (see Tables VI and VII) wereindependent, there are some findings that reveal commonalities among the collegeseniors (n ¼ 975) who indicated a like or dislike of certain work placements and thoseadults who already were working in the same type of work (n ¼ 590). While most worktypes in the two studies are different (i.e. fire fighters were only studied in the secondanalysis), there appears to be some opportunity to compare outcomes related to theWPI constructs and: a. Adjudged work type preference of graduating seniors and theirwork preferences and; b. Actual work that one has chosen. In both studies there wererespondents who were identified with either clerical, budget and finance, social andhealth services, and production and assembly line type work. A review of the
CDI13,1
70

HR
Dir
Bu
sd
riv
ers
Cle
rks
inco
rrec
tion
sC
ust
omer
serv
ice
Hea
lth
serv
ices
dir
ecto
rs
Pu
bu
tili
tym
grs
Fin
and
pay
roll
wor
ker
s
Pro
dan
das
sem
bly
lin
ew
krs
Wel
din
ged
uca
tors
Fir
efi
gh
ters
n¼
34n¼
56n¼
51n¼
132
n¼
102
n¼
17n¼
33n¼
91n¼
43n¼
31M
easu
re(a
)(b
)(c
)(d
)(e
)(f
)(g
)(h
)(i
)(j
)M
SF
Par
t.E
ta2
IND
Ek
4.20
h3.
853.
933.
824.
44b
cdh
4.39
h4.
24h
3.55
4.36
bcd
h3.
886.
229.
27*
**
0.13
(0.5
8)(1
.03)
(1.0
3)(0
.83)
(0.4
8)(0
.57)
(0.4
8)(1
.08)
(0.5
9)(0
.82)
TA
SC
4.57
ef4.
53ef
4.43
ef4.
63ef
3.86
3.85
4.31
e4.
59ef
4.43
ef4.
44e
5.24
14.4
7*
**
0.18
(0.5
8)(0
.83)
(0.6
3)(0
.45)
(0.7
3)(0
.83)
(0.5
2)(0
.39)
(0.5
6)(0
.65)
TE
AM
4.40
c4.
38c
3.85
4.47
c4.
33c
4.45
c4.
33c
4.58
c4.
264.
67c
2.50
6.44
**
*0.
09(0
.49)
(0.8
)(0
.95)
(0.5
1)(0
.63)
(0.5
3)(0
.57)
(0.4
5)(0
.75)
(0.4
8)L
KB
L3.
854.
01c
3.39
4.05
c3.
82c
4.02
c3.
874.
10c
3.79
4.22
c2.
756.
35*
**
0.09
(0.5
5)(0
.84)
(0.8
5)(0
.61)
(0.6
4)(0
.41)
(0.5
2)(0
.62)
(0.6
8)(0
.57)
HE
LP
4.35
c4.
33c
3.72
4.51
c4.
28c
4.25
4.13
4.47
c4.
46c
4.45
c3.
078.
39*
**
0.12
(0.5
9)(0
.75)
(0.9
8)(0
.52)
(0.5
1)(0
.51)
(0.6
6)(0
.48)
(0.5
8)(0
.51)
RS
LT
4.93
c4.
674.
414.
83c
4.74
c4.
84c
4.95
c4.
75c
4.80
c4.
86c
1.11
6.95
**
*0.
10(0
.23)
(0.6
3)(0
.58)
(0.3
6)(0
.38)
(0.2
9)(0
.16)
(0.3
6)(0
.31)
(0.2
6)JF
UL
4.65
4.63
4.37
4.63
4.61
4.65
4.74
4.52
4.62
4.84
c0.
661.
91*
0.03
(0.5
4)(0
.72)
(0.6
8)(0
.62)
(0.5
5)(0
.46)
(0.5
2)(0
.58)
(0.5
2)(0
.35)
LE
AD
3.76
3.83
c3.
283.
74c
4.04
c4.
26c
3.73
3.77
c3.
813.
822.
633.
93*
**
0.06
(0.9
1)(0
.89)
(1.1
1)(0
.85)
(0.6
2)(0
.58)
(0.8
6)(0
.82)
(0.6
8)(0
.68)
CL
AD
4.44
e4.
29e
4.17
e4.
51ce
f3.
723.
914.
45e
4.45
ef4.
034.
16e
5.40
14.1
9*
**
0.18
(0.5
7)(0
.75)
(0.7
3)(0
.53)
(0.7
1)(0
.71)
(0.5
1)(0
.53)
(0.5
1)(0
.65)
WR
IT3.
283.
96ae
3.58
e3.
72e
3.17
3.41
3.70
e3.
82ae
3.87
e3.
634.
398.
39*
**
0.12
(0.7
4)(0
.68)
(0.7
1)(0
.71)
(0.7
4)(0
.62)
(0.8
5)(0
.74)
(0.6
2)(0
6.7)
AU
RL
3.78
3.96
3.77
3.96
4.06
4.06
3.97
4.00
4.05
4.18
0.66
1.34
0.02
(0.7
8)(0
.79)
(1.0
9)(0
.69)
(0.6
1)(0
.4)
(0.5
8)(0
.59)
(0.6
7)(0
.54)
ME
CH
2.66
3.80
acd
e3.
043.
29ae
2.87
3.81
ae
3.29
4.05
acd
eg4.
44acd
eg3.
94acd
e11
.76
25.0
3*
**
0.28
(0.9
9)(0
.75)
(0.9
5)(0
.99)
(0.8
4)0.
79)
(0.8
)(0
.69)
(0.5
7)(0
.72)
DA
TA
3.36
3.52
3.47
3.37
3.49
3.85
3.98
dj
3.69
j3.
223.
112.
403.
72*
**
0.06
(0.7
5)(0
.8)
(0.7
6)(0
.94)
(0.7
6)(0
.82)
(0.6
9)(0
.71)
(0.8
2)(0
.86)
(continued
)
Table VII.Comparison of
respondent ratings by jobtype
Measuring workpreferences
71
HR
Dir
Bu
sd
riv
ers
Cle
rks
inco
rrec
tion
sC
ust
omer
serv
ice
Hea
lth
serv
ices
dir
ecto
rs
Pu
bu
tili
tym
grs
Fin
and
pay
roll
wor
ker
s
Pro
dan
das
sem
bly
lin
ew
krs
Wel
din
ged
uca
tors
Fir
efi
gh
ters
n¼
34n¼
56n¼
51n¼
132
n¼
102
n¼
17n¼
33n¼
91n¼
43n¼
31M
easu
re(a
)(b
)(c
)(d
)(e
)(f
)(g
)(h
)(i
)(j
)M
SF
Par
t.E
ta2
IDE
A4.
32c
4.06
c3.
494.
28ce
4.57
bcd
gh
j4.
13c
3.9
4.19
c4.
26c
4.07
c5.
1013
.43
**
*0.
17(0
.56)
(0.7
4)(0
.76)
(0.5
8)(0
.48)
(0.6
9)(0
.67)
(0.5
7)(0
.61)
(0.7
8)F
AC
T4.
24e
4.16
e3.
994.
39ce
3.77
3.97
4.24
e4.
38ce
4.20
e4.
113.
318.
62*
**
0.12
(0.5
7)(0
.77)
(0.7
6)(0
.53)
(0.6
3)(0
.5)
(0.5
8)(0
.58)
(0.5
6)(0
.74)
TIM
M4.
194.
123.
874.
19ce
3.96
44.
234.
214.
213.
811.
243.
18*
*0.
05(0
.61)
(0.7
8)(0
.73)
(0.5
7)(0
.57)
(0.6
6)(0
.64)
(0.6
)(0
.57)
(0.6
9)F
LE
X3.
523.
112.
863.
35c
3.55
h3.
273.
233.
093.
433.
60c
3.12
3.78
**
*0.
06(0
.78)
(1.0
3)(1
.3)
(0.9
1)(0
.69)
(0.8
3)(0
.74)
(0.9
4)(0
.85)
(0.8
5)
Notes:
*¼
,0.
05;
**¼
,0.
002;
**
*¼
,0.
001
a¼
opsi
tiv
ed
iffe
ren
cew
ith
HR
Dir
ecto
rs;
b¼
Pos
itiv
ed
iffe
ren
cew
ith
bu
sd
riv
ers;
c¼
Pos
itiv
ed
iffe
ren
cew
ith
Cle
rks
inC
orre
ctio
ns;
d¼
Pos
itiv
ed
iffe
ren
cew
ith
cust
omer
serv
ice
wor
ker
s;e¼
Pos
itiv
ed
iffe
ren
cew
ith
Soc
ial
and
Hea
lth
Car
eD
irec
tors
;f¼
Pos
itiv
ed
iffe
ren
cew
ith
pu
bli
cu
tili
tym
anag
ers;
g¼
Pos
itiv
ed
iffe
ren
ces
wit
hfi
nan
cean
dp
ayro
llw
ork
ers;
h¼
Pos
itiv
ed
iffe
ren
cew
ith
pro
du
ctio
nan
das
sem
bly
lin
ew
ork
ers;
i¼
Pos
itiv
ed
iffe
ren
cew
ith
wel
din
ged
uca
tors
;j¼
Pos
itiv
ed
iffe
ren
cew
ith
fire
fig
hte
rs;k
¼M
ean
(SD
);l¼
Mea
ns
bas
edon
aL
iker
tfi
ve-
poi
nt
scal
e,1¼
SD
,5¼
SA
;A
dju
sted
mea
nca
lcu
late
dat
mea
ns
ofco
var
iate
(sex
);W
ilk
s’l¼
0.21
2(1
53.0
00)F¼
6,07
9,p,
0.00
1;E
ta2¼
0.16
2IN
DE¼
Wor
kin
dep
end
entl
y;T
AS
C¼
Tas
ksp
ecifi
cin
stru
ctio
ns;
TE
AM
¼W
ork
wit
hot
her
sin
team
s;L
KB
L¼
Wan
tto
be
lik
eab
le;H
EL
P¼
Hel
pfu
lto
oth
ers;
RS
LT¼
Ach
iev
ere
sult
s;JF
UL¼
Job
fulfi
llm
ent;
LE
AD¼
Lea
dot
her
s;C
LA
D¼
Car
eer
lad
der
;W
RIT
¼W
ritt
enle
arn
ing
;A
UR
L¼
Au
ral
lear
nin
g;
ME
CH¼
Wor
kw
ith
thin
gs;
DA
TA
¼W
ork
wit
hd
ata;
IDE
A¼
Ex
plo
reid
eas;
FA
CT¼
Wor
kw
ith
fact
ual
info
rmat
ion
;T
IMM
¼T
ime
man
agem
ent;
FL
EX¼
Fle
xib
le
Table VII.
CDI13,1
72
preferences of those associated with these four work types reveal notable similarities(Note: Such comparisons should be made with caution, as the work types are notidentical and the samples were not derived randomly):
(1) Clerical: Both analyses revealed clerical types’ preferences to be lower thanothers in RSLT, INDE, LEAD, and IDEA, and higher in TASC and WRIT.
(2) Budget and finance: In both studies, accounting and finance types have higherpreferences for DATA and FACT, and lower in HELP, IDEA, and MECH.
(3) Social and health services: Both analyses revealed these types have higherinterests in HELP and IDEA, and lower interests in CLAD and MECH.
(4) Production and assembly line workers: Both studies revealed higher interests inMECH, and lower preference for INDE and JFUL.
Given the differences in the two studies conducted following the CFA analysis(Tables VI and VII), there appears to be empirical support for the working hypothesisof this paper:
Respondents’ ratings on the empirically derived constructs will be significantly different interms of: the expressed types of work they would prefer and; the type of work environmentsthat they actually select.
Limitations of the studyMost fundamental to the understanding of this contribution is that it is still in itsformative stage of development, and much more rigorous and systematic research isneeded in the future in order for the constructs in the WPI to be used to predict careerchoice outcomes. Limitations to this work at this initial developmental stage include:
Randomization of students and their majors and those working adults actuallyengaged in their careers was not employed. Thus, all results relating to work typesused to compare outcomes need to be viewed as tentative. More work types need to beincluded in the study, with specific sampling of working adults.
The WPI constructs are assumed to be similar to constructs already reported in theliterature. However, actual testing of the WPI constructs with those associated withRIASEC, FFM, MBTI and others is needed before the WPI constructs may be assumedto be equivalent to other constructs previously reported in the literature. Also, manyother potentially important constructs that were not included in the WPI may havebeen omitted and further review of other tools and constructs is merited as research inthe use of multidimensional tools is expanded.
The preliminary studies did not focus specifically on short-term work placements,and more systematic research needs to be conducted to test the utility of the outcomesof the tool with specific short-term placements at work.
It is likely that other demographic variables in addition to gender may influencerespondent ratings on the constructs. Future research is needed to explore this.
Summary and conclusionsThis is an introductory work that reports on the development of the WPI and itspotential use as an aid to careerists as they review shorter-term career decisionsassociated with today’s changing work contexts. As a first step, the constructs havebeen validated and their relationship with different types of work has been
Measuring workpreferences
73

demonstrated. The use of the constructs in the tool may shed light on the degree towhich one may find satisfaction when working with others in teams, value workingwith organizational customers, find meaning in helping others, leading others, besupervised, and instructed about work assignments. It helps identify one’s preferredmanner of learning and interacting with others on the job, achievement motivation, thevalues one holds that provide greatest job fulfillment, and interests related to workingwith data, facts, mechanical objects, ideas or people. It helps career decision makersgain insight about their preferred work environment in relation to working on detailedtasks or grasping broader concepts and ideas. It pinpoints the degree of flexibility andtime management control that is suitable for a person.
These preferences can be relevant to a person involved in making work relatedchoices in job placements as diverse as computer science, management, budget andfinance, maintenance and repair, and the arts. Information generated by the WPI maybe useful to employees, their supervisors, human resources planners, team leaders,mentors and vocational counselors in terms of the relative suitability of the individualwith new job assignments, tasks to be performed on work teams, and careerbroadening options.
The WPI, as a multidimensional tool, includes constructs that have been derivedfrom different areas of concentration within the field of career psychology. To venturea metaphor, the WPI is not intended to add a new color (i.e. new construct) to the careerdeveloper’s professional palette from which to choose. However, because it ismultidimensional (i.e. having multiple measures from different fields), it provides aunique mix of colors that are available to the career development specialist at one timethrough one instrument, validly and reliably. This is especially useful when reviewinga person’s preferences as they pertain to their work related choices from either theorganization or individual’s perspective.
The sampling reported here has been drawn from students and other adults, mostwere already involved in their careers. Sampling of pre careerists at the secondaryschool level would aid in gaining added insight about the validity of the tool with thisyounger population. Further analyses of working adults’ self reported satisfaction withactual work assignments, their work environments, performance appraisal scores,career progress, and succession planning rankings and their scores on the 17 measuresto determine if relationships exist between them would aid in understanding thepredictive power of the 17 constructs.
It is recognized that work preferences may be affected by many variables (e.g. levelof education, gender, life and career stages, college major, race, ethnicity,socioeconomic status, and other organizational characteristics); these, too, meritfurther investigation.
Given the many limitations cited above, the development of the WPI has provided asound basis for continued research and opens the door for further collaborative effortsamong academicians and others involved in career development analysis. To this end,research partnerships with other academicians and practitioners are being developedto further explore the application of the WPI and its constructs as such relate to careerchoice and work satisfaction.
In conclusion, this study represents an initial effort to establish the WPI as a validmultidimensional tool to gauge individual work preferences. Future research usingmore specific psychological constructs and outcome measures associated with each
CDI13,1
74
will lead to modifications in order to further the purification of the instrument and itspractical applicability.
References
Amabile, T., Hill, K., Hennessey, B. and Tighe, E. (1994), “The Work Preference Inventory:assessing intrinsic and extrinsic motivational orientations”, Journal of Personality andSocial Psychology, Vol. 66, pp. 950-67.
Anderson, J. and Adams, M. (1992), “Acknowledging the learning styles of diverse studentpopulations: implications for instructional design”, New Directions for Teaching andLearning, Vol. 49, pp. 19-31.
Anderson, J. and Gerbing, D. (1988), “Structural equation modeling in practice: a review andrecommended two-step approach”, Psychological Bulletin, Vol. 103 No. 3, pp. 411-23.
Barker, J. and Kellen, J. (1998), Career Planning: A Developmental Approach, Prentice-Hall,Englewood Cliffs, NJ.
Barrick, M., Mount, M. and Gupta, R. (2003), “Meta-analysis of the relationship between thefive-factor model of personality and Holland’s occupational types”, Personnel Psychology,Vol. 56 No. 1, pp. 45-63.
Baruch, Y. (2006), “Career development in organizations and beyond: balancing traditional andcontemporary viewpoints”, Human Resource Management Review, Vol. 16, pp. 125-38.
Bozionelos, N. (2001), “Organizational downsizing and career development”, Career DevelopmentInternational, Vol. 6 No. 2, pp. 87-92.
Brenner, O., Blazini, A. and Greenhaus, J. (1988), “An examination of race and sex differences inmanagerial work values”, Journal of Vocational Behavior, Vol. 32, pp. 336-44.
Brown, D. (1996), “Brown’s value-based, holistic model of career and life-role choices andsatisfaction”, in Brown, D. and Brooks, L. (Eds), Career Choices and Development, 3rd ed.,Jossey-Bass, San Francisco, CA, pp. 337-72.
Chan, K. and Drasgow, F. (2001), “Toward a theory of individual differences and leadership:understanding the motivation to lead”, Journal of Applied Psychology, Vol. 86 No. 3,pp. 481-98.
Cohen, J., Cohen, P., West, S. and Aiken, L. (2003), Applied Multiple Regression/CorrelationAnalysis for the Behavioral Sciences, 3rd ed., Lawrence Erlbaum Associates, Hillsdale, NJ.
Costa, P. and McCrae, R. (1992), Revised NEO-Personality Inventory (NEO-PI-R) and NEO FiveFactor Inventory (NEO-FFI): Professional Manual, PsychologicalAssessment Resources,Odessa, FL.
Cox, C. and Cooper, C. (1989), “The making of the British CEO: childhood, work experiences,personality, and management style”, Academy of Management Executive, Vol. 3, pp. 241-5.
Dewaele, J. and Furnham, A. (1999), “Extraversion: the unloved variable in applied linguisticresearch”, Language Learning, Vol. 49, pp. 509-44.
Douglas, E. and Shepard, D. (2002), “Self employment as a career choice: attitudes,entrepreneurial intentions and utility maximization”, Entrepreneurial Theory andPractice, Vol. 26 No. 3, pp. 81-90.
Dowd, L. (2006), The Work Preference Match, Administrator’s Guide, JIST Publishing, St Paul,MN.
Dunn, R. and Dunn, K. (1999), The Complete Guide to the Learning Strategies Inservice System,Allyn & Bacon, Boston, MA.
Measuring workpreferences
75
Dunn, R., Beaudry, J. and Klavas, A. (1989), “Survey research on learning styles”, EducationalLeadership, Vol. 46, pp. 50-8.
Edwards, J. (1991), “Person-job fit: a conceptual integration, literature review, andmethodological critique”, in Cooper, C. and Robertson, I. (Eds), International Review ofIndustrial and Orgaznisational Psychology, Vol. 6, Wiley, New York, NY, pp. 283-357.
Fazarro, D. and Stevens, A. (2004), “Topography of learning style preferences of undergraduatestudents in industrial technology and engineering programs at historically black andpredominantly white institutions”, Journal of Industrial Teacher Education, Vol. 4 No. 8,pp. 5-29.
Gerbing, D. and Anderson, J. (1988), “An updated paradigm for scale development incorporatingunidimensionality and its assessment”, Journal of Marketing Research, Vol. 25 No. 2,pp. 186-92.
Goldberg, L. (1990), “An alternative ‘description of personality’: the Big Five factor structure”,Journal of Personality and Psychology, Vol. 59, pp. 1216-29.
Goldberg, L. (1993), “The structure of personality”, American Psychologist, Vol. 48, pp. 26-34.
Hall, D. (1996), “Protean careers of the 21st century”, The Academy of Management Executive,Vol. 10, pp. 8-15.
Harmon, L., Hansen, J., Borgen, F. and Hammer, A. (1994), Strong Interest Inventory ApplicationGuide, Consulting Psychologists Press, Palo Alto, CA.
Harvey, M. and Novicevic, M. (2006), “The world is flat: a perfect storm for global business”,Organizational Dynamics, Vol. 35 No. 3, pp. 207-19.
Hogan, R. and Hogan, J. (1992), Hogan Personality Inventory Manual, Hogan AssessmentSystems, Tulsa, OK.
Holland, J. (1973), Making Vocational Choices: A Theory of Careers, Prentice-Hall, EnglewoodCliffs, NJ.
Holland, J. (1992), Making Vocational Choices, 2nd ed., Psychological Assessment Resources,Odessa, FL.
Holland, J. (1997), Making Vocational Choices: A Theory of Vocational Personalities and WorkEnvironments, 3rd ed., Psychological Assessment Resources, Odessa, FL.
Jansen, K. and Kristof-Brown, A. (2006), “Toward a multidimensional theory ofperson-environment fit”, Journal of Managerial Issues, Vol. 18, pp. 193-212.
Judge, T. and Ferris, G. (1992), “The elusive criterion of fit in human resources staffingdecisions”, Human Resource Planning, Vol. 15 No. 4, pp. 47-67.
Judge, T., Cable, D., Boudreau, J. and Bretz, R. (1995), “An empirical investigation of thepredictors of executive career success”, Personnel Psychology, Vol. 52, pp. 621-52.
Konrad, A., Ritchie, J., Lieb, P. and Corrigall, E. (2000), “Sex differences and similarities in jobattribute preferences: a meta-analysis”, Psychological Bulletin, Vol. 126, pp. 593-641.
Kristof, A. (1996), “Person-organization fit: an integrative review of its conceptualizations,measurement and implications”, Personnel Psychology, Vol. 49, pp. 1-49.
Kristof-Brown, A., Zimmerman, R. and Johnson, E. (2005), “Consequences of individuals’ fit atwork: a meta analysis of person-job, person-organization, person-group, andperson-supervisor fit”, Personnel Psychology, Vol. 58, pp. 281-342.
Law, K., Wong, C. and Mobley, W. (1998), “Towards a taxonomy of multidimensionalconstructs”, Academy of Management Review, Vol. 23 No. 4, pp. 741-55.
Lewin, K. (1935), ADynamic Theory of Personality: Selected Papers, McGraw-Hill, New York, NY.
CDI13,1
76
McCaulley, M. (1990), “The Myers-Briggs Type Indicator: a measure for individuals and groups”,Measurement and Evaluation in Counseling and Development, Vol. 22, pp. 181-95.
McClelland, D. (1985), “How motives, skills, and values determine what people do”, AmericanPsycholgist, Vol. 40 No. 7, pp. 812-25.
McClelland, D. and Boyatzis, R. (1982), “The leadership motive pattern and long-term success inmanagement”, Journal of Applied Psychology, Vol. 6, pp. 737-43.
Mccloy, R., Campbell, J. and Cudek, R. (1994), “A confirmatory test of a model of performancedeterminants”, Journal of Applied Psychology, Vol. 79, pp. 493-505.
Malka, A. and Chatman, J. (2003), “Intrinsic and extrinsic orientations as moderators of the effectof annual income on subjective well-being: a longitudinal study”, Personality and SocialPsychology Bulletin, Vol. 29 No. 6, pp. 737-46.
Mulaik, S., James, L., Van Alstine, J., Bennett, N., Lind, S. and Stilwell, C. (1989), “Evaluation ofgoodness-of-fit indices for structural equation models”, Psychological Bulletin, Vol. 105No. 3, pp. 430-50.
Myers, I. (1987), The Myers-Briggs Type Indicator, Consulting Psychologists, Palo Alto, CA.
Niles, S. and Harris-Bowlsbey, J. (2002), Career Development Interventions in the 21st Century,Merrill Prentice-Hall, Upper Saddle River, NJ.
Nunnally, J. and Bernstein, I. (1994), Psychometric Theory, 3rd ed., Mc-Graw Hill, New York, NY.
Patton, W. and McMahon, M. (1999), Career Development and Systems Theory: A NewRelationship, Brooks/Cole Publishing Company, Pacific Grove, CA.
Prediger, D. (1976), “A world of work map for career exploration”, Vocational GuidanceQuarterly, Vol. 24, pp. 198-208.
Rokeach, M. (1973), The Nature of Human Values, Free Press, New York, NY.
Rounds, J. and Armstrong, P. (2005), “Assessment of needs and values”, in Brown, S. and Lent, R.(Eds), Career Development and Counseling, Wiley, Hoboken, NJ, pp. 305-29.
Rounds, J., Dawis, R. and Lofquist, L. (1987), “Measurement of person-environment fit andprediction of satisfaction in the theory of work adjustment”, Journal of VocationalBehavior, Vol. 31, pp. 297-318.
Rounds, J. Jr, Henly, G., Dawis, R., Lofquist, L. and Weiss, D. (1981), Manual for the MinnesotaImportance Questionnaire: A Measure of Vocational Needs and Values, University ofMinnesota, Minneapolis, MN.
Rowe, R. and Snizek, W. (1995), “Gender differences in work values: perpetuating the myth”,Work and Occupations, Vol. 22, pp. 215-29.
Schriesheim, C. (2005), “Concurrent validity”, Blackwell Encyclopedic Dictionary of HumanResource Management, p. 67.
Sekiguchi, T. (2006), “How organizations promote person-environment fit: using the case ofJapanese firms to illustrate institutional and cultural differences”, Asia Pacific Journal ofManagement, Vol. 23, pp. 47-69.
Simons, R., Goddard, R. and Patton, W. (2000), “Measuring vocational interests: a call formulti-sample norms”, Career Development International, Vol. 5 No. 7, pp. 351-9.
Smola, K. and Sutton, C. (2002), “Generational differences: revisiting generational work values forthe new millennium”, Journal of Organizational Behavior, Vol. 23, pp. 363-82.
Super, D. (1970), Work Values Inventory, Houghton Mifflin, Boston, MA.
Super, D. (1982), “The relative importance of work: models and measures of meaningful data”,The Counseling Psychologist, Vol. 10, pp. 95-103.
Measuring workpreferences
77
Werbel, J. and Gilliland, S. (1999), “Person-environment fit in the selection process”, in Ferris, G.(Ed.), Research in Personnel and Human Resource Management, JAI Press, Stanford, CT,pp. 209-43.
Werbel, J. and Johnson, D. (2001), “The use of person-group fit for employment selection:a missing link in person-environment fit”, Human Resource Management, Vol. 40,pp. 227-40.
About the authorsG. Ronald Gilbert, PhD is Clinical Professor of Management and International Business, andFaculty Director of the International Executive MBA program, Jamaica at Florida InternationalUniversity, Miami, Florida. He also lectures in the Masters in Executive Leadership graduateprogram at the University of Southern California. He has developed several psychologicalassessment tools related to individual, work team, leadership, and organizational effectivenessthat have been published in refereed journals associated with behavioral science, management,human resources, social psychology, and service quality journals. He lectures for a wide varietyof executive education and management development programs, and has consulted for hundredsof companies and governments in the USA and abroad. G. Ronald Gilbert is the correspondingauthor and can be contacted at: [email protected]
Ravipreet S. Sohi is a Professor of Marketing at the University of Nebraska – Lincoln. Heholds a Masters and PhD in Marketing from the University of Wisconsin – Madison. One of hisareas of expertise is psychometrics and scale development. He has developed scales for severalconstructs, and his work has been published in some of the leading journals in business,including the Journal of Marketing, Journal of the Academy of Marketing Science, and theStrategic Management Journal.
Adriana G. McEachern PhD., NCC, NCRC, LMHC is an Associate Professor in counseloreducation in the College of Education at Florida International University. She received herdoctorate in Counselor Education from the University of Florida in 1989.
CDI13,1
78
To purchase reprints of this article please e-mail: [email protected] visit our web site for further details: www.emeraldinsight.com/reprints