Embed Size (px)
Citation preview

5 6 4 | N A T U R E | V O L 5 4 3 | 2 3 m A R c h 2 0 1 7
LETTERdoi:10.1038/nature21710
CD32a is a marker of a CD4 T-cell HIV reservoir harbouring replication-competent provirusesBenjamin Descours1*, Gaël Petitjean1*, José-Luis López-Zaragoza2,3,4, Timothée Bruel2,5, Raoul Raffel1, christina Psomas6, Jacques Reynes6, christine Lacabaratz2,3,4, Yves Levy2,3,4, Olivier Schwartz2,5, Jean Daniel Lelievre2,3,4 & monsef Benkirane1
The persistence of the HIV reservoir in infected individuals is a major obstacle to the development of a cure for HIV1–3. Here, using an in vitro model of HIV-infected quiescent CD4 T cells, we reveal a gene expression signature of 103 upregulated genes that are specific for latently infected cells, including genes for 16 transmembrane proteins. In vitro screening for surface expression in HIV-infected quiescent CD4 T cells shows that the low-affinity receptor for the immunoglobulin G Fc fragment, CD32a, is the most highly induced, with no detectable expression in bystander cells. Notably, productive HIV-1 infection of T-cell-receptor-stimulated CD4 T cells is not associated with CD32a expression, suggesting that a quiescence-dependent mechanism is required for its induction. Using blood samples from HIV-1-positive participants receiving suppressive antiretroviral therapy, we identify a subpopulation of 0.012% of CD4 T cells that express CD32a and host up to three copies of HIV DNA per cell. This CD32a+ reservoir was highly
enriched in inducible replication-competent proviruses and can be predominant in some participants. Our discovery that CD32a+ lymphocytes represent the elusive HIV-1 reservoir may lead to insights that will facilitate the specific targeting and elimination of this reservoir.
Resting CD4 T cells are paradoxically non-permissive to HIV-1, but also predominantly support viral persistence under antiretroviral therapy in HIV-1-infected participants1,4–6. We took advantage of our recent discovery that SAMHD1 is responsible for HIV-1 restriction in resting CD4 T cells to generate latently infected cells without delivering an activation signal7–12. We could thus test the hypothesis that these latently infected non-stimulated T cells might have a gene expression signature that distinguishes them from their non-infected counterparts. Peripheral blood mononuclear cells (PBMCs) from four HIV-negative controls were isolated and exposed to viral-like particles (VLP) containing the SIVmac251 accessory protein Vpx (VLP-Vpx), which
1Institut de Génétique Humaine, Laboratoire de Virologie Moléculaire, UMR9002, CNRS, Université de Montpellier, Montpellier, France. 2Vaccine Research Institute, Université Paris-Est, Faculté de Médecine, INSERM U955, and Assistance Publique-Hôpitaux de Paris, Groupe Henri-Mondor Albert-Chenevier, Service d’Immunologie Clinique, Créteil, France. 3Inserm, U955, Equipe 16, Créteil, France. 4AP-HP, Hôpital Henri-Mondor Albert-Chenevier, Service d’Immunologie Clinique et Maladies Infectieuses 94000 Créteil, France. 5Institut Pasteur, Virus and Immunity Unit, URA CNRS 3015, Paris, France. 6Département Maladies Infectieuses et Tropicales, Hôpital Universitaire, Montpellier, France.*These authors contributed equally to this work.
–1 0 1 2 3
XH+ 2XH+ 4
XH+ 3NI 4X1XH– 1NI 1X2XH– 2NI 3X 4XH– 4NI 2X 3
XH+ 1
XH– 30 40 80 120
VLP-Vpx
Healthydonor
PBMCs
HIVcmvGFP
a b
c d e
log2 fold change
Day 4Day 0
XH+, latently infected,GFP+
XH–, HIV-exposed,GFP–
X, non-infected,Vpx-treated
Non-infected
FACS sorting ofquiescent CD4 T cells:
Computationalanalysis
TotalRNA-seq
FACSvalidation
Euclideandistance
10
0
0
5
10
120
2
4
00
0
33
70
11
1
9
5
5
2
15
–40 –20 0 10
–10
–20
–30
PC
2: 1
7% v
aria
nce
PC1: 58% variance
–log
10 (F
DR
)
NI
XH–
XH+
X
NI vs XH+ XH– vs XH+
NI vs X NI vs XH–
XH
+ 2 X1
X2
X 4
X 3
NI 4
NI 1
NI 2
NI 3
XH
+ 3
XH
+ 4
XH
+ 1
XH
– 1
XH
– 3
XH
– 4
XH
– 2
Figure 1 | The gene expression signature of latently HIV-1-infected quiescent CD4 T cells. a, Workflow to generate latently infected quiescent CD4 T cells using PBMCs isolated from four HIV-negative controls. Total RNA was extracted and gene expression profiles were determined by RNA-seq. b, Heat map of hierarchical clustering performed on Euclidean distance, calculated using regularized-log-transformed gene expression counts, between each cell subset (XH+, XH−, X and non-infected (NI)), from each HIV-negative donor (1 to 4). c, Principal component analysis of regularized-log-transformed gene expression counts for XH+,
XH−, X and non-infected cell subsets from four HIV-negative controls. Plot of first two principal components are shown. d, Volcano plot presenting significance FDR and fold change of gene expression between infected and exposed uninfected resting CD4 T cells. Black dots indicate genes selected for their significant increase in XH+ compared to XH− (FDR < 10−8). e, Venn Diagram spreading the 253 genes found significantly differentially expressed between four relevant comparison groups, including XH− versus XH+ (FDR < 10−8). Red intersection indicates genes selected for further analysis.
© 2017 Macmillan Publishers Limited, part of Springer Nature. All rights reserved.
Letter reSeArCH
2 3 m A R c h 2 0 1 7 | V O L 5 4 3 | N A T U R E | 5 6 5
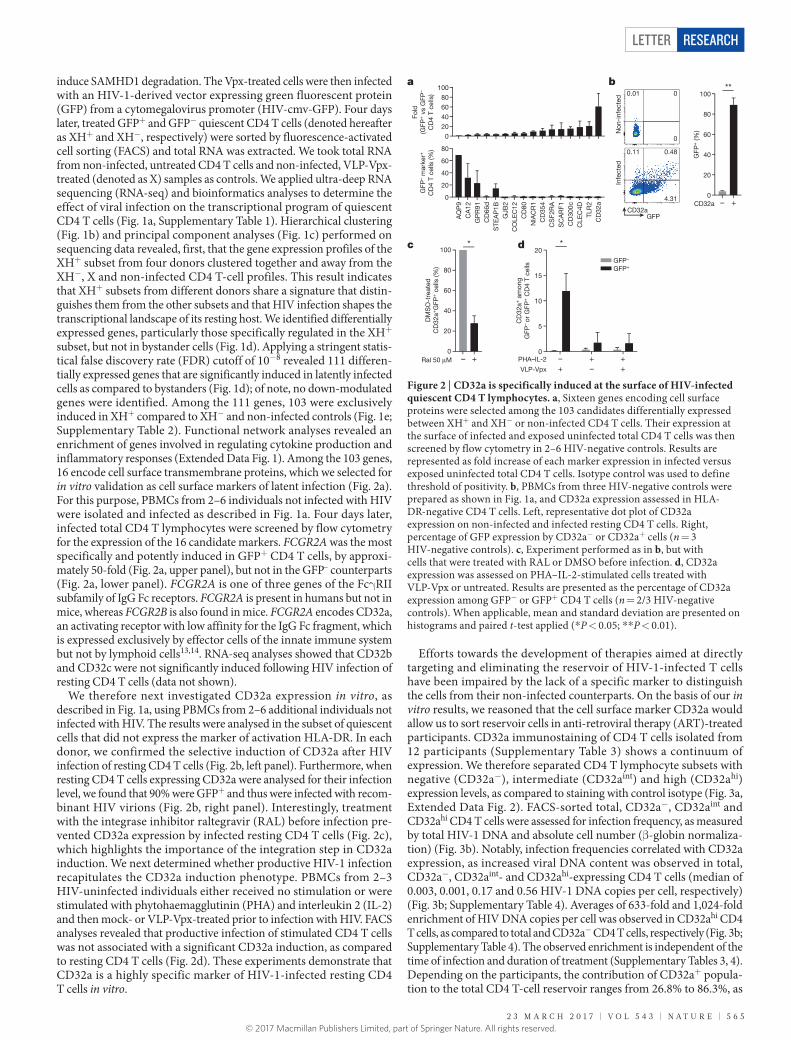
induce SAMHD1 degradation. The Vpx-treated cells were then infected with an HIV-1-derived vector expressing green fluorescent protein (GFP) from a cytomegalovirus promoter (HIV-cmv-GFP). Four days later, treated GFP+ and GFP− quiescent CD4 T cells (denoted hereafter as XH+ and XH−, respectively) were sorted by fluorescence-activated cell sorting (FACS) and total RNA was extracted. We took total RNA from non-infected, untreated CD4 T cells and non-infected, VLP-Vpx-treated (denoted as X) samples as controls. We applied ultra-deep RNA sequencing (RNA-seq) and bioinformatics analyses to determine the effect of viral infection on the transcriptional program of quiescent CD4 T cells (Fig. 1a, Supplementary Table 1). Hierarchical clustering (Fig. 1b) and principal component analyses (Fig. 1c) performed on sequencing data revealed, first, that the gene expression profiles of the XH+ subset from four donors clustered together and away from the XH−, X and non-infected CD4 T-cell profiles. This result indicates that XH+ subsets from different donors share a signature that distin-guishes them from the other subsets and that HIV infection shapes the transcriptional landscape of its resting host. We identified differentially expressed genes, particularly those specifically regulated in the XH+ subset, but not in bystander cells (Fig. 1d). Applying a stringent statis-tical false discovery rate (FDR) cutoff of 10−8 revealed 111 differen-tially expressed genes that are significantly induced in latently infected cells as compared to bystanders (Fig. 1d); of note, no down- modulated genes were identified. Among the 111 genes, 103 were exclusively induced in XH+ compared to XH− and non-infected controls (Fig. 1e; Supplementary Table 2). Functional network analyses revealed an enrichment of genes involved in regulating cytokine production and inflammatory responses (Extended Data Fig. 1). Among the 103 genes, 16 encode cell surface transmembrane proteins, which we selected for in vitro validation as cell surface markers of latent infection (Fig. 2a). For this purpose, PBMCs from 2–6 individuals not infected with HIV were isolated and infected as described in Fig. 1a. Four days later, infected total CD4 T lymphocytes were screened by flow cytometry for the expression of the 16 candidate markers. FCGR2A was the most specifically and potently induced in GFP+ CD4 T cells, by approxi-mately 50-fold (Fig. 2a, upper panel), but not in the GFP– counterparts (Fig. 2a, lower panel). FCGR2A is one of three genes of the Fcγ RII subfamily of IgG Fc receptors. FCGR2A is present in humans but not in mice, whereas FCGR2B is also found in mice. FCGR2A encodes CD32a, an activating receptor with low affinity for the IgG Fc fragment, which is expressed exclusively by effector cells of the innate immune system but not by lymphoid cells13,14. RNA-seq analyses showed that CD32b and CD32c were not significantly induced following HIV infection of resting CD4 T cells (data not shown).
We therefore next investigated CD32a expression in vitro, as described in Fig. 1a, using PBMCs from 2–6 additional individuals not infected with HIV. The results were analysed in the subset of quiescent cells that did not express the marker of activation HLA-DR. In each donor, we confirmed the selective induction of CD32a after HIV infection of resting CD4 T cells (Fig. 2b, left panel). Furthermore, when resting CD4 T cells expressing CD32a were analysed for their infection level, we found that 90% were GFP+ and thus were infected with recom-binant HIV virions (Fig. 2b, right panel). Interestingly, treatment with the integrase inhibitor raltegravir (RAL) before infection pre-vented CD32a expression by infected resting CD4 T cells (Fig. 2c), which highlights the importance of the integration step in CD32a induction. We next determined whether productive HIV-1 infection recapitulates the CD32a induction phenotype. PBMCs from 2–3 HIV-uninfected individuals either received no stimulation or were stimulated with phytohaemagglutinin (PHA) and interleukin 2 (IL-2) and then mock- or VLP-Vpx-treated prior to infection with HIV. FACS analyses revealed that productive infection of stimulated CD4 T cells was not associated with a significant CD32a induction, as compared to resting CD4 T cells (Fig. 2d). These experiments demonstrate that CD32a is a highly specific marker of HIV-1-infected resting CD4 T cells in vitro.
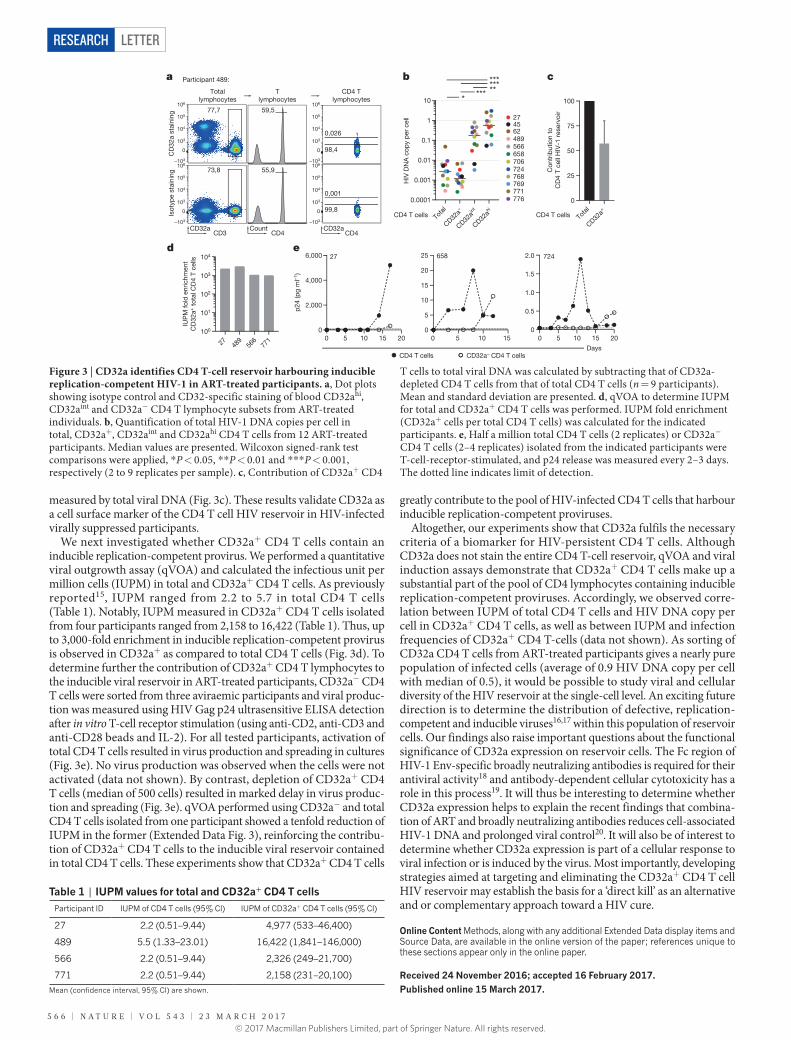
Efforts towards the development of therapies aimed at directly targeting and eliminating the reservoir of HIV-1-infected T cells have been impaired by the lack of a specific marker to distinguish the cells from their non-infected counterparts. On the basis of our in vitro results, we reasoned that the cell surface marker CD32a would allow us to sort reservoir cells in anti-retroviral therapy (ART)-treated participants. CD32a immunostaining of CD4 T cells isolated from 12 participants (Supplementary Table 3) shows a continuum of expression. We therefore separated CD4 T lymphocyte subsets with negative (CD32a−), intermediate (CD32aint) and high (CD32ahi) expression levels, as compared to staining with control isotype (Fig. 3a, Extended Data Fig. 2). FACS-sorted total, CD32a−, CD32aint and CD32ahi CD4 T cells were assessed for infection frequency, as measured by total HIV-1 DNA and absolute cell number (β -globin normaliza-tion) (Fig. 3b). Notably, infection frequencies correlated with CD32a expression, as increased viral DNA content was observed in total, CD32a−, CD32aint- and CD32ahi-expressing CD4 T cells (median of 0.003, 0.001, 0.17 and 0.56 HIV-1 DNA copies per cell, respectively) (Fig. 3b; Supplementary Table 4). Averages of 633-fold and 1,024-fold enrichment of HIV DNA copies per cell was observed in CD32ahi CD4 T cells, as compared to total and CD32a− CD4 T cells, respectively (Fig. 3b; Supplementary Table 4). The observed enrichment is independent of the time of infection and duration of treatment (Supplementary Tables 3, 4). Depending on the participants, the contribution of CD32a+ popula-tion to the total CD4 T-cell reservoir ranges from 26.8% to 86.3%, as
AQ
P9
CA
12G
PR
91C
D66
dS
TEA
P1B
GJB
2C
OLE
C12
CD
80N
IAC
R1
CD
354
CS
F2R
AS
CA
RF1
CD
300c
CLE
C4D
TLR
2C
D32
a
0
20
40
60
80
GFP
– m
arke
r+
CD
4 T
cells
(%)
0
20
40
60
80
100
Fold
(GFP
+ v
s G
FP–
CD
4 T
cells
)
– +0
20
40
60
80
100
GFP
+ (%
)
**
CD32a
– +0
20
40
60
80
100
DM
SO
-tre
ated
CD
32a+
GFP
+ c
ells
(%)
*
Ral 50 μM0
5
10
15
20
CD
32a+
am
ong
GFP
– or
GFP
+ C
D4
T ce
lls
GFP–
GFP+
PHA–IL-2
VLP-Vpx +– +
–++
*
GFPCD32a
Non
-inf
ecte
dIn
fect
ed
0
0
0.48
4.31
0.11
0.01
a b
c d
Figure 2 | CD32a is specifically induced at the surface of HIV-infected quiescent CD4 T lymphocytes. a, Sixteen genes encoding cell surface proteins were selected among the 103 candidates differentially expressed between XH+ and XH− or non-infected CD4 T cells. Their expression at the surface of infected and exposed uninfected total CD4 T cells was then screened by flow cytometry in 2–6 HIV-negative controls. Results are represented as fold increase of each marker expression in infected versus exposed uninfected total CD4 T cells. Isotype control was used to define threshold of positivity. b, PBMCs from three HIV-negative controls were prepared as shown in Fig. 1a, and CD32a expression assessed in HLA- DR-negative CD4 T cells. Left, representative dot plot of CD32a expression on non-infected and infected resting CD4 T cells. Right, percentage of GFP expression by CD32a− or CD32a+ cells (n = 3 HIV-negative controls). c, Experiment performed as in b, but with cells that were treated with RAL or DMSO before infection. d, CD32a expression was assessed on PHA–IL-2-stimulated cells treated with VLP-Vpx or untreated. Results are presented as the percentage of CD32a expression among GFP− or GFP+ CD4 T cells (n = 2/3 HIV-negative controls). When applicable, mean and standard deviation are presented on histograms and paired t-test applied (* P < 0.05; * * P < 0.01).
© 2017 Macmillan Publishers Limited, part of Springer Nature. All rights reserved.
LetterreSeArCH
5 6 6 | N A T U R E | V O L 5 4 3 | 2 3 m A R c h 2 0 1 7
measured by total viral DNA (Fig. 3c). These results validate CD32a as a cell surface marker of the CD4 T cell HIV reservoir in HIV-infected virally suppressed participants.
We next investigated whether CD32a+ CD4 T cells contain an induci ble replication-competent provirus. We performed a quantitative viral outgrowth assay (qVOA) and calculated the infectious unit per million cells (IUPM) in total and CD32a+ CD4 T cells. As previously reported15, IUPM ranged from 2.2 to 5.7 in total CD4 T cells (Table 1). Notably, IUPM measured in CD32a+ CD4 T cells isolated from four participants ranged from 2,158 to 16,422 (Table 1). Thus, up to 3,000-fold enrichment in inducible replication-competent provirus is observed in CD32a+ as compared to total CD4 T cells (Fig. 3d). To determine further the contribution of CD32a+ CD4 T lymphocytes to the inducible viral reservoir in ART-treated participants, CD32a− CD4 T cells were sorted from three aviraemic participants and viral produc-tion was measured using HIV Gag p24 ultrasensitive ELISA detection after in vitro T-cell receptor stimulation (using anti-CD2, anti-CD3 and anti-CD28 beads and IL-2). For all tested participants, activation of total CD4 T cells resulted in virus production and spreading in cultures (Fig. 3e). No virus production was observed when the cells were not activated (data not shown). By contrast, depletion of CD32a+ CD4 T cells (median of 500 cells) resulted in marked delay in virus produc-tion and spreading (Fig. 3e). qVOA performed using CD32a− and total CD4 T cells isolated from one participant showed a tenfold reduction of IUPM in the former (Extended Data Fig. 3), reinforcing the contribu-tion of CD32a+ CD4 T cells to the inducible viral reservoir contained in total CD4 T cells. These experiments show that CD32a+ CD4 T cells
greatly contribute to the pool of HIV-infected CD4 T cells that harbour inducible replication-competent proviruses.
Altogether, our experiments show that CD32a fulfils the necessary criteria of a biomarker for HIV-persistent CD4 T cells. Although CD32a does not stain the entire CD4 T-cell reservoir, qVOA and viral induction assays demonstrate that CD32a+ CD4 T cells make up a substantial part of the pool of CD4 lymphocytes containing inducible replication-competent proviruses. Accordingly, we observed corre-lation between IUPM of total CD4 T cells and HIV DNA copy per cell in CD32a+ CD4 T cells, as well as between IUPM and infection frequencies of CD32a+ CD4 T-cells (data not shown). As sorting of CD32a CD4 T cells from ART-treated participants gives a nearly pure population of infected cells (average of 0.9 HIV DNA copy per cell with median of 0.5), it would be possible to study viral and cellular diversity of the HIV reservoir at the single-cell level. An exciting future direction is to determine the distribution of defective, replication- competent and inducible viruses16,17 within this population of reservoir cells. Our findings also raise important questions about the functional significance of CD32a expression on reservoir cells. The Fc region of HIV-1 Env-specific broadly neutralizing antibodies is required for their antiviral activity18 and antibody-dependent cellular cytotoxicity has a role in this process19. It will thus be interesting to determine whether CD32a expression helps to explain the recent findings that combina-tion of ART and broadly neutralizing antibodies reduces cell-associated HIV-1 DNA and prolonged viral control20. It will also be of interest to determine whether CD32a expression is part of a cellular response to viral infection or is induced by the virus. Most importantly, developing strategies aimed at targeting and eliminating the CD32a+ CD4 T cell HIV reservoir may establish the basis for a ‘direct kill’ as an alternative and or complementary approach toward a HIV cure.
Online Content Methods, along with any additional Extended Data display items and Source Data, are available in the online version of the paper; references unique to these sections appear only in the online paper.
received 24 November 2016; accepted 16 February 2017.
Published online 15 March 2017.
106
105
104
103
0
–103
106
105
104
103
0
–103
106
105
104
103
0
–103
106
105
104
103
0
–103
0 5 10 15 200
2,000
4,000
6,000 27
Tota
lTo
tal
CD32a–
CD32a+
CD32aint
CD32ahi
0.0001
0.001
0.01
0.1
1
10
HIV
DN
A c
opy
per
cel
l
***
489566
768
274562
658706724
769
776
***
******
7710
25
50
75
100
Con
trib
utio
n to
CD
4 T
cell
HIV
-1 r
eser
voir
CD4 T cellsCD4 T cells
27 489
566
771
104
103
102
101
100
IUP
M fo
ld e
nric
hmen
tC
D32
a+ t
otal
CD
4 T
cells
Participant 489:
77,7
73,8
59,5
55,9
0,026
98,4
0,001
99,8
Totallymphocytes
Tlymphocytes
CD4 Tlymphocytes
CD3 CD4CD4CD32a Count CD32a
CD
32a
stai
ning
Isot
ype
stai
ning
p24
(pg
ml–1
)
CD4 T cells CD32a– CD4 T cells
a b c
d e
0 5 10 150
5
10
15
20
25 658
0 5 10 15 200
0.5
1.0
1.5
2.0 724
Days
Figure 3 | CD32a identifies CD4 T-cell reservoir harbouring inducible replication-competent HIV-1 in ART-treated participants. a, Dot plots showing isotype control and CD32-specific staining of blood CD32ahi, CD32aint and CD32a− CD4 T lymphocyte subsets from ART-treated individuals. b, Quantification of total HIV-1 DNA copies per cell in total, CD32a+, CD32aint and CD32ahi CD4 T cells from 12 ART-treated participants. Median values are presented. Wilcoxon signed-rank test comparisons were applied, * P < 0.05, * * P < 0.01 and * * * P < 0.001, respectively (2 to 9 replicates per sample). c, Contribution of CD32a+ CD4
T cells to total viral DNA was calculated by subtracting that of CD32a-depleted CD4 T cells from that of total CD4 T cells (n = 9 participants). Mean and standard deviation are presented. d, qVOA to determine IUPM for total and CD32a+ CD4 T cells was performed. IUPM fold enrichment (CD32a+ cells per total CD4 T cells) was calculated for the indicated participants. e, Half a million total CD4 T cells (2 replicates) or CD32a− CD4 T cells (2–4 replicates) isolated from the indicated participants were T-cell-receptor-stimulated, and p24 release was measured every 2–3 days. The dotted line indicates limit of detection.
Table 1 | IUPM values for total and CD32a+ CD4 T cellsParticipant ID IUPM of CD4 T cells (95% CI) IUPM of CD32a+ CD4 T cells (95% CI)
27 2.2 (0.51–9.44) 4,977 (533–46,400)
489 5.5 (1.33–23.01) 16,422 (1,841–146,000)
566 2.2 (0.51–9.44) 2,326 (249–21,700)
771 2.2 (0.51–9.44) 2,158 (231–20,100)
Mean (confidence interval, 95% CI) are shown.
© 2017 Macmillan Publishers Limited, part of Springer Nature. All rights reserved.
Letter reSeArCH
2 3 m A R c h 2 0 1 7 | V O L 5 4 3 | N A T U R E | 5 6 7
1. Chun, T. W. et al. Presence of an inducible HIV-1 latent reservoir during highly active antiretroviral therapy. Proc. Natl Acad. Sci. USA 94, 13193–13197 (1997).
2. Chun, T. W., Davey, R. T., Jr, Engel, D., Lane, H. C. & Fauci, A. S. Re-emergence of HIV after stopping therapy. Nature 401, 874–875 (1999).
3. Finzi, D. et al. Identification of a reservoir for HIV-1 in patients on highly active antiretroviral therapy. Science 278, 1295–1300 (1997).
4. Zack, J. A. et al. HIV-1 entry into quiescent primary lymphocytes: molecular analysis reveals a labile, latent viral structure. Cell 61, 213–222 (1990).
5. Stevenson, M., Stanwick, T. L., Dempsey, M. P. & Lamonica, C. A. HIV-1 replication is controlled at the level of T cell activation and proviral integration. EMBO J. 9, 1551–1560 (1990).
6. Chomont, N. et al. HIV reservoir size and persistence are driven by T cell survival and homeostatic proliferation. Nat. Med. 15, 893–900 (2009).
7. Laguette, N. et al. SAMHD1 is the dendritic- and myeloid-cell-specific HIV-1 restriction factor counteracted by Vpx. Nature 474, 654–657 (2011).
8. Berger, A. et al. SAMHD1-deficient CD14+ cells from individuals with Aicardi-Goutières syndrome are highly susceptible to HIV-1 infection. PLoS Pathog. 7, e1002425 (2011).
9. Hrecka, K. et al. Vpx relieves inhibition of HIV-1 infection of macrophages mediated by the SAMHD1 protein. Nature 474, 658–661 (2011).
10. Descours, B. et al. SAMHD1 restricts HIV-1 reverse transcription in quiescent CD4+ T-cells. Retrovirology 9, 87 (2012).
11. Baldauf, H. M. et al. SAMHD1 restricts HIV-1 infection in resting CD4+ T cells. Nat. Med. 18, 1682–1687 (2012).
12. Cribier, A., Descours, B., Valadão, A. L., Laguette, N. & Benkirane, M. Phosphorylation of SAMHD1 by cyclin A2/CDK1 regulates its restriction activity toward HIV-1. Cell Reports 3, 1036–1043 (2013).
13. Nimmerjahn, F. & Ravetch, J. V. Fcγ receptors as regulators of immune responses. Nat. Rev. Immunol. 8, 34–47 (2008).
14. Guilliams, M., Bruhns, P., Saeys, Y., Hammad, H. & Lambrecht, B. N. The function of Fcγ receptors in dendritic cells and macrophages. Nat. Rev. Immunol. 14, 94–108 (2014).
15. Laird, G. M. et al. Rapid quantification of the latent reservoir for HIV-1 using a viral outgrowth assay. PLoS Pathog. 9, e1003398 (2013).
16. Ho, Y. C. et al. Replication-competent noninduced proviruses in the latent reservoir increase barrier to HIV-1 cure. Cell 155, 540–551 (2013).
17. Cohn, L. B. et al. HIV-1 integration landscape during latent and active infection. Cell 160, 420–432 (2015).
Supplementary Information is available in the online version of the paper.
Acknowledgements We thank the participants enrolled in this study. We thank members of the Molecular Virology laboratory for critical reading of the manuscript, J. Venables for editing the manuscript, MRI platform for FACSAria cell sorting. We are grateful to J.-F. Delfraissy and F. Barré-Sinoussi for their continuous support. This work was supported by grants from the European FP7 contract 305762, MSDAvenir, ANRS and FRM ‘équipe labéllisée’ and Labex EpiGenMed to M.B. G.P was supported by FRM fellowships; B.D. and R.R. by ANRS fellowships. T.B. was supported by a Vaccine Research Institute (VRI) fellowship. O.S was supported by grants from ANRS, VRI, Labex IBEID, Sidaction, European FP7 contract 305762 and Institut Pasteur.
Author Contributions M.B. conceived the study. M.B., G.P. and B.D. designed experiments, interpreted data and wrote the paper. R.R. analysed the RNA-seq data. T.B. and O.S. performed highly sensitive p24 assays. J.D.L., J.-L.L.-Z., C.L., C.P., J.R. and Y.L. recruited participants and collected blood samples. All the authors read and approved the final manuscript.
Author Information Reprints and permissions information is available at www.nature.com/reprints. The authors declare no competing financial interests. Readers are welcome to comment on the online version of the paper. Publisher’s note: Springer Nature remains neutral with regard to jurisdictional claims in published maps and institutional affiliations. Correspondence and requests for materials should be addressed to M.B. ([email protected]), G.P. ([email protected]) or B.D. ([email protected]).
reviewer Information Nature thanks N. Chomont, F. Nimmerjahn, D. Richman, G. Silvestri and the other anonymous reviewer(s) for their contribution to the peer review of this work.
18. Bournazos, S. et al. Broadly neutralizing anti-HIV-1 antibodies require Fc effector functions for in vivo activity. Cell 158, 1243–1253 (2014).
19. Bruel, T. et al. Elimination of HIV-1-infected cells by broadly neutralizing antibodies. Nat. Commun. 7, 10844 (2016).
20. Horwitz, J. A. et al. HIV-1 suppression and durable control by combining single broadly neutralizing antibodies and antiretroviral drugs in humanized mice. Proc. Natl Acad. Sci. USA 110, 16538–16543 (2013).
© 2017 Macmillan Publishers Limited, part of Springer Nature. All rights reserved.
LetterreSeArCH
21. Avettand-Fènoël, V. et al. LTR real-time PCR for HIV-1 DNA quantitation in blood cells for early diagnosis in infants born to seropositive mothers treated in HAART area (ANRS CO 01). J. Med. Virol. 81, 217–223 (2009).
22. Pereira Bittencourt Passaes, C. et al. Ultrasensitive HIV-1 p24 detects single infected cells and differences in reservoir induction by latency-reversal agents. J. Virol. 91, e.02296-16 (2017).
23. Rosenbloom, D. I. et al. Designing and interpreting limiting dilution assays: general principles and applications to the latent reservoir for Human Immunodeficiency Virus-1. Open Forum Infect. Dis. 2, ofv123 (2015).
MeThODSData reporting. No statistical methods were used to predetermine sample size. The experiments were not randomized and the investigators were not blinded to allocation during experiments and outcome assessment.Plasmids. The SIV3+ plasmid was provided by N. Manel. pHRET was pro-vided by C. Mettling. pCMVdeltaR8.2 packaging plasmid was obtained from D. Trono (Addgene plasmid 12263). pMD2-G VSV-G envelope was previously described7.VLP and virus production. VLP and viral particles were produced from myco-plasma-free 293T cells (ATCC CRL-3216) using the standard phosphate calcium transfection protocol. For VLP-Vpxmac251, 293T cells were transfected with 8 μ g SIV3+ and 2 μ g pMD2-G VSV-G-encoding plasmid. Media was replaced 16 h after transfection and VLP were collected 48 h later, filtered at 0.45 μ m and concentrated 100-fold by ultracentrifugation. HIV-cmv-GFP was produced by transfection of 6 μ g of pHRET, 3 μ g of pCMVdeltaR8.2 packaging vector and 2 μ g of pMD2-G. Viral stocks were quantified by measuring viral p24 antigen by ELISA (Zeptometrix) and multiplicity of infection was determined by titration in 293T cells.Infection and flow cytometry cell sorting of in vitro infected resting CD4 T cells. PBMCs from HIV-non-infected individuals were isolated from blood samples by Ficoll gradient (Eurobio) and cultured for 12 h in the presence of VLP-Vpx at a density of 2 million cells per well (24-well plates) in 300 μ l of 10% FCS supple-mented complete RPMI (Invitrogen). Infection was then performed by addition of HIV-cmv-EGFP (1 μ g of p24 per well). As controls, cells were either exclusively treated with VLP-Vpx or left untreated. Three days after infection, infected (XH+), bystanders (XH−) and control (X and non-infected) resting (negative for CD69 and HLA-DR) CD4 T cells were sorted on a FACS Aria (BD Biosicences) using the following antibodies combination: BV421-CD3 (UCHT1; BD Biosciences), Cy7PE-CD4 (RPA-T4; BD Bioscience), PE-HLA-DR (L243; BD Biosciences), APC-CD69 (FN50; BD Biosciences). A minimum of 160,000 cells were sorted, resuspended in 350 μ l of RA1 buffer (GE Healthcare) + 3.5 μ l of β -mercaptoethanol and stored at − 80 °C after total RNA extraction.RNA sequencing, bioinformatic analysis and validation by flow cytometry of selected candidates. Total RNA extraction using GE Healthcare Illustra RNA mini kit was performed. RNA quality was analysed on Agilent Bioanalyzer 2100 with a RNA NanoChip. Standard TruSeq RNA Sample Prep, barcoded, Illumina was used to prepare the library. Samples were multiplexed (by 2) on Illumina HiSeq2000 slides which provides 75–100 million single-end reads of 100 nucleotides per sample (sequencing data have been deposited at SRA with reference numbers SRR5071107–SRR5071122). Reads were mapped to the Hg38 reference genome using STAR and counted using HT-SeqCount. The DESeq2 R Package was then used to perform Differential Expression analysis between conditions. The Rlog transformed count from DESeq2 were used to perform PCA. Involvement in biological pathways of DE genes in XH+ compared to XH− and non-infected cells were analysed using REACTOME and STRING databases. Expression at protein level of identified candidates was tested by FACS on in vitro infected rest-ing CD4 T cells using the following primary antibodies: rabbit anti-AQP9 and mouse anti-CA12 (Abcam), rabbit anti-GPR91 and rat anti-NIACR1 (Novus Biological), sheep anti-CD66d, goat anti-COLEC12, mouse anti-SCARF1 and mouse anti-CLEC4D (R&D system), rabbit anti-STEAP1B (Cliniscience), goat anti-GJB2 (SantaCruz Biotechnology). Relevant Alexa647 species-specific anti-IgG secondary antibodies were purchased from Life Technologies. Conjugated antibodies were also used: APC anti-CD32 (FL18-26, BD Biosciences and FUN-2, Sony Biotechnology), APC anti-CD80, APC anti-CD354, PE anti-CSF2RA and PE anti-TLR2 (Sony Biotechnology) and eFluor660 anti-CD300c (ebioscience). Paired isotype controls were purchased for each antibody. Where mentioned, PHA (2 μ g/ml) and IL-2 (50 U/ml) were used to activate cells.
ART-treated HIV-1 infected participant cells and flow cytometry sorting of CD4 T-cell subsets. Twelve HIV-1-infected participants, under suppres-sive ART (11 out of 12 with < 20 HIV-1 RNA copies per ml, and 1 with 33 HIV-1 RNA copies per ml) for a median of 26 months (min–max, 10–89), were included in this study (Supplementary Table 1). They were recruited from the Montpellier University Hospital and from Henri Mondor University Hospital, Creteil (COHORT Physiopathologie). The study was approved by the local Ethics Committee, and all participants gave written informed consent. Fresh PBMCs were isolated from blood samples by Ficoll gradient (Eurobio). 50–100 million HIV-1 infected patient PBMCs were first incubated with Fcγ R-blocking reagent (BD Pharmingen) for 10 min and then stained with the following anti-body combination: BV421-CD3 (UCHT1), PECy7-CD4 (RPA-T4), PE-HLA-DR (L243) and APC-CD32 (FUN-2). APC-IgG2 was used as isotype control. All the antibodies were purchased from Sony Biotechnology. Total CD4+ T cells (CD3+CD4+), CD32a depleted CD4+ T cells, and CD32ahi CD4 T cells were sorted in a BSL3 confinement laboratory on a four-laser SH800 cell sorter (Sony Biotechology) in ultra-purity mode. The population expressing an intermediate level of CD32a was also sorted and referenced as CD3+CD4+CD32aint. For each sorted fraction, cells were split for HIV-1 DNA quantification, qVOA and viral induction assay.Quantification of viral DNA. Total DNA was extracted from each sorted subset (total CD4 T cells, CD32a−, CD32aint and CD32ahi CD4 T cells) (QIAamp DNA micro DNA kit, Qiagen). Cell HIV-1-DNA was quantified by ultrasensitive real-time quantitative PCR using primers and probes targeting a conserved consensus sequence in the LTR (Biocentric)21. Results were normalized to the β -globin copy numbers which were quantified on DNA extract according to manufacturer’s instructions (Control kit DNA, Roche).Viral induction and quantitative viral outgrowth assays. FACS-sorted cell subsets from the indicated participants were used to perform viral induction assay and/or a quantitative viral outgrowth assay (qVOA). Both assays were per-formed by first stimulating CD4 T cells with anti-CD2/anti-CD3/anti-CD28 coated beads (Miltenyi) and 50 UI/ml IL-2 (Roche). For viral induction assay as many as possible replicate wells of 0.5 million CD4+ T lymphocytes and CD32a depleted CD4+ T cells were cultured in 24 well plates and p24 released in the supernatant measured every 2–3 days by ultrasensitive digital ELISA (Simoa technique from Quanterix)22. qVOA was performed as previously described15. Briefly, serial dilutions of total (from 1 million to 1,600 cells) and CD32a+ CD4 T cells (from 800 to 1 cell) were performed to determine the minimal amount of infectious units per million of each population (IUPM) using IUPMstat23. Ultrasensitive digital ELISA measured the released viral p24 in the supernatant (ELISA limit of detection values were 0.01–0.04 pg/ml).Data availability. Source Data for Figs. 2, 3 and Extended Data Figs 1a, 3 are provided with the paper. Reads count and list of differentially expressed genes are provided in Supplementary Tables 1 and 2. Clinical parameters of the participants and related data are provided in Supplementary Tables 3 and 4. RNA-seq data are accessible through the Sequence Read Archive (https://www.ncbi.nlm.nih.gov/sra) with reference numbers SRR5071107–SRR5071122.
© 2017 Macmillan Publishers Limited, part of Springer Nature. All rights reserved.
Letter reSeArCH
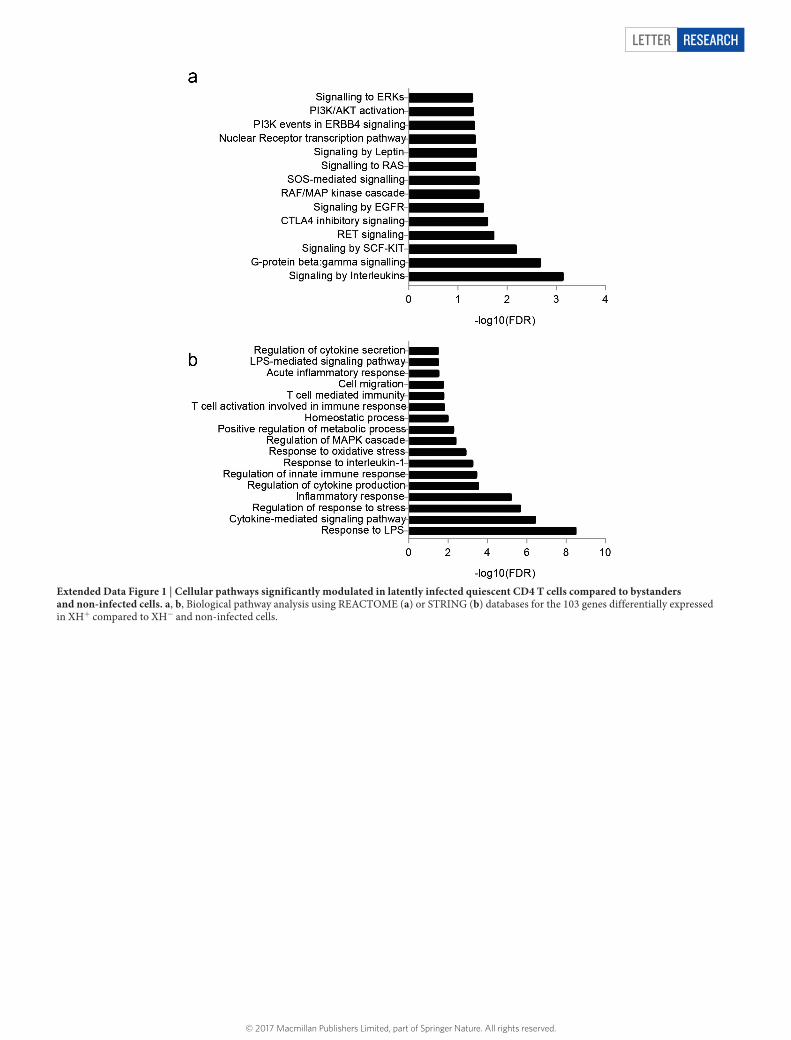
Extended Data Figure 1 | Cellular pathways significantly modulated in latently infected quiescent CD4 T cells compared to bystanders and non-infected cells. a, b, Biological pathway analysis using REACTOME (a) or STRING (b) databases for the 103 genes differentially expressed in XH+ compared to XH− and non-infected cells.
© 2017 Macmillan Publishers Limited, part of Springer Nature. All rights reserved.
LetterreSeArCH
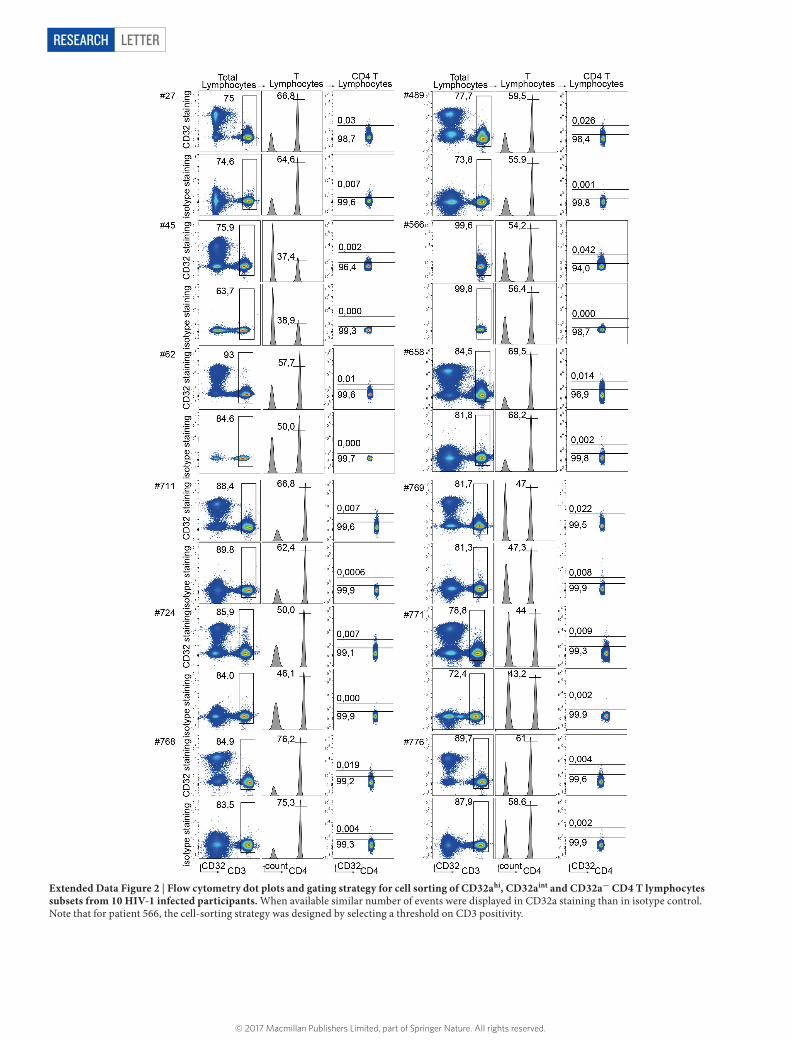
Extended Data Figure 2 | Flow cytometry dot plots and gating strategy for cell sorting of CD32ahi, CD32aint and CD32a− CD4 T lymphocytes subsets from 10 HIV-1 infected participants. When available similar number of events were displayed in CD32a staining than in isotype control. Note that for patient 566, the cell-sorting strategy was designed by selecting a threshold on CD3 positivity.
© 2017 Macmillan Publishers Limited, part of Springer Nature. All rights reserved.
Letter reSeArCH
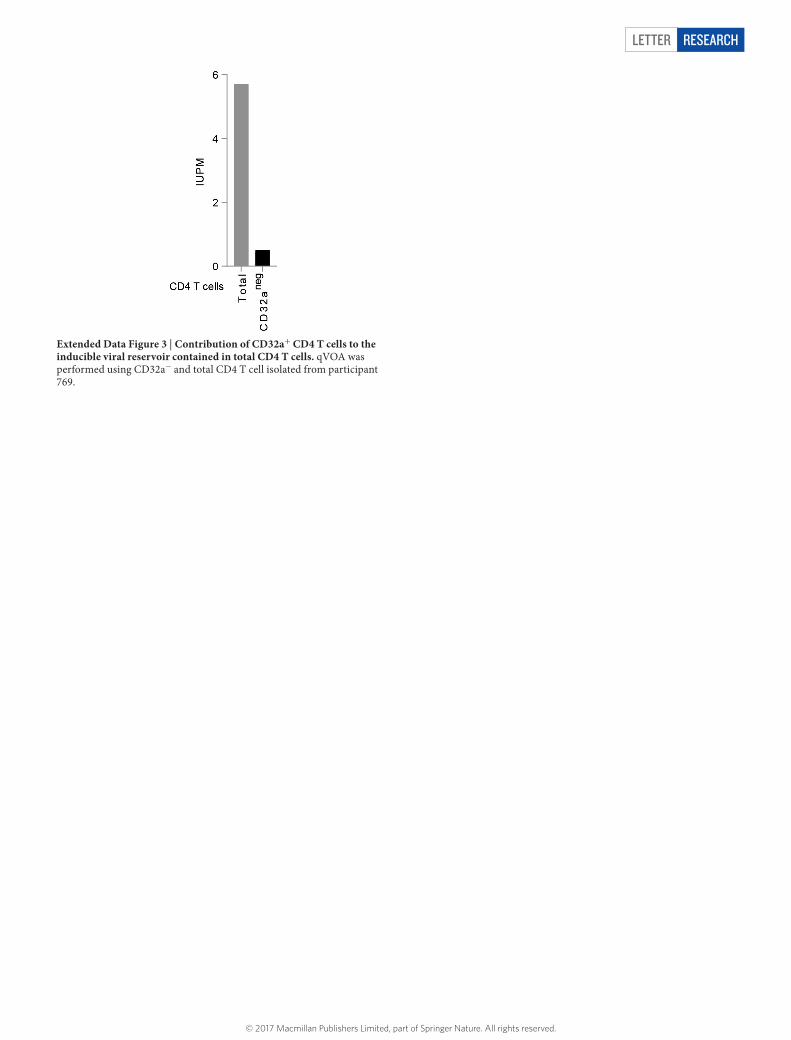
Extended Data Figure 3 | Contribution of CD32a+ CD4 T cells to the inducible viral reservoir contained in total CD4 T cells. qVOA was performed using CD32a− and total CD4 T cell isolated from participant 769.
© 2017 Macmillan Publishers Limited, part of Springer Nature. All rights reserved.

6 8 6 | N A T U R E | V O L 5 4 6 | 2 9 J U N E 2 0 1 7
Corrigendumdoi:10.1038/nature22807
Corrigendum: Cd32a is a marker of a Cd4 T-cell HiV reservoir harbouring replication-competent provirusesBenjamin Descours, Gaël Petitjean, José-Luis López-Zaragoza, Timothée Bruel, Raoul Raffel, Christina Psomas, Jacques Reynes, Christine Lacabaratz, Yves Levy, Olivier Schwartz, Jean Daniel Lelievre & Monsef Benkirane
Nature 543, 564–567 (2017); doi:10.1038/nature21710
In the Acknowledgements section, the European FP7 contract number was incorrect in two places; it should be 305762. The original Letter has been corrected online.
CORRECTIONS & AMENDMENTS
© 2017 Macmillan Publishers Limited, part of Springer Nature. All rights reserved.


