Embed Size (px)
Citation preview

1
Jasco J-810
Spectropolarimeter
Basic Operating Manual
Written by:
Adam Fung University of Maryland
Department of Chemistry and Biochemistry College Park, MD 20742
2
This manual serves as a short-course guide to the basic operating procedures to measure
CD spectra, the most common maintenance, and the most frequent troubleshooting issues
for the Jasco J-810 circular dichroism spectropolarimeter.
A very important note to consider when comparing multiple spectra is concentration. It is
absolutely critical that concentrations are accurately determined. Otherwise, comparison
between samples is futile.
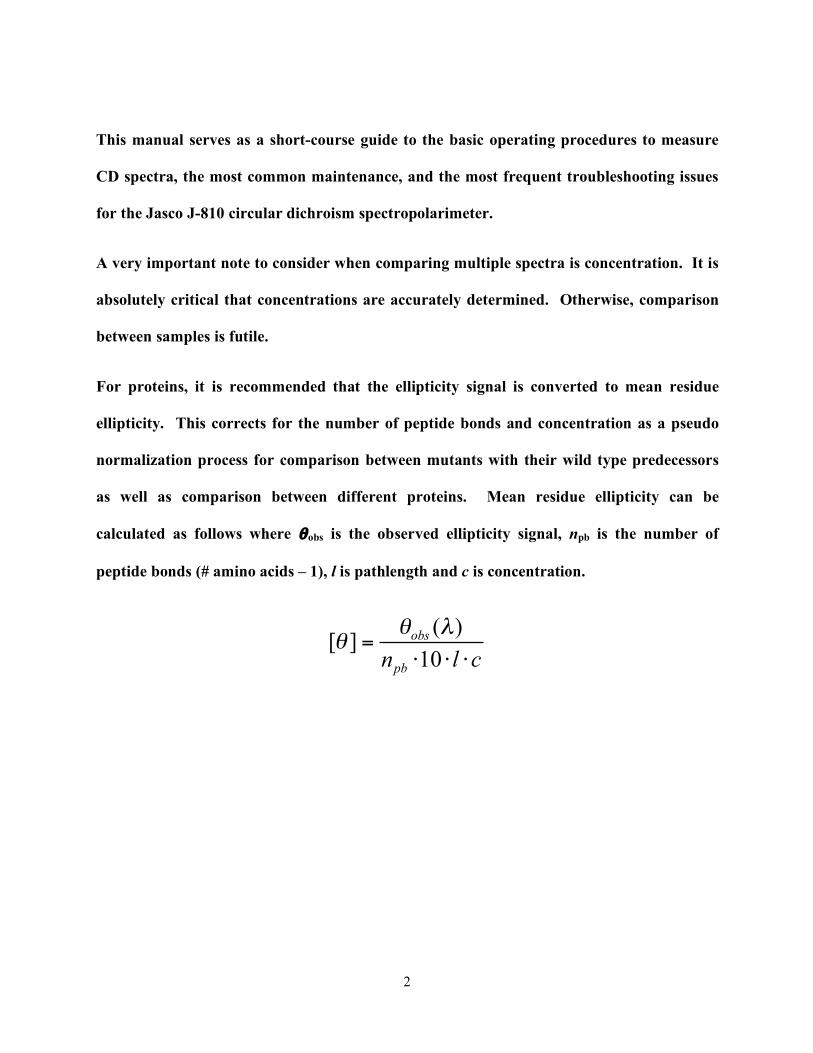
For proteins, it is recommended that the ellipticity signal is converted to mean residue
ellipticity. This corrects for the number of peptide bonds and concentration as a pseudo
normalization process for comparison between mutants with their wild type predecessors
as well as comparison between different proteins. Mean residue ellipticity can be
calculated as follows where θobs is the observed ellipticity signal, npb is the number of
peptide bonds (# amino acids – 1), l is pathlength and c is concentration.
( )[ ]
10
obs
pbn l c
! "! =
# # #

3
Contents:
I. Basic Instrument Initialization
a. Purging with N2 Gas 4
b. Turning Jasco J-810 Instrument On/Off 5
c. Initializing Instrument 6
d. Using Peltier Temperature Controller 6
e. Summary of Initialization 7
II. Spectrum Measurement
a. Parameters 7
b. Measuring and Saving CD Spectra 10
c. Summary of Spectrum Measurement 10
III. Other Programs
a. Time Course Measurement 11
b. Interval Scan Measurement 11
c. Data Monitor 12
d. Environment 12
e. Variable Temperature 12
f. Temperature/Wavelength Scan 12
g. Titration Spectrum Measurement 13
h. Titration Measurement 13
IV. Maintenance
a. Changing the Lamp 14
4
b. CD Scale Check Calibration 16
c. Peltier Element 17
V. Troubleshooting
a. Peltier changing temperature relatively slowly 18
b. Amp check error upon initialization 18
c. HT ‘Too High’ upon initialization 18
d. HT ‘Too Low’ upon initialization 19
e. Voltage higher than usual with no sample in chamber 19
f. Voltage does not increase when sample chamber is closed 19
g. High levels of noise 19
h. Low reproducibility of CD spectra 20
VI. Contacting Jasco
a. Contact Information and Instrument Serial Numbers 21

5
I. Basic Instrument Initialization:
a. Purging with N2 Gas
You should find the instrument located in the Biochemistry building in room 3517. The
instrument consists of the main spectropolarimeter unit with the monochromator on the right side
of the sample chamber, a Peltier temperature controller (Model JWJTC-484), a water bath, and
Dell computer. Also integral to the instrument is a nitrogen gas line connected to N2 cylinders at
the end of the bench.
To use the instrument, use the log book to reserve the instrument, track user history, and
monitor lamp life.
First, before turning on the instrument, be sure to purge the instrument with nitrogen gas
for 10 minutes. This is accomplished by turning the tank regulator anti-clockwise. There are
four ways to regulate the pressure of the gas. The first is the tank regulator which is part of the
gas tank itself. Second is the large black knob facing out on the Fisher Scientific gas regulator.
The third is the small black knob facing down on the Fisher regulator. The final way is the gas
flow regulator directly attached to the front of the sample chamber. If nobody changes the
settings on the other knobs, the only thing the user will need to do is open the flow of the gas
directly from the tank. Here, a full tank should have pressure between 2000 and 2700 psi. Tank
pressure can be monitored by the pressure guage on the right. The large black knob controls the
flow rate through the Fisher regulator and should read between 8 and 10 psi, as viewed on the
left guage on the Fisher regulator. The sample chamber regulator should have the top edge of the
floater at 40 psi. The approximate flow rate is 450 liters per hour. Thus, a full tank should be
6
able to last for 4.5 – 6 hours. It is critical that the instrument never be run without nitrogen gas.
The optics can be ruined from the buildup of ozone on the optical mirrors if run without nitrogen.
NEVER OPERATE THE INSTRUMENT WITHOUTH NITROGEN GAS. The user
should replace cylinders no later than when the pressure on the Fisher regulator reads 200
psi.
It is important for the user to replace nitrogen cylinders as they use them to ensure that
enough gas is available for future users. Room 3517 has the capacity to store 4 cylinders at a
given time. One should always be securely connected to the instrument via the bench-top cradle,
while three can be securely stored with a chain along the wall. It may be necessary to use Teflon
tape to prevent gas leaking between the tank and regulator.
Typically, empty cylinders are securely stored w/ lids off to indicate that they are empty.
However, empty cylinders should be replaced as soon as possible and not left for the next user to
deal with. Replacement cylinders can be exchanged in the chemistry receiving department.
Users should use ‘general use’ as the user name and account number 111640GE when checking
out cylinders. Be sure to sign and date the card when checking out and returning cylinders.
b. Turning Jasco J-810 Instrument On/Off
To turn on the CD spectropolarimeter after purging with nitrogen gas, make sure the
computer and monitor is turned on. The default username is ‘Administrator’ while the password
is left blank. Just click ‘OK’ to proceed and log in (Note: It is not necessary to turn off the
computer between usages. Just log out and power off the monitor). Next, turn on the instrument
by flipping the large green switch on the front of the spectropolarimeter to the ‘On’ position
(You will hear an audible beep). Next, turn on the Peltier temperature controller and the water

7
bath. If the user will be measuring spectra at very low temperatures, change the water bath
temperature to 14 degrees C while measuring at these low temperatures. The normal
temperature setting for the water bath should be 18 degrees C. The instrument is now on and
ready to be initialized.
c. Initializing the Instrument
Double click on the ‘Spectra Manager’ icon on the computer’s desktop. A menu of
software program macros will appear. For a simple far-UV or near-UV measurement over a
given wavelength range, double click on ‘Spectrum Measurement.’ The instrument will now
undergo its initialization process by checking the internal diagnostics (See troubleshooting guide
if errors occur). Once the diagnostics are completed, the shutter will open and the lamp will be
turned on. Confirmations of these processes are both audible by single clicking noises and visual
by the lumination of two green lights on the front panel of the instrument. The lamp should be
allowed to warm up for ten minutes. When the lamp has reached 400+ hours, allow the lamp 15
– 20 minutes of warm up time to ensure reproducibility. The lifetime of the lamp is around
500 hours. It is imperative that the user record the lamp life before and after their
experiment. To accomplish this, select ‘Light Source’ from the ‘Control’ menu. In the log
book, record the lamp’s hours both before and after the experiment.
d. Using Peltier Temperature Controller
If the user wishes regulate the temperature of the sample for reproducibility and/or to take
measurements at various temperatures, the Peltier temperature controller must be activated. To
do this, in the Spectrum Measurement program, click on the ‘Measurement’ menu, then
‘Accessory.’ Select ‘JASCO Peltier Type (Single, RTE On)’ in the ‘Temperature’ drop down

8
menu. Then, click ‘OK.’ The temperature controller will now be initialized. To activate the
temperature controller, the user must press the ‘Start’ button on the front of the
temperature controller. If the user does not press ‘Start,’ the Peltier unit and the software will
not synchronize. To change the temperature, select the ‘Control’ menu and then click
‘Accessory’ and the accessory control panel will appear. Key in the desired temperature and
click ‘Apply,’ then ‘Close.’ The temperature controller will now change to the desired
temperature.
e. Summary of Initialization
1. Reserve the CD instrument ahead of time using the logbook
2. Purge CD with nitrogen gas for 10 minutes
3. Ensure computer is turned on, and then turn on instrument, Peltier, and water bath.
4. Initialize the instrument and record the lamp lifetime in the log book
5. Initialize the temperature controller using the computer software and physically press ‘Start”
on the temperature controller.
II. Spectrum Measurement
a. Parameters
To collect CD spectra, click on the ‘Measurement’ menu and select ‘Parameter.’ Here is
where the user can change the parameters to best suit their needs depending on the sample to be
measured. It is recommended that each user consult the literature for appropriate
9
parameters and to have a good idea about what to expect from the signal output. Under no
circumstances should the instrument be used without a good frame of reference.
Each sample is different. The utmost consideration should be given to sample
composition. It is best to keep the sample composition as simple as possible. Many buffers
absorb (any chiral molecule can have CD) and protein or DNA concentration greatly affects the
signal to noise ratio. These are perhaps the most important things to consider when preparing
samples. Again, consult the literature before using the instrument.
The basic parameters generally used are as follows:
Sensitivity: Standard (100 mdeg) Start Wavelength: 250 (far-UV CD), 320 (near-UV CD) End Wavelength: 190 (far-UV CD), 250 (near-UV CD) Data Pitch: 1 nm Scanning Mode: Continuous Scanning Speed: between 10 – 100 nm/min slower scanning rate generally gives better data quality Response: this parameter depends on the scanning speed. These two parameters are inversely proportional. The response time is a pseudo averaging time which allows the data to stabilize. Bandwidth: 2 nm Accumulation: 1 Accumulation determines the number of scans. Typically, multiple scans are taken at higher scanning rates and these are manually averaged. Using a slower scanning rate can alleviate this. Under the ‘Data Mode’ menu, the user can select up to 4 “channels.” Typically, only two
are necessary. Channels 1 and 2 should always monitor CD signal and HT (Voltage)
respectively. It is imperative that the user monitor the HT signal as this gives a direct measure of
the amount of light being produced and passed through the sample. If the voltage increases
above 700, the signal will start to become noisy and the CD output will become unreliable. If the
voltage increases beyond 800, the noise will become disproportionate to the sample signal and
the output will be completely unreliable.
10
The voltage increases proportional to the absorption of the sample. If a buffer component
is highly absorbent of circularly polarized light, the light source will increase the amount of light
being generated to achieve the same level of light passing through the sample (not absorbed). If
the voltage raises beyond 700, the user should dilute the buffer concentrations accordingly. It is
a good idea if the user is unsure of the absorptive properties of their buffer to run a buffer
blank before preparing samples to assess the extent the buffer contributes to the CD
spectrum. Be sure to check absorbance over the range of wavelength you intend on using.
Voltage, thus absorbance, is wavelength dependent. To ensure that the sample does not
max out the limitations of the detector, insert your sample in the sample chamber and close the
lid. Then, select the ‘Control’ menu and select ‘Move Wavelength.’ Change the wavelength to
the ends of the wavelength range you wish to monitor each time allowing the data to stabilize
and monitor the voltage. This can be viewed from the spectrum measurement window viewing
the digital box on the second row down, third from the left. Repeat this with a few wavelengths
in the middle of the range. If the voltage is below the noise threshold, continue with operation
(Note, voltage increases with increasing temperature. If you wish to do a
temperature/wavelength scan, be sure the voltage never exceeds 500 volts at the starting
temperature).
Once again, referencing the literature is the best way to determine a starting point.
Once the parameters are input and the voltage checked over the wavelength range, select
the ‘Data File’ menu from the ‘Parameter’ menu. Give your spectrum an appropriate name and
save it accordingly in a folder under your name.
The ‘Option’ menu allows the user to record important information regarding their
sample. This is an optional feature.

11
b. Measuring and Saving CD Spectra
You may now push ‘Start’ on the spectrum measurement window. The spectrum will be
obtained and a new ‘Spectra Analysis’ window will appear showing your spectrum. To save this
file as a text document for further processing using signal processing or spreadsheet software,
select ‘File’ from the menu, and then ‘Save As.’ Select the appropriate folder and make sure the
file extension .txt is used. This file can now be transferred to your computer and processed
further.
c. Summary of Spectrum Measurement
1. Input appropriate parameters
2. Check wavelength dependent voltage of buffer and sample (not to exceed 700 volts)
3. Give spectra name and direct it to save in appropriate folder
4. Take measurement by clicking ‘Start’
5. Save file as text document for further processing
III. Other Programs
a. Time Course Management
This program monitors a single wavelength over a period of time. The time course
program is a way to measure kinetic processes on the timescale of seconds to minutes. As it only
monitors at one wavelength, it is important that the sample measured absorbs strongly and
consistently at a characteristic wavelength.
b. Interval Scan Measurement
12
c. Data Monitor
The data monitor program is not generally used for spectral measurements. This program
is used during calibration and to monitor the signal when performing the CD scale check after
replacing a lamp.
d. Environment
This program is only used when performing calibrations during preventative maintenance
by Jasco technicians. General users do not need to use this application.
e. Variable Temperature
The variable temperature application allows the user to monitor a single wavelength as a
function of temperature. If a single characteristic absorbance is observed in a sample, this
program will allow the user to perform thermal denaturation experiments monitoring at that
single wavelength.
f. Temperature / Wavelength Scan
The temperature/wavelength scan is an extension of the variable temperature program.
This application features the ability to monitor a range of wavelengths (ie far-UV, near-UV --
like the spectrum measurement program) and a single wavelength as a function of temperature.
This program allows the user to monitor the entire spectrum of interest as a function of
temperature which is especially useful when measuring samples which have multiple
wavelengths where the sample absorbs circularly polarized light. This program allows the ability
to monitor complex relationships and coupling between various wavelengths for more thorough
analysis compared to following a single wavelength. Use of this program is nearly identical to
the ‘Spectrum Measurement’ application. The only difference is that there are two variable
parameter menus to navigate (temperature & wavelength). Note: to change the range of
13
temperatures, enter the desired starting and final temperatures in the ‘Temperature’ menu, then
click the ‘Reset’ button followed by the ‘Append’ button.
g. Titration Spectrum Measurement
Refer to the ‘Automatic Titration System Instruction Manual’ for more detailed
instructions and schematics of the titrator module. The model number of the module is ATS-
429S/429L.
The titration programs utilize the optional titration module and are a simple way to
perform chemical titrations. A 1 cm cuvette must be used with the optional cuvette cover and
appropriate attachments. Assembly of the cuvette is self explanatory, and the tubing delivering
the solute injections should be routed through the black circular protrusion at the top of the
sample chamber lid. There are two holes drilled through to the sample chamber for the inlet and
outlet flow of solution. Extreme caution should be considered when using salts which will
crystallize and cloud the optics if the sample volume exceeds the capacity of the cuvette at
any time.
It should be noted that in the experience of this user, the internal calculations performed
using the software are incorrect. It is prudent to perform dilution and concentration calculations
manually instead of relying on the software calculations. It is also necessary to check the
volume of the injections. With CD, concentration is a critical variable that propagates large
errors if not checked.
The titration spectrum measurement program monitors a range of wavelengths with each
injection of solute. Chemical denaturation or ligand binding are common measurements
monitored with this application.
h. Titration Measurement

14
Titration measurement simply monitors a single characteristic wavelength with each
injection of solute. See notes above for precautions.
15
IV. Maintenance
a. Changing Lamp
The Jasco J-810 uses an Osram 150 watt Xenon lamp (Jasco Part Number 3027) which
has a typical lifetime of 500 hours, but the lifetime can vary between new light sources. It is
recommended to keep a spare lamp on hand if the user notices much more noise than usual,
having to wait for longer than 20 minutes for the signal to become steady, or if the initialization
diagnostics upon instrument startup indicated that the voltage (HT) is “Too High.” It is a good
idea to regularly monitor the voltage with no sample in the sample chamber at 250 nm and to
record the voltage at this wavelength in the logbook upon replacing the lamp. An indication of
the lamp being replaced should also be noted in the logbook. If the voltage increases more than
~ 50 volts, try replacing the lamp.
It is critical for safety that the instrument is turned off before replacing the lamp. It is
also HIGHLY recommended that if the instrument has been on before lamp replacement, the
light source should be thoroughly cooled before handling. The lamp anode and cathode holders
should be cool to the touch. Never handle the lamp by touching the glass.
The orientation of the lamp is critical. The polarity of the Xe lamp should not be
confused. Be sure the anode end is on top and the cathode on bottom. A “knob” is apparent
in the middle of the glass “bulge.” This should never face either of the mirrors (M0 & M1). If
the voltage is “Too Low” when initializing the instrument for the first time after lamp
replacement, check the orientation of the lamp. Being misaligned by a millimeter can have a
huge affect on the voltage. (See pages 23-25 in the ‘Hardware/Function Manual’)
Follow the steps below to replace the lamp:
16
1. Ensure the instrument if OFF
2. Remove the light source cover on the back left corner of the top of the instrument.
This is a “mesh” covered enclosure fastened with three fixing screws.
3. Loosen the two screws which hold the light source in place. These two screws are
tightened against the anode holder.
4. Slowly remove the lightsource by holding the anode holder and unscrewing it from the
light source. The light source is spring loaded so use extreme caution and have a steady
grip at all times. Also make sure to note the orientation of the protrusion on the bulge of
the light source so you know which way to reinstall the new light source. The anode holder
is the metal end which is used pull the light source from the chamber.
5. Remove the cathode adaptor from the old lamp. The cathode adaptor is the slightly
pointed metal end at the bottom of the light source.
6. Attach the anode holder and cathode adaptor to the new light source. Do not touch
the glass of the light source.
7. Secure the light source via the anode holder with the two fixing screws making sure
the protrusion on the glass bulge of the light source does not point towards the mirrors. It is best
to replace the light source with the protrusion in the same orientation as the old lamp.
8. Secure the light source cover and with the three fixing screws.
9. Start up the instrument
10. Initialize the instrument by opening the data monitor program
11. Select the ‘Parameter’command from the ‘Setting’ menu and set the following:
Sensitivity: Standard (100 mdeg), Response: 1 sec, Band Width: 1 nm.
17
12. Select the ‘Data Mode’command from the ‘Setting’ menu and input the following:
Num. of Channel: 2, Channel #1: CD, Channel #2: HT.
13. Select the ‘Setting’ menu and ‘Move Wavelength’ to 546.1 nm.
14. Remove the cover of the M0 and M1 mirrors (see page 25 in ‘Hardware/Function
Manual for illustration) and see 3 adjustment screws for each mirror.
15. Adjust the screws for the M1 mirror to minimize the voltage with the sample chamber
empty. This takes patience and very fine adjustments. Typically a HT value to try and
achieve is 310 Volts at 546.1 nm through adjustment of the M1 mirror. The manufacturer
suggests a value between 200 – 300 volts, but this user has never achieved anything below 300
(the Jasco technician could not either).
16. Adjust the screws for the M0 mirror to minimize the voltage with the sample chamber
empty. It is the experience of this user that the M0 mirror needs minimal if any adjustment.
Focus on the M1 mirror.
17. Reinstall the mirror covers
b. CD Scale Check
Once the lamp has been replaced, it is necessary to adjust the CD scale to ensure proper
amplitude of the CD signal. Follow the procedures below:
1. Start up the instrument and initialize the ‘Spectrum Measurement’ program
2. Allow the lamp to warm up for 1 hour prior to adjusting the CD scale
3. Prepare a 0.06% (w/v) aqueous solution of ammonium d-10-camphor sulfonate. This
is achieved by weighing out 0.03 g (30 mg) and dissolving in 50 mL. It is very important to
make an accurate sample as reproducibility will be influenced between lamp changes
otherwise.

18
4. Select ‘Parameter’ from the ‘Measurement’ menu and set parameters to the following:
Sensitivity: Low(1000mdeg), Start: 350 nm, End: 250 nm, Data Pitch: 0.1 nm, Scanning Mode:
Continuous, Scanning Speed: 50 nm/min, Response: 1 sec, Band Width: 1 nm, Accumulation: 1.
Under the ‘Data Mode’ menu, select 2 channels, CD and HT respectively.
5. Fill a 1 cm pathlength cuvette with the 0.06% solution of ammonium d-10-camphor
sulfonate and place the sample in the sample chamber.
6. Select ‘Start’ command
7. Confirm that the peak from channel 1 (CD) is 190.4 +/- 1 mdeg at 291 nm. If the peak
maximum does not fall within this range, use a small screwdriver to adjust the recessed ‘Scale
Correction CD’ adjustment screw on the back side of the instrument until the ellipticity reads
within the appropriate range (See pg 29 in the ‘Hardware/Function Manual’ for illustrations.
c. Peltier Element
On the occasion that the user is measuring spectra over a wide thermal range, but the
temperature changes very slowly or if the user plans to collect spectra at very low temperatures
(ie below 0 degrees C) the Peltier element housed within the sample cell holder may need to be
replaced. The Peltier element degrades over time and does not conduct heat as efficiently as a
new element. If the Peltier element needs replacement, there are two options, the user can
remove the sample chamber and send to Jasco for repair, or a Jasco technician can come and
replace it. The user cannot do this on their own as the Peltier element must be carefully packed
and soldered into place. This is a messy job. The most cost effective plan is to remove the
sample cell holder and shipping to Jasco in Easton, MD. To do this, all that must be done is
removing the bolts fixing the sample holder in place (ie the entire assembly where the cuvette is
placed) which are screwed to the bottom of the sample compartment. The electronics must be

19
unclipped and the temperature probe removed. This is a rather robust sample chamber, but
utmost care must be taken not to scratch or break the sample compartment windows in the light
path.
V. Troubleshooting
In addition to the troubleshooting guide provided on pages 31 – 33 in the
‘Hardware/Function Manual,’ this user will offer a few helpful suggestions on dealing with
common problems encountered during operation.
a. Peltier changing temperature relatively slowly
The Peltier element may need to be replaced. Slow temperature changes will be noticed
especially at very low temperature (ie below 0 degrees C). To prolong the life of the Peltier
element and save on costs for replacement/labor, the circulating water bath can be used to help
the Peltier achieve these low temperatures. Under normal operation of the CD at room
temperature, set the water bath to 18 degree C. For temperatures below 0 degrees C, set the
water bath to 14 degrees C. This will make the temperature change more quickly.
b. Amp check error upon initialization
This is an internal test voltage that has no bearing on the analysis or normal operation of
the CD. It is advised to contact Jasco upon this occurrence however to discuss symptoms with a
technician. It should not be assumed that the instrument can be continually run without further
maintenance.
c. HT ‘Too High’ upon initialization
There is most likely a light leak somewhere. The most common place for this is the
sample chamber. Make sure the lid to the sample chamber is closed properly and the latch on the
far left front of sample compartment is in contact with the sample compartment lid. This latch is
20
pressed down normally when the lid is closed and controls the shutter being opened and closed
when the lid is closed and opened respectively.
Also be sure that there is no sample in the sample holder which could obstruct the light
path.
d. HT ‘Too Low’ upon initialization
Alignment of the lamp is likely off. Make sure the protrusion of the light source is not
facing either the M0 or M1 mirrors. Gently loosen the fixing screws of the light sources and
slightly turn the light source before re-securing. Check again upon initialization to be sure the
HT is ‘OK.’
e. Voltage higher than usual with no sample in chamber
The lamp needs to be replaced (Jasco Part Number 3027). Regular monitoring at low
wavelengths with no sample in the chamber should be performed and recorded routinely to
monitor for noise related to the lamp life.
f. Voltage does not increase when sample chamber is closed
Be sure the shutter is open and that the lid to the sample chamber is pressing down on the
latch which controls the shutter.
g. High levels of noise
The most likely cause for this problem is high absorption of sample components such as
salts. Dilute the buffer concentration and retry. A shorter path length cuvette may also be
advisable.
The lamp may need to be replaced (Jasco Part Number 3027). See section e above.
21
The spectral bandwidth may be set too low. Try increasing the bandwidth to allow more
light to pass through the sample.
h. Low reproducibility of CD spectra
The most common cause for this problem is slight alterations in sample concentration. It
is critical that sample concentrations be maintained in order to obtain consistent and reproducible
spectra. It is also critical if the user wishes to compare spectra between proteins with the same
number of amino acids.
The lamp may be getting old and may require longer warm up times than 10 – 15
minutes.
The scanning speed may be too high. Lower scanning speeds allow the user to obtain
more consistent and reproducible CD spectra. The response time is also longer at slower
scanning speeds which allows for a longer averaging time for the signal to become stable.

22
VI. Contacting Jasco
a. Contact Information and Instrument Serial Numbers
Jacso Incorporated 8649 Commerce Drive Easton, MD 21601 www.jascoinc.com Telephone: 800-333-5272 410-822-1220 Fax: 410-822-7526 The current Jasco service engineer is Ron Miller – [email protected] (Note, service engineers change with relative consistency) To contact a service engineer or schedule maintenance, use one of the two telephone numbers provided above. Jasco J-810 CD Spectropolarimeter: Serial Number B030960750 Jasco Temperature Controller Module: Model PFD-425S, Serial Number A004760835 Jasco Titrator Unit: Model ATS-429S/429L, Serial Number A006060832 Osram 150 W Light Source: Part Number 3027


![JWMVS-529 CD Multivariate SSE Programdmitryf/manuals/Multivariate...This manual is for the JASCO [CD Multivariate SSE] program that runs on Microsoft Windows. The [CD Multivariate](https://img.dokumen.tips/doc/110x75/6126f1e613b27866f35b8927/jwmvs-529-cd-multivariate-sse-program-dmitryfmanualsmultivariate-this-manual.jpg)