Embed Size (px)
Citation preview

CCU&S via Stacked Storage—
Case Studies from CO2-EOR
Basins of the United States
Susan D. Hovorka with
David L. Carr, Stuart H. Coleman, Khandaker Zahid,
Rebecca C. Smyth, Vanessa NunezRebecca C. Smyth, Vanessa Nunez
Gulf Coast Carbon Center
Bureau of Economic Geology
Jackson School of Geoscience
The University of Texas at Austin
www.gulfcoastcarbon.org

Gulf Coast Carbon Center (GCCC)
BEG Team Scott Tinker
Michael YoungSue HovorkaTip MeckelJ. P. Nicot
Rebecca Smyth
LBNLLLNLORNLNETLSNLMississippi State UU of Mississippi
Collaborators IA sponsors
China Petroleum Co. Taiwan
Rebecca SmythRamon Trevino
Katherine RomanakSeyyed HosseiniChangbing YangVanessa Nunez
Dave CarrBrad Wolaver
Alex SunJiemin Lu
Carey King students and others
SECARBUT-PGE UT Chem-ECFSES- BESUT- CIEEPUT- DoGSUT- LBJ schoolBEG- CEEJSG – EERUniv. EdinburghUniv. DurhamRITECO2-CRC

UT - Large CCS program
Gulf Coast Carbon Center at the Bureau of Economic Geology,Jackson School of Geosciences
Luminant Capture Program Department of Chemical EngineeringDepartment of Chemical Engineering
Geological CO 2 Storage JIP Center for Petroleum and Geosystems EngineeringCockrell School of Engineering
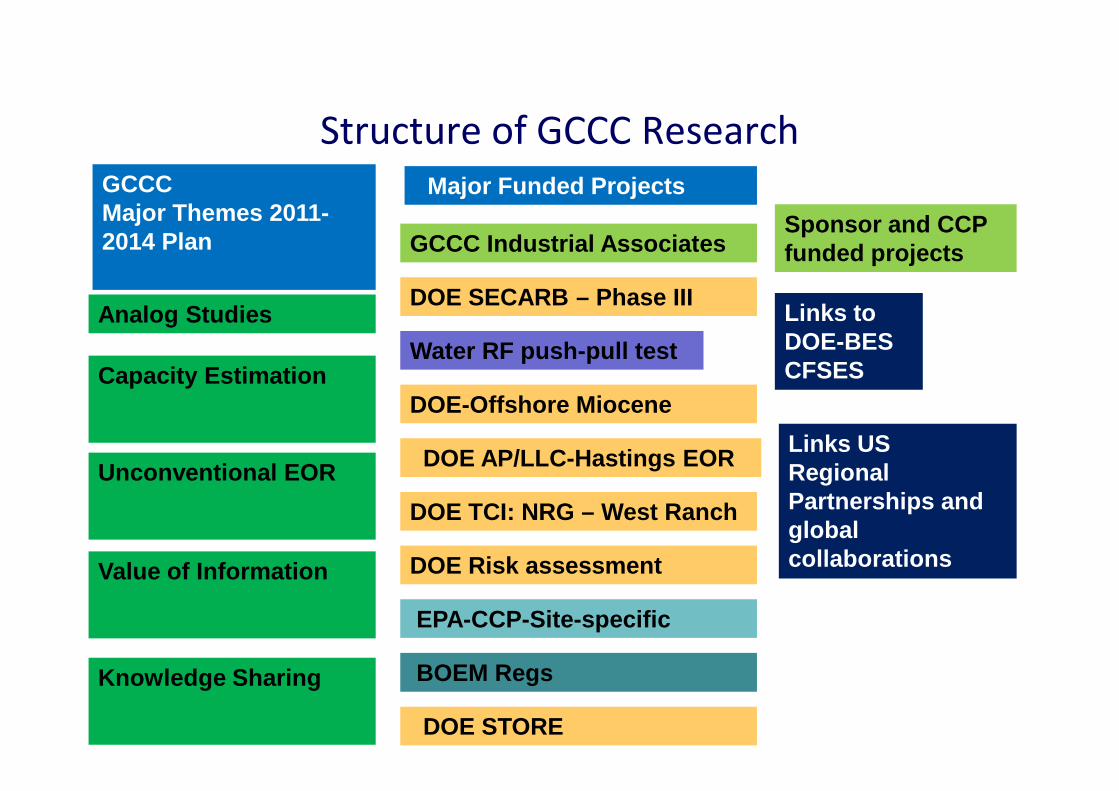
Structure of GCCC Research
GCCCMajor Themes 2011-2014 Plan
Capacity Estimation
Analog Studies
Major Funded Projects
GCCC Industrial Associates
DOE-Offshore Miocene
DOE SECARB – Phase III
Water RF push-pull test
Links to DOE-BES CFSES
Sponsor and CCP funded projects
Unconventional EOR
Value of Information
Knowledge Sharing
DOE-Offshore Miocene
DOE AP/LLC-Hastings EOR
DOE TCI: NRG – West Ranch
DOE Risk assessment
EPA-CCP-Site-specific
DOE STORE
BOEM Regs
Links USRegional Partnerships and global collaborations

GCCC DOE-Funded Field Monitoring Programs
CranfieldSECARB Phase II&IIDenbury
Frio Test 1&2Texas American Resources
SACROCSouthwestPartnershipKinderMorganNM Tech
HastingsDenbury-AP-LLCWest Ranch
Petra-Nova NRG Hillcorp

Sub-seafloor storage potential
Galloway and others

Characterization for Storage– Sub-seafloor offshore
Gulf of MexicoMeckel, Trevino,
Carr, Wallace

EPA STAR – CCP Site specific monitoring
Characterization Uncertainty: Fault-seal??
Leak path concept
Test Sensitivity of Monitoring Options
Monitoring options Image free-phase with surface 4-D
Measure change in pressure AZMI
Temperature change along fault
Mass/pressure balance in reservoir
Microseismic
Trigger – tool not sensitive, noise too high
Test Sensitivity of Monitoring Options
Image free-phase with surface 4-DMeasure change in pressure AZMI
Microseismic
Temperature change along fault
Change in rate pressure increase in reservoir
Mas
s le
aked
Seismic velocity change Rat
e le
aked
Pressure change
Det
ectio
n lim
it
Rat
e le
aked
Derivative Pressure change
Rat
e le
aked
Temperature change in Fault zone
Det
ectio
n lim
it Trigger, Failure or pre-failure
Set triggers, stage monitoring options
• Select microseismic as pre-failure trigger • AZMI pressure as most sensitive trigger• Select Image with surface 4- D and change
in rate of pressure change in reservoir as post trigger follow up.
• Decrease analysis of microseismic after pressure peaks and plateaus
fault

Estimation of Storage Capacity
Source and capture of CO2
CCUS or CCS
CO2 use for enhanced oil productionto offset development cost and speed implementation
CO2 Storage in brineformation
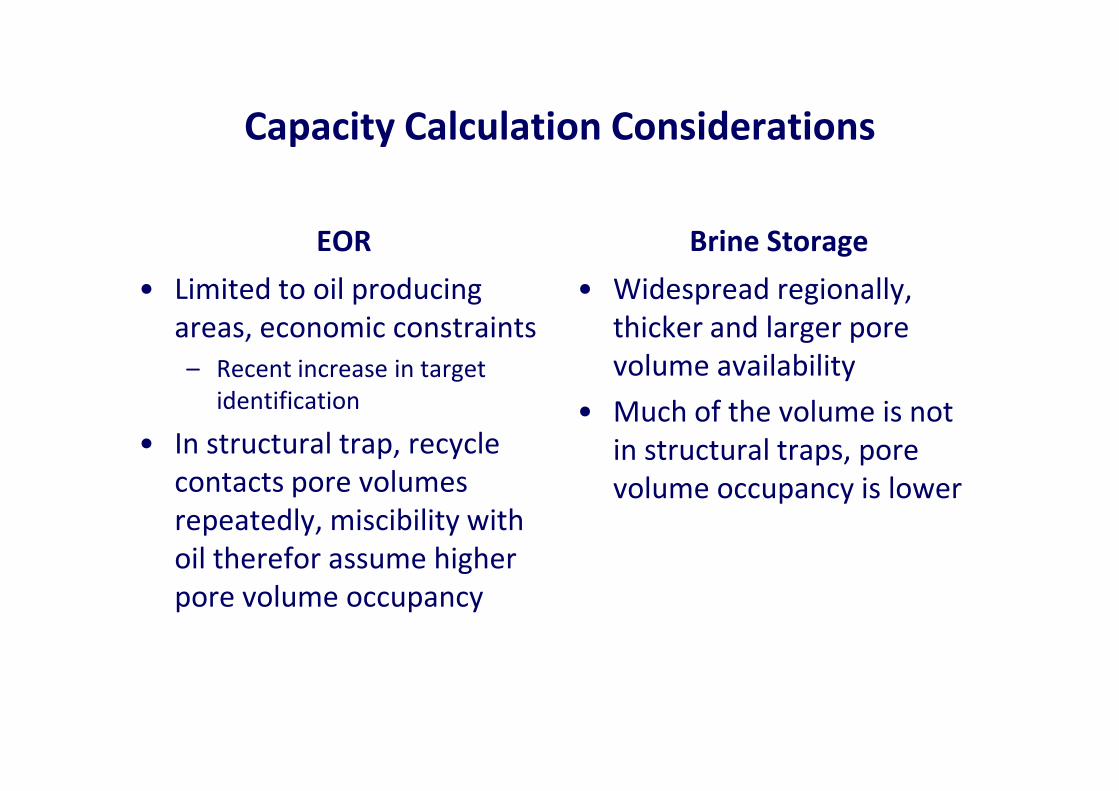
Capacity Calculation Considerations
EOR
• Limited to oil producing
areas, economic constraints
– Recent increase in target
identification
Brine Storage
• Widespread regionally,
thicker and larger pore
volume availability
• Much of the volume is not identification
• In structural trap, recycle
contacts pore volumes
repeatedly, miscibility with
oil therefor assume higher
pore volume occupancy
• Much of the volume is not
in structural traps, pore
volume occupancy is lower

Oil Resources –co-occupy space with
Saline potential
Power PlantsPure CO2 sourcesOil and Gas (USGS)Coal (USGS)Brine Aquifer> 1000m
Compiled 2000 from USGS data

Stacked Potential in US Sample Basins Basin Top target formation Deeper targets Enhanced oil recovery
potential
Los Angeles Repetto Same Formation Yes
Basin and Range Paleozoic Carbonates No No
Sevier/Kaiparowits Jurassic Navajo Sandstone Wingate Sandstone No
San Juan Morrison Formation Dakota No
Powder River Basin Upper Cretaceous Fox Hills
Sandstone
Lower Cretaceous Lakota
Formation
No
Sandstone Formation
Williston Basin Madison Group Cambrian sandstones yes
Denver Basin Frontier Dockum, Lyons Sandstone yes
Palo Duro Basin Granite walsh Paleozoic carbonates No
Anadarko basin Arbuckle group Simpson Group Yes
East Texas Basin Woodbine Paluxy Yes
Gulf Coast Basin Miocene Frio Yes
Illinois Basin St. Peter Sandstone Mt Simon yes
Appalachian Basin Oriskany Tuscarora No
Black Warrior Pottsville Paleozoics Yes

System Analysis of Storage Capacity
Sources and sinkslinked regionally in a pipeline network
Enhanced oil productionto offset development cost and
Future extension of pipeline network
pipeline network to offset development cost and speed implementation
Very large volumestorage in stacked brineformations beneathreservoir footprints

Temporal Role of EOR in
Sequestration2
Brine sequestration
Vol
ume
of C
O2
Time
EOR
Early EOR+sequestration projects underway, more planned

Updated Role of Use (EOR) in
Sequestration2
Brine sequestrationBrine sequestrationlarge storage volumes
Vol
ume
of C
O2
Time
EORModerate Volumes, NOW!
Cost offsetPublic acceptance
Regulatory certaintyInfrastructure

• Brine test planned, ended up stacked
• Numerous suitable injection zones in same tracts used for oil production
Frio Pilot 2004-2006
Fresh water
Injection intervals
Oilproduction

Geometries of Stacked Storage
• Vertical stacking
• Laterally offset
• Use of saline rather than optimizing EOR flood
for storage
– Maximize EOR economics
– Minimize long term storage in areas with most
well penetration

Stacked
Frio Reservoirs:
Rollover Anticlines
Markham North-Bay City North field
Modified from Tyler andAmbrose (1986)

Permian Basin Saline Capacity Examples
Yates Formation Queen Formation San Andres Formation
Capacity in porosity times thickness,
low High
Sprayberry FormationDean- 3rd Bone Spring Formation Wolfcamp – Lime
times thickness, (units variable)

South Georgia Basin example
Austin Chalk
Tuscaloosa
Jurassic
Austin
Paleozoic
Paleozoicbasement
Paleozoic
Austin Chalk
Lower Cretaceous
Jurassic
D. Carr

Advantages of Stacked Storage• Limit plume and increased pressure footprint
• Characterization of multiple injection zones =
reduced cost
• Flexible operation
• Co-monitoring multiple injection zones• Co-monitoring multiple injection zones
– Use of shallower zones for surveillance of deeper zones
– Near-surface monitoring of same footprint
• Brownfield
– Reduced environmental impact, same infrastructure
– Increased public acceptance
• Revenue during initial (most expensive) stages

Stacked Storage to Limit Plume Size
Confining systemMultiple injection zonesbeneath one land tract
Confining system
Not
S
tack
ed
One injection zone =Large plume
Confining system
Confining system
Confining system
beneath one land tract
CO2 is emplaced though well(s) designed and perforated to access multiple horizons
Injection zone 1
Injection zone 2
Injection zone 3
Sta
cked

Disadvantages of stacked storage
• Oil production – conflict of interest and purpose
– Public acceptance and trust
– Emissions from compression, oil refining, oil combustion
• Operational interference
– Complex subsurface ownership (US)– Complex subsurface ownership (US)
– Well penetrations
– Fluid extraction and disposal
• Monitoring interference
– Complex fluid history
– Hydrocarbons in shallow environments – natural and past
practices
– Pressure and fluid interference

Conclusions
• Field studies and data bases show oilfield and
saline storage are “stacked”
• Carbon capture use and storage
– Numerous advantages – Numerous advantages
• Limit area Flexablity, public acceptance
– Requires advance planning, reduce disadvantages
www.gulfcoastcarbon.org


