Embed Size (px)
Citation preview
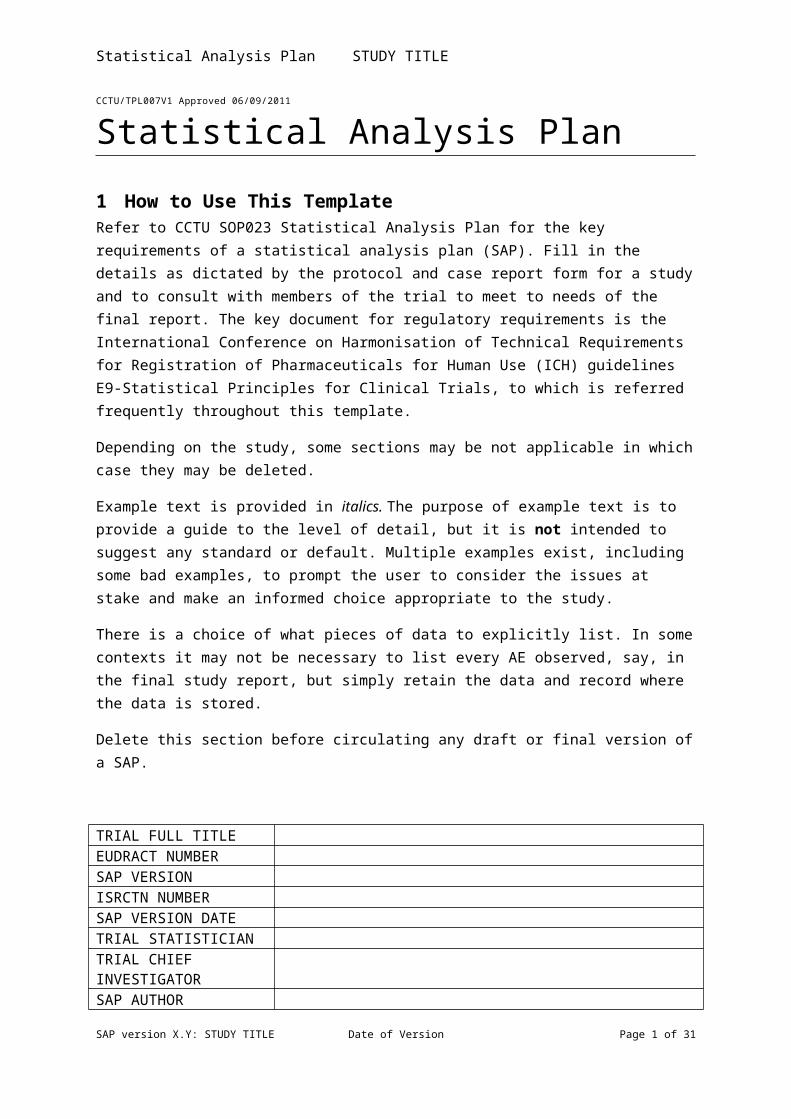
Statistical Analysis Plan STUDY TITLE
CCTU/TPL007V1 Approved 06/09/2011
Statistical Analysis Plan1 How to Use This TemplateRefer to CCTU SOP023 Statistical Analysis Plan for the key requirements of a statistical analysis plan (SAP). Fill in the details as dictated by the protocol and case report form for a study and to consult with members of the trial to meet to needs of the final report. The key document for regulatory requirements is the International Conference on Harmonisation of Technical Requirements for Registration of Pharmaceuticals for Human Use (ICH) guidelines E9-Statistical Principles for Clinical Trials, to which is referred frequently throughout this template.
Depending on the study, some sections may be not applicable in which case they may be deleted.
Example text is provided in italics. The purpose of example text is to provide a guide to the level of detail, but it is not intended to suggest any standard or default. Multiple examples exist, including some bad examples, to prompt the user to consider the issues at stake and make an informed choice appropriate to the study.
There is a choice of what pieces of data to explicitly list. In some contexts it may not be necessary to list every AE observed, say, in the final study report, but simply retain the data and record where the data is stored.
Delete this section before circulating any draft or final version of a SAP.
TRIAL FULL TITLEEUDRACT NUMBERSAP VERSIONISRCTN NUMBERSAP VERSION DATETRIAL STATISTICIANTRIAL CHIEF INVESTIGATORSAP AUTHOR
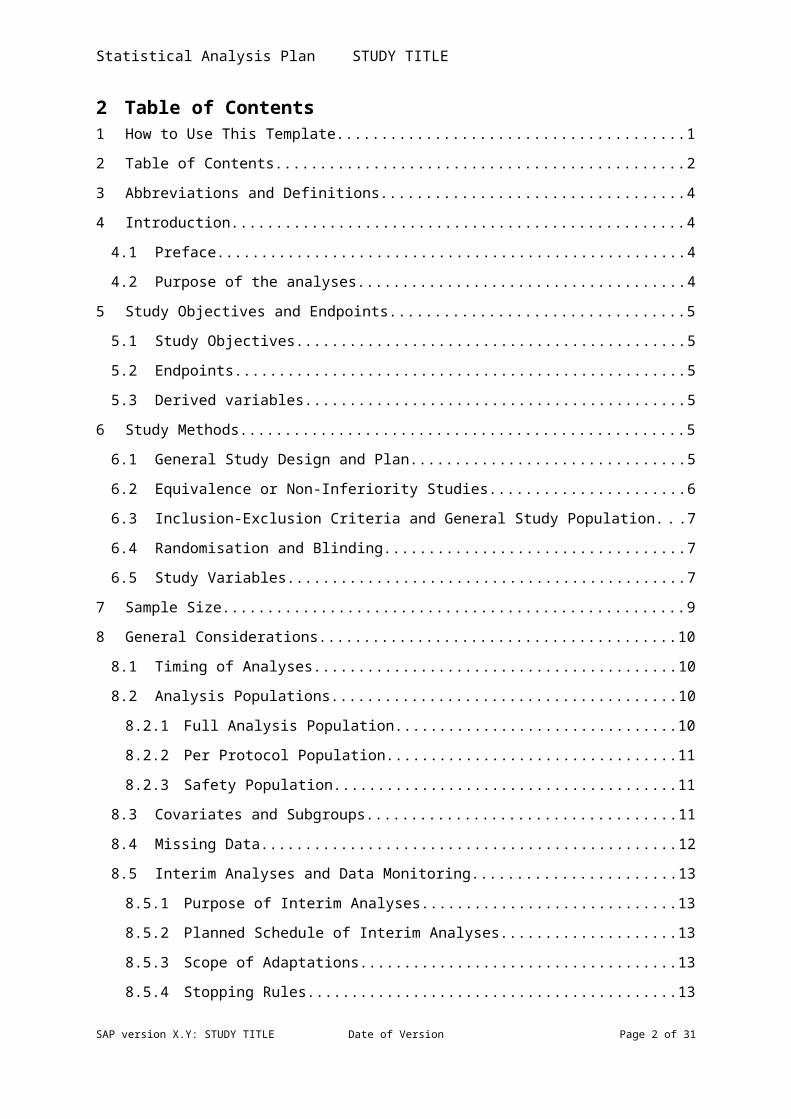
2 Table of Contents1 How to Use This Template...............................................................................12 Table of Contents............................................................................................23 Abbreviations and Definitions..........................................................................44 Introduction.....................................................................................................4
4.1 Preface......................................................................................................4
SAP version X.Y: STUDY TITLE Date of Version Page 1 of 26
Statistical Analysis Plan STUDY TITLE
4.2 Purpose of the analyses............................................................................45 Study Objectives and Endpoints......................................................................5
5.1 Study Objectives.......................................................................................55.2 Endpoints..................................................................................................55.3 Derived variables......................................................................................5
6 Study Methods.................................................................................................56.1 General Study Design and Plan.................................................................56.2 Equivalence or Non-Inferiority Studies......................................................66.3 Inclusion-Exclusion Criteria and General Study Population.......................76.4 Randomisation and Blinding......................................................................76.5 Study Variables.........................................................................................7
7 Sample Size.....................................................................................................98 General Considerations.................................................................................10
8.1 Timing of Analyses..................................................................................108.2 Analysis Populations................................................................................10
8.2.1 Full Analysis Population....................................................................108.2.2 Per Protocol Population.....................................................................118.2.3 Safety Population..............................................................................11
8.3 Covariates and Subgroups......................................................................118.4 Missing Data............................................................................................128.5 Interim Analyses and Data Monitoring....................................................13
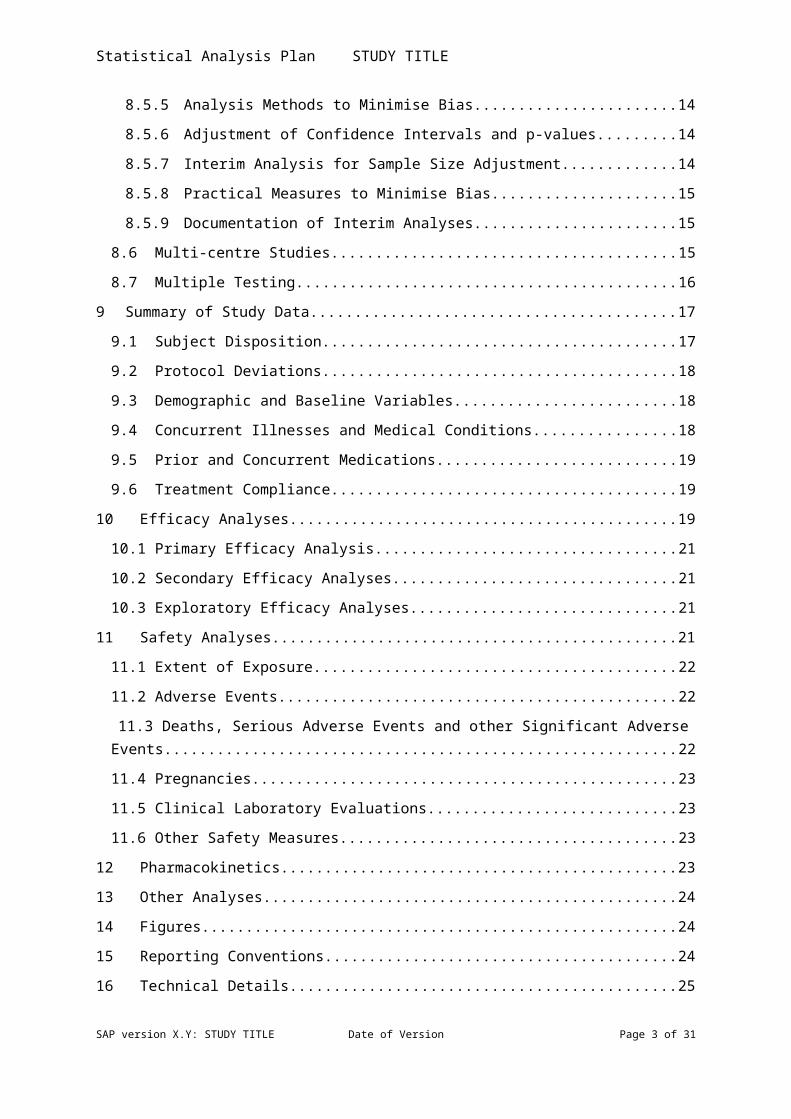
8.5.1 Purpose of Interim Analyses.............................................................138.5.2 Planned Schedule of Interim Analyses..............................................138.5.3 Scope of Adaptations........................................................................138.5.4 Stopping Rules..................................................................................138.5.5 Analysis Methods to Minimise Bias...................................................148.5.6 Adjustment of Confidence Intervals and p-values.............................148.5.7 Interim Analysis for Sample Size Adjustment....................................148.5.8 Practical Measures to Minimise Bias.................................................158.5.9 Documentation of Interim Analyses..................................................15
8.6 Multi-centre Studies................................................................................158.7 Multiple Testing.......................................................................................16
9 Summary of Study Data................................................................................179.1 Subject Disposition..................................................................................179.2 Protocol Deviations.................................................................................18
SAP version X.Y: STUDY TITLE Date of Version Page 2 of 26
Statistical Analysis Plan STUDY TITLE
9.3 Demographic and Baseline Variables......................................................189.4 Concurrent Illnesses and Medical Conditions..........................................189.5 Prior and Concurrent Medications...........................................................199.6 Treatment Compliance............................................................................19
10 Efficacy Analyses........................................................................................1910.1 Primary Efficacy Analysis........................................................................2110.2 Secondary Efficacy Analyses...................................................................2110.3 Exploratory Efficacy Analyses.................................................................21
11 Safety Analyses..........................................................................................2111.1 Extent of Exposure..................................................................................2211.2 Adverse Events.......................................................................................2211.3 Deaths, Serious Adverse Events and other Significant Adverse Events. .2211.4 Pregnancies.............................................................................................2311.5 Clinical Laboratory Evaluations...............................................................2311.6 Other Safety Measures............................................................................23
12 Pharmacokinetics.......................................................................................2313 Other Analyses...........................................................................................2414 Figures.......................................................................................................2415 Reporting Conventions...............................................................................2416 Technical Details........................................................................................2517 Summary of Changes to the Protocol.........................................................2518 References.................................................................................................2519 Listing of Tables, Listings and Figures........................................................27
3 Abbreviations and DefinitionsProvide a list of the abbreviations and acronyms used in the Statistical Analysis Plan (SAP) with definitions. All terms will appear in alphabetical order.
This section should be completed on an on-going basis during the preparation of the document and checked carefully after preparing the rest of the SAP to ensure that all the abbreviations are captured.
Although the abbreviations are listed, it is standard practice to spell out abbreviated terms and to indicate the abbreviation in parentheses at their first appearance in the text.
AE Adverse EventCRF Case Report Form
SAP version X.Y: STUDY TITLE Date of Version Page 3 of 26

Statistical Analysis Plan STUDY TITLE
IMP Investigational Medical ProductSAP Statistical Analysis Plan
4 Introduction4.1 PrefaceInclude a very brief summary (approximately one paragraph) of the important background information from the protocol. This should be copied directly from the protocol and should not be re-written.
4.2 Purpose of the analysesInclude a brief statement of the purpose of the analyses. For example:
These analyses will assess the efficacy and safety of [IMP] in comparison with the [standard] and will be included in the clinical study report.
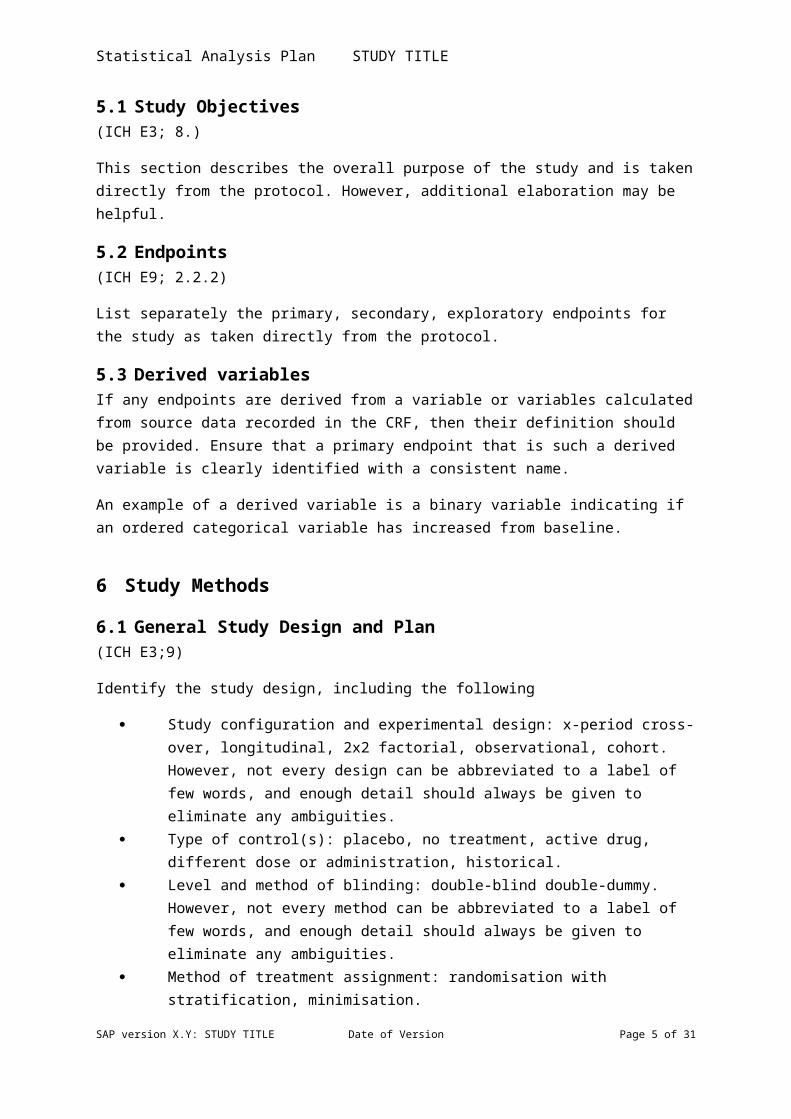
5 Study Objectives and Endpoints5.1 Study Objectives(ICH E3; 8.)
This section describes the overall purpose of the study and is taken directly from the protocol. However, additional elaboration may be helpful.
5.2 Endpoints(ICH E9; 2.2.2)
List separately the primary, secondary, exploratory endpoints for the study as taken directly from the protocol.
5.3 Derived variablesIf any endpoints are derived from a variable or variables calculated from source data recorded in the CRF, then their definition should be provided. Ensure that a primary endpoint that is such a derived variable is clearly identified with a consistent name.
An example of a derived variable is a binary variable indicating if an ordered categorical variable has increased from baseline.
6 Study Methods6.1 General Study Design and Plan(ICH E3;9)
Identify the study design, including the following
SAP version X.Y: STUDY TITLE Date of Version Page 4 of 26
Statistical Analysis Plan STUDY TITLE
Study configuration and experimental design: x-period cross-over, longitudinal, 2x2 factorial, observational, cohort. However, not every design can be abbreviated to a label of few words, and enough detail should always be given to eliminate any ambiguities.
Type of control(s): placebo, no treatment, active drug, different dose or administration, historical.
Level and method of blinding: double-blind double-dummy. However, not every method can be abbreviated to a label of few words, and enough detail should always be given to eliminate any ambiguities.
Method of treatment assignment: randomisation with stratification, minimisation.
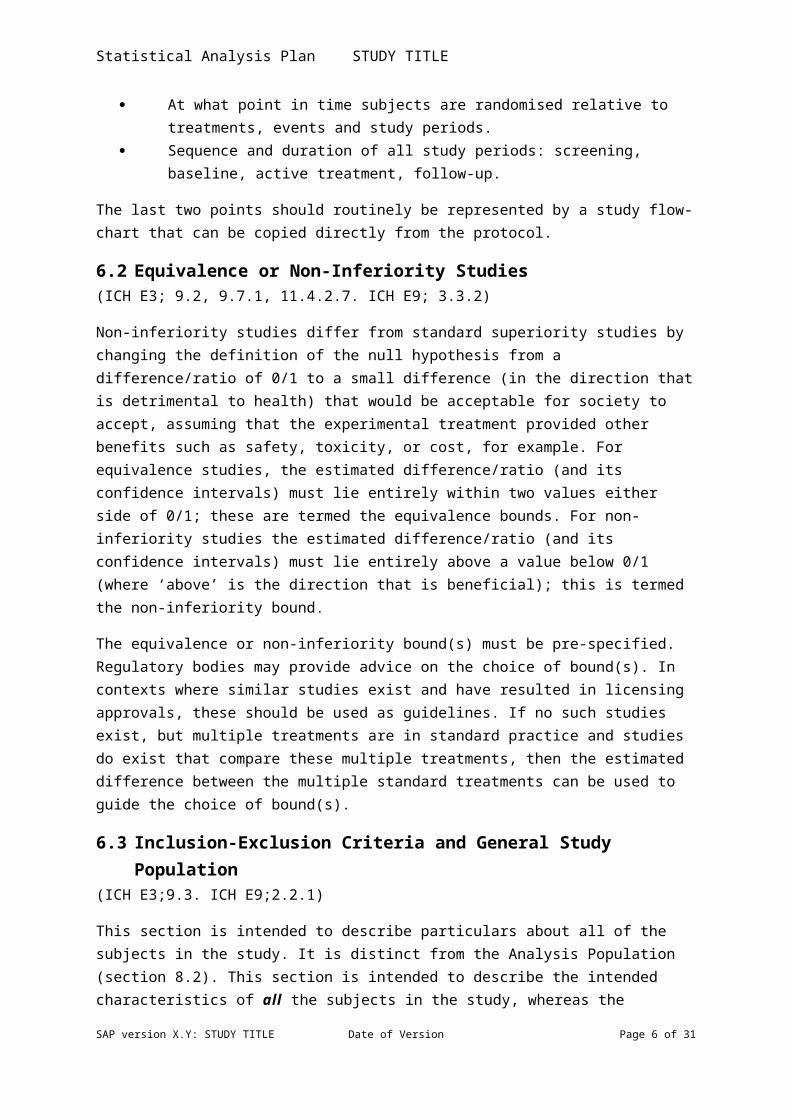
At what point in time subjects are randomised relative to treatments, events and study periods.
Sequence and duration of all study periods: screening, baseline, active treatment, follow-up.
The last two points should routinely be represented by a study flow-chart that can be copied directly from the protocol.
6.2 Equivalence or Non-Inferiority Studies(ICH E3; 9.2, 9.7.1, 11.4.2.7. ICH E9; 3.3.2)
Non-inferiority studies differ from standard superiority studies by changing the definition of the null hypothesis from a difference/ratio of 0/1 to a small difference (in the direction that is detrimental to health) that would be acceptable for society to accept, assuming that the experimental treatment provided other benefits such as safety, toxicity, or cost, for example. For equivalence studies, the estimated difference/ratio (and its confidence intervals) must lie entirely within two values either side of 0/1; these are termed the equivalence bounds. For non-inferiority studies the estimated difference/ratio (and its confidence intervals) must lie entirely above a value below 0/1 (where ‘above’ is the direction that is beneficial); this is termed the non-inferiority bound.
The equivalence or non-inferiority bound(s) must be pre-specified. Regulatory bodies may provide advice on the choice of bound(s). In contexts where similar studies exist and have resulted in licensing approvals, these should be used as guidelines. If no such studies exist, but multiple treatments are in standard practice and studies do exist that compare these multiple treatments, then the estimated difference between the multiple standard treatments can be used to guide the choice of bound(s).
6.3 Inclusion-Exclusion Criteria and General Study Population
(ICH E3;9.3. ICH E9;2.2.1)
This section is intended to describe particulars about all of the subjects in the study. It is distinct from the Analysis Population (section 8.2). This section is
SAP version X.Y: STUDY TITLE Date of Version Page 5 of 26
Statistical Analysis Plan STUDY TITLE
intended to describe the intended characteristics of all the subjects in the study, whereas the Analysis Population section is designed to identify the characteristics that are needed to defined sub-populations used for the analyses.
The SAP may include:
a list of all inclusion and exclusion criteria directly copied from the protocol.
or a simple description of the relevant diagnostic or disease related criteria (e.g. a history of chronic back pain for over 10 years.
6.4 Randomisation and Blinding(ICH E3; 9.4.3, 9.4.6. ICH E9; 2.3.1, 2.3.2)
Describe essential components of the randomisation and blinding methodology in enough detail to enable its reproduction. Include any minimisation, stratification or blocking procedures used to avoid or minimise bias. This section may be copied from the protocol but it may be necessary to include additional information details, particularly regarding block size. However, in a double-blind study it may be appropriate not to include such information in the SAP but document it within the final study report, in which case document that these details will be provided in the final study report. Document any software packages used to perform the randomisation.
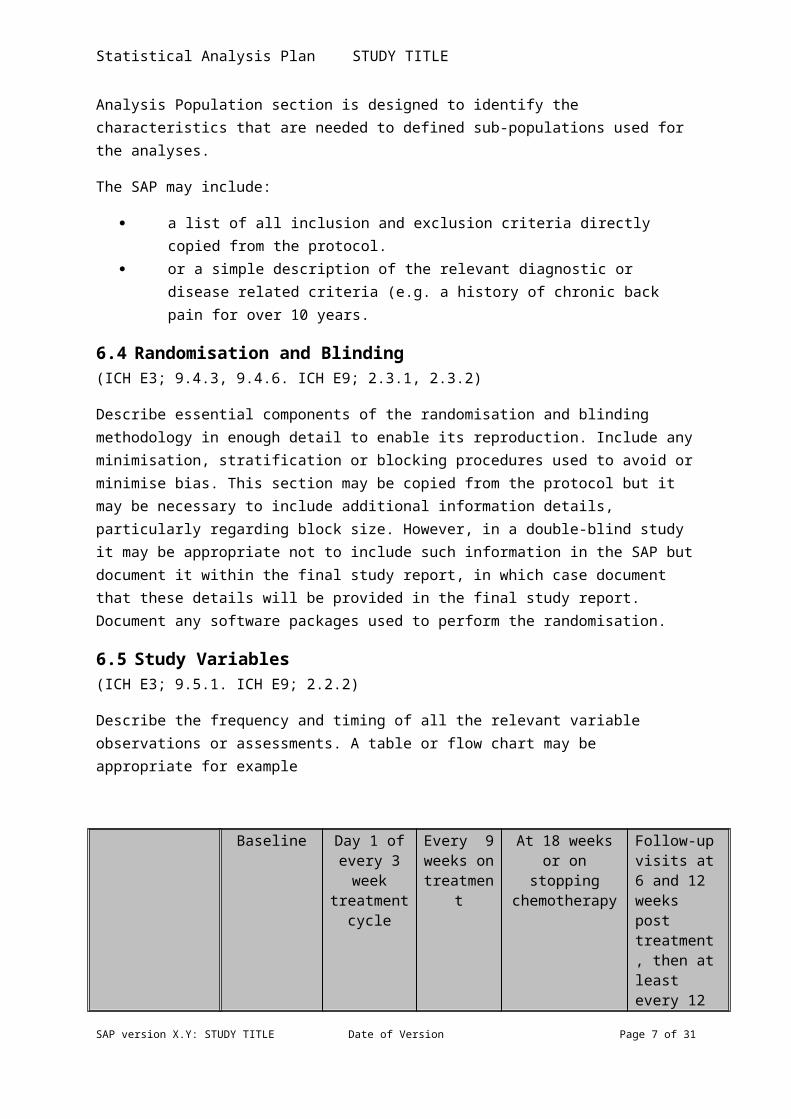
6.5 Study Variables(ICH E3; 9.5.1. ICH E9; 2.2.2)
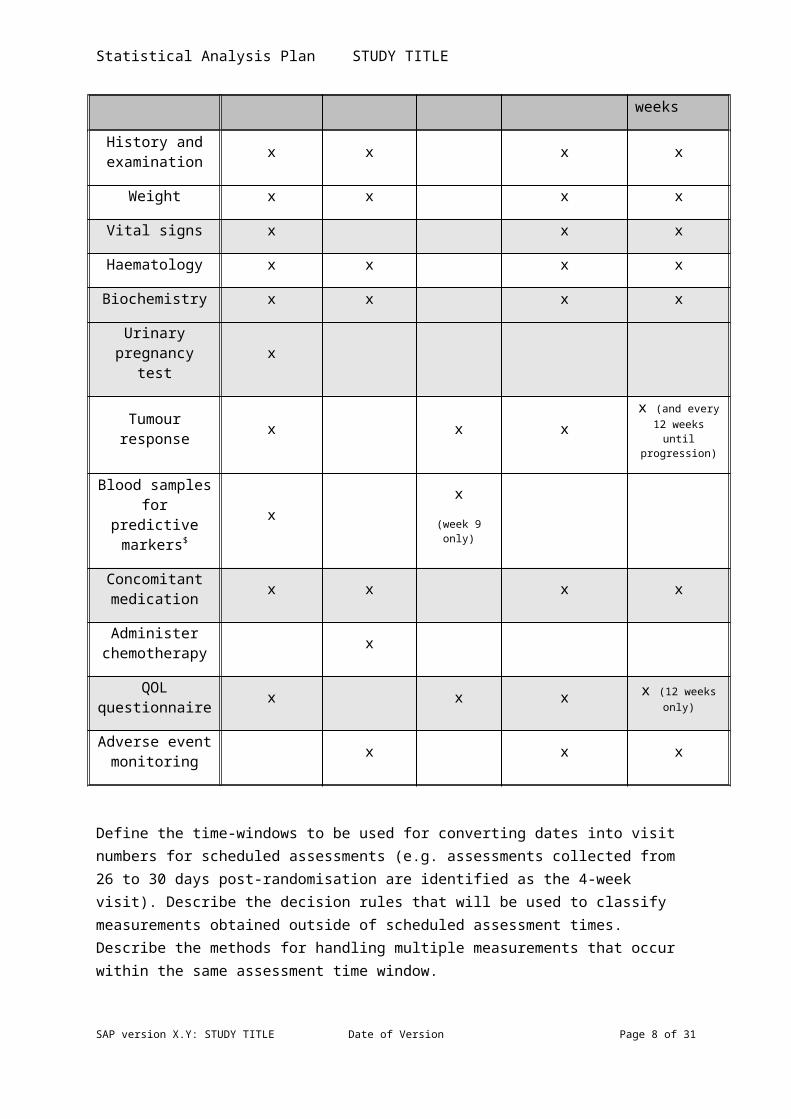
Describe the frequency and timing of all the relevant variable observations or assessments. A table or flow chart may be appropriate for example
Baseline
Day 1 of every 3 week
treatment cycle
Every 9 weeks on treatmen
t
At 18 weeks or on stopping
chemotherapy
Follow-up visits at 6 and 12 weeks post treatment, then at least every 12 weeks
History and examination x x x x
Weight x x x x
Vital signs x x x
Haematology x x x x
Biochemistry x x x x
SAP version X.Y: STUDY TITLE Date of Version Page 6 of 26
Statistical Analysis Plan STUDY TITLE
Urinary pregnancy test x
Tumour response x x x x (and every
12 weeks until progression)
Blood samples for predictive
markers$x
x(week 9
only)
Concomitant medication x x x x
Administer chemotherapy x
QOL questionnaire x x x x (12 weeks
only)
Adverse event monitoring x x x
Define the time-windows to be used for converting dates into visit numbers for scheduled assessments (e.g. assessments collected from 26 to 30 days post-randomisation are identified as the 4-week visit). Describe the decision rules that will be used to classify measurements obtained outside of scheduled assessment times. Describe the methods for handling multiple measurements that occur within the same assessment time window.
This section will go beyond the description of variables provided in the protocol in that it will list and describe all important study variables from a statistical perspective. The description of each variable should include:
Identification of any number ranges for numeric endpoints along with their corresponding text descriptors.
o Items are measure on a 0-100 visual analogue scale (VAS) for which 0=no pain and 100=worst pain imaginable
o Items are measured on a 1-4 ordered categorical scale for which 1=no pain, 2= slight pain, 3=moderate pain, 4=extreme pain
The method for computing the variable including any special techniques used in the computation (e.g. carrying forward values into missing observations, transformation of values) and specific methods for combining multiple variables into a single value (e.g. EQ-5D Quality of Life questionnaire)
If there are numerous variables it may be useful to create subsections corresponding to each variable which are grouped together as in the protocol (e.g. efficacy, safety) and sections 9-13 of this document.
SAP version X.Y: STUDY TITLE Date of Version Page 7 of 26
Statistical Analysis Plan STUDY TITLE
7 Sample Size (ICH E3; 9.7.2. ICH E9; 3.5)
This section should reproduce the relevant section from the protocol. If any amendments to the sample size have been made during the study, these should be documented and explained here. If any techniques are used to adjust the primary analysis for sample size adjustment they should be described in the relevant section (10.1).
8 General Considerations8.1 Timing of AnalysesGive details here of when, or under what criteria, the final analyses will be performed. Give details of what data cleaning and locking processes must take place to comply with SOP specifications. For example:
The final analysis will be performed after XXX progressions have been observed
The final analysis will be performed when XXX subjects have completed visit Y or dropped out prior to visit Y.
The final analysis will be performed on data transferred to the file XXX, having been documented as meeting the cleaning and approval requirements of SOPZZZ and after the finalisation and approval of this SAP document.
8.2 Analysis Populations(ICH E3; 9.7.1, 11.4.2.5. ICH E9; 5.2)
This section is designed to identify the characteristics needed for inclusion in particular populations used in the analyses. Clearly define all the populations with a formal title (e.g. Full Analysis, Per Protocol, Safety) and give criteria to determine if a subject or observational unit belongs to that population. The criteria typically relate to adherence to protocol and the taking of observations, which relate to missing data (section 8.4).
Note that “intention to treat” refers to how subjects are assigned to a treatment group for the purposes of analysis (i.e. the treatment they are randomised to but not necessarily the one received); it can be used within any analysis population and thus is not a suitable description for a population itself.
It is not enough just to use a standard label for population. Such labels are vague and need further precise definitions within each trial; examples are given below.
8.2.1 Full Analysis Population All subjects who received any study drug All subjects who received any study drug and who participated in at least
one post-baseline assessment
SAP version X.Y: STUDY TITLE Date of Version Page 8 of 26

Statistical Analysis Plan STUDY TITLE
All subjects who were randomised
8.2.2 Per Protocol Population All subjects who adhere to the major criteria in the protocol (e.g. all
subjects who completed at least two efficacy analyses, whose study drug compliance was between 75% and 125% and who did not take any rescue medication)
All subjects who did not substantially deviate from the protocol as to be determined on a per-subject basis at the trial steering committee immediately before data base lock.
8.2.3 Safety Population All subjects who received any study treatment (including control) but
excluding subjects who drop out prior to receiving any treatment. All subjects who received any study treatment (including control) and are
confirmed as providing complete follow-up regarding adverse event information.
Discuss each of the following
Specification of the primary efficacy population Specification of the population to be used for each type of data (e.g.
background, safety, efficacy, health-economic).
If the primary analysis is based on a reduced subset of the subjects with data (e.g. subjects who complete the active phase of the study) and if the trial is intended to establish efficacy, there should be additional analyses that use all the randomised subjects with any on-treatment data.
It is crucial to assign each subject’s inclusion or exclusion status with regard to each analysis population prior to breaking the blind. Such a statement should be included in this section. The exact process for assigning the statuses will be defined and documented prior to breaking the blind along with any predefined reasons for eliminating a subject from a particular population.
8.3 Covariates and Subgroups(ICH E3; 9.7.1, 11.4.2.1. ICH E9; 5.7)
Provide a general comment identifying the covariates (continuous or categorical, including subgroups) that are expected to have an important influence on specific endpoints (e.g. demographic or baseline measurements, concomitant therapy). Document any model selection procedures (e.g. forward stepwise selection).
Any variables used to stratify or minimise over in treatment allocation should be adjusted for in the primary analysis; otherwise specific reasons should be included (for example, a categorical variable used in a minimisation treatment allocation process could be omitted if it introduced too many categories).
SAP version X.Y: STUDY TITLE Date of Version Page 9 of 26
Statistical Analysis Plan STUDY TITLE
State which important demographic or baseline-value-defined subgroups are to be analysed for different treatment effects (for example comparison of effects by age, gender, ethnic group, prognosis, prior treatment). If there exists an a priori hypothesis of subgroup differences, it should be noted in this section. Likewise, it should be noted if subgroup analyses are exploratory.
Subgroup analyses should focus on the evidence for a difference in treatment effects: the interaction effect. It is flawed to present an analysis that provides two p-values, one for each of the two subgroups, and then report that only one subgroup showed a statistically significant difference. Only if the interaction effect is judged to be statistically and clinically significant should subgroup-specific treatment effect estimates be presented. It is acceptable to present exploratory subgroup-specific summary statistics. The use of forest plot figures is a highly effective way of communicating the relevant information about possible subgroup effects and interactions.
Where applicable, discuss the impact of the sample size on the power of subgroup analyses or reference section 7 if discussed there.
8.4 Missing Data(ICH E3; 9.7.1, 11.4.2.2. ICH E9;5.3. EMA Guideline on Missing Data in Confirmatory Clinical Trials)
Describe procedures to be used for dealing with premature discontinuation from the study or treatment and the handling of spurious or missing data (e.g. use of multiple imputation, random effects models or complete case analyses). Describe any possible biases these techniques may introduce. Describe the underlying assumptions (e.g. Missing At Random) in both statistical and non-statistical terms. Describe procedures to be used for describing the pattern of permanent (i.e. dropout) or transient missing data.
This section is intended to be a general discussion of the approach to missing data. Variable-specific information for imputing missing data, where appropriate, will be documented in section 6.5; analytical methods may be further detailed in section 9.
8.5 Interim Analyses and Data Monitoring(ICH E3; 9.7.1, 11.4.2.3. ICH E9; 4.1, FDA Feb 2010 “Guidance for Industry Adaptive Design Clinical Trials for Drugs and Biologics”)
8.5.1 Purpose of Interim AnalysesGive a description of why the interim analyses are to be performed. Typically the reason is due to uncertainty about some aspect or aspects of the treatment or treatments and the interim will allow learning to influence the subsequent design of the study at Data Monitoring Committees. This can range from simple uncertainty about safety aspects, the primary endpoint treatment effect that leads to early termination for futility of efficacy, to decisions regarding the choice of dose, endpoint, treatment arm, randomisation weighting, subgroup
SAP version X.Y: STUDY TITLE Date of Version Page 10 of 26
Statistical Analysis Plan STUDY TITLE
enrichment. The data to be analysed in the interim analyses should be explicitly specified (for example, baseline data, treatment received, safety)
8.5.2 Planned Schedule of Interim AnalysesIt must be detailed when the first interim analysis will occur, and what scope of decisions will be taken at future interim analyses. Technically, details of the interim analysis beyond the next interim can be left open to be decided sequentially at each interim, under the proviso that rules for the analysis to combine the future data at each stage are defined and the scope for adaptations is not enlarged. However, it is recommended to plan as much as possible in advance and give a full predicted schedule of all interim analyses.
8.5.3 Scope of AdaptationsGive an explicit list of which aspects of the trial may be revised at an interim analysis. Document any formal rules governing these adaptations. If an interim SAP will not be produced, or it is appropriate to document the interim analysis in the main SAP, then specify what analyses, summaries or figures will be used to inform the choice of adaptations.
8.5.4 Stopping RulesDocument any formal stopping rules for futility, efficacy or lack of power. Document the probability of each possible eventuality under the null and alternative hypothesis e.g. the probability of stopping for futility or efficacy, or continuing to the next stage.
8.5.5 Analysis Methods to Minimise BiasIt is generally advised to perform a naïve analysis that pools all data at the final analysis as if it were collected in a fixed design. However this may induce biases in estimation. For example in group sequential designs the estimate of treatment effects will be biased away from the stopping region; for sample sizes that are revised to reflect the estimated treatment effect at the first interim, the naïve pooled estimate will be biased away from the null.
Any known biases must be discussed, and any methods proposed to correct the biases must be documented. It must be stated in advance which analysis will be the primary analysis used in the case of conflicting interpretations and for “headline” reporting of the trial.
8.5.6 Adjustment of Confidence Intervals and p-valuesIn a design where formal hypothesis testing is used and the interim analyses provide multiple opportunities to stop for efficacy, the overall trial significance level will be greater than nominal significance levels used at each stage. Any stopping rules should adjust for this, and correspondingly any confidence intervals or p-values presented must be calculated to adjust for the possibility of stopping earlier and for having reached the observed stage in the trial.
Conversely, a trial that only has the option to stop early for futility will conservatively preserve the overall significance level. Here the nominal confidence interval and p-value at the end of the trial can be used. Investigations
SAP version X.Y: STUDY TITLE Date of Version Page 11 of 26
Statistical Analysis Plan STUDY TITLE
should be made into the effect on the power of the trial, and only if the power is substantially reduced should adjustments be used.
8.5.7 Interim Analysis for Sample Size AdjustmentIf the sample size is to be adjusted at an interim, specify any rules: for example conditional power calculations.
The weighting of data from different stages of the trial needs to either, be set in advance independently of (random) sample sizes, or rules given for how the weighting will be determined. The final analyses must specify how these weightings will be used, see section 8.5.5.
8.5.8 Practical Measures to Minimise BiasIt is important to establish and control who will have access to what information at each stage of the trial. Uncontrolled reporting of interim analyses to study centres could lead to investigators responsible for recruiting subjects to change their desire to recruit to a trial, which would induce uncontrollable biases into the subject population. The final analyses could be biased by knowledge of interim results by the analyst. Any level of unblinding, either of individual subjects or of treatment estimates, could induce biases.
It should be explicitly documented
who will perform any interim analysis who will see any data or analyses at the interim and make decisions what information will be publically available following an interim analysis what information will be provide to the sponsor and investigators who will be unblinded at any point in the trial who will perform any final analyses and remain blinded if any safety monitoring decision making will remain isolated from efficacy
information
8.5.9 Documentation of Interim AnalysesSnapshots of the data available at each interim analysis should be preserved, as should all documentation of analysis plans, programming code and reporting provided at each interim. It should be possible to recreate the decision process from the trial archive.
Record what documents will be created and stored thus.
8.6 Multi-centre Studies(ICH E3;9.7.1, 11.4.2.4. ICH E9; 3.2)
This section may be copied directly from the protocol, if appropriate.
Where a multi-centre study is intended to be analysed as a whole, describe the following:
Procedures to combine individual centre results into more usable pseudo-centres with greater numbers of subjects
SAP version X.Y: STUDY TITLE Date of Version Page 12 of 26
Statistical Analysis Plan STUDY TITLE
Rationale for the combining of centres and the decision rule for whether or not the grouping will be necessary
Methods to test for qualitative or quantitative treatment-by-centre interactions
Analyses of treatment comparisons that will allow for centre differences with respect to response
Centre effects should be considered exploratory in analyses of studies that have not been explicitly designed with enough power to detect centre effects.
The general discussion about the analysis of subgroups in section 8.3 is applicable to centre effects.
8.7 Multiple Testing(ICH E3; 9.7.1, 11.4.2.5. ICH E9; 2.2.5)
This section can be copied from the protocol, if available.
In a confirmatory trial, the choice of sample size will be justified in terms of the power, which focuses on a single analysis, which in turn focuses only on one primary endpoint. This means there should only be one primary endpoint.
However, exceptions to this maxim do occur. In such circumstances the most acceptable statistical methodology is to either, combine the co-primary endpoints through a deterministic function into a single endpoint, or adopt a formal closed-testing procedure that examines a variety of hypotheses in such a way that preserves the overall significance level of the analyses; for example Bonferonni adjustments of the nominal significance level, or gate-keeping approaches to a pre-specified order of hypothesis tests.
In trials that are focused on learning and hypothesis generation, the preservation of the overall significance level is of lesser importance, however there should be a statistical discussion that reflects awareness of the issues, and the analyses should present confidence intervals rather than p-values.
Identical issues arise if there are:
more than two treatment groups, subset analyses, multiple time points, multiple methods of analysis, sensitivity analyses for missing data.
9 Summary of Study DataSpecify the method of describing the study data that will be presented in the final study report. This section provides a general overview of the methods. If any of the items require a unique approach that differs from the general overview, then it should be noted in the appropriate section.
SAP version X.Y: STUDY TITLE Date of Version Page 13 of 26

Statistical Analysis Plan STUDY TITLE
Specify
How data will be ordered How summary tables will be structured (e.g. columns for each treatment
and overall in the order: Placebo, Experimental Low Dose, Experimental High Dose, All Subjects.)
Descriptive or summary statistics that will be displayed for continuous data and for categorical data.
The analysis populations upon which the tables and figures will be based.
Example:
All continuous variables will be summarised using the following descriptive statistics: n (non-missing sample size), mean, standard deviation, median, maximum and minimum. The frequency and percentages (based on the non-missing sample size) of observed levels will be reported for all categorical measures. In general, all data will be listed, sorted by site, treatment and subject, and when appropriate by visit number within subject. All summary tables will be structured with a column for each treatment in the order (Control, Experimental) and will be annotated with the total population size relevant to that table/treatment, including any missing observations.
Only deviations from the general overview will be noted in the subsequent sub-sections within section 9. However, all variables to be summarised need to be documented below.
9.1 Subject DispositionSpecify which variables from the CRF will be used to establish how many subjects reached the various stages of the trial, how many dropped out and for what reasons (death, toxicity, treatment failure, withdrew consent). For example the number screened, randomised, reached visit 1- X, study close, follow-up visits 1- X…
An overview of the time-dependent rates of recruitment should be provided.
If there is any ambiguity arising from multiple sources of visit date, document how this will be resolved.
This section should determine how the population membership and population size for each treatment (to be used in most table headers) will be determined.
A skeleton CONSORT diagram should be provided in this section that provides an explicit statement of what statistics are to be provided.
If appropriate use standard text: ‘The summary statistics will be produced in accordance with section 9.’
9.2 Protocol Deviations
SAP version X.Y: STUDY TITLE Date of Version Page 14 of 26
Statistical Analysis Plan STUDY TITLE
Define the specific protocol deviations that could impact the analysis (e.g. major deviations and a definition of a major deviation) and specify the methods used to describe and analyse them. Clearly define which deviations will exclude a subject from each of the analysis populations defined in section 8.2.
If appropriate use standard text: ‘The summary statistics will be produced in accordance with section 9.’
9.3 Demographic and Baseline VariablesIdentify all variables that will be considered as demographic or baseline variables, recorded at, or shortly, before randomisation or first treatment administration. If transformation of data will occur (e.g. age coarsening into 18-40, 41-65, over 65) then define this exactly in this section. It may be appropriate to summarise these data by centre.
If appropriate use standard text: ‘The summary statistics will be produced in accordance with section 9.’
9.4 Concurrent Illnesses and Medical ConditionsInclude a description of which, if any, coding system was used (e.g. MedDRA, WHO drug dictionary). If appropriate use standard text: ‘The summary statistics will be produced in accordance with section 9.’
9.5 Prior and Concurrent MedicationsThe definitions used to distinguish prior and concurrent should be provided. Include a description of which, if any, coding system was used (e.g. MedDRA, WHO drug dictionary). If appropriate use standard text: ‘The summary statistics will be produced in accordance with section 9.’
9.6 Treatment ComplianceExamples of the assessment of treatment compliance include: remaining pill count, diary records of medication. Any method for calculating a measure of treatment compliance should be defined clearly here. The variables used to assess treatment compliance should be identified.
If appropriate use standard text: ‘The summary statistics will be produced in accordance with section 9.’
10Efficacy AnalysesSpecify the method of summarising and formally analysing the efficacy data that will be used. This section includes a description of the general methods that will be used repeatedly for different variables and analysis populations. If any items need to be handled in a different manner then this should be clarified in the appropriate section below.
The following should be specified in this section
Sort order of the data listings
SAP version X.Y: STUDY TITLE Date of Version Page 15 of 26
Statistical Analysis Plan STUDY TITLE
Grouping of summary table information (e.g. by treatment group and in what order, possibly adding a combined “all subjects” column)
Summary statistics that will be produced for continuous and categorical data
Analysis populations that will be used and identification of the primary population.
The following details of the statistical analyses should be considered and included as needed. The details should be placed either in section 10, if broadly applicable across most analyses, or in the relevant subsections below.
The statistical model underlying the analysis including, strata, covariates, baseline values and interaction terms.
A statement of the clinical objective rephrased in precise statistical terms (null and alternative hypotheses).
The nature of the hypothesis: descriptive, exploratory or confirmatory. The methods used to obtain parameter estimates, confidence intervals
and, if required, p-values. Methods used to check any assumptions behind the analyses (histograms,
box plots) and approaches to be taken if the data do not meet the assumptions.
The rationale for the choice of statistical procedures. The test statistics, the sampling distribution of the test statistic under the
null hypothesis, significance level, alternative hypothesis, whether the test is 1- or 2-sided. If a 1-sided test is to be used, provide justification.
If Bayesian techniques are to be used, specify which prior distributions will be considered, or how the prior(s) will be obtained, with justification.
Any procedures for removing non-significant covariates from the model or model selection procedures in general.
Methods for handling longitudinal data or missing data.
Examples:
All efficacy variables will be listed by subject within study centre. Data will be summarised by treatment group. N, Mean, Standard Deviation, Minimum and Maximum will summarise continuous efficacy variables, whereas number and percent will summarise categorical efficacy variables.
All analyses of the continuous efficacy variables (e.g. VAS pain score) will be performed as analysis of variance with treatment group adjusting for study centre and surgical category. Treatment groups will be tested at the 2-sided 5% significance level.
All assumptions for regression models will be assessed by viewing plots of the residual values
All analyses of categorical efficacy measures will be performed using logistic regression with treatment group and adjustments for study centre.
SAP version X.Y: STUDY TITLE Date of Version Page 16 of 26

Statistical Analysis Plan STUDY TITLE
In some cases it may be more appropriate to clarify items that do not conform to the general methods in individual sections below.
All the variables being considered should be mentioned explicitly in the subsections below even if they are mentioned in this section.
10.1 Primary Efficacy AnalysisDefine the primary analysis that will provide the main result of the trial in this section. Note the use of “analysis” singular. This section of the document should be structured in parallel with 5.2 in terms of the ordering of endpoints considered. If appropriate use standard text: ‘The summary statistics will be produced in accordance with section 9.’
10.2 Secondary Efficacy AnalysesInclude all secondary efficacy analyses. There may be secondary analyses of the primary endpoint including subgroup analyses and sensitivity analyses, which will be included in this section. If appropriate use standard text: ‘The summary statistics will be produced in accordance with section 9.’
10.3 Exploratory Efficacy AnalysesFurther analysis of exploratory endpoints used for hypothesis generation and exploration should be included here. If appropriate use standard text: ‘The summary statistics will be produced in accordance with section 9.’
11Safety AnalysesSpecify the methods of describing the safety data that will be used in the final report. This section includes general descriptions of the methods. If any of the items require a unique approach then this should be noted in the appropriate subsection below.
Specify:
Sort order of any listings Grouping of summary information (e.g. by preferred terms and treatment
group, including an “All Subjects” column) Descriptive statistics that will be displayed for continuous data and for
categorical data. Analysis populations on which the descriptions will be based. How repeat events will be handled when producing summary statistics.
For example: “When calculating the incidence of adverse events, or any sub-classification thereof by treatment, time period, severity, etc., each subject will only be counted once and any repetitions will be ignored; the denominator will be the total population size.”
Only deviations from the aforementioned analytical and summary approaches will be noted in the subsequent subsections of section 11.
SAP version X.Y: STUDY TITLE Date of Version Page 17 of 26

Statistical Analysis Plan STUDY TITLE
Variables being summarised should be listed in the subsections below.
11.1 Extent of ExposureIf appropriate use standard text: ‘The summary statistics will be produced in accordance with section 9.’
11.2 Adverse EventsIf appropriate use standard text: ‘The summary statistics will be produced in accordance with section 9.’
It is useful to include an identification of the components of the numerator and denominator that will be used to calculate incidence rates and percentages. For example: “When calculating the incidence of adverse events, or any sub-classification thereof by treatment, time period, severity, etc., each subject will only be counted once and any repetitions of adverse events will be ignored; the denominator will be the total population size.”
Be certain to specify those adverse events that will be included in the summary and analysis. For example, treatment emergent adverse events are those events that occur after the baseline assessment, and some definitions also include those adverse events that worsen post-treatment.
It may be appropriate only to report the incidence of specific AEs of interest, in which case document these specific AEs. Or it may be appropriate only to report the incidence of AEs that are judged to be related to the treatment.
11.3 Deaths, Serious Adverse Events and other Significant Adverse Events
If appropriate use standard text: ‘The summary statistics will be produced in accordance with section 9.’
11.4 PregnanciesIf appropriate use standard text: ‘The summary statistics will be produced in accordance with section 9.’ If the study did not perform any pregnancy tests or pregnancies are impossible, for example if it was limited to male or post-menopausal subjects only, then explain this succinctly.
11.5 Clinical Laboratory EvaluationsIf appropriate use standard text: ‘The summary statistics will be produced in accordance with section 9.’
Address the issues of
Normal ranges that differ between study centres. Explicitly tabulating the normal ranges when producing the SAP may be useful and timely to ensure the normal ranges have been provided by all centres.
How to handle duplicate laboratory test within study periods. Normally summaries are only provided over scheduled laboratory tests. Any
SAP version X.Y: STUDY TITLE Date of Version Page 18 of 26
Statistical Analysis Plan STUDY TITLE
unscheduled follow-up tests performed for medical or safety concerns, are normally only listed.
Laboratory tests are often summarised using shift tables. Shift tables may show the change in laboratory values from baseline to either each subsequent visit, the final visit, or the most extreme post-baseline value. An alternative may be a figure showing a scatter plot of the baseline value on the horizontal axis versus the subsequent values, as considered above, with different plotting symbols used to distinguish different treatment groups.
11.6 Other Safety MeasuresIf appropriate use standard text: ‘The summary statistics will be produced in accordance with section 9.’ Vital signs might be appropriately included in this subsection. Many of the points made regarding laboratory tests in section 11.5 are relevant to vital signs.
12 PharmacokineticsDescribe pharmacokinetic and pharmacodynamic parameters to be analysed and the approach to the data summaries and analyses. Include pharmacodynamic data in section 12 only if it is not considered as efficacy data included in section 10. If there are no such data collected then this section may be deleted. If appropriate use standard text: ‘The summary statistics will be produced in accordance with section 9.’
If there are a number of variables observed then it may be necessary to generate subsections below. All variables being summarised must be explicitly mentioned.
13Other AnalysesVariables that cannot be easily included in the preceding sections should have their own section here. Replace the heading “Other Analyses” with more appropriate text. Some examples of such data are: health economic data, quality of life data, patient satisfaction data.
All the comments from section 9 onwards may be relevant.
14FiguresFigures are an excellent method to communicate both summary statistics and formal analyses. They also provide an effective means to check assumptions (e.g. assuming a symmetric distribution to justify the use of an arithmetic mean).
They should be used generously and always considered as alternatives or supplements to tabulation for all analyses detailed in sections 4 to 17. In some cases, tabulations are required simply to check the integrity of the study (e.g. baseline variables), are of little direct scientific interest and thus may not benefit from a graphical display. However primary and secondary analyses, along with SAP version X.Y: STUDY TITLE Date of Version Page 19 of 26

Statistical Analysis Plan STUDY TITLE
summaries of primary and secondary endpoints should routinely be considered as candidates for graphical displays.
15 Reporting ConventionsDescribe reporting conventions, for example the precision used for reporting p-values and other numeric values.
Example:
P-values ≥0.001 will be reported to 3 decimal places; p-values less than 0.001 will be reported as “<0.001”. The mean, standard deviation, and any other statistics other than quantiles, will be reported to one decimal place greater than the original data. Quantiles, such as median, or minimum and maximum will use the same number of decimal places as the original data. Estimated parameters, not on the same scale as raw observations (e.g. regression coefficients) will be reported to 3 significant figures.
16Technical DetailsInclude a brief statement of: study-specific documents used, including version numbers; which software package or packages used; and the directory/file paths used to store data, code and output documents.
Describe what quality assurance measures are in place to monitor the quality of any coding. Document who will review which pieces of code, and to what level of detail. For example:
A second review statistician will independently reproduce the primary analyses and summary statistics table X, Y, Z. The reviewing statistician will have an overview of the entire analyses and will explicitly check the code producing tables A, B & C (selected at random) as well as any other pieces of code as desired.
17Summary of Changes to the ProtocolIf the statistical analysis plan proposes changes to the statistical approach described in the protocol then summarise those changes in this section. Analyses are usually faithful to those specified in the protocol, but occasionally different, or supplemental, analyses are needed. Explain the reason for such changes. You may choose to identify those analyses that are not from the protocol in the relevant sections above. However, documenting the changes here greatly aids clarity.
Other important, non-statistical changes to the protocol should also be noted in this section, for example the introduction of an additional treatment group.
SAP version X.Y: STUDY TITLE Date of Version Page 20 of 26
Statistical Analysis Plan STUDY TITLE
18 ReferencesProvide references for any citations in the main body of the SAP.
SAP version X.Y: STUDY TITLE Date of Version Page 21 of 26
Statistical Analysis Plan STUDY TITLE
19 Listing of Tables, Listings and FiguresThis section is to give precise details for each table, listing or figure to be produced. As a minimum it will be a tabulation of the following aspects unique to each table or listing.
Title Footnotes Numbering Population Endpoint(s) Time Points or details of how to conglomerate multiple observations Covariates or Subgroups used to break down summary statistics Which summary statistics will be calculated Or, what formal analysis will be used
Such a table should be derived from an accompanying data set or spreadsheet that will be used to automate some of the aesthetic aspects of table production.
For figures the equivalent information is:
Title Footnotes Numbering Population Type of figure (or combination thereof): scatter plot, box plot, line-graph, bar chart … Endpoint(s), and which is used for horizontal and vertical co-ordinates Statistic(s) used in calculating co-ordinate values used in the figure Covariates used within the figure used to determine colours or symbols Covariates used to define facets or sub-plots
SAP version X.Y: STUDY TITLE Date of Version Page 22 of 26
Statistical Analysis Plan STUDY TITLE
The aim of producing such detailed information is to encapsulate as much routine decision making early on in the process of reporting a trial. It should be done in a way to avoid repetition of the same work later. A secondary purpose is to avoid ambiguity if the work of producing the tables is transferred to someone other than the author of the SAP.
If possible, it is recommended to supplement the above with examples from previous trials, or bespoke mock tables specifically created for the trial.
These detailed specifications can have minor revisions during the production phase without needing to revise the SAP, providing that the specifications in the main body of the SAP sections 4 to 17 are met.
The following is a partially complete example of a listing of tables. It was created originally as an excel file and then pasted into word.
Table Title Number
Population
Endpoint Time Points or how to conglomerate
Covariates or Subgroups
Summary Statistics
Formal Analysis
Foot Notes
Disposition 1.1 NA Disposition Baseline-week21 Treatment count NASummary of Baseline Variable
1.2 Full Analysis
Age Baseline Treatment n, mean, SD, Median, min, max
NA
Cancer Type Baseline Treatment p% (x/n) NAECOG Status Baseline Treatment p% (x/n) NACentre Baseline Treatment p% (x/n) NAHeight Baseline Treatment n, mean, SD,
Median, min, max
NA
Weight Baseline Treatment n, mean, SD, Median, min, max
NA
Surface Area Baseline Treatment n, mean, SD, Median, min,
NA
SAP version X.Y: STUDY TITLE Date of Version Page 23 of 26

Statistical Analysis Plan STUDY TITLE
maxPulse Rate Baseline Treatment n, mean, SD,
Median, min, max
NA
Blood Pressure
Baseline Treatment n, mean, SD, Median, min, max
NA
Incidence of Dose modification
2.1 Full Analysis
Dose Modification
weeks 3-24 Treatment p% (x/n) NA
GEE Logistic Regression Analysis of the Incidence of Dose Modifications
2.2 Full Analysis
Dose Modification
Observations clustered by Subject across all weeks
Treatment NA GEE logistic regression
Kaplan-Meier Estimates/Ratios of time to first dose modification: 12 weeks
2.3 Full Analysis
time to dose modification
estimate at 12 weeks
Treatment NA KM estimates
Cox PH Regression for Time to First Dose Modification
2.4 Full Analysis
time to dose modification
NA Treatment NA Cox Proportional hazards
Summary of the Incidence of Dose Modifications by Week
2.5 Full Analysis
dose modifications
NA Treatment and Cancer Type
p% (x/n) NA
Summary of the Incidence of Dose Modifications by Centre
2.7 Full Analysis
dose modification
up to week 12 Treatment and Centre
p% (x/n) NA
SAP version X.Y: STUDY TITLE Date of Version Page 24 of 26
Statistical Analysis Plan STUDY TITLE
The corresponding Mock Tables are here
SAP version X.Y: STUDY TITLE Date of Version Page 25 of 26
Statistical Analysis Plan STUDY TITLE
The following is an example of a listing of figures. It was created originally as an excel file and then pasted into word.
Title Number Population Type of graph
Horizontal Variables
Vertical Variables
Groupings
Statistics Facets
Boxplot of percentage change in tumour diameter
6.1 Full Analysis Boxplot Treatment
Tumour diameter
Mean, Median, IQR, 5th, 95th percentile
NA
Progression Free Survival
6.2 Full Analysis KM time probability
Treatment
Survival Estimates NA
Overall Survival 6.3 Full Analysis KM time probability
Treatment
Survival Estimates NA
Probability of Dose Modifications
6.4 Full Analysis KM time probability
Treatment
Survival Estimates NA
The corresponding Mock Figures are here
Having reached the end you should edit the headers and footers to add in the correct study title, change the version number, the date you finalised the current version (do not use the automatic “today’s date” as this will change each time you open the document). Also check the accuracy of the table at the top of the document. Update the table of contents. Leave in this reminder paragraph until the final version is confirmed.
SAP version X.Y: STUDY TITLE Date of Version Page 26 of 26