Embed Size (px)
Citation preview

CCS Global Prospects of Carbon Capture and Storage Technologies (CCS) in Emerging Economies
Final Report to the German Federal Ministry for the Environment, Nature Conservation and Nuclear Safety (BMU) Part I: General Status and Prospects of CCS GIZ-PN 2009.9022.6
Wuppertal, 30 June 2012 This project is part of the International Climate Initiative (ICI).
Fina
l Rep
ort

CCS global
2 Final Report Part I
The project on which this report is based was funded by the German Federal Ministry for the Environment, Nature Conservation and Nuclear Safety (BMU) through the GIZ (Project Number 2009.9022.6). The sole responsibility for the content of this report lies with the au-thors.
The total report consists of 6 parts:
Concluding Hypotheses / Zusammenfassende Thesen I. General Status and Prospects of CCS II. Country Study India III. Country Study China IV. Country Study South Africa V. Comparative Assessment of Prospects of CCS in the Analysed Countries Elaborated by Wuppertal Institute Dipl.-Umweltwiss. Andrea Esken Dipl.-Umweltwiss. Samuel Höller Dr. Daniel Vallentin Dr. Peter Viebahn (Project Co-ordinator) With subcontracts to Dr. Pradeep Kumar Dadhich (The Energy and Resources Institute, New Delhi) Prof. Dr. Can Wang (Tsinghua University, Beijing) Prof. Dr. Rosemary Falcon (University of the Witwatersrand, Johannesburg) Dr. Werner Zittel (Ludwig-Bölkow-Systemtechnik, Ottobrunn, Germany) Teresa Gehrs (LinguaConnect, Osnabrück) Assistance by Holger Liptow (GIZ) Christina Deibl, Bianca Falk, Florian Knüfelmann, Geo Kocheril (Wuppertal Institute) Contact Dr. Peter Viebahn Wuppertal Institute for Climate, Environment and Energy Research Group “Future Energy and Mobility Structures” Döppersberg 19 42103 Wuppertal Germany Tel.: +49 202/2492-306 Fax: +49 202/2492-198 E-mail: [email protected] Web: www.wupperinst.org/CCS/

Table of Contents
Wuppertal Institute for Climate, Environment and Energy 3
Table of Contents
Table of Contents 3
List of Abbreviations, Units and Symbols 6
List of Tables 9
List of Figures 10
I. General Status and Prospects of CCS 12
1 Perception and Relevance of CCS in Global CO2 Mitigation Scenarios 13
1.1 Introduction 13
1.2 Global Scenario Studies Analysed 13
1.3 CCS-Based Electricity Generation in Global Low CO2 Energy Scenarios 15
1.3.1 The Bellona Scenario 15 1.3.2 The ETP-BLUE Map Scenario 2010 17 1.3.3 The WEO-450 Scenario 2010 21
1.4 Non-CCS-Based Electricity Generation in Global Low CO2 Energy Scenarios 23
1.5 National Energy Scenarios 25
1.5.1 Regional Development in the Energy [R]evolution Scenario 2010 26 1.5.2 Regional Development in the ETP-BLUE Map Scenario 2010 26 1.5.3 Regional Development in the WEO-450 Scenario 2010 28
1.6 Summary 29
2 CO2 Capture: Technologies, State of Development and Fields of Use 30
2.1 Introduction 30
2.2 Technology Options and State of Development 30
2.2.1 Post-Combustion Process 30 2.2.2 Pre-Combustion Process 32 2.2.3 Oxyfuel Process 33
2.3 Fields of Use 34
2.3.1 New Fossil-Fired Power Plants 34 2.3.2 Retrofitting of CO2 Capture at Operating Fossil-Fired Power Plants 37

CCS global
4 Final Report Part I
2.3.3 Industrial Processes 41 2.3.4 Fuel Production 47
3 CO2 Transport: Technical, Financial and Infrastructural Challenges 51
3.1 Introduction 51
3.2 General Description of CO2 Transport Issues 51
3.2.1 Truck and Train Transport 51 3.2.2 Transport by Ship 52 3.2.3 Movement by Pipeline 53 3.2.4 Comparison of Different Forms of Transport 55
3.3 Existing CO2 Pipeline Infrastructures 56
3.4 Global CO2 Transport Studies 56
3.5 Risks and Uncertainties with CO2 Transport 57
4 CO2 Storage: Types of Storage Formations, Mechanisms for CO2 Storage and Methods for Assessing Storage Potentials 58
4.1 Introduction 58
4.2 Characteristics of Geological Formations Suitable for CO2 Storage 58
4.2.1 Types of Formations and Reservoir Requirements for CO2 Storage 58 4.2.2 Storage Mechanisms 67
4.3 Methods for Assessing the Capacity of CO2 Storage Formations 71
4.3.1 Capacity Concepts 71 4.3.2 Oil and Gas Fields 72 4.3.3 Deep Saline Aquifers 73 4.3.4 Unminable Coal Seams 76 4.3.5 Other Possibilities 77
4.4 Problems and Constraints of CO2 Storage 77
4.4.1 Leakage 77 4.4.2 Seismicity 78 4.4.3 Injection Rate Constraints 80
4.5 Aim of Storage Assessment in this Study 80
5 Supplementary Technology Assessment of CCS 82
5.1 Assessment of Reserves 82
5.2 Economic Assessment 82

Table of Contents
Wuppertal Institute for Climate, Environment and Energy 5
5.3 Life Cycle Assessment 82
5.4 Stakeholder Analysis 84
6 Literature 85

CCS global
6 Final Report Part I
List of Abbreviations, Units and Symbols Abbreviations
BAU Business as usual
BECCS Bio-energy with carbon capture and storage
BFB Bubbling fluidised bed
BMU German Federal Ministry for the Environment, Nature Conservation and Nuclear Safety
CAR Ceramic autothermal recovery
CBM Coalbed methane
CCGT Combined cycle gas turbine
CCS Carbon (dioxide) capture and storage
CFB Circulating fluidised bed
CH4 Methane
CHP Combined heat and power plant
CISA China – India – South Africa
CLC Chemical looping combustion
CO Carbon monoxide
CO2 Carbon dioxide
CO2CRC Cooperative Research Centre for Greenhouse Gas Technologies (AUS)
CSLF Carbon Sequestration Leadership Forum
CTL Coal to liquid
Daf Dry and ash free
DRI Direct reduced iron
ECBM Enhanced coalbed methane
EGR Enhanced gas recovery
EOR Enhanced oil recovery
EREC European Renewable Energy Council
EU European Union
FCC Fluid catalytic cracking
FGD Flue gas desulphurisation
FTSM Feed-in Tariff Support Mechanism
GDR Greenhouse Development Rights
GHG Greenhouse gas
GHGT International Conference on Greenhouse Gas Control Technologies
H2 Hydrogen
H2S Hydrogen sulfide
HHV Higher heating value
HRSG Heat recovery steam generator
IEA International Energy Agency
IGCC Integrated gasification combined cycle
IPCC Intergovernmental Panel on Climate Change
LCA Life cycle assessment
LCOE Levelised cost of electricity

List of Abbreviations, Units and Symbols
Wuppertal Institute for Climate, Environment and Energy 7
LNG Liquefied natural gas
LPG Liquefied petroleum gas
LR Learning rate
MEA Monoethanolamine
N2 Nitrogen
NGCC Natural gas combined cycle
NGO Non-governmental organisation
NOx Nitrous oxides
NRW North Rhine-Westphalia
O2 Oxygen
OECD Organisation for Economic Co-operation and Development
PC Pulverised coal
PCC Pulverised coal combustion
PR Progress ratio
PV photovoltaic
R&D Research & development
SC Supercritical
SCCS Scottish Centre for Carbon Storage
SO2 Sulphur dioxide
STP Standard temperature and pressure
TGR-BF Top gas recycling-blast furnace
UBA German Federal Environment Agency
UCG Underground coal gasification
ULCOS Ultra Low CO2 Steelmaking
USC Ultra supercritical
WI Wuppertal Institute for Climate, Environment and Energy
WTT Well to tank

CCS global
8 Final Report Part I
Units and Symbols
°C degree Celsius
a annum
A surface area of coal basin
Bg gas expansion factor
C completion factor
cp compressibility of pores or rock
cW compressibility of formation water
E efficiency factor
el electric
EV volumetric efficiency
EUR euro
FVF formation volume factor
GC gas content
Gt gigatonne (1 billion tonnes)
GW gigawatt
h cumulative thickness of the coal
hPa Hectopascal
km kilometre
km2 square kilometre
m metre
mCO2, effective effective gravimetric storage capacity
mCO2, theoretical theoretical gravimetric storage capacity
mD millidarci
mm millimetre
MPa megaPascal
Mt megatonne (1 million tonnes)
MW megawatt
n/g net-to-gross ratio (proportion of sediment structures with porosity and permeability suitable for absorbing CO2)
ppm parts per million
Rf recovery
TJ terajoule
traps% proportion of traps in the total volume
USD United States dollar
Vb volume of the potential storage
Vgas(STP) cumulative production volume under standard conditions
ρCO2 density of CO2
ρcoal bulk coal density
φ Porosity
Δp maximum pressure increase
% per cent

List of Tables
Wuppertal Institute for Climate, Environment and Energy 9
List of Tables
Tab. 1-1 Share of plants assumed for CCS implementation 15
Tab. 1-2 CCS contribution to global greenhouse gas emission reduction by 2050 using the Bellona Scenario 17
Tab. 1-3 Contribution of CCS to CO2 emissions abatement under the BLUE Map Scenario for China and India in 2050 27
Tab. 1-4 Analysed scenarios and criteria for exclusion of further treatment 29
Tab. 2-1 Parameters for different categories of pulverised coal combustion technologies 35
Tab. 2-2 Measures to be carried out for various CO2 capture processes 39
Tab. 3-1 Design of CO2 pipelines with an initial pressure of 11 MPa and flow rate of 1.5 m/s 54
Tab. 3-2 Characteristics and suitability of different forms of transport for CO2 56
Tab. 4-1 Overview of the characteristic properties of suitable reservoir rocks for aquifers and gas/oil fields (minimum, maximum and optimum conditions) 61
Tab. 4-2 Overview of trapping mechanisms 70

CCS global
10 Final Report Part I
List of Figures
Fig. 1-1 Contribution of different technology options to reduce greenhouse gas emissions by 84 per cent between 2005 and 2050 under the Bellona Scenario 16
Fig. 1-2 Net electricity generation efficiencies of fossil-fired power plants by different scenarios, with and without CCS 18
Fig. 1-3 Contribution of different technology options to reduce CO2 emissions by 50 per cent up to 2050 under the BLUE Map Scenario 19
Fig. 1-4 Global electricity production in 2050 under the BLUE Map Scenario 19
Fig. 1-5 Globally installed power plant capacity fitted with CCS and captured CO2 emissions in 2050 under the BLUE Map Scenario 20
Fig. 1-6 Contribution of CCS to reductions of CO2 in the power sector in the BLUE Map Scenario in 2050 20
Fig. 1-7 Options for reducing direct CO2 emissions from industry up to 2050 21
Fig. 1-8 Development of CO2 emission savings by policy measures in the WEO-450 Scenario (top: worldwide; bottom: by region) 22
Fig. 1-9 Annual CO2 emissions and reduction pathways allocated under the Greenhouse Development Rights system for different regions (up to 2030, in Mt) 24
Fig. 1-10 Development of CO2 emissions divided by sector under the Energy [R]evolution Scenario and the Advanced Energy [R]evolution Scenario 24
Fig. 1-11 Global development of electricity generation structure under three scenarios (Reference, Energy [R]evolution and Advanced Energy [R]evolution) 25
Fig. 1-12 Annual CO2 emissions and reduction pathways allocated under the Greenhouse Development Rights system for China and India 26
Fig. 1-13 Contribution of technologies to CO2 emissions abatement under the BLUE Map Scenario for China and India in 2050 27
Fig. 1-14 Regional deployment of CCS in power generation under the BLUE Map Scenario (the storage figures show the amount of CO2 stored in the considered year as Mt/a, not cumulated as Mt) 28
Fig. 2-1 Overview of various technological routes to CO2 capture 30
Fig. 2-2 International R&D activities on CO2 capture 32
Fig. 2-3 Temporal availability of CCS 36
Fig. 2-4 Size, age and operating efficiency of coal-fired power plants installed worldwide 37
Fig. 2-5 Direct CO2 emissions in industry by sector 41
Fig. 2-6 Direct CO2 emissions in industry by region/country 42
Fig. 2-7 LKAB’s top gas-recycling blast furnace with CO2 removal plant (VPSA) 44
Fig. 2-8 Investment cost structure for a refinery complex with CO2 capture 46

List of Figures
Wuppertal Institute for Climate, Environment and Energy 11
Fig. 2-9 Well-to-tank emissions of indirect coal liquefaction (with and without CCS) in comparison to conventional diesel 48
Fig. 2-10 Electricity generation costs of co-firing and fully biomass-fired power plants both with and without CCS 50
Fig. 3-1 Costs against distance for onshore pipelines, offshore pipelines and ship transport. The pipeline costs are given for a mass flow of 6 Mt of CO2/a 53
Fig. 4-1 Phase diagram for CO2 59
Fig. 4-2 Variation of CO2 density with depth 60
Fig. 4-3 Schematic examples of open and closed structures in open and closed aquifer systems 64
Fig. 4-4 Adsorption of various gases on “dry and ash free” coal (daf) 65
Fig. 4-5 Share of different trapping mechanisms after injection stops 68
Fig. 4-6 Modified version of the storage potential pyramid suggested by CSLF 72
Fig. 4-7 Conceptual model of geological CO2 storage 75
Fig. 4-8 Potential escape and leakage routes for CO2 injected into saline formations 78
Fig. 4-9 Processes involved in seismic activity induced by underground injection of CO2 79
Fig. 5-1 Stages of a life cycle assessment according to ISO 14 040/14 044 83

CCS global
12 Final Report Part I
I. General Status and Prospects of CCS The aim of this study is to explore whether carbon capture and storage (CCS) could be a viable technology option for significantly reducing CO2 emissions in emerging countries such as China, India and South Africa. These key countries have been chosen as case studies because all three, which hold vast coal reserves, are experiencing a rapidly growing demand for energy, currently based primarily on the use of coal.
The analysis is designed as an integrated assessment, and takes various perspectives. The main objective is to analyse how much CO2 can potentially be stored securely and for the long term in geological formations in the selected countries. Based on source-sink matching, the estimated CO2 storage potential is compared with the quantity of CO2 that could poten-tially be separated from power plants and industrial facilities according to a long-term analy-sis up to 2050. This analysis is framed by an evaluation of coal reserves, levelised costs of electricity, ecological implications and stakeholder positions. The study finally draws conclu-sions on the future roles of technology cooperation and climate policy as well as research and development (R&D) in the field of CCS.
The following sections present introductions to the individual country with profiles for India (Part II), China (Part III) and South Africa (Part IV). First of all, in Part I, a number of global low CO2 energy scenarios are analysed according to whether they include country-specific CCS-based scenarios which could be used in the country analyses (section 1). Section 2 reviews technology options and the state of developments in the field of CO2 capture pro-cesses. Furthermore, different types of uses for CO2 capture are discussed. In section 3 an overview of the technical, financial and infrastructural challenges facing the transportation of CO2 is given whilst section 4 gives an introduction to types of storage formation, mechanisms for CO2 storage and methods for assessing storage potentials. Finally, in section 5 a short overview is given of the methods used in the supplementary technology assessment.

Perception and Relevance of CCS in Global CO2 Mitigation Scenarios
Wuppertal Institute for Climate, Environment and Energy 13
1 Perception and Relevance of CCS in Global CO2 Mitigation Scenarios
1.1 Introduction
The aim of this section is to assess the role that CCS technologies could play on the interna-tional stage. In the first step, a number of different global low CO2 energy scenarios are ana-lysed. Secondly, there is a comparison of the extent to which CCS could contribute to overall CO2 reduction, both in the energy sector and in the industrial sector. Furthermore, low CO2 energy scenarios for India, China and South Africa are reviewed from a CCS perspective. These scenarios could serve as a basis for further analytical work regarding the framework conditions for CCS in country-specific energy sectors.
It should be noted that in the sections below, generally no distinction is made between “hard coal” and “lignite”, so “coal” can refer to either type of coal.
1.2 Global Scenario Studies Analysed
Various global energy scenario studies have been published in recent years by non-governmental organisations (NGO) (for example, EREC and Greenpeace International (2008a)), companies (for example, Shell (2008)) and international agencies (for example, IEA and OECD (2009)). For this section, four different scenario studies are analysed:
• How to Combat Global Warming – The Bellona Scenario (Bellona Foundation 2008);
• Energy Technology Perspectives 2010 (IEA 2010);
• World Energy Outlook 2010 (IEA and OECD 2010);
• Energy [R]evolution – A Sustainable World Energy Outlook 2010 (EREC and Green-peace International 2010).
These studies were chosen because they have all been published within the last two years and all include at least one scenario that attains ambitious climate protection goals.
How to Combat Global Warming – The Bellona Scenario describes a climate protection sce-nario up to 2050, which by then achieves a reduction in global greenhouse gas (GHG) emis-sions of 85 per cent compared to 2005 levels, despite an envisaged nuclear phase-out. A spreadsheet model is used to build the scenario whilst data input comes from a large variety of sources. Contrary to most other scenarios, this one encompasses all greenhouse gases and not just carbon dioxide. Furthermore, it aims to describe “the optimal technological path for considerably reducing global GHG emissions” instead of achieving it via a mix of technol-ogies through economic optimisation (Bellona Foundation 2008).
As well as a Reference Scenario (Current Policies Scenario), the World Energy Outlook (WEO) 2010 from the International Energy Agency (IEA) also describes a 450 Scenario that aims to stabilise the concentration of greenhouse gases in the atmosphere at 450 parts per million (ppm) of carbon dioxide equivalent in the long term. Unlike the other scenarios ana-lysed in this paper, which all run until the middle of the century, the scenarios of the WEO

CCS global
14 Final Report Part I
2010 are described in detail only up to 2035. Consequently, the figures on coal power gener-ation do not go beyond this date.
Energy Technology Perspectives (ETP) 2010 is the third publication in the ETP series, fol-lowing previous ones published in 2006 and 2008. As the title suggests, a theme of these publications is the various technological options regarded as essential in reaching “a more secure, sustainable and affordable energy future” (IEA 2010). ETP 2010 describes a number of different scenarios for the global energy system up to 2050. In addition to a Baseline Sce-nario, a main alternative scenario named BLUE Map and other variations on the BLUE Map Scenario are developed. In all versions of the BLUE scenario, the global energy-related CO2
emissions are reduced to 50 per cent of 2005 levels by 2050. Based on the IEA assump-tions, the BLUE Map Scenario is the most cost-effective way of achieving this goal.
However, it should be noted that, according to climate research findings, a 50 per cent reduc-tion target will not be sufficient to limit the rise in temperature to 2 degrees. In fact, the IPCC assumes that a minus 50 to minus 85 per cent global reduction in greenhouse gas emissions on year 2000 levels by 2050 is quite likely to be required to achieve temperature targets (IPCC 2007). Not even the 50 per cent reduction within the BLUE scenario set would fulfil the IPCC requirements since the scenarios use 2005 as their basis and not 1990, as the WEO does.
The BLUE Map Scenario does focus separately on India and China, but there are no detailed figures on the development pathways up to 2050.
The 2010 Energy [R]evolution study is the third in a series of studies, of which the first were published in 2007 and 2008 (see, for example, EREC and Greenpeace International (2008b); Krewitt et al. (2009)). It aims to show how the global energy system could be transformed up to 2050 to comply with stringent climate protection goals without relying on new nuclear power plants or on CCS technology. The study includes two scenarios which envisage dras-tic improvements in energy efficiency, an ambitious increase in the use of all forms of renew-able energy and a global phase-out of nuclear energy. Whilst the Energy [R]evolution Sce-nario achieves a reduction in global energy-related CO2 emissions of 51 per cent by 2050 compared to 1990 emissions, the more ambitious Advanced Energy [R]evolution Scenario would achieve a reduction of 84 per cent by 2050. Since both scenarios are broken down into IEA world regions and single countries, individual scenarios for India, China and South Africa can be used.
Three of the analysed studies consider CCS as part of their low CO2 energy scenarios. The-se scenarios and their focus on CCS are described in section 1.3:
• How to Combat Global Warming – The Bellona Scenario (Bellona Foundation 2008);
• World Energy Outlook 2010 (IEA and OECD 2010);
• Energy Technology Perspectives 2010 (IEA 2010).
Although the Energy [R]evolution study does not consider CCS, its Energy [R]evolution Sce-nario 2010 (EREC and Greenpeace International 2010) is also analysed. In the country-specific scenarios its country reports will be used to illustrate a low coal-based strategy. This scenario is described in section 1.4.

Perception and Relevance of CCS in Global CO2 Mitigation Scenarios
Wuppertal Institute for Climate, Environment and Energy 15
1.3 CCS-Based Electricity Generation in Global Low CO2 Energy Scenarios
1.3.1 The Bellona Scenario
The Bellona Business-as-Usual (BAU) scenario is mainly based on rather conservative as-sumptions of both the Reference Scenario in the IEA World Energy Outlook 2007 (IEA and OECD 2007) and the Baseline Scenario in the IEA Technology Perspectives 2006. Under BAU conditions, global GHG emissions would increase from 44.9 Gt of CO2-eq in 2005 to 81 Gt of CO2-eq by 2050. In comparison, the Bellona Scenario assumes that changes in life-style will “reduce the growth in energy demand and resulting GHG emissions through re-duced consumption and improved availability and use of low carbon products and solutions.” The main development issues within this scenario are:
• An increase in global primary energy demand of 23 per cent between 2005 and 2050;
• A decreased dependency on fossil fuel from 81 per cent in 2005 to 40 per cent in 2050;
• Renewable energy accounting for 60 per cent of total energy supply by 2050;
• A decrease in global GHG emissions by 84 per cent (37.7 Gt CO2-eq/a) between 2005 (44.9 Gt CO2-eq) and 2050 (7.1 Gt CO2-eq) and a decrease of 91 per cent (74 Gt CO2-
eq/a), if compared with BAU 2050 figures;
• A peak in global GHG emissions before 2015 (see Fig. 1-1).
Bellona regards CCS as one of the main low carbon technologies and considers the use of this technology for clean energy development as “ambitious, but also realistic.” The potential for CCS is based on another Bellona study (Stangeland 2007) “which concluded that CCS can reduce CO2 emissions from fossil fuelled power plants by 80 per cent in OECD countries by 2050”, but for the Bellona Scenario this assumption is enhanced to a CCS share of 100 per cent. Furthermore, it is assumed that CCS can be implemented in 50 per cent of industri-al plants and fuel transformation plants, respectively, and in 80 per cent of biomass-based power plants.
In general, the potential for non-OECD countries is set at 75 per cent of the potential for OECD countries. Tab. 1-1 summarises the assumptions of the CCS contribution to CO2 re-duction.
Tab. 1-1 Share of plants assumed for CCS implementation
Sector Share of CO2 emissions where CCS is introduced in 2050
OECD countries Non-OECD countries
2030 2050 2030 2050
% % % %
Fossil-fired power plants 33 100 25 75
Biomass-fired power plants 26.7 80 20 60
Industry and fuel transformation 16.7 50 12.5 37.5
Source: Bellona Foundation (2008)
The main assumptions on which the calculation of CO2 reduction by CCS are based are

CCS global
16 Final Report Part I
• Commercial availability of CCS by 2020;
• A capture rate of 80 per cent by 2015, increasing to 90 per cent by 2050;
• An increased energy demand, given as a percentage of the power production from a power plant, of 15 per cent by 2015, decreasing to 10 per cent by 2050. This equates to a penalty load of 5 to 6 percentage points for existing power plants, decreasing to 3 to 5 percentage points by 2050.
Fig. 1-1 shows the development of global GHG emissions between 2005 and 2050 (minus 84 per cent) as well as the share of the considered low carbon technologies on the total GHG reduction by 2050, if one compares the 2050 figures between BAU and Bellona (minus 91 per cent). Nearly 23 Gt of CO2-eq/a or 31 per cent of the total reduction abatement by 2050 (74 Gt CO2-eq/a) is assumed to be enabled by the implementation of CCS.
Fig. 1-1 Contribution of different technology options to reduce greenhouse gas emissions by 84
per cent between 2005 and 2050 under the Bellona Scenario
Source: Bellona Foundation (2008)
Whilst the diagram shows only the differentiation between bioenergy-based CCS (60 per cent) and other CCS sources (40 per cent), Tab. 1-2 illustrates the allocation to individual sources. It shows that only a minor share comes from fossil fuelled power production (24 per cent) and from industrial sources (7 per cent), whilst the majority is enabled by CCS from large biomass power plants (40 per cent) and from other biomass-based sources (20 per cent). Biomass power plants applying CCS combines two effects – replacing fossil fuels with biomass and, additionally, capturing the CO2, also referred to as “carbon negative energy”. The high level indicated seems to be quite ambitious, especially considering that today only small-scale biomass based plants exist. This is why Bellona argues “how important it is to deploy large-scale bio power plants with CCS.” Another conclusion is that “the CCS potential is relatively evenly distributed across OECD and non-OECD regions, which is a compelling reason for deploying CCS in developing countries as well as in developed countries” (Bellona Foundation 2008).

Perception and Relevance of CCS in Global CO2 Mitigation Scenarios
Wuppertal Institute for Climate, Environment and Energy 17
Tab. 1-2 CCS contribution to global greenhouse gas emission reduction by 2050 using the Bellona Scenario
Source and technology GHG emission reduction in 2050
Gt CO2-eq/a %
Biomass 13.6 60
Biomass for power production and fuel transformation (with CCS) 4.4 20
CCS from bioenergy-based sources 9.2 40
Non-biomass 9.2 40
CCS for fossil-fired power production 5.6 24
CCS for fuel transformation from fossil-fired sources 2.1 9
CCS for industrial sources 1.7 7
Total 23 100
Source: Based on Bellona Foundation (2008)
1.3.2 The ETP-BLUE Map Scenario 2010
The ETP 2010 Baseline Scenario is based on the Reference Scenario published in the IEA World Energy Outlook 2009 (IEA and OECD 2009), which anticipates developments up to 2030, and presents its own projections for the period between 2030 and 2050. Under BAU conditions, global CO2 emissions would increase from 29 Gt of CO2 in 2007 to 40 Gt of CO2 by 2030 and to 57 Gt of CO2 by 2050 (which is a total growth of 28 Gt, or 97 per cent). It is assumed that nearly all the growth (96 per cent) in global CO2 emissions in the Baseline Scenario will come from outside the OECD. In this study, it is worth noting that “CO2 emis-sions in India show the largest relative increase, rising nearly fivefold by 2050.”
In contrast, in its BLUE Map Scenario the IEA estimates that a 50 per cent reduction in global CO2 emissions by 2050 (compared to the 2005 level) would require a 43 Gt reduction in CO2 compared to the Baseline Scenario (IEA 2010). The main developments within this scenario, the target of which is consistent with the 450 ppm IPCC scenario, are
• A 50 per cent (14 Gt CO2/a) decrease in global CO2 emissions between 2005 (29 Gt CO2) and 2050 (15 Gt CO2) and a decrease of 75 per cent (43 Gt CO2-eq/a), if compared with the Baseline 2050 figures;
• A peak in global CO2 emissions at below 31 Gt between 2015 and 2020 (see Fig. 1-3).
According to the IEA, this ambitious CO2 reduction target “will require the development and deployment of a wide range of energy-efficient and low-carbon technologies across every sector of the economy.” But from 2030, existing technologies and measures would no longer be sufficient and would have to be supplemented by the widespread introduction of CCS (and other) technologies. The calculation of CO2 reduction through CCS is chiefly based on the assumptions that:
• New CCS-based power plants are mainly erected between 2030 and 2050;
• The retrofit of existing power plants with CCS “is expected to play a significant role be-fore 2030,” which requires that “new fossil-fired plants built over the next 10 to 20 years utilise technologies and practices that enable such retrofitting to take place”;

CCS global
18 Final Report Part I
• For CCS-based power plants, a reduction of electrical efficiencies for coal at a level of around 7 per cent; for natural gas a figure of around 9 per cent is assumed (Fig. 1-2).
Fig. 1-2 Net electricity generation efficiencies of fossil-fired power plants by different scenarios,
with and without CCS Source: IEA (2010)
Taking these assumptions into account, it has been calculated that CCS can make a 19 per cent contribution to the decrease in CO2 emissions in the BLUE Map scenario, with the CO2
being captured from power stations (10 per cent) and industrial sites and fuel transformation plants (9 per cent) in roughly equal measures (see Fig. 1-3). This means that 55 per cent of the captured CO2 comes from the energy sector and 45 per cent from industry and transfor-mation. The latter comprises cement kilns, ammonia plants and combined heat and power plants (CHP) in industry as well as refineries, synthetic fuel production (synfuels) and blast furnaces in the fuel transformation sector.

Perception and Relevance of CCS in Global CO2 Mitigation Scenarios
Wuppertal Institute for Climate, Environment and Energy 19
Fig. 1-3 Contribution of different technology options to reduce CO2 emissions by 50 per cent up to
2050 under the BLUE Map Scenario
Source: IEA (2010)
The maximum reduction in CO2 as a result of using CCS is 8.2 Gt/a, 4.5 Gt/a of which is con-tributed by the energy sector and 3.7 Gt/a by industry and transformation. The total amount is equivalent to 28 per cent of current CO2 emissions (these figures already take into account that CCS would require an additional amount of fuel due to efficiency losses). Consequently, CCS would make a substantial contribution to achieving the 50 per cent reduction target.
Taking the power plant sector in isolation, Fig. 1-4 and Fig. 1-5 show the share of different fuels within total CCS-based power generation (Fig. 1-4 illustrates the share within generated electricity in total; Fig. 1-5 shows the share from installed capacity).
Fig. 1-4 Global electricity production in 2050 under the BLUE Map Scenario
Source: IEA (2010)

CCS global
20 Final Report Part I
Fig. 1-5 Globally installed power plant capacity fitted with CCS and captured CO2 emissions in
2050 under the BLUE Map Scenario
Source: IEA (2010)
Combining both pie charts in Fig. 1-5 produces Fig. 1-6, which shows that CCS could con-tribute 31 per cent of CO2 reduction in electricity generation, equalling 4.34 Gt of CO2 (of 14 Gt CO2 in total). This quantity of reduced CO2 emissions is lower than the amount of cap-tured CO2 given in Fig. 1-5 (5.4 Gt CO2/a) due to the energy (and therefore CO2) penalty of the capture process.
Fig. 1-6 Contribution of CCS to reductions of CO2 in the power sector in the BLUE Map Scenario
in 2050
Source: IEA (2010)
Within industry, CCS could contribute 33 per cent to overall CO2 reduction activities by 2050, which would equal 1.75 Gt of CO2/a (Fig. 1-7). Second only to energy efficiency measures,

Perception and Relevance of CCS in Global CO2 Mitigation Scenarios
Wuppertal Institute for Climate, Environment and Energy 21
this would be the most effective reduction measure, complemented by energy fuel and feed-stock switching as well as recycling and energy recovery.
Fig. 1-7 Options for reducing direct CO2 emissions from industry up to 2050 Source: IEA (2010)
The consequences of this scenario development are that:
• OECD countries reduce their CO2 emissions by 77 per cent compared to 2005 levels, whilst non-OECD countries reduce their emissions by 25 per cent;
• By 2050, the share of coal use in power generation decreases from 44 per cent in the Baseline Scenario to 12 per cent in the BLUE Map Scenario;
• The contribution from natural gas decreases from 23 per cent to 15 per cent;
• More than 90 per cent of coal-based and around 30 per cent of gas-based electricity generation comes from power plants fitted with CCS;
• The total amount of annually captured CO2 is 9.4 Gt/a and therefore 14.6 per cent higher than the avoided CO2 (8.2 Gt/a). 21 per cent (2 Gt) is derived from industry, 57 per cent (5.4 Gt) from power plants and 21 per cent (2 Gt) from other transformation processes;
• In total, 1,011 GW of CCS-based power plants are expected to be installed by 2050 (in-cluding large-scale industrial CHP plants). This figure includes 550 GW of coal-fired, 298 GW of gas-fired and 49 GW of biomass- and waste-fired power plants (all of them newly built). 114 GW of coal-fired capacity is retrofitted with CCS;
• The share differs if one compares the source of captured CO2 emissions: the major part (86 per cent) originates from coal, followed by 12 per cent from natural gas and 2 per cent from biomass;
• Combined, 79 Gt of CO2 are being captured and stored between 2010 and 2050, of which coal-fired power plants account for 87 per cent (69 Gt), gas-fired 10 per cent (8.2 Gt) and biomass-fired 3 per cent (2.0 Gt).
1.3.3 The WEO-450 Scenario 2010
CCS is considered as a key element in the WEO-450 Scenario. As Fig. 1-8 shows, the con-tribution of CCS to worldwide CO2 emission reductions amounts to 17 per cent by 2030 and

CCS global
22 Final Report Part I
19 per cent by 2035, which differs from the Current Policies Scenario. The figure illustrates that there is an earlier deployment of CCS than that which is assumed in the BLUE Map Scenario, leading to a CO2 emissions abatement of 2.6 Gt/a by 2030 and to 4 Gt/a by 2035 (compared to the BLUE Map Scenario, which requires about 1 Gt/a in 2030 and about 4 Gt/a in 2035). Possible reasons for this difference might be:
• The different approaches applied in the scenario development: whilst the Energy Tech-nology Perspectives take a technological view, looking at technical development in more detail, the World Energy Outlook is demand driven, based on international energy and environmental policies and trying to optimise the economic aspect of future energy sys-tems;
• The different reference value: as already mentioned, the WEO reduction targets refer to the 1990 level whilst the ETP takes 2005 as the base and therefore shrinks the required amount of CO2 emission reduction.
As this scenario, unlike the other scenarios, runs only until 2035, it cannot be considered further since in the country analyses it is necessary to calculate the cumulated captured CO2 emissions.
Fig. 1-8 Development of CO2 emission savings by policy measures in the WEO-450 Scenario
(top: worldwide; bottom: by region) Source: IEA and OECD (2010)
Perception and Relevance of CCS in Global CO2 Mitigation Scenarios
Wuppertal Institute for Climate, Environment and Energy 23
1.4 Non-CCS-Based Electricity Generation in Global Low CO2 Energy Sce-narios
The Energy [R]evolution Scenario 2010
The Greenpeace/EREC-Energy [R]evolution Scenario 2010 is based on the Reference Sce-nario published in the IEA World Energy Outlook 2009 (IEA and OECD 2009), which projects development up to 2030. Its key macroeconomic and energy indicators were extrapolated for the period between 2030 and 2050. Under BAU conditions, global CO2 emissions would in-crease from 27.4 Gt of CO2 in 2007 to 38.5 Gt of CO2 by 2030 and to 44.3 Gt of CO2 by 2050 (which is a total growth of 16.9 Gt, or 62 per cent). It is worth noting that in this study “China and India are expected to grow faster than other regions” (EREC and Greenpeace Interna-tional 2010).
The aim of the Energy [R]evolution Scenario is to illustrate the efforts and actions required to achieve a worldwide reduction in CO2 emissions down to a level of around 10 Gt by 2050, which would be necessary to keep the increase in global temperature below 2°C in 2100. As in the Reference Scenario, these efforts are broken down into the ten IEA world regions by applying a multi-region model. Besides the assumptions for macroeconomic figures, such as population development and economic growth, which are carried across from the Reference Scenario, the Energy [R]evolution Scenario is based on the following assumptions and prin-ciples:
• Using the cost curve approach to provide supply curves of carbon abatement for renewa-ble energies and energy efficiency measures to show current and future potential and in-vestments for each technology individually. They are based on cost projections provided by applying the learning curve approach;
• Assuming a worldwide CO2 emissions trading system and including the (increasing) cost of CO2 allowances in the calculation of electricity production costs;
• Implementing a Feed-in Tariff Support Mechanism (FTSM) which could enable the faster deployment of new renewable energy power plants in developing countries with financial support from industrialised nations. This instrument aims to bridge the current cost gap between renewable and coal- or gas-fired electricity generation;
• Sharing the national CO2 reduction goals between industrialised and developing coun-tries by applying the Greenhouse Development Rights (GDR) framework (Baer et al. 2008). This approach takes “inequality within countries into account and calculates na-tional obligations on the basis of the estimated capacity and responsibility of individuals.” It is the basis for developing national CO2 reduction pathways, and Fig. 1-9 demonstrates this global obligation to move from the reference figures towards the targets of the Ener-gy [R]evolution Scenario, divided into the largest regions required. Detailed figures for In-dia and China are given in section 1.4.

CCS global
24 Final Report Part I
Fig. 1-9 Annual CO2 emissions and reduction pathways allocated under the Greenhouse
Development Rights system for different regions (up to 2030, in Mt) Source: EREC and Greenpeace International (2010)
The resulting worldwide development of CO2 emissions divided by sector is illustrated in Fig. 1-10. In the Energy [R]evolution Scenario, CO2 emissions decrease from 27,408 Mt in 2007 to 10,202 Mt by 2050. This means a reduction of the annual per capita emissions from 4.1 to 1.1 tonnes. The main contributors to this reduction are efficiency gains and a high take-up of renewables.
Fig. 1-10 Development of CO2 emissions divided by sector under the Energy [R]evolution Scenario
and the Advanced Energy [R]evolution Scenario
Source: EREC and Greenpeace International (2010)

Perception and Relevance of CCS in Global CO2 Mitigation Scenarios
Wuppertal Institute for Climate, Environment and Energy 25
By looking only at the power plant sector, Fig. 1-11 illustrates the share of different technolo-gies in the electricity generation structure (including “efficiency” as a reduction compared to the Reference Scenario) for both the Energy [R]evolution Scenario and the Advanced Energy [R]evolution Scenario (which is not considered in the presented study). The development of the power plant sector within the Energy [R]evolution Scenario is characterised by a phase-out of nuclear energy and a significant reduction in the number of coal-fired power plants (hard coal, labelled as coal, and lignite). By 2050, 79 per cent of the electricity generated worldwide will come from renewable energy sources, 10 per cent from coal and 10 per cent from highly efficient natural gas power plants. The coal-fired power plants still in use in 2050 (611 GW) will mainly comprise those which have been built recently, or which are being built now and will be still in operation in the middle of the century.
Fig. 1-11 Global development of electricity generation structure under three scenarios (Reference,
Energy [R]evolution and Advanced Energy [R]evolution)
Source: EREC and Greenpeace International (2010)
As mentioned above, the Energy [R]evolution Scenario explicitly excludes CCS since it is not seen to be necessary for reaching even ambitious long-term GHG reduction goals by 2050. Greenpeace and EREC argue that CCS power plants are not included in their analyses since CCS would “probably not become commercially viable as a possible effective mitigation op-tion until 2030.” If it was to be viable earlier, it would not be a solution due to its high overall cost, which would “serve as a major barrier to its deployment” (EREC and Greenpeace Inter-national 2010).
1.5 National Energy Scenarios
In this section, there is a review of what energy scenarios are available for the countries un-der investigation in this study. From the considered scenarios, only the Energy [R]evolution Scenario (excluding CCS) and the BLUE Map Scenario (including CCS) consider trends on a regional and national level to some degree of detail. Whilst the first one adopts the IEA ap-proach and considers ten world regions and single countries (therein India, China, South Africa), the latter investigates India, China, OECD Europe and the United States in detail. The WEO-450 Scenario also considers individual regions and states, but only provides quali-tative statements on the role of CCS.

CCS global
26 Final Report Part I
1.5.1 Regional Development in the Energy [R]evolution Scenario 2010
As mentioned above, in the Energy [R]evolution Scenario the Greenhouse Development Rights (GDR) framework is applied to develop national CO2 reduction pathways. The GDR framework “calculates the share of global climate obligation for each country,” so it can “be used to calculate (against a baseline) the reductions that each country needs to achieve to meet an international target” (EREC and Greenpeace International 2010). Applying the glob-al obligation, which is required to move from the Baseline Scenario (WEO 2009 Reference Scenario) to the overall emission target set in the Energy [R]evolution Scenario, yields reduc-tion curves proportionate to each country’s share. These curves are illustrated in Fig. 1-12 for China and India.
Fig. 1-12 Annual CO2 emissions and reduction pathways allocated under the Greenhouse
Development Rights system for China and India
Source: EREC and Greenpeace International (2010)
The curves illustrate that in these countries “the allocation of permits is greater than the esti-mated emissions [within the Energy [R]evolution Scenarios], indicating that other countries will need to support a reduction from the level indicated by the allocation (solid lines) and projected emissions (dashed lines).” Furthermore, the analysis within the Energy [R]evolution Scenario shows that these country-specific obligations can be met without using CCS or nu-clear energy in the long term.
1.5.2 Regional Development in the ETP-BLUE Map Scenario 2010
Fig. 1-13 shows that for both China and India nearly the same share of CCS on the total CO2 emissions abatement as that attributed globally is assumed. But in absolute figures, the amount of CO2 captured in China would be double that captured in India. For China, the BLUE Map Scenario identifies a figure of 18 per cent of CO2 emissions reduction by 2050 (2.09 Gt/a) which could be provided by CCS (10 per cent originates from power generation and 8 per cent from industry and transformation). For India, a share of 17 per cent by 2050 (9 per cent from power generation and 8 per cent from industry and transformation) is identified, which adds up to 0.85 Gt/a (compare Tab. 1-3).

Perception and Relevance of CCS in Global CO2 Mitigation Scenarios
Wuppertal Institute for Climate, Environment and Energy 27
Fig. 1-13 Contribution of technologies to CO2 emissions abatement under the BLUE Map Scenario for China and India in 2050
Source: IEA (2010)
Tab. 1-3 Contribution of CCS to CO2 emissions abatement under the BLUE Map Scenario for China and India in 2050
Country Total CO2 Share of CCS Share of CCS for power and industry
reduction Power Industry
Gt/a Gt/a % Gt/a % Gt/a %
China 11.6 2.09 18 1.16 10 0.93 8
India 5 0.85 17 0.45 9 0.4 8
Total 16.6 2.94 1.61 1.33
Source: Authors’ composition based on IEA (2010)
It is expected that the majority of worldwide CCS activities in 2050 will be located in China and India. As Fig. 1-14 illustrates, by 2050 nearly 300 GW from 1,100 GW of installed CCS-based power plant capacity worldwide will be based in these two countries, providing 2 Gt of separated1 CO2 emissions (around 36 per cent of globally separated CO2 emissions). This contradicts the statistics given per country, where 1.61 Gt of CO2/a is calculated for the en-ergy sector (Tab. 1-3). It should be noted that the storage figures given in Fig. 1-14 show the amount of CO2 stored in the year in question as Mt/a, and not as stated as Mt cumulated.
Unfortunately, the BLUE Map Scenario lacks the detailed data needed for the analyses pre-sented in the country reports:
• Instead of illustrating the development of CCS- and non-CCS-based power generation capacities between 2000 and 2050, only the figures for 2050 (Baseline as well as BLUE Map Scenario) are given. This means that these scenarios can only be used for compari-
1 It should be noted that “separated” CO2 emissions are larger than “reduced” CO2 emissions due to the
energy penalty of the capture process that causes additional CO2 emissions.

CCS global
28 Final Report Part I
son purposes focusing on 2050, but not for assessing the cumulative CO2 emissions that must be stored until 2050;
• In general, it is not clear whether these figures include the additional CO2 emissions that occur due to the penalty load required by CCS or whether avoided emissions equal sepa-rated emissions.
Fig. 1-14 Regional deployment of CCS in power generation under the BLUE Map Scenario (the
storage figures show the amount of CO2 stored in the considered year as Mt/a, not cumulated as Mt)
Source: IEA (2010)
1.5.3 Regional Development in the WEO-450 Scenario 2010
The WEO-450 Scenario provides only qualitative statements on the role of CCS for China, India and South Africa (IEA and OECD 2010):
• China: It is expected that, in the longer term, CCS development in China will play a key role in the global deployment of this technology;
• India: CCS is expected to play a powerful role in moving towards the 450 Scenario;
• South Africa: Since South Africa’s CO2 emissions are expected to decrease by 53 per cent by as early as 2035, compared to 2008 emissions, a widespread deployment of CCS technologies is assumed. “In 2035, CCS would account for 48 per cent of South Af-rican abatement, compared with the New Policies Scenario, up from only 6 per cent in 2020. This very substantial share is because, with very rich coal resources and a CO2 price of USD 90 per tonne in other major economies, the application of CCS to coal-fired generation makes better economic sense for South Africa than a move to other sources of power.”

Perception and Relevance of CCS in Global CO2 Mitigation Scenarios
Wuppertal Institute for Climate, Environment and Energy 29
1.6 Summary
In this study, two main conditions must be fulfilled for an existing energy scenario to be used for country-level analysis:
1. A long-term development up to 2050 has been considered.
2. Data on the possible CCS deployment per decade are available at country level.
Tab. 1-4 illustrates the results of the assessments of the scenarios considered. It reveals that no scenario framework exists that fulfils the requirements outlined above. The only scenario where all required figures are both calculated and stated (Energy [R]evolution scenario) does not consider CCS. Therefore, in the country-specific sections, their own CCS-based scenari-os will be developed, based on existing scenarios that have not included CCS so far.
Tab. 1-4 Analysed scenarios and criteria for exclusion of further treatment
Scenario Time Stated Regional development
frame decades China India South Africa
CCS-based electricity generation scenarios as part of global low CO2 energy scenarios
The Bellona Scenario 2050 2050 --- --- ---
ETP-BLUE Map Scenario 2010 2050 2050 Only figures for 2050 ---
WEO-450 Scenario 2010 2035 2020, 2030, 2035
Only qualitative
Non-CCS-based electricity generation scenarios as part of global low CO2 energy scenario
Energy [R]evolution Scenario 2050 2010–2050 X X X
Cells marked bold lead to the exclusion of further treatment in the country-specific analyses Bellona Scenario: (Bellona Foundation 2008); ETP-BLUE Map Scenario: (IEA 2010); WEO-450 Scenario: (IEA and OECD 2010); Energy [R]evolution Scenario: (EREC and Greenpeace International 2010)
Source: Authors’ composition

CCS global
30 Final Report Part I
2 CO2 Capture: Technologies, State of Development and Fields of Use
2.1 Introduction
Section 2.2 assesses technology options and the state of development in the field of CO2 capture processes, including post-combustion, pre-combustion and oxyfuel capture technol-ogies. There follows an evaluation of different fields of use for CO2 capture. This encom-passes new fossil-fired power plants, retrofitting of operating power plants and industrial pro-cesses, such as in the steel and iron industry, cement industry, chemical industry, fuel pro-duction and biomass utilisation.
2.2 Technology Options and State of Development
CO2 capture processes can be subdivided into three technological groups: post-combustion, pre-combustion and oxyfuel processes (see Fig. 2-1). Fig. 2-2 illustrates ongoing research and development (R&D) for all three CO2 capture routes.
Fig. 2-1 Overview of various technological routes to CO2 capture
Source: Ewers and Renzenbrink (2005)
2.2.1 Post-Combustion Process
CO2 is captured from the flue gas of fossil-fired plants. The flue gas of conventional power plant processes has a CO2 concentration of less than 3 to 15 per cent, because combustion of the fuel takes place with air, which is almost 80 per cent nitrogen. The low CO2 concentra-tion makes the economic capture of the greenhouse gas challenging, since a huge volume of gas needs to be treated, requiring large quantities of chemicals and energy. Nevertheless,

CO2 Capture: Technologies, State of Development and Fields of Use
Wuppertal Institute for Climate, Environment and Energy 31
compared with other capture processes, post-combustion processes have the highest short- to medium-term achievable potential for CO2 reduction. This is due to the fact that they are also suitable for being retrofitted onto existing power plants, which generate around two thirds of CO2 emissions in the electricity sector (Figueroa et al. 2008). Demonstration plants are likely to be available by 2015, enabling the technology to be used on a large scale begin-ning sometime between 2020 and 2030. In addition, post-combustion processes are increas-ing in importance because a broad market launch of integrated gasification combined cycle (IGCC) power plants with pre-combustion processes have been curbed by a sharp increase in the investment costs for large-scale plants (Herzog et al. 2009).
Chemical absorption processes based on amines are the most developed solvents for post-combustion CO2 capture processes, because similar scrubbing processes are already in use in other branches of industry. Some of the leading suppliers include Mitsubishi Heavy Indus-tries (MHI; Japan), Cansolv (Canada), Fluor (USA), HTC Purenergy (Canada) and Aker Clean Carbon (Norway). Monoethanolamine (MEA) is one of the preferred amine solutions. However, MEA is a relatively powerful solution that bonds strongly with CO2, causing its re-generation to involve high energy use. For this reason, ongoing R&D focuses on optimising amine solvents or the development of alternative solvents. Approaches for optimising amine solvents are hindered amines and blended solvents. The former is a modification of the mo-lecular geometry of amines, aiming at increasing the reactivity of amines and weakening the bond between amines and CO2 to reduce the energy requirements involved in CO2 capture. Blending amines with other solvents also serves the purpose of optimising capture efficiency and enhancing the reaction rate.
Besides absorption, alternative post-combustion pathways such as adsorption, membrane processes and biological capture processes are being tested and developed in R&D projects. In adsorption processes, the CO2 is not absorbed by the solvent but is attached to its sur-face. There is no chemical reaction between the CO2 and the solvent. At present, work is being carried out on adsorption processes that use zeolitic or metal-organic substances to bond the CO2. The former have a high CO2 selectivity but a low capture capacity. The latter have a high adsorption capacity, but it is not certain how resistant they are to impurities in the flue gas.
Membrane processes are an alternative medium- to long-term option. Membranes are semi-permeable separating layers used to separate mixtures of substances, such as flue gas. They are already used commercially in a range of industries, but their use in CO2 capture is still at a relatively early stage of development. Membranes have the advantage that impuri-ties are removed by separating the flue gas prior to the capture process, reducing the con-sumption of the solvent. However, existing membrane technologies have a low level of tech-nological maturity and are not yet an economical option. Therefore, current R&D activities shall enhance the economic efficiency of membranes and improve their selectivity and per-meability. In Germany, the Forschungszentrum Jülich is working on the development of po-rous and ceramic membranes and on suitable methods for the production of membranes.
Biological capture processes are expected to be available on a large scale in the medium to long term. They use natural organisms, such as algae or enzymes, to bond the CO2. Algae-based capture processes are currently being pursued with great interest in the USA, since CO2 is converted into biomass which can be utilised as energy. German energy suppliers

CCS global
32 Final Report Part I
such as RWE, E.On and Vattenfall Europe are also working on R&D projects in this field. In July 2010, Vattenfall Europe started a project which will analyse which species of algae are most suited for breeding from captured CO2 produced in a lignite-fired co-generation power plant in Senftenberg (Brandenburg). Algae cultures can be bred in either open ponds or closed reactors. The CO2 is transformed into air by photosynthesis. The algae reproduce and can be processed into related products such as biodiesel. In enzyme-based processes, the CO2 is bound by enzymes in a biological reactor and transformed into bicarbonate ions. The bicarbonate can then be processed into limestone, amongst other things. The Canadian company CO2 Solutions is currently developing and testing bacteria for the production of suitable enzymes in cooperation with Babcock and Wilcox.
Fig. 2-2 International R&D activities on CO2 capture
Source: Authors’ composition
2.2.2 Pre-Combustion Process
In this process, the feedstock is transformed by gasification into a synthesis gas consisting mainly of carbon monoxide (CO), hydrogen (H2) and CO2. The proportion of CO content in

CO2 Capture: Technologies, State of Development and Fields of Use
Wuppertal Institute for Climate, Environment and Energy 33
the synthesis gas is reduced in a shift reactor, creating a gas with a considerably higher CO2 concentration than in the flue gas from conventional power plants. The CO2 can be separat-ed from the gas stream through physical absorption with considerably less energy consump-tion than in post-combustion processes due to the higher CO2 concentration in the syngas. Despite their comparatively high capture efficiency, pre-combustion processes have been a lower priority for R&D recently. This is explained by the fact that the deployment of IGCC power plant technologies has not yet extended beyond individual demonstration plants, which is mainly due to the high investment costs involved. In addition, developing countries are concentrating primarily on conventional and mature combustion processes in the con-struction of new coal-fired power plants.
Current R&D activities in the field of pre-combustion deal primarily with the development of new physical solvents, such as lithium silicate, or alternative processes, such as membrane systems or chemical looping combustion (CLC). The latter uses metal oxides or limestone-based carriers to oxidise the fuel. Direct contact between the fuel and the air supplied for combustion is therefore avoided. The resulting combustion exhaust gases consist mainly of CO2 and water, making it easy to separate the CO2 once the water has been condensed out. CLC is currently being pursued by European market players in particular, such as Alstom and the Swedish Chalmers University.
2.2.3 Oxyfuel Process
In the oxyfuel process, virtually pure oxygen (over 95 per cent) substitutes air for the com-bustion of fuel. In this way, the CO2 concentration in the flue gas can be increased to 80 per cent, enabling CO2 to be captured by simply condensing it out. Oxyfuel processes are re-garded as a promising alternative to post- and pre-combustion processes, but remain at an early stage of development. So far, virtually no reliable economic feasibility studies have been conducted.
The world’s first oxyfuel pilot plant was commissioned in Germany at the Schwarze Pumpe site in the Brandenburg town of Spremberg by Vattenfall Europe in September 2008. The cost of the plant amounts to around EUR 70 million (Vattenfall 2009). In addition, Vattenfall Europe conducted feasibility studies for retrofitting one of six 500 MW generating units by installing two boilers, one equipped with oxyfuel technology and one with post-combustion technology. However, this project was cancelled in late 2012.
A focal point of current R&D work on oxyfuel technology is the exploration of energy-efficient methods for producing the required oxygen. Although cryogenic air separation processes are currently being used for this purpose, they are very energy- and cost-intensive. They com-prise around 33 per cent of the investment costs and 67 per cent of the power demand of an oxyfuel plant (ENCAP 2009). Alternative options for producing oxygen are ceramic mem-brane systems and molecular sieves or the adsorption of oxygen. In the latter process, which is also denoted as ceramic autothermal recovery (CAR), air is fed at high temperatures to a fixed bed vessel with pellets made of the perovskite calcium titanium oxide (Ca TiO3). Oxy-gen is adsorbed and stored at the surface of the perovskite.

CCS global
34 Final Report Part I
2.3 Fields of Use
2.3.1 New Fossil-Fired Power Plants
Power plants are currently being discussed as the prioritised field of use for CCS. The World Energy Outlook 2009 of the International Energy Agency (2009) projects that CCS at power plants could mitigate approximately 1,410 million tonnes of CO2 by 2030, which is equivalent to 10 per cent of the CO2 mitigation required by this time in order to limit the concentration of CO2 in the atmosphere to 450 ppm. This makes CCS at power plants a significant, but not the most important, mitigation option because energy efficiency (7,880 million tonnes) and renewable energies (27,741 million tonnes) contribute much larger values (IEA and OECD 2009).
The IEA estimates the mitigation potential of efficiency increases at power plants at 735 mil-lion tonnes of CO2. In previous years, improvements in thermal efficiency, for example, through increases in steam pressure or temperature, have been the most important measures for mitigating CO2 emissions from fossil-fired power stations. Such adjustments have resulted in successive improvements in the efficiency of power plants. Current designs of power plants fired with lignite or hard coal show that they could achieve efficiencies of 43 and 46 per cent, respectively. Gas-fired combined cycle gas turbine (CCGT) plants are ca-pable of operating at efficiencies of approximately 58 per cent. By 2020, it is estimated that efficiencies will reach 47.5 per cent (lignite-fired plants), 49.5 per cent (hard coal-fired plants) or 60 per cent (CCGT) (Viebahn et al. 2010).
At present, pulverised coal combustion (PCC) plants represent more than 90 per cent of in-stalled coal-fired capacities for power generation worldwide. The coal is ground (pulverised) to a fine powder which is blown with part of the combustion air into the boiler plant. Combus-tion takes place at temperatures ranging from 1,300 to 1,700°C, depending largely on coal rank. Steam is generated, driving a steam generator and a turbine (IEA Clean Coal Centre 2010). The thermal efficiency of PCC plants is mainly a function of steam temperature and pressure, with the former being the more important of the two parameters. Over the tempera-ture range of 500 to 800°C, efficiencies vary almost linearly with steam temperature. Over the last three decades, steam temperatures have increased by about 60°C and are expected to grow by at least another 50°C in the coming 30 years (Graus et al. 2008).
PCC plants are distinguishable by their applied steam pressure and are grouped into three categories: subcritical, supercritical and ultra supercritical. Available definitions of these cat-egories make different assumptions for steam temperature, steam pressure and achievable thermal efficiencies. Below, and in Tab. 2-1, the definitions from MIT (2007), Graus et al. (2008) and Nalbandian (2009) are summarised, reflecting the assumed ranges for each pa-rameter:
• Subcritical: The majority of globally existing PCC plants, especially in developing or emerging economies, are subcritical units. Subcritical operation refers to steam pres-sures below 220 bar and steam temperatures around 535 to 550°C. Thermal efficiencies of subcritical plants vary from 33 to 39 per cent, depending on coal quality, operation, de-sign parameters and location.

CO2 Capture: Technologies, State of Development and Fields of Use
Wuppertal Institute for Climate, Environment and Energy 35
• Supercritical: Supercritical PCC plants first came into operation in the 1960s. Early su-percritical units were operated with steam pressures below 220 bar and temperatures of approximately 540°C. Today, supercritical plants are widely deployed and are highly reli-able. Current state-of-the-art plants use steam pressures ranging from 220 to 250 bar and temperatures from 540 to 580°C. Thermal efficiencies range from 38 to 42 per cent.
Tab. 2-1 Parameters for different categories of pulverised coal combustion technologies
PCC plant type Steam temperature Steam pressure Efficiency
°C bar %
Subcritical 535–550 <220 33–39
Supercritical 540–580 220–250 38–42
Ultra supercritical 565–580 >250 42–47
Source: Various
• Ultra supercritical: In order to achieve further efficiency improvements, the power industry continues to move towards higher steam pressures and temperatures. Operating steam cycle conditions beyond temperatures of 565 to 580°C and pressures higher than 250 bar qualify as ultra supercritical, increasing efficiency to between 42 and 47 per cent. One of the first ultra supercritical units was the hard coal-fired unit 3 at Nordjyllandsvaer-ket in Denmark, using steam at a pressure of 290 bar and a temperature of 580°C. The plant has an operating efficiency of 47 per cent. In Germany, RWE is constructing BoA plants 2 and 3 (“Braunkohlekraftwerk mit optimierter Anlagentechnik”) in Neurath (North Rhine-Westphalia, NRW) with gross capacities of 1,100 MW and efficiencies of more than 43 per cent. BoA1 in Niederaußem (NRW), commissioned in 2003, has a gross ca-pacity of 3,801 MW and shall also achieve an efficiency level of 43 per cent.
• In Europe and Japan, some ultra supercritical plants applying steam at 320 bar and 600 to 610°C are in operation. Current R&D projects aim to raise the steam temperature be-yond 700°C, thereby achieving efficiencies in the range of 52 to 55 per cent. However, these plant designs are not expected before 2010 to 2015.
Due to limitations related to thermodynamic process parameters and boiler materials, the potential for further efficiency improvements of power plants is limited. Therefore, it is widely recognised that process optimisations are not sufficient to meet ambitious long-term CO2 mitigation targets. This insight has moved CO2 capture and storage technologies to the top of the international climate policy agenda in recent years. However, as mentioned in the previ-ous section, CCS processes are still at the development and demonstration stage. An in-creasing number of voices do not expect the large-scale application of the integrated CCS process chain before 2025 or 2030 (Greenpeace 2008; MIT 2007; ZEP 2008). Fig. 2-3 shows a timeline of each step of the CCS process chain. The greatest level of uncertainty currently surrounds the storage stage, as estimates of international storage capacities vary significantly. Detailed assessments of individual storage formations are needed in order to quantify their actual capacity.

CCS global
36 Final Report Part I
Fig. 2-3 Temporal availability of CCS Source: Authors’ illustration
The timeframe for the availability of CCS strongly affects the technology’s mitigation poten-tial, as it needs to coincide with the demise of a country’s existing coal-fired power plants. In many countries, the existing power plant fleet will reach the end of its operational life before the earliest likelihood of CCS becoming available in around 2020 and, therefore, will be re-placed by plants without CCS. This means that it is essential that new power plants are de-signed to be capture-ready in order to enable retrofits of CO2 capture equipment (see section 2.3.2). This is also the case in developing countries such as the China – India – South Africa (CISA) nations used in this study, which have rapid growth rates in their fossil-fired power plant fleets. Fig. 2-4 shows the ages of existing coal-fired power plants globally. More than 500 GW of installed coal-fired generating capacities are less than ten (about 300 GW) or 20 years old (more than 200 GW). Assuming an average lifespan of 40 years, these plants will operate for another 20 or 30 years. They are not designed as capture-ready and, therefore, are rather unlikely to be retrofitted with CCS.
Capturing CO2 at power plants causes substantial losses in the electrical efficiency of fossil-fired power plants. Amongst the different capture routes, post-combustion incurs the highest efficiency penalties because of the high energy intensity resulting from low CO2 concentra-tions (3 to 15 per cent) and the strong bonds between the solvent and the CO2. Fuel con-sumption per kWh of a new supercritical pulverised coal power plant increases by 24 to 40 per cent. Natural gas-based units and IGCC plants applying pre-combustion systems indi-cate lower but still significant energy penalties of 11 to 22 per cent or 14 to 25 per cent, re-spectively. The increased fuel requirement results in an increase in most other environmental emissions generated per kWh in comparison to new state-of-the-art plants without CO2 cap-ture (Viebahn et al. 2010). In addition, CO2 capture leads to a rise in the amount of solid waste at coal-fired plants and an increased consumption of chemicals, such as ammonia and limestone used by pulverised coal plants for nitrogen oxide and sulphur emissions control (IPCC 2005).

CO2 Capture: Technologies, State of Development and Fields of Use
Wuppertal Institute for Climate, Environment and Energy 37
Fig. 2-4 Size, age and operating efficiency of coal-fired power plants installed worldwide
Source: Bhattacharya (2009)
Due to their energy intensity, CO2 capture processes are the most costly component of the CCS process chain, representing approximately 63 per cent of the overall CCS costs (Fischedick et al. 2008). Post-combustion processes increase the costs of electricity genera-tion of a coal-fired power plant by approximately 40 to 70 per cent. Power generation costs of an IGCC plant with pre-combustion capture grow by about 20 to 55 per cent. This is mainly due to the lower CO2 concentrations in the gas stream and the lower energy intensity of pre-combustion capture technologies (IPCC 2005). However, estimates of CO2 capture costs suggest great uncertainty as plant investment costs have escalated in recent years due to the high costs of resources such as steel. Plant cost indices report cost increases of 35 to 100 per cent (Davison and Thambimuthu 2009). Furthermore, prices of fossil resources such as coal or natural gas have been highly volatile in recent years due to the unpredictable economy.
2.3.2 Retrofitting of CO2 Capture at Operating Fossil-Fired Power Plants
Retrofitting of operating fossil-fired power plants occurs when they are supplemented at a later date by a further known component, or one that is yet to be developed, in order to fulfil an additional task without seriously restricting the existing function of the plant. Power plants which “can include CO2 capture when the necessary regulatory or economic drivers are in place” (IEAGHG 2007) can be denoted as capture-ready plants. Capture-ready plants will avoid the risks of stranded assets or carbon lock-in. Plants that are not capture-ready either incur higher costs and efficiency losses when retrofitted with CO2 capture technologies or retrofitting cannot be carried out due to a lack of space at the plant site.
CCS global
38 Final Report Part I
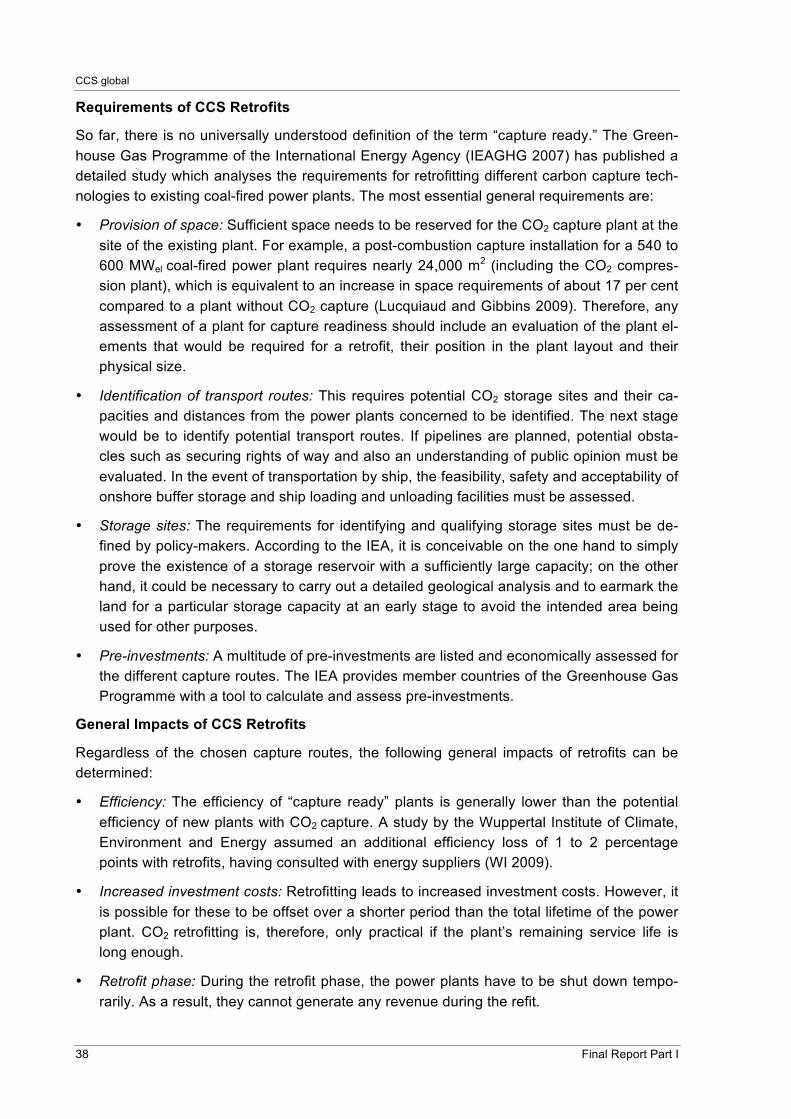
Requirements of CCS Retrofits
So far, there is no universally understood definition of the term “capture ready.” The Green-house Gas Programme of the International Energy Agency (IEAGHG 2007) has published a detailed study which analyses the requirements for retrofitting different carbon capture tech-nologies to existing coal-fired power plants. The most essential general requirements are:
• Provision of space: Sufficient space needs to be reserved for the CO2 capture plant at the site of the existing plant. For example, a post-combustion capture installation for a 540 to 600 MWel coal-fired power plant requires nearly 24,000 m2 (including the CO2 compres-sion plant), which is equivalent to an increase in space requirements of about 17 per cent compared to a plant without CO2 capture (Lucquiaud and Gibbins 2009). Therefore, any assessment of a plant for capture readiness should include an evaluation of the plant el-ements that would be required for a retrofit, their position in the plant layout and their physical size.
• Identification of transport routes: This requires potential CO2 storage sites and their ca-pacities and distances from the power plants concerned to be identified. The next stage would be to identify potential transport routes. If pipelines are planned, potential obsta-cles such as securing rights of way and also an understanding of public opinion must be evaluated. In the event of transportation by ship, the feasibility, safety and acceptability of onshore buffer storage and ship loading and unloading facilities must be assessed.
• Storage sites: The requirements for identifying and qualifying storage sites must be de-fined by policy-makers. According to the IEA, it is conceivable on the one hand to simply prove the existence of a storage reservoir with a sufficiently large capacity; on the other hand, it could be necessary to carry out a detailed geological analysis and to earmark the land for a particular storage capacity at an early stage to avoid the intended area being used for other purposes.
• Pre-investments: A multitude of pre-investments are listed and economically assessed for the different capture routes. The IEA provides member countries of the Greenhouse Gas Programme with a tool to calculate and assess pre-investments.
General Impacts of CCS Retrofits
Regardless of the chosen capture routes, the following general impacts of retrofits can be determined:
• Efficiency: The efficiency of “capture ready” plants is generally lower than the potential efficiency of new plants with CO2 capture. A study by the Wuppertal Institute of Climate, Environment and Energy assumed an additional efficiency loss of 1 to 2 percentage points with retrofits, having consulted with energy suppliers (WI 2009).
• Increased investment costs: Retrofitting leads to increased investment costs. However, it is possible for these to be offset over a shorter period than the total lifetime of the power plant. CO2 retrofitting is, therefore, only practical if the plant’s remaining service life is long enough.
• Retrofit phase: During the retrofit phase, the power plants have to be shut down tempo-rarily. As a result, they cannot generate any revenue during the refit.

CO2 Capture: Technologies, State of Development and Fields of Use
Wuppertal Institute for Climate, Environment and Energy 39
• Additional space requirements: Space has to be available not only on the premises of the power plant, but also within the plant to be able to integrate the CO2 capture plants or to make any necessary alterations. Estimates assume 50 per cent more space is required for natural gas combined cycle power plants and up to 200 per cent for conventional coal-fired power plants (Fischedick et al. 2006).
Technical Requirements of CO2 Capture Retrofits
Retrofitting of post-combustion, pre-combustion and oxyfuel CO2 capture processes involves different requirements which are summarised in Tab. 2-2.
Post-combustion capture technologies are best suited for retrofits as they are more ad-vanced than other capture technology options. Additional aggregates needed for CO2 cap-ture are units for CO2 scrubbing and CO2 compression. Furthermore, the steam cycle needs to be made “capture friendly” in order to be able to supply any steam required for the thermal regeneration of the capture solvent.
Tab. 2-2 Measures to be carried out for various CO2 capture processes
Process Measures
Post-combustion
Installation of a CO2 gas scrubber Installation of a CO2 liquefaction plant Optimisation of the steam cycle Connections for heat extraction to regenerate the solvent Optimisation of the cooling system Provisions for heat recovery in CO2 capture and liquefaction Plants to remove the liquefied CO2 Optimisation of the flue gas desulphurisation plant to minimise the SO2 content in the flue gas Extension and addition of balance of plant systems Installation of a CO2 pipeline system for CO2 transportation Provisions for increased auxiliary power demand Expansion of cooling capacity
Pre-combustion
Installation of a natural gas reformer Installation of a water gas shift reactor Additional water/steam injection for the water gas shift reaction Installation of a CO2 gas scrubber before the gas turbine combustor Installation of gas turbines suited for combusting hydrogen-rich gases Installation of a CO2 liquefaction plant Installation of a CO2 pipeline system for CO2 transportation
Oxyfuel Installation of an air separation plant Installation of a CO2 liquefaction plant Expansion of the planned auxiliary power generation and distribution system Increase of the cooling capacity to enable the water to be condensed out of the exhaust gas Installation of a flue gas circulation system and a flue gas dryer Installation of a CO2 pipeline system for CO2 transportation
Source: Author’s own composition
The significant amount of heat (around 110 to 120°C) required for solvent regeneration is most effectively provided by condensing steam extracted from the power cycle (Lucquiaud et

CCS global
40 Final Report Part I
al. 2009). Nearly 50 per cent of the steam leaving the intermediate pressure (IP) turbine is needed for this purpose. Another essential requirement for pre-combustion capture retrofit-ting is the modification of the flue gas desulphurisation (FGD) unit, enabling it to achieve high levels of sulphur removal to meet the high level of gas purity required for the amine scrub-bing system. In order to adjust the power plant for the additional requirements of the capture equipment, some extension and addition of the balance of plant systems is needed.
When retrofitting an integrated gasification combined cycle (IGCC) plant with pre-combustion capture technology, several new plant components have to be added and a number of exist-ing energy systems need to be reconfigured. Coal gasification produces a syngas consisting of carbon monoxide (CO), carbon dioxide (CO2) and hydrogen (H2). If coal is oxidised with air instead of pure oxygen, the synthesis gas is also rich in nitrogen oxides (NOx). Pre-combustion CO2 capture processes call for a highly concentrated CO2 stream, requiring a water gas shift reactor which reduces the share of CO in the syngas whilst increasing the proportions of H2 and CO2. The reaction requires additional water/steam injection into the process, which may influence the overall thermodynamics. If the plant uses a quench gasifi-er, however, no further injection is needed (IEAGHG 2007).
The recovery of CO2 from the syngas requires existing equipment for acid gas removal to be modified as pre-combustion CO2 capture is either conducted via heating or by a reduction of pressure. The CO2 capture unit has to be linked with a CO2 compression plant, which needs to be connected to CO2 transport facilities.
The CO2-free syngas which is introduced to the gas turbine has a lower calorific value than the syngas in its original composition. As a consequence, the gas turbine either has to be derated or the gasifier needs to be expanded in order to ensure the required flow of fuel to the gas turbine. Furthermore, the modified syngas consists almost exclusively of hydrogen, which brings significant changes to the combustion properties of the gas (particularly higher flame temperatures and higher flame speed). The gas turbines need to be adjusted to ac-commodate these requirements. However, turbine designs capable of combusting hydrogen-rich gases are still at the development stage. Leading technology providers, power utility companies and research institutes, such as Siemens, E.On and RWTH Aachen University, are currently collaborating in the four-year project “Low Emission Gas Turbine Technology for Hydrogen-Rich Syngas” under the 7th EU Framework Programme.
Besides gas turbine modifications, steam flows and requirements within the process will be significantly changed, requiring adjustments of the heat recovery steam generator (HRSG) and the steam turbine.
In comparison to the pre-combustion capture option, the retrofitting of oxyfuel technologies requires fewer plant modifications as the steam generator and steam cycle for air-firing and oxyfuel-firing do not differ (Tigges et al. 2008). The steam turbine generator and auxiliaries are the same as those of a conventional air-fired pulverised coal power plant.
Additional requirements for oxy-fuelling are an air separation unit and a CO2 compression plant. For both plant types, sufficient space at the plant site needs to be reserved. Both air separation and CO2 compression units will significantly increase the internal electricity con-sumption of the power plant and, therefore, require additional capacity from the auxiliary power distribution system of a power station. Furthermore, oxygen production and CO2 com-

CO2 Capture: Technologies, State of Development and Fields of Use
Wuppertal Institute for Climate, Environment and Energy 41
pression lead to an overall increase in the required cooling capacity by 15 to 20 per cent, necessitating further modifications in the plant design. The CO2 compression unit needs to be linked to a pipeline system for transferring the captured CO2 to the storage site. The pipe-line material needs to be resistant to corrosion from oxygen or sulphur dioxide (SO2) resi-dues in the CO2.
Another major distinguishing feature of an oxyfuel plant compared to a conventional air-fired plant is its two-stage flue gas circulation system. Approximately two thirds of the flue gas needs to be moved back to the boiler plant in two streams. Recirculation of flue gas is nec-essary to provide a sufficient mass flow of gas for cooling the flame and to ensure sufficient heat capacity and convective heat transfer in the boiler (Tigges et al. 2008). The first flue gas stream serves as the transport medium for the pulverised fuel; the second stream is recycled to burners and the furnace. Before the flue gas can be recycled, it needs to be dried so that a flue gas dryer can be added.
2.3.3 Industrial Processes
There is a strong focus on the energy sector within the current debate on CCS. However, beyond this key sector, industries with large point sources of CO2 are important potential fields of use for CO2 capture technologies. In 2006, direct CO2 emissions (encompassing fuel combustion and process-related emissions from within the industry sector) totalled 7.2 Gt of indirect CO2 emissions, reflecting CO2 discharges from electricity produced for industry which totalled 3.4 Gt (IEA 2009a). Fig. 2-5 and Fig. 2-6 illustrate the distribution of direct industrial emissions globally among sectors or regions/countries respectively. Iron and steel, cement and chemicals represent the largest sectoral shares of direct industrial CO2 emissions; by region, China (34 per cent) is clearly the largest contributor of emissions. India’s emissions are equivalent to about 5 per cent of direct industrial CO2 emissions globally; South Africa is not among the major emitting countries.
Fig. 2-5 Direct CO2 emissions in industry by sector
Source: IEA (2009a)

CCS global
42 Final Report Part I
Fig. 2-6 Direct CO2 emissions in industry by region/country
Source: IEA (2009a)
In the sections below, technical possibilities and the potential for applying CO2 capture in the most CO2-intensive industries, as well as early low-cost options, are presented.
2.3.3.1 Steel and Iron Industry
The global steel industry has shown unprecedented growth in recent years, reaching an overall production volume of 1,344 Mt in 2007. Whilst production was largely steady between 1975 and 2000, it escalated by 58 per cent between 2000 and 2007. China’s rapid economic development was the main driver of this trend, with Chinese steel production representing about 36 per cent of the global production volume (IEA 2009a). The iron and steel industry is the world’s largest single industrial source of CO2. In 2006, its direct CO2 discharge totalled 2.2 Gt. The International Energy Agency (IEA) estimates the industry’s annual CO2 saving potential at approximately 20 per cent if the best available technologies were applied, tapping the technical potential for energy efficiency improvements. The replacement of small-scale blast furnaces is the single most important mitigation opportunity. Better use of residual gas-es and waste heat is also important (IEA 2009a). However, due to the limited overall efficien-cy potential, additional mitigation technologies such as CCS might be needed to substantially reduce the industry’s environmental footprint.
As iron and steel can be produced using very different processes, the industry has a complex technical structure. Blast furnaces have remained the dominant technology route, despite a significant growth in gas- and coal-based direct reduced iron (DRI). Blast furnaces are often part of integrated steel plants, which comprise several interconnected production units such as coke ovens, sinter plants and palletising plants. Within such an integrated production complex, blast furnaces generate the largest stream of CO2 and therefore offer the most economical opportunity for CO2 capture (Rootzén et al. 2009).

CO2 Capture: Technologies, State of Development and Fields of Use
Wuppertal Institute for Climate, Environment and Energy 43
The IEA (2008) identifies two approaches for capturing CO2 from coal-fired blast furnaces:
• Oxy-fuelling to generate a pure CO2 off-gas: Instead of enriched air, blast furnaces use oxygen. In combination with recycled top gases, the emission stream would indicate a sufficiently high CO2 concentration to capture CO2 with physical absorbents. Physical ab-sorption is significantly less energy intensive than chemical absorption. However, oxy-gen-fired blast furnaces are not yet technically proven.
• Chemical absorption: In general, post-combustion chemical absorption would be a feasi-ble method for capturing CO2 from blast furnaces. However, it would require substantial investment as the waste heat generated during iron and steel production is not sufficient to cover the heat demand of chemical absorption processes. Only about 50 per cent of the necessary heat could be recovered from integrated iron and steel plants. The remain-ing 50 per cent would have to be supplied by a separate combined heat and power (CHP) plant. Chemical absorption using waste heat and blast furnace gas reforming is currently being investigated in Japan, Korea and China.
R&D initiatives for reducing the carbon intensity of the iron and steel industry have been launched in Europe, North America, Japan, Korea, Australia and Brazil. The European Union (EU) is funding the Ultra-Low CO2 Steelmaking Programme (ULCOS). The project is being conducted through a consortium of 48 partners including all major European steel compa-nies, energy and engineering partners, research institutes and universities. ULCOS is aiming to reduce the specific CO2 emissions of a modern blast furnace by 50 per cent. CO2 capture was identified as one possible mitigation path for achieving this purpose.
Top gas recycling-blast furnaces (TGR-BF) are a promising technology prospect for CO2 capture. In a TGR-BF, CO2 in the top gas of the blast furnace is removed so that the useful gas components – CO and H2 – can be recycled back into the furnace. This would reduce the amount of coke needed in the furnace. Additionally, oxygen could be injected into the furnace instead of air; unwanted nitrogen (N2) would be removed, facilitating CO2 capture (Zuo and Hirsch 2008). The IPCC estimates that 70 per cent of the CO2 emitted from an in-tegrated steel plant could be recovered if TGR-BF with CO2 capture were to be introduced (IPCC 2005).
In 2007, the Swedish mining company LKAB tested different CCS configurations at an exper-imental top gas-recycling blast furnace (see Fig. 2-7). In combination with carbon capture, the trials achieved a total CO2 mitigation of 76 per cent (Zuo and Hirsch 2008). Experts esti-mate that carbon capture at blast furnaces in combination with transportation and storage could cost approximately USD 40 to 50/t of CO2 (IEA 2008). CCS within gas-based direct reduced iron (DRI) would be significantly less costly, leading to abatement costs of USD 20 to 25/t of CO2. However, as DRI units are concentrated in relatively few countries and are on a rather small scale, the discussion focuses on CO2 capture at blast furnaces.

CCS global
44 Final Report Part I
Fig. 2-7 LKAB’s top gas-recycling blast furnace with CO2 removal plant (VPSA)
Source: Zuo and Hirsch (2008)
2.3.3.2 Cement Industry
The cement industry is currently responsible for 1.9 Gt, or 26 per cent, of the world’s total direct industrial CO2 emissions. Around 0.8 Gt are emitted from fuel combustion, whilst 1.1 Gt are process emissions (IEA 2009a). Global cement production has experienced a steady growth over many years, reaching about 2.5 Gt in 2006. The average growth rate was 5.5 per cent per year during the period 1990 to 2006, and the average rate has accelerated to 8.7 per cent annually since 2002 (IEA 2008). The main growth has taken place in China, which accounts for nearly 50 per cent of the world’s cement production. India is the second largest producer, but representing only 6 per cent of the global cement production (IEA 2009a).
Cement is produced from a feedstock of limestone, clay and sand, providing lime, silica, alumina and iron. In the first step, the raw material is ground and homogenised. Afterwards, the raw materials are mixed and delivered to a clinker kiln. In modern cement plants, precal-ciners are used to preheat the feedstock and calcine the raw material. Inside the kiln, the raw material is gradually heated and burned at a peak temperature of approximately 1,450°C. Calcination takes place at around 900°C, and CO2 is released from calcium carbonate. As the temperature rises, calcium oxide agglomerates with silica, alumina and ferrous oxide, forming pellets called clinker (Rootzén et al. 2009). The clinker is ground and mixed with ad-ditives, such as gypsum and other minerals, to be converted into cement.
Clinker production is by far the most energy-intensive step of cement production, accounting for more than 70 per cent of the total energy consumed (Rootzén et al. 2009). As a conse-quence, an overwhelming percentage of the direct emissions from cement production derive

CO2 Capture: Technologies, State of Development and Fields of Use
Wuppertal Institute for Climate, Environment and Energy 45
from clinker burning. Two types of clinker kilns – wet and dry – can be distinguished, depend-ing on the water content of the raw material feedstock. Water evaporation makes the wet process more energy intensive than the dry process which, therefore, dominates modern cement production. Whilst wet cement kiln technologies consume between 5.9 and 6.7 GJ per tonne of clinker, the energy consumption of dry processes ranges from 2.9 to 4.6 GJ per tonne of clinker (IEA 2009a). It seems unlikely that the fuel efficiency of current dry kiln de-signs can be raised to much higher levels. Hence, additional mitigation measures are needed to substantially reduce direct emissions of the cement industry (IEA 2009a).
Fuel is fed to two devices in modern cement plants: the precalciner and the clinker kiln. The resulting flue gas has a relatively high CO2 concentration of about 25 per cent compared to 14 per cent for a coal-fired power plant. CO2 can be captured both at the precalciner and the clinker kiln. Similar to a power plant, post-combustion capture would not affect the core of the cement production process but recover CO2 after the combustion process. A CO2 capture plant, a compressor to increase CO2 pressure for transport via a pipeline, a plant to provide steam for the regeneration of the CO2 as well as equipment for flue gas desulphurisation and scrubbing of NOx would have to be added. According to the IEA Greenhouse Gas Pro-gramme, post-combustion capture processes could recover about 85 per cent of the CO2 produced in cement plants. 95 per cent of capture is considered to be feasible without signifi-cantly affecting the cost per tonne of captured CO2. Using chemical absorption systems, the costs of CCS are estimated at USD 75 to 100 per tonne of captured CO2, increasing capital costs by 40 to 90 per cent (IEAGHG 2008).
Oxy-fuelling can be applied both to the precalciner and the clinker kiln, but if applied only to the precalciner, the impact on the clinkerisation process could be minimised. However, pro-cess redesign might be needed, involving substantial capital costs. Oxy-combustion in the precalciner has the potential of avoiding 61 per cent of the CO2 produced at the cement plant. However, net CO2 mitigation would be only 52 per cent as oxy-fuelling causes a signif-icant increase in auxiliary power consumption for O2 production, CO2 compression and purifi-cation. If oxy-combustion was applied to both the precalciner and the cement kiln, more than 90 per cent of the CO2 could be avoided. Generating costs of USD 40 per tonne of CO2 avoided, oxy-fuelling is much less expensive than post-combustion CO2 capture (IEA 2008).
2.3.3.3 Refineries
The refining sector accounts for about 4 per cent of global CO2 emissions, totalling nearly 1 Gt per year (Gale 2005). Refineries are different from other industrial large-point CO2 sources in that they include multiple emission sources, often dispersed over a large area, as they involve several different process operations. The most important processes are distilla-tion, reforming, hydrogenation and cracking.
Potential CO2 mitigation options include the construction of co-generation plants for covering internal heat and power demand, the reduction of flaring, the use of alternative energy sources and CO2 capture and storage (Van Straelen et al. 2010). CO2 capture can be ap-plied to process heaters and steam boilers, which are the two largest single emission sources within refinery plants. Process heaters alone account for 44 per cent of the CO2 emissions from fluid catalytic cracking (FCC) refineries and 55 per cent of the emissions from hydrocracking refineries (IEA 2008). The total mitigation potential of applying CCS at process

CCS global
46 Final Report Part I
heaters and steam boilers is 65 per cent of a refinery’s overall emissions (Rootzén et al. 2009). Furthermore, CO2 may be captured at internal co-generation plants. CO2 can be ei-ther captured through chemical absorption (post-combustion capture) or by designing heat-ers and boilers for oxyfuel operation. Applying post-combustion capture to a refinery heater is highly energy intensive, also in comparison to fossil-fired power plants, as the flue gas needs to be pushed through the network and due to the pressure imposed by the packed column absorbers and the flue gas pre-treatment to reduce NOx and SO2 concentrations.
A study for a UK refinery and petrochemical complex concludes that post-combustion cap-ture requires 6.2 GJ per tonne of captured CO2 and investment costs of USD 238 per tonne of CO2. Fig. 2-8 illustrates the cost structure for a refinery complex with CO2 capture
(Simmonds et al. 2003).
Fig. 2-8 Investment cost structure for a refinery complex with CO2 capture
Source: Based on Simmonds et al. (2003)
The overall cost per tonne of CO2 avoided is estimated at USD 50 to 60 (Simmonds et al. 2003), based on relatively low costs of energy, steel and engineering services. A later study by van Straelen et al. (2010) estimates the costs of capturing CO2 from different process steps through post-combustion capture at EUR 90 to 120 per tonne of captured CO2. If CO2 was captured at numerous smaller sources, for example small boilers or small furnaces, which are scattered over the refinery site, then costs would be higher as many kilometres of additional ducting would be required to collect the CO2.
Another study focuses on oxy-fuelling for a refinery power station boiler, using heavy oil and gas (Wilkinson et al. 2001). Electricity requirements for the air separation unit and CO2 cap-ture amount to 1.5 GJ per tonne of CO2. Investment costs would be around USD 50 per tonne of CO2.

CO2 Capture: Technologies, State of Development and Fields of Use
Wuppertal Institute for Climate, Environment and Energy 47
2.3.3.4 Chemical and Petrochemical Industry
The chemical industry accounts for approximately 17 per cent of direct industrial CO2 emis-sions. It is the largest industrial energy user, accounting for approximately 10 per cent of total worldwide final energy demand. The bulk of the industry’s energy demand is provided by three groups of products including petrochemicals (steam cracking of naphtha, aromatic pro-cesses, production of methanol and olefins), inorganic chemicals (carbon black, soda ash, industrial gases, chlorine) and fertilisers (ammonia production) (IEA 2008).
In the petrochemical industry, most carbon is stored in synthetic organic products. This car-bon is only available for capture when these products are combusted, either in waste incin-erators or for energy recovery in other products. The most important sources of CO2 in the petrochemical industry are steam boilers and an increasing number of CHP plants. Technol-ogies being applied for CO2 capture at large-scale CHP plants are similar to CO2 capture pro-cesses for other power plants. For steam cracking with high-temperature boilers, the only feasible option is chemical absorption, since the residual gas is a mixture of methane and hydrogen and has a low CO2 concentration per unit of energy used.
High-purity CO2 is generated from the production of ethylene oxide from ethylene and the production of ammonia. The latter constitutes an early opportunity for industrial CCS as CO2
capture is an integrated process step of ammonia production. CO2 capture is separated from hydrogen at an early stage by using solvent absorption. A significant share of the recovered CO2 is used for the production of urea. The remaining CO2 is relatively low cost CCS as only CO2 compression, transportation and storage are required as additional steps.
2.3.4 Fuel Production
2.3.4.1 Coal to Liquids
The production of liquid fuels (for example, diesel or kerosene) from coal through so-called coal-to-liquid (CTL) plants has gained new prominence in recent years. Countries with vast coal reserves, such as the United States, China or India, consider an extension of coal utili-sation to fuel production as a way to alleviate energy security concerns. Distinction can be made between indirect and direct coal liquefaction processes. In indirect CTL processes, coal is gasified into synthesis gas consisting of carbon monoxide, hydrogen and various im-purities, such as sulphur compounds or CO2. The syngas is then liquefied via Fischer-Tropsch synthesis involving iron or cobalt catalysts. Fischer-Tropsch synthesis generates a broad range of hydrocarbons, including high-quality synthetic diesel or jet fuels. Globally, about 24 indirect CTL facilities were at the planning stage in mid 2009. The total initial capac-ity of all planned indirect coal liquefaction plants added up to 747,900 barrels per day, which was equivalent to approximately 72 per cent of the total 2006 gasoline and diesel demand of Germany’s transport sector (Vallentin 2009).
Direct coal liquefaction processes convert coal into a slurry and, by applying high tempera-tures and pressure, liquefy the feedstock in either a one- or two-stage process. Subsequent-ly, gaseous products are separated and liquid hydrocarbons are distilled to light, middle and heavy oils. Direct coal liquefaction receives less attention than the indirect process route, with China being the only country seriously considering the commercialisation of this tech-

CCS global
48 Final Report Part I
nology. An important reason for the international preference of indirect coal liquefaction is its greater technical maturity. Furthermore, indirect CTL processes imply synergies with carbon capture technologies. CTL technologies are highly carbon intensive; hence, their deployment in a carbon-constrained environment strongly depends on the feasibility and economic viabil-ity of CCS.
Before being injected into the Fischer-Tropsch plant, the synthesis gas needs to be essen-tially free of impurities such as sulphur compounds or CO2 as they can poison the highly sensitive Fischer-Tropsch catalysts. The impurities accumulate on the surface of the cata-lysts and reduce their activity. Thus, the removal of CO2 is desirable to maximise the synthe-sis of coal-derived liquids and to extend the lifetime of the catalyst. The Fischer-Tropsch pro-cess requires a CO2 capture rate of about 90 per cent. Hence, CO2 capture is an integrated element of indirect coal liquefaction processes and does not cause additional costs. Howev-er, direct coal liquefaction offers no direct opportunity for carbon capture.
Fig. 2-9 Well-to-tank emissions of indirect coal liquefaction (with and without CCS) in comparison
to conventional diesel Source: Based on CONCAWE et al. (2007)
Without CCS, the well-to-tank (WTT) emissions of indirect CTL plants are about nine times as high as those of conventional diesel. Nearly 80 per cent of the emissions from indirect coal liquefaction are caused by coal transformation, including a credit for co-producing elec-tricity in an IGCC process from heat, which is a by-product of indirect coal liquefaction. Ex-cluding the IGCC credit, the CTL’s WTT emissions would be eleven times as high as the WTT cycle of conventional diesel. Applying CCS may significantly reduce the WTT emissions of indirect coal liquefaction, but even with a 90 per cent capture rate, coal-derived diesel re-mains significantly more GHG-intensive than petroleum-based diesel (Fig. 2-9).
2.3.4.2 CCS and Biomass
CCS in combination with biomass-fired plants (bio-energy with carbon capture and stor-age/BECCS) has emerged as a new topic in the international CCS debate. This option is being considered, especially with regard to low carbon stabilisation scenarios, as biomass

CO2 Capture: Technologies, State of Development and Fields of Use
Wuppertal Institute for Climate, Environment and Energy 49
CCS plants would be capable of producing negative net CO2 emissions and, therefore, func-tion as a CO2 sink. Bellona, a Norwegian NGO with a strong focus on CCS, projects that the share of “carbon negative energy” will reach 18 per cent of the overall reduction targets to be fulfilled by 2050 (Bellona Foundation 2008). In recent scenarios, BECCS has been identified as being critical to achieving a greenhouse gas concentration of 400 ppm CO2 equivalent. The costs of BECCS are strongly determined by the international biomass potential (Bauer et al. 2009; Edenhofer et al. 2010; Knopf et al. 2009).
BECCS can be applied in different sectors and plant configurations (biomass-only plants or co-firing with coal). CCS could be added to plants for the production of biofuels, such as eth-anol (fermentation), methanol or Fischer-Tropsch synfuels (both via gasification), or power plants, including combustion or gasification-based units. In ethanol plants, CO2 can be most easily captured from the fermentation process. The CO2 produced during fermentation is rather pure and it would be relatively easy and inexpensive to capture the gas. Afterwards, the water needs to be removed and CO2 has to be compressed to generate pressure. Ac-cording to Lindfeldt et al. (2009), the amount of CO2 captured and stored after fermentation totals 12 tonnes of CO2 per TJ of biomass input if the efficiency of the ethanol production process is 33 per cent. Biomass production and transportation cause 3 tonnes of CO2 per TJ of biomass, and distribution of the produced ethanol leads to 0.4 tonnes of CO2 per TJ of biomass input. Consequently, each TJ of biomass that is used for ethanol production with low efficiency results in negative carbon dioxide emissions of 8.6 tonnes of CO2 (Lindfeldt and Westermark 2009).
Co-firing of biomass and coal in combination with CCS can be used for electricity generation, fuel production (for example, Fischer-Tropsch synfuels) or the co-generation of several prod-ucts. However, co-firing brings with it several technical challenges mainly due to the feed-stock features of biomass. On the one hand, biomass contains significantly higher shares of volatile matter and has a higher reactivity than coal, reducing the amount of oxygen/air needed for gasification. Biomass reduces the production of undesirable by-products, such as ash, sulphur compounds or tar, which require costly cleaning procedures. On the other hand, the high moisture content and low heating value of biomass limits the range of compatible gasifier designs and coal ranks. Low-quality coal, such as lignite with its high moisture con-tent, is not suited for co-firing operations with biomass (Vallentin 2009). Furthermore, the lower energy density of biomass causes a drop of gasifier efficiency as the combustion frac-tion rises in comparison to coal. The higher degree of combustion also affects the syngas composition and the CO2 content in the syngas (Meerman et al. 2009).
The IEA (IEAGHG 2009a) has presented a detailed comparison of the costs of electricity generation of different types of 500 MWel coal-fired power plants with 10 per cent biomass co-firing both with and without CO2 capture. The plant types considered in this comparison are pulverised coal units and different fluidised bed power plants (circulating fluidised bed/CFB vs. bubbling fluidised bed/BFB). Furthermore, the study compares the electricity generation costs of different plant capacities (250 MWel versus 75 MWel) and plants which are fully biomass-fired or co-firing.
Fig. 2-10 shows the electricity generation costs of the aforementioned plant configurations with and without CO2 capture. In general, it becomes clear that the generation costs of the 100 per cent biomass-fired facilities are more than twice as high as the generation costs of

CCS global
50 Final Report Part I
coal-fired power plants with biomass co-firing. This is mainly due to the high costs of the bi-omass feedstock, which is approximately three times more expensive than the coal in terms of energy. In all cases, adding CO2 capture technologies substantially increases electricity generation costs. For the co-firing plants, costs grow by 54 to 58 per cent; electricity generat-ing costs of the considered biomass-fired plants grow by 80 to 84 per cent.
Fig. 2-10 Electricity generation costs of co-firing and fully biomass-fired power plants both with and
without CCS
Source: IEA GHG (2009a)

CO2 Transport: Technical, Financial and Infrastructural Challenges
Wuppertal Institute for Climate, Environment and Energy 51
3 CO2 Transport: Technical, Financial and Infrastructural Chal-lenges
3.1 Introduction
This section describes the journey between the CO2 capture process and the potential injec-tion sites, either for CO2 enhanced oil recovery (EOR) or for geological sequestration. Costs and the amount of CO2 transported per year increase by distance, thus short routes and an intelligent infrastructure are most favourable.
In section 3.2, the technical aspects of the different means of transport are presented as well as financial and infrastructural issues. Examples of existing CO2 pipelines are given in sec-tion 3.3. The following section describes worldwide transport studies and models for CO2 (section 3.4) to show how a transport system for CO2 could be implemented. The final sec-tion, 3.5, examines risks and uncertainties associated with the possible transport schemes.
3.2 General Description of CO2 Transport Issues
To conduct successful CCS projects, the captured CO2 has to be transferred from the emis-sion source to potential sinks. Transport is possible both onshore and offshore through pipe-lines; onshore by truck or train or offshore by ship. In order to be transported, the green-house gas is compressed to a supercritical fluid (>8 MPa in pipelines) or a liquid (typically at a low pressure of 0.7 MPa to 2 MPa). In this section, these different transport possibilities are described and the advantages and disadvantages of each are assessed. In each section, a differentiation is made between transport capacity, costs and environmental impacts. The underlying problem with all transport options is that they require energy, which causes addi-tional emissions such as CO2, SOx or NOx.
3.2.1 Truck and Train Transport
A possible way to transfer CO2 onshore without constructing a pipeline would be by truck or freight train.
Transport Capacity
The amount of CO2 that can be transported via truck or train is very limited compared to a continuous pipeline. A container on a truck can be filled with 20 tonnes of CO2 (Coleman 2009), whereas an entire train could be loaded with 1,300 to 3,000 tonnes of CO2 (Fischedick et al. 2008). Both methods are only suitable for small-scale applications, for ex-ample for demonstration or pilot plants or during the construction phase of a pipeline system. One example is the CO2Sink project in Ketzin, Germany, where trucks deliver pure CO2 for storage (Möller 2009).
Costs
The costs per km of transport are very high for truck and train transport. This is mainly due to the very low transport capacity (compare Tab. 3-2).

CCS global
52 Final Report Part I
Environmental Impacts
Transportation of CO2 by truck needs fuel. Burning this fuel releases greenhouse gas emis-sions into the atmosphere and is contradictory to the aim of sequestering CO2 underground. Additionally, SOx and NOx emissions occur. The freight train option, if this uses electricity and non-renewable sources, also increases the amount of CO2.
In a future scenario, where CCS has been adopted on a large scale, bringing with it the movement of millions of tonnes of CO2 via truck or train, congestion and noise levels would catapult. (Coleman 2009) estimates that the equivalent of a truck lane circling the globe 38 times would be required to transport just 1 Gt of CO2. This would have a prohibitive impact on the environment, landscape and population and so this means of transport must be re-stricted to early applications at low capacities.
3.2.2 Transport by Ship
Shipping CO2 from source to sink is flexible, and could be made available rapidly and much sooner than a pipeline. However, shipping may have to be combined with other forms of transport if onshore CO2 emissions are being transported to offshore sites. The journey from the source to the harbour could be via truck, train, boats on inland waterways or by onshore pipeline. From the harbour to the sinks, offshore vessels could transfer greenhouse gas where an injection facility is needed.
Shipping CO2 is new but lessons can be learned from transporting liquefied natural or petro-leum gas (LNG, LPG). These products are transported commercially on a large scale by ma-rine tankers (IPCC 2005). Recently, a technical association of businesses agreed to work on the design and risk assessment of tankers for shipping CO2 (Schulze 2010). The tankers developed will have similarities with LPG carriers and offshore shuttle tankers.
Transport Capacity
For CO2 transportation offshore by ship, a loading and unloading infrastructure is needed at the harbour and possibly a site for intermediate storage (Chiyoda Corporation 2011). Seago-ing tankers can transport around 24,000 tonnes of CO2 (MAERSK 2010). The Chiyoda Corporation (2011) assumes a transport capacity per ship of 1 million tonnes of CO2 per year.
Costs
The cost of transporting CO2 by ship comprises tanker costs, harbour fees, fuel costs, costs for loading and unloading processes as well as intermediate storage and condensation plants. It includes additional costs for liquefaction compared to compression. The total costs amount to between USD 20 and 30 per tonne of CO2 for transporting within the North Sea with volumes of more than 2 Mt/a (Möller 2009). Fig. 3-1 indicates costs of USD 8 to 28 per tonne of CO2 (IPCC 2005). Chiyoda Corporation (2011) estimates that the cost of loading, shuttle and injection based on a distance of 400 to 800 km with four tankers in operation is USD 37 per tonne of CO2.
Nevertheless the costs for shipping CO2 are rather low in comparison to transport by truck or rail. When comparing with the pipeline alternative, this depends on the distance. From 0 to 500 km, pipeline transport is most efficient. Beyond 1,000 km, the break-even point is

CO2 Transport: Technical, Financial and Infrastructural Challenges
Wuppertal Institute for Climate, Environment and Energy 53
reached and shipping appears to be cheaper than constructing, maintaining and using large-scale pipelines (IPCC 2005) (see Fig. 3-1).
Fig. 3-1 Costs against distance for onshore pipelines, offshore pipelines and ship transport. The
pipeline costs are given for a mass flow of 6 Mt of CO2/a
Source: IPCC (2005)
Environmental Impacts
Shipping CO2 needs heavy fuel, the production of which leads to ozone layer depletion (Koornneef et al. 2008). Additionally, photochemical oxidation and acidification resulting from SOx emissions as well as acidification and eutrophication due to NOx emissions occur. The greenhouse gas effectiveness of such an operation has to be analysed before the form of transport is chosen. Additionally, CO2 might be lost during loading and unloading processes.
The large-scale movement of CO2 using offshore tankers would considerably increase ship-ping traffic, which would heighten the risk of collisions. It could also lead to conflicts of use with existing shipping transport.
3.2.3 Movement by Pipeline
Pipelines can transport CO2 as a highly compressed supercritical fluid with a pressure great-er than 8 MPa and thus a high density of 1,100 kg/m3. This is the most cost-effective and controllable way of transporting CO2 for distances up to 1,000 km offshore and even longer distances onshore (compare the break-even point in Fig. 3-1 at approximately 1,700 km). (IPCC 2005)
Another advantage when compared to ships is their possible application both onshore and offshore. The experience gained from natural gas pipelines and some small CCS pipeline connections is explained in section 3.3.

CCS global
54 Final Report Part I
Transport Capacity
The amount of CO2 that can be transported by pipelines is very high compared to the other methods. It depends mainly on design features such as the diameter of the tube, the pres-sure applied and the temperature in the pipeline (dependent on the quantity of, and distance between, compressors). It is understood that a larger diameter, higher pressure or increased flow rate of CO2 in the pipeline increases the mass transport of CO2 per year (see Tab. 3-1). The design also includes the pipeline track. Populated areas should be avoided as well as valleys where leaked CO2 could gather (because it is denser than air) and be dangerous. Detours that accommodate these guidelines would increase pipeline lengths and thus the transport time.
Costs
Transport investment costs are highest for the pipeline solution. Costs are dependent on pipeline diameters and whether their track runs onshore or offshore (see Tab. 3-1). However, the operational and maintenance costs are very low in comparison. The transport costs over 100 km and 40 years of operation time decrease in line with the diameter size. However, for larger diameters, the cost spectrum varies quite substantially. For offshore pipes, additional costs have to be factored in as construction, maintenance and monitoring are more expen-sive on the seabed. A cost reduction might be possible where routes can be shared with ex-isting pipelines (for example, natural gas). The same track might be used, which cuts plan-ning costs for a pipeline, and there may be greater acceptance among the local community. There needs to be some analysis of whether natural gas pipelines are compatible with CO2 in order to establish whether they can be used to transport both. This is currently being test-ed at the Lacq gas processing plant in south-west France (Total 2012). Besides complex technical requirements, the conflict of use would be an issue. Natural gas is becoming in-creasingly important and many projects are underway to build additional natural gas pipe-lines and gas storage facilities, thus the functioning older ones will continue to be used. Addi-tionally, more and more biogas is being introduced to the natural gas pipeline system and energy scenarios include gas produced from renewables. In the medium term, it may also be necessary to transport hydrogen through pipelines, which would create another potential conflict of use.
Tab. 3-1 Design of CO2 pipelines with an initial pressure of 11 MPa and flow rate of 1.5 m/s
Diameter Costs (onshore) Capacity Cost
m Million USD/km Mt of CO2/a USD/t of CO2
0.3 0.3 2.9 0.25
0.4 0.4–0.9 5.1 0.2–0.44
0.75 0.8–1.0 18 0.11–0.13
1.0 1.0–2.3 35.9 0.07–0.16
1.6 1.9–6.2 81.8 0.06–0.19
The costs for transportation over 100 km within a period of 40 years are calcu-lated
Source: Based on Göttlicher (2004)

CO2 Transport: Technical, Financial and Infrastructural Challenges
Wuppertal Institute for Climate, Environment and Energy 55
Another important aspect is the construction material needed for the pipeline. If the trans-ported CO2 has a high purity, then conventional carbon steel is sufficient. However, if there is the possibility of water or water vapour content occurring during the transportation phase, then non-corrosive steel is needed, which increases costs. Because of the corrosion issue, companies tend to prefer to construct new pipelines for transporting CO2 rather than relying on older gas pipes.
The calculation of installation costs also needs to reflect labour costs (Wildenborg et al. 2004). Besides investment costs, the budget should also take into account operational and maintenance costs as well as possible energy costs. Safety factors, such as detours in pipe-lines to avoid hazardous or populated areas, conflicts with local residents or reducing the danger of terrorist attacks or pipeline accidents, could delay pipeline construction and incur considerable additional costs.
(Hendriks 2010) calculates the investment costs as being EUR 0.6 to 1.0 million/km for an onshore pipeline with no complications and a 1 metre diameter. Offshore, this amount would increase to EUR 1.0 to 2.0 million/km. Existing projects have investment costs (for 1 m diam-eter) of EUR 0.5 million/km (the onshore Weyburn project) to 2.3 million EUR/km (offshore at Snøhvit). Tab. 3-1 shows the costs depending on the pipeline diameter. For a 1 m diameter, costs of USD 1 to 2.3 million/km are derived, which is comparable with the above-mentioned project costs.
For a single 900 MW power plant, a smaller diameter would be sufficient (0.2 to 0.5 m), which would reduce installation and operating costs. But if economies of scale are consid-ered, pipelines with a larger diameter connecting various plants would be even more cost-effective (compare Tab. 3-1). The transport costs are given at EUR 4 to 8 per tonne of CO2 for a distance between 200 and 300 km at the demonstration stage (Hendriks 2010). This is supposed to decrease to EUR 4 to 6 per tonne of CO2 for the same distance on a commer-cial scale. The IPCC (2005) provides similar estimates of transport costs with a range of USD 1 to 8 per tonne of CO2 per 250 km transport. Chrysostomidis et al. (2009) calculate the av-erage costs for transporting CO2 as being dependent on capacity utilisation with EUR 8 to 11 per tonne of CO2. These figures are in line with the cost assessments of CO2 transportation via pipeline by Massachusetts Institute of Technology (MIT 2007), the Global CCS Institute (2009) and McCoy (2008). On average, costs are around USD 2 per tonne of CO2 for trans-portation over a distance of 100 km. This amount is used in the cost calculation for the three selected countries.
Environmental Impacts
The specific additional CO2 emissions are most favourable, with pipelines at only 1 to 2 per cent per 1,000 km. For shipping, this doubles to 3 to 4 per cent per 1,000 km (IPCC 2005). The pipeline has to connect sources and sinks over hundreds of kilometres. This would im-pose a significant impact on land use and involve considerable construction projects, with potentially far-reaching local environmental consequences.
3.2.4 Comparison of Different Forms of Transport
Tab. 3-2 compares the different transport options in terms of capacity, costs and the addi-tional CO2 emissions. The transport capacity indicates the possible amount that could be

CCS global
56 Final Report Part I
transported with one truck, freight train or ship tanker. Movement through pipelines is strong-ly dependent on the pipe’s diameter (see Tab. 3-1). The additional CO2 emissions referring to the same amount of gas being transported are included qualitatively. These range from high emissions for transportation by truck or train through to intermediate emissions for ships and down to low emissions for pipeline transport.
It can be concluded that pipelines are most suitable for large-scale CO2 transportation. Ships could be more feasible under three circumstances at the initial phase of a project: if the total volume of CO2 being transported is low, if pipeline investment is too costly or if the transport distance is more than approximately 1,000 km (Neele et al. 2011).
Tab. 3-2 Characteristics and suitability of different forms of transport for CO2
Means of transport Capacity Costs CO2 emissions
kt of CO2 USD/t of CO2 (100 km)
Truck 0.02 10 High
Train 1–3 4 High
Ship 10–135 1.5 Intermediate
Pipeline Dependent on diameter 0.4–3.2 Low
Source: Authors’ compilation
For the cost calculation in this report, only pipeline transport is assumed. Based on Tab. 3-2, the average costs for transporting a tonne of CO2 over a distance of 100 km are USD 2.
3.3 Existing CO2 Pipeline Infrastructures
Pipeline transport is well established for natural gas, oil, condensate and water. These sub-stances can be transported onshore and offshore up to 1,000 km. But there is some experi-ence in CO2 pipeline transport as well. This originates mainly from the USA, where high-pressure pipelines have been built since the seventies to transport carbon dioxide from natu-ral sources to nearly-depleted oilfields in order to increase production (enhanced oil recov-ery). Five such projects are known for the USA, as well as one between the USA and Cana-da and one project in Turkey (Fischedick et al. 2008). In total, 50 Mt of CO2/a are transported about a total length of 2,600 km. The transport costs amount to between USD 9 and 18 per tonne which is low compared to capture costs, which usually amount to between USD 40 and 60 per tonne.
3.4 Global CO2 Transport Studies
This section gives an overview of some transport models and scenarios. CO2Europipe is a partly EU-funded project under the 7th Framework Programme of the European Commission, which ran from April 2009 through to October 2011. It analysed and defined requirements for a possible large-scale pipeline infrastructure for CO2 transport in north-western and central Europe. The project tried to address which CO2 emissions could be transported in such a system; where the sources were situated and when they would occur. Three scenarios, based on onshore and offshore transport and EOR, were calculated (Neele et al. 2011). Haszeldine (2009) elaborated a possible CO2 pipeline network in north-west Europe, and

CO2 Transport: Technical, Financial and Infrastructural Challenges
Wuppertal Institute for Climate, Environment and Energy 57
Middleton and Bielicki (2009a, 2009b) developed a CCS infrastructure model based on Cali-fornia.
The IEA (2009b) calculated the potential global pipeline investments from 2010 to 2050 with-in its CCS model. Up to 2020, about USD 15 billion would have to be invested from which China and India would receive 20 per cent (USD 3 billion to build 17 to 20 pipelines between 2,100 to 2,700 km in length). Until 2050, the amount invested in China and India would in-crease to 33 per cent (USD 275 billion for 360 to 660 pipelines totalling 55,000 to 100,000 km in length) at a total of USD 550 to 1,000 billion in infrastructure investment (IEA 2009b). McKinsey (2008) argues that 400 Mt of CO2/a would have to be transported by 2030. In or-der to achieve such challenging aims, the author identifies clusters where regional transport hubs would have to be installed and a pipeline network would have to be laid. Other meth-ods, such as ship and truck, are also analysed.
3.5 Risks and Uncertainties with CO2 Transport
As mentioned earlier, the avoidance of corrosion of materials is important to allow the safe passage of CO2 in ships, tankers or pipelines. The quality of CO2 is important when as-sessing risks since the amount of other substances such as H2S, NOx, SOx or N2 reduces its purity. Dry CO2 does not corrode usual carbon-manganese steels and so water content is a crucial factor. The corrosion rate would be very small (0.01 mm/a). Effective steel has to be selected and regular monitoring would be needed. Besides material corrosion, there are oth-er risks. Leakages could occur at the transfer stage between capture facility and pipeline or tanker. CO2 may also escape at possible injection sites.
Another crucial issue in the transportation of CO2 is public acceptance. There may be local resistance due to an absence of information or explanations, which can make it very difficult to obtain planning permission for a CO2 pipeline from public authorities.
The potential harm to the local population must be kept to a minimum. Pipeline routes should not be installed through valleys because if there was a CO2 leak there, it would gather be-cause of its higher density than the air. Such an accumulation would be invisible, and there-fore could go undetected, potentially leading to casualties because of a lack of oxygen.

CCS global
58 Final Report Part I
4 CO2 Storage: Types of Storage Formations, Mechanisms for CO2 Storage and Methods for Assessing Storage Potentials
4.1 Introduction
An essential part of the CCS chain is the storage of CO2 in the geological subsurface. There-fore, within this study, an in-depth review of the storage capacity in the three selected coun-tries is provided. In order to examine the different perspectives of CO2 storage capacity, general arguments, assumptions and methods are presented in this section.
Firstly, the characteristics of suitable geological formations for the injection and storage of CO2 are described (section 4.2). The different types of formations are explained separately and the favourable conditions and negative impacts of different trapping mechanisms are shown. In section 4.3 there is an explanation of how CO2 storage capacities are calculated for each of these formations and their classification in the different capacity concepts. Poten-tial problems and constraints of CO2 sequestration are discussed in section 4.4. Finally, the overall aim of the storage assessment for CISA is described (section 4.5). If storage projects are taking place in China, India or South Africa, these projects are described in their specific country report.
4.2 Characteristics of Geological Formations Suitable for CO2 Storage
The storage of CO2 in the subsurface is linked to geological formations. Some general re-quirements have to be fulfilled in order to declare a storage site as suitable. Formation types considered for CO2 storage include oil and gas fields, deep saline aquifers, unminable coal seams and other possibilities such as basalt storage.
4.2.1 Types of Formations and Reservoir Requirements for CO2 Storage
4.2.1.1 General Requirements for CO2 Storage
Generally speaking, CO2 storage needs pores into which the gas can be injected. This prop-erty is called porosity and is calculated by pore volume per total bulk volume. To inject and store CO2 effectively, these pores have to interconnect to allow the fluid to disperse in the underground (permeability). Porosity and permeability are related and conditions for both have to be sufficient to obtain a high percentage of usable pore space. This can be ex-pressed by the factor n/g (net-to-gross ratio). This is required for fast injection (high injectivi-ty). In terms of estimating total storage capacity, the maximum allowable injection rate is not important. Instead, for regional or local injection projects, the injection rate may be the limit-ing factor. For this study it was not possible to cover this issue in the context of source-sink matching as there is a considerable lack of knowledge on injectivity at potential storage sites.
High levels of porosity and permeability are found in most sandstone reservoirs. Average values for efficient reservoirs are 20 per cent porosity and 300 mD of permeability. The depth essentially influences porosity and permeability, and these properties generally decrease with increasing depth.

CO2 Storage: Types of Storage Formations, Mechanisms for CO2 Storage and Methods for Assessing Storage Potentials
Wuppertal Institute for Climate, Environment and Energy 59
Besides the required pore volume space, another essential aspect of safe CO2 storage is the caprock. The porous storage area has to be sealed by an impermeable sediment layer of clay or salt with a substantial thickness. This reliable cap has to be able to resist the applied injection pressure at the bore well and also the general pressure increase created by CO2 injection over the time it is operating as a storage site. Recently, experts have been favouring the multi-seal concept, meaning that not only one, but several confining layers are in place to secure the storage site (Birkholzer et al. 2009; DNV 2010). Consequently, even if the first cap layer is destabilised and CO2 leaks beyond it, the second or third layer can contain the gas underground.
The described geological properties have another important impact on CO2. As the overlay-ing sediment layers become thicker and thicker with increased depth, the temperature and pressure rise. On average, earth underground warms up by 25 to 30°C per km (geothermal gradient) and the pressure rises by 10 to 12 MPa per km (pressure gradient) (North 1985).
Pressure and temperature control the phase state of CO2. The relationship can be seen in Fig. 4-1. At higher temperatures (>31.1°C) and high pressures (>7.3 MPa), CO2 is com-pressed to the supercritical state. Beyond this supercritical point, the difference between the liquid and the gas phase vanishes. These conditions occur at a depth of around 800 m when average gradients are applied.
Fig. 4-1 Phase diagram for CO2
Source: Piri et al. (2005)
The supercritical state is closely related to the density of CO2. High pressure compresses the relative volume of a gas. Fig. 4-2 shows the reduction of volume with increased depth. At the supercritical point, around a depth of 800 m, it was reduced to a relative volume of 3.8 per cent and a CO2 density of around 600 kg/m3 is reached. This depth is considered as the min-imum depth for CO2 storage because the changes in volume and density until 2.5 km are only minor (2.7 per cent of the original size and a density of 700 kg/m3). Vangkilde-Pedersen et al. (2009a) define 2.5 km as the maximum depth because of the considerable decrease in

CCS global
60 Final Report Part I
permeability and porosity. The opportunity for CO2 storage in aquifers and oil or gas fields lies, therefore, at between 800 and 2,500 m.
Fig. 4-2 Variation of CO2 density with depth
Source: IPCC (2005)
In particular, the gain in volume leads to much more efficient storage operations because multiple amounts of CO2 can be injected and stored. This positive effect is reached without additional energy input as the geological gradients deliver adequate conditions.
In coalfields (see section 4.2.1.4), the permeability threshold has already been reached at a depth of 1,300 to 1,500 m. Most of the methane production wells are shallower than 1,000 m (IPCC 2005). CO2CRC (2008) points out that the influence of supercritical CO2 on the coal is very unclear and, therefore, for security reasons, injected CO2 should remain in the gaseous phase, in other words, no deeper than 700 to 800 m. The density of this gaseous CO2 would be less than the supercritical 600 to 700 kg/m3, and would range from 2 kg/m3 at the surface to 500 kg/m3 at a depth of 700 m (see Fig. 4-2).
Several authors indicate that the coal situated in the groundwater protection zone has to be excluded from any plans for CO2 storage (Bachu et al. 2007; Christensen and Holloway 2004; Hamelinck et al. 2001). Depending on water protection regulation and the depth of the potable water level, and if the previously defined maximum depth of 700 to 800 m is applied, the scope of appropriate depths is reduced considerably.
Tab. 4-1 gives an overview of the maximum and minimum values of variables for adequate CO2 storage sites in aquifers and hydrocarbon fields. These figures vary for coal seams.

CO2 Storage: Types of Storage Formations, Mechanisms for CO2 Storage and Methods for Assessing Storage Potentials
Wuppertal Institute for Climate, Environment and Energy 61
Tab. 4-1 Overview of the characteristic properties of suitable reservoir rocks for aquifers and gas/oil fields (minimum, maximum and optimum conditions)
Property Unit Minimum Optimum Maximum Example *
Permeability Cap rock mD As low as possible 1–10
Reservoir mD 200 > 300 > 1,000 100–700
Porosity Cap rock % - < 10 10
Reservoir % 10 20 30 18.7
Thickness Cap rock m 20 > 100 Infinite Infinite
Reservoir m 20–50 100 300 200
CO2 density kg/m3 500 700 750 650
Depth m 800 1,200 2,500 200–3000
* = properties of a Lower Trias reservoir (UK), average values based on (Bentham 2006)
Source: Höller (2009)
4.2.1.2 Oil and Gas Fields
Depleted oil and natural gas fields are ideal for storing CO2 underground. The carbon dioxide is injected where the former hydrocarbons were situated. The point of injection (for example, at the bottom or at the top of the structure) is chosen depending on the injection strategy and the geology of the site. If it is injected at the bottom, the differences in density cause the CO2 plume to rise (similar to the formation of oil and natural gas) and it is collected underneath the roof. For millions of years, depleted oil and natural gas fields have shown the existence of suitable caprocks for hydrocarbons, which are equally assumed to be impermeable to CO2. It should be pointed out, however, that CO2 has different chemical properties to those of oil or natural gas, which could lead to problems. Above all, the formation of carbonic acid, caused by the dissolution of CO2 in the prevailing water, creates an acidic and therefore cor-rosive environment. This could jeopardise the integrity of the caprock or wellbore cement (Ennis-King and Paterson 2007; Hunt 1995; Kharaka et al. 2006).
A big advantage of storing CO2 in hydrocarbon fields is that plenty of data is available. The fields are well analysed and researched following decades of exploitation so the necessary geological information can be provided.
The trigger for starting the commercial application of CCS could take place through the ex-pansion of tertiary oil recovery (enhanced oil recovery = EOR), which has already been ap-plied for decades in the USA. There, a long CO2 pipeline has been constructed which pro-vides oil fields with fresh and pure natural CO2. Dooley et al. (2010) assess that this pipeline network and existing CO2-EOR operations do not help to boost the commercial deployment of CCS in the USA. Thus, new EOR projects include the potential value of sequestered CO2 in the financial feasibility study of the projects (Nummedal 2008).
The first depletion phase of an oil field is induced by natural pressure, i.e. pressure in the reservoir is higher than that in the adjacent well bore. In the second production step, water is injected to increase the pressure difference between reservoir and well. The water displaces the oil. When this technique has lost its impact, CO2-EOR is introduced and the recovery is enhanced with the greenhouse gas. On the one hand, CO2 reduces the viscosity of oil and makes the recovery easier. On the other hand, it pushes the oil into the wellbore through

CCS global
62 Final Report Part I
increased reservoir pressure. In comparison to usual EOR technologies, CO2-EOR is more complex. Furthermore, it is a long-term technology with high costs.
The percentage of recovery of the original oil is extended from 10 to 30 per cent to 35 to 55 per cent through secondary recovery. Additionally, CO2-EOR contributes between 5 and 15 per cent (Bellona Foundation 2005; SCCS 2009; van der Straaten et al. 1996). However, the CO2 also blends with the oil and has to be separated from it afterwards. If CO2 captured from emissions is to be used as a recovery aid, a small fraction of it may be stored underground. The Weyburn project produces between 5 and 10 barrels of oil for every tonne of CO2 se-questered permanently underground (Nummedal 2008).
Thus, a life cycle assessment of the emission impact has to be taken into account. (Jaramillo et al. 2009) calculate that around 60 per cent of the injected CO2 remains underground and that for every injected tonne of CO2, approximately 3.7 to 4.7 tonnes of CO2 are emitted into the atmosphere. These emissions include CO2 released during production, transport, refinery and burning of the additionally produced hydrocarbons. EOR is therefore not an option for reducing emissions and is counter-productive to climate change initiatives (Luhmann 2009).
Another issue is scheduling. On the one hand, during EOR operations, efforts are made to achieve the highest possible oil output. For this reason, injection rates might be reduced to balance the internal reservoir pressure build-up. A continuous and safe CO2 provision for several years at least is needed because stopping the operation could cause problems. On the other hand, CO2 sequestration projects aim to inject the most amount of CO2 at a contin-uous speed but an injection stop does not cause major problems (Nummedal 2008).
But nevertheless, EOR could help to implement a CO2 pipeline system which could later be used for storage purposes. When EOR shuts down, the redundant field could be used after-wards for CO2 injection and sequestration. But economic conditions such as oil recovery, oil market prices and infrastructure suitability, need to be favourable to achieve an adequate implementation. This is especially true offshore (SCCS 2009).
Enhanced gas recovery (EGR) is not as popular as the oil option. This is largely explained by three reasons. Firstly, the primary recovery step already produces 75 to 95 per cent of the original gas in place. Thus, additional recovery is not as important as for oil, and ranges from around 1 to 2 per cent of the original gas (Paterson 2003). Secondly, the gas mixes with CO2 and the effect of enhanced recovery is not as obvious as for EOR. This gas mixture has a much higher CO2 content than typical natural gas, and needs further refinery. Thirdly, EGR projects are still being investigated under laboratory conditions or in pilot projects, and this technology is not yet commercially available (IPCC 2005).
Unconventional Gas
Recently, prospective unconventional gas resources have fired imaginations with the possi-bility of a revolution in gas exploitation and its use as a domestic energy source, especially in the USA (Flavin and Kitasei 2010). The three possible gas sources are trapped gas from low-porosity rocks; gas from shales and coalbed methane recovery. Gas extraction from low-porosity sedimentary rocks is difficult and only becomes feasible if a high gas price exceeds the increased recovery costs. Technological advancements such as hydraulic fracturing and horizontal drilling help to recover trapped gas from shales. On the one hand, these tech-niques have considerable implications for the local environment as water laced with toxic

CO2 Storage: Types of Storage Formations, Mechanisms for CO2 Storage and Methods for Assessing Storage Potentials
Wuppertal Institute for Climate, Environment and Energy 63
chemicals is injected for rock fracturing. These added chemicals create a huge toxic disposal problem and may contaminate water and other natural resources (NYSDEC 2009). On the other hand, horizontal drilling could reduce disruption to the land as it may cut the amount of vertical drilling required. In the USA, a shale “gold rush” is taking place (IHS CERA 2010). Coalbed methane recovery is explained in section 4.2.1.4.
Unconventional gas recovery is mentioned here as a considerable increase in gas production would increase the potential space for CO2 injection. However, the production of trapped or shale gas destabilises the rock through fracturing, which diminishes the potential of suitable CO2 storage sites. Additionally, greater quantities of domestic gas could partially replace coal as a leading energy source in upcoming economies such as India, China and South Africa. Instead of large coal-fired power plants, decentralised gas-fired plants could be constructed. Flavin and Kitasei (2010) argue that these countries may have extensive natural gas re-sources and could, by using these methods, reduce greenhouse gas emissions. This is un-derlined by the projections of IEA and OECD (2009). China is collaborating with the USA in enhancing unconventional gas recovery within the “US-China Shale Gas Resource Initiative”. In spite of this, it remains rather uncertain whether these unconventional sources will boost global gas production, and the significance that this will have upon CCS implementation.
4.2.1.3 Deep Saline Aquifers
Unlike oil and gas fields, groundwater-saturated sediment formations, also referred to as deep saline aquifers, are relatively under-explored. Although there is a lack of reliable data, the injection of CO2 into deep saline aquifers is generally considered to be the most attractive solution in terms of volume. The availability of suitable sedimentary basins is widespread and can be found in almost all parts of the world. Such basins are used for the underground stor-age of natural gas. Lessons learned from this technology could be applied to the storage of CO2.
These formations contain water that has a very high salt content and is, therefore, undrinka-ble. A further property of potential storage formations is the very slow flowing movement of the groundwater (approximately just a few centimetres per year). Researchers assume that the injected CO2 would remain safely underground in the long term due to dissolution and mineralisation. These effects are described in more detail in section 4.2.2.
Open and Closed Formations
An essential prerequisite for CO2 storage in aquifers is the connection of the injection area to the rest of the formation. It can be compared with open and closed structures in open and closed systems (see Fig. 4-3).
The most straightforward type of a closed structure is a trap which can be likened to an up-turned bucket or a subterranean hill. If CO2 is injected into such a structure, it would remain inside, assuming the presence of a sufficient confining layer. Other possible structures are flat or trough-shaped (open or synclinal structures). If an open structure is used for CO2 stor-age, the gas would not remain in the structure but would dissipate to other connected areas in the subsurface.
Open and closed structures in saline aquifers can be found in open or closed systems. In both cases, the injection of CO2 is followed by compression and displacement of the pore

CCS global
64 Final Report Part I
water. The compression increases the pressure in the system. If the system is closed, the maximum pressure increase of the aquifer system controls the amount of CO2 to be injected because the pores are saturated with salt water and disruption of the cap and leakage has to be ruled out. If the system is open, this saline water can be displaced out of the structure and into other parts of the system. It is important that there are assurances that this displacement of highly saline water does not contaminate other environments. Catastrophes such as the salinisation of drinking water or the release of salt water to the surface must be prevented through safeguarding controls. Consequently, not only the risk of leaks of CO2 emissions, but also that of saline water has to be taken into account.
Fig. 4-3 Schematic examples of open and closed structures in open and closed aquifer systems Source: Höller (2009)
4.2.1.4 Unminable Coal Seams
In many coalfields, coalbed methane (CBM) is present. This methane presents a danger to miners and the mining process as it is highly explosive. All over the world, explosions caused by methane emissions are a big problem in coal mining. Coalfield fires frequently occur and spontaneously combusting coalfields pose a severe threat to people and the economy. Addi-tionally, there are heightened methane risks brought about by global warming. There have been cases of methane leaking to the surface close to coal mines. More detailed information on environmental issues concerning coal mining, especially in CISA, is provided in the coun-try-specific sections on environmental impacts of CCS.
A very convenient way of reducing these risks is to recover the coalbed methane. Besides the safety benefits, it can be used for energy generation, and capturing the gas additionally reduces the emissions from coal mining. Recovery can be enhanced through the injection of CO2 into deep uneconomic coal seams (enhanced coalbed methane (ECBM) recovery). In the long run, CO2 storage is an opportunity here, in addition to depleted oil or natural gas fields and deep saline aquifers.
The storage of CO2 in coalfields is based on the adsorption of CO2 on the solid coal. Coal is a polymer-like substance and has a very large number of micro pores. Methane is present in

CO2 Storage: Types of Storage Formations, Mechanisms for CO2 Storage and Methods for Assessing Storage Potentials
Wuppertal Institute for Climate, Environment and Energy 65
many pores, as mentioned above, but coal has a higher affinity to injected CO2. At the same pressure (for example, 3 MPa), one gramme of dry coal adsorbs a volume of approximately 5 cm3 of methane or 15 cm3 of CO2 (see Fig. 4-4). Due to this higher affinity, the methane is exchanged by CO2 and can be produced (ECBM). It has the potential to increase the recov-ery rate of methane from 50 to 90 per cent, and could lead to economically feasible exploita-tion (Hamelinck et al. 2001). For every methane molecule recovered, two to three molecules of carbon dioxide are accommodated (Gentzis 2000).
CO2 has two effects on coal. On the one hand, it works as a “plasticiser”, leading to a soften-ing of the coal. On the other hand, CO2 swells the coal and reduces its permeability (Day et al. 2010).
The depth of coalfields suitable for storing CO2 is the source of some controversial discus-sion in the literature. One argument is that it is widely assumed that CO2 storage is impossi-ble in the depth area where coal mining has taken place and in groundwater protection zones. This can occur up to 600 to 1,200 m depth. For safety reasons, CO2 storage should only be considered 100 m below the deepest mining operation (Holloway et al. 2009). The counter-argument is that coalfields below 1,300 to 1,500 m are declared as not viable for storing CO2 because permeability is too low (< 1 mD) (Bachu et al. 2007). These depth re-strictions would make it rather difficult to find adequate storage space. For comparison, most coalbed methane-producing wells are less than 1 km deep (IPCC 2005). Whether CO2 stor-age or ECBM activities in traces of coal from depleted mines are safely available is also open to question. The abandoned coal mines accommodate many different wells, lodes and shafts so that a controlled sealing before injection is almost impossible. May (2003) points out that recovery in adjacent mines could still be in process, potentially raising other safety concerns. Additionally, crevasse formations often occur above the coal deposition.
Fig. 4-4 Adsorption of various gases on “dry and ash free” coal (daf)
Source: Bachu et al. (2007)

CCS global
66 Final Report Part I
Another limitation is the state of CO2. It is considered as being unsafe if it is injected in the supercritical phase (CO2CRC 2008). Therefore the gaseous conditions of CO2 should be maintained, which reduces the maximum depth range to 700 to 800 m (Holloway et al. 2009). It should also be appreciated that any CO2 storage contaminates the coal, thereby precluding it from further exploitation meaning that this part of the energy resource is sterilised (Bachu et al. 2007).
Lignite occurrences are excluded from such possibilities since ECBM or CO2 storage in the-se low-rank coals remain uncertain (Hendriks et al. 2004; Kumar and Mani 2007).
For these reasons, the option for storage in coal deposits has often been declared as unfea-sible due to safety concerns and questions regarding storage efficiency (Shi and Durucan 2005). Nevertheless, many storage capacity estimates do include this deposition as a possi-bility and thus the methodology is described in section 4.3.4.
4.2.1.5 Other Possibilities
Underground Coal Gasification
Underground coal gasification (UCG) is another potential technology for CO2 sequestration. The concept behind this process is to retain the coal resources underground so that it can be gasified there. Two wells are drilled into the coal for this purpose. One is reserved for the injection of oxidants such as air, oxygen, water vapour or mixtures of these substances. The-se are injected and heated to create syngas out of the solid coal. The second well is used to bring this product to the surface. The syngas does not have the purity of natural gas and it needs to be cleaned before it can be used for energy production. Clean CO2 is formed as a by-product, ready for sequestration or CO2-EOR application. Operations can be halted by injecting nitrogen (N2) into the first well.
For CO2 storage purposes, scientists argue that coal gasification turns the remaining coal into a rough equivalent of activated carbon with many internal pores (porosity from 2 to 30 per cent). This process should deliver enough space for CO2 to be adsorbed, although there is no proof that this actually works (Kempka et al. 2009).
This technology might have major problems. It leaves the coal underground, but the gasifica-tion process reduces the mass, running the risk of huge subsidence. UCG causes (geo-) thermal and geochemical changes, which may influence the CO2 storage potential. Proper-ties such as pressure, temperature or the flow of fuel gas vary according to time and location. Severe groundwater contamination issues have been reported from UCG projects, including the possibility of organic contaminants in CO2 and metals in acid groundwater becoming more soluble (BHEL 2006; Friedmann 2007). All these effects have to be analysed before injecting CO2 back into coal seams or near to an active UCG production facility (Voosen 2010).
Basalts
Flood basalts form part of large igneous provinces, mostly in the oceans. Major continental formations are situated in the USA (Columbia River basalts), India (Deccan Volcanic Prov-ince), South Africa (Karroo basalts), Canada (Keeweenawan) and Brazil (Parana). Basalts typically have low porosity, low permeability and low pore space continuity. The thickness of

CO2 Storage: Types of Storage Formations, Mechanisms for CO2 Storage and Methods for Assessing Storage Potentials
Wuppertal Institute for Climate, Environment and Energy 67
the uppermost section is often highly variable because the flood basalts have an inherent heterogeneous nature.
During solidification of the magma, different processes take place to form joints and porous and permeable flow tops of basaltic lava. These processes include variations in cooling rates and thermal contraction, degassing and interaction of the magma with water. These effects partially established the necessary characteristics for CO2 sequestration (sufficiently high porosity and permeability), but also created properties such as joints which can lead to se-vere problems in CO2 injection operations. The basalt formations are partly confined by seals to contain the CO2 in the basalt. These are dense, low permeable basalts and sediment beds with a low permeability within the basalt.
The possible injection rate per well might be higher than a few million tonnes of CO2 per year, although there is yet to be a detailed evaluation of their storage potential. Consequent-ly, the IPCC (2005) states that still more research is needed and that basalts appear unlikely to be suitable for CO2 storage. Nevertheless, recent studies have evaluated the potential of CO2 storage in continental flood basalts in the US and Indian basalts (Kumar et al. 2008; McGrail et al. 2006, 2009; Schaef et al. 2010; Singh et al. 2006).
4.2.2 Storage Mechanisms
Once CO2 has been injected into the subsurface, it can be kept there using a variety of tech-niques.
When it comes to storage in saline aquifers, the pore water is displaced by the injected car-bon dioxide. CO2 rises in this formation because it has a lower density than the surrounding salt water. As soon as it reaches a cap rock, it collects there in a structure (for example, trap) as a mobile phase. This mobile phase of CO2 is similar to storage operations in depleted oil or gas fields, where the displacement issue is different. There, the space created by pro-duced hydrocarbons may be filled with CO2.
In both formation types, CO2 is gradually dissolved in the salt water at the boundary surface to the water layer, and carbonic acid is formed. Eventually the entire mobile CO2 phase should be dissolved. The mineralogical deposition of carbonates does not start until the wa-ter is CO2-saturated and enough cations (such as calcium ions) are available. The Intergov-ernmental Panel on Climate Change (IPCC) special report on CCS (IPCC 2005) provides an overview of the trapping mechanisms and the planning stages for saline aquifers (see Fig. 4-5).
Mineralogical storage is also the trapping mechanism available for storage in flood basalts. There, it is supposed that the injected supercritical CO2 dissolves sufficient ions from the rocks. These cationic ions can react with dissolved CO2 to create carbonate minerals.
CO2 storage in coalbeds is different to the described methods. There, trapping by adsorption is the essential mechanism.
In the following section, the trapping mechanisms and the different activation time periods (see Fig. 4-5) are described and summarised in Tab. 4-2.

CCS global
68 Final Report Part I
Fig. 4-5 Share of different trapping mechanisms after injection stops Source: IPCC (2005)
4.2.2.1 Free-Phase Trapping
The contribution of free-phase trapping is at its highest at the beginning of the injection pro-cess and decreases as time goes by and as other processes become more important. The most convenient pore spaces are within structural and stratigraphic traps, where CO2 accu-mulates underneath a confining layer.
4.2.2.2 Capillary Trapping
Whilst the injected CO2 moves as a plume through the subsurface, parts of it are retained in the pores due to capillary forces. This amount of residual trapped CO2 increases with the length of the migration path and with the amount of pore space volume that is passed through. The migration rate of the injected CO2 is reservoir specific and depends on the properties of the rock such as permeability and porosity, the brine density, the CO2 itself and the injection strategy. The formation water situated in the pores is exchanged by CO2. This is called residual trapping, and develops with age, from immediately after the injection has stopped, lasting for an indeterminate period of time, and possibly over centuries (Bradshaw et al. 2005).
4.2.2.3 Dissolution Trapping
The CO2 fraction trapped in structures or stored in pores dissolves into the surrounding water in the long term.
The dissolution process occurs in conjunction with residual trapping and is referred to as solubility trapping in Fig. 4-5. The migrating CO2 is dissolved in the formation water. The amount of dissolution relies heavily on the conditions in the subsurface. A greater amount of gas can be dissolved if the pressure is high and salinity is low. CO2 dissolved in water forms

CO2 Storage: Types of Storage Formations, Mechanisms for CO2 Storage and Methods for Assessing Storage Potentials
Wuppertal Institute for Climate, Environment and Energy 69
ionic species and produces a weak acid (slightly lower pH). The acid-rich salt water has a higher density than the CO2-free saline water and descends. New saline water can rise to the boundary and dissolve additional CO2.
Because of the time frame, this trapping mechanism does not increase the short-term stor-age potential, which is borne out by numerical simulations (Bielinski et al. 2008; Doughty et al. 2001; Pruess 2003). If a CCS operation of between 40 to 60 years is assumed, most of the injected CO2 will be captured during this period in structural and stratigraphic traps (free-phase trapping). Effective dissolution starts only after decades of injection and could in-crease the pore space available for further injection.
A huge amount of CO2 can be trapped by dissolution over a timescale of hundreds to thou-sands of years (Bradshaw et al. 2005). In the long term, it is believed that all free CO2 will be dissolved due to the slow velocity of the injected CO2 plume (cm/a) (Bradshaw et al. 2005; Gunter et al. 1993). The lateral movement is slow enough that the whole CO2 would dissolve before exiting the formation. This also applies if no traps or caps impede the movement.
Gilfillan et al. (2009) describe solubility trapping as a major sink for CO2 by providing exam-ples of natural analogies. Regarding the long-term storage, dissolution removes up to 90 per cent of the CO2 in the formation whereas mineral precipitation has only a minor impact (0 to 15 per cent). The occurrence of natural CO2 deposits is explained by assuming a very slow dissolution process in the formation in question. In contrast, van der Meer (1996) models the contribution of dissolution to storage as being less efficient and states that only a small amount will be dissolved.
4.2.2.4 Mineral Trapping
Mineral trapping works over an even longer timescale and provides the highest level of stor-age security. The drawback is that it only starts to occur significantly centuries after injection has taken place (see Fig. 4-5).
In geochemical terms, mineral storage is based on CO2-saturated pore water (dissolution trapping). The carbonate ionic species react via bicarbonate ions to carbonate minerals with calcium, magnesium and iron. These derive from silicate minerals in the rock matrix. Such reactions can take place in saline aquifers, oil and gas fields and in flood basalts, and result in the precipitation of carbonate minerals. CO2 can be sequestered sustainably underground due to this geochemical trapping.
The main difference between sedimentary rock formations and basalts is the relatively fast reaction rate of mineralogical trapping in basalts. Firstly, the CO2 is dissolved in the basaltic pore water. After that, a rapid reaction of CO2-saturated pore water with major crystalline components of the basalts takes place and stable carbonates are formed. The associated mineralisation reactions in basalts have already been demonstrated under laboratory condi-tions in less than 1,000 days but need to be verified in nature (McGrail et al. 2006; Schaef et al. 2010). The researchers tested basalts from the USA, India and South Africa. All samples had different levels of reactivity, for example, the Karoo basalt of South Africa was highly reactive with the CO2-H2S mixture and least reactive with supercritical CO2. But virtually all the basalts showed some type of reaction under the presence of CO2, suggesting that they could permanently store the gas as carbonate minerals. Prasad et al. (2009) tried to optimise

CCS global
70 Final Report Part I
the reaction rate under laboratory conditions to maximise the amount of sequestered CO2. The careful adjustment of process conditions such as altering the particle size, reservoir temperature or CO2 pressure could enhance the trapped amount. It would be very difficult to guarantee such conditions in nature and many investigations still have to be carried out to prove the suitability of basalt storage. BGS (2010) mentions a different method of storing CO2 in basalts. Using its approach, the gas would be injected through the basalt using high pressure, possibly causing it to partially react with the rock. However, much of the injected CO2 would be emitted at the other end of the formation, leading to obvious problems con-cerning emission control and safety.
One pilot study designed to make new discoveries about the environmentally safe and irre-versible long-term storage of CO2 in Deccan basalt is being conducted by an international consortium led by the National Geophysical Research Institute in Hyderabad (Kumar et al. 2008).
Sediment basins are much more widespread, and thus have a higher storage potential, but deliver only insufficient calcium, magnesium or iron ions for mineral trapping. The supercriti-cal CO2 remains much longer in the formation, mixing very slowly with the pore water and so leakage is possible.
4.2.2.5 Adsorption Trapping
This trapping mechanism is restricted to CO2 storage in coal seams and after underground coal gasification. When the gas comes into contact with the surface of the coal, it is adsorbed and, where present, coalbed methane is displaced. In order to achieve an economic output through coalbed methane recovery, this process has to be quick (Bachu et al. 2007). Absorp-tion and structural rearrangement of the coal also controls the speed of the initial adsorption (CO2CRC 2008).
CO2 adsorption is most successful where large quantities of micro pores are available. This process has been successfully demonstrated in a laboratory setting, but must be tested in natural environments through an extensive testing process to show its viability for large-scale CCS deployment.
Tab. 4-2 Overview of trapping mechanisms
Free-phase Capillary Dissolution Mineral Adsorption
Oil and gas fields x x x x
Deep saline aquifers x x x x
Coalbeds/UCG x x
Flood basalts x x x
Time Initially fast, decreasing in
long term
Increasing with migra-tion path
Medium to long term
Long term (centuries), faster
in basalts
Short term
Dependent on Porosity, per-meability
Permeabil-ity
Lateral move-ment, water
conditions (pres-sure, salinity)
Cations, CO2-saturated pore
water, CO2 pres-sure, temperature
Available coal micro
pores, bounded CH4
Source: Authors’ compilation

CO2 Storage: Types of Storage Formations, Mechanisms for CO2 Storage and Methods for Assessing Storage Potentials
Wuppertal Institute for Climate, Environment and Energy 71
4.3 Methods for Assessing the Capacity of CO2 Storage Formations
This section provides an overview of different methods for assessing CO2 storage capacity, which is crucial to understanding the available estimates and the huge variations between them (Bradshaw et al. 2007). First of all, various concepts for capacity categorisation are explained. This is followed by a description of the calculation methods for different formation types such as oil and gas fields, deep saline aquifers and unminable coal seams.
4.3.1 Capacity Concepts
Against the backdrop of carbon dioxide sequestration activities becoming more prevalent, different concepts for describing available underground capacity are reviewed. There are two key aspects here: one is to consider the dimensions of the assessment, adopting either a top-down or a bottom-up approach, whilst the other is to specify the estimated CO2 storage capacities. This is widely achieved using the so-called pyramid concept, where the estimates are sorted according to viability.
4.3.1.1 Top-Down and Bottom-Up Approaches
There are two different approaches to investigating the spatial aspects of CO2 storage: the top-down approach derives from the total size of a region or federal state and uses general-ised values and assumptions to estimate capacity. This differs from the bottom-up method, in which site-by-site level data is collected in order to assess volume, properties and storage characteristics. Applying these factors gives a site-specific capacity estimation which can be scaled upwards to calculate a figure for the entire region. If reliable measurements are avail-able, the bottom-up approach can deliver a much more detailed capacity perspective.
Depending on the formation type, different geological information is available. The explora-tion and production industry has collected significant data for oil and gas fields. Here, a bot-tom-up approach is possible and widely applied to estimate storage capacity. Data about deep saline aquifers has only been sparsely collected and therefore in most cases general values are used to derive storage capacity using a top-down approach. Nonetheless, region-al or formation-specific assessments do exist. Coal seams are somewhere in between: the coal industry has significant data about reserves, but this is limited to commercially exploita-ble areas. For CO2 storage, only uneconomic seams are considered and thus data is limited because the capacity depends on the quality of the coal and the specific adsorption capacity (CO2CRC 2008). This is the reason for the top-down approach usually being applied to coal seams.
4.3.1.2 The Pyramid Concept
Besides the spatial view of storage capacities, there needs to be an evaluation of the reliabil-ity of estimations. When the available capacity estimates for the same region are compared, the variation is enormous (Bradshaw et al. 2007). The differences can be partly explained by applying a concept which sorts the different results into categories. A commonly used con-cept is the ”techno-economic resource-reserve pyramid for CO2 storage capacity” proposed by the Carbon Sequestration Leadership Forum (CSLF) (Bachu et al. 2007). It provides a good overview of different capacities. Essentially, the pyramid consists of four categories:

CCS global
72 Final Report Part I
theoretical, effective, matched and practical capacity. Fig. 4-6 shows a modified version of that pyramid. The whole pyramid represents the theoretical capacity. This represents the maximum volume that can be filled with CO2. This capacity includes uneconomic and unreal-istic volumes. Geologically, the most important capacity is the effective capacity. It is a sub-set of the theoretical one applying physical, geological and engineering cut-off limits on ca-pacity. The matched capacity is derived through a source-sink matching of big CO2 sources with potential sinks. The practical storage capacity incorporates technical, legal and econom-ic barriers.
Fig. 4-6 Modified version of the storage potential pyramid suggested by CSLF
Source: Authors’ illustration based on Bachu et al. (2007)
This section presents the methodologies for obtaining the effective capacity, although it was not possible to apply these equations to all countries in this study. If the required data was unavailable, the theoretical capacity was derived. To demonstrate the wide range of options for storage, scenarios are developed for either effective or theoretical capacity. Based on these scenarios, the country-specific sections deal with the infrastructural challenges in-volved in achieving broad source-sink matching. In the case of effective capacities, a matched capacity, as shown in Fig. 4-6, is derived. If only theoretical storage capacity esti-mates are available, a theoretically matched capacity is calculated.
4.3.2 Oil and Gas Fields
The storage capacity for oil and gas fields is mostly calculated from depleted fields. Addition-ally, enhanced oil or gas recovery may contribute to storage capacity via increased recovery.
The capacity to store CO2 in depleted oil and gas fields is calculated from the amount of hy-drocarbons produced (and remaining reserves) or from the original reserve number (original oil or gas in place) modified by a recovery factor. This results in the volume of gas or oil at

CO2 Storage: Types of Storage Formations, Mechanisms for CO2 Storage and Methods for Assessing Storage Potentials
Wuppertal Institute for Climate, Environment and Energy 73
standard temperature (15°C) and pressure (1,000 hPa) at the surface (STP): Vgas(STP) or Voil(STP). A factor is needed to take the shift of density from reservoir conditions to the sur-face into account. This coefficient is called the gas expansion factor Bg for storage in deplet-ed gas fields and the formation volume factor FVF for oil fields. Additionally, the density of CO2 at reservoir conditions is applied to convert from a volume to a mass of CO2 to be stored. This leads to Equations 4-1 for gas fields and 4-2 for oil fields.
!
mCO 2,theoretical=V gas(STP) "#CO 2
"Bg 4-1
!
mCO 2,theoretical=V oil(STP) "#CO 2
"FVF 4-2
where
mCO2,theoretical = theoretical storage capacity [mCO2,theoretical] = kg;
Vgas(STP) = volume of ultimately recoverable gas at the surface (standard temperature and pressure (STP)), [Vgas(STP)] = m3;
Voil(STP) = volume of ultimately recoverable oil at the surface, [Voil(STP)] = m3;
ρCO2 = density of CO2 at reservoir conditions, [ρCO2] = kg/m3;
Bg = gas expansion factor from reservoir conditions to STP, [Bg] = -;
FVF = formation volume factor, [FVF] = -.
It should be added that this storage capacity in gas and oil fields has to be considered as theoretical as it assumes that 100 per cent of the oil or gas formerly there can be replaced by carbon dioxide. As (hydro-)geological processes take place during and after the depletion of a field, this is a rather optimistic assumption. The CSLF has defined an efficiency factor for hydrocarbon fields (Bachu et al. 2007). This factor is derived from water migration into the field, surface subsidence and the heterogeneity of the geological structure. These effects could lead to a diminution of pore space and thus makes it more realistic to apply an efficien-cy factor on the estimated theoretical capacity. Hendriks et al. (2004) and the IEA GHG (2009) suggest a sweep efficiency of 75 per cent. This can be considered as the average efficiency provided by Holloway et al. (2006) at 65 to 90 per cent. If the intention is to obtain an efficient CO2 storage capacity in hydrocarbon fields, such an efficiency of around 75 per cent should be applied.
Economically, there is another potential way to remove (at least part of) the CO2. CO2 may be used within increased oil or gas recovery (EOR/EGR), when the production rate of the hydrocarbons decreases. If this is undertaken, the storage capacity in oil or gas fields is in-creased by the amount of additionally recovered hydrocarbons, although the CO2 already stored during hydrocarbon production has to be included in this calculation.
4.3.3 Deep Saline Aquifers
The general formula for effective CO2 storage capacity estimation in saline aquifers is based on the top-down approach (compare Vangkilde-Pedersen et al. (2009b)):
!
mCO 2,theoretical=V b"n /g " # " traps% "$CO 2
4-3

CCS global
74 Final Report Part I
where
mCO2 = storage capacity, theoretical or effective, [mCO2] = kg;
Vb = volume of the potential storage site, [Vb ] = m3;
Φ = porosity, [Φ] = %;
n/g = net-to-gross ratio, usable space of a rock, i.e. the percentage of porous and perme-able rock in comparison to the total bulk volume of the aquifer, [n/g] = %;
traps% = amount of traps of total volume, [traps%] = %;
ρCO2 = density of CO2, [ρCO2] = kg/m3.
Firstly, the volume is estimated from the entire sediment area and the average aquifer thick-ness potentially available for CO2 sequestration. The net-to-gross ratio helps to limit this vol-ume to the usable part of the total bulk volume. Most of the scientists dealing with CCS agree that storage in deep saline aquifers has to be limited to closed structures because this in-creases the safety of the operation, facilitates monitoring and could enhance societal ac-ceptance. This factor is expressed by traps%. Additionally, the density of CO2 in reservoir conditions is included in the equation to derive the gravimetric theoretical storage capacity. This unrealistically high capacity assumes that the entire usable pore space (which is water saturated in aquifers) can be filled with CO2. This is not possible and thus an efficiency factor E has been created to reduce this theoretical capacity towards a more realistic one:
!
mCO 2,effective=mCO 2,theoretical
"E 4-4
where
E = efficiency factor, [E] = %.
This efficiency factor is the focus of broad discussions within the international CCS scientist community. Storage capacity estimates range from between 0.01 per cent and 40 per cent, depending on the research (Höller 2009). These strong deviations are largely explained by the assumed volume projections. The variations in other parameters, which may modify this substantial range, should also be taken into account. The most conservative approach is introduced by van der Meer and Egberts (2008). These Dutch scientists regard every geolog-ical system as finite or confined. If this assumption is true, formation water cannot be dis-placed out of the system and storage capacity is controlled by water and rock compressibility (cp+cw) and maximum pressure increase in the system (Δp) (compare Wildenborg et al. 2004). The conservative efficiency is derived from a multiplication of total compressibility and maximum pressure increase by
!
E = (c p+cw) " #p (7.4)
If a total compressibility of 10-3/MPa and a pressure of 1 to 10 MPa is inserted, efficiency values of 0.1 to 1 per cent are derived.
This approach is underlined by Ehlig-Economides and Economides (2010) who give a possi-ble range of 0.01 to 1 per cent and IEA GHG (2009c) who calculate an exemplary efficiency of 0.59 per cent for closed systems.

CO2 Storage: Types of Storage Formations, Mechanisms for CO2 Storage and Methods for Assessing Storage Potentials
Wuppertal Institute for Climate, Environment and Energy 75
These values below 1 per cent are estimated from the allowable pressure increase in the total system and so refer to the entire volume. This does not overcome the limitation that storage of CO2 takes place only in traps, but for capacity calculation, the percentage of traps does not play a role. Thus traps% is set to 1.
Besides the calculation of CO2 capacity in closed systems, there are models to estimate ca-pacity in open systems as well. This is not described further within this study because of the lack of information and uncertainties surrounding the security of the displaced fluids when CO2 is injected; this has persuaded the authors to gravitate towards the conservative effi-ciency option.
It should be stated that the differences between efficiency factors mentioned above are par-tially explained by differing approaches, which puts this into some perspective. If an efficien-cy factor of 0.1 per cent, referring to the total usable pore volume (i.e. the affected space in Fig. 4-7), is compared to an efficiency factor of 20 per cent, for example, referring to the trap volume (i.e. the available space to the spill point in Fig. 4-7), the difference is not as signifi-cant as it appears. If the percentage of traps is 5 per cent (i.e. 5 per cent of the affected space is the available space in Fig. 4-7), the difference between these two scenarios is “just” factor 10 (instead of factor 200). But even a capacity in saline aquifers ten times higher is very notable and could have significant political implications.
Fig. 4-7 Conceptual model of geological CO2 storage
Source: van der Meer and Yavuz (2009)
As explained in section 4.3.1.1, an estimation of capacity would be much more detailed if the necessary data to derive the parameters of Equation 4-3 were measured at a site-specific level. As this is not possible for the countries selected for this study, assumptions have to be made and a general assessment of the parameters is needed.
Specific Storage Density
Different authors have estimated a specific storage density for CO2 storage in deep saline aquifers. Wildenborg et al. (2004) calculated it at 0.2 Mt CO2/km2 for European conditions, which is used by Holloway et al. (2008) to show a possible storage capacity for India. Within
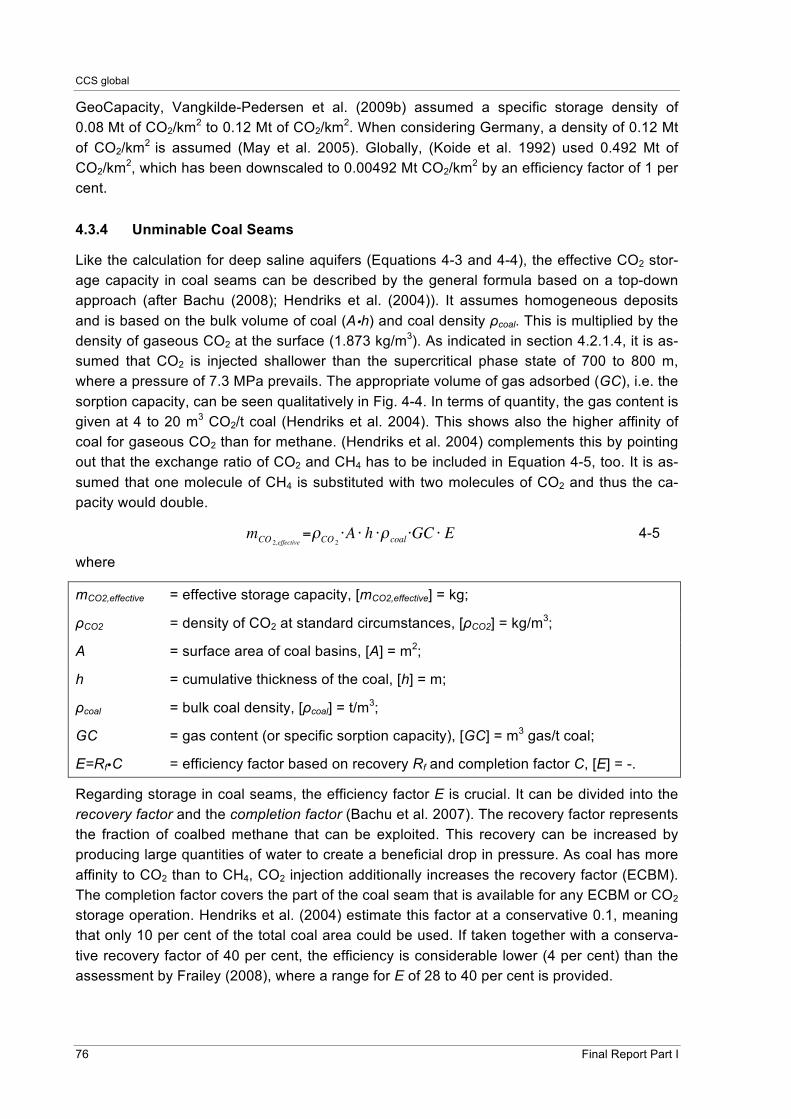
CCS global
76 Final Report Part I
GeoCapacity, Vangkilde-Pedersen et al. (2009b) assumed a specific storage density of 0.08 Mt of CO2/km2 to 0.12 Mt of CO2/km2. When considering Germany, a density of 0.12 Mt of CO2/km2 is assumed (May et al. 2005). Globally, (Koide et al. 1992) used 0.492 Mt of CO2/km2, which has been downscaled to 0.00492 Mt CO2/km2 by an efficiency factor of 1 per cent.
4.3.4 Unminable Coal Seams
Like the calculation for deep saline aquifers (Equations 4-3 and 4-4), the effective CO2 stor-age capacity in coal seams can be described by the general formula based on a top-down approach (after Bachu (2008); Hendriks et al. (2004)). It assumes homogeneous deposits and is based on the bulk volume of coal (A�h) and coal density ρcoal. This is multiplied by the density of gaseous CO2 at the surface (1.873 kg/m3). As indicated in section 4.2.1.4, it is as-sumed that CO2 is injected shallower than the supercritical phase state of 700 to 800 m, where a pressure of 7.3 MPa prevails. The appropriate volume of gas adsorbed (GC), i.e. the sorption capacity, can be seen qualitatively in Fig. 4-4. In terms of quantity, the gas content is given at 4 to 20 m3 CO2/t coal (Hendriks et al. 2004). This shows also the higher affinity of coal for gaseous CO2 than for methane. (Hendriks et al. 2004) complements this by pointing out that the exchange ratio of CO2 and CH4 has to be included in Equation 4-5, too. It is as-sumed that one molecule of CH4 is substituted with two molecules of CO2 and thus the ca-pacity would double.
!
mCO 2,effective="CO 2
#A # h #"coal #GC # E 4-5
where
mCO2,effective = effective storage capacity, [mCO2,effective] = kg;
ρCO2 = density of CO2 at standard circumstances, [ρCO2] = kg/m3;
A = surface area of coal basins, [A] = m2;
h = cumulative thickness of the coal, [h] = m;
ρcoal = bulk coal density, [ρcoal] = t/m3;
GC = gas content (or specific sorption capacity), [GC] = m3 gas/t coal;
E=Rf�C = efficiency factor based on recovery Rf and completion factor C, [E] = -.
Regarding storage in coal seams, the efficiency factor E is crucial. It can be divided into the recovery factor and the completion factor (Bachu et al. 2007). The recovery factor represents the fraction of coalbed methane that can be exploited. This recovery can be increased by producing large quantities of water to create a beneficial drop in pressure. As coal has more affinity to CO2 than to CH4, CO2 injection additionally increases the recovery factor (ECBM). The completion factor covers the part of the coal seam that is available for any ECBM or CO2 storage operation. Hendriks et al. (2004) estimate this factor at a conservative 0.1, meaning that only 10 per cent of the total coal area could be used. If taken together with a conserva-tive recovery factor of 40 per cent, the efficiency is considerable lower (4 per cent) than the assessment by Frailey (2008), where a range for E of 28 to 40 per cent is provided.

CO2 Storage: Types of Storage Formations, Mechanisms for CO2 Storage and Methods for Assessing Storage Potentials
Wuppertal Institute for Climate, Environment and Energy 77
Wildenborg et al. (2004) calculate the amount that can be stored in coalfields through the recovery of coalbed methane. The “producible gas in place” and the exchange ratio of CO2 for methane determine the storage capacity.
4.3.5 Other Possibilities
Underground Coal Gasification
Additionally, underground coal gasification technology with connected storage of carbon di-oxide could increase the estimates. Different authors anticipate plenty of potential for this use of coal in the future (Courtney 2008; Friedmann 2007; Kempka et al. 2009), but it remains very uncertain whether this will become a reality. Also, there is no reliable method of estimat-ing the true potential. Thus UCG will not be included in CO2 storage capacity calculations in this study.
Basalt
Some authors are looking at CO2 sequestration in continental flood basalts (Kumar et al. 2008; McGrail et al. 2006; Schaef et al. 2010; Singh et al. 2006). In India and South Africa, considerable amounts of magmatic basalt deposits can be found onshore. The calculation of India’s storage capacity in basalt traps using a volumetric approach was carried out by Singh et al. (2006). The calculation by McGrail et al. (2006) for the Columbian River is more com-prehensible and is based on the specific basaltic storage density. It is assumed that the area of the Columbian River basalts with 164,000 km2 obtains a capacity of 20 to 100 Gt of CO2 and so a density of 0.12 to 0.6 Mt of CO2/km can be derived. This density range will be ap-plied on the area of the Deccan Basalt formation and the Karroo basalts in the respective sections to achieve a first, very broad estimate of the storage capacity in these basalts.
4.4 Problems and Constraints of CO2 Storage
CCS could be a means of fighting climate change. But there are several difficulties and is-sues particularly relating to the storage of CO2 that must be resolved before this technology could be implemented on a large scale. These obstacles include the potential risk of leakage, not just of CO2, but also the prevailing salt water (section 4.4.1), possible seismic activity resulting from stored CO2 (section 4.4.2) and the question of whether the total storage ca-pacity or the limited allowable injection rate during operations is the real limiting factor of CO2 storage (section 4.4.3).
4.4.1 Leakage
The sole purpose of CCS is to reduce the level of CO2 emissions in the atmosphere. This implies that CO2 storage operations have to be reliable and secure, meaning that the injected gas must remain underground. The IPCC (2005) refers to a maximum acceptable leakage rate of 0.01 per cent per year. This would lead to 99 per cent of CO2 being retained in the formation after one hundred years. Ha-Duong and Loisel (2009), representing various stake-holder perspectives, argue that “zero is the only acceptable leakage rate for geologically stored CO2.” The logic of both arguments can be understood when the spatial scale is in-cluded. Locally, zero emissions must be the goal. Globally, 0.01 per cent leakage may still be allowable when weighed against benefits it would bring to climate change.

CCS global
78 Final Report Part I
If all CO2 was to stay underground, there might be other implications. If injection into water-saturated aquifers takes place, then there are only two possibilities regarding saline water. On the one hand, CO2 injection increases the reservoir pressure and pushes water at the margins out of the structure or system. If monitoring is limited to the CO2 plume, it is not clear what controls the migration of salt water underground. This water could contaminate drinking water or the surface during the decades of CO2 injection at a site. This leakage of water has to be taken very seriously and risks should be assessed as part of the legislative implemen-tation process (IPCC 2005). Potential migration paths of CO2 underground are shown and described in Fig. 4-8.
On the other hand, the saline water may be produced to increase the available pore space for CO2 storage and to control the pressure in the formation (for the sake of pressure reme-diation). This idea is increasingly being discussed within the scientific community (Bradshaw 2010; Hughes 2010). The water produced may then be desalinised, used or deposited into rivers, into the ocean or into a different aquifer. The remaining saltwater, water or salt create another waste disposal problem.
Fig. 4-8 Potential escape and leakage routes for CO2 injected into saline formations Source: IPCC 2005
4.4.2 Seismicity
Induced geological risks include seismicity (earthquakes), volcanic and magmatic activity, hydrothermal activity, hydrological and hydrogeological responses to geological changes and large scale erosion (Bhandari 2006). Regarding events in CISA, India and China in particular have suffered recently from hazardous seismicity with many casualties (earthquakes in East-ern Sichuan (China) in 2007 and India in 2001). It is a contentious issue whether safe and secure storage operations can take place in these regions. Therefore the safety risks must

CO2 Storage: Types of Storage Formations, Mechanisms for CO2 Storage and Methods for Assessing Storage Potentials
Wuppertal Institute for Climate, Environment and Energy 79
be analysed in order to determine how, and to what extent, earthquakes or other geological risks influence CO2 sequestration sites. As part of the selection process of appropriate stor-age areas, this issue must be taken into account (see Beck et al. (2007); Shackley and Ver-ma (2008) for the situation in India).
The BGS (2010) points out that seismicity could lead to problems in CO2 storage operations, but that it is hard to analyse. There are large oil and gas fields in seismically active areas and thus CO2 could be stored there as well. The occurrence of huge earthquakes does increase the risk of leakage, though it does not necessarily mean that the stored CO2 will be ruptured. CTEMPO (2010) adds that extreme seismic events affect the surface more than what lies beneath it. It concludes that seismicity is not really a limiting factor for the storage of CO2.
Beside natural geological hazards, the drilling of wells or CO2 injection may trigger seismicity locally. This has occurred when there has been well drilling for the disposal of hazardous waste or for oil fields (Sminchak and Gupta 2002). However, if the site is carefully selected and the installation, operation and monitoring is done properly, then seismicity could be pre-vented. Such seismicity is most likely where there are existing fractures and faults and if the pressure being applied is too high, causing hydraulic fracturing (Bachu 2008b). Thus, the stress conditions in the subsurface have to be analysed beforehand. Mineral precipitation may reduce permeability and create a build-up of pressure underground if CO2 is injected. This effect could create seismic activity (Sminchak and Gupta 2002). The processes involved are shown in Fig. 4-9.
Fig. 4-9 Processes involved in seismic activity induced by underground injection of CO2 Source: Sminchak and Gupta (2002)

CCS global
80 Final Report Part I
Knowledge gained from experience in understanding factors that induce seismicity from geo-thermal energy generation, underground mining and hydrocarbon production can be applied to CO2 storage operations. National, regional and especially site-specific circumstances have to be included in the risk assessment of any storage operation. In the case of India, there needs to be research into the relationship between storage capacity and seismic events. This is not yet available (Goel 2010).
4.4.3 Injection Rate Constraints
If the total capacity is not considered as a limiting factor, then the timeframe of the injection rate might be. CCS could contribute significantly to CO2 reduction targets if a large quantity of this gas was stored safely each year. This presupposes that sufficient storage sites are available and that, from a technological point of view, there is no strict limit on injecting CO2 into the available structures at the necessary time. The first assumption may well be true, but it is rather uncertain as to whether there are enough good storage sites that could be investi-gated, accredited and prepared in time. Adequate monitoring also has to be assured. This will definitely vary from country to country, but is still not easy to achieve in any country.
The second assumption is also confronted by major difficulties. At just one potential storage site, the operator has had to design the necessary injection strategy and the required number of wells for achieving the injection rate target. Modern storage projects inject scarcely more than 1 Mt of CO2/a. 70 CCS projects in the world today inject a total of 40 Mt of CO2/a (Beck et al. 2007). But it should be added that these projects are still at the R&D stage. When it comes to the commercial application of this technique, adequate storage sites should be big enough to store the emissions of a 1,600 MW power plant with total emissions of up to 400 Mt in 40 years (ZEP 2008). This would indicate that up to 10 Mt of CO2 have to be injected per year and per project. Field experiments and reservoir modelling have to show whether this is possible, bearing in mind the numerous variations in rock characteristics. Among other effects, the pressure build-up at the wells and the pressure regime in the subsurface have to be kept under control. The maximum allowable pressure increase must maintain a faultless seal to ensure a safe long-term operation. This might be supplemented by saline water pro-duction as a pressure remediation option, which has already been discussed in section 4.4.1.
4.5 Aim of Storage Assessment in this Study
Given that the underground storage of CO2 is crucial to the whole CCS process chain, the sections above have shown that there are lots of challenges to be considered when calculat-ing the storage capacity. The formations available for CO2 storage must fulfil several geolog-ical quality properties. These are:
• A minimal available space in the structure;
• A sealing cap rock;
• Sufficiently high porosity and permeability.
The quality of the storage formation depends on the usable volume within the formation. To assess the theoretical capacity, a detailed and site-specific data investigation is needed, which is very difficult to achieve, especially for the studied countries.

CO2 Storage: Types of Storage Formations, Mechanisms for CO2 Storage and Methods for Assessing Storage Potentials
Wuppertal Institute for Climate, Environment and Energy 81
Nevertheless, an air capacity assessment is required for orientation purposes by potential investors and political decision-makers. Considering the general aim of the present study, the storage assessment plays an essential role in determining how relevant CCS could become for China, India and South Africa in the future.
Therefore, the objectives of the analysis are to:
• Systematically analyse and compare existing capacity estimates for the CISA countries with regard to their assumptions, the methodologies applied, the chosen parameters and the data sources;
• Present a range of theoretical capacities;
• Develop three storage scenarios of effective capacities for each country;
• Match the effective capacities of these scenarios with the cumulated amount of CO2 to be captured by 2050, derived from different development pathways of the national energy and industry sector.
Finally, the results of the capacity calculation matched between the CO2 sources and geolog-ical CO2 storage sites yield a range within which CCS might be able to contribute to a reduc-tion of CO2 emissions into the atmosphere.
It should be pointed out that, rather than basing the analysis on new geological data, it uses findings given in the literature. This process is accompanied by both expert interviews and internal reviews conducted by experts in the individual countries. Furthermore, due to a lack of practical experience of injecting CO2 in China, India and South Africa, such general esti-mates can only be rough generalisations and need to be supplemented by evidence from detailed investigations into individual storage structures.

CCS global
82 Final Report Part I
5 Supplementary Technology Assessment of CCS
5.1 Assessment of Reserves
The aim of the reserve assessment is to develop an understanding of the domestic supply potential of coal. For this purpose, reserves are analysed with respect to their changes in recent decades. These data are further disaggregated into regional supply potential and dif-ferentiated according to quality, at least to the greatest extent possible.
Past and present production history is given with detailed data, either of regional production volumes or of company production. A third topic covers coal price developments. Local pric-es are compared with international price developments. Finally, based on price projections of the International Energy Agency, price scenarios are developed for coal import prices up to 2035.
5.2 Economic Assessment
The aim of the economic assessment as part of the supplementary technology assessment of CCS is to conduct a comparative analysis of the long-term development of levelised cost of electricity (LCOE) and the costs of CO2 mitigation for coal-fired power plants with and without CCS in the selected countries. The plant types considered are supercritical, pulver-ised coal (PC) power plants. The analysis is built upon three main methodological principles:
Firstly, it integrates three pathways for the development of coal-fired power plant capacities in India, China and South Africa up to 2050. They are based on the coal development path-ways E1–E3, which are provided for each of the considered countries.
Secondly, the economic assessment uses data from available studies as well as the knowledge of numerous experts, who were interviewed during the course of this project, to define and quantify important cost parameters, such as capital costs and operation and maintenance costs. Whenever possible, country-specific conditions and data have been tak-en into account. This is particularly true for plant capital costs. Plant parameters, such as plant efficiency and the number of annual full load hours, were synchronised with corre-sponding assumptions in other parts of this study.
Thirdly, the economic assessment uses experience curves and learning rates to project the cost development of supercritical PC plants with and without CCS. An experience curve de-scribes how unit costs decline with cumulative production. The progress of cost reduction is expressed by the progress ratio (PR) and the corresponding learning rate (LR). LR and PR used in this study are derived from a report of the IEAGHG Programme (IEAGHG 2006).
5.3 Life Cycle Assessment
For the ecological evaluation of selected system configurations, the method of life cycle as-sessment (LCA) according to ISO 14 040/14.044 is often used2. “LCA addresses the envi-ronmental aspects and potential environmental impacts (for example, use of resources and
2 ISO 14 040:2006: Environmental management – Life cycle assessment – Principles and framework; ISO 14
044:2006: Environmental management – Life cycle assessment – Requirements and guidelines

Supplementary Technology Assessment of CCS
Wuppertal Institute for Climate, Environment and Energy 83
environmental consequences of releases) throughout a product’s life cycle from raw material acquisition through production, use, end-of-life treatment, recycling and final disposal” (ISO 14 040).
The first step of a life cycle assessment, the “goal and scope definition”, is to address the system’s boundaries, its level of detail, the subject of the LCA study as well as its intended purpose (Fig. 5-1).
Fig. 5-1 Stages of a life cycle assessment according to ISO 14 040/14 044
Source: ISO 14 040
The second step of an LCA compares the material and energy flows that enter a system, are converted there and leave it in a different form (input/output balance, “life cycle inventory analysis”). A product LCA thus examines all the material and energy flows caused by a sin-gle product, beginning with the extraction and processing of the raw materials and following the process through manufacturing and use to the product’s eventual disposal (the “cradle-to-grave” approach).
The third step is to calculate the environmental impact of the assessed flows. During this “life cycle impact assessment” it is necessary to “weigh up, aggregate, or generalise flows of dif-ferent materials in different environmental media with different environmental impacts” (Schmidt 1997). Such impact categories are, for example, the global warming potential, the acidification potential or the resource consumption. By applying the results to a functional unit (for example, 1 kWh electricity output at the power plant’s stack), different production processes and the best technology can be selected with regard to an impact category.
In the final step, the “life cycle interpretation”, the results are discussed and serve as a basis for recommendations and political consultation.

CCS global
84 Final Report Part I
5.4 Stakeholder Analysis
Stakeholders are key players in implementing and deploying new and innovative technolo-gies. Hence, analysing the position of key stakeholders regarding the prospects of CCS in India, China and South Africa is an important element of the supplementary assessment of CCS technology. The overall aim of the analysis is to reflect the current state of the CCS debate in the three countries and to draw up a map of key stakeholders.
The analysis is mainly based on research interviews with experts from the national govern-ments, science, industry and societal organisations. The interviews were guided by a ques-tionnaire containing open questions, giving interviewees the opportunity to freely unfold their positions and to identify parameters affecting the prospects of CCS in the respective country. If necessary, the questionnaire is supplemented with questions tailored to the individual ex-pertise of each respondent. The project team has conducted a total of 49 interviews with CCS and energy experts from all three countries. For India and China, the qualitative as-sessment is complemented and concluded with a standard survey in order to reflect the re-spondents’ views on general issues related to CCS. However, the survey by no means claims to be representative due to the small number of participants. In India and China, 22 experts each participated in the survey.

Literature
Wuppertal Institute for Climate, Environment and Energy 85
6 Literature Bachu, S. (2008a): Comparison between Methodologies Recommended for Estimation of CO2 Stor-
age Capacity in Geological Media. Carbon Sequestration Leadership Forum, USDOE Capacity and Fairways Subgroup of the Regional Carbon Sequestration Partnerships Program.
Bachu, S. (2008b): CO2 Storage in Geological Media: Role, Means, Status and Barriers to Deploy-ment. Progress in Energy and Combustion Science 34(2)254–273. doi: 10.1016/j.pecs.2007.10.001.
Bachu, S.; Bonijoly, D.; Bradshaw, J.; Burruss, R.; Christensen, N. P.; Holloway, S.; Mathiassen, O. M. (2007): Task Force for Review and Identification of Standards for CO2 Storage Capacity Esti-mation. Carbon Sequestration Leadership Forum.
Baer, P.; Fieldman, G.; Athanasiou, T.; Kartha, S. (2008): Greenhouse Development Rights: Towards an Equitable Framework for Global Climate Policy. Cambridge Review of International Affairs 21(4)649. doi: 10.1080/09557570802453050.
Bauer, N.; Edenhofer, O.; Leimbach, M. (2009): Low-Stabilisation Scenarios and Technologies for Carbon Capture and Sequestration. Energy Procedia 1(1)4031–4038. doi: 10.1016/j.egypro.2009.02.209.
Beck, R.; Price, Y.; Friedmann, S. J.; Wilder, L.; Neher, L. (2007): Regional Assessment of CO2 Sources and Sinks for the Indian Subcontinent. Proceedings AAPG Annual Meeting 6.
Bellona Foundation (2005): CO2 for EOR on the Norwegian Shelf: A Case Study. Bellona Report. Oslo.
Bellona Foundation (2008): How to Combat Global Warming: An Ambitious but Necessary Approach to Reduce Greenhouse Gas Emissions. Oslo. http://www.bellona.org/reports/How_to_Combat_Global_Warming. Last access: 13 January 2010.
Bentham, M. (2006): An Assessment of Carbon Sequestration Potential in the UK: Southern North Sea Case Study. Working Paper No. 85. Tyndall Centre.
BGS (2010): Interview with a representative of the British Geological Survey (BGS), 21 September 2010 at GHGT-10, Amsterdam.
Bhandari, A. K. (2006): Technical Issues of CO2 Sequestration in Saline Aquifers. Presented at the 2nd Inter-sectoral Interaction Meet on CO2 Sequestration Technology, New Delhi.
Bhattacharya, S. (2009): Coal-fired Power Generation. Need for Common Mechanism to Collect and Report Performance. Presented at the IEA/ISO/IEC Workshop on International Standards to Promote Energy Efficiency, Paris.
BHEL (2006): Underground Coal Gasification (UCG) Power Generation: Drilling in an Indian Mine Location. Presented at the UCG Workshop: US India Energy Dialogue Coal Working Group.
Birkholzer, J. T.; Zhou, Q.; Tsang, C.-F. (2009): Large-scale Impact of CO2 Storage in Deep Saline Aquifers: A Sensitivity Study on Pressure Response in Stratified Systems. Int J of Greenhouse Gas Control 3(2)181–194. doi: 10.1016/j.ijggc.2008.08.002.
Bradshaw, J. (2010): Regional Scale Assessment: Results and Methodology of Queensland CO2 Storage Atlas. Presented at the 2nd EAGE Workshop on CO2 Geological Storage, Berlin.
Bradshaw, J.; Bachu, S.; Bonijoly, D.; Burruss, R.; Christensen, N. P.; Mathiassen, O. M. (2005): Task Force for Review and Identification of Standards for CO2 Storage Capacity Measurement. Car-bon Sequestration Leadership Forum.
Bradshaw, J.; Bachu, S.; Bonijoly, D.; Burruss, R.; Holloway, S.; Christensen, N. P.; Mathiassen, O. M. (2007): CO2 Storage Capacity Estimation: Issues and Development of Standards. International Journal of Greenhouse Gas Control 1(1)62–68. doi: 16/S1750-5836(07)00027-8.

CCS global
86 Final Report Part I
C-TEMPO (2010): Interview with a representative of the Center for Techno-Economic Mineral Policy options (C-TEMPO), Ministry of Mines, 20 October 2010, New-Delhi, India.
Chiyoda Corporation (2011): Preliminary Feasibility Study on CO2 Carrier for Ship-based CCS. Final Report. Canberra: Global Carbon Capture and Storage Institute (GCCSI). http://www.globalccsinstitute.com/publications/preliminary-feasibility-study-co2-carrier-ship-based-ccs. Last access: 21 March 2012.
Christensen, N. P.; Holloway, S. (2004): GESTCO: Geological Storage of CO2 from Combustion of Fossil Fuel. Summary Report. Brussels: European Commission.
Chrysostomidis, I.; Zakkour, P.; Bohm, M.; Beynon, E.; de Filippo, R.; Lee, A. (2009): Assessing Is-sues of Financing a CO2 Transportation Pipeline Infrastructure. Energy Procedia 1(1)1625–1632. doi: 16/j.egypro.2009.01.213.
CO2CRC (2008): Storage Capacity Estimation: Site Selection and Characterisation for CO2 Storage Projects. http://www.co2crc.com.au/dls/pubs/08-1001_final.pdf. Last access: 03 September 2010.
Coleman, D. L. (2009): Transport Infrastructure Rationale for Carbon Dioxide Capture & Storage in the European Union to 2050. Energy Procedia 1(1)1673–1681. doi: 10.1016/j.egypro.2009.01.219.
CONCAWE; EUCAR; European Commission Directorate-General Joint Research Centre (2007): Well-to-Wheel Analysis of Future Automotive Fuels and Powertrains in the European Context. Well-to-Wheels Report No. 2c.
Courtney, R. (2008): Underground Coal Gasification in the Energy Mix. Presentation for the UCG Partnership, Woking.
Davison, J.; Thambimuthu, K. (2009): An Overview of Technologies and Costs of Carbon Dioxide Capture and Storage. Journal of Power and Energy 223(3)201–212.
Day, S.; Fry, R.; Sakurovs, R.; Weir, S. (2010): Swelling of Coals by Supercritical Gases and Its Rela-tionship to Sorption. Energy & Fuels 24(4)2777–2783. doi: 10.1021/ef901588h.
DNV (2010): CO2QUALSTORE: Guideline for Selection and Qualification of Sites and Projects for Geological Storage of CO2. DNV Report No. 2009-1425. Hovik: Det Norske Veritas. http://www.dnv.com/industry/energy/segments/carbon_capture_storage/recommended_practice_guidelines/co2qualstore_co2wells/index.asp. Last access: 03 August 2011.
Dooley, J. J.; Dahowski, R. T.; Davidson, C. L. (2010): CO2-driven Enhanced Oil Recovery as a Step-ping Stone to What? Report No. PNNL-19557. Richland: Pacific Northwest National Laboratory.
Edenhofer, O.; Knopf, B.; Barker, T.; Baumstark, L.; Bellevrat, E.; Chateau, B. et al. (2010): The Eco-nomics of Low Stabilization: Model Comparison of Mitigation Strategies and Costs 31(Special Issue 1).
Ehlig-Economides, C.; Economides, M. J. (2010): Sequestering Carbon Dioxide in a Closed Under-ground Volume. J of Petroleum Science and Engineering 70(1-2)123–130. doi: 10.1016/j.petrol.2009.11.002.
ENCAP (2009): High Temperature O2 Generation for Power Cycles. Enhanced Capture of CO2. http://www.encapco2.org/technoHTO2GPC.htm. Last access: 23 March 2012.
Ennis-King, J.; Paterson, L. (2007): Coupling of Geochemical Reactions and Convective Mixing in the Long-Term Geological Storage of Carbon Dioxide. Int J of Greenhouse Gas Control 1(1)86–93.
EREC; Greenpeace International (2008a): Energy [R]evolution: A Sustainable Global Energy Outlook 2008. Amsterdam: Greenpeace International, European Energy Council. http://www.energyblueprint.info/. Last access: 06 September 2010.

Literature
Wuppertal Institute for Climate, Environment and Energy 87
EREC; Greenpeace International (2008b): Energy [R]evolution: A Sustainable India Energy Outlook. Amsterdam: Greenpeace International, European Energy Council. http://www.energyblueprint.info/764.0.html. Last access: 26 August 2010.
EREC; Greenpeace International (2010): Energy [R]evolution: A Sustainable Global Energy Outlook 2010. Amsterdam: Greenpeace International, European Energy Council. http://www.energyblueprint.info/. Last access: 17 September 2010.
Ewers, J.; Renzenbrink, W. (2005): Bestandsaufnahme und Einordnung der verschiedenen Technolo-gien zur CO2-Minderung. Int J for Electricity and Heat Generation 85(4)46–51.
Figueroa, J. D.; Fout, T.; Plasynski, S.; McIlvried, H.; Srivastava, R. D. (2008): Advances in CO2 Cap-ture Technology: The U.S. Department of Energy’s Carbon Sequestration Program. Int J of Greenhouse Gas Control 2(1)9–20. doi: 10.1016/S1750-5836(07)00094-1.
Fischedick, M.; Esken, A.; Pastowski, A.; Schüwer, D.; Supersberger, N.; Viebahn, P. et al. (2008): RECCS: Ecological, Economic and Structural Comparison of Renewable Energy Technologies (RE) with Carbon Capture and Storage (CCS): An Integrated Approach. Wuppertal, Stuttgart, Berlin: Wuppertal Institute, DLR, ZSW, PIK.
Fischedick, M.; Günster, G.; Fahlenkamp, H.; Meier, H.-J.; Neumann, F.; Oeljeklaus, G. et al. (2006): CO2-Abtrennung im Kraftwerk: Ist eine Nachrüstung für bestehende Anlagen sinnvoll? VGB PowerTech 86(4)108–117.
Flavin, C.; Kitasei, S. (2010): The Role of Natural Gas in a Low-Carbon Energy Economy. Briefing Paper. Natural Gas and Sustainable Energy Initiative. Washington, D.C.: World Watch Institute.
Frailey, S. (2008): Estimation of the Storage Efficiency Factor for Saline Formations: Appendix B. Carbon Sequestration Atlas of the United States and Canada (Vol. Second Edition). U.S. De-partment of Energy and the National Energy Technology Laboratory.
Friedmann, S. J. (2007): Fire in the Hole. Science & Technology Review 2007(04)12–18.
Gale, J. (2005): Sources of CO2. IPCC (Intergovernmental Panel on Climate Change): Carbon Diox-ide Capture and Storage. New York.
Gentzis, T. (2000): Subsurface Sequestration of Carbon Dioxide: An Overview from an Alberta (Cana-da) Perspective. Int J of Coal Geology 43(1-4)287–305. doi: 16/S0166-5162(99)00064-6.
Gilfillan, S. M. V.; Lollar, B. S.; Holland, G.; Blagburn, D.; Stevens, S.; Schoell, M. et al. (2009): Solu-bility Trapping in Formation Water as Dominant CO2 Sink in Natural Gas Fields. Nature 458(7238)614–618. doi: 10.1038/nature07852.
Global CCS Institute (2009): Economic Assessment of Carbon Capture and Storage Technologies. Strategic Analysis of the Global Status of Carbon Capture and Storage.
Goel, M. (2010): Interview with Malti Goel, 19 October 2010, New Delhi, India.
Göttlicher, G. (2004): Energetik der Kohlendioxidrückhaltung in Kraftwerken. No. 421. VDI Progress Reports Series 6.
Graus, W.; Roglieri, M.; Jaworski, P.; Alberio, L. (2008): Efficiency and Capture-readiness of New Fossil Power Plants in the EU. Utrecht.
Greenpeace (2008): Falsche Hoffnung. Warum CO2-Abscheidung und –Lagerung das Klima nicht retten wird. Amsterdam.
Gunter, W. D.; Perkins, E. H.; McCann, T. J. (1993): Aquifer Disposal of CO2-Rich Gases: Reaction Design for Added Capacity. Energy Conversion and Management 34(9-11)948.
Ha-Duong, M.; Loisel, R. (2009): Zero is the Only Acceptable Leakage Rate for Geologically Stored CO2: An Editorial Comment. Climatic Change 93(3-4)311–317. doi: 10.1007/s10584-009-9560-z.

CCS global
88 Final Report Part I
Hamelinck, C. N.; Schreurs, H.; Faaij, A. P. C.; Ruijg, G. J.; Jansen, D.; Pagnier, H. et al. (2001): Po-tential for CO2 Sequestration and Enhanced Coalbed Methane Production in the Netherlands. Utrecht: Novem BV.
Haszeldine, R. S. (2009): Carbon Capture and Storage: How Green Can Black Be? Science 325(5948)1647–1652. doi: 10.1126/science.1172246.
Hendriks, C. (2010): Costs of Carbon Dioxide Capture and Storage. Presented at the Workshop Mozambique: Costs of CCS.
Hendriks, C.; Graus, W.; van Bergen, F. (2004): Global Carbon Dioxide Storage Potential and Costs. Report No. EEP-02001. Utrecht: ECOFYS, TNO.
Herzog, H.; Meldon, J.; Hatton, A. (2009): Advanced Post-combustion CO2 Capture. Paper for the U.S. ‘Clean Air Task Force’.
Höller, S. (2009): Assessment of Methodologies for Estimating the Capacity for Geological Sequestra-tion of CO2 with Special Emphasis on the Capacity Calculation for Germany. Diplom thesis at University of Trier and Wuppertal Institute for Climate, Environment and Energy.
Holloway, S.; Garg, A.; Kapshe, M.; Deshpande, A.; Pracha, A. S.; Khan, S. R. et al. (2008): A Re-gional Assessment of the Potential for CO2 Storage in the Indian Subcontinent. Technical study No. 2008/2. International Energy Agency Greenhouse Gas R&D Programme.
Holloway, S.; Garg, A.; Kapshe, M.; Deshpande, A.; Pracha, A. S.; Khan, S. R. et al. (2009): An As-sessment of the CO2 Storage Potential of the Indian Subcontinent. Energy Procedia 1(1)2607–2613. doi: 10.1016/j.egypro.2009.02.027.
Holloway, S.; Vincent, C. J.; Kirk, K. L. (2006): Industrial Carbon Dioxide Emissions and Carbon Diox-ide Storage Potential in the UK. DTI Cleaner Fossil Fuels Programme Report DTI/Pub URN 06/2027(COAL R308).
Hughes, D. (2010): Aquifer Appraisal & Pressure Management. Presented at the 2nd EAGE Work-shop on CO2 Geological Storage, Berlin.
Hunt, J. M. (1995): Petroleum Geochemistry and Geology (2nd ed.). New York: W.H.Freeman & Co Ltd.
IEA (2008): CO2 Capture and Storage: A Key Carbon Abatement Option. Energy Technology Analy-sis. Paris: International Energy Agency.
IEA (2009a): Energy Technology Transitions for Industry. Strategies for the Next Industrial Revolution. Paris.
IEA (2009b): Technology Roadmap: Carbon Capture and Storage. Paris: International Energy Agency.
IEA (2010): Energy Technology Perspectives 2010 Scenarios and Strategies to 2050. Paris: Interna-tional Energy Agency.
IEA Clean Coal Centre (2010): Clean Coal Technologies: Pulverised Coal Combustion (PCC). Lon-don. http://www.iea-coal.org.uk/site/ieacoal_old/databases/ccts/pulverized-coal-comcustion-pcc. Last access: 28 April 2010.
IEA; OECD (2007): World Energy Outlook 2007. Paris: International Energy Agency, Organisation for Economic Co-operation and Development.
IEA; OECD (2009): World Energy Outlook 2009. Paris: International Energy Agency, Organisation for Economic Co-operation and Development.
IEA; OECD (2010): World Energy Outlook 2010. Paris: International Energy Agency, Organisation for Economic Co-operation and Development.
IEAGHG (2006): Estimating the Future Trends in the Cost of CO2 Capture Technologies. Report No. 6. Cheltenham: International Energy Agency Greenhouse Gas R&D Programme.

Literature
Wuppertal Institute for Climate, Environment and Energy 89
IEAGHG (2007): CO2 Capture Ready Plants. Technical Study No. 4. International Energy Agency Greenhouse Gas R&D Programme.
IEAGHG (2008): CO2 Capture in the Cement Industry. Technical Study No. 2008/3. Cheltenham: In-ternational Energy Agency Greenhouse Gas R&D Programme.
IEAGHG (2009a): Biomass CCS Study. Cheltenham: International Energy Agency Greenhouse Gas R&D Programme.
IEAGHG (2009b): CO2 Storage in Depleted Gas Fields. Technical Study No. 2009/01. Cheltenham: International Energy Agency Greenhouse Gas R&D Programme.
IEAGHG (2009c): Developments of Storage Coefficients for Carbon Dioxide Storage in Deep Saline Formations. Technical Study No. 2009/13. Cheltenham: International Energy Agency Green-house Gas R&D Programme.
IHS CERA (2010): Fueling North America’s Energy Future: The Unconventional Natural Gas Revolu-tion and the Carbon Agenda. IHS CERA Special Report. Cambridge, Massachusetts: Infor-mation Handling Services Cambridge Energy Research Associates. http://press.ihs.com/article_display.cfm?article_id=4211. Last access: 09 February 2010.
IPCC (2005): Special Report on Carbon Dioxide Capture and Storage. Prepared by Working Group III of the Intergovernmental Panel on Climate Change. (B. Metz, O. Davidson, H. de Coninck, M. Loos, and L. Meyer, Eds.). Cambridge, New York: Cambridge University Press.
IPCC (2007): Climate Change 2007. IPCC Fourth Assessment Report (AR4). Geneva: Intergovern-mental Panel on Climate Change.
Jaramillo, P.; Griffin, W. M.; McCoy, S. T. (2009): Life Cycle Inventory of CO2 in an Enhanced Oil Re-covery System. Environmental Science & Technology 43(21)8027–8032. doi: 10.1021/es902006h.
Kempka, T.; Nakaten, N.; Azzam, R.; Schlüter, R. (2009): Economic Viability of In-Situ Coal Gasifica-tion with Downstream CO2 Storage. Glückauf Mining Reporter (1)43–50.
Kharaka, Y. K.; Cole, D. R.; Hovorka, S. D.; Gunter, W. D.; Knauss, K. G.; Freifeld, B. M. (2006): Gas-water-rock Interactions in Frio Formation following CO2 Injection: Implications for the Storage of Greenhouse Gases in Sedimentary Basins. Geology 34(7)577 –580. doi: 10.1130/G22357.1.
Knopf, B.; Edenhofer, O.; Barker, T.; Baumstark, L.; Criqui, P.; Held, A. et al. (2009): The Economics of Low Stabilisation: Implications for Technological Change and Policy. Making Climate Work for Us: ADAM Synthesis Books. Cambridge.
Koide, H.; Tazaki, Y.; Noguchi, Y.; Nakayama, S.; Iijima, M.; Ito, K.; Shindo, Y. (1992): Subterranean Containment and Long-term Storage of Carbon Dioxide in Unused Aquifers and in Depleted Natural Gas Reservoirs. Energy Conversion and Management 33(5-8)626.
Koornneef, J.; van Keulen, T.; Faaij, A.; Turkenburg, W. (2008): Life Cycle Assessment of a Pulver-ized Coal Power Plant with Post-combustion Capture, Transport and Storage of CO2. Int J of Greenhouse Gas Control 2(4)448–467. doi: 10.1016/j.ijggc.2008.06.008.
Krewitt, W.; Teske, S.; Simon, S.; Pregger, T.; Graus, W.; Blomen, E.; Schmid, S.; Schäfer, O. (2009): Energy [R]evolution 2008: A Sustainable World Energy Perspective. Energy Policy 37(12)5764–5775. doi: 10.1016/j.enpol.2009.08.042.
Kumar, B.; Charan, S. N.; Menon, R.; Panicker, S. K. (2008): Geological CO2 Sequestration in the Basalt Formations of Western India: A Feasibility Study. In M. Goel, B. Kumar, and S. N. Charan (Eds.), Carbon Capture and Storage: R&D Technologies for a Sustainable Energy Fu-ture. Hyderabad: Alpha Science International.
Kumar, B.; Mani, D. (2007): India’s Energy Future and Carbon Management. Presented at the 27th Oil Shale Symposium, Colorado School of Mines, Colorado.

CCS global
90 Final Report Part I
Lindfeldt, E. G.; Westermark, M. O. (2009): Biofuel Production with CCS as a Strategy for Creating a CO2 -neutral Road Transport Sector. Energy Procedia 1(1)4111–4118. doi: 16/j.egypro.2009.02.219.
Lucquiaud, M.; Gibbins, J. (2009): Retrofitting CO2 Capture Ready Fossil Plants with Post-combustion Capture: Part1 Requirements for Supercritical Pulverised Coal Plants: Using Solvent-based Fuel Gas Scrubbing. Journal for Power and Energy 223(Part A).
Luhmann, H.-J. (2009): CCS: Ein wirksamer Beitrag zum Klimaschutz? ifo Schnelldienst 6216.
MAERSK (2010): CO2 Transportation and Storage. http://www.maersktankers.com/Activities/Pages/CO2%20Shipping.aspx. Last access: 28 July 2010.
May, F. (2003): GESTCO Final Report: Work Package 2, Study Area F: Coal Mines. Hannover.
May, F.; Müller, C.; Bernstone, C. (2005): How Much CO2 can be Stored in Deep Saline Aquifers in Germany? VGB PowerTech 85(6)32–37.
McCoy, S. T. (2008): The Economics of CO2 Transport by Pipeline and Storage in Saline Aquifers and Oil Reservoirs. Pittsburgh: Carnegie Mellon University. Retrieved from URL: http://wpweb2.tepper.cmu.edu/ceic/theses/Sean_McCoy_PhD_Thesis_2008.pdf.
McGrail, B. P.; Schaef, H. T.; Glezakou, V.-A.; Dang, L. X.; Owen, A. T. (2009): Water Reactivity in the Liquid and Supercritical CO2 Phase: Has Half the Story been Neglected? Energy Procedia 1(1)3415–3419. doi: 10.1016/j.egypro.2009.02.131.
McGrail, B. P.; Schaef, H. T.; Ho, A. M.; Chien, Y.-J.; Dooley, J. J.; Davidson, C. L. (2006): Potential for Carbon Dioxide Sequestration in Flood Basalts. Journal of Geophysical Research 111(B12201). doi: 10.1029/2005JB004169.
McKinsey (2008): Carbon Capture and Storage: Assessing the Economics. McKinsey&Company. assets.wwf.ch/downloads/mckinsey2008.pdf. Last access: 04 February 2012.
van der Meer, L. G. H. (1996): Computer Modelling of Underground CO2 Storage. Energy Conversion and Management 37(6-8)1160.
van der Meer, L. G. H.; Egberts, P. (2008): A General Method for Calculating Subsurface CO2 Stor-age Capacity. Paper for presentation at the 2008 Offshore Technology Conference in Houston OTC 19309.
van der Meer, L. G. H.; Yavuz, F. (2009): CO2 Storage Capacity Calculations for the Dutch Subsur-face. Energy Procedia 1(1)2615–2622. doi: 10.1016/j.egypro.2009.02.028.
Meerman, J. C.; Faaij, A. P. C.; Turkenburg, W. C. (2009): Flexible integrated gasification co-generation facilities A technical and energy analysis. Energy Procedia 1(1)4241–4248. doi: 16/j.egypro.2009.02.235.
Middleton, R. S.; Bielicki, J. M. (2009a): A Comprehensive Carbon Capture and Storage Infrastructure Model. Energy Procedia 1(1)1611–1616. doi: 10.1016/j.egypro.2009.01.211.
Middleton, R. S.; Bielicki, J. M. (2009b): A Scalable Infrastructure Model for Carbon Capture and Stor-age: SimCCS. Energy Policy 37(3)1052–1060. doi: 10.1016/j.enpol.2008.09.049.
MIT (2007): The Future of Coal: Options for a Carbon-constrained World. Boston: Massachusetts In-stitute of Technology.
Möller, F. (2009): CO2 Sink Projekt. GeoForschungsZentrum.
Nalbandian, H. (2009): Performance and Risks of Advanced Pulverized-Coal Plants. Report No. 20/1. Energeia.

Literature
Wuppertal Institute for Climate, Environment and Energy 91
Neele, F.; Mikunda, T.; Seebregts, A.; Santen, S.; van der Burgt, A.; Nestaas, O. et al. (2011): To-wards a Transport Infrastructure for Large-scale CCS in Europe. Executive Summary No. 226317. CO2Europipe. TNO. http://www.co2europipe.eu/. Last access: 21 March 2012.
North, F. K. (1985): Petroleum Geology. Boston: Kluwer Academic Publishers.
Nummedal, D. (2008): The Role of Enhanced Oil Recovery in Reducing Global CO2 Emissions. In M. Goel, B. Kumar, and S. N. Charan (Eds.), Carbon capture and storage: R&D technologies for a sustainable energy future. Hyderabad: Alpha Science International.
NYSDEC (2009): Well Permit Issuance for Horizontal Drilling and High-volume Hydraulic Fracturing to Develop the Marcellus Shale and Other Low-permeability Gas Reservoirs. SGEIS on the Oil, Gas and Solution Mining Regulatory Program. Supplemental Generic Environmental Impact Statement. New York: New York State Department of Environmental Conservation: Division of Mineral Resources. http://www.dec.ny.gov/energy/58440.html. Last access: 13 July 2010.
Paterson, G. (2003): Enhanced Gas Recovery Potential from CO2 Injection into Depleted Dry Gas Reservoirs. Sharp IOR eNewsletter. http://ior.senergyltd.com/issue6/rnd/SMEs/ECL_CO2/ecl_co2.htm. Last access: 03 September 2010.
Piri, M.; Prévost, J. H.; Fuller, R. (2005): Carbon Dioxide Sequestration in Saline Aquifers: Evapora-tion, Precipitation and Compressibility Effects. Presented at the 4th Annual Conference on Car-bon Capture and Sequestration, Princeton: U.S. Department of Energy.
Prasad, P. S. R.; Srinivasa Sarma, D.; Sudhakar, L.; Basavaraju, U.; Singh, R. S.; Begum, Z. et al. (2009): Geological Sequestration of Carbon Dioxide in Deccan Basalts: Preliminary Laboratory Study. Current science 96(2)288–291.
Rootzén, J.; Kjärstad, J.; Johnsson, F. (2009): Assessment of the Potential for CO2 Capture in Euro-pean Heavy Industries. Presented at the 5th Dubrovnik Conference on Sustainable Develop-ment of Energy, Water and Environment Systems, Dubrovnik.
SCCS (2009): Opportunities for CO2 Storage Around Scotland: An Integrated Strategic Research Study. Edinburgh: Scottish Centre for Carbon Storage. http://www.geos.ed.ac.uk/sccs. Last ac-cess: 16 November 2009.
Schaef, H. T.; McGrail, B. P.; Owen, A. T. (2010): Carbonate Mineralization of Volcanic Province Bas-alts. Int J of Greenhouse Gas Control 4(2)249–261. doi: 10.1016/j.ijggc.2009.10.009.
Schmidt, M. (1997): Möglichkeiten der Wirkungsanalyse und Bewertung von Sachbilanzen. In M. Schmidt and A. Häuslein (Eds.), Ökobilanzierung mit Computerunterstützung. Produktbilanzen und betriebliche Bilanzen mit dem Programm Umberto. Berlin: Springer.
Schulze, A. B. (2010): Maersk Tankers, HHI & DNV Joint CO2 Ship Design. MAERSK Press Releases from 7 May 2010. http://www.maersk.com/Press/NewsAndPressReleases/Pages/20100705-120232.aspx. Last access: 28 July 2010.
Shackley, S.; Verma, P. (2008): Tackling CO2 Reduction in India Through Use of CO2 Capture and Storage (CCS): Prospects and Challenges. Energy Policy 36(9)3554–3561. doi: 10.1016/j.enpol.2008.04.003.
Shell (2008): Shell Energy Scenarios to 2050. The Hague: Shell International BV. http://www-stat-ic.shell.com/static/public/downloads/brochures/corporate_pkg/scenarios/shell_energy_scenarios_2050.pdf
Shi, J. Q.; Durucan, S. (2005): CO2 Storage in Deep Unminable Coal Seams. Oil & Gas Science and Technology: Rev. IFP 60(3)558.

CCS global
92 Final Report Part I
Simmonds, M.; Hurst, P.; Wilkinson, M. B.; Watt, C.; Roberts, C. A. (2003): A Study of Very Large Scale Post Combustion CO2 Capture at a Refining & Petrochemical Complex. Proceedings of 6th Conference Greenhouse Gas Control Technologies. http://www.docstoc.com/docs/2371862/A-STUDY-OF-VERY-LARGE-SCALE-POST-COMBUSTION-CO2-CAPTURE-AT-A. Last access: 24 August 2011.
Singh, A. K.; Mendhe, V. A.; Garg, A. (2006): CO2 Sequestration Potential of Geologic Formations in India. Presented at the International Conference on Greenhouse Gas Control Technologies, Trondheim.
Sminchak, J.; Gupta, N. (2002): Issues Related to Seismic Activity Induced by the Injection of CO2 in Deep Saline Aquifers. Journal of Energy and Environmental Research 2(1)32–46.
Stangeland, A. (2007): A Model for the CO2 Capture Potential. Int J of Greenhouse Gas Control 1(4)418–429.
van der Straaten, R.; Elewaut, E.; Koelewijn, D.; Baily, H.; Holloway, S.; Barbier, J. et al. (1996): In-ventory of the CO2 Storage Capacity of the European Union and Norway. Final Report No. CT92-0031. Joule II Project. Nottingham: British Geological Survey.
Van Straelen, J.; Geuzebroek, F.; Goodchild, N.; Protopapas, G.; Mahony, L. (2010): CO2 Capture for Refineries: A Practical Approach. International Journal of Greenhouse Gas Control 4(2)316–320. doi: 10.1016/j.ijggc.2009.09.022.
Tigges, K.-D.; Klauke, F.; Bergins, C.; Buskerus, K.; Niesbach, J.; Ehrmann, M. et al. (2008): Oxyfuel Combustion Retrofits for Existing Power Stations: Bringing ‘Capture Ready’ to Reality. Duis-burg, Basking Ridge: Hitachi Power Europe GmbH, Hitachi Power Systems America, Ltd. http://www.hitachipowersystems.us/supportingdocs/forbus/hpsa/technical_papers/Hitachi_oxyfuel_retrofit_Clearwater2008_final.pdf. Last access: 24 August 2011.
Total (2012): Capture and Geological Storage of CO2: The Lacq Demonstration. http://www.total.com/en/special-reports/capture-and-geological-storage-of-co2/capture-and-geological-storage-of-co2-the-lacq-demonstration-200969.html. Last access: 21 March 2012.
Vallentin, D. (2009): Coal-to-Liquids (CTL): Driving Forces and Barriers – Synergies and Conflicts from an Energy and Climate Policy Perspective. Including Country Studies on the United States, China and Germany and a Foreword by Peter Hennicke. Stuttgart.
Vangkilde-Pedersen, T.; Anthonsen, K. L.; Smith, N.; Kirk, K.; Neele, F.; van der Meer, B. et al. (2009a): Assessing European Capacity for Geological Storage of Carbon Dioxide: The EU Ge-oCapacity Project. Energy Procedia 1(1)2663–2670. doi: 10.1016/j.egypro.2009.02.034.
Vangkilde-Pedersen, T.; Neele, F.; Wojcicki, A.; Le Nindre, Y.-M.; Kirk, K.; Anthonsen, K. L. et al. (2009b): EU GeoCapacity: Storage Capacity. Technical Report D16 WP2 No. SES6-518318. EU GeoCapacity. GEUS.
Vattenfall (2009): Die CCS-Pilotanlage. http://www.vattenfall.de/de/die-pilotanlage.htm. Last access: 23 March 2012.
Viebahn, P.; Esken, A.; Höller, S.; Luhmann, H.-J.; Pietzner, K.; Vallentin, D. (2010): RECCS plus: Comparison of Renewable Energy Technologies (RE) with Carbon Dioxide Capture and Stor-age (CCS). Update and Expansion of the RECCS study. Final Report of Wuppertal Institute on behalf of the German Federal Ministry for the Environment, Nature Conservation and Nuclear Safety. Berlin. www.wupperinst.org/CCS/
Voosen, P. (2010): Researchers Explore ‘Coal Without Mining’ in Bid to Slash CO2-Storage Price Tag. Environment & Energy Daily, News from 16 April 2010. http://www.eenews.net/public/Greenwire/2010/04/16/1. Last access: 17 May 2010.

Literature
Wuppertal Institute for Climate, Environment and Energy 93
WI (2009): Energiewirtschaftliche, strukturelle und industriepolitische Analyse der Nachrüstung von Kohlekraftwerken mit einer CO2-Rückhaltung in NRW. Abschlussbericht 131/41808012 an das Forschungszentrum Jülich GmbH - Projektträger ETN. Wuppertal: Wuppertal Institute for Clima-te, Environment and Energy.
Wildenborg, T.; Gale, J.; Hendriks, C.; Holloway, S.; Brandsma, R.; Kreft, E.; Lokhorst (2004): Cost Curves for CO2 Storage: European Sector. Proceedings of the 7th International Conference on Greenhouse Gas Control Technologies.
Wilkinson, M. B.; Bodem, J. C.; Panesar, R. S.; Allam, R. J. (2001): CO2 Capture via Oxyfuel Firing: Optimization of a Retrofit Design Concept for a Refinery Power Station Boiler. Presented at the 1st National Conference on Carbon Sequestration, Washington, D.C.
ZEP (2008): EU Demonstration Programme for CO2 Capture and Storage (CCS): ZEP’s Proposal. European Technology Platform for Zero Emission Fossil Fuel Power Plants.
Zuo, G.; Hirsch, A. (2008): The Trial of the Top Gas Recycling Blast Furnace at LKAB’s EBF and Scale-up. Proceedings of the ULCOS Seminar.