Embed Size (px)
Citation preview

CARBON DIOXIDE CAPTURE AND STORAGE IN THE CLEAN DEVELOPMENT MECHANISM: ASSESSING MARKET EFFECTS OF INCLUSION
Technical Study
Report Number: 2008/13
Date: November 2008
This document has been prepared for the Executive Committee of the IEA GHG Programme. It is not a publication of the Operating Agent, International Energy Agency or its Secretariat.

INTERNATIONAL ENERGY AGENCY
The International Energy Agency (IEA) was established in 1974 within the framework of the Organisation for Economic Co-operation and Development (OECD) to implement an international energy programme. The IEA fosters co-operation amongst its 26 member countries and the European Commission, and with the other countries, in order to increase energy security by improved efficiency of energy use, development of alternative energy sources and research, development and demonstration on matters of energy supply and use. This is achieved through a series of collaborative activities, organised under more than 40 Implementing Agreements. These agreements cover more than 200 individual items of research, development and demonstration. The IEA Greenhouse Gas R&D Programme is one of these Implementing Agreements.
DISCLAIMER
This report was prepared as an account of work sponsored by the IEA Greenhouse Gas R&D Programme. The views and opinions of the authors expressed herein do not necessarily reflect those of the IEA Greenhouse Gas R&D Programme, its members, the International Energy Agency, the organisations listed below, nor any employee or persons acting on behalf of any of them. In addition, none of these make any warranty, express or implied, assumes any liability or responsibility for the accuracy, completeness or usefulness of any information, apparatus, product or process disclosed or represents that its use would not infringe privately owned rights, including any party’s intellectual property rights. Reference herein to any commercial product, process, service or trade name, trade mark or manufacturer does not necessarily constitute or imply an endorsement, recommendation or any favouring of such products.
COPYRIGHT
Copyright © IEA Greenhouse Gas R&D Programme 2008. All rights reserved.

ACKNOWLEDGEMENTS AND CITATIONS
This report describes research sponsored by the IEA Greenhouse Gas R&D Programme. This report was prepared by: Environmental Resource Management 8 Cavendish Square London W1G 0ER The principal researchers were:
• Paul Zakkour ( project manager) • Emily King • Greg Cook • Naoko Maruyama • Sandeep Rana
To ensure the quality and technical integrity of the research undertaken by the IEA Greenhouse Gas R&D Programme (IEA GHG) each study is managed by an appointed IEA GHG manager. The report is also reviewed by a panel of independent technical experts before its release. The IEA GHG Managers for this report were:
• Tim Dixon • Brendan Beck
The expert reviewers for this report :
• Stefan Bakker – ECN • Wolfgang Heidug – Shell • Frede Cappelen – StatoilHydro
The report should be cited in literature as follows: IEA Greenhouse Gas R&D Programme (IEA GHG) “Carbon Dioxide Capture and Storage in the Clean Development Mechanism: Assessing market effects of inclusion, 2008/13, November 2008”. Further information or copies of the report can be obtained by contacting the IEA GHG Programme at: IEA Greenhouse R&D Programme, Orchard Business Centre, Stoke Orchard, Cheltenham Glos. GL52 7RZ. UK Tel: +44 1242 680753 Fax: +44 1242 680758 E-mail: [email protected] www.ieagreen.org.uk
i
CARBON DIOXIDE CAPTURE AND STORAGE IN THE CLEAN DEVELOPMENT MECHANISM: ASSESSING MARKET EFFECTS OF
INCLUSION
Background A concern raised about the inclusion of CO2 capture and storage (CCS) in the clean development mechanism (CDM) is the negative effect that it may have on the global carbon market due to the increased supply of carbon credits. This is a particular concern because of the size of CCS projects – many potentially likely to be in excess of one million tonnes of CO2 avoided per year. In 2007, Point Carbon undertook a related study for the IEA GHG “CCS and the CER Market” to assess the effect that coal power plants with CCS could have on the global carbon market. This study showed that even with high level uptake of coal fired power plants with CCS (4 plants by 2020 and 288 by 2032), with 20 MtCO2 by 2020, the impact on the global carbon price remains minimal (not exceeding €2/tCO2). This study, however, only considered CCS associated with coal power plant, leaving out CCS applied to any other CO2 source. Also in 2007, the IEA released a report entitled “CCS in the CDM”. In this report they stated that “Widespread uptake of just the short-term CCS opportunities could more than double the current CDM portfolio. If […] CCS facilities become widely used, this could in theory dominate the CDM portfolio in the long-term.” This study was based on a top-down assessment of global technical potential CO2 point sources, with the majority in Kyoto period 1 (2008-2012) coming from natural gas and refineries. For 2012 they suggested some 584 Mt CO2 pa from CCS CDM, which is larger than the current CDM market size, and some 9301 MtCO2 by 2020. Although these figures were given the caveat that this technical potential is very unlikely to be reached due to realistic factors, it does not quantify a more realistic estimate, leaving potentially misleading figures and messages for a wider audience. ECN also published a report late in 2007 “Carbon credit supply potential beyond 2012’ which undertook a bottom-up assessment of a range of mitigation options from 2013 to 2020. They estimated that CCS could provide 158MtCO2 pa by 2020 out of a CDM market of 1600-3200 MtCO2 pa, looking at a range of CO2 sources but did not include natural gas processing. Also this report did not provide any consideration for CCS in Kyoto period 1 (2008-2012). What was required was a study to provide realistic estimates for CCS in the CDM which covers all likely CO2 sources and covering both Kyoto periods 1 and 2, i.e. from 2008 to 2020. It is important that the negotiations on CCS and CDM use a reasonable evidence-base, and it would be very timely to provide a more reasonable estimate of CCS effects on the CDM market in time for the negotiations at COP/MOP4 in December 2008, where a decision is meant to be made on CCS in the CDM.

ii
Method and approach
The research builds on previous assessments – namely by the IEA and ECN - in several ways: firstly, a detailed bottom-up assessment of CO2 emissions from natural gas processing (NGP) operations has been undertaken; second, an assessment of the potential of other CCS “early opportunity” projects is considered, covering sectors such as ammonia, ethanol, and fertiliser production, petroleum refining, and also cement making; thirdly cost estimates for different types of CCS applications across these sectors has been compiled. These were then compared with published estimates of emission reduction potentials for other possible candidate CDM abatement options, such as renewable energy, energy efficiency, waste to energy and forestry-based projects. This was used to provide a basis for assessing market effects by comparing cost ordered marginal abatement costs on a portfolio basis with and without CCS. Included in this portfolio assessment were assumptions for realistic deployment scenario factors for CCS (eg time to develop different project types) and the other technologies. Assessments were made for two periods: 2012 and 2020. The detailed bottom-up estimates of emissions from NGP, the comparative costing exercise, the deployment scenario factors, and the market effects analysis represent important new contributions to the debate on this matter.
Results and Analysis
The analysis suggests that “early opportunity” projects have a total technical potential that could apply CCS in 2012 of around 1.24 GtCO2, comprising 219 MtCO2 in natural gas processing and 1020 MtCO2 in other sectors. Abatement costs across the sectors are in the range $18-138 per tCO2 abated, the lowest being for natural gas processing and the highest in cement production. In 2020, total abatement potential in natural gas processing increases to 314 MtCO2, whilst due to the absence of information on forecast emissions in the other sectors (cement aside), these are assumed to be the same as in 2012. Increases in emissions from cement production are expected to be higher than used in this analysis, although the total potential is unlikely to be realised as retrofitting cement plants will typically involve a full refurbishment. A small portion of fossil fuel fired power sector potential (121 MtCO2) was also included in the 2020 assessment, drawing on estimates for CCS deployment in published literature. This resulted in 1.45 GtCO2 of CCS technical potential in 2020. Abatement cost estimates are also assumed to remain the same in all sectors to 2020, with the exception of natural gas processing, for which costs reduce to $14 per tCO2 abated. This is a consequence of variations in project field lives and the scale of new fields expected to come on stream over this period, which serves to increase investment periods (thus reducing annual loan instalment costs), whilst bigger projects allow for economies of scale to be realised. A portfolio of other candidate CDM abatement options was developed from published literature. These data suggested that around 2.3 GtCO2 abatement potential is available in these sectors in 2012, rising to 3.7 GtCO2 in 2020. The integrated datasets provided the basis for assessing market impacts of CCS, based on changes in the marginal cost of abatement at different levels of CER supply. A range of sensitivities were applied to the base data in order to provide more realistic estimates of deployment levels. Results suggest that no CCS would be deployed before 2012 at current estimates of CER supply and demand over the first Kyoto commitment period (estimated to be around 360 M CERs per year to 2012). The analysis suggested that

iii
CCS projects would only compete with other CDM candidate options at the margin if demand exceeds about 520 M CERs per year to 2012 (see figure below). Marginal abatement cost curves can also be interpreted taking a perspective of carbon market price, reading off of the cost of abatement. This is a useful exercise, as the price of CERs in the international carbon market is not primarily driven by marginal abatement costs in non-Annex I countries, but the marginal abatement cost in Annex I countries (or trading schemes therein such as the EU Emissions Trading Scheme). In other words, taking into account restrictions on CER supply, if it is marginally cheaper to abate in non-Annex I countries, the price will be determined by Annex I country marginal abatement costs, minus profit margin, transaction costs and other risk-based factors relating to things such as non-delivery risk. This means that true price discovery is not necessarily achieved in the CDM market, as the CER price tends to be higher than the marginal cost of CER supply (i.e. the lowest cost abatement options are not deployed in cost-ordered way as the cost of abatement in Annex I countries is higher than in non-Annex I countries). Consequently, on the basis of CER price estimation (assumed in the range $13-14 per CER for this study), CCS could potentially contribute 0-63 MtCO2 of abatement potential by 2012. This would be equal to between 0-16 percent of total CER supply at the estimated level of demand. This compares to the current 27 percent of CDM market share occupied by industrial gases (HFC-23, N2O and PFC destruction; 132.6 M CERs per year) and 18 percent from CH4 based projects (94.5 M CERs per year).
Combined scenario MAC curves – 2012 (detail)
In 2020, CER demand forecasts are difficult to make due to inherent uncertainties about the carbon market beyond 2012 (and price forecasts even harder still, so they are not done for this timescale). The study adopted a figure for demand of 2,100 MCERs per year in 2020, based on published research on potential CER supply in 2020. At this level of demand, CCS would be deployed at levels in the range
$0
$5
$10
$15
$20
$25
$30
300 400 500 600 700 800
Abat
emen
t C
ost (
$/tC
O2)
MCER Potential / MtCO2 abatement
Non-CCS MACC 2012
Combined MACC 2012 LOW
Combined MACC 2012 MED
Combined MACC 2012 HIGH

iv
117-314 MtCO2 per year. This would represent between 6-9 percent of total CER supply, which compares to the current 27 percent of CDM market share occupied by industrial gases (HFC-23, N2O and PFC destruction) and 19 percent from CH4 based projects. Deployment, and subsequently price effects at the margin, would only occur at levels of CER demand in excess of about 1,600 MCERs per year (see figure below).
Combined scenario MAC curves – 2020 (detail)
$0
$10
$20
$30
$40
$50
$60
$70
$80
$90
$100
1000 1500 2000 2500 3000 3500
Abat
emen
t Co
st ($
/tCO
2)
MCER Potential / MtCO2 abatement
Non CCS MACC 2020
Combined MACC 2020 LOW
Combined MACC 2020 MED
Combined MACC 2020 HIGH
The marginal price effect on CERs from CCS inferred by these data is a cost reduction per CER of between $24-30 at demand levels of 2,100 MCERs per year, equal to about a 47-60 percent reduction, although these estimates must be treated with care. Such significant price effects are only seen should demand exceed around 2,000 MCERs per year, as indicated in the graph above. This does however mean that CCS will significantly reduce the overall abatement costs for emissions reductions beyond 2,000MCERs per year. Interpretation of this analysis is hampered by the aggregated nature of the abatement potential and cost estimates for different technologies (i.e. large tranches of abatement at homogenous cost), which can suggest significant divergence in abatement costs for given level of abatement when two different technologies compete at the margin. For example, the long flat-line in the centre of the graph above (at $50) is linked to an assumed cost and potential for reducing emissions from deforestation and degradation (REDD)in 2020 of $50 per tCO2 abated and 0.35 GtCO2 total potential. These data serve to affect the results quite significantly. It is also dependent on the margin selected; at 1,900M CER demand, little or no price effects are apparent. Moreover, in reality, individual projects are subject to their own specific cost considerations, and will vary within a spectrum of costs around the average cost of abatement used here, meaning these effects does not exist in practice. Moreover, there are significant uncertainties associated with the cost and potential estimates, particularly for non-CCS options. On this basis, the results should be treated with caution when interpreting carbon market price impacts. The effects on average abatement cost for a given reduction were also calculated (equivalent to the sum of the area under the curve divided by the abatement potential). This provides an indication of
v
the potential for CCS to reduce overall abatement costs. This analysis suggested that CCS could reduce the weighted average cost of abatement in non-Annex I countries by around $1.8-2.3 per tCO2. The medium-term (to 2020) total expenditure would be around $3 billion on CCS technologies under the CDM at a weighted average marginal abatement cost of around $17 per tCO2 abated.
Discussion
The results presented infer potential CER price impacts from CCS, although caution is warranted when considering the CER price effects, given the nature of data used and the uncertainty regarding cost estimates. Moreover, the study is subject to range of limitations which cannot be easily modelled at the present time, and thus the technical abatement potential for CCS described here should be considered as a conservative estimate at the upper end of the range of potential deployment. Limitations of the study include:
• Other CCS applications: the research did not consider EOR or application of CCS in sectors such as synthesis fuel production. EOR was excluded as it is extremely difficult to try and gauge its effect on CCS deployment, principally as the technology does not impact technical abatement potential, but rather, the costs of deployment for different CCS project-types within certain niches.
• Storage capacity: The study did not consider any major limitations on storage availability, other than consideration of transport of CO2 over distances exceeding 500km in some circumstances.
• Technical and economic barriers to deployment: NGP CCS projects would not face as significant technical barriers as other projects. This is because they are highly likely to be in close proximity to potential storage sites (such as depleted gas fields), and in-house expertise would be readily available for development of surface and subsurface technical parts of the project. In other sectors, technical barriers will be more significant. Pipeline infrastructure development also presents a significant constraint on potential deployment.
• Non-technical barriers to deployment: development of institutional capacity to approve CCS projects, and the removal of legal impediments and the creation of legal frameworks for CCS are also likely to pose a significant barrier to deployment in the near- to medium term (to 2020). It was not possible to effectively consider this in the research undertaken.
On the other hand, a range of factors may also serve to enhance deployment of CCS ahead of the cost curve. These include industry flagship projects such as the proposed Masdar project in Abu Dhabi, a proposed CCS CDM project by Shell, and technical demonstration projects in developing countries, such as the UK-China NZEC project. An important point to note is that for process emissions from natural gas production there may not be any alternative abatement option other than CCS. At the time of writing, the European Union has proposed a pilot phase for CCS under the CDM. The approach is based on allowing a restricted number of projects within the CDM in the first instance, which could allow for a better understanding of the range of issues posed by CCS inclusion within the CDM in a learning-by-doing context, whilst limiting concerns about market effects. The analysis presented herein suggests an approach whereby a maximum ‘creditable tonnage’ of CCS projects may be developed, and proposes a figure of 15-20 MtCO2 per year as a possible starting point.

vi
The focus of the report is on the effects of CCS inclusion on the carbon market. However, there may be some significant benefits offered by including CCS in the CDM, based around what are considered the two main challenges to realising CCS in the medium-term: firstly technical innovation and cost reduction efforts needed with capture of CO2 from dilute flue gas streams from fossil-fuel fired power plants; secondly, proving the technical efficacy of large-scale subsurface storage of CO2, and the capacity building needs and legal and regulatory developments required. The first issue is subject to considerable research efforts in Annex I countries at present, with a view to getting demonstration projects running by 2015. The second could be overcome in parallel by focussing on early opportunities for CCS application, which are not subject to the technical challenges posed by the first. Many of these opportunities, especially in NGP operations, are located in non-Annex I countries, as highlighted by the research undertaken here. The spillover learning effects from deployment of these projects could support convergence of the two areas of research in the future, resulting in a second phase of deployment focussed on the fossil-fuel power sector, perhaps from 2025 onwards. CDM could provide useful bridging finance to support a CCS technology development pathway over the next 15-20 years. In addition, the impact on CER price in 2020 could be viewed as CCS starting to deliver the lower cost emission reductions which it is forecast to do in the longer term, and which the world needs to combat climate change.
Expert Group Comments
The draft report on the study was sent to a number of expert reviewers. The study was generally well received by the reviewers. Most of the comments received were general in nature and referred to general issues on the report contents which have been addressed by the contractors in the final draft of the report. These issues, which were not fundamental in their nature, were discussed by the contractors and the IEA GHG project manager concerned and, where appropriate, modifications to the reports contents were agreed and then implemented by the contractor.
Conclusions Over the Kyoto Commitment period, analysis undertaken under CER demand estimates suggests that no CCS would be deployed before 2012 at current estimates of CER supply and demand (estimated to be around 360 MCERs per year to 2012). The research suggests CCS would only become cost competitive with other CDM candidate options at the margin if demand exceeds about 520 MCERs per year to 2012. However, the analysis allows interpretation from a price perspective, and on the basis of CER price estimation, (at $13-14 per CER), CCS could contribute between 0-63 MtCO2 of abatement potential by 2012. This would be equal to around 0-16 percent of total CER supply at the estimated level of demand. This compares to the current 27 percent of CDM market share occupied by industrial gases (HFC-23, N2O and PFC destruction; 132.6 MCERs per year) and 18 percent from CH4 based projects (94.5 MCERs per year). For 2020, analysis undertaken under CER demand assuming an annual demand of 2,100 MCERs in 2020, CCS would be deployed under the CDM, with total levels in the range 117-314 MtCO2 per year. This would represent between 6-9 percent of total CER supply. Price effects at the margin would only occur if

vii
CER demand exceeds about 1,600 MCERs per year. The marginal price effect on CERs in 2020 from CCS inferred by the analysis is a cost reduction per tCO2 abated of between $24-30 at demand levels of 2,100 MCERs per year, equal to about a 47-60 percent reduction, but these estimates must be treated with care. Such significant price effects are only seen should demand exceed around 2,000 MCERs per year. This does however mean that CCS will significantly reduce the overall abatement costs for emissions reductions beyond 2,000MCERs per year. The research has not been able to integrate the full range of technical, economic, and non-technical constraints faced by CCS over the time period under consideration. These must be overcome to realise wider deployment of CCS, and will likely constrain the technical abatement potential estimated in this research. On this basis, and despite the estimated abatement cost effects at the margin, it is possible to conclude that the inclusion of CCS in the CDM may not have any significant ramifications for the global carbon market or other CDM technologies in the near- or medium-term. In fact, the marginal price effects at 2020 show that CCS is progressing to deliver its expected low-cost emissions reductions for the world. There is scope to proceed with caution if concerns over market stability ensue. This can potentially be achieved by adopting the option for a CCS CDM pilot phase up to 2012, possible through the capping of a maximum tonnage of CO2, perhaps coupled with a minimum number of projects in order to enhance equitable distribution of potential projects. A maximum creditable tonnage of 15-20 MtCO2 per year to 2012 is proposed as a possible option. Such levels of deployment would lead to minimum price effects, accounting for around 5 percent of the total CER supply. This analysis also suggests that these projects would not be competitive with other potential CDM candidate technologies at the margin over this period. It would therefore likely be restricted to the engagement to a few niche players looking to deploy CCS projects ahead of the cost curve. Furthermore, the potential benefits of CCS inclusion within the CDM should be considered. The near-term incentive offered by CDM can help to stimulate investment into early opportunity CCS projects (ie natural gas processing and LNG), which would provide important spillover learning effects for a second phase of deployment, which would be focussed on the fossil-fuel fired power sector.

FINAL REPORT
IEA Greenhouse Gas R&D Programme
Carbon Dioxide Capture and Storage in the Clean Development Mechanism: Assessing market effects of inclusion
November 2008
Prepared by: Paul Zakkour, Emily King, Greg Cook, Naoko Maruyama, Sandeep Rana
For and on behalf of Environmental Resources Management Approved by: Charles Allison Signed: Position: Partner Date: 13th November 2008
This report has been prepared by Environmental Resources Management the trading name of Environmental Resources Management Limited, with all reasonable skill, care and diligence within the terms of the Contract with the client, incorporating our General Terms and Conditions of Business and taking account of the resources devoted to it by agreement with the client. We disclaim any responsibility to the client and others in respect of any matters outside the scope of the above. This report is confidential to the client and we accept no responsibility of whatsoever nature to third parties to whom this report, or any part thereof, is made known. Any such party relies on the report at their own risk.

ENVIRONMENTAL RESOURCES MANAGEMENT IEA GHG
I
EXECUTIVE SUMMARY III
1 INTRODUCTION 1
1.1 BACKGROUND TO THE ISSUE 1 1.2 AIMS AND OBJECTIVES 3 1.3 APPROACH AND METHODOLOGY 4
2 CO2 EMISSIONS AND CCS DEPLOYMENT COSTS IN NATURAL GAS PROCESSING 6
2.1 INTRODUCTION 6 2.2 APPROACH 6 2.3 TECHNICAL POTENTIAL 7 2.4 ECONOMIC POTENTIAL 10 2.5 INTEGRATING TECHNICAL AND ECONOMIC POTENTIAL 15
3 CO2 EMISSIONS AND COSTS IN OTHER ACTIVITIES 19
3.1 INTRODUCTION 19 3.2 APPROACH 19 3.3 TECHNICAL POTENTIAL 20 3.4 ECONOMIC POTENTIAL 21 3.5 INTEGRATING TECHNICAL AND ECONOMIC POTENTIAL 26
4 COSTS AND POTENTIAL FOR OTHER CDM TECHNOLOGIES 27
4.1 INTRODUCTION 27 4.2 APPROACH AND METHOD 27 4.3 MARGINAL ABATEMENT COSTS AND POTENTIAL IN 2012 28 4.4 MARGINAL ABATEMENT COSTS AND POTENTIAL IN 2020 30 4.5 2012 & 2020 MACCS: EXTRAPOLATION ACROSS ALL NON-ANNEX I REGIONS 32 4.6 DEVELOPING REALISTIC TECHNICAL POTENTIAL ESTIMATES 34
5 COMBINED RESULTS 35
5.1 INTRODUCTION 35 5.2 MAC CURVES FOR CCS 35 5.3 INTEGRATED ABATEMENT FOR ALL POTENTIAL CDM TECHNOLOGIES 37
6 ASSESSMENT OF MARKET IMPACTS OF CCS INCLUSION IN THE CDM 42
6.1 INTRODUCTION 42 6.2 CER DEMAND AND PRICES 42

ENVIRONMENTAL RESOURCES MANAGEMENT IEA GHG
II
6.3 SUBSTITUTION EFFECTS 43 6.4 SENSITIVITY ANALYSIS 43
7 DISCUSSION 54
7.1 SUMMARY OF MARKET EFFECTS 54 7.2 FACTORS LIMITING DEPLOYMENT 55 7.3 FACTORS POTENTIALLY ENHANCING DEPLOYMENT 58 7.4 CCS IN CDM 58
8 CONCLUSIONS 63
APPENDIX A DETAILED COST METHODOLOGY A.1

ENVIRONMENTAL RESOURCES MANAGEMENT IEA GHG
III
EXECUTIVE SUMMARY
Introduction
This report provides analysis on the potential impacts that inclusion of carbon dioxide capture and storage (CCS) as a clean development mechanism (CDM) project activity could have on the global carbon market. It has been undertaken in response to concerns raised about the possibility that CCS inclusion could result in the flooding of the carbon market with certified emission reduction (CERs) from CCS project activities, given the enormous scale of emission reductions potentially achievable. Method and approach
The research builds on previous assessments – namely by the IEA and ECN - in several ways: firstly, a detailed assessment of carbon dioxide (CO2) emissions from natural gas processing (NGP) operations has been undertaken; second, an assessment of the potential of other CCS “early opportunity” projects is considered, covering sectors such as ammonia, ethanol, and fertiliser production, petroleum refining, and also cement making; thirdly bottom-up cost estimates for different types of CCS applications across these sectors has been compiled. These were then compared with published estimates of emission reduction potentials for other possible candidate CDM abatement options, such as renewable energy, energy efficiency, waste to energy and forestry-based projects. This was used to provide a basis for assessing market effects by comparing cost ordered marginal abatement costs on a portfolio basis with and without CCS. Assessments were made for two periods: 2012 and 2020. The detailed estimates of emissions from NGP, the detailed bottom-up costing exercise, and the market effects analysis represent important new contributions to the debate on this matter. Results
The analysis suggests that “early opportunity” projects have a total CCS technical potential in 2012 of around 1.24 GtCO2, comprising 219 MtCO2 in natural gas processing and 1020 MtCO2 in other sectors. Abatement costs across the sectors are in the range $18-138 per tCO2 abated, the lowest being for natural gas processing and the highest in cement production. In 2020, total technical abatement potential in natural gas processing increases to 314 MtCO2, whilst due to the absence of information on forecast emissions in the other sectors (cement aside), technical potential is assumed to be the same as in 2012. Increases in emissions from cement production are expected to be higher than used in this analysis, although the total potential is unlikely to be realised as retrofitting cement plants will typically involve a full refurbishment. A small portion of fossil fuel fired power sector technical CCS abatement potential (121 MtCO2) was also included in the 2020 assessment, drawing on estimates of CCS deployment in published literature. This resulted in a total of 1.45 GtCO2 of CCS technical potential in 2020. Abatement

cost estimates are also assumed to remain the same in all sectors to 2020, with the exception of natural gas processing, for which costs reduce to $14 per tCO2 abated. This is a consequence of variations in project field lives and the scale of new fields expected to come on stream over this period, which serves to increase investment periods (thus reducing annual loan instalment costs), whilst bigger projects allow for economies of scale to be realised. The portfolio of other candidate CDM abatement options developed from published literature suggested that around 2.3 GtCO2 annual technical abatement potential is available in these sectors in 2012, rising to 3.7 GtCO2 in 2020. These data formed the base case set to which analysis was applied. Under the base case, CCS is not competitive with other CDM technologies until CER demand exceeds 2,600 MCERs per year in 2020, and significant cost effects are only noticeable beyond 3,000 MCERs per year (see figure below).
Combined scenario MAC curves – 2020 Base Case (detail)
Analysis
The integrated datasets provided the basis for assessing market impacts of CCS, based on changes in the marginal cost of abatement at different levels of CER supply, and on estimates of CER prices. A range of sensitivities were applied to the base data in order to provide more realistic estimates of deployment levels (i.e. application of constraints on the technical potential of both CCS and non-CCS project options). Results suggest that on the basis of CER supply costs and estimated demand, no CCS would be deployed before 2012 over the Kyoto Commitment period (estimated to be around 360 MCERs per year to 2012) as it is not cost competitive with other technologies at this
ENVIRONMENTAL RESOURCES MANAGEMENT IEA GHG
IV
$0
$10
$20
$30
$40
$50
$60
$70
$80
$90
$100
2000.0 2200.0 2400.0 2600.0 2800.0 3000.0 3200.0 3400.0
Abat
emen
t Cos
t ($/
tCO
2)
MCER Potential / MtCO2 Abatement
Non CCS MACC 2020
Combined MACC 2020 - BASE

level of CER supply (1). The analysis suggested that CCS projects would only compete with other CDM candidate options at the margin if supply (or demand) exceeds about 520 MCERs per year to 2012 (see figure below). Marginal abatement cost curves can also be interpreted taking a perspective of carbon market price, reading off of the cost of abatement. This is a useful exercise, as the price of CERs in the international carbon market is not primarily driven by marginal abatement costs in non-Annex I countries, but the marginal abatement cost in Annex I countries (or trading schemes therein such as the EU Emissions Trading Scheme). In other words, taking into account restrictions on CER supply, if it is marginally cheaper to abate in non-Annex I countries, the price will be determined by Annex I country marginal abatement costs, minus profit margin, transaction costs and other risk-based factors relating to things such as non-delivery risk. This means that true price discovery is not necessarily achieved in the CDM market, as the CER price tends to be higher than the marginal cost of CER supply (i.e. the lowest cost abatement options are not deployed in cost-ordered way as the cost of abatement in Annex I countries is higher than in non-Annex I countries). Consequently, on the basis of CER price estimation (assumed in the range $13-14 per CER for this study), CCS could potentially contribute 0-63MtCO2 of abatement potential by 2012. This would be equal to between 0-16 percent of total CER supply at the estimated level of demand. This compares to the current 27 percent of CDM market share occupied by industrial gases (HFC-23, N2O and PFC destruction; 132.6 M CERs per year) and 18 percent from CH4 based projects (94.5 M CERs per year).
Combined scenario MAC curves – 2012 (detail)
ENVIRONMENTAL RESOURCES MANAGEMENT IEA GHG
V
(1) It is important to note that CER prices are not necessarily driven by supply costs, but rather by marginal abatement costs in Annex I regions or trading schemes therein (i.e. the EU Emissions Trading Scheme and the price of EU Allowances).
$0
$5
$10
$15
$20
$25
$30
300 400 500 600 700 800
Abat
emen
t C
ost (
$/tC
O2)
MCER Potential / MtCO2 abatement
Non-CCS MACC 2012
Combined MACC 2012 LOW
Combined MACC 2012 MED
Combined MACC 2012 HIGH

In 2020, CER demand and price forecasts are difficult to make due to inherent uncertainties about the future of the carbon market beyond 2012, particularly price forecasts. Consequently the study did not consider potential CER prices beyond 2012, and adopted a figure of 2,100 MCERs of demand per year in 2020, based on published research on potential CER supply, and an assumption that demand would be equal to supply over the period. At this level of demand, CCS would be deployed at levels in the range 117-314 MtCO2 per year, representing between 6-9 percent of total CER supply in this period. . Deployment, and subsequently price effects at the margin, would only occur at levels of CER demand in excess of about 1,600 MCERs per year (see figure below). The marginal price effect on CERs from CCS inferred by these data is a cost reduction per CER of between $24-30 at demand levels of 2,100 MCERs per year, equal to about a 47-60 percent reduction, although these estimates must be treated with care. Such significant price effects are only seen should demand exceed around 2,000 MCERs per year, as indicated in the graph above. Interpretation of this analysis is hampered by the aggregated nature of the abatement potential and cost estimates for different technologies (i.e. large tranches of abatement at homogenous cost), which can suggest significant divergence in abatement costs for given level of abatement when two different technologies compete at the margin. For example, the long flat-line in the centre of the graph above is linked to an assumed cost and potential for REDD in 2020 of $50 per tCO2 abated and 0.35 GtCO2 total potential. These data serve to skew the results quite significantly.
Combined scenario MAC curves – 2020 (detail)
ENVIRONMENTAL RESOURCES MANAGEMENT IEA GHG
VI
$0
$10
$20
$30
$40
$50
$60
$70
$80
$90
$100
1000 1500 2000 2500 3000 3500
Abat
emen
t Co
st ($
/tCO
2)
MCER Potential / MtCO2 abatement
Non CCS MACC 2020
Combined MACC 2020 LOW
Combined MACC 2020 MED
Combined MACC 2020 HIGH
ENVIRONMENTAL RESOURCES MANAGEMENT IEA GHG
VII
It is also dependent on the margin selected; at 1,900 MCER demand, little or no price effects are apparent. Moreover, in reality, individual projects are subject to their own specific cost considerations, and will vary within a spectrum of costs around the average cost of abatement used here, meaning these effects are less amplified in practice. Moreover, there are significant uncertainties associated with the cost and potential estimates, particularly for non-CCS options. On this basis, the results should be treated with care when interpreting carbon market price impacts. The effects on average abatement cost for a given reduction were also calculated (equivalent to the sum of the area under the MAC curve divided by the abatement potential). This provides an indication of the potential for CCS to reduce overall abatement costs. This analysis suggested that CCS could reduce the weighted average cost of abatement in non-Annex I countries by around $1.8-2.3 per tCO2. In the medium-term (to 2020) total expenditure would be around $3 billion per year on CCS technologies under the CDM at a weighted average marginal abatement cost of around $17 per tCO2 abated. Discussion
The results presented infer potential CER price impacts from CCS, although care is warranted when considering these effects, given the nature of data used and the uncertainty regarding cost estimates. Moreover, the study is subject to range of limitations which cannot be easily modelled at the present time despite efforts to apply sensitivities, and thus the abatement potential for CCS described here should be considered as a conservative estimate at the upper end of the range of potential deployment. Limitations of the study include:
• Hidden costs: such as research and capacity building needs to support CCS deployment;
• Storage capacity: The study did not consider any major limitations on storage availability, other than consideration of transport of CO2 over distances exceeding 500km in some circumstances;
• Technical and economic barriers to deployment: NGP CCS projects would not face as significant technical barriers as other projects. This is because they are highly likely to be in close proximity to potential storage sites (such as depleted gas fields), and in-house expertise would be readily available for development of surface and subsurface technical parts of the project. However, they will face considerable economic barriers, given the opportunity cost of investing in CCS relative to investing in new gas or oil field developments. In other sectors, technical barriers will be more significant. Indeed, these sectors are likely to only export captured CO2 to other operators for the purpose of storage(e.g. NGP operators), and are thus contingent on the evolution of CCS in other sectors prior to deploying CCS. This could be hampered by CDM accounting rules, which pose challenges to multiple operators storing in a single CO2 storage site, as this presents issues around joint liabilities in the possible event of releases of stored CO2. Pipeline infrastructure development also presents a

ENVIRONMENTAL RESOURCES MANAGEMENT IEA GHG
VIII
significant constraint on potential deployment. Establishing CO2 pipeline corridors will take many years of planning and evaluation, considerably extending project lead times;
• Non-technical barriers to deployment: development of institutional capacity to approve CCS projects, and the removal of legal impediments and the creation of legal frameworks for CCS are also likely to pose a significant barrier to deployment in the near- to medium term (to 2020). It was not possible to effectively consider this in the research undertaken.
• Other CCS applications: the research did not consider enhanced oil recovery (EOR) or application of CCS in other sectors, such as synthesis fuel production. EOR was excluded as it is extremely difficult to try and gauge its effect on CCS deployment, principally as the technology does not impact technical abatement potential, but rather, the costs of deployment for different CCS project-types within certain niches. In other words, EOR may be applicable to any of the potential CCS opportunities identified, and will serve to reduce their overall unit costs relative to those applied here. It has not been possible to model the extent to which this occurs within different sectors. Synthesis fuel production was excluded due to a lack of emission data;
On the other hand, a range of factors may also serve to enhance deployment of CCS ahead of the cost curve. These include industry flagship projects (such as the proposed Mazdar City project in Abu Dhabi), technical demonstration projects in developing countries, such as the UK-China NZEC project, or niche EOR applications. For some activities, such as process emissions from NGP activities and emissions from the calcination of limestone in cement, there may not be any alternative abatement option other than CCS. At the time of writing, the European Union has proposed a pilot phase for CCS under the CDM. The approach is based on allowing a restricted number of projects within the CDM in the first instance, which could allow for a better understanding of the range of issues posed by CCS inclusion within the CDM in a learning-by-doing context, whilst limiting concerns about market effects. The analysis presented herein suggests an approach whereby a maximum ‘creditable tonnage’ of CCS projects may be developed, and proposes a figure of 15-20 MtCO2 per year as a possible starting point. An important consideration in this context is tenure of the development rights under such an approach. In order to work effectively, a sunset clause would need to be considered in order to avoid applications for projects which are subsequently never realised, or not realised in a timeframe which is beneficial to development of CCS technologies. This could potentially block other more viable projects from being incentivised by the CDM. The focus of the report is on the risks of CCS inclusion on the carbon market. However, there may be some significant benefits offered by including CCS in the CDM, based around what are considered the two main challenges to realising CCS in the medium-term, namely:

ENVIRONMENTAL RESOURCES MANAGEMENT IEA GHG
IX
1. First, the main technical innovation and cost reduction efforts needed to realise CCS over the medium-term are associated with capture of CO2 from dilute flue gas streams from fossil-fuel fired power plants. Considerable work is needed to develop these at full scale, which will likely take at least another 10-15 years before market maturity;
2. Second, one of the main concerns over the technical efficacy of CCS relates to the large-scale subsurface storage of CO2, the risk and effects of leakage, and the long-term permanence of emission reductions achieved. Capacity building needs and legal and regulatory developments are also required to accommodate this element of the CCS chain.
The first challenge is subject to considerable research efforts in Annex I countries at present (e.g. EU flagship programme) and through cooperative research with non-Annex I countries (e.g. the UK-China NZEC project. These are focussed on developing large-scale demonstration projects in the power sector running by around 2015. The second challenge could be overcome in parallel by focussing on early opportunities for CCS application, which are not subject to the technical challenges posed by the first. Many of these opportunities, especially in NGP operations, are located in non-Annex I countries, as highlighted by the research undertaken here. The spillover learning effects from deployment of these projects could support convergence of the two areas of research in the future, resulting in a second phase of deployment focussed on the fossil-fuel power sector, perhaps from 2025 onwards. The fossil-fuel fired power sector will be critical for consideration of CCS, as emissions are estimated to be in the order of 7GtCO2 per year from this sector in developing countries alone by 2020. Thus, inclusion of CCS in the CDM could provide useful bridging finance to support a CCS technology development pathway over the next 15-20 years.

ENVIRONMENTAL RESOURCES MANAGEMENT IEA GHG
1
of
1 INTRODUCTION
This report has been prepared by Environmental Resources Management (ERM) for the IEA Greenhouse Gas R&D Programme (IEA GHG) over the period July-October 2008. The report presents findings associated with the possible inclusion of carbon dioxide capture and geological storage (CCS) within the Kyoto Protocol’s clean development mechanism (CDM) (1), and the potential repercussions this could have on the global regulated carbon market. In order to achieve this, it examines the effects of creating additional certified emission reduction (CER) (2) “offsets” from CCS activities to the pool available for compliance by Annex B Parties to the Kyoto Protocol. The study also considers implications for 2020 in order to gauge potential market effects of CCS in any future, yet-to-be-agreed, post-2012 international carbon trading mechanism.
1.1 BACKGROUND TO THE ISSUE
Concerns have been raised by some observers (3) regarding the negative effects on the carbon market that could result from the inclusion of CCS in the CDM. This is due to the potential for a marked increase in the supply of low cost CERs, primarily because of the levels abatement achieved in CCS projects compared to some other CDM project activities, with typical project sizes potentially in excess of one million tonnes of CO2 abated per year. This could result in relatively low transaction costs per tCO2 avoided compared to other types of CDM project activities. The perceived effect is that this would depress the price of carbon in the market, which could also have negative effects on financing for other CDM project activities. A further upshot might be that Annex I countries would have a potentially low cost means for compliance with their Kyoto targets, absent of taking action to reduce domestic greenhouse gas emissions. Furthermore, as the CDM is in essence only an offset mechanism, it would not lead to any net reductions in global greenhouse gas emissions (4). To undertake an assessment of the possible price effect of potential inclusion of CCS in the CDM, Point Carbon, in 2007, undertook a related study for the IEA GHG (5) to assess the effect that coal power plants with CCS could have on the global carbon market. This study showed that even with a high level uptake of coal fired power plants with CCS (4 plants by 2020 and 288 by 2032), with 20 MtCO2 being avoided using CCS by 2020, the impact on the global
(1) The clean development mechanism is outlined in Article 12 of the Kyoto Protocol. More information can be found here: <http://unfccc.int/kyoto_protocol/mechanisms/clean_development_mechanism/items/2718.php> (2) CERs are the carbon credits generated in the CDM. These can be used by Annex I governments for compliance with their Kyoto Protocol commitments, as well as indirectly by firms included in the EU's emissions trading scheme. (3) For example, see Miguez, Jose. A Brazillian perspective on CCS. Presentation at a side event, Bonn, 15 May 2006, referred to in Philibert et al., op cit. (4) Although baseline and additionality considerations inherently imply that emissions shall be reduced by CDM projects, albeit outside the scope of Annex I countries. (5) Point Carbon 2007. CCS and the CER Market. For the IEA GHG Programme, August 2007

ENVIRONMENTAL RESOURCES MANAGEMENT IEA GHG
2
carbon price was shown to be minimal (not exceeding €2 price impact per CER). This study, however, only considered CCS associated with coal-fired power plants, leaving out CCS applications in other sectors and activities. Later in 2007, the International Energy Agency (IEA) released a report examining issues relating to CCS inclusion as a CDM project activity (1). The study was based on a top-down assessment of global technical abatement potential (2) for CCS application in CDM candidate countries (i.e. non-Annex I countries that have ratified the Kyoto Protocol) according to the magnitude of CO2 emission point sources, absent of considering the costs of such application (i.e. economic potential). It concluded that the majority of CCS projects in the CDM within the Kyoto Protocol commitment period (2008-2012) would be applied at natural gas processing (NGP) plants and petroleum refineries. For 2012, the results suggest an annual technical potential of some 584 Mt CO2 avoided using CCS, increasing to an annual potential of 9,301 MtCO2 by 2020. The former figure is larger than the current CDM market size, whilst the latter presents a significant amount of CERs which would likely have repercussions for the carbon market (for instance, this figure compares with a current annual supply estimate of CERs of 307 million (M), and forecast CER supply figure between 2008 and 2012 of 1,537 M from all CDM projects types (3)). In the context of market effects, the IEA report suggested that:
Widespread uptake of just the short-term CCS opportunities could more than double the current CDM portfolio. If […] CCS facilities become widely used, this could in theory dominate the CDM portfolio in the long-term.
The report did provide some caveats to this analysis, suggesting that the technical potential outlined is very unlikely to be reached due to ‘realistic’ factors. However, absent of consideration of the realistic costs and other technical barriers to deployment, the analysis is could be misleading for a wider audience that do not have a clear understanding of the constraints of the study. By way of alternative, a bottom-up assessment of CER supply from a range of potential greenhouse gas emission mitigation projects from 2013 to 2020 was also published in late 2007 (Bakker et al.) (4). The study included assessment of the CER supply potential from CCS projects over this period, based on a scenario for CCS deployment covering uptake in the power sector and other early opportunities industry sectors such as ammonia production, limited to nine large non-Annex I countries. The results of the analysis provided an estimate that CCS could provide emission reductions of 158 MtCO2 per year
(1) Philibert, C. Ellis, J. and Pokanski, J. Carbon Capture and Storage in the CDM. Organisation for Economic Co-operation and Development/International Energy Agency. 2007 (2) Technical potential refers to the total amount of CO2 emissions available for capture and storage in a particular sector or activity. For the purpose of this study, it refers to the total emissions in the sector in non-Annex I countries to which CCS could be applied to abate these emissions. It does not consider the availability of geological capacity suitable for storing CO2. (3) UNEP Risoe CDM/JI Pipeline Analysis and Database, November 2008. Availabel at <http://www/cdmpipeline.org/> (4) Bakker, S.J.A., Aravanitakis, A.G., Bole, T. van de Brug, E., Dcoets, C.E.M., Gilbert, A. Carbon credit supply potential beyond 2012: A bottom-up assessment of mitigation options. ECN-C—07-090, Point Carbon, Ecofys, November 2007.

ENVIRONMENTAL RESOURCES MANAGEMENT IEA GHG
3
by 2020 out of a CDM market of 1600-3200 MtCO2 per annum (5-10% of total supply). Their analysis examined supply of CCS CERs from a range of potential CO2 sources/sectors, but did not include consideration of NGP, a sector which – as suggested previously – the IEA estimates could have technical potential of 167 MtCO2 to 2012, and a further 334 MtCO2 per year in 2020. The authors suggest that the exclusion of NGP consideration, and the scenario used for power plant deployment, means that this can be considered as a “conservative realistic economic potential for 2020”. The study also did not consider the scope for CCS deployment under the CDM within the Kyoto commitment period (2008-2012). Thus, a range of analysis has been carried out regarding the potential market effects of including CCS in the CDM, with wide variations in the results provided, and each with their own specific limitations. However, this issue continues to be one of largest barriers for further considering the inclusion of CCS as a CDM project activity, and it seems apparent that further analysis on the issue is warranted to better inform policy-decisions regarding the perceived potential effects.
1.2 AIMS AND OBJECTIVES
The analysis undertaken herein aims to provide better clarity regarding the following:
• Potential levels of CCS deployment in near-term (prior the end of 2012) and medium-term (in 2020, reflecting a possible post-Kyoto commitment period) across a range of sectors in CDM candidate countries; and,
• The possible effects that different levels of deployment could have on carbon markets.
In order to achieve this aim, the following objectives are included within the scope of the analysis:
1. Develop a clearer understanding of the range of potential CCS applications in CDM candidate countries over the period under study in order to determine technical potential of CCS;
2. Develop better calibration of the costs of CCS deployment, by considering the main cost elements associated with CCS application in different sectors in order to determine the economic potential (1) of CCS;
3. Provide a comprehensive analysis of the technical and economic potential and constraints for CCS in 2012 and 2020, based on generating CCS-specific marginal abatement cost (MAC) curves for the respective years;
(1) Economic potential in this context is considered to be the capacity to recover the costs under different CO2 price scenarios, which will ultimately define the level of deployment

ENVIRONMENTAL RESOURCES MANAGEMENT IEA GHG
4
4. Develop MAC curves for other CDM technologies in CDM candidate countries in 2012 and 2020;
5. Integrate the CCS-specific MAC curve with that for other CDM technologies, and use this as the basis for providing an insight to the potential market effects of CCS inclusion on certified emission reduction (CER) prices, and the broader carbon market; and,
6. Undertake sensitivity analysis to assess the market effects of under alternate cost and deployment assumptions.
The approach and method to accomplish this is described further below.
1.3 APPROACH AND METHODOLOGY
In order to assess potential market effects, ERM has undertaken a bottom-up assessment of CCS project potential, based on both the range of possible CCS applications, and the cost of implementing these across this range. It seeks to build on the work of Bakker et al. (2007) by including a more detailed consideration of NGP operations, as well as more refined abatement cost calibration across both NGP and other CCS “early opportunities” (1) in industrial sectors. The first issue to consider is the identification of relevant CO2 emission sources to which CCS could be applied across different sectors, building on the previous studies highlighted above (Section 1.1). In this report, particular attention has been given to early opportunity sources, such as high purity CO2 rich offgas streams from NGP and some chemical production activities, in order to develop a robust estimate of the technical potential for CCS deployment in the near-term. In this context, this study has considered the following sectors:
• NGP, including liquefied natural gas (LNG) production; • Chemicals industry, focussing on ethanol, hydrogen, ammonia, and
fertiliser production; • Petroleum refining sector, • Cement production, and; • Fossil-fuel fired power stations.
Secondly, there is a need to develop more realistic estimates of the costs of CCS deployment, based on identifying the variety of technical CCS elements that can be applied to different CO2 source streams. This involved firstly defining a project typology for each sector, and then attaching key cost elements associated with each CCS project type. The different project types identified are then allocated across the CO2 emission sources within each sector, resulting in a scenario for CCS deployment in 2012 and 2020. This allowed a more realistic cost estimate of CCS deployment to be outlined.
(1)“Early opportunities” are described in the SRCCS as projects that [are likely to] “involve CO2 captured from a high-purity, low-cost source, the transport of CO2 over distances of less than 50 km, coupled with CO2 storage in a value-added application such as EOR.” See footnote 12, pg. 44.

ENVIRONMENTAL RESOURCES MANAGEMENT IEA GHG
5
Emissions and cost data are then used to develop a comprehensive estimate of the technical and economic potential for CCS in 2012 and 2020, based on developing CCS-specific marginal abatement cost (MAC) curves for the respective years. Finalised MAC curves for CCS are then integrated with MAC curves for other CDM technologies in candidate countries in 2012 and 2020, allowing an assessment of the relative effect of CCS to be compared against competing CDM technologies. Finally, the development of scenario’s, with accompanying sensitivities, are used to develop ranges of uncertainty around the costs and deployment scenario developed. The results of the analysis described are used to provide information on two key outcomes which provide insight into the potential market effects of CCS inclusion in the CDM:
• Price impacts: carbon market price impacts for assumed levels of CER demand; and,
• CCS deployment levels: based on estimates of CER price and the abatement potential form CCS under this price; and,
• Delivered volumes: in the context of the amount of CER flows for a given CER price from different technologies.
Substitution effects, in terms of impacts of displacing other CDM technologies within the overall abatement portfolio, have not been considered within this report, as described in latter sections. The remainder of the report outlines the following elements in more detail:
• Section 2: Establishing CO2 emissions and CCS deployment costs for NGP;
• Section 3: Establishing CO2 emissions and CCS deployment costs for other industrial sectors, including power plants;
• Section 4: Establishing MAC curves for other CDM technologies in CDM candidate countries;
• Section 5: Results of the analysis; • Section 6: Discussion of the results; • Section 7: Conclusions.

ENVIRONMENTAL RESOURCES MANAGEMENT IEA GHG
6
2 CO2 EMISSIONS AND CCS DEPLOYMENT COSTS IN NATURAL GAS PROCESSING
2.1 INTRODUCTION
This section sets out ERM’s approach and methodology to estimating the technical and economic potential for the application of CCS to NGP emissions in CDM candidate countries in the near and medium term (2012 and 2020). Estimates outlined here are representative of a Base Case, without consideration of any technical or economic constraints which could impact on deployment of CCS in these sectors. These constraints are covered in latter sections of the report (Section 6.4).
2.2 APPROACH
2.2.1 Scope and assumptions
For the purpose of this study, CO2 emissions from NGP activities are considered to include only the CO2 removed from field gas in order to meet pipeline or liquefied natural gas feedstock grade (i.e. processing emissions, sometimes referred to as “knock out” emissions in LNG production). Combustion emissions from the NGP installations are assumed not to be captured, an assumption that is consistent with current practice (e.g. at the Snohvit, Sleipner (1) and In Salah (2) CCS projects in operation in the Norwegian sector of the North Sea and Algerian desert respectively). Typically emissions of this type are vented to atmosphere where CCS is not applied. Research presented here has only considered emissions from operations in major gas producing CDM candidate countries, based on firstly, the relative contribution to the total gas production from CDM countries, and secondly, areas known to be typified by high-CO2 content natural gas reserves. The research has focussed on known gas fields in those countries, and publicly available data on the annual production, size of reserve, and CO2 content. In calculating the level of CO2 emission reductions it was necessary to take view on level of removal required. For pipeline gas, a delivery specification of 2% CO2 content (3) has been assumed (i.e. CO2 must be removed down to a 2% concentration), and for LNG feedstock, a 0.2% content (4). This presents a constraint of the study, as the delivery specification may be much higher,
(1)http://www.statoil.com/statoilcom/svg00990.nsf/web/sleipneren?opendocument. (2) http://www.bp.com/sectiongenericarticle.do?categoryId=9024977&conentId=7046614 (3) Pipeline gas specification will vary significantly depending on the lease set for the field. Some may be very low in order to allow subsequent blending with higher CO2 gas. In other cases, gas grids may be designed specifically handle high CO2 content gas (4) Specification for LNG feedstock is lower because the liquefaction process is negatively affected by the presence of CO2 in the gas, which can form dry ice within the process.

ENVIRONMENTAL RESOURCES MANAGEMENT IEA GHG
7
partly driven by technical constraints on the gas delivery system. For example, offshore gas production systems tend to employ membrane treatment systems because of their lower weight relative to solvent based removal systems. These designs typically only result in a fraction of the CO2 being removed offshore (e.g. from 40% CO2 down to 20%), and secondary processing may occur onshore to meet pipeline specification. It has not been possible to reflect these types of variations within the scope of this study. It has been assumed that there are no additional (incremental) costs for CO2 capture in NGP activities, whilst it is also assumed that CO2 injection occurs in situ, except for LNG activities, which are assumed to require transportation of CO2 of less than 50km (see below). A capture efficiency of 98% has been assumed, reflecting an assumption regarding fugitive losses in capture, transport and injection, as well as an making an allowance for combustion emissions related to powering CO2 compression operations (1).
2.3 TECHNICAL POTENTIAL
Technical potential in this context defines the full spectrum of potential for applying CCS in terms of tons CO2 abated. Previous studies have highlighted the lack of publicly available data on CO2 emissions from NGP activities, primarily because of the commercially sensitive nature of the data. For example, the IPCC (2) and the IEA (3) have both only been able to provide broad, top-down, estimates of the technical potential for CCS application to NGP activities. The IPCC SRCCS used an assumption that on average, CO2 emissions from natural gas ‘sweetening’ would be in the order of 50 MtCO2 per year, based on a global gas production of 2618.5 billion m³, with half of this containing an average CO2 content of natural 4%, and a required delivery quality of 2% (4). The IEA took a different set of assumptions, based on 98.5 trillion m³ of gas reserves in CDM candidate countries, a 60 year production horizon, an assumed average CO2 content of 7%, and a delivery specification of 2%. This would give emissions of around 167 MtCO2 per year over the production period. Furthermore, it assumed that more gas production, and with a higher CO2 content, would come on stream between 2012 and 2020, and subsequently doubled the annual figure to 334 MtCO2 in 2020.
(1) These emissions are assumed to be deducted from the amount stored to arrive at the CER supply potential, i.e. they would be treated as project emissions under the CDM. Leakage from storage sites is assumed to be zero, based on only appropriately selected and well managed storage sites being employed within the CDM. (2)Metz B, Davidson O, de Coninck, HC, Loos M, and Meyer LA (eds.). 2005. IPCC Special Report on Carbon Dioxide Capture and Storage. Prepared by Working Group III of the Intergovernmental Panel on Climate Change. Cambridge and New York: Cambridge University Press. Available at <http://www.ipcc.ch/pdf/special-reports/srccs/srccs_wholereport.pdf>. Hereafter referred to as the IPCC SRCCS. (3) op. cit. (4) See: IPCC Special Report on CCS, pg. 111-112.

Given the range of assessments, ERM took the view that it would develop a dataset of emissions from NGP on a country-by-country, field-by-field basis, where data allowed.
2.3.1 Natural gas production in non-Annex I countries
The first step in developing estimates of CO2 emissions from NGP was to establish forecasts of natural gas production in CDM candidate countries. In order to keep the dataset manageable within the timeframe available for the study, ERM took only the top 15 gas producing non-Annex I countries, which account for 90% of all gas production in non-Annex I countries. Several countries were selected in addition to these because of their known prevalence of high CO2 gas fields (e.g. Thailand, Myanmar). These data are shown below (Figure 2.1). Collectively, these countries are forecast to account for around 62 trillion cubic feet (TCF) of natural gas production per year in 2020, which is equal to 44% of total worldwide forecast annual gas production in 2020.
Figure 2.1 Natural gas production in major non-Annex I countries
Source: http://www.eia.doe.gov/ Note: Venezuela is removed from the study as it does not have a DNA.
0
10,000,000
20,000,000
30,000,000
40,000,000
50,000,000
60,000,000
70,000,000
2000 2002 2004 2006 2008 2010 2012 2014 2016 2018 2020
Gas
pro
duct
ion
(mm
scf)
UzbekistanUnited Arab EmiratesTurkmenistanTrinidad and TobagoThailandSaudi ArabiaQatarPakistanOmanNigeriaMyanmarMexicoMalaysiaIranIndonesiaIndiaEgyptChinaBangladeshArgentinaAlgeria
By establishing the levels of production in each country, total CO2 emissions could be estimated in 2012 and 2020, based on establishing the CO2 content of the gas.
2.3.2 Characterisation of natural gas fields in non-Annex I countries
For each of the countries under study, field-by-field research was conducted to establish the following:
ENVIRONMENTAL RESOURCES MANAGEMENT IEA GHG
8

ENVIRONMENTAL RESOURCES MANAGEMENT IEA GHG
9
• Size of the total reserve (cubic feet); • Annual production rate (cubic feet per year); • Production start date (year); • CO2 content of the field (%); • Production type (pipeline or LNG); and • Location (onshore or offshore, and water depth).
These data were used to generate the following characteristics:
• Field life (in years, equal to total reserve divided by annual production) (1); and,
• Annual processing CO2 emissions (based on annual gas production, CO2 content, and production type).
The location of the field was required to generate cost estimates, as described below (Section 2.4). It was not possible to find detailed data for every field in the countries under study. Consequently, an “other field” category was assumed, and the country production data was used to estimate the balance of annual production, with CO2 content assumed as an average of the country’s field assets. In some cases, no individual field data were found, and consequently a 2% content was assumed (e.g. in Latin America, where information on oil & gas reserves is notoriously difficult to obtain), resulting in no CO2 emissions from NGP activities in those countries. This was considered to be a conservative assumption, given the heterogeneous distribution of high CO2 gas fields, and the highly site specific nature of CO2 content. A linear, two year, field production ramp up and ramp down period to and from full production is assumed. A summary of data coverage of known relative to unknown fields (“other field”) for the major candidate countries is provided below (Table 2.1).
Table 2.1 Gas field data coverage for major countries (%)
Country 2008 2012 2020 Algeria 85 70 6 China 16 52 21 Egypt 29 26 14 Indonesia 72 47 54 Iran 43 39 27 Malaysia 76 61 49 Myanmar 72 64 50 Pakistan 69 47 30 Qatar 62 36 22 Saudi Arabia 78 66 48 Thailand 81 86 58 Turkmenistan 59 76 62 Uzbekistan 9 17 10 Notes: variations between years are a reflection of changes in forecast production over time, know data on new fields planned to come on stream, know field maturation dates, and the lack of certainty regarding long-term forecasts for production, supply and field lives.
(1) The model built by ERM also assumes a 3 year ramp-up and step down for the start and end of production of fields.

A summary of the results of the analysis is presented below (Figure 2.2). These data clearly show the dominant potential contribution of South-East Asian countries, which is to be expected given the known occurrences of high CO2 gas in the Gulf of Thailand, South China Sea provinces, and in onshore and offshore Indonesia (e.g. Java Sea, Flores Sea, Banda Sea, Timor Sea) (1), and the energy security issues in the region which drives the development of these fields. North Africa also features, as does the Middle East.
Figure 2.2 Annual CER technical potential by country
Note: data presented is based on short-lead times for all project types (see below)
0
50
100
150
200
250
300
350
2009 2010 2011 2012 2013 2014 2015 2016 2017 2018 2019 2020
MtC
O2
per y
ear
Annual CER potential CCS gas processing
Uzbekistan
United Arab Emirates
Turkmenistan
Thailand
Saudi Arabia
Qatar
Pakistan
Myanmar
Malaysia
Indonesia
Egypt
China
Algeria
2.4 ECONOMIC POTENTIAL
A key component for determining realistic data on levels of CCS in NGP operations in CDM candidate countries is the cost of deployment, which can determine the economic potential. Economic potential in this context is considered to be the capacity to recover the costs under different CO2 price scenarios, which will ultimately define the level of deployment. That said, the full range of costs are modelled in order to generate the MAC curve. Previous studies have not been able to provide any granularity on estimates of costs, especially differentiated by the range of cost variables that can affect deployment for different types of CCS operations in NGP activities. This is a key finding from this study. In discussing costs of CCS deployment, both the IEA (2) and IPCC SRCCS note the widely varying costs between sites as a result of variables such as: transportation distance, storage type used, depth of storage, the required CO2
ENVIRONMENTAL RESOURCES MANAGEMENT IEA GHG
10
(1) See page 210-211 of the IPCC SRCCS. (2) op. cit.
ENVIRONMENTAL RESOURCES MANAGEMENT IEA GHG
11
purity, whether CO2 capture is routinely carried out, and whether the system is retrofitted or new-build. As NGP activities routinely remove the CO2 as part of standard operations, these can be considered as an early opportunity, as the costs of CO2 capture are avoided, whilst they are also likely to be located close to geological formations which are suitable for CO2 storage. In order to better describe the technical potential, this study has undertaken analysis to develop estimates of both capital expenditure (CAPEX) and operating expenditure (OPEX) for different project types. Prior to developing costs, it is first necessary to define a NGP project typology against which specific costs can be assigned, as described below.
2.4.1 Natural gas processing project typologies
The application of CCS for CO2 emissions abatement in NGP offers a wide spectrum of potential conditions, each with project-specific technical requirements. In turn, these drive a wide range of potential project-specific CO2 abatement costs. However, accounting for this diversity of costs on a project-by-project basis for all non-Annex I countries would require significantly greater investigation than has been possible within the scope of this project. On the other hand, if this diversity is not reflected, a homogenous unit cost for all potential projects would be assumed (e.g. in $ per tCO2 abated per yr), which would result in a single cost estimate for all projects in non-Annex I countries. This would not reflect the true heterogeneity of potential applications, and would not provide a realistic view on the range of abatement costs, and thus economic abatement potential. Therefore, in order to capture and reflect this diversity, ERM developed a generalised project typology for CCS application in NGP activities. This serves to define a range of technical factors and options that could potentially be applicable to different gas processing CCS conditions, which, in turn, drives variations in project cost estimates, providing better granularity to the estimates of economic CO2 abatement potential. The typology framework developed is summarised below (Figure 2.3).

Figure 2.3 Framework for developing a gas processing CCS project typology
Gas processing
Onshore Offshore
New-build
Deep water
Shallow water
Retrofit Retrofit
Deep water
Shallow water
New-build
Liquefied natural gas (LNG)
As can be seen, the variables considered in defining the typology include:
1. Location (onshore or offshore. Because of their inherent coastal locations, all LNG projects are assumed to store CO2 offshore)
2. Age (new-build or retrofit) 3. Water depth (offshore only) 4. Transport distance (in the study LNG is assumed to require
transportation of less than 50km, whilst gas processing projects are assumed to inject CO2 in situ)
This analysis resulted in the development of seven different project types for NGP operations. The technical abatement potential to 2020 for each project type is shown below (Figure 2.4).
Figure 2.4 Annual CER technical potential by project type
Annual CER potential CCS gas processing
0
50
100
150
200
250
300
350
2009 2010 2011 2012 2013 2014 2015 2016 2017 2018 2019 2020
MtC
O2 p
er y
ear
LNGOffshore deep NBOffshore deep ROffshore shallow NBOffshore shallow ROnshore NBOnshore R
ENVIRONMENTAL RESOURCES MANAGEMENT IEA GHG
12

ENVIRONMENTAL RESOURCES MANAGEMENT IEA GHG
13
In addition, it is also important to note that NGP infrastructure is not necessarily defined by a fixed asset life but will be determined, within a reasonable economic life, by the volume of gas in the field. In other words, unlike typical capital projects, where fixed asset lives can be assumed (e.g. 30 years for a power plant), there is significant variation in the asset life of a natural gas production field and associated infrastructure. Thus, the field characteristics described previously were used to determine field life. Field life subsequently affects the length of time over which investment costs may be discounted, which has repercussions for overall abatement costs, as described below.
2.4.2 Capital expenditure (CAPEX)
The analysis of costs only considers the marginal cost of plant for the addition of CCS compared to conventional plants, which are those costs incurred by installing additional equipment required to capture, compress, transport and store CO2. In the case of NGP activities, these can be considered as the cost for the following equipment:
• Mechanical and electrical equipment (M&E), including: o Compressors o Auxiliary equipment for compression (dryers, coolers etc) o Monitoring (any passive equipment)
• Civil engineering (Civils), including: o Transportation o Injection (umbilical connections [offshore] and wells); o Storage site development, closure and decommissioning (wells,
well plugging) Other cost variable are also considered, covering onshore versus offshore engineering costs (higher costs for offshore), and variations in costs between new-build and retrofit (higher costs for retrofits), and price indexing to 2008 costs. These are described in detail, including the calculations used to derive costs, in Appendix A. These costs have been applied to NGP, based on the project typology described above. For “other fields”, or fields known to be coming on stream between 2012 and 2020, it is assumed that they will be built with CCS fitted (i.e. new builds, rather than retrofits). The cost model also accounts for economies of scale, with larger scale projects being cheaper per tCO2 stored compared to smaller projects. A summary of CAPEX for NGP projects is provided below (Table 2.2).

ENVIRONMENTAL RESOURCES MANAGEMENT IEA GHG
14
Table 2.2 Summary of CAPEX estimates (non-discounted) for NGP activities ($/tCO2)
Up to MtCO2/yr injection Project type 0 to 0.1 0.1 to 0.5 0.5 to 1 1 to 2 2 to 4 4 to 6 LNG $540 $183 $116 $76 $51 $41 Offshore deep NB $1,556 $532 $342 $226 $153 $123 Offshore deep R $1,701 $588 $378 $251 $169 $136 Offshore shallow NB $1,315 $483 $316 $210 $141 $112 Offshore shallow R $1,460 $538 $353 $235 $157 $125 Onshore NB $317 $116 $76 $51 $34 $27 Onshore R $462 $172 $113 $75 $50 $40 Note: NB = New build; R = Retrofit. Cost vary by project size, based on economies of scale achieved in larger projects – see Appendix A. Economic variables
In modelling economic potential, all CAPEX estimates are subject to 12.5% discount rate and a project economic life defined by the given field life associated with the project. The discount rate chosen are the author’s estimate, based on undertaking commercial assessments of climate change mitigation projects in developing countries. Typically, experience suggest these can range between 10 – 17%, depending on project type and jurisdiction; in other words, these are the typical rates applied by investors when undertaking project appraisal. The economic life is capped to a maximum of 21 years, reflecting the period over which projects may have a revenue stream i.e. 21 years under the current CDM modalities and procedures. Some gas fields have significantly longer life times than this, although discounting over this period would not provide a true representation of the typical economic appraisal approach that might be applied by a commercial operator. Indeed, it may be equally representative to discount investments over a shorter economic life (e.g. 15 years), reflecting the financing terms that may be applicable to this type of infrastructure investment in CDM candidate countries. This would result in slighter higher abatement cost estimates than presented here. In developing a Base Case, a lead time of 1.5 years has been assumed for all potential projects, starting from 2008.
2.4.3 Operating expenditure (OPEX)
Marginal operating costs associated with CCS operations in gas processing installations are considered to include the following factors:
• Power (gas consumed in compression plant); • Maintenance; and, • Monitoring (storage site only (1)).
Details of OPEX calculations used in this research are provided in Appendix A. A summary of OPEX calculations for NGP is provided below (Table 2.3).
(1) Other monitoring costs such as flow metering on pipework etc is assumed to be minor.

ENVIRONMENTAL RESOURCES MANAGEMENT IEA GHG
15
Table 2.3 Summary of OPEX estimates for NGP activities ($/tCO2)
Up to MtCO2/yr injection Project type 0 to 0.1 0.1 to 0.5 0.5 to 1 1 to 2 2 to 4 4 to 6 LNG $8.51 $3.55 $2.55 $1.97 $1.60 $1.46 Offshore deep NB $6.75 $2.93 $2.16 $1.72 $1.44 $1.34 Offshore deep R $6.75 $2.93 $2.16 $1.72 $1.44 $1.34 Offshore shallow NB $6.75 $2.93 $2.16 $1.72 $1.44 $1.34 Offshore shallow R $6.75 $2.93 $2.16 $1.72 $1.44 $1.34 Onshore NB $6.75 $2.93 $2.16 $1.72 $1.44 $1.34 Onshore R $6.75 $2.93 $2.16 $1.72 $1.44 $1.34 Note: NB = New build; R = Retrofit. Cost vary by project size, based on economies of scale achieved in larger projects – see Appendix A.
2.5 INTEGRATING TECHNICAL AND ECONOMIC POTENTIAL
The most effective method for integrating the technical and economic potential described is to plot the results as a MAC curve, with technical potential along the x-axis, and unit cost of abatement on the y-axis. MAC curves are a standard tool used in CO2 abatement analysis in order to identify the cost and effectiveness of different abatement options. It can be used to determine either: the theoretical level of deployment based on a given carbon price (reading off of the y-axis), or a required carbon price for desired level of deployment (reading off of the x-axis). A MAC curve also allows a range of different technology options to be compared on a portfolio basis in order to determine a cost-ordered perspective on the range of mitigation options available. The detailed MAC curves developed for NGP activities is in 2012 (Figure 2.5) and 2020 (Figure 2.6) are shown below.

Figure 2.5 NGP MAC curve - 2012
Note: The MAC curve presented does not include constraints on project lead times.
$0
$10
$20
$30
$40
$50
$60
$70
$80
$90
$100
$110
$120
0 50 100 150 200 250
Aba
tem
ent
CO
st (
$/tC
O2)
CER Potential (M) = MtCO2
Detailed gas processing MACC - 2012
Figure 2.6 NGP MAC curve - 2020
Note: The MAC curve presented does not include constraints on project lead times
$0
$10
$20
$30
$40
$50
$60
$70
$80
0 50 100 150 200 250 300 350
Aba
tem
ent
CO
st (
$/tC
O2)
CER Potential (M) = MtCO2
Detailed gas processing MACC - 2020
ENVIRONMENTAL RESOURCES MANAGEMENT IEA GHG
16

ENVIRONMENTAL RESOURCES MANAGEMENT IEA GHG
17
Summary data for the 2012 and 2020 MAC curves are shown below (Table 2.4).
Table 2.4 Summary data for NGP MAC curves
2012 2020 Project type CER tech.
potential (Mt/year)
Av. abatement cost
($/tCO2)
CER tech. potential
(Mt/year)
Av. abatement cost
($/tCO2) LNG 28.3 $9.2 72.3 $7.9 Offshore deep NB 0.0 N/A 0.0 N/A Offshore deep R 1.7 $31.0 1.7 $31.0 Offshore shallow NB 76.4 $23.3 125.9 $23.4 Offshore shallow R 77.7 $18.1 67.7 $16.4 Onshore NB 16.3 $9.3 33.1 $8.8 Onshore R 18.8 $15.0 12.1 $12.3 TOTAL 219.2 - 312.9 -
These data suggest technical abatement potential in non-Annex I countries from NGP activities is equal to 219 MtCO2 and 313 MtCO2 in 2012 and 2020 respectively, with average abatement costs for each project type in the range $7.9 - $31.0 per tCO2 abated. The data presented are consistent with reported data in the literature, albeit within wide boundaries. For example, the IPCC SRCCS estimated early opportunity projects of this type would have costs in the range $5-55 per tCO2 abated, whilst WWF have cited a figure of 200 MtCO2 being available for abatement in NGP activities worldwide for less than $20 per tCO2 abated (1) . In respect of the latter figure, data presented here suggest that around 222 MtCO2 can be abated at less than $30 per tCO2 in 2012, increasing to 316 MtCO2 at this cost in 2020. ECN suggest that their estimates using a non-public gas field database indicate technical potential for CCS in NGP activities in the order of 147-222 MtCO2 per year by 2020 (2), slightly lower than the estimates developed by ERM, although ECNs figure is subject to change as it has yet to be finalised. This could be a consequence of assumptions used by ERM in respect of CO2 content in gas used to generate estimates of the balance of gas production from “other fields” where no data were available and country averages were employed (see Table 2.1 for coverage of ERM data). The country level production forecasts are considered robust. Primary reasons for the differences between the 2012 and 2020 MAC curve are as follows:
• Changes in technical potential: Forecast gas production increases will result in higher CO2 emissions in the sector, especially as production is likely to move to more marginal (smaller, more contaminated) gas fields as larger, easier to produce resources mature. This is consistent
(1) See: IEEP (2007) CO2 Capture and Storage in Developing Countries and the role of the Clean Development Mechanisms: A paper for WWF European Policy Office. Submitted to the UNFCCC in 2007 by WWF. Citing Iain Wright, BP, pg 22. The IPCC definition for early opportunity CCS projects is given in footnote#1 on page 5 of this report. (2) Bakker personal communication. Based on data from IHS Consulting.

ENVIRONMENTAL RESOURCES MANAGEMENT IEA GHG
18
with ERMs discussions with the oil & gas industry experts, and provides a sound basis for our assumptions regarding CO2 emissions from gas fields in 2020;
• Changes in average abatement cost: This is a consequence of differences in field life between known and unknown field developments. A range of projects in the 2012 MAC curve are associated with short field lives, which serves to increase the unit cost of abatement. This is also the reason why offshore retrofit costs decrease over the period. This is not the case for 2020, where field lives are largely unknown, and the “other field” projects are assumed to be new builds, which have a lower CAPEX (see Appendix A). The data for LNG in 2020 are also significantly lower, largely resulting in skewing of the data, based on the assumptions that the massive East Natuna gas field (1) will be on-stream as an LNG project in this period.
Problematically, in reality, a number of new field developments are likely be undertaken as step-out production attached to existing processing operations, so in reality would represent retrofits to these installations rather than new-builds. However, it has not been able to model this level of detail within the scope of this study. Further consideration of the analysis presented, in particular consideration of barriers to realising this potential, is provided in the Discussion section of the report (Section 7).
(1) A very large high CO2 content gas field in Indonesia.

ENVIRONMENTAL RESOURCES MANAGEMENT IEA GHG
19
3 CO2 EMISSIONS AND COSTS IN OTHER ACTIVITIES
3.1 INTRODUCTION
This section sets out ERMs approach and methodology to estimating the technical and economic potential for the application of CCS to CO2 emissions from a range of industrial and power generating activities in CDM candidate countries in the near and medium term (2012 and 2020), covering:
• Chemicals industry, focussing on ethanol, hydrogen, ammonia, and fertiliser production,
• Petroleum refining sector, • Cement production, and; • Fossil fuel-fired power stations.
Estimates outlined here are also representative of a Base Case, without consideration of any technical or economic constraints which could impact on deployment of CCS in these sectors, the power sector exlcuded. These constraints are covered in latter sections of the report (Section 6.4).
3.2 APPROACH
3.2.1 Scope and assumptions
ERM has used data from the IEA GHG CO2 emissions database (1) to develop estimates of emissions from industrial activities in CDM candidate countries. For emissions in these sectors, a similar approach to developing technical and economic potential estimates is used as applied to NGP sector described in the previous section. The database was screened to remove non-CDM eligible countries including: Afghanistan, Turkey, Taiwan, Iraq, Venezuela, plus Annex I country data in order to arrive at an appropriate emissions dataset that is consistent with the political situation at the time of writing. Fossil fuel-fired power plants obviously present huge technical potential for CCS application in developing countries (> 7GtCO2 in 2020 (2)). However, it would be an onerous task to try and characterise the range of potential applications and attach a cost to each option within the scope of this study. For this reason, ERM followed the approach taken by Bakker et al (3) to estimating the technical and economic potential of this sector.
(1) IEA GHG R&D Programme. CO2 Point Sources Database. Last update: 2006. (2) IEA 2007, op cit. (3) op. cit.

ENVIRONMENTAL RESOURCES MANAGEMENT IEA GHG
20
3.3 TECHNICAL POTENTIAL
3.3.1 Industrial activities
The IEA GHG database provides country specific data at a plant level for a range of activities. These data have been used to characterise different sectors in terms of the number of emissions sources, total annual emissions, and average size of emissions. These data provide an indication of the technical potential within each sector, as shown below (Table 3.1).
Table 3.1 Industrial sector technical potential - CDM candidate countries
Activity/sector Emission sources
(N)
Average source size
(tCO2/yr)
Total emissions (MtCO2/yr)
2012
Total emissions (MtCO2/yr)
2020 Ethanol productionA 40 342,258 13.7 13.7 Hydrogen productionB 21 285,442 5.9 5.9 Ammonia productionC 118 822,087 97.0 97.0 Fertiliser productionD 28 414,682 11.6 11.6 Petroleum refiningE 247 1,183,509 292.3 292.3 Cement productionE 693 865,952 600.1 600.1 TOTAL 1,147 1,020.7 1,020.7 Source: IEA GHG CO2 Point Sources database. Afghanistan, Iraq, Turkey, Taiwan, Iraq, Venezuela plus Annex I country data removed to arrive at CDM candidate countries. Notes: A Brazil and Pakistan only. B Aruba, Venezuela, South Korea, India, Iran, Kuwait, Saudi Arabia, UAE only. C Algeria, Egypt, China, Vietnam, Georgia, Turkmenistan, Uzbekistan, Indonesia, Malaysia, North Korea, Bangladesh, Myanmar, India, Pakistan, Brazil, Chile, Colombia, Mexico, Trinidad & Tobago, Iran, Syria, UAE only. D India only. E Large number of countries covered. Note, these data are significantly lower than the 1.2 GtCO2 emissions cited elsewhere. However, the authors understand that retrofitting CCS to a cement plant would involve a major refurbishment to a plant, essentially making it similar to a new build operation. As such, this figure is considered representative of the technical potential in the sector to 2020. These data have been used as the basis for estimating technical and economic potential for CCS application across these activities. In establishing the dataset, it has been assumed that emissions from these activities remain constant at 2012 levels in 2020.
3.3.2 Fossil fuel fired power
The estimated potential for application of CCS in the fossil fuel fired power sector is 121 MtCO2 per year in 2020, based on the approach adopted by Bakker et al. In that research, the following assumptions were adopted (1):
• No CCS until 2015 in CDM candidate countries, and; • Linear increase per year in deployment to 50% of newly built power
plants in 2030.
(1) Based on: Hendriks, C. Carbon Capture and Storage. Paper for UNFCCC Financing Study. 2007

This arrived at estimates of CCS deployment in the power sector in 2020 of:
• Coal fired power stations: 93 MtCO2 • Gas fired power stations: 28 MtCO2
These forecasts have been used in this study.
3.4 ECONOMIC POTENTIAL
As for gas processing, in order to better describe the economic potential a number of project typologies have been developed in order to provide better granularity of the costs associated with various types of CCS deployment. These have then been used to attach respective costs for different project types. Subsequently, assumptions regarding the partitioning of project types across each sector’s emissions were applied in order to develop marginal abatement cost estimates at an improved level of granularity. This is described in the following sections.
3.4.1 Industrial and power sector project typologies
The variety of factors affecting the cost of CCS deployment have been described previously (Section 2.4). Based on these variations a typology framework for industrial installations has been developed following the framework summarised below (Figure 3.1).
Figure 3.1 Framework for developing an industrial emissions CCS project typology
Retrofit New-build
Transport (<50km)
Transport (<500km)
Transport (>500km)
Shallow water
Deep water
Offshore Onshore
Industrial installation (ethanol, hydrogen, ammonia,
fertiliser, refining, cement)
ENVIRONMENTAL RESOURCES MANAGEMENT IEA GHG
21

ENVIRONMENTAL RESOURCES MANAGEMENT IEA GHG
22
In addition, some sector specific considerations were made as follows:
• In petroleum refining, around 15% of the emissions may be from a steam reformer used to produce hydrogen on site, which represent a low cost option relative to gathering all emissions from a refinery. This has repercussions for the cost of deployment, and whether just hydrogen plant emissions are capture and stored, or whether the refinery develops a fully integrated CCS system. This ratio is assumed to be consistent for all refineries. Both cases are modelled.
• In the cement sector, two capture options exist for cement kilns (1). One involves the post-combustion capture of emissions from the kiln, including the deployment of a combined heat and power (CHP) plant for steam and electrical power to support the process. Emissions from the CHP plant are also captured. An alternative involves the capture of emissions from oxy-firing in the pre-calciner only. This configuration allows for the capture of approximately 61% of the whole plant’s emissions, but at a significantly lower cost than full plant capture. Both cases have been modelled, albeit with different levels of deployment, as described below.
Based on the framework described, sixty different project types were developed across the industrial sector, reflecting the range of variables that affect costs of applying CCS in these operations.
3.4.2 Partitioning sector emissions across project types
In order to generate estimates of economic potential of CCS deployment, the totals for each sector’s emissions had to be partitioned across the project types described above (Figure 2.3). In order to do this, and in the absence of suitable data which is able to provide details regarding source and sink matching for different industrial activities, ERM made a range of assumptions as to how these might look in reality, as described below (Table 3.2). Problematically, some of the assumptions adopted are rather arbitrary (e.g. splits of transport distances between sources and sinks), reflecting the lack of data at this resolution (2). However, the authors considered it necessary to include these considerations in order to reflect the heterogeneity of CCS deployment costs even within sectors.
(1) IEA Greenhouse Gas R&D Programme. “CO2 Capture in the Cement Industry” 2008/3, July 2008. (2) Very few regions of the world have undertaken detailed source-sink matching studies. It was not possible to compile such data within the scope of this study.

ENVIRONMENTAL RESOURCES MANAGEMENT IEA GHG
23
Table 3.2 Partitioning of project types across sectors
Sector Capture TransportA Storage Ethanol Hydrogen Ammonia Fertiliser
- No capture required. High purity CO2 offgas stream. - Compression required. - All retrofits.
10% <50km 30%<500km 60%>500km
50% onshore 50% offshore
Petroleum refining
- No capture required for 15% of emission from H2 plant. - Remaining 85% requires capture, collection and compression. - All retrofits.
10% <50km 30%<500km 60%>500km
50% onshore 50% offshore
Cement production
- All costs assumed as new-build cement plants because of major refurbishment required to install CCS. - 90% of plants employ post-combustion capture. - 10% of plants employ oxy-firing in the pre-calciner, resulting in 61% of CO2 captured. - CO2 calibrated to IEA GHG 2008 op cit.
10% <50km 30%<500km 60%>500km
50% onshore 50% offshore
Notes: A 50km is fixed at 50km in the model. <500km is fixed at 400km in the model. >500km is fixed at 750km in the model Costs for each project type are described below.
3.4.3 Capital expenditure
Capital costs for equipment required to apply CCS in ethanol, hydrogen, fertiliser and ammonia production plants are considered to consist of the following key cost elements:
• CO2 compressors; • Compression auxiliary equipment; • Construction and engineering; • Pipeline; • Injection well(s); and • Storage.
These installations represent early opportunities because there is no need to consider CO2 capture. For petroleum refineries and cement plants, as well as the items described above, additional equipment is needed including:
• Amine capture plants (refinery heaters and post combustion capture on cement kilns);
• Power plants (post combustion on cement kilns);

ENVIRONMENTAL RESOURCES MANAGEMENT IEA GHG
24
• Air separation (oxy-firing on cement kilns); • CO2 gathering network and blowers to force CO2 around (refineries);
and, • A range of other equipment associated with CO2 capture (e.g. flue gas
desulphurisation in cement plants). Costs have been calculated based on a typical sector project size, according to the average emissions from installations in the sector, as outlined above (Table 3.1 – Average source size). Consequently, different economies of scale are realised within the cost estimates. It is also important to note that the CAPEX estimates do not include any consideration of storage site development costs. This is because it is assumed that operators of these types of installations would not be developing CO2 storage facilities themselves, but would pay a gate fee to a third-party storage site operator to take CO2. Thus a gate fee is assumed as part of operating costs described below (Section 3.4.4). A detailed description of the calculations used to derive cost estimates of each capital element is provided in Appendix A. A summary of CAPEX estimates used in this study is provided below (Table 3.3).
Table 3.3 Summary of CAPEX estimates (non-discounted) for industrial activities ($/tCO2)
Project type
Ethanol Hydrogen Ammonia Fertiliser RefiningA Cement (PC)
Cement (Oxy)
<50km $240 $268 $142 $214 $335 $641 $122 <500km $541 $606 $312 $479 $484 $829 $310 >500km $884 $993 $506 $782 $655 $1,043 $525 H2 only <50km $181 <500km $641 >500km $1,167 Note: offshore storage only has a price effect on OPEX, as described below. A Refining is spilt into capture from just the hydrogen plant and the capture of emissions from oil fired heater etc. These data suggest that the option with the lowest CAPEX is the use of oxy-firing in cement plants. However, it is important to note that this technology is yet to be proven at any scale. Ammonia plant represent the lowest cost opportunity using current technology. Other cost variations are largely a result in economies of scale, especially in relation to pipeline costs, which have significant effects on overall system costs, especially at longer distances.
3.4.4 Operating expenditure (OPEX)
Marginal operating costs associated with industrial activities employing CCS are considered to include the following factors:
• Power (gas consumed in capture and compression plant);

ENVIRONMENTAL RESOURCES MANAGEMENT IEA GHG
25
• Capture plant operating costs (such as amine replacement); • Maintenance (including pipeline maintenance); and, • Storage fees, based on a gate fee derived from the NGP capital and
operating costs for CO2 storage described above (Section 2.4), plus an assumed margin for operators.
Details of OPEX calculations used in this research are provided in Appendix A. A summary of OPEX calculations for industrial activities with CCS is provided below (Table 3.4). The variations in OPEX shown are a reflection of the relative contribution that the pipeline maintenance costs makes to the overall operating costs, compared to the amount of CO2 transported and stored.
Table 3.4 Summary of OPEX estimates for industrial activities ($/tCO2)
Project type
Ethanol Hydrogen Ammonia Fertiliser RefiningA Cement (PC)
Cement (Oxy)
<50km on $9.00 $9.40 $7.59 $8.63 $20.36 $63.18 $51.60 <500km on $16.51 $17.85 $11.84 $15.26 $24.09 $63.18 $51.60 >500km on $25.10 $27.52 $16.70 $22.84 $28.35 $63.18 $51.60 <50km off $11.07 $11.47 $9.65 $10.69 $22.42 $66.20 $54.62 <500km off $18.57 $19.92 $13.90 $17.32 $26.15 $66.20 $54.62 >500km off $27.16 $29.58 $18.76 $24.90 $30.41 $66.20 $54.62 H2 only <50km on $13.69 <500km on $25.20 >500km on $38.36 <50km off $15.75 <500km off $27.26 >500km off $40.42 A Refining is spilt into capture from just the hydrogen plant and the capture of emissions from oil fired heater etc.
3.4.5 Fossil fuel fired power plants costs
As described previously, this study has used the same assumptions as Bakker et al. for assessing the application of CCS in power plants in CDM candidate countries (Section 3.3.2). This study used an average abatement cost of €40 tCO2 for natural gas-fired power plants, and €30 tCO2 coal-fired power plants, based on expert judgement, and taking into account various factors relating to storage costs in different parts of the world. These cost data have been converted to back to US dollars ($) for the purpose of this study using an exchange rate of 1.2 (1). The cost data for power plants fitted with CCS, as with other cost estimates, should be treated with extreme caution. They are subject to considerable uncertainty as full-scale CCS application in power plants has yet to be achieved anywhere in the world. Furthermore, most cost studies pre-date the
(1) Bakker et al converted data in US dollars ($) to Euros (€) for the purpose of their study, using an exchange rate of 1.2.

ENVIRONMENTAL RESOURCES MANAGEMENT IEA GHG
26
n sector.
significant rises in steel costs seen over the last year (2007-08). Again, this issue is applicable to all cost analysis presented.
3.5 INTEGRATING TECHNICAL AND ECONOMIC POTENTIAL
The approach to integrating technical and economic potential has been described previously (Section 2.5). The MAC curves developed for industrial processing activities and fossil fuelled power plants using CCS in 2012 and 2020, integrated with NGP MAC curves (Figure 2.5 and Figure 2.6), are shown below (Section 5.2). Summary marginal abatement cost and technical potential data for the 2012 and 2020 for industrial activities and power plants are shown in the same section (Table 5.1). These data suggest that the lowest cost opportunities for CCS in the near term in the industrial sector are in ammonia production, albeit with costs that are significantly higher than application of CCS in NGP emissions (approximately twice the cost of the most expensive NGP option; $31 compared to $62 per tonne CO2 abated). It is important to note that in many cases, ammonia plant are often integrated with urea plants, which are capable of using 70-90% of the CO2, potentially resulting in a significant decrease in the technical potential from this sector (1). However, because of a lack of data, it has not been possible to determine the extent of the effect of this on the over estimates for technical potential in the ammonia productio More detailed analysis of CCS marginal abatement costs are presented in below (Section 5).
(1) IEA Greenhouse Gas R&D Programme. 2007. ERM – Carbon Dioxide Capture and Storage in the Clean Development Mechanism. Annex A. Available at: <http://www.co2captureandstorage.info/networks/CCS-CDM.htm>.

ENVIRONMENTAL RESOURCES MANAGEMENT IEA GHG
27
4 COSTS AND POTENTIAL FOR OTHER CDM TECHNOLOGIES
4.1 INTRODUCTION
In order to assess the effects of CCS on CER supply, it is necessary to integrate deployment costs and abatement potential with that of other candidate CDM technologies. This also allows the assessment of the market impacts described previously (Section 1.3). This section of the report describes the process used to develop MAC curves for other CDM technologies for the near- (2012) and medium-term (2020) for this purpose.
4.2 APPROACH AND METHOD
This research has been developed through a review and update of existing studies that have examined the technical abatement potential and costs for a range of CDM candidate technologies in non-Annex I countries. The MACs were developed in accordance with the assumptions for extrapolation of results that are utilised in the two existing studies. The two studies used are: • Study 1: Wetzelaer B.H.H.W., van der Linden N.H., Groenenberg, H., and
de Coninck, H.C. (2007) GHG Marginal Abatement Cost curves for the Non-Annex I region, ECN (ref: ECN-E—06-060)
• Study 2: Bakker, S.J.A., Arvanitakis, A.G., Bole, T., van de Brug, E., Doest,
C.E.M., Gilbert, A. (2007) Carbon credit supply potential beyond 2012, ECN (ref: ECN-E—07-090)
MACC curves were developed for 2012 and 2020 by extrapolating the data presented in these two studies, as described below (Section 4.2.1). For the purpose of the analysis provided in this report, the 2010 MAC data presented in this research is assumed to be the same in 2012.
4.2.1 Extrapolating data between 2012 and 2020
The two studies provide data for both 2010 and 2020, the latter based mainly on extrapolation of 2010 abatement estimates to 2020. In order to scale existing data up to 2020, ERM adopted the same method as employed by Bakker et al. (for fossil CO2 emissions only), namely the development of scaling factors based on the regional datasets in the IEA Reference Scenario (1). From these, forecasts for 2020 were developed on the basis of linear interpolation between the two years. Subsequently, these data were used to estimate a percentage in emissions growth between 2012 and 2020 for each region (Table 4.1).
(1) IEA (2007) World Energy Outlook. International Energy Agency, Paris

ENVIRONMENTAL RESOURCES MANAGEMENT IEA GHG
28
Table 4.1 Scaling Factors: Forecasted Growth in CO2 Emissions 2012 to 2020
Region / country Scaling Factors: Forecasted growth in CO2 emissions 2012 to 2020 (%)
China 26.3 India 44.7 Other Asia 22.7 Middle East 25.5 Africa 20.6 Latin America 20.1 Developing countries (all) 26.4
No scaling factors were applied to afforestation/reforestation estimates between 2012 and 2020 (see below).
4.3 MARGINAL ABATEMENT COSTS AND POTENTIAL IN 2012
For the 2012 MAC data, ERM used the information presented by Wetzelaer et al to obtain abatement potential and costs for a range of options in 2010, and assumed these may also be applied in 2012. The Wetzelaer et al study considered the following countries/regions:
• China; • India; • Rest of East South Asia Region (nine counties accounting for
approximately 70% of emissions covered, but study extrapolates to all 20 countries);
• South Africa; • Brazil; and • Nine countries in the Rest of Central and South America Region
(accounting for roughly 72% of total GHG emissions in the Rest of Central and South America Region);
A summary of the 2012 MAC data is provided below in Table 4.2. Average abatement costs and potential from the Wetzelear et al study have been grouped into different project category types, and average costs calculated accordingly. The project categories are based on the author’s judgements regarding specific abatement options, covering inter alia:
• Agriculture: all measures to reduce emissions from livestock (excluding waste management)
• Renewables: covering all forms of renewable energy (wind, solar, hydro etc), including small-scale domestic measures (e.g. solar water heaters) and heat pumps;
• Electricity: includes modifications to power generating technology electricity supply, and the use of biomass-firing for power generation;
• Waste to energy: covering anaerobic digestion technologies (including landfill gas combustion for energy purposes and manure digesters) and waste biomass residue use (e.g. bagasse use from sugar cane production)

ENVIRONMENTAL RESOURCES MANAGEMENT IEA GHG
29
• Fuel switching (coal/oil to gas): in both industrial sector and electricity supply;
• Energy efficiency: covering a range of domestic and commercial building applications, excluding industrial energy efficiency;
• Industrial energy efficiency: covering non-sector specific industrial measures (e.g. waste heat recovery, energy efficient motors and drives).
The other sectors/project types are self-explanatory.
Table 4.2 2012 MACC Data – non CCS technologies
Sector/project types Total abatement potential (Mt CO2
eq/yr)
Average abatement cost ($/tCO2)
Agriculture 50.6 $19.4 Afforestation/reforestation (A/R) 188.6 -$6.7 Renewables 371.0 $14.7 Industrial energy efficiency 562.8 -$6.1 Transport 164.0 $7.8 Electricity supply (power exc renewable) 245.7 $10.2 Crude oil (production) 5.3 $1.7 Cement 19.7 -$1.0 Waste to energy 66.4 $6.2 Energy efficiency 391.7 -$8.5 Fuel switching (coal/oil to natural gas) 118.7 $10.4 Domestic fuel switch 1.3 $20.7 Non-CO2 149.0 $1.8 Cumulative abatement potential for non-Annex I region 2012 2,336.0
4.3.1 Identifying additional abatement options - 2012
Bakker et al. also incorporates some extra abatement options in 2010 that were not included by Wetzelaer et al (see also Section 4.4.1), although only the 2020 data were available. Thus, the abatement options for 2020 (for fossil abatement options only) were scaled down to 2012 abatement potential levels using the scaling factors described previously (Section 4.2.1). The finalised abatement options are shown graphically below as a MAC curve for 2012 (Figure 4.1).

Figure 4.1 Marginal Abatement Curve for 2012 – non CCS
-$150
-$100
-$50
$0
$50
$100
$150
$200
0.0 500.0 1000.0 1500.0 2000.0 2500.0
Aba
tem
ent
Cos
t ($
/tCO
2)
MCER Potnetial / MtCO2 Abatement
MACC for other CDM candidate technologies - 2012
4.4 MARGINAL ABATEMENT COSTS AND POTENTIAL IN 2020
For the 2020 MAC curve, ERM extracted the data from both Wetzelaer et al. and Bakker et al. to obtain abatement potential and costs for a range of options in 2020 for several non-Annex I countries. Greenhouse gas emissions reductions options were taken from Wetzelaer et al. and scaled up to 2020 using the scaling factors described above.
4.4.1 Identifying additional abatement options - 2020
Bakker et al. built upon data from Wetzelaer et al. by providing a range of additional abatement options for 2020. These extra options were incorporated with the data extrapolated from Wetzelaer et al. These included a range of data provided by experts in various fields, covering data for a range of abatement options in Brazil, China, Fiji, Samoa, Nepal, Egypt and Zimbabwe. These data covered to the following sectors:
• power; • transport; • avoided deforestation; • residential; • public; • non-CO2 greenhouse gases, and • industry.
ENVIRONMENTAL RESOURCES MANAGEMENT IEA GHG
30
ENVIRONMENTAL RESOURCES MANAGEMENT IEA GHG
31
Bakker et al. also included data for afforestation/reforestation and avoided deforestation which was absent from Wetzelaer et al., as described below.
4.4.2 Land- use, land- use change and forestry
Wetzelaer et al. provides additional abatement options related to avoided deforestion (reducing emissions from deforestation and degradation; REDD) and afforestation/reforestation (A/R). Addtional data, based on scenario’s for A/R and REDD development are also provided by Bakker et al. Currently the only land-use, land-use change and forestry (LULUCF) approach which can deliver emission reductions which are eligible as CDM project activities is afforestation and reforestation. REDD is an activity with potential, but is not yet eligible, although discussions on possible incentives for REDD are making good progress under the “Bali road-map”. Avoided deforestation
In this study, REDD has been included in the 2020 MAC as it is possible that it could be introduced as a project-based mechanism, or at least present a cost effective abatement option in the portfolio of mitigation measures available over the period. This is subject to considerable uncertainty, a discussion of which is beyond the scope of this study. Bakker et al. used three different scenarios for A/R project development between 2012 and 2020, covering:
• Scenario 1: 25% reduction rate in those countries which are members of the Coalition of Rainforest Nations (1), plus Brazil and Indonesia. The view is taken that only these countries will be suitably prepared to meet the monitoring and verification requirements that may be needed to implement REDD in a project-based mechanism;
• Scenario 2: only active countries are included, namely Brazil, Indonesia, Papua New Guinea, with a reduction of 25% against a given baseline;
• Scenario 3: same countries as scenario 2, but with only 5% reduction against the baseline.
In this study, ERM adopted scenario 1 to estimate REDD abatement potential. In terms of cost, Bakker et al provided three cost ranges, for three different abatement potentials, per region and incorporated into the 2020 database, covering $1-20/tCO2, $20-50/tCO2, and $50-100/tCO2. There is significant uncertainty and variation in abatement cost estimates for REDD, reflected in these price ranges. Balancing on the one hand, the assumption that the most cost effective REDD options would be taken up first, and on the only, that first-mover projects are likely to face additional demonstration costs in developing methods applicable to REDD, ERM selected $50/tCO2 as an average cost for REDD for use within this study.
(1) Covering: Bolivia, Bolivia, Cameroon, Congo, Congo DRC, Costa Rica*, Gabon, Guatemala* and Papua New Guinea. (*not included in the Bakker et al study because not selected within the 36 countries with largest forest cover in the world)

ENVIRONMENTAL RESOURCES MANAGEMENT IEA GHG
32
Afforestation / reforestation
Bakker et al. used two different scenarios for A/R project development between 2012 and 2020:
• Scenario 1: a canopy cover definition of 10% is assumed for countries that had not yet set their CDM forest definition. This is the lowest value in the UNFCCC range;
• Scenario 2: a canopy cover definition of 30% is assumed for countries that have not yet set their CDM forest definition. This is the maximum value in the UNFCCC range.
Scenario 1 data was employed in the research presented here. Bakker et al also presented specific costs for A/R abatement in different countries, ranging $46-227/tCO2, which have also been employed in this study.
4.5 2012 & 2020 MACCS: EXTRAPOLATION ACROSS ALL NON-ANNEX I REGIONS
As described previously, the data presented by Wetzelear et al covers approximately 80% of the total non-Annex I regions emissions. Therefore, as per the Bakker et al. study, a factor of 1.25 was used to extrapolate the results for 30 countries to all non-Annex I regions. The approach that was taken categorised the total potential by sector and then determined the average cost per sector. These were subsequently included as ‘other countries’ within the abatement dataset. The data on sector basis is provided below (Table 4.3 and Figure 4.2) As for 2012, average abatement costs are provided as there may be several different abatement technology options for each sector.
Table 4.3 2020 MACC Data – non CCS technologies
Sector Total abatement potential (Mt CO2 eq/yr)
Average abatement cost ($/tCO2)
Agriculture 50.6 $19.4 Afforestation/reforestation 331.4 $85.4 Renewables 550.2 $18.0 Industry energy efficiency 706.7 -$2.9 Transport 254.4 $8.1 Electricity 303.9 $9.8 Crude oil 6.4 $1.6 Cement 24.7 $0.3 Waste to energy 90.5 $6.2 Energy efficiency 542.1 -$5.6 Fuel switching (gas for coal) 153.6 $18.5 Domestic fuel switch 1.5 $18.1 Non-CO2 149.0 $1.6 Avoided deforestation 558.0 $40.4 Cumulative abatement potential for non-Annex I region 2020 3,724.5

Figure 4.2 Marginal Abatement Curve for 2020
-$150
-$100
-$50
$0
$50
$100
$150
$200
0.0 500.0 1000.0 1500.0 2000.0 2500.0 3000.0 3500.0 4000.0
Abat
emen
t Co
st (
$/tC
O2)
MCER Potential / MtCO2 Abatement
MACC for other CDM candidate technologies - 2020
4.5.1 Sector summary
As for the purpose of extrapolation, data for the MACC curves was arranged according to sectors, as summarised below.
Table 4.4 Sector summaries for non-CCS MACs
2012 2020 Project type CER tech.
potential (Mt/year)
Av. abate cost
($/tCO2)
CER tech. potential (Mt/year)
Av. abate cost
($/tCO2) Agriculture 50.6 $19.4 50.6 $19.4 Afforestation (A/R) 188.6 -$6.7 331.4 $85.4 Renewables 371.0 $14.7 550.2 $18.0 Industrial energy efficiency 562.8 -$6.1 706.7 -$2.9 Transport 164.0 $7.8 254.4 $8.1 Electricity supply 245.7 $10.2 303.9 $9.8 Crude oil 5.3 $1.7 6.4 $1.6 Cement 19.7 -$1.0 24.7 $0.3 Waste to energy 66.4 $6.2 90.5 $6.2 Energy efficiency 391.7 -$8.5 542.1 -$5.6 Fuel switch 118.7 $10.4 153.6 $18.5 Domestic fuel switch 1.3 $20.7 1.5 $18.1 Non-CO2 149.0 $1.8 149.0 $1.6 REDD 558.0 $40.4 TOTAL 2,336.0 - 3,724.5
ENVIRONMENTAL RESOURCES MANAGEMENT IEA GHG
33

ENVIRONMENTAL RESOURCES MANAGEMENT IEA GHG
34
4.6 DEVELOPING REALISTIC TECHNICAL POTENTIAL ESTIMATES
Clearly the sectors analysed offer considerable abatement potential, especially at zero or low cost. However, in order to provide realistic estimates of potential against which CCS could be compared, ERM applied scaling factors assumed to be applicable to each sector/project type. These were developed by undertaking a comparison between the estimated potential in each sector/project type against the current annual estimate of CER generation in each sector as provided in the CDM Pipeline (op. cit.). This allowed a more realistic estimate of the market deployment for different non-CCS technologies in the emissions abatement portfolio against which CCS could be assessed. Arbitrary extrapolations of 2012 factors were made for 2020, as outlined below (Table 4.5).
Table 4.5 Factors applied to non CCS technology potentials
CDM Pipeline Scaling factor applied Sector/project type 2012 2020
Agriculture 0.01 0.05 0.15 Afforestation/reforestation 0.01 0.05 1.00
Renewables 0.44 0.70 0.85 Industry energy efficiency 0.12 0.17 0.30
Transport 0.004 0.02 0.10 Electricity 0.05 0.10 0.25 Crude oil 0.90 0.80 0.95
Cement 0.35 0.50 0.70 Waste to energy 0.91 0.95 0.95
Energy efficiency 0.15 0.25 0.35 Fuel switching (gas for coal) 0.37 0.50 0.60
Domestic fuel switch - 0.10 0.25 Non-CO2 0.56 0.80 1.00
Note: A/R and REDD already constrained through the assumptions adopted by Bakker et al. These factors have been applied to the analysis described in Section 6, although the Base Case described in Section 5 uses the technical potential data absent of any reduction factors, except for the sensitivities already applied to A/R and REDD estimates as adopted from the Bakker et al analysis.

5 COMBINED RESULTS
5.1 INTRODUCTION
This section of the report presents the basic set of results developed from the study, covering:
• MAC curves for CCS in 2012 and 2020; • Integrated MAC curves with CCS and other CDM technologies in 2012
and 2020; The data presented constitute the Base Case datasets, absent of any adjustments, for example, through consideration of barriers to deployment. These adjustments are applied in assessing the market impacts outlined below (Section 6). An assessment of the market impacts, based on assumed CER demand and carbon prices, is presented in the next Section.
5.2 MAC CURVES FOR CCS
Previous sections highlighted the summary MAC curves for CCS in NGP activities, the industrial sector and the power sector (Sections 2 and 3). These data have been integrated to arrive at the summary MAC curves outlined below (Figure 5.1 and Figure 5.2).
Figure 5.1 CCS MAC curve for 2012
Note: Base case refers to the MAC curve without sensitivities applied (see below)
$0
$50
$100
$150
$200
$250
0 200 400 600 800 1,000 1,200 1,400
Aba
tem
ent
Cost
($/tC
O2)
MCER Potnetial / MtCO2 Abatement
Base Case CCS MACC - 2012
ENVIRONMENTAL RESOURCES MANAGEMENT IEA GHG
35

Figure 5.2 CCS MAC curve for 2020
Note: Base case refers to the MAC curve without sensitivities applied (see below)
$0
$50
$100
$150
$200
$250
0 200 400 600 800 1,000 1,200 1,400 1,600
Abat
emen
t Co
st (
$/tC
O2)
MCER Potential / MtCO2 Abatement
Base Case CCS MACC - 2020
Table 5.1 Summary data for CCS MACs in 2012 and 2020
2012 2020 Project type CER tech.
potential (Mt/year)
Av. abate cost
($/tCO2)
CER tech. potential (Mt/year)
Av. abate cost
($/tCO2) NGP 219.2 $17.6 312.9 $14.2 Ammonia 97.0 $62.2 97.0 $62.2 Fertliser 97.0 $92.1 11.6 $92.1 Ethanol 13.7 $103.7 13.7 $103.1 Refineries 292.3 $114.7 292.3 $114.7 Hydrogen 6.0 $114.9 6.0 $114.9 Cement 600.1 $138.4 600.1 $138.4 Coal power 0.0 n/a 93.0 $36.0 Gas power 0.0 n/a 28.0 $48.0 TOTAL 1,239.9 - 1,454.7 -
The data presented suggest that nearly 1.5 GtCO2 per year could be available for abatement using CCS between now and 2020, excluding the majority of power sector emissions. However, there are significant costs with projects at upper end of this range that will severely inhibit deployment (>$200 per tCO2). Achieving such rates of deployment would entail significant expenditure in the order of $130 billion in 2012, or $140 billion by 2020 (based on the cumulative levelised abatement cost multiplied by the level of deployment i.e. 1.5 GtCO2 per year). Detailed MAC data (Table 5.2) suggest that in 2012, 222 MtCO2 could be abated at less than $30 tCO2, largely from onshore NGP projects, LNG operations, offshore NGP operations in shallow water depths, and ammonia production
ENVIRONMENTAL RESOURCES MANAGEMENT IEA GHG
36

ENVIRONMENTAL RESOURCES MANAGEMENT IEA GHG
37
facilities located within 50km of a CO2 storage site (the latter = 4.9 MtCO2/yr). At $50 per tCO2, around 235 MtCO2 and 451 MtCO2 could be abated in 2012 and 2020 respectively. Achieving the latter levels (i.e. at $50 per tonne tCO2) of abatement would involve total expenditure in the range of >$10.4 billion between now and 2020, excluding other research and development costs for CCS needed to support the realisation of this potential.
Table 5.2 Detailed data for CCS marginal abatement costs in 2012 and 2020
2012 2020 Project type CER tech.
potential (M/year)
Abatement Cost
CER tech. potential (M/year)
Abatement cost
Gas Onshore NB LNG Gas onshore R Ammonia R<50km (onshore) Gas offshore shall R
222
< $30 / tCO2
Σ $4.0 billion
(total cost)
316
< $30/ tCO2
Σ $5.2 billion
(total cost)
As above + Ammonia R <50km (offshore) Gas offshore shallow NB Gas offshore deep R Fertiliser R <50km (on and offshore) Ethanol R <50km (on and offshore)
236
< $50 / tCO2
Σ $4.5 billion
450
< $50/ tCO2
Σ $10.4 billion
Most project types included
411
< $100/ tCO2
Σ $19.5 billion
626
< $100/ tCO2
Σ $25.4 billion A Refining is spilt into capture from just the hydrogen plant and the capture of emissions from oil fired heater etc. It should be noted that these data represent an upper end of deployment estimates. Significant barriers exist to deployment at this level, as described further below (Section 7).
5.3 INTEGRATED ABATEMENT FOR ALL POTENTIAL CDM TECHNOLOGIES
Drawing on the data presented in the previous Sections, and the abatement cost estimates developed for other CDM technologies, integrated MAC curves were developed. These MAC curves primarily allow the effects of CCS deployment to be assessed. The integrated MAC curves are shown below.

Figure 5.3 Combined MAC curve for all potential CDM technologies - 2012
Note: options above $250 per tCO2 abated have been left off the figure. Base case relates to the CCS data described previously.
Figure 5.4 Combined MAC curve for all potential CDM technologies - 2020
Note: options above $250 per tCO2 abated have been left off the figure. Base case relates to the CCS data described previously.
-$200
-$150
-$100
-$50
$0
$50
$100
$150
$200
$250
0 500 1000 1500 2000 2500 3000 3500 4000
Abat
emen
t CO
st ($
/tCO
2)
CER Potential (M) = MtCO2
Base Case Combined MACC - 2012
-$200
-$150
-$100
-$50
$0
$50
$100
$150
$200
$250
0 500 1000 1500 2000 2500 3000 3500 4000 4500
Aba
tem
ent
COst
($/tC
O2)
CER Potential (M) = MtCO2
Base Case Combined MACC - 2020
The MAC curves presented clearly show the increase in total abatement potential between 2012 and 2020. This is largely driven by the increased abatement potential offered by forestry based projects, including A/R, and potentially REDD in climate change mitigation between now and 2020. These
ENVIRONMENTAL RESOURCES MANAGEMENT IEA GHG
38

ENVIRONMENTAL RESOURCES MANAGEMENT IEA GHG
39
activities account for 0.3 and 0.6 GtCO2 of abatement potential in 2020 respectively, compared to composite estimate of 1.4 GtCO2 of abatement potential from CCS in 2020 (Table 2.2). Of course, all of these estimates are subject to significant uncertainty, whilst the A/R and REDD estimates have already been adjusted to account for realistic market potential levels. This is undertaken for CCS in the next section.
Table 5.3 Summary data for all MACs in 2012 and 2020
2012 2020 Project typeA CER tech.
potential (Mt/year)
Av. abate cost
($/tCO2)
CER tech. potential (Mt/year)
Av. abate cost
($/tCO2) Agriculture 50.6 $19.4 50.6 $19.4 Afforestation/reforestation 188.6 -$9.9 331.4 $71.9 Renewables 371.0 $15.4 550.2 $15.4 Industry energy efficiency 562.8 $8.0 706.7 $8.0 Transport 164.0 $4.4 254.4 $4.4 Electricity 245.7 $2.7 303.9 $2.7 Crude oil 5.3 $1.0 6.4 $1.0 Cement 19.7 -$3.2 24.7 -$3.2 Waste to energy 66.4 $3.8 90.5 $3.8 Energy efficiency 391.7 -$13.3 542.1 -$13.3 Fuel switching (gas for coal) 118.7 $8.9 153.6 $8.9 Domestic fuel switch 1.3 $8.5 1.5 $8.5 Non-CO2 149.0 $0.6 149.0 $0.6 CCS 1,239.9 $105.1 1,454.7 $103.1 REDD - - 558.0 $40.2 TOTAL 3,574.7 5,177.8 - Note: A/R and REDD estimates subject to deployment constraints as developed by Bakker et al. CCS estimates represent unconstrained technical potential for all sectors except electricity supply. The MAC curve with and without CCS for 2020 is shown below (Figure 5.5 and Figure 5.6).

Figure 5.5 MAC curve for Base Case – with and without CCS – 2020 (detail)
Figure 5.6 MAC curve for Base Case – with and without CCS – 2020
$0
$10
$20
$30
$40
$50
$60
$70
$80
$90
$100
2000.0 2200.0 2400.0 2600.0 2800.0 3000.0 3200.0 3400.0
Abat
emen
t C
ost (
$/tC
O2)
MCER Potential / MtCO2 Abatement
Non CCS MACC 2020
Combined MACC 2020 - BASE
-$200
-$100
$0
$100
$200
$300
$400
$500
$600
0.0 1000.0 2000.0 3000.0 4000.0 5000.0 6000.0
Abat
emen
t C
ost (
$/tC
O2)
MCER Potential / MtCO2 Abatement
Non CCS MACC 2020
Combined MACC 2020 - BASE
The MAC estimates and curves presented above suggest that CCS, on an aggregate level, will have to compete with a range of other potential mitigation options between now and 2020, as its aggregated average
ENVIRONMENTAL RESOURCES MANAGEMENT IEA GHG
40

ENVIRONMENTAL RESOURCES MANAGEMENT IEA GHG
41
abatement costs are the highest of all abatement options outlined in both 2012 and 2020. The MAC curves suggest that in 2020, CCS will only be competitive with other CDM abatement options above 2,500 MCERs per year, and only have significant cost effects above around 3,000 MCERs per year. On the other hand, certain CCS early opportunities in the NGP sector will be cost competitive with other abatement technologies at prices of less than $30 tCO2 (Table 5.2), offering around 222-316 MtCO2 of cost effective mitigation options in the near and medium term. Thus, these data, as well as the estimated average abatement costs for other activities, should be used with caution as they tend to mask the variation in costs across the range of potential applications. A more detailed analysis of the potential carbon market impacts of CCS is outlined in the next section.

ENVIRONMENTAL RESOURCES MANAGEMENT IEA GHG
42
6 ASSESSMENT OF MARKET IMPACTS OF CCS INCLUSION IN THE CDM
6.1 INTRODUCTION
The MAC data generated within this study lends itself to the generation of estimates of market impacts in several ways, including:
• Potential levels of CCS deployment under the CDM at an assumed market price for carbon; and,
• Potential impacts on carbon market prices from CCS inclusion at an assumed level of CER demand.
The analysis presented here builds on the raw data described in the Base Case results outlined previously (Section 5) by applying a range of factors which serve to provide more realistic estimates of deployment of different technologies (including the approach adopted for non-CCS technologies as described previously – Section 4.6)
6.2 CER DEMAND AND PRICES
In order to provide an assessment of the potential deployment of CCS (in 2012) and market impacts, it is necessary to first take a view on CER demand and price both pre- and post-2012 that can be applied to near-term (2012) and medium-term (2020) impacts. However, data for 2020 should be treated with care as it is extremely difficult to make estimates of CER prices or demand post-2012 due to the lack of certainty regarding the future regime, in particular for CER price hence no CER price estimates beyond 2012 were included. Data were found on estimated CER supply in published literature (UNEP Risoe op. cit.; Bakker et. al, World Bank 2008), and these was considered to be equal to demand assuming a balanced carbon market (i.e. supply = demand). These were used to generate high, medium and low CER price and proxy demand estimates as summarised below (Table 6.1).
Table 6.1 High, medium and low estimates of CER price and demand
2012 priceA
($ per CER) 2012 demandB
(MCERs per yr) 2020 demandB
(MCERs peryr) High 15.60 (€13) 400 2,400 Medium 13.60 360 2,100 Low 9.60 (€8) 320 1,800 Source: A Prices based on 2008 CER estimates from Capoor, K. And Ambrosi, P (2008) State and Trends of the Carbon Market 2008. World Bank. These prices are assumed to be applicable to CCS in 2012 assuming contracts would be structured through 2009 if eligibility for inclusion is granted in COP/MOP4 . Prices converted from € to $ at 1.2 unless published in USD. BBakker et al (op cit) and UNEP Risoe CDM Pipeline estimates of CDM supply to 2012 (from: www.cdmpipeline.org accessed November 2008). The empirical evidence in the pipeline database currently suggests 307 MCERs for each of the 5 years of the Kyoto Commitment Period.

ENVIRONMENTAL RESOURCES MANAGEMENT IEA GHG
43
Given the considerable uncertainty regarding future CER demand (and supply) and prices in both the near- and medium-term, these figures were considered relevant and appropriate for use in this study given the absence of any other data or any further certainty regarding possible future CER demand. The medium demand and price estimate has been used for the purpose of analysis in this report. A more detailed assessment of CER demand and price was, however, not within the scope of this study.
6.3 SUBSTITUTION EFFECTS
Substitution effects of CCS have not been considered within the scope of this report i.e. assessment of the displacement of other technologies through CCS deployment. This because the view was taken that CCS doesn’t present an “either/or” alternative to another form of abatement. Without CCS, emissions would continue unabated, but operators would not necessarily be motivated to invest the avoided capital expenditure into other CDM activities. Thus, CCS is not considered to have direct substitution effects in the CDM market.
6.4 SENSITIVITY ANALYSIS
The factors used to constrain supply of CERs from non-CCS sectors have been described previously (Section 4.6). A similar, albeit more detailed, range of factors were applied to the CCS sector estimates provided in the Base Case. These were arranged around three scenarios describing a range of factors that could affect high, medium or low levels of CCS deployment over the near- and medium-term. The following factors are included as sensitivities:
• Cost estimates: this factor simply accounts for uncertainty in cost estimates by applying a +10% or -10% to the CAPEX and OPEX estimates outlined previously;
• Data uncertainty – NGP sector: the data for NGP technical potential developed in this study are subject to uncertainty, in particular with respect to “other” field estimates, as described in Section 2.3.2 and summarised in Table 2.1. These have been taken account for in the sensitivity analysis undertaken.
• Technical barriers – NGP sector: the bottom-up approach adopted for estimating technical and economic potential for the NGP sector means only slight modifications should be applied to account for variations in technical factors. In this context, the only technical factor applied was a minimum project size (i.e. an assumption a threshold may apply for emission sources of a certain size below which CCS would not be feasible).
• Technical barriers – non NGP sectors: this factor is used to take account for certain technical barriers that could apply to non-NGP CCS projects. These are designed to constrain the technical potential, covering a range of issues including: lack of access to storage locations; remaining asset life (which could mean that the project would never get build), or lack of space to deploy the capture plant;

ENVIRONMENTAL RESOURCES MANAGEMENT IEA GHG
44
• Capacity barriers: this factor is applied to both NGP and non-NGP CCS projects. Factors affecting deployment include lack of technical expertise in country, or lack of capacity to deliver CCS projects. For non-NGP projects, the latter is assumed to be covered under the technical barriers constraint.
• Project lead times – NGP sector: whilst also a technical barrier, this is covered separately as it can have a significant influence on deployment and has been modelled as a separate sensitivity in the model.
• Project lead times – non-NGP sectors: significantly longer lead times can be expected for non-NGP sector CCS projects. This is because companies in these sectors are not typically used to handling the surface or subsurface engineering expertise required to develop CCS projects, compared to gas producers. In addition, it has been assumed that these operators would only supply CO2 to other storage sites operators, rather than developing their own storage infrastructure, which means deployment in these sectors will be dependent on the development of the infrastructure through deployment of projects in other sectors. Different lead times have been assumed for different distances from storage.
• Distance to storage – non NGP sectors: splits assumed for CO2 transportation are shown above (Table 3.2). These estimates have been made on an arbitrary basis (because it is beyond the scope of this study to attempt to source-sink match all potential projects). This factor can have significant impacts on the overall costs of CCS deployment, and consequently have been varied in the scenarios modelled.
• Sector emissions – non-NGP sectors: sectors total emissions over the medium-term (to 2020) have also been varied in the scenarios.
A summary of sensitivities applied in each scenario is provided below (Table 6.2).

ENVIRONMENTAL RESOURCES MANAGEMENT IEA GHG
45
Table 6.2 Sensitivities applied in scenarios
Factor High Medium Low Costs -10% As base case +10% Data uncertainty All “other” fields
included “Other” field data
restricted to 50% of total
“Other” field data removed
Tech barrier – NGP No barrier Projects > 500ktCO2 only
Projects > 1MtCO2 only
Tech barrier – non-NGP No barrier 80% 60% Capacity barrier – NGP No barrier No barrier Myanmar, Pakistan,
Egypt, Turkmenistan & Uzbekistan
removed Project lead time – NGP 1.5 years (all) LNG, Offshore
shallow R, Onshore R = 2 yrs
Offshore deep NB, Offshore deep R,
Offshore shallow NB, Onshore NB
= 5 yrs
Offshore shallow NB, Onshore NB
= 3 yrs LNG, Offshore deep NB, Offshore deep R, Offshore shallow R,
Onshore R = 5 yrs
Project lead time 2 yrs < 50 km – 3 yrs < 500 km – 5 yrs > 500 km – 10 yrs
< 50 km – 5 yrs < 500 km – 10 yrs > 500 km – 13 yrs
Distance to storage < 50 km – 25% < 500 km – 40% > 500 km – 35%
< 50 km – 10% < 500 km – 30% > 500 km – 60%
< 50 km – 5% < 500 km – 15% > 500 km – 80%
Sector emissions change (2012 to 2020)
+10% As Base Case (no change)
-10%
The results of analysis under each of the scenarios is outlined below.
6.4.1 Sensitivity analysis results
Each of the scenarios has been evaluated against the market impact assessment criteria outlined above (Section 6.1). The results are designed to provide an indicative estimate of the potential market impacts presented by CCS inclusion within the CDM. High scenario
Under the high scenario, , when considering these data in terms of CER demand, there is no deployment of CCS in the near-term (2012) due to the availability of cheaper abatement options below the level of demand (360 MCERs per year). This means that the inclusion of CCS in the CDM has no impact on the marginal price for CERs before 2012, with the cost of generating 360 MtCO2 per year of CERs estimated to be around $1.93 per CER (excluding transaction costs). The data developed in this study suggests that CCS would only enter the CDM market where CER demand increase over about 550 MCERs per year. At this level of CER demand, the price effect at the margin can be seen to be a reduction of around $7 per CER as a consequence of CCS

(at 550 MCER demand; approximately $8 compared to $15 per tCO2 abated without CCS; equal to around 45 MtCO2 per yr abatement using CCS). This is illustrated below (Figure 6.1). The graphic also shows that marginal price effects would be eliminated at around 570-580 MCER demand, where there is convergence of the two MAC curves, and then departure of the two MACC curves after 580-590 MCER demand, with a price differential of around $2-5 per tCO2 avoided thereafter. Thus, based on Figure 6.1, it can be concluded that for a high CCS deployment scenario, price impacts at the margin may be possible should demand exceed around 600-650 MCERs per year. However, when considering these data in terms of CER price, the assumed average CER price of $13.60 suggests that CERs from CCS projects would be competitive with other candidate CDM project options in a total potential supply range of 527 to 590 MCERs per year with or without CCS respectively; the range representing the abatement potential at this CER price with and without CCS. This also implies that up to 63 MtCO2 could be abated using CCS before the end of 2012 under the CDM at this price level (see Figure 6.1). It is not possible to make any inferences regarding price effects by basing analysis on CER prices. Under all scenarios, further deployment of CCS can only be expected at CER prices greater than $15 per CER and closing again around $20 per CER (see Figure 6.4). These prices suggest CER supply could be in the range 520-650 MCERs per year, with and without CCS respectively.
Figure 6.1 MAC curve for High Deployment – with and without CCS - 2012
It is also useful to note the “lumpiness” of the MACC curves, which serves to mask the detailed changes in prices at the margin, and can lead to erroneous interpretation of data when selecting a single point at which to make estimates
ENVIRONMENTAL RESOURCES MANAGEMENT IEA GHG
46
$0
$5
$10
$15
$20
$25
$30
$35
$40
$45
$50
300 400 500 600 700 800 900 1000
Abat
emen
t Co
st ($
/tCO
2)
MCER Potential / MtCO2 abatement
Combined MACC 2012
Non-CCS MACC 2012

of price effects. In other words, selecting a demand estimate of around 575 MCER would show no marginal price effects, as the same abatement option is at the margin. Selecting points either side of this figure will show price effects. In order to provide an overall estimate of the cost implications of including CCS in the CDM market, the average abatement cost has been calculated. These data suggest that for around 600 MtCO2 abatement in non-Annex I countries, CCS would increase the portfolio of CO2 abatement options, and reduce the average cost of abatement by less than $1 per ton CO2 ($0.79). In 2020, with CER demand potentially much higher than present (in this example the authors have employed 2,100 MCERs per year as the basis for the analysis), marginal cost effects can be seen as a consequence of CCS inclusion in the CDM with a high deployment scenario. The analysis suggests that CCS could reduce marginal abatement costs by around $30 per MtCO2 (from $50 to $20 per ton CO2). This effect is illustrated below (Figure 6.2).
Figure 6.2 MAC curve for High Deployment – with and without CCS - 2020
The graph suggests that marginal cost effects only occur at demand levels in excess of 1600 MCERs per year, and only become pronounced at levels in excess of around 1900 MCERs per year. It also suggests that there is some convergence of marginal costs towards around 2300-2500 MtCO2 abated, and wide departure thereafter. At the modelled level of CER demand, around 185 MtCO2 per year could be abated through CCS in the CDM – mainly from NGP projects, and application at ammonia production plants and on hydrogen plants on refineries; this would equate to about 9% of the total CERs developed under the CDM. The effect of CCS on the average cost of abatement at the modelled level of CER demand suggest CCS would reduce
ENVIRONMENTAL RESOURCES MANAGEMENT IEA GHG
47
$0
$10
$20
$30
$40
$50
$60
$70
$80
$90
$100
1000 1500 2000 2500 3000 3500
Abat
emen
t Co
st ($
/tCO
2)
MCER Potential / MtCO2 abatement
Combined MACC 2020
Non CCS MACC 2020

ENVIRONMENTAL RESOURCES MANAGEMENT IEA GHG
48
overall abatement costs in non-Annex I countries by around $2 per ton CO2 abated at levels of 2,100 MtCO2 per year total abatement. However, these levels of CCS deployment across the sectors described seems unlikely to occur by 2020 (see Section 7.2.1 and 7.2.2 below). A summary of the results of the high deployment scenario are given below (Table 6.3).
Table 6.3 Summary of market effects – High deployment scenario
Assessment criteria CDM no CCS CDM with CCS 2012 CER Demand (MtCO2) 360 360 2012 CER price ($/CER) $13.60 $13.60 2012 CER price ($/tCO2 - marginal) $1.93 $1.93 2012 CER price ($/tCO2 - average) -$4.45 -$4.45 2020 CER Demand (MtCO2) 2,100 2,100 2020 CER price ($/tCO2 - marginal) $50.00 $19.86 2020 CER price ($/tCO2 - average) $2.73 $0.43 2012 Marginal price difference ($/tCO2) n/a 2020 Marginal price difference ($/tCO2) -$30.1 2012 Average abatement cost difference ($/tCO2) n/a 2020 Average abatement cost difference ($/tCO2) -$2.3 CCS contribution (MtCO2) – 2012 (CER price) 0-63 CCS contribution (MtCO2) – 2012 (CER demand) 0 CCS contribution (MtCO2) – 2020 (CER demand) 185
Combined MAC curves with and without CCS for 2012 and 2020 for all scenarios are shown below (Figure 6.4 and Figure 6.5). Medium scenario
Similar analysis for the medium deployment scenario as outlined for the high deployment scenario was undertaken. Based on demand estimates, these data, suggest that CCS may not get deployed before 2012, for the same reasons as described for the High Scenario (i.e. it is not cost competitive with other CDM options at demand levels of 360 MCERs per year). This effect is also augmented by the assumptions regarding sensitivities, which serve to increase the cost of CCS deployment in this scenario, and reduce abatement potential. Consequently, there are no price effects evident in the near term (in 2012). Under this scenario, CCS projects are only deployed when CER demand exceeds 540 MCERs per year, where some NGP projects become price competitive with other abatement options. However, based on CER price estimates for 2012, under the medium scenario the data suggest that the abatement potential with and without CCS is around 527 and 562 MtCO2-e per year respectively, implying that CCS is cost

competitive with other CDM project options at this price under the constraints applied. The data infer that up to about 35 MtCO2 could be abated using CCS by 2012 (see Figure 6.4). In the medium term to 2020 market effects can be seen. In 2020, CCS could contribute around 145 MCERs, representing about 7% of the total CER supply. This would reduce the average cost of abatement by around $2 per ton CO2. The marginal price effects under the medium scenario in 2020 are illustrated and detailed below (Figure 6.3 and Table 6.4).
Figure 6.3 MAC curve for Medium Deployment – with and without CCS - 2020
Table 6.4 Summary of market effects – Medium deployment scenario
Assessment criteria CDM no CCS CDM with CCS 2012 CER Demand (MtCO2) 360 360 2012 CER price ($/CER) $13.60 $13.60 2012 CER price ($/tCO2 - marginal) $1.93 $1.93 2012 CER price ($/tCO2 - average) -$4.45 -$4.45 2020 CER Demand (MtCO2) 2,100 2,100 2020 CER price ($/tCO2 - marginal) $50.00 $21.28 2020 CER price ($/tCO2 - average) $2.73 $0.75 2012 Marginal price difference ($/tCO2) $0 2020 Marginal price difference ($/tCO2) -$28.7 2012 Average abatement cost difference ($/tCO2) $0 2020 Average abatement cost difference ($/tCO2) -$2.0 CCS contribution (MtCO2) – 2012 (CER price) 0-35 CCS contribution (MtCO2) – 2012 (CER demand) 0 CCS contribution (MtCO2) – 2020 (CER demand) 145
$0
$10
$20
$30
$40
$50
$60
$70
$80
$90
$100
1000 1500 2000 2500 3000 3500
Aba
tem
ent
Cos
t ($
/tCO
2)
MCER Potential / MtCO2 abatement
Combined MACC 2020
Non CCS MACC 2020
ENVIRONMENTAL RESOURCES MANAGEMENT IEA GHG
49

ENVIRONMENTAL RESOURCES MANAGEMENT IEA GHG
50
Low scenario
Under the low scenario, as to be expected the assumed CER price suggests lower deployment of CCS than the other scenarios pre-2012, at around 26 MtCO2 abatement potential below $13.60 per CER (see Figure 6.4). As for the High and Medium Scenario, there is no CCS deployment in the near-term under the low deployment scenario. This is for the same reasons as described previously. Less pronounced effects of deployment in 2020 can be seen compared to the High and Medium Scenario, with CCS contributing about 116 MCERs, or around 6% of the overall CER supply.
Table 6.5 Summary of market effects – Low deployment scenario
Assessment criteria CDM no CCS CDM with CCS 2012 CER Demand (MtCO2) 360 360 2012 CER price ($/CER) $13.60 $13.60 2012 CER price ($/tCO2 - marginal) $1.93 $1.93 2012 CER price ($/tCO2 - average) -$4.45 -$4.45 2020 CER Demand (MtCO2) 2,100 2,100 2020 CER price ($/tCO2 - marginal) $50.00 $26.42 2020 CER price ($/tCO2 - average) $2.73 $1.0 2012 Marginal price difference ($/tCO2) $0 2020 Marginal price difference ($/tCO2) -$23.6 2012 Average abatement cost difference ($/tCO2) $0 2020 Average abatement cost difference ($/tCO2) -$1.8 CCS contribution (MtCO2) – 2012 (CER price) 0-26 CCS contribution (MtCO2) – 2012 (CER demand) 0 CCS contribution (MtCO2) – 2020 (CER demand) 116
A combined MAC curve for each scenario in 2012 is shown below (Figure 6.4). The graph clearly shows points of divergence and convergence of the curves across the portfolio of options under all scenarios, albeit with a departure from this pattern beyond about 520 MtCO2 abatement per year. After this point, the data suggest that CCS plays an increasingly important role in CO2 abatement, and also in reducing overall CO2 abatement costs.

Figure 6.4 Combined scenario MAC curves – 2012 (detail)
The pattern of divergence and convergence shown highlights the effect of “lumpiness” in the abatement option tranches along each of the curves, and indicates the challenges associated with basing an assessment of market effects by assigning relative marginal abatement costs at a single point on the x-axis against each curve. This can serve to distort the real effects that CCS could have on the CDM market. For instance, in 2020 (Figure 6.5) at around 2.0-2.5 GtCO2 of abatement, a large tranche of avoided deforestation projects dominate supply (around 0.55 GtCO2 of estimated technical potential), and convergence of the MAC curves can be seen. Thus, it is useful to also consider the average cost of abatement alongside the marginal cost, which calculates the area under the curve at a given point, providing an estimate of the overall cost of abatement. This also serves to outline the benefits CCS offers with respect to reducing the overall cost of climate change mitigation.
ENVIRONMENTAL RESOURCES MANAGEMENT IEA GHG
51
$0
$5
$10
$15
$20
$25
$30
300 400 500 600 700 800
Abat
emen
t C
ost (
$/tC
O2)
MCER Potential / MtCO2 abatement
Non-CCS MACC 2012
Combined MACC 2012 LOW
Combined MACC 2012 MED
Combined MACC 2012 HIGH

Figure 6.5 Combined scenario MAC curves – 2020 (detail)
The same graph is shown below in larger scale (Figure 6.6)
Figure 6.6 Combined scenario MAC curves – 2020 (full)
$0
$10
$20
$30
$40
$50
$60
$70
$80
$90
$100
1000 1500 2000 2500 3000 3500
Abat
emen
t Co
st ($
/tCO
2)
MCER Potential / MtCO2 abatement
Non CCS MACC 2020
Combined MACC 2020 LOW
Combined MACC 2020 MED
Combined MACC 2020 HIGH
-$200
-$100
$0
$100
$200
$300
$400
$500
$600
0 500 1000 1500 2000 2500 3000 3500 4000 4500
Abat
emen
t Co
st ($
/tCO
2)
MCER Potential / MtCO2 abatement
Non CCS MACC 2020
Combined MACC 2020 LOW
Combined MACC 2020 MED
Combined MACC 2020 HIGH
ENVIRONMENTAL RESOURCES MANAGEMENT IEA GHG
52

ENVIRONMENTAL RESOURCES MANAGEMENT IEA GHG
53
Base case reference results
In order to provide a reference, the Base Case data were analysed for the same criteria (CER demand only). These suggested that, when setting CER demand at 2.26 and 3.52 GtCO2 in 2012 and 2020 respectively (1), the level of CCS deployment would account for 141 MtCO2 (6%) of total abatement in 2012, and 317 MtCO2 (9%) in 2020. Marginal effects in 2012 would be equal to $42 per tCO2 reduction in abatement at the margin (a 67% reduction in marginal cost), and average cost effects would be a reduction of $1.6 per tCO2 abated. In 2020, these figures become $76 per tCO2 marginal price effect (a 60% reduction in marginal cost), and average abatement cost reduction of $1.6 per tCO2 (about a 4% reduction in average abatement cost). It should be noted, however, these data are skewed at the margin by the very high abatement options at the upper end of the non CCS range (>$500 per ton, Figure 5.6). Summary data for the Base Case are provided below (able 6.6).
able 6.6 Summary of market effects – Base Case
Assessment criteria CDM no CCS CDM with CCS 2012 CER Demand (MtCO2) 2,260 2,260 2012 CER price ($/tCO2 - marginal) $62 $20 2012 CER price ($/tCO2 - average) $0.5 -$1.1 2020 CER Demand (MtCO2) 3,520 3,520 2020 CER price ($/tCO2 - marginal) $126 $50 2020 CER price ($/tCO2 - average) $7.2 $7.3 2012 Marginal price difference ($/tCO2) -$41.5 2020 Marginal price difference ($/tCO2) -$76.1 2012 Average abatement cost difference ($/tCO2) -$1.6 2020 Average abatement cost difference ($/tCO2) $0.13 CCS contribution (MtCO2) – 2012 141.0 CCS contribution (MtCO2) – 2020 317.5
Further discussion of the results is outlined in the next Section.
(1) These levels were set based on the maximum CER supply potential available from non-CCS projects - see Table 4.2 and Table 4.3.

ENVIRONMENTAL RESOURCES MANAGEMENT IEA GHG
54
7 DISCUSSION
This section of the report provides a discussion of the results findings, covering a recap on the main findings, a discussion regarding the constraints of the research undertaken, and consideration of the issues posed when considering CCS within the CDM.
7.1 SUMMARY OF MARKET EFFECTS
The data presented in the previous section suggest that, based on demand estimates, CCS would not have an impact on the CER prices at the margin in the near-term (even under a high deployment scenario) because it is not cost competitive compared with other abatement options in the portfolio in non-Annex I countries. Effects at the margin are indicated over the medium term (2020), where 117-185 MtCO2 per year of CCS could be deployed under the CDM through the period 2013 to 2020, depending in a range of cost and technical factors. This would be equal to around 6-9 percent of total CER supply, which is significantly lower than the current 27 percent of CDM market share occupied by industrial gases (HFC-23, N2O and PFC destruction; 132.6 MCERs per year) and 19 percent from CH4 based projects (94.5 MCERs per year). The marginal price effect on CERs from CCS inferred by these data is a cost reduction per CER of between $24-30 at demand levels of 2,100 MCERs per year, equal to about a 47-60 percent reduction, but these estimates must be treated with extreme caution (as described further below). The medium-term total expenditure would be around $3 billion on CCS technologies under the CDM at a weighted average marginal abatement cost of around $17 per tCO2 abated. In the medium term, CCS could reduce the weighted average cost of abatement in non-Annex I countries by between $1.8 to $2.3 per tCO2. However, based on price estimates, at CER prices of around $13-14 per CER, levels of CCS deployment under the CDM could be in the range 0-63 MtCO2 before 2012. No assessment of deployment based on price post-2012 could be estimated because of significant uncertainty regarding CER prices for this period. The analysis of potential CER price impact results should, however, be treated with a degree of caution, for several reasons:
• That CER prices are not driven by supply costs, but rather by marginal abatement costs in Annex I regions or trading schemes therein (i.e. the EU Emissions Trading Scheme and the price of EU Allowances). The estimates of deployment at an assumed CER price suggest that CCS could be deployed before 2012, and compete with other CDM candidate technologies at annual CER demand of around 360 million, with the total abatement potential below this price being around 530-560 MtCO2-e per year.

ENVIRONMENTAL RESOURCES MANAGEMENT IEA GHG
55
• That the abatement cost effect shown at the margin may be distorted by the highly aggregated nature of abatement potential and cost data, and the tranches of abatement options therein, as used in this study (see Figure 6.4). This serves to create larger price differences at the margin than would occur in reality, recognising the full spectrum of potential CDM project activities (i.e. that abatement tranches would in reality consist of a number of discrete CDM projects of varying size, with variations in the abatement cost around the mean used here – thus aggregation would not exist in reality. The same notion applies equally to CCS, although this study has sought to disaggregate CCS costs in some detail. In the absence of data with better resolution on technical abatement potential and costs, this effect will continue to mask the heterogeneity of technical potential and costs associated with different emission abatement options.
• That the modelling presented assumed constraints on the supply of non-CCS technologies by applying factors to restrict supply (Table 4.5). Removing these constraints would increase the technical abatement potential of lower cost options, shifting CCS options further to the right on the MAC curve.
• Transaction costs for different types of projects, which can affect choices regarding different abatement options.
• The hidden costs of CCS deployment such as research and capacity building needs, and the extreme uncertainty on CCS monitoring requirements to meet CDM standards, and the costs thereof. These are discussed further below.
Thus, certain factors may constrain deployment compared to estimates presented here, whilst other factors may lead to deployment ahead of the MACestimate, as discussed further below. General limitations to the research are also outlined.
7.2 FACTORS LIMITING DEPLOYMENT
This research has not been able to take account of all “early opportunity” CCS projects that could be strong candidates in the near- and medium- term. Most significantly, this includes the use of CO2 injection in conjunction with enhanced oil recovery operations (EOR). The authors are aware of proposals for at least one EOR project to be undertaken with a view to developing it as a CDM project activity that is in the portfolio of potential options. However, trying to quantify the potential for application of EOR is particularly challenging because it needs another way of considering the issue. EOR doesn’t serve to further reduce emissions in addition to standard CCS projects, but rather it can serve to move any potential CCS project, in any sector, down the cost curve. This will be based on factors such as oil price, status of oil fields and their amenability to CO2 flooding for EOR purposes, the timescale for which a CO2 flood might run, where these are located, and uncertainty over which source of CO2 may be employed. These factors are extremely difficult to take into account at the scale employed in this study. For these reasons, no speculation on EOR potential was included.

ENVIRONMENTAL RESOURCES MANAGEMENT IEA GHG
56
Other areas for CCS application include in unconventional fuel production (e.g. coal gasification, coal-to-liquids, or gas-to-liquids plants). Developments of these types are increasing around the world. Such operations are characterised by higher emissions of CO2 relative to conventional fossil fuel sources, and as such, developers are keen to consider CCS as a way to mitigate this problem. A further area which has not been considered in this study is emissions of CO2 from gas produced in association with oil. Information on this has proved difficult to find, although the authors are not aware of any project proposals of this type under discussion. The study also did not consider any major limitations on storage availability, other than consideration of transport of CO2 over distances exceeding 500km. In the absence of detailed information on storage site availability, and the use of geographical information systems able to link sources and sinks, this will continue to be a constraint for this type of analysis. Consideration of other potential barriers to deployment is outlined below.
7.2.1 Technical & Economic barriers to deployment
Whilst the research attempted to capture various technical constraints on CCS deployment across the sectors under study, this was only possible at a macro-level. More detailed analysis at a sector-by-sector, country-by-country, and project-by-project level would be warranted to further improve the resolution of cost estimates, but was not possible within the scope of this study. In particular, gaining a better understanding of source-sink matching and average distance between source and sink is an important consideration. Development of CCS clusters would also likely serve to promote more rapid deployment in certain regions. For NGP activities, technical constraints are not considered to be significant – all gas producers will have in-house capacities with respect to both surface (compression, injection) and sub-surface (storage site selection, development and monitoring). The greatest constraint for these operators are economic, primarily driven by the opportunity costs of developing CCS projects under high natural gas and oil prices (i.e. that CCS projects will compete with other subsurface exploration and development projects in the operators portfolio). For other sectors, these capacities do not reside within their core businesses, and thus will face greater technical barriers to realising CCS deployment. For this reason, it was assumed that other sectors would need to pay a gate fee for stored CO2, rather than making the direct investment into storage themselves. However, this assumes that storage sites exist within proximity to the CO2 source, which in turn is reliant on the other early opportunity activities – especially NGP activities – to develop storage sites and allow third-party access. This latter point is potentially a block on deployment in other sectors, because amongst concerns raised in the UN-level negotiations on CCS in the

ENVIRONMENTAL RESOURCES MANAGEMENT IEA GHG
57
CDM, are methodological and accounting issues posed with multiple storage, and the potential joint and severed liabilities presented by multiple storage operations, especially when considering possible CO2 releases. As such, even were CCS to be allowed under the CDM, multiple injections into one site may not be allowed in the near- to medium-term until these issues are resolved; this is a potential block on most sectors outside of NGP operations being able to develop CCS projects. The research was also not able to capture the hidden and other unknown costs associated with CCS deployment. These include the significant research & development costs necessary to mature the technology into the demonstration and deployment phase. This applies to the whole chain of activities including: capture, storage site selection, monitoring, permitting and legal issues (see below). Another issue is developing pipeline infrastructure. For instance, even though the analysis presented here has assumed a cost for transporting CO2 distances greater than 500 km, the absence of a storage site in close proximity to non-NGP projects will largely preclude these operations from employing CCS. This is because of the challenges and costs associated with developing a pipeline corridor in the first instance. The lead time on such activities is likely to be extremely long (>10 years). All of these factors will significantly impact on the lead time for CCS deployment. The extent of technical barriers in the fossil-fuel power sector have not been considered here, but can be considered to be great, especially in non-Annex I countries.
7.2.2 Non-technical barriers to deployment
There are certain institutional and capacity building needs that must be overcome in order to be able to safely deploy CCS technologies. Again, gas producers will have extensive experience in gaining mineral rights permitting and procedures, and are well placed to take CCS forward, should the regulations allow. However, some potential host countries may have laws which prohibit the injection of material into the sub-surface, and significant efforts may be needed to modify the laws, which will take time. This is notwithstanding the subsequent efforts needed to create a legal system to handle CCS operations, particularly in respect of storage site permitting, property rights, and long-term liability. Some countries may not hold significant capacity to assess applications to store CO2 in the sub-surface, and may require third-party assistance in building knowledge and assessing applications. This will need to be developed and formalised. On the other hand, some countries may not be supportive of CCS, and may elect not to create an enabling legal framework for CCS projects. This has only been touched upon in the study by making the assumption that certain countries may not have these institutions in place in order to allow CCS projects to proceed (see Table 6.2). Thus, a lack of host country regulatory

ENVIRONMENTAL RESOURCES MANAGEMENT IEA GHG
58
competence could present significant delays to deployment of CCS projects in many non-Annex I countries. On the whole, these factors are largely unquantifiable at this stage, and therefore it has not been possible to capture them within the scope of the analysis undertaken. For this reason, the estimated potential provided within this study under even the low scenario may be considered to be at the upper end of the potential in the near- to medium-term.
7.3 FACTORS POTENTIALLY ENHANCING DEPLOYMENT
So far this discussion has focussed on potential barriers to deployment of CCS in non-Annex I countries. However, as estimates of CCS deployment under the CDM according to CER price rather than demand have suggested, CCS can be cost competitive with other abatement options at price levels of $13-14 per CER. Thus, it is reasonable to assume that there are a number of factors which could serve to enhance CCS deployment ahead of the cost curve. For example, CCS may be the only major mitigation option in some countries, especially oil and gas exporting countries, and countries strongly dependent on coal for electricity supply and other activities (e.g. iron and steel production). These countries may look to enhance their capacity to host and deploy CCS projects. These could also come by way of partnerships with other supportive Annex I countries, for example, the Near Zero Emissions Coal (NZEC) and Cooperative Action with China – CCS (COACH) projects supporting CCS deployment in the power sector in China, sponsored by the United Kingdom and European Commission (EC) respectively. The power sector abatement potential estimates employed in this research to some extent do take account of these factors. In addition, some countries or private operators may be keen to develop CCS flagship and research and demonstration projects ahead of the cost curve. Examples of these include the Mazdar City proposals in Abu Dhabi, a project looking to employ CCS to create a carbon-free city in the Middle East by 2015. Further, and perhaps more critically, CCS also presents the only technical option that can be used to abate emissions in some sectors, especially process emissions (e.g. CO2 emission from the calcination of limestone in clinker (cement) production or from natural gas processing). These sectors may look to develop CCS as the only alternative to shutting production in order to meet emission reduction commitments if imposed (e.g. in Annex I countries).
7.4 CCS IN CDM
7.4.1 Where now?
A broad range of technical, methodological, legal, policy, financial and other views have been expressed by various Parties to the UN Framework Convention on Climate Change (UNFCCC) and Kyoto Protocol and other

ENVIRONMENTAL RESOURCES MANAGEMENT IEA GHG
59
n ns:
everely
organisations on the issue of CCS inclusion as a CDM project activity (1), which shall not be repeated here. Suffice to say, views expressed reside itwo opposing positio
• those wishing to see support for CCS demonstration in developing countries to be enhanced in the near-term, and see CDM as a potential catalyst to this development; and,
• those strongly opposed to the use of CDM as a means to promote CCS. The synthesis of views of Parties and organisations suggest the majority take the former position. However, finding middle ground has produced difficult. At the last round of negotiations on the matter (2), no conclusions were reached on a draft position from the Parties. Thus progress remains shampered. In an effort to break the deadlock, one Party (the European Union; EU) has suggested the concept of a pilot phase for including CCS as a CDM project activity, with a view to building capacity, closing the present knowledge gaps around CCS technologies, and providing a means of addressing the concerns raised by some Parties in respect of CCS activities. It suggested that it could also serve to clarify various methodological issues posed by inclusion of CCS as a CDM project activity in a learning-by-doing context, while at the same time contributing to the worldwide demonstration and diffusion of CCS. The main features of the EU proposal were:
1. Limited duration; 2. A maximum number of projects; 3. A maximum creditable tonnage or a specified number of tonnes per
annum per project, for example a maximum volume of CERs allowed into the market as a result of the pilot;
4. Crediting which starts after registration, according to CDM-EB procedures;
5. A window of opportunity to register projects in the first commitment period of the Kyoto Protocol (i.e. before 2013);
6. Evaluation of pilot phase at the earliest appropriate opportunity. The analysis presented in this study suggests that item 3 – a maximum creditable tonnage – would provide a possible means to limit perceived effects on the CDM market. Critically, if this proposal is to be of benefit to supporting the wider deployment of CCS, it must be restricted to projects which can be realised within a short period of time. In other words, it is probably very important to include a sunset provision or tenure period within
(1) See: UNFCCC (2008a). Synthesis of views on issues relevant to the consideration of carbon dioxide capture and storage in geological formations as clean development mechanism project activities. Paper FCCC/SBSTA/2008/INF.1 Available at: http://unfccc.int/resource/docs/2008sbsta/eng/inf01.pdf And: UNFCCC (2008b) Synthesis of views on technological, methodological, legal, policy, financial and other issues relevant to the consideration of carbon dioxide capture and storage in geological formations as clean development mechanism project activities. Paper FCCC/SBSTA/2008/INF.3 Available at: http://unfccc.int/resource/docs/2008sbsta/eng/inf03.pdf (2) The 28th Session of the Subsidiary Body on Scientific and Technical Advice, Bonn, June 2008.

ENVIRONMENTAL RESOURCES MANAGEMENT IEA GHG
60
any application for a CCS project so that real projects are brought to market in the near term so as to avoid the blocking of other more viable projects being included under a pilot phase. The analysis presented herein suggests that the NGP sector seems an obvious candidate for near-term CCS deployment. Taking the range of potential in the sectors considered in this study, around 65-90 MtCO2 could be abated in the in the near-term for less than $13-14 per tCO2, or when considering constraints on CCS deployment, around 0-63 MtCO2 per year(see Figure 2.5, pg. 16). Recognising the challenges to modelling constraints on CCS deployment, and taking into account the barriers described previously, if it assumed that roughly a quarter to a third of this potential could be actually realised over this period, then a figure of 15-20 MtCO2 per year seems reasonable as a starting point for considering a maximum level of creditable tonnage for CCS in the CDM. Such levels of deployment would lead to minimum price effects in a market of over 300 MtCO2 to 2012, accounting for around 5 percent of the total CER supply, which is significantly lower than 27 percent currently taken up by industrial gas emissions abatement projects within the CDM. This analysis also suggests that these projects would not be competitive with other potential CDM candidate technologies at the margin over this period. It would therefore likely be restricted to the engagement to a few niche players looking to deploy CCS projects ahead of the cost curve. Perhaps it would be prudent to couple a maximum creditable tonnage with a minimum number of projects in order to enhance equitable distribution of potential projects. Of course, the possibility to deploy these projects will also be subject to the technical, economic and non-technical constraints highlighted in the previous section.
7.4.2 What are the benefits of inclusion?
This report has focussed extensively on the potential risk of unbalancing the carbon market posed by CCS inclusion within the CDM. This concern appears warranted given the potential scale of emission abatement potential presented by CCS. On the other, there are significant barriers to realising this potential in the near- and medium-term, and CCS does not appear cost competitive with other CDM candidate technologies until demand for CER exceeds 600 MCERs before 2012, or 1200 MCERs between 2013- and 2020. The study has not considered the ramifications for widespread deployment of CCS for the coal-dependent countries such as China, India, South Africa and Indonesia. Estimates of CO2 emissions from the fossil-fuel fired power sector in non-Annex I countries in 2020 are in the order of 7.2 GtCO2 per year (1), 3-4 GtCO2 of which are in China and India alone (2). The authors recognise that the placing of this many CERs onto the CDM market could have serious ramifications for the stability of the carbon market. However, it must be noted that – building on the points raised previously – two key factors constrain this potential in the near- to medium term:
(1) Based on the IEA (2007) op cit. (2) ERM analysis undertaken for UK Defra, 2005, in preparation for G8 Gleneagles summit.

ENVIRONMENTAL RESOURCES MANAGEMENT IEA GHG
61
• Firstly, the main technical innovation and cost reduction efforts
needed to realise CCS over the medium-term are associated with capture of CO2 from dilute flue gas streams from fossil-fuel fired power plants. Considerable work is needed to develop these at full scale, which will likely to take at least another 10-15 years before market maturity;
• Second, one of the main concerns over the technical efficacy of CCS relates to the large-scale subsurface storage of CO2, the risk and effects of leakage, and the long-term permanence of emission reductions achieved. Capacity building needs and legal and regulatory developments are also required to accommodate this element of the CCS chain.
Thus CCS presents a two-pronged challenge: The first challenge can be resolved through further R&D efforts, focussed in Annex I countries (e.g. the EU flagship CCS programme), where research funds and political will exists to develop CCS technologies suitable for application to fossil-fuel fired power plants. Cooperative research between Annex I and non-Annex I countries should also run in parallel in order to enhance technology transfer of CO2 capture technologies for application in the fossil fuel-fired power sector. Work in this area is developing rapidly in Australia and the US, and through bilateral cooperative research, such as the UK-China Near-Zero Emission Coal fired power project (NZEC). Confidence regarding the second challenge could be supported through development of CCS on early opportunities, such as those examined in this report. This bypasses the first challenge, and allows development in the second to continue in parallel with the first. A large number of such early opportunities exist in non-Annex I countries (1) although they are not likely to employ CCS in the absence of any incentives such as the CDM. As suggested by the EU in its pilot phase proposal, incentivizing these lower cost early opportunities in developing countries could enable the development of the infrastructure and knowledge (e.g. pipelines and storage potential mapping) needed to test the technical efficacy of large scale sub-surface storage of CO2. Development of institutional and legal frameworks needed to accommodate CO2 storage could also develop on the back of these projects, thus contributing to the worldwide demonstration and diffusion of CCS. At a future stage, a second phase of wider deployment will be possible through application of CCS to the fossil-fuel fired power sector. This view is supported by the IPCC, which concluded that: “early opportunities […] could provide valuable early experience with CCS deployment, and create parts of the infrastructure and knowledge base needed for the future large-scale deployment of CCS systems” (2). The absence of such a development could severely hamper
(1) See Figure 2.9 in Chapter 2, page 97 in: Metz B, Davidson O, de Coninck, HC, Loos M, and Meyer LA (eds.). 2005. IPCC Special Report on Carbon Dioxide Capture and Storage. Prepared by Working Group III of the Intergovernmental Panel on Climate Change. Cambridge and New York: Cambridge University Press. Available at http://www.ipcc.ch/pdf/special-reports/srccs/srccs_wholereport.pdf (2) SRCCS, page 341.

ENVIRONMENTAL RESOURCES MANAGEMENT IEA GHG
62
the capacity to deploy CCS on wider scale in the future. This is a largely a consequence of the delay in producing the spillover learning effects which can support the second phase of wider deployment of CCS, as described. On this note, Shell has reported that each year of delay of widespread deployment of CCS beyond 2020 results in a 1 ppm increase in long-term atmospheric stabilisation levels of CO2 (1). Thus inclusion of CCS within the CDM could serve as a useful bridging step in supporting the technological development pathway for CCS over the next 10-15 years and beyond, providing longer term benefits for the stabilisation of atmospheric CO2 concentrations.
(1) Shell (2008) Quick Guide to Carbon Dioxide Capture and Storage. February 2008.

ENVIRONMENTAL RESOURCES MANAGEMENT IEA GHG
63
8 CONCLUSIONS
The research presents detailed estimates of emissions from natural gas processing in non-Annex I countries, coupled with detailed bottom-up cost estimates, which represents a new and important contribution to the debate on CCS inclusion as a CDM project activity. Furthermore, the detailed cost consideration of other early opportunity projects also represents a useful development. The assessment of potential carbon market effects also provides a new contribution to the current debate on the matter. Analysis undertaken suggests that in 2012, CCS early opportunities could have technical potential to deploy around 1.24 GtCO2, comprising 219 MtCO2 in natural gas processing and 1020 MtCO2 in other sectors. However, market assessments undertaken suggest that no CCS would be deployed before 2012 at current estimates of CER supply and demand over the Kyoto Commitment period (estimated to be around 360 MCERs per year to 2012). The research suggests CCS would only become competitive with other CDM candidate options at the margin if supply (or demand) exceeds about 520 MCERs per year to 2012. Marginal abatement cost curves can also be interpreted taking a perspective of carbon market price, reading off of the cost of abatement. On the basis of CER price estimation (assumed in the range $13-14 per CER for this study), CCS could potentially contribute 0-63 MtCO2 of abatement potential by 2012. This would be equal to between 0-16 percent of total CER supply at the estimated level of demand. This compares to the current 27 percent of CDM market share occupied by industrial gases (HFC-23, N2O and PFC destruction; 132.6 M CERs per year) and 18 percent from CH4 based projects (94.5 M CERs per year). In 2020, total abatement potential in natural gas processing increases to 314 MtCO2, whilst forecast emissions in other sectors are assumed to be the same as in 2012, resulting in 1.45 GtCO2 of CCS technical potential in 2020. Abatement costs across the sectors are in the range $18-138 per tCO2 abated, the lowest being for natural gas processing and the highest in cement production. Assuming an annual CER demand of 2,100 MCERs in 2020, CCS would be deployed under the CDM, with total levels in the range 117-314 MtCO2 per year. This would represent between 6-9 percent of total CER supply. This compares to the current 27 percent of CDM market share occupied by industrial gases (HFC-23, N2O and PFC destruction; 132.6 MCERs per year) and 19 percent from CH4 based projects (94.5 MCERs per year). Price effects at the margin would only occur if CER demand exceeds about 1,600 MCERs per year. The marginal price effect on CERs in 2020 from CCS inferred by the analysis is a cost reduction per tCO2 abated of between $24-30 at demand levels of 2,100 MCERs per year, equal to about a 47-60 percent reduction, but these estimates

ENVIRONMENTAL RESOURCES MANAGEMENT IEA GHG
64
must be treated with extreme caution. Such significant price effects are only seen should demand exceed around 2,000 MCERs per year. The research has not been able to integrate the full range of technical, economic, and non-technical constraints faced by CCS over the time period under consideration. These must be overcome to realise wider deployment of CCS, and will likely constrain the technical abatement and carbon market potential estimated in this research. On this basis, and despite the estimated abatement cost effects at the margin, it is possible to conclude that the inclusion of CCS in the CDM may not have any significant ramifications for the global carbon market or other CDM technologies in the near- or medium-term. Rather, it will compete with the full range of cost effective mitigation technologies, and also serve to mitigate emissions that presently are emitted to the atmosphere without any real alternative to their cessation i.e. process emissions. On the other hand, there is scope to proceed with caution if fears over market stability ensue. This can potentially be achieved by adopting the option for a CCS CDM pilot phase, possible through the capping of a maximum tonnage of CO2, perhaps coupled with a minimum number of projects in order to enhance equitable distribution of potential projects. A maximum creditable tonnage of 15-20 MtCO2 per year is proposed as a possible option, subject to including limitations on tenure of the opportunity (so as to avoid preventing market ready opportunities to be realised). Furthermore, the potential benefits of CCS inclusion within the CDM should be considered. The near-term incentive offered by CDM can help to stimulate investment into early opportunity CDM projects, which can provide important spillover learning effects for a second phase of deployment, focussed on the fossil-fuel fired power sector at some point in the future (2025+). In particular, it can assist in building knowledge about the efficacy of large-scale sub-surface CO2 storage, and help build institutional capacity to accommodate CCS in those jurisdictions where CO2 emissions are rising most rapidly. Parallel research – focussed in Annex I countries but also through cooperative research between Annex I and non-Annex I countries – over this period on CO2 capture demonstration can serve to support a technology development pathway for CCS over the next 15-20 years. To reiterate: Annex I and cooperative research between Annex I and non-Annex I countries focussed on development and demonstration of CO2 capture on fossil fuel-fired power plants, coupled with parallel demonstration of CO2 storage applied to early opportunity CCS projects to support improved knowledge on subsurface CO2 storage and attendant legal institutional issues. CCS inclusion within the CDM could thus serve as a useful bridging step in supporting the technological development pathway for CCS over the next 10-15 years and beyond.

ENVIRONMENTAL RESOURCES MANAGEMENT IEA GHG
A1
Appendix A
Detailed cost methodology

ENVIRONMENTAL RESOURCES MANAGEMENT IEA GHG
A2
A1 COST COMPILATION
A1.1 INTRODUCTION
This appendix outlines ERM’s approach to developing capital and operating cost estimates for the application of carbon capture and storage (CCS) to different sectors and activities. The sectors/activities covered within the scope of the study include:
• Natural gas processing including liquefied natural gas (LNG); • Chemical processes including ethanol, hydrogen, ammonia and
fertiliser production; • Petroleum refineries; • Fossil fuel fired power plants; and • Cement plants.
The cost estimates represent marginal costs for the addition of CCS to conventional plants, which are those costs incurred by installing additional equipment required to capture, compress, transport and store CO2. For some activities, CO2 capture is already an integral part of the process, where the CO2 rich off-gas stream from is typically vented to the atmosphere. In this case the cost of CO2 capture is considered to be non-marginal and therefore the marginal cost relates only to compression, transportation and storage. In developing the cost estimates for CCS, equipment inventories for the required CCS components in different sectors/activities were established. Subsequently, the associated capital and operating cost of each the components were developed.
A1.1.1 Capital costs
Typical marginal capital cost components for CCS include:
• Gas compression costs; • Compression auxiliary equipment costs; • Construction and engineering costs; • Pipeline costs; • Storage site infrastructure costs (prospecting, reception facilities,
injection facilities, injection wells etc); • Offshore engineering costs (for offshore storage sites e.g. platforms,
umbilicals); and • Storage site monitoring (passive systems), closure and
decommissioning costs. In addition, there are certain activity-specific cost elements, such as the use of selective catalytic reduction (SCR) to remove NOX from the exhaust flue gases before the CO2 is captured in cement plants (in addition to the cost of the CO2

ENVIRONMENTAL RESOURCES MANAGEMENT IEA GHG
A3
capture plant). Similarly, power-plants require the use of amine technology to separate the CO2 stream from the flue gas, as injection well as the use of Flue Gas Desulphurisation (FGD) and SCR. These technologies may not be standard fit for these activities in certain regions, but are required to avoid degradation of the solvents used to remove CO2, or to avoid contamination of the CO2 injection stream.
A1.1.2 Operating costs
Typical marginal operating cost elements for CCS include:
• Power for operation of the capture and compression components of CCS projects;
• Capture and compression plant operation and maintenance; • Pipeline operation and maintenance; • Injection well operation and maintenance; and • Any other additional operational and maintenance; and • Storage site monitoring.
It is considered unlikely that individual plant operators would develop and operate CO2 storage sites themselves; rather they would enter into a commercial agreement with a contractor who would manage the CO2 injection and storage on their behalf. In order to reflect the commercial relationships that would evolve, the costs calculated for CO2 storage for natural gas processing were used to develop a ‘gate fee’ that would be payable by plant operators to CO2 injection and storage contractors. A unit cost per tonne CO2 ($/tCO2) was calculated based on a 1 million tCO2/yr storage project. This involved estimates the following components calculated for gas processing:
• Injection well infrastructure costs; • Injection well operation and maintenance costs; • Storage monitoring cost; • A margin assumed to be applied by a storage site operator; and • Offshore multiplier used to scale up the cost for offshore processing
projects only (described below).
A1.1.3 Cost adjustment factors
Several cost adjustment factors have been employed to reflect variations in different CCS capital costs, relative to the standard “book” price for capital equipment. These factors relate to the additional costs associated with retrofitting equipment relative to new build equipment costs, undertaking capital works offshore relative to onshore works, and developing storage sites in deep water relative to shallow water. The assumptions used in developing cost variations are described below.
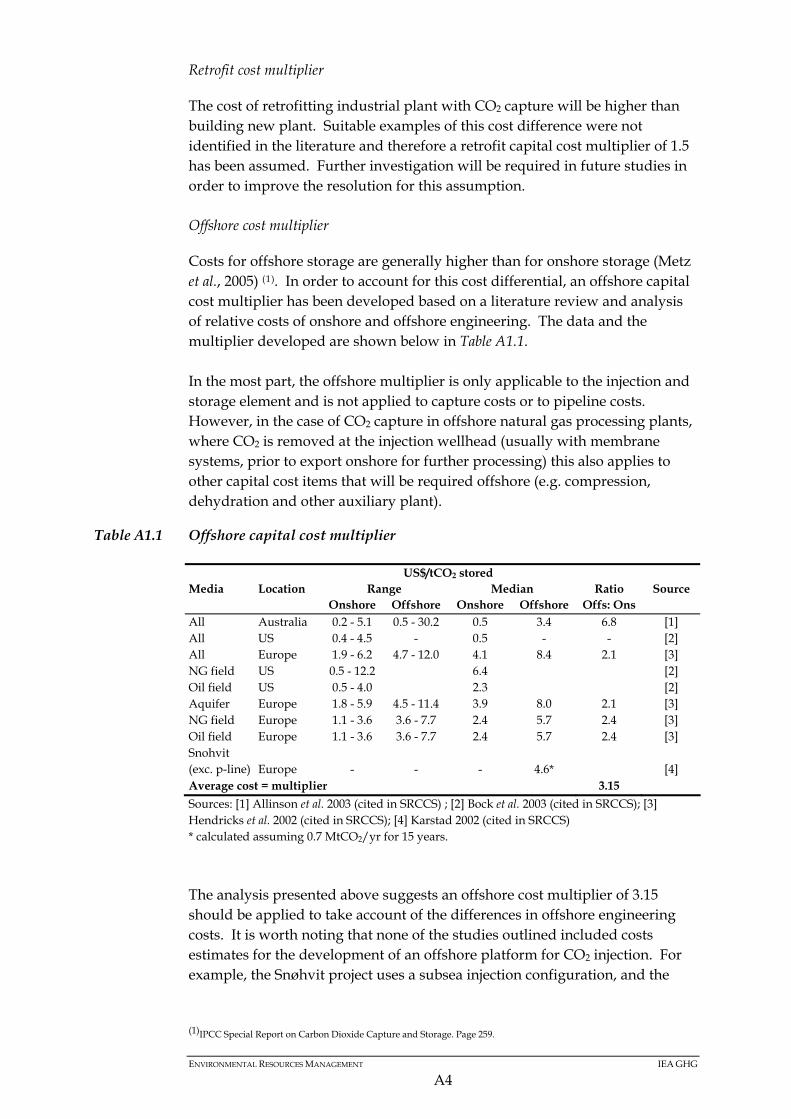
ENVIRONMENTAL RESOURCES MANAGEMENT IEA GHG
A4
Retrofit cost multiplier
The cost of retrofitting industrial plant with CO2 capture will be higher than building new plant. Suitable examples of this cost difference were not identified in the literature and therefore a retrofit capital cost multiplier of 1.5 has been assumed. Further investigation will be required in future studies in order to improve the resolution for this assumption. Offshore cost multiplier
Costs for offshore storage are generally higher than for onshore storage (Metz et al., 2005) (1). In order to account for this cost differential, an offshore capital cost multiplier has been developed based on a literature review and analysis of relative costs of onshore and offshore engineering. The data and the multiplier developed are shown below in Table A1.1. In the most part, the offshore multiplier is only applicable to the injection and storage element and is not applied to capture costs or to pipeline costs. However, in the case of CO2 capture in offshore natural gas processing plants, where CO2 is removed at the injection wellhead (usually with membrane systems, prior to export onshore for further processing) this also applies to other capital cost items that will be required offshore (e.g. compression, dehydration and other auxiliary plant).
Table A1.1 Offshore capital cost multiplier
US$/tCO2 stored Media Location Range Median Ratio Source Onshore Offshore Onshore Offshore Offs: Ons All Australia 0.2 - 5.1 0.5 - 30.2 0.5 3.4 6.8 [1] All US 0.4 - 4.5 - 0.5 - - [2] All Europe 1.9 - 6.2 4.7 - 12.0 4.1 8.4 2.1 [3] NG field US 0.5 - 12.2 6.4 [2] Oil field US 0.5 - 4.0 2.3 [2] Aquifer Europe 1.8 - 5.9 4.5 - 11.4 3.9 8.0 2.1 [3] NG field Europe 1.1 - 3.6 3.6 - 7.7 2.4 5.7 2.4 [3] Oil field Europe 1.1 - 3.6 3.6 - 7.7 2.4 5.7 2.4 [3] Snohvit (exc. p-line) Europe - - - 4.6* [4] Average cost = multiplier 3.15 Sources: [1] Allinson et al. 2003 (cited in SRCCS) ; [2] Bock et al. 2003 (cited in SRCCS); [3] Hendricks et al. 2002 (cited in SRCCS); [4] Karstad 2002 (cited in SRCCS) * calculated assuming 0.7 MtCO2/yr for 15 years. The analysis presented above suggests an offshore cost multiplier of 3.15 should be applied to take account of the differences in offshore engineering costs. It is worth noting that none of the studies outlined included costs estimates for the development of an offshore platform for CO2 injection. For example, the Snøhvit project uses a subsea injection configuration, and the
(1)IPCC Special Report on Carbon Dioxide Capture and Storage. Page 259.

ENVIRONMENTAL RESOURCES MANAGEMENT IEA GHG
A5
Hendriks et al. (2002) study assumed that old offshore infrastructure would be used. Inclusion of platform infrastructure costs would add significantly the costs of the overall development of an offshore CO2 storage site. Estimates might be in the order of US$200 million (M), which could add around $10-20+/tCO2 to the overall cost of storage (assuming a $200M capital cost for a platform for a 1 MtCO2/yr project operating for 20 years). Deep water injection cost multiplier
A deep water capital cost multiplier has been developed based on the study by Gately (2007), who examined the investment cost of energy extraction in the Gulf of Mexico. Gately provided cost elements for well drilling at different depths as shown in Table A1.2. The multiplier was developed to take account of cost differences in deep and shallow water injection and is applied to the capital cost of the injection well.
Table A1.2 Deep water injection cost multiplier
Exploratory and development drilling (Cost per well drilled) 0–60 m $5,865,392 61–200 m $4,161,688 201–900 m $8,263,864 900 m+ $14,086,352 Shallow (average of 0-60m and 61-200m) $5,013,540 Deep (average of 201-900 and 900m+) $11,175,108 Multiplier 2.23
The analysis presented above suggests a deep water multiplier of 2.23 should be applied to take account of the difference in injection well costs. Gately also provides data to differentiate between pipeline capital costs for deep and shallow water. A deep water multiplier has not been applied to pipeline costs, however, since the uncertainty around these assumptions would not be possible to resolve within the scope of this study. In addition, the deep/shallow water differentiator is not applied to CO2 transported from sources such as chemical plants, cements plants and refineries since it is assumed that injection of CO2 from these sources takes place in shallow waters only.
A1.2 KEY DATA SOURCES
The key sources from which cost estimates are drawn are presented in Table A1.3. As can be seen, the study draws heavily on the paper entitled ‘Techno-Economic Models for Carbon Dioxide Compression, Transport, and Storage’ by McCollum and Ogden (2006), hereafter referred to as the ‘UCD cost paper’.

ENVIRONMENTAL RESOURCES MANAGEMENT IEA GHG
A6
Table A1.3 Key data sources
Capital costs Data source Gas compression McCollum and Ogden (2006) Compression auxiliary equipment Fisher et al. (2005) Construction and engineering ERM assumption Pipeline McCollum and Ogden (2006) Injection well McCollum and Ogden (2006) Operating costs Power costs - compressors and pumps McCollum and Ogden (2006) Plant operation and maintenance McCollum and Ogden (2006) Pipeline operation McCollum and Ogden (2006) Injection well operation and maintenance McCollum and Ogden (2006) Storage monitoring Metz et al. (2005) Process-specific cost elements Refineries Simmonds et al. (2002) Power plants ECN (2007) Cement plants IEA GHG (2008) Cost adjustment factors New Build versus Retrofit ERM assumption Onshore versus Offshore References cited in Metz et al. (2005)
(IPCC Special Report) as detailed in Table 1.1.
Shallow water versus Deep water Gately (2007)
The derivation of these cost elements is described further in the following sections. A summary of the costs for a natural gas processing plant emitting 1Mt CO2 per annum is presented in Table A1.4.

ENVIRONMENTAL RESOURCES MANAGEMENT IEA GHG
A7
Table A1.4 Capital and operating costs for a natural gas processing plant emitting 1MtCO2 per annum
Capital cost element Cost (M$) Gas compression costs Compressor(s) $29.2 Pump(s) $1.0 Compression auxiliary equipment Interstage cooler(s) $4.1 Interstage seperator(s) $0.7 Dryers $24.5 Construction and engineering costs $23.8 Pipeline costs Length < 50 km $15.8 Length > 50 < 750 km $165.4 Length > 750 km $336.5 Injection well costs $2.7 Operating cost element Power costs Compressor(s) $0.4 Pump(s) $0.03 Plant operation and maintenance $2.4 Pipeline operating costs Length < 50 km $0.4 Length > 50 < 750 km $4.1 Length > 750 km $8.4 Injection well operation and maintenance costs $0.1 Storage monitoring costs $0.2 TOTAL $619.8
Note that power costs vary across different sectors. The power cost for natural gas processing is assumed to be minimal since the operator would not pay the wholesale price for the fuel. Operators of other types of plant would pay the full price and would therefore incur higher power costs. In the case of power plants, the cost of power effectively becomes an ‘energy penalty’ since the power used is power that is not available for sale.
A1.3 CAPITAL COSTS FOR NATURAL GAS PROCESSING
A1.3.1 Gas compression capital cost
After the CO2 is captured from the natural gas processing acid-gas removal plant off gas stream it must be compressed from pressure to a pressure suitable for pipeline transport. In the UCD cost paper, the pressure of the CO2 exiting a CO2 removal plant is assumed to be equal to atmospheric pressure (Pinitial = 0.1 MPa). The final pressure requirement of injection is assumed to be 150 barg (Pfinal = 15 MPa). At Pinitial the CO2 exists as a gas. At 15 MPa the CO2 is in either the liquid or ‘dense phase’ regions, depending on the temperature. Therefore, CO2 undergoes a phase transition somewhere between these initial and final pressures.

ENVIRONMENTAL RESOURCES MANAGEMENT IEA GHG
A8
The UCD cost paper adopts a mixed approach to CO2 compression and CO2 pumping, based on the phase change occurring for CO2 at compression greater than 7.38 MPa. After the CO2 reaches this stage, it is in a liquid phase which lends itself to pumping rather than compression. The UCD cost paper also proposes a five-stage compression process. The equations provided in the UCD cost paper have been used to calculate both power requirements and cost for compressors and pumps, generating the data presented in Table A1.5 and Table A1.6.
Table A1.5 Compressor power and capital cost data (compression from 0.1 to 7.38 MPa)
Parameter Value CO2 mass flow rate (t/day) 1,100,000 Power, kW 12,602 Cost, M$ 29.2
Table A1.6 Pump power and capital cost data (compression from 7.38 MPa to 15 MPa)
Parameter Value CO2 mass flow rate (t/day) 1,100,000 Power, kW 729 Cost, M$ 1.0
Capacity factor for compression plant design Note that in calculating the cost of compressors, an assumed capacity factor of 10% over-specification factor has been applied. So, for example, for a plant emitting 1MtCO2, the plant is designed for a mass flow rate of 1.1MtCO2.
A1.3.2 Compression auxiliary equipment capital costs
The UCD study does not include the cost of compression auxiliary plant, and therefore alternative data sources for these items of equipment were identified. Costs have been derived from data from four key studies, all of which looked into removal of CO2 from power plant flue gas:
• Fisher et al. (2005); • Singh et al. (2003); • Kadam (1997); and • Choi et al. (2005).
Cost factors were taken from a study by Fisher et al. (2005) for CO2 interstage coolers and CO2 interstage separators. The cost factor is equal to the cost of the item of equipment divided by the cost of the compressors. A cost factor of 0.141 was calculated for CO2 interstage coolers and a factor of 0.025 was calculated for CO2 interstage separators.

ENVIRONMENTAL RESOURCES MANAGEMENT IEA GHG
A9
To establish a cost multiplier for drying plant, data from all four papers was analysed. It can be seen from Table A1.7 that the cost of a dryer plant is typically 0.84 times the cost of the compressors.
Table A1.7 Compression and amine plant cost calculations
Source Compressor cost
Compressor and dryer cost
Amine plant cost
Cost of dryer plant
Cost amine plant / cost of compressor
Cost amine plant / cost of compressor and dryer
Cost dryer / cost of compressor
From Fisher et al. (2005) Table 5-1 $7,215,000 - $46,635,900 - 6.46 - - Table 5-2 $19,380,000 - $43,102,200 - 2.22 - - Table 5-3 $17,469,000 - $42,305,900 - 2.42 - - Table 5-4 $13,854,000 - $43,740,200 - 3.16 - - Table 5-5 $7,341,000 - $50,006,200 - 6.81 - - Table 5-6 $20,537,000 - $46,030,200 - 2.24 - - From Singh et al. (2003) Table 7 $20,147,300 $34,388,603 $76,364,330 $14,241,303 3.79 2.22 0.71 Table 8 $14,022,206 $28,263,509 $99,470,022 $14,241,303 7.09 3.52 1.02 From Kadam (1997) Table 4 $26,351,776 $52,359,500 $112,785,600 $26,007,724 2.15 0.99 From Choi et al. (2005) Table 2 $14,154,673 $23,370,000 $60,582,000 $9,215,327 2.59 0.65 Multiplier 4.28 2.62 0.84
Note: Data highlighted in bold indicates calculated data. Here the 4.28 multiplier has been applied to the amine plant cost to estimate the compressor cost.
A1.3.3 Construction and engineering costs
To take account of construction and engineering costs, a fixed rate of 40% of total capital cost has been assumed. This assumption is estimated from typical values in a range of published studies and covers the following:
• Construction • Engineering • Engineering & construction management • Electrical • Piping • Insulation & coating • Instrumentation • Utilities • Contractors fee • Contingency
So, for a natural gas processing plant, the cost for construction and engineering would be 40% of the cost of the compressors, pumps and auxiliary equipment.

ENVIRONMENTAL RESOURCES MANAGEMENT IEA GHG
A10
A1.3.4 Pipeline costs
For gas processing it has been assumed that CO2 is injected in-situ, since it is assumed that the gas is processed at the location of the gas field. In the case of Liquefied Natural Gas (LNG) plants, however, the CO2 must be returned from the location of the LNG plant to the location of the originating gas field. A transportation cost is therefore incurred, associated with the construction of the pipeline. To calculate pipeline costs, the following equation provided in the UCD cost study was used:
Pipeline capital cost ($/km) = (9970 * m0.35) * L0.13 where m is the CO2 mass flow rate (tonne/day) and L is the pipeline length (McCollum, 2006). This equation gives costs in USD2005 so an adjustment was made for 2008 costs. The equation for calculating pipeline capital cost was derived from seven other pipeline models, all of which are recent and reliable. Three pipeline lengths were used in the study, one for short pipelines (less than 50 km), one for medium length pipelines (50 km to 750km) and one for long pipelines (greater than 750 km). For pipelines less than 50 km in length, the 50 km values were used. For pipelines longer than 50 km but shorter than 750 km, the 400 km values were used. For pipelines with a length greater than 750 km, the 750 km values were used. By multiplying the cost by the pipeline length, the total capital cost was calculated for three different pipeline lengths (CO2 mass flow rate of 1,100,000 t/year), as shown in Table A1.8.
Table A1.8 Pipeline capital costs, $M
Length Cost, M$ < 50 km $15.8 > 50 < 750 km $165.4 > 750 km $336.5
Over-specification of pipeline design Note that in calculating the pipeline costs, an over-specification factor of 10% has been applied. So, for example, for a plant emitting 1MtCO2 per annum, the pipeline is designed for a mass flow rate of 1.1MtCO2.

ENVIRONMENTAL RESOURCES MANAGEMENT IEA GHG
A11
A1.3.5 Injection well capital costs
Injection well capital costs were estimated using the equations in the UCD cost study, where the total cost is the sum of the cost of site screening and evaluation (Csite), cost of injection equipment (Cequip) and cost of drilling (Cdrill).
Ctotal = Csite + Cequip + Cdrill Injection equipment costs include injection supply wells, plants, distribution lines, headers, and electrical services. It was assumed that only one injection well is required per 1MtCO2 injected per annum, that all CO2 is injected into depleted gas fields, and that the gas field has a depth of 1,500m. For a CO2 mass flow rate of 1 Mt per annum, the data presented in Table A1.9 was generated.
Table A1.9 Injection well drilling capital costs, $
Cost item Cost, $ Csite $2,141,875 Cequip $178,276 Cdrill $406,900 Ctotal $2,727,051
A1.3.6 Storage site closure and decommissioning
Research into the cost of site closure and decommissioning did not yield results suitable for application in this study and therefore these costs have not been included. Further investigation into this cost element is required.
A1.4 OPERATING COSTS FOR NATURAL GAS PROCESSING
The total operating cost for CCS for a natural gas processing plant includes the following elements:
• Power costs; • Plant operation and maintenance costs; • Pipeline operation and maintenance costs; • Injection well operation and maintenance costs; and • Storage monitoring costs.
Other monitoring costs such as flow metering on pipework were assumed to be minor.
A1.4.1 Power costs
For natural gas processing CCS there is a cost associated with the power requirement of the compressors and pumps. It was assumed that all

ENVIRONMENTAL RESOURCES MANAGEMENT IEA GHG
A12
compressors and pumps are gas fired and therefore the cost is cost based on the price of natural gas. The cost per kWh for natural gas was derived from data from the US EIA1, which gives the price of natural gas (industrial delivered price, Pacific Census Region) in August 2008 as $12.45/mcf, which is equivalent to $0.0412/kWh. It was assumed that the costs incurred by a platform operator for natural gas would be nominal and was taken to be 10% of the wholesale cost ($0.004/kWh). The compressor and pump power rating was taken from Table A1.5 and Table A1.6, and it was assumed that the equipment operates full time with a two-week shut-down. The power cost for a CO2 mass flow rate of 1.1 Mt per annum was calculated as shown in Table A1.10.
Table A1.10 Compressor and Pump Power Costs
Cost item Cost, $/yr Compressor power $436,147 Pump power $25,230
A1.4.2 Plant operation and maintenance costs
To calculate the operation and maintenance cost for the compressors and pumps, the UCD cost study applied a factor of 4%. In other research on CO2 capture from a coal-fired power plant, Singh et al. (2003) also calculated Operation and Maintenance (O&M) costs to be 4% of the plant capital cost. This fixed percentage for O&M has therefore been applied in this study. The O&M factor was applied to the capital cost of all plant equipment, which for natural gas processing includes compressors, pumps, and auxiliary equipment.
A1.4.3 Pipeline operation and maintenance costs
For gas processing it has been assumed that CO2 is injected in-situ, since it is assumed that the gas is processed at the location of the gas field. In the case of Liquefied Natural Gas (LNG) plants, however, the CO2 must be returned from the location of the LNG plant to the location of the originating gas field. A pipeline operation and maintenance (O&M) cost is therefore incurred. The O&M costs for the pipeline, which were calculated as 2.5% of the total capital cost of the pipeline, are presented in Table A1.11. The 2.5% factor was taken from the UCD cost study in which the authors extracted an average O&M factor from a handful of studies on CO2 pipeline transport.
(1) 1 http://tonto.eia.doe.gov/steo_query/app/ngpage.htm

ENVIRONMENTAL RESOURCES MANAGEMENT IEA GHG
A13
Three pipeline lengths were used in the study, one for short pipelines (less than 50 km), one for medium length pipelines (50 km to 500km) and one for long pipelines (greater than 500 km). For pipelines less than 50 km in length, the 50 km values were used. For pipelines longer than 50 km but shorter than 750 km, the 400 km values were used. For pipelines with a length greater than 500 km, the 750 km values were used.
Table A1.11 Pipeline operation and maintenance costs, $M
Length Cost, $/yr < 50 km $0.4 > 50 < 500 km $4.1 > 500 km $8.4
A1.4.4 Injection well operation and maintenance costs
Injection well operation and maintenance costs are taken from the UCD cost study and are grouped into the following four categories: Normal Daily Expenses (O&Mdaily), Consumables (O&Mcons), Surface Maintenance (O&Msur), and Subsurface Maintenance (O&Msubsur), where
O&Mtotal = O&Mdaily+ O&Mcons + O&Msur + O&Msubsur Again, it assumed that only one injection well is required and that the storage reservoir has a depth of 1,500m. The total injection well operation and maintenance cost, O&Mtotal, for a CO2 mass flow rate of 1 Mt per annum is presented in Table A1.12.
Table A1.12 Injection well operation and maintenance costs, $
Cost item Cost, $/yr O&Mdaily $8,758 O&Mcons $23,399 O&Msur $55,611 O&Msubsur $8,043 O&Mtotal $95,810
A1.4.5 Storage monitoring costs
Storage monitoring costs are assumed to be $0.2/tCO2 injected based on data provided in the Technical Summary of the Special Report (Metz et al., 2005) monitoring and verification. The IPCC give a range of $0.1-0.3/tCO2 injected, which covers pre-injection, injection, and post-injection monitoring, and depends on the regulatory requirements. In this study the mid-range value was adopted.

ENVIRONMENTAL RESOURCES MANAGEMENT IEA GHG
A14
A1.5 COSTS FOR CHEMICAL PRODUCTION
The costs for the application of CCS in chemical production has been developed based on the following CO2 sources:
• Ethanol production; • Hydrogen production; • Ammonia production; and • Fertiliser production.
A1.5.1 Chemical production capital costs
The marginal capital costs for CO2 capture from a chemical plant are assumed to comprise of the same cost elements as for a natural gas processing plant, including:
• Gas compression costs; • Compression auxiliary equipment costs; • Construction and engineering costs; • Pipeline costs; • Injection well costs; and • Storage costs.
For all costs except injection well and storage costs, the calculation of these costs followed the same method described for natural gas processing. The costs associated with injection and storage were captured by the gate fee, as described below.
A1.5.2 Chemical production operating costs
As before, operation and maintenance costs are taken to be 4% of the equipment capital cost (compressors, pumps and auxiliary equipment) plus 2.5% of the pipeline capital cost. Power costs were calculated in the same way as they were calculated for natural gas processing, however the wholesale gas price was applied. The cost associated with CO2 injection and storage for chemical production was captured by the ‘gate fee’. Gate fee
The cost of injection and storage for natural gas processing CCS has been analysed to obtain a fixed operating cost that can be applied to all other project types. This cost has been termed the ‘gate fee’ and covers the following:
• Injection well infrastructure costs; • Injection well operation and maintenance costs; and

ENVIRONMENTAL RESOURCES MANAGEMENT IEA GHG
A15
• Storage monitoring costs. The gate fee has been calculated as $0.96/tCO2 injected for onshore injection projects and $3.02/tCO2 injected for offshore injection projects. Comparing these values with the Special Report (Metz et al., 2005) it can be seen that the gate fee is within the suggested range. The results of the IPCC storage cost assessment indicates that there is significant potential for storage at costs in the range of $0.5–8/tCO2 stored (excluding monitoring costs, well remediation and longer term costs).

ENVIRONMENTAL RESOURCES MANAGEMENT IEA GHG
A16
A1.6 COSTS FOR PETROLEUM REFINERIES
This study examined two potential configurations for application of CCS in refineries:
1. Capture of all emissions from the plant with the exception of emissions from the hydrogen production plant (85% of all emissions) requiring the development of a fully integrated CCS system (capture, treatment and compression); and
2. Capture of emissions from the hydrogen plant only (15% of all emissions). This is a high purity CO2 offgas stream and therefore there is no additional cost for CO2 capture.
The capital and operating costs for each configuration are summarised below.
A1.6.1 Petroleum refineries capital costs
Non-hydrogen emissions capture
In their paper on post combustion CO2 capture, Simmonds et al. (2003) examined the cost of retrofitting an amine based capture facility to a refining and petrochemical complex. The facility was designed to capture 2 Mt per annum of carbon dioxide for pipeline transmission to a North Sea oil field. Data was provided by Simmonds for following cost elements:
• Gas gathering systems; • NOx and SOx removal; • Econamine FGSM ; • CO2 drying and compression; and • Utility and offsite systems.
This data was used to estimate capital cost per tonne of CO2 captured and was applied in the study in a similar way to previous cost calculations. The data already pertained to retrofit plant and therefore no cost adjustment was required. For a typical refinery producing 1MtCO2 per annum, the capital costs are presented in Table A1.13.
Table A1.13 Petroleum refineries capital costs, $
Cost item Cost, $ Gas gathering systems $26,184,328 NOx and SOx removal $49,683,085 Econamine FGSM $111,451,244 CO2 drying and compression $32,226,866 Utility and offsite systems $100,037,562
ENVIRONMENTAL RESOURCES MANAGEMENT IEA GHG
A17
Pipeline capital costs comprise a separate cost element and were calculated in the same way as described for natural gas processing. Hydrogen only emissions
To calculate the capital cost associated with emissions from the hydrogen plant, the costs associated with gas gathering and treatment (NOX, SOX and amine plant) have been excluded from the analysis.
A1.6.2 Petroleum refineries operating costs
Operating costs were calculated using the methodology described for gas processing, with the exception of power costs. As for the operating costs for Chemical Processes, the Gate Fee was applied to calculate the operating cost associated with injection and storage. In addition to the power requirements of compression, the refinery CCS project described by Simmonds et al. (2003) incurs power costs associated with the capture system and amine plant. The blower power demand to push flue gases through this ducting network is around 15 megawatts, with a further 10 megawatts required to power additional blowers to overcome the pressure drop imposed by the structured packing of the Econamine FGSM absorbers and the downstream stack. Furthermore, the post combustion capture plant has an energy requirement of 396 megawatts, fired as natural gas in the combined heat and power (CHP) plant to produce steam and power from a back pressure turbine. To take account of the extra energy penalties, it is assumed that compressor and pump costs constitute 65% of the total power cost. This assumption is based on an assessment of the data provided by Simmonds et al. (2003) and the data in the IEA GHG Draft Report on CO2 capture in the cement industry (IEA GHG, 2008).

ENVIRONMENTAL RESOURCES MANAGEMENT IEA GHG
A18
A1.7 COSTS FOR CEMENT PRODUCTION
The cost of deploying CCS at cement plants has been taken from a recent publication from the IEA Greenhouse Gas R&D Programme (IEA GHG, 2008). This study examined two potential configurations for application of CCS in cement plants:
1. Where kiln emissions are captured using post-combustion (amine) technologies. This included the capture of CO2 from an onsite combined heat and power plant (CHP) to provide steam for amine regeneration; and,
2. Oxy-firing in the pre-calciner, which would lead to approximately 61% of the total emissions from the plant being captured i.e. not oxy-firing in the kiln.
The capital and operating costs for each configuration are summarised below.
A1.7.1 Cement production capital costs
Post Combustion capture
The capital cost for ‘Post Combustion capture’ includes the following cost elements:
• Capture plant (amine); • Compressor plant; • Flue gas desulphurisation (FGD); • Selective catalytic reduction (SCR); • Combined Heat and Power (CHP); • Construction and Engineering; and • Pipeline costs.
For a typical plant producing 1MtCO2 per annum, the capital costs for ‘Post Combustion capture’ are presented in Table A1.14.
Table A1.14 Post Combustion capture capital costs
Cost item Cost, $ Capture plant (amine) $40,291,448 Compressor plant $8,334,144 Other capital items (FGD, SCR, CHP) $99,689,184 Construction and Engineering $173,093,760
Pipeline capital costs were calculated in the same way as described for natural gas processing.

ENVIRONMENTAL RESOURCES MANAGEMENT IEA GHG
A19
Oxyfuel firing - pre-calciner emissions only
The capital cost for Oxyfuel firing - pre-calciner emissions only includes the following cost elements:
• Air separation unit (ASU); • Flue Gas Recycle (FGR); • Compressor plant; • Organic Rankine Cycle (ORC) heat recovery; • Electrostatic precipitator (ESP); • Construction and Engineering; and • Pipeline.
For a typical plant producing 1MtCO2 per annum, the capital costs for ‘Oxyfuel firing - pre-calciner emissions only’ are presented in Table A1.15.
Table A1.15 Oxyfuel firing capital costs
Cost item Cost, $ Capture plant (amine) $11,219,040 Compressor plant $5,951,586 Other capital items (FGD, SCR, CHP) $7,909,345 Construction and Engineering $23,493,103
Pipeline capital costs were calculated in the same way as described for natural gas processing.
A1.7.2 Cement production operating costs
Post Combustion capture
The operating cost for ‘Post Combustion capture - all kiln emissions’ includes the following:
• Coal requirements for CHP; • Petcoke requirements; • Power; • Other OPEX; • Catalyst (SCR); • Limestone for FGD; • Process water; • Cooling water; • Power output (CHP); • Transportation; and • Gate Fee.
For a typical plant producing 1MtCO2 per annum, the operating costs for ‘Post Combustion capture - all kiln emissions’ are presented in Table A1.16.

ENVIRONMENTAL RESOURCES MANAGEMENT IEA GHG
A20
Table A1.16 Post Combustion capture operating costs
Cost item Cost, $ All OPEX $47,686,262 Gate fee $1,118,584
The gate fee was calculated in the same way as described for Chemical Processes. Oxyfuel firing - pre-calciner emissions only
The operating cost for ‘Oxyfuel firing - pre-calciner emissions only’ includes the following:
• Coal requirements; • Petcoke requirements; • Power; • Other OPEX; • Process water; • Cooling water; • Transportation; and • Gate Fee.
For a typical plant producing 1MtCO2 per annum, the operating costs for ‘Oxyfuel firing - pre-calciner emissions only’ are presented in Table A1.17.
Table A1.17 Oxyfuel firing operating costs
Cost item Cost, $ All OPEX $34,949,907 Gate fee $1,118,584
The gate fee was calculated in the same way as described for Chemical Processes.

ENVIRONMENTAL RESOURCES MANAGEMENT IEA GHG
A21
A1.8 COSTS FOR FOSSIL FUEL FIRED POWER GENERATION
The costs for fossil fuel fired power generation were taken from the study by the ECN on carbon credit supply potential (Bakker et al, 2007). The ECN applied a similar methodology to the one applied here to estimate the cost and technical potential of various CDM technologies. The study took account of two options for newly build power plants:
• New coal-fired power plants; and • New gas-fired power plants.
These are described in the main body of the report.

ENVIRONMENTAL RESOURCES MANAGEMENT IEA GHG
A22
A1.9 PLANT COST INDICES
All cost data was adjusted to 2008 prices using the USA Chemical Engineering (CE) Plant Cost Index, as presented in Table A1.18. Few countries outside of the USA and UK produce and publish comprehensive capital cost indices. The Chemical Engineering (CE) Plant Cost Index was chosen since this is a injection well-established, complex, multi-component index (Gerrard, 2002), and is more widely used than other indices.
Table A1.18 Application of plant cost indices
Year data was published
USA Plant Cost Index
Data Source
1990 357.6 Gerrard (2002) 1991 361.3 Gerrard (2002) 1992 358.2 Gerrard (2002) 1993 359.2 Gerrard (2002) 1994 368.1 Gerrard (2002) 1995 381.1 Gerrard (2002) 1996 381.7 Gerrard (2002) 1997 386.5 Gerrard (2002) 1998 389.5 Gerrard (2002) 1999 390.6 Gerrard (2002) 2000 394.1 CEPCI (2008) 2001 394.3 CEPCI (2008) 2002 395.6 CEPCI (2008) 2003 402.0 CEPCI (2008) 2004 444.2 CEPCI (2008) 2005 468.2 CEPCI (2008) 2006 499.6 CEPCI (2008) 2007 525.4 CEPCI (2008) 2008 539.8 CEPCI (2008)

ENVIRONMENTAL RESOURCES MANAGEMENT IEA GHG
A23
A1.10 REFERENCES USED IN COST COMPILATION
Chemical Engineering Plant Cost Index (CEPCI) (2008) (Economic Indicators) (Statistical table) (Brief article). Chemical Engineering 115.6, 88 (1). Academic OneFile. Gale. University of Cape Town, South Africa. Choi, G.N., Chu, R., Degen, B., Wen, H., Richen, P.L., Chinn, D. (2005). CO2 removal from power plant flue gas-cost efficient design and integration study. Carbon Dioxide Capture for Storage in Deep Geologic Formations, Volume 1 (Thomas, D.C., and Benson, S.M., Ed.) Chapter 5, 99-116. Bakker, S.J.A., Arvanitakis, A.G., Bole, T., van de Brug, E., Doest, C.E.M., Gilbert, A. (2007) Carbon credit supply potential beyond 2012, ECN (ref: ECN-E—07-090) Fisher, K. S., Beitler, C., Rueter, C., Searcy, K., Rochelle, G., Jassim, M. (2005) Integrating MEA Regeneration with CO2 compression and peaking to reduce CO2 capture costs. Final Report Submitted June 09 2005 to U.S. Department of Energy National Energy Technology Laboratory. Freund, P., Davison, J. (2002) General overview of costs. Proceedings of the IPCC Workshop on carbon dioxide capture and storage, Regina, Canada, 79-94. Gately, M., (2007). The EROI of U.S. offshore energy extraction: a net energy analysis of the Gulf of Mexico. Ecological Economics 63, 355–364 Gerrard, A. M. Ed. (2002). Guide to Capital Cost Estimating (Paperback). The Institution of Chemical Engineers (IChemE), Rugby, UK Hamilton, M., Herzog, H. (2008) Cost Update for the Future of Coal, MIT Energy Initiative, Massachusetts Institute of Technology, 77 Massachusetts Ave. Cambridge, MA 02139 E40-443 Herzog, H., Drake, E., Adams, E. (1997). CO2 capture, reuse, and storage technologies for mitigating global climate change- A white paper. Final report. Massachusetts Institute of Technology, Cambridge, U.S.A IEA GHG (2005) Oxy Combustion Processes for CO2 Capture from Power Plant. IEA Greenhouse Gas R&D Programme Report number: 2005/9, July 2005. IEA GHG (2008) IEA GHG Draft Report on CO2 Capture in the Cement Industry. Kadam, K.L. (1997). Power plant flue gas as a source of CO2 for microalgae cultivation: economic impact of different process options. Energy Conversion and Management 38, S505–S510

ENVIRONMENTAL RESOURCES MANAGEMENT IEA GHG
A24
McCollum, D. L. (2006) Comparing Techno-Economic Models for Pipeline Transport of Carbon Dioxide. Institute of Transportation Studies, University of California-Davis. http://its.ucdavis.edu/ McCollum, D. L., Ogden, J, M. (2006) Techno-Economic Models for Carbon Dioxide Compression, Transport, and Storage & Correlations for Estimating Carbon Dioxide Density and Viscosity. Institute of Transportation Studies, University of California-Davis. http://its.ucdavis.edu/ Metz, B., Davidson. O., De Coninck, H. C., Loos, M., and Meyer, L.A. (eds.) (2005). IPCC Special Report on Carbon Dioxide Capture and Storage. Prepared by Working Group III of the Intergovernmental Panel on Climate Change. Cambridge and New York: Cambridge University Press. Available at http://www.ipcc.ch/pdf/special-reports/srccs/srccs_wholereport.pdf Peeters, A.N.M., Faaij, A.P.C., Turkenburg, W.C. (2007). Techno-economic analysis of natural gas combined cycles with post-combustion CO2 absorption, including a detailed evaluation of the development potential. International journal of greenhouse gas control 1, 396-417 Peters, M.S., Timmerhaus, K.E., West, R.D., Plant Design and Economic of Chemical Engineers- 5th Edition. (2002) McGraw-Hill. McGraw-Hill Cost Estimator Tool: http://www.mhhe.com/engcs/chemical/peters/data/ce.html Rubin, E. S., Chen, C., Rao, A.B. (2007). Cost and performance of fossil fuel power plants with CO2 capture and storage. Energy Policy 35, 4444–4454 Simmonds, M., Hurst, P., Wilkinson, M.B., Watt, C., Roberts, C.A. (2002) A study of very large scale post combustion CO2 capture at a refining & petrochemical complex. Proceedings of the 6th International Conference on Greenhouse Gas Control Technologies, Kyoto, Japan, 39-44. Singh, D., Croiset, E., Douglas, P.L., Douglas, M.A. (2003). Techno-economic study of CO2 capture from an existing coal-fired power plant: MEA scrubbing vs. O2/CO2 recycle combustion. Energy Conversion and Management 44, 3073–3091 Statoil (2003) The Sleipner and Snohvit CO2-Injection Projects. Canadian CO2 capture and storage technology roadmap, 1. Workshop Calgary, Canada, Sept 2003. http://www.nrcan.gc.ca/es/etb/cetc/combustion/co2trm/pdfs/co2trm1_okaarstad.pdf

ERM has over 135 offices across the following countries worldwide Argentina Mexico Australia The Netherlands Belgium New Zealand Brazil Peru Canada Poland Chile Portugal China Puerto Rico Colombia Romania Ecuador Russia France Singapore Germany South Africa Hong Kong Spain Hungary Sweden India Taiwan Indonesia Thailand Ireland United Arab Emirates Italy UK Japan US Kazakhstan Venezuela Korea Vietnam Malaysia ERM’s London Office 8 Cavendish Square London W1G 0ER UK T: +44 (0)20 7465 7200 F: +44 (0)20 7465 7272 www.erm.com
ERM consulting services worldwide www.erm.com