Embed Size (px)
Citation preview

2010 Comprehensive Annual Financial Report
West Virginia Public Employees Insurance Agency 1
CCOOMMPPRREEHHEENNSSIIVVEE
AANNNNUUAALL
FFIINNAANNCCIIAALL
RREEPPOORRTT
FFoorr tthhee FFiissccaall YYeeaarr EEnnddeedd JJuunnee 3300,, 22001100
(an enterprise fund of the primary government of West Virginia)
PPUUBBLLIICC EEMMPPLLOOYYEEEESS
IINNSSUURRAANNCCEE AAGGEENNCCYY

2010 Comprehensive Annual Financial Report
West Virginia Public Employees Insurance Agency 2
TThhiiss PPaaggee WWaass LLeefftt BBllaannkk IInntteennttiioonnaallllyy

2010 Comprehensive Annual Financial Report
West Virginia Public Employees Insurance Agency 3
State of West Virginia
Public Employees Insurance Agency
(an enterprise fund of the primary Government of West Virginia)
Comprehensive Annual
Financial Report
For the fiscal year ended June 30, 2010
Earl Ray Tomblin, Governor
State of West Virginia
Robert W. Ferguson, Jr., Cabinet Secretary
West Virginia Department of Administration
Ted Cheatham, Director
West Virginia Public Employees Insurance Agency
Prepared by:
Jason A. Haught, CPA
Chief Financial Officer
West Virginia Public Employees Insurance Agency
Earl Ray Tomblin, Governor
2010 Comprehensive Annual Financial Report
West Virginia Public Employees Insurance Agency 4
TThhiiss PPaaggee WWaass LLeefftt BBllaannkk IInntteennttiioonnaallllyy

2010 Comprehensive Annual Financial Report
West Virginia Public Employees Insurance Agency 5
State of West Virginia
Public Employees Insurance Agency
Comprehensive Annual Financial Report For the fiscal year ended June 30, 2010
Table of Contents
Introductory Section Page Letter of Transmittal ............................................................................................................9
Principal Officials ..............................................................................................................21
Organizational Chart ..........................................................................................................22
Certificate of Achievement for Excellence in Financial Reporting: FY 06/30/2009 ........23
Financial Section Page
Report of Independent Auditors.........................................................................................25
Management’s Discussion and Analysis ........................................................................27
Basic Financial Statements: Statements of Net Assets ...............................................................................................33
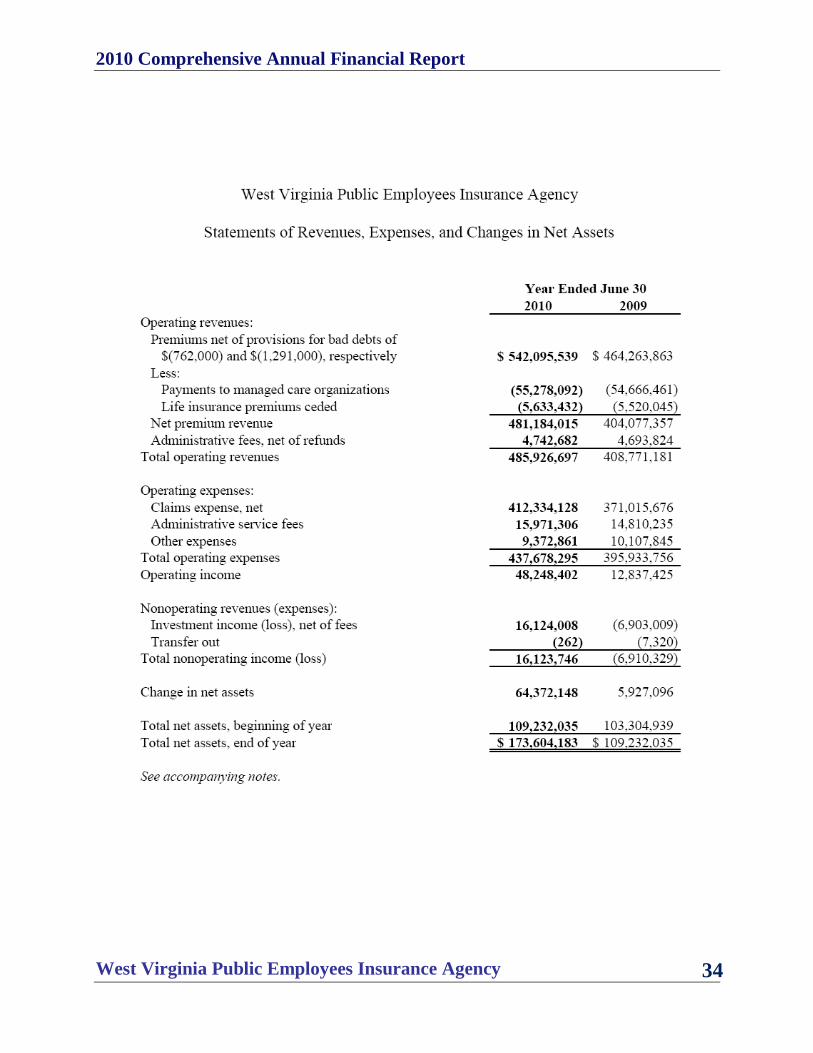
Statements of Revenues, Expenses and Changes in Net Assets ...................................34
Statements of Cash Flows .............................................................................................35
Notes to Financial Statements
(an integral part of the Financial Statements) ........................................................36
Required Supplementary Information: Ten-Year Claims Development Information (Unaudited) .....................................65
Statistical Section Page Schedule 1: Net Assets.......................................................................................................67
Schedule 2: Changes in Net Assets ....................................................................................68
Schedule 3: Changes in Net Assets (By Major Revenue Components) ............................69
Schedule 4: Benefit Deductions from Net Assets by Type ................................................70
Schedule 5: Employer and Employee Health Contribution Rates .....................................71
Schedule 6: Health Policyholder Count by Employer Type ..............................................72
Schedule 7: Demographic and Economic Information ......................................................73
Schedule 8: Principal Participating Employers..................................................................74
Schedule 9: Principal Participating Employers Revenue...................................................75
Schedule 10: Number of Employees by Identifiable Activity ...........................................76
Schedule 11: Policyholder Count by Type of Healthcare Benefit .....................................77
Schedule 12: Average Monthly Claims Cost per Policy/Contract.....................................78

2010 Comprehensive Annual Financial Report
West Virginia Public Employees Insurance Agency 6
TThhiiss PPaaggee WWaass LLeefftt BBllaannkk IInntteennttiioonnaallllyy
2010 Comprehensive Annual Financial Report
West Virginia Public Employees Insurance Agency 7
Introductory Section
A proven methodology in controlling healthcare costs and improving healthcare quality is
evidence based practice. Intermountain Healthcare, through Dr. Brent James, has created a high
quality healthcare system due to its use of evidence based practice. Intermountain utilizes
healthcare data to determine the most effective protocols to treat various healthcare issues.
The system incorporates a committee of physicians, nurses and administrators for each medical
condition or procedure for which they wish to develop treatment protocols. Intermountain has
23 hospitals and dozens of clinics. This system has created 50 protocols for treatment of various
conditions. Physicians with good results are asked what they‟re doing and also receive monetary
incentives. Physicians with poor results receive friendly advisement about what they may be
doing wrong.
Some have stated that the program at Intermountain is possibly the answer to reforming
healthcare. “It‟s the best model in the country of how you can actually change health care,”
states Dr. Jack Wennberg of Dartmouth.
Anthony Staines, a health scholar and hospital regulator in Switzerland who recently completed a
study of some of the world‟s most-admired hospitals said that “Intermountain was really the only
system where there was evidence of improvement in a majority of departments.”
However, Dr. James is most proud of his imitators. More and more reputable healthcare systems
are adopting his system of quality care based on evidence. Hopefully, for everyone‟s sake, this
trend will continue and evidence based practice will become the norm.1
1 David Leonhardt, “Making Health Care Better”, The New York Times (November 3, 2009)
2010 Comprehensive Annual Financial Report
West Virginia Public Employees Insurance Agency 8
TThhiiss PPaaggee WWaass LLeefftt BBllaannkk IInntteennttiioonnaallllyy

2010 Comprehensive Annual Financial Report
West Virginia Public Employees Insurance Agency 9
Earl Ray Tomblin Ted Cheatham Governor Director
WV Toll-free: 1-888-680-7342 · Phone: 1-304-558-7850 · Fax: 1-304-558-2470 · Internet: www.wvpeia.com
December 21, 2010
The Honorable Earl Ray Tomblin, Governor
State of West Virginia
Mr. Robert W. Ferguson, Jr., Cabinet Secretary
West Virginia Department of Administration
Mr. Ted Cheatham, Director
West Virginia Public Employees Insurance Agency
Gentlemen:
It is a privilege to submit to you the Comprehensive Annual Financial Report (CAFR) of the
West Virginia Public Employees Insurance Agency (PEIA) for the fiscal year ended June 30,
2010. This report was prepared by the office of the PEIA Chief Financial Officer.
Responsibility for both the accuracy of the data presented, and the completeness and fairness of
the presentation, including all disclosures, rests with the management of PEIA. To the best of
our knowledge, the data is accurate in all material respects and is reported in a manner designed
to present fairly the financial position and results of operations of PEIA. All disclosures
necessary to enable the reader to gain an understanding of PEIA‟s financial activities have been
included. The financial statements of PEIA have been prepared on an accrual basis in
conformity with Generally Accepted Accounting Principles (GAAP) for governmental entities as
prescribed or permitted by the Governmental Accounting Standards Board (GASB).
PEIA‟s management is responsible for establishing and maintaining internal controls designed to
ensure that the assets of PEIA are protected from loss, theft or misuse and to provide that
financial statements are prepared in conformity with GAAP. Internal controls are designed to
provide reasonable assurance that these objectives are met. The concept of reasonable assurance
recognizes that the cost to administer the control should not exceed the benefits derived from the
control. An annual budget is prepared each fiscal year to be used by management for planning
and evaluating performance.
601 57th Street, S.E., Suite 2 Charleston, WV 25304-2345
2010 Comprehensive Annual Financial Report
West Virginia Public Employees Insurance Agency 10
The CAFR is presented in three sections: introductory, financial and statistical. This
introductory section contains this transmittal letter, a list of the principal officials of PEIA and
PEIA‟s organizational chart. The financial section includes the financial statements and
auditor‟s opinion, as well as certain required supplementary information as described in more
detail in the table of contents. The statistical section includes selected financial, economic and
demographic data for PEIA.
GAAP requires that management provide a narrative introduction, overview, and analysis to
accompany the basic financial statements in the form of Management‟s Discussion and Analysis
(MD&A). This letter of transmittal is designed to complement the MD&A and should be read in
conjunction with it. PEIA‟s MD&A can be found immediately following the report of the
independent auditors.
PEIA is required by the Financial Accounting and Reporting Section of the Department of
Administration to have an annual independent audit. The firm of Ernst & Young, LLP was
selected to perform the audit for fiscal year ended June 30, 2010 Their report is included in the
financial section of this report.
PROFILE OF PEIA
PEIA was established under the Public Employees Insurance Act of 1971, to provide hospital,
surgical, group major medical, prescription drug, group life, and accidental death and
dismemberment insurance coverage to eligible employees; and to establish and promulgate rules
for the administration of these plans. Benefits are made available to all active employees of the
State of West Virginia and various related State agencies and local governments. Participants
may elect health insurance coverage through a fully self-insured Preferred Provider Benefit
(PPB) plan or through external Managed Care Organizations (MCO). Furthermore, all
participants may elect to purchase additional life insurance under the optional life insurance
policy. For revenue, PEIA relies almost solely on the premiums paid directly by its participating
employers and employees.
PEIA is reported as an enterprise fund in the State of West Virginia‟s CAFR. After applying the
criteria set forth in GAAP, PEIA management has determined there are no organizations that
should be considered component units of PEIA. See Note 2 (Summary of Significant
Accounting Policies) for a comprehensive discussion of PEIA‟s accounting policies.
As an insurance benefit providing agency, PEIA‟s expenses are predominantly medical and
prescription drug claims. Medical and pharmaceutical claim expenses represent 94% of total
expenses with administrative expenses representing 6%. Administrative expenses include
payments to third party administrators (TPA), wages and benefits of PEIA employees.
2010 Comprehensive Annual Financial Report
West Virginia Public Employees Insurance Agency 11
RELEVANT FINANCIAL POLICIES
The PEIA Finance Board (Board) is required to develop five-year financial plans each fall that
begin with the next fiscal year commencing in July. The financial plan must incorporate a
mandated reserve fund equal to 10% of total forecast plan expenses for that fiscal year. The
fiscal year 2010 year-end PEIA reserve of $174 million did meet the mandated 10% reserve
requirement. The current financial plan also forecasts PEIA meeting the 10% reserve
requirement for fiscal years 2011 through 2015. PEIA is also required to transfer any reserve
amounts that are in excess of approximately 26% of the recommended reserve to the West
Virginia Retiree Health Benefit Trust Fund. PEIA‟s reserve did not have required excess reserve
transfers in fiscal year 2010.
PEIA maintains two separate insurance risk pools based on employer type. The two pools are
different based on the employer being deemed a State or non-State employer. Also, the
participants in the State risk pool are mandatory participants in PEIA, while the non-State risk
pool participants are not mandatory participants; both of which must maintain the
aforementioned 10% minimum reserve.
The PEIA funding policy for employers in the State risk pool has an impact on PEIA‟s financial
statements. PEIA is required to maintain the State employer and State employee aggregate cost
sharing percentages of 80% from employers and 20% from employees. Although enrollment
fluctuations cause difficulties in attaining the required ratio, the current financial plan indicates
the plan is in compliance with this requirement.
LONG-TERM FINANCIAL PLANNING
PEIA had a change in net assets for fiscal year 2010 of $ 64,372,148 resulting in an end of year
net asset amount of $173,604,183. PEIA had increases in premium revenues and in claims
expense. For further details regarding PEIA‟s financial condition, please see the MD&A portion
of the financial section beginning on page 27 that incorporates a narrative introduction, overview
and analysis of the financial statements.
PEIA and its Finance Board continue to struggle with the rising costs of healthcare. Increasing
healthcare costs continue in all aspects of healthcare. The current rate of healthcare inflation
continues to trend approximately five times greater than the annual increase in average hourly
earnings, which was 1.8% as of July 2010. The rate of healthcare cost inflation is also eight
times greater than the consumer price index which was 1.2% as of July 2010. 2
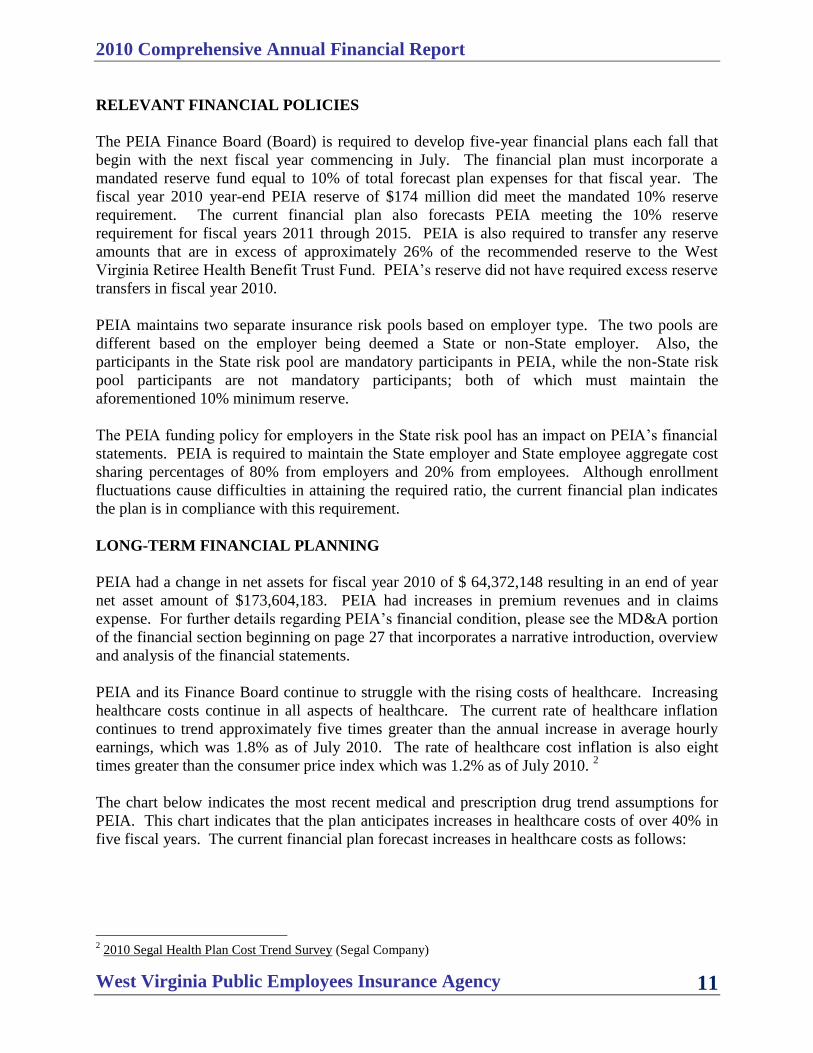
The chart below indicates the most recent medical and prescription drug trend assumptions for
PEIA. This chart indicates that the plan anticipates increases in healthcare costs of over 40% in
five fiscal years. The current financial plan forecast increases in healthcare costs as follows:
2 2010 Segal Health Plan Cost Trend Survey (Segal Company)
2010 Comprehensive Annual Financial Report
West Virginia Public Employees Insurance Agency 12
The 2011 Segal Health Plan Cost Trend Survey indicates the 2011 trend projection for preferred
provider organizations with prescription drug benefits is 10.6%. This trend assumption includes
the impact of the Patient Protection and Affordable Care Act (PPACA), or health care reform. In
the survey, 78% of respondents indicate the PPACA would be an additional increase of 1.1%.
For comparison purposes, PEIA‟s combined trend projection for fiscal year 2011 equals 7.7%
with no impact due to the PPACA, as PEIA will not be implementing the PPACA requirements
until plan year 2012. A more comprehensive discussion of PEIA trends is available in the PEIA
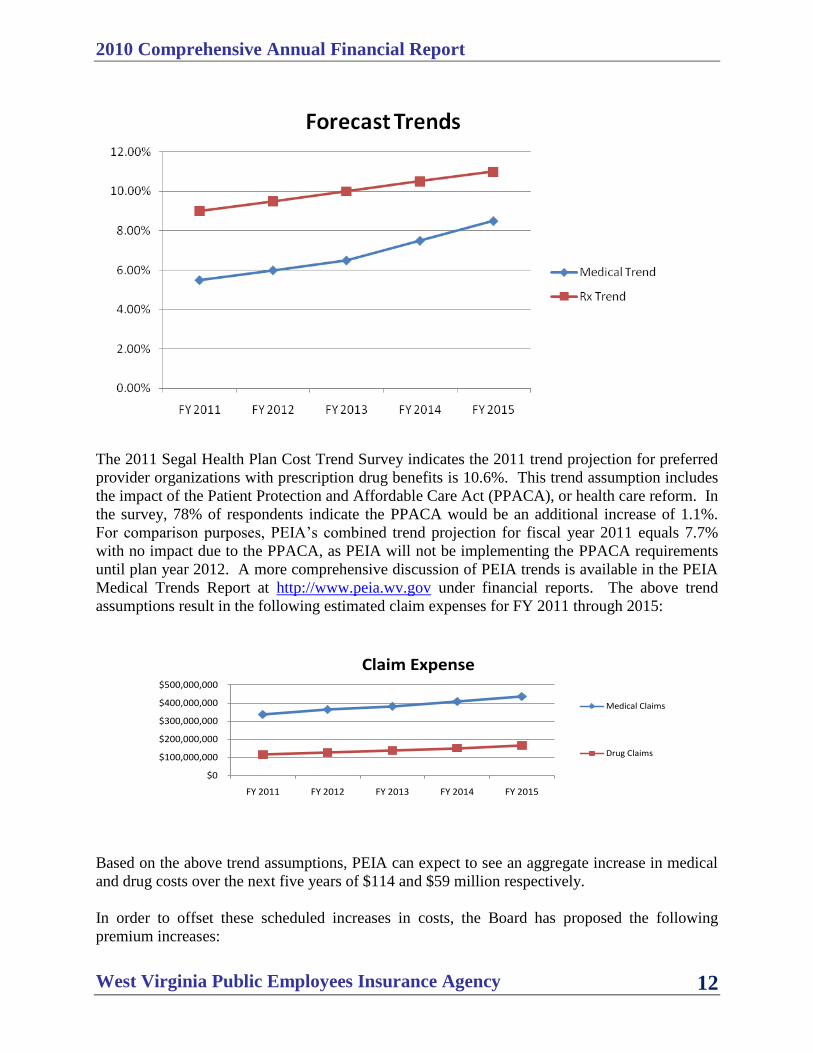
Medical Trends Report at http://www.peia.wv.gov under financial reports. The above trend
assumptions result in the following estimated claim expenses for FY 2011 through 2015:
Based on the above trend assumptions, PEIA can expect to see an aggregate increase in medical
and drug costs over the next five years of $114 and $59 million respectively.
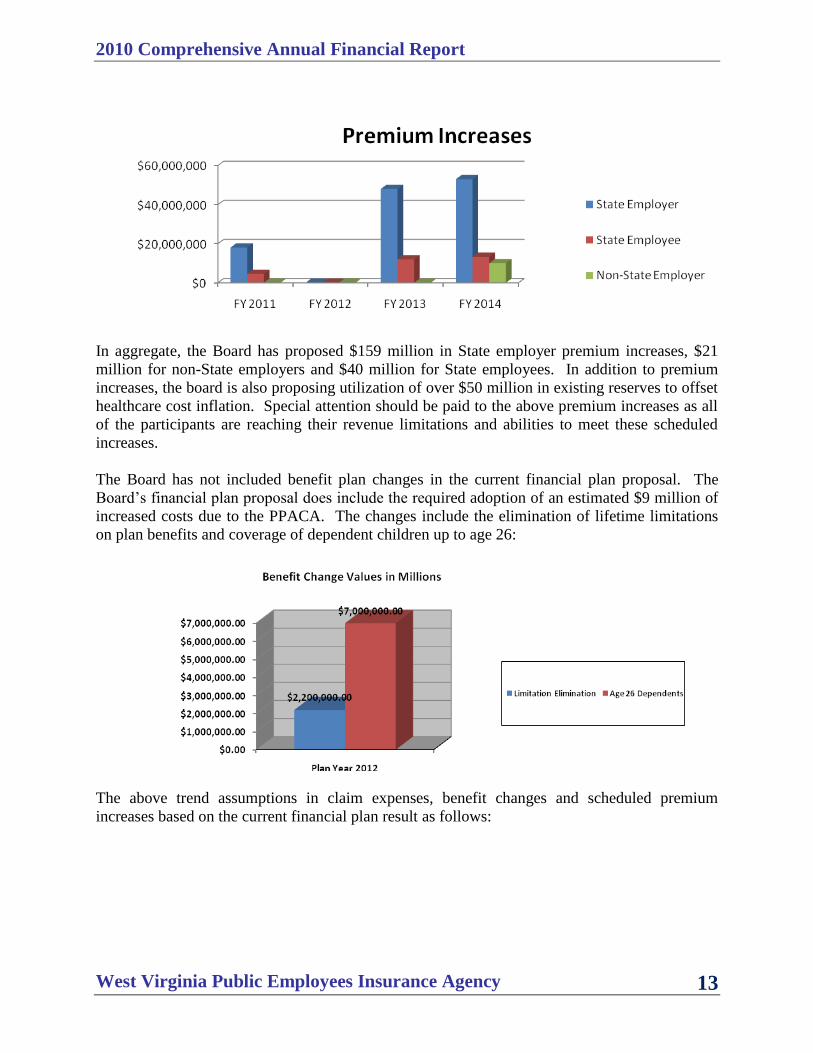
In order to offset these scheduled increases in costs, the Board has proposed the following
premium increases:
$0
$100,000,000
$200,000,000
$300,000,000
$400,000,000
$500,000,000
FY 2011 FY 2012 FY 2013 FY 2014 FY 2015
Claim Expense
Medical Claims
Drug Claims
2010 Comprehensive Annual Financial Report
West Virginia Public Employees Insurance Agency 13
In aggregate, the Board has proposed $159 million in State employer premium increases, $21
million for non-State employers and $40 million for State employees. In addition to premium
increases, the board is also proposing utilization of over $50 million in existing reserves to offset
healthcare cost inflation. Special attention should be paid to the above premium increases as all
of the participants are reaching their revenue limitations and abilities to meet these scheduled
increases.
The Board has not included benefit plan changes in the current financial plan proposal. The
Board‟s financial plan proposal does include the required adoption of an estimated $9 million of
increased costs due to the PPACA. The changes include the elimination of lifetime limitations
on plan benefits and coverage of dependent children up to age 26:
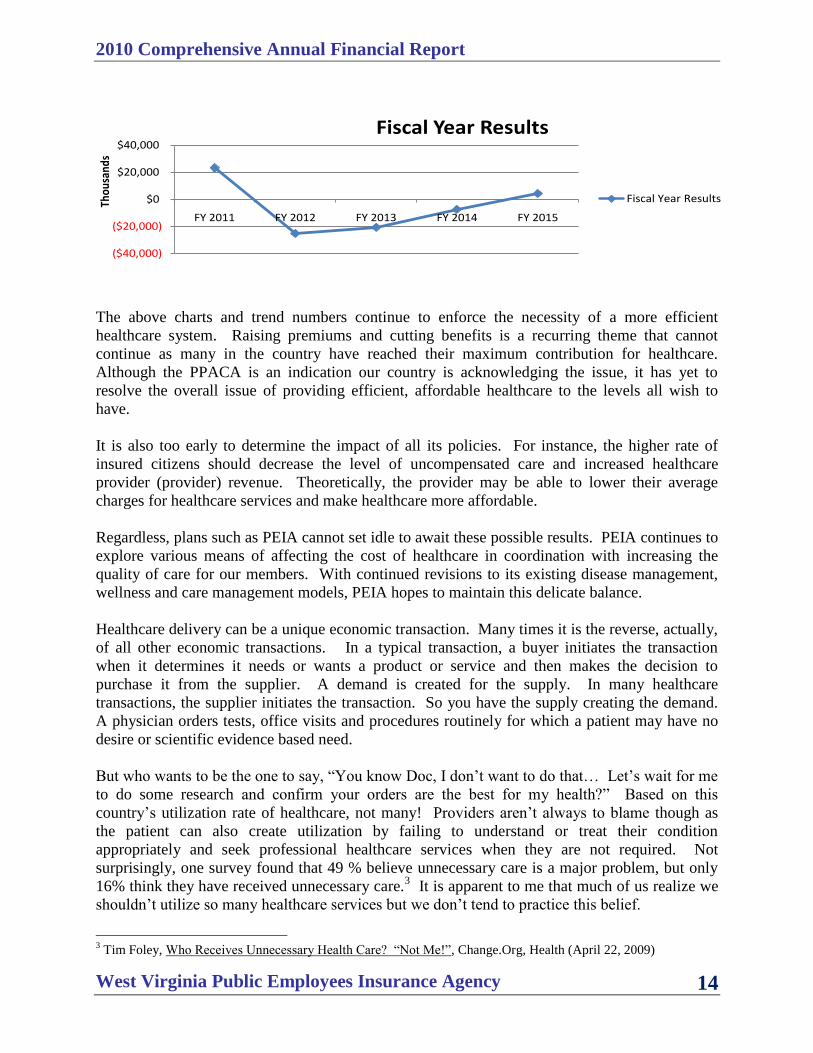
The above trend assumptions in claim expenses, benefit changes and scheduled premium
increases based on the current financial plan result as follows:
2010 Comprehensive Annual Financial Report
West Virginia Public Employees Insurance Agency 14
The above charts and trend numbers continue to enforce the necessity of a more efficient
healthcare system. Raising premiums and cutting benefits is a recurring theme that cannot
continue as many in the country have reached their maximum contribution for healthcare.
Although the PPACA is an indication our country is acknowledging the issue, it has yet to
resolve the overall issue of providing efficient, affordable healthcare to the levels all wish to
have.
It is also too early to determine the impact of all its policies. For instance, the higher rate of
insured citizens should decrease the level of uncompensated care and increased healthcare
provider (provider) revenue. Theoretically, the provider may be able to lower their average
charges for healthcare services and make healthcare more affordable.
Regardless, plans such as PEIA cannot set idle to await these possible results. PEIA continues to
explore various means of affecting the cost of healthcare in coordination with increasing the
quality of care for our members. With continued revisions to its existing disease management,
wellness and care management models, PEIA hopes to maintain this delicate balance.
Healthcare delivery can be a unique economic transaction. Many times it is the reverse, actually,
of all other economic transactions. In a typical transaction, a buyer initiates the transaction
when it determines it needs or wants a product or service and then makes the decision to
purchase it from the supplier. A demand is created for the supply. In many healthcare
transactions, the supplier initiates the transaction. So you have the supply creating the demand.
A physician orders tests, office visits and procedures routinely for which a patient may have no
desire or scientific evidence based need.
But who wants to be the one to say, “You know Doc, I don‟t want to do that… Let‟s wait for me
to do some research and confirm your orders are the best for my health?” Based on this
country‟s utilization rate of healthcare, not many! Providers aren‟t always to blame though as
the patient can also create utilization by failing to understand or treat their condition
appropriately and seek professional healthcare services when they are not required. Not
surprisingly, one survey found that 49 % believe unnecessary care is a major problem, but only
16% think they have received unnecessary care.3 It is apparent to me that much of us realize we
shouldn‟t utilize so many healthcare services but we don‟t tend to practice this belief.
3 Tim Foley, Who Receives Unnecessary Health Care? “Not Me!”, Change.Org, Health (April 22, 2009)
($40,000)
($20,000)
$0
$20,000
$40,000
FY 2011 FY 2012 FY 2013 FY 2014 FY 2015
Thou
sand
s
Fiscal Year Results
Fiscal Year Results
2010 Comprehensive Annual Financial Report
West Virginia Public Employees Insurance Agency 15
What this discussion is driving at is necessary versus un-necessary healthcare utilization. How
do we as patients know what is necessary care and what is unnecessary? We can‟t always know
when our child‟s fever is due to the common cold, (which your physician can‟t prescribe
anything to cure it, regardless what many may think), and when it is due to a condition that does
require a professional medical treatment.
The means to curb unnecessary utilization remains one of the more formidable challenges of the
US healthcare system. The most prevalent procedure in doing so is known as utilization
management (UM) where certain procedures must receive prior authorization before the
insurance benefits will “kick-in.” This allows the payer to confirm that the process is medically
appropriate before scarce resources are used to pay for the service. Providers argue this is one of
the reasons the system doesn‟t work as efficiently as it should. Many providers argue the payers‟
UM processes are burdensome and reduces their time otherwise spent on practicing medicine. It
is also speculated that once the providers know the requirements to receive approval, the
procedure is rarely denied and the UM process loses effectiveness.
Another major factor adding to the rate of unnecessary care is known as defensive medicine.
Many physicians practice defensive medicine due to threat of malpractice suits. Defensive
medicine drives up utilization of healthcare services. By ordering a large number of procedures
to assure proper diagnosis and treatment, a physician is less likely to be found liable for
malpractice if the patient‟s outcome is unfavorable.
To put this issue in perspective, the table below offers some anecdotal data that indicates
estimates of the amount of unnecessary health care utilized by the U.S.

2010 Comprehensive Annual Financial Report
West Virginia Public Employees Insurance Agency 16
Estimated Unnecessary Care
Spend/Utilization Annually Cause Comments
$700 Billion or 30% of Total
Healthcare
Ineffective
Healthcare
This represented 5% of the nation‟s Gross
Domestic Product.4
$650 Billion or 26% of Total
Healthcare Defensive
Medicine
This is an estimate of the amount of money
spent annually due to unnecessary tests being
ordered to mitigate malpractice liability.5
$50 Billion Deceptive
Drug
Marketing
Marketing costs represent an estimated 20% to
30% of the total drug cost6
$35 Billion Unnecessary
CT/MRI
Screenings
The annual price tag for imaging runs about
$100 billion. It is estimated that 35% of them
are unnecessary.7
7.5 Million Unnecessary
Medical and
Surgical
Procedures
Coronary bypasses, hysterectomies and
cesareans are some of the most common
unnecessary surgeries that can cause greater
health problems.8
A possible solution to the issue is developing nationally recognized standards of care based on
three factors. This concept is also known as Evidence Based Medicine or Evidence Based
Practice (EBP). The goal of EBP is the integration of: (a) clinical expertise, (b) best current
evidence, and (c) client/patient perspectives to provide high-quality services reflecting the
interests, values, needs, and choices of the patients. Conceptually, the trilateral principles
forming the bases for EBP can be represented through a simple figure9:
4 David B. Kendall, “Improving Health Care – By „Spreading The Mayo‟ (The Mayo Clinic Model, That Is)”,
Progressive Policy Institute (January 15, 2009) 5 Kristina Fiore, “Unnecessary Tests Drive Up Cost of Healthcare”, Medpage Today, Health Policy (February 22,
2010) 6 Merill Goozner, “Unnecessary, Illegal Marketing Drives Up Healthcare Costs”, MedCity News (September 7,
2010) 7 Dr. Jonathan LaPook, “Too Many Unnecessary MRIs and CT Scans?” (September 24, 2009)
8 Alexis Black, “Unnecessary surgery exposed! Why 60% of all surgeries are medically unjustified and how
surgeons exploit patients to generate profits.” NaturalNews.com http://www.naturalnews.com/012291.html (October
7, 2005) 9 “Evidence-Based Practice (EBP)”, American Speech-Language-Hearing Association (ASHA)
(http://www.asha.org/members/ebp/)
2010 Comprehensive Annual Financial Report
West Virginia Public Employees Insurance Agency 17
This issue is somewhat addressed by the PPACA. The PPACA includes the creation of the
Patient Centered Outcome Research Institute (PCORI) that will compare the effectiveness of
various medical treatments and prescription drugs. This 19 member panel was appointed in
September 2010. But the PCORI was not given the ability to recommend practice guidelines or
policy changes. It will simply disseminate the findings of its research. It will be up to payers to
adjust benefit packages to promote the procedures found to be most effective by the research,
and providers to choose to comply with the research.
This is where the PPACA falls short of resolving the issue and where EBP could be
implemented. There already are a number of highly regarded standards of practice for various
health issues. The problem is getting everyone to agree on one that will be the way healthcare is
delivered and for how it will be paid.
Using the PCORI to develop the agreed upon EBP guidelines, the PPACA could later be revised
to allow the PCORI to enforce these policies as the only services reimbursable by payers. If
implemented properly, the EBP guidelines could remove the malpractice issue as physicians
would be following nationally accepted guidelines. This could also allow a physician to quell
overly concerned patients demanding additional procedures by providing documentation that
proves it not worthwhile.
Does EBP work? One example of the impact of EBP is Intermountain Healthcare
(Intermountain). This full service healthcare system based in Utah has demonstrated the
effectiveness of EBP through improved patient outcomes, the true barometer of effectiveness.10
One of the earliest examples of EBP in practice at Intermountain involved the development of
protocols for the treatment of acute respiratory distress syndrome, ARDS. The protocols were
developed to study whether a new approach to ventilator care could help treat the condition. The
protocol resulted in a 50 page binder and was left by the patients‟ beds. These initial protocols
were later, as anticipated, found to be flawed, but since the protocols reduced the variation of
what the doctors did, and all data was tracked when they varied from the protocol, the study was
able to determine what treatment methods made a difference. The team met regularly and
revised the protocols as outcomes were known so they developed the most effective treatment.
The result of their study resulted in a survival rate of 40 percent. Which in comparison of an
earlier study by Massachusetts General Hospital with a survival rate of 10 percent, appeared to
result in an effective treatment.
Although these better outcomes were obviously a pleasant result, also significant was the
researchers had managed to bring a group of physicians together and develop a complex set of
clinical guidelines. Since the ARDS study, Intermountain has gone through the same exercise
for 50 clinical conditions, accounting for over half of their patient cases.
The results of these programs have been impressive. Intermountain has reduced the number of
pre-term deliveries and utilization of the neonatal intensive care unit. Adverse drug events such
as overdoses and allergic reactions were reduced by 50 percent. A protocol for treating one
broad category of pneumonia cut the mortality rate by 40 percent. The mortality rate for
10
David Leonhardt, “Making Health Care Better”, The New York Times (November 3, 2009)

2010 Comprehensive Annual Financial Report
West Virginia Public Employees Insurance Agency 18
coronary bypass surgery was reduced to 1.5 percent from the national average of 3 percent.
Medicare data indicates Intermountain has a lower readmission rate for heart failure and
pneumonia patients. It is estimated that the changes have saved thousands of lives a year across
Intermountain‟s Network.
To further demonstrate the fallacy of the current system, Intermountain cut the number of
premature babies that went on a ventilator by more than 75 percent. This achievement of higher
quality care was rewarded in the current healthcare system by a reduction in reimbursement
revenue of $329,000. Since many payers use a fee for service, Intermountain‟s efficient, high
quality care resulted in less procedures billed which reduced their revenue.
This is a perfect example of how the medical transaction is in an inverse relationship to a typical
economic transaction. These types of achievements should result in a higher payment, not less.
There are forms of payment that do just that, but not all providers are quite ready for this shift in
reimbursement philosophy. The system has developed a population of providers and patients
that are devoted to the concept more medicine is better medicine and this will not change
quickly.
However, the achievements of Intermountain with EBP and many other healthcare systems
across the nation at such locations as Johns Hopkins and the Mayo Clinic must be the goal of our
country‟s policy makers so we can reverse the current trend of bill and spend without the
necessary regard to quality or outcomes. Considering the outcomes in reimbursement would be
extremely beneficial to all.
PEIA is dedicated to investing it‟s time and resource to implementing reimbursement
methodologies that will focus on quality, not quantity. PEIA currently reimburses all inpatient
and outpatient facility services based on the diagnosis, not the number of services. It is PEIA‟s
belief that the further implementation of EBP by the providers and reimbursement for quality
will mitigate the rate of increases in healthcare cost inflation that are currently unsustainable long
term and provide better healthcare to our citizens.
MAJOR INITIATIVES
PEIA is currently conducting a pilot program of reimbursing providers on a capitated basis. The
project entails an agreement with a group of providers that have the ability to serve many
patients for a vast array of healthcare needs. The providers have their own pharmacies, x-ray
machines/imaging services, lab and a wide array of physicians with varying specialties.
All services are provided to our members with no limit in their utilization for a flat monthly fee.
Regardless of the utilization rates, the same amount is paid. A patient could use the services
every day or not at all and the capitated provider receives the same payment each month. The
patients have a much lower out of pocket using these capitated providers so they are incented to
seek care from them only.
The data for all of the patients at the capitated providers is then compared with the plan as a
whole. If the patients at the capitated providers show a savings in costs in comparison to the

2010 Comprehensive Annual Financial Report
West Virginia Public Employees Insurance Agency 19
plan, the plan shares the savings with the capitated providers. Beyond the fact that lower
utilization by patients results in margin for the providers, the shared savings is further incentive
for the providers to provide quality healthcare and reduce unnecessary utilization.
The goal here is that the providers will better manage the care of the patient and the patient will
not require as much healthcare, nor the more intensive and expensive healthcare such as
hospitalization. The first pilot data results are promising. There remain items for improvement,
but as a pilot project, the program can continue to be tweaked as it moves forward.
The first data set represented 2,760 member months. The pilot group had 10 out of 13 measures
with a positive outcome in comparison with the overall PEIA population. Also, on a risk
adjusted per member per month cost, the pilot group was $16.95 cheaper. The estimated total
savings was $46,782. As mentioned, fifty percent of this amount will be shared with the
provider group.
PEIA is planning on expanding this pilot to more providers in the future that will encompass
different provider types. In doing so, PEIA will be able to modify the policies and procedures
during the pilot for the different provider types in a manner that will assure efficiencies if it is
eventually moved into production plan wide.
AWARDS AND ACKNOWLEDGEMENTS
The Government Finance Officers Association (GFOA) of the United States and Canada
awarded a Certificate of Achievement for Excellence in Financial Reporting to the West Virginia
Public Employees Insurance Agency for its comprehensive annual financial report for the fiscal
year ended June 30, 2009. In order to be awarded a Certificate of Achievement, a government
must publish an easily readable and efficiently organized comprehensive annual financial report.
This report must satisfy both Generally Accepted Accounting Principles and applicable legal
requirements.
A Certificate of Achievement is valid for a period of one year only. We believe that our current
comprehensive annual financial report continues to meet the Certificate of Achievement
Program‟s requirements and we are submitting it to the GFOA to determine its eligibility for
another certificate.
2010 Comprehensive Annual Financial Report
West Virginia Public Employees Insurance Agency 20
Special thanks are extended to Governor Earl Ray Tomblin, for his support in stressing the
importance of fiscal responsibility and financial reporting. Acknowledgement is also given to
the Legislature and its leadership, whose continued support will promote the future success and
stability of the program. Finally, this report would not have been possible without the dedication
and effort of PEIA Director, Ted Cheatham and PEIA Controller, Larry Stover, CPA.
Respectfully, we submit the Comprehensive Annual Financial Report for the West Virginia
Public Employees Insurance Agency for the year ended June 30, 2010.
Sincerely,
Jason A. Haught, CPA
Chief Financial Officer

2010 Comprehensive Annual Financial Report
West Virginia Public Employees Insurance Agency 21
Principal Officials
Earl Ray Tomblin, Governor
State of West Virginia
Robert W. Ferguson, Jr., Cabinet Secretary
West Virginia Department of Administration
Finance Board
Robert W. Ferguson, Jr, Chairman
Elaine Harris, Member
James W. Dailey, II, Member
John Ruddick, Member
Joshua Sword, Member
Michael Smith, Member
William Milam, Member
Troy Giatras, Member
William Ihlenfeld, Member
Executive Staff
Ted Cheatham, Director

2010 Comprehensive Annual Financial Report
West Virginia Public Employees Insurance Agency 22

2010 Comprehensive Annual Financial Report
West Virginia Public Employees Insurance Agency 23

2010 Comprehensive Annual Financial Report
West Virginia Public Employees Insurance Agency 24
Financial Section
Although evidence based practice may have its supporters, it also has its detractors. Many
physicians still believe that practicing by intuition is more effective in treating their patients. A
perfect example of this resistance is a list developed by a Johns Hopkins Physician, Dr. Peter J.
Pronovost. This is a simple list of steps to perform that reduce the rate of infections when
inserting catheters. The list has resulted in a significant reduction in infection rates.
Most notable was its use in 108 intensive care units in Michigan. It‟s reported that one-half of
intensive care patients receive catheters; about 80,000 a year become infected and 28,000 die,
with an economic cost of $2.3 billion.
Using the checklist, in 18 months, the intensive care units reduced their infection rate to zero,
from 4 percent. The checklist saved more than 1,500 lives and nearly $200 million. The program
itself cost only $500,000.
Amazingly, this simple list has yet to be adopted as standard protocol in our nation‟s hospitals.
This anecdotal example of resistance to medical procedures with positive evidence to support
their use is why evidence based practice has yet to be adopted by more hospitals. With the
evidence of quality care coupled with lower costs, it appears that simple processes such as the
list should be part of “health care reform”.11
11
Jane E. Brady, “A Basic Hospital To-Do List Saves Lives”, The New York Times (January 22, 2008)

2010 Comprehensive Annual Financial Report
West Virginia Public Employees Insurance Agency 25
2010 Comprehensive Annual Financial Report
West Virginia Public Employees Insurance Agency 26
2010 Comprehensive Annual Financial Report
West Virginia Public Employees Insurance Agency 27
West Virginia Public Employees Insurance Agency
Management’s Discussion and Analysis
Year Ended June 30, 2010
This section of the annual financial report of the West Virginia Public Employees Insurance
Agency (PEIA) presents a discussion and analysis of the financial performance of PEIA for the
year ended June 30, 2010. Please read it in conjunction with the basic financial statements, which
follow this section.
OVERVIEW OF THE FINANCIAL STATEMENTS
PEIA‟s basic financial statements are prepared in accordance with U.S. generally accepted
accounting principles for governmental entities. The primary purpose of PEIA is to provide
group health and prescription drug insurance for the employees of state agencies, colleges and
universities, county school boards, and other governmental units as set forth in the West Virginia
Public Employees Insurance Act of 1971 as amended. PEIA operates in a manner similar to any
other insurance company. PEIA is an enterprise fund of the State of West Virginia and is
combined with other similar funds to comprise the enterprise funds of the State of West Virginia.
The basic financial statements are presented on the accrual basis of accounting. The three basic
financial statements presented within the financial statements are as follows:
Statement of Net Assets – This statement presents information reflecting PEIA‟s assets,
liabilities, and net assets. Net assets represent the amount of total assets less total liabilities.
The statement of net assets is categorized as to current and noncurrent assets and liabilities.
For purposes of the basic financial statements, current assets and liabilities are those assets
and liabilities with immediate liquidity or which are collectible or become due within 12
months of the statement date.
Statement of Revenues, Expenses, and Changes in Net Assets – This statement reflects
PEIA‟s operating revenues and expenses, as well as nonoperating revenues during the fiscal
year. The major source of operating revenues is premium income, while major expense areas
include medical and prescription drug claims costs. The change in net assets for an enterprise
fund is similar to net profit or loss for any other insurance company.
Statement of Cash Flows – The statement of cash flows is presented on the direct method of
reporting which reflects cash flows from operating, capital, and investing activities. Cash
collections and payments are reflected in this statement to arrive at net increase or decrease
in cash for the fiscal year.
2010 Comprehensive Annual Financial Report
West Virginia Public Employees Insurance Agency 28
West Virginia Public Employees Insurance Agency
Management’s Discussion and Analysis (continued)
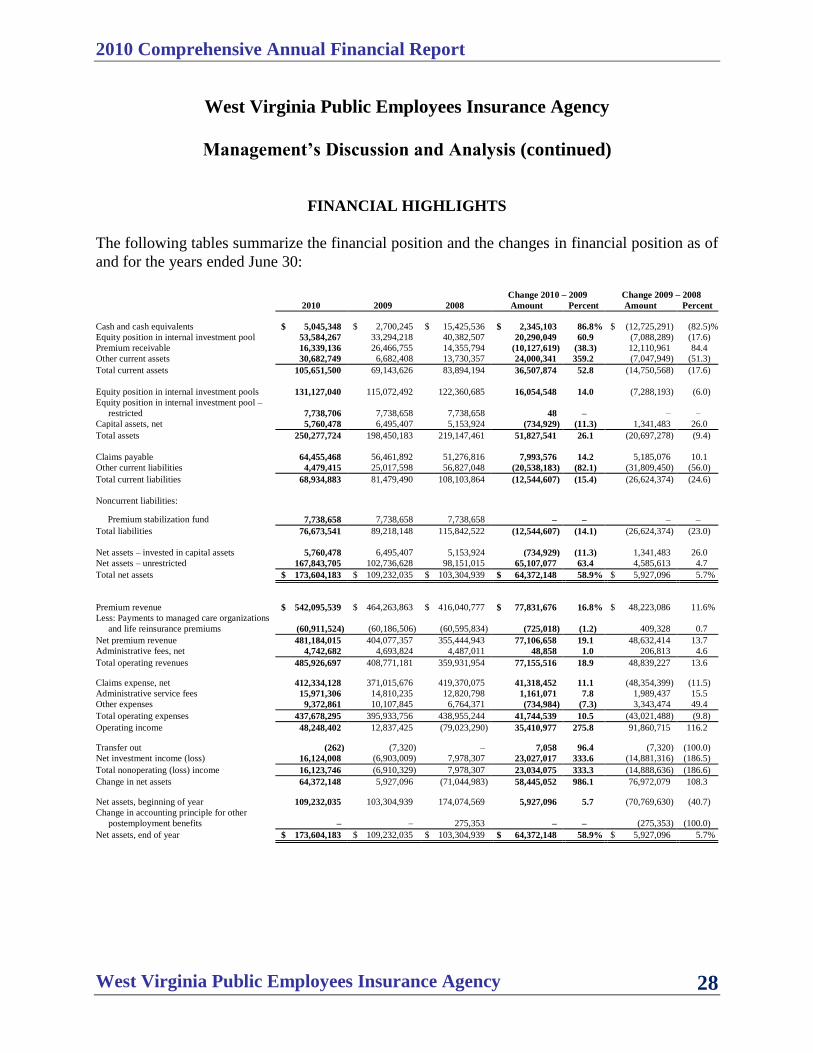
FINANCIAL HIGHLIGHTS
The following tables summarize the financial position and the changes in financial position as of
and for the years ended June 30:
Change 2010 – 2009 Change 2009 – 2008
2010 2009 2008 Amount Percent Amount Percent
Cash and cash equivalents $ 5,045,348 $ 2,700,245 $ 15,425,536 $ 2,345,103 86.8% $ (12,725,291) (82.5)%
Equity position in internal investment pool 53,584,267 33,294,218 40,382,507 20,290,049 60.9 (7,088,289) (17.6)
Premium receivable 16,339,136 26,466,755 14,355,794 (10,127,619) (38.3) 12,110,961 84.4
Other current assets 30,682,749 6,682,408 13,730,357 24,000,341 359.2 (7,047,949) (51.3)
Total current assets 105,651,500 69,143,626 83,894,194 36,507,874 52.8 (14,750,568) (17.6)
Equity position in internal investment pools 131,127,040 115,072,492 122,360,685 16,054,548 14.0 (7,288,193) (6.0)
Equity position in internal investment pool –
restricted 7,738,706 7,738,658 7,738,658 48 – – –
Capital assets, net 5,760,478 6,495,407 5,153,924 (734,929) (11.3) 1,341,483 26.0
Total assets 250,277,724 198,450,183 219,147,461 51,827,541 26.1 (20,697,278) (9.4)
Claims payable 64,455,468 56,461,892 51,276,816 7,993,576 14.2 5,185,076 10.1
Other current liabilities 4,479,415 25,017,598 56,827,048 (20,538,183) (82.1) (31,809,450) (56.0)
Total current liabilities 68,934,883 81,479,490 108,103,864 (12,544,607) (15.4) (26,624,374) (24.6)
Noncurrent liabilities:
Premium stabilization fund 7,738,658 7,738,658 7,738,658 – – – –
Total liabilities 76,673,541 89,218,148 115,842,522 (12,544,607) (14.1) (26,624,374) (23.0)
Net assets – invested in capital assets 5,760,478 6,495,407 5,153,924 (734,929) (11.3) 1,341,483 26.0
Net assets – unrestricted 167,843,705 102,736,628 98,151,015 65,107,077 63.4 4,585,613 4.7
Total net assets $ 173,604,183 $ 109,232,035 $ 103,304,939 $ 64,372,148 58.9% $ 5,927,096 5.7%
Premium revenue $ 542,095,539 $ 464,263,863 $ 416,040,777 $ 77,831,676 16.8% $ 48,223,086 11.6%
Less: Payments to managed care organizations
and life reinsurance premiums (60,911,524) (60,186,506) (60,595,834) (725,018) (1.2) 409,328 0.7
Net premium revenue 481,184,015 404,077,357 355,444,943 77,106,658 19.1 48,632,414 13.7
Administrative fees, net 4,742,682 4,693,824 4,487,011 48,858 1.0 206,813 4.6
Total operating revenues 485,926,697 408,771,181 359,931,954 77,155,516 18.9 48,839,227 13.6 Claims expense, net 412,334,128 371,015,676 419,370,075 41,318,452 11.1 (48,354,399) (11.5)
Administrative service fees 15,971,306 14,810,235 12,820,798 1,161,071 7.8 1,989,437 15.5
Other expenses 9,372,861 10,107,845 6,764,371 (734,984) (7.3) 3,343,474 49.4
Total operating expenses 437,678,295 395,933,756 438,955,244 41,744,539 10.5 (43,021,488) (9.8)
Operating income 48,248,402 12,837,425 (79,023,290) 35,410,977 275.8 91,860,715 116.2 Transfer out (262) (7,320) – 7,058 96.4 (7,320) (100.0)
Net investment income (loss) 16,124,008 (6,903,009) 7,978,307 23,027,017 333.6 (14,881,316) (186.5)
Total nonoperating (loss) income 16,123,746 (6,910,329) 7,978,307 23,034,075 333.3 (14,888,636) (186.6)
Change in net assets 64,372,148 5,927,096 (71,044,983) 58,445,052 986.1 76,972,079 108.3 Net assets, beginning of year 109,232,035 103,304,939 174,074,569 5,927,096 5.7 (70,769,630) (40.7)
Change in accounting principle for other
postemployment benefits – – 275,353 – – (275,353) (100.0)
Net assets, end of year $ 173,604,183 $ 109,232,035 $ 103,304,939 $ 64,372,148 58.9% $ 5,927,096 5.7%
2010 Comprehensive Annual Financial Report
West Virginia Public Employees Insurance Agency 29
West Virginia Public Employees Insurance Agency
Management’s Discussion and Analysis (continued)
The current portion of equity position in internal investment pool and cash and cash equivalents
increased $22.6 million as the result of $47.3 million produced from operations less
$23.6 million advanced to the Retiree Health Benefit Trust (RHBT), and $1.1 million used for
the purchase of capital assets.
In the previous year, the decrease of cash and cash equivalents and the current portion of equity
position in internal investment pool of $19.8 million was the result of $26.1 million used in
operations, $6.9 million used to cover investment losses, and $7.3 million was provided from
liquidation of investments, $2.8 million was used to purchase capital assets, and $8.7 million was
advanced to RHBT.
Premium receivable at June 30, 2010 was $10.1 million less than the prior year because of
several large employers who held their premium last year-end that did not do so this year.
As of the previous year-end, premiums receivable were $12.1 million more than the prior year
because several large employers did not remit their premium until after year-end.
Other current assets were up $24.0 million as of the end of this year because $22.1 million was
advanced to RHBT, prescription receivable increased $1.1 million because the Pharmacy Benefit
Manager has begun quarter remittance in the current year from monthly remittance, provider
refunds receivable is up $.4 million and other increases of $.4 million.
At year-end 2009, other current assets were down $7.0 million due to a $7.2 million advance to
RHBT having been collected, prescription rebates receivable were up $.5 million and provider
refunds receivable were down $.3 million.
Claims payable increased $8.0 million due to increased enrollment and medical cost inflation. In
fiscal year 2009, this liability increased $5.2 million due to the same reasons.
Other current liabilities decreased $20.5 million mainly resulting from the elimination of the
$15.6 million deficiency reserve, repayments of $1.5 million to RHBT, and a $3.4 million
reduction of accounts payable and other current liabilities.
In the previous year, other current liabilities decreased $31.8 million mainly resulting from a
reduction of premium deficiency reserve by $27.7 million, $4.7 million decrease in accounts
payable, $1.9 million reduction of accrued liabilities, less an advance from RHBT of $1.5 million
and $1.0 million increase in unearned revenue.
2010 Comprehensive Annual Financial Report
West Virginia Public Employees Insurance Agency 30
West Virginia Public Employees Insurance Agency
Management’s Discussion and Analysis (continued)
In 2010, the increase in net assets resulted from an increase in premium of $77.8 million,
primarily achieved through increased policy premium rates, recovery of market value of
investments producing an improvement of $23.0 million, and a reduction of $.7 million of other
operating expenses. These improvements were offset by increased claim costs of $41.3 million,
increased administrative service fees of $1.2 million, and an increase of $.7 million in payments
to managed care organizations.
The 2009 increase in net assets resulted primarily from an increase in premium revenue of
$48.2 million over prior year and lower claim costs, less investment losses.
Net premiums increased $77.1 million mainly due to premium increases and reduction of paygo
pass-through to RHBT, a further reduction of $.8 million in provision for uncollectible accounts
offset by an increase of $.7 million in managed care and life insurance expenses.
In the prior year, net premiums increased $48.6 million as a result of a reduction in the
pass-through of post-employment benefit funding to RHBT, a $6.8 million decrease in provision
for uncollectible accounts, and changes in policyholder counts.
Medical and prescription drug claims were 94% of total plan operating expenses for the three-
year period. In the current year, claims expense was reduced by $15.6 million to write-off the
premium deficiency reserve. Additionally, claims experience indicates a 5.7% increase in
medical claims and a 13.6% increase in drug claims, net of premium deficiency. Fiscal year 2009
included a $27.7 million reduction to reduce the deficiency reserve and reflected a net 5.8%
increase in medical claims and a 6.8% increase in drug claims.
Administrative service fees and other expenses have averaged approximately 5% to 6% of plan
operating expenses for the three-year period. Administrative service fees expense increased 7.8%
due to expanded services written into new contracts, which became effective in 2010. Other
expenses decreased 7.3% primarily due to $0.7 million decrease in wellness spending, $0.4
increase in depreciation and $0.3 reduction of professional fees and computer services. In the
prior year, administrative service fees expense increased 15.5% due to replacement of old
contracts with new higher fee contracts, while other expenses increased 49.4% primarily due to
$0.9 million increase in wellness spending, $1.1 million increase in depreciation relating to a
new computer system.
During fiscal year 2010, PEIA recovered the prior-year investment loss, as markets recovered,
and ended the year with $23.0 million above year 2009. For the previous year, a decrease of
$14.9 million from the prior year was recognized.

2010 Comprehensive Annual Financial Report
West Virginia Public Employees Insurance Agency 31
West Virginia Public Employees Insurance Agency
Management’s Discussion and Analysis (continued)
Net assets increased $64.4 million in fiscal year 2010. The 2010 increase resulted primarily from
a $45.8 million increase produced by rate increases, $18.0 million reduction in the pass-through
of post-employment benefit funding to RHBT, reduction of claims expense of $15.6 million to
adjust the year-end premium deficiency reserve, $29.7 million increase in claims incurred, and
improved investment income. The financial plan for 2010 indicated a decrease in total net assets
of $13.5 million. However, it did not include the $15.6 million reduction of expense related to
the premium deficiency reserve. Total claim costs for the current year were $40.2 million less,
investment income was $8.9 million above plan, premium revenues were $19.0 million more,
managed care capitations were $10.2 million less than plan and other non-claim expenses were
$0.4 million more than plan.
In the prior year, net assets increased $5.9 million. This increase resulted primarily from a
reduction of claim expenses of $27.7 million to adjust the year-end premium deficiency reserve;
lower than expected claim expenses were partially offset by investment losses. When the
reduction of the premium deficiency is excluded, the year 2009 net asset change becomes
negative $21.8 million. Premium rate increases totaling $6.0 million were adopted for year 2009.
The financial plan for last year indicated a decrease in total net assets of $46.8 million. However,
it did not include the $27.7 million reduction of expense related to the premium deficiency
reserve. Total claim costs were $18.4 million less, investment loss was $6.9 million more, and
non-claim expenses were $0.8 million more than plan.
ECONOMIC CONDITIONS
After allowing for the contribution to help fund retiree health care costs, which is included in the
active policyholder premium amount, PEIA‟s average active employee family monthly premium
cost is $772.31 compared to the national average cost of $1,169.42. It should be noted that PEIA
achieved an increase in plan assets of $48.8 million, excluding the effect of eliminating the
prior-year premium deficiency reserve.
Actuaries have estimated that the new federal Patient Protection and Affordable Care Act will
cost PEIA policyholders and employers between $30 million and $38 million per year beginning
with fiscal year 2012. It has been reported, based on inescapable relevant science, that many
high-ticket medical interventions, which account for the majority of the direct cost of health care,
either do not advantage patients at all or do so minimally. New U.S. Department of Health and
Human Services rules are expected to be completed in 2013, which aim to improve quality of
care. The rules require the exchange of patient data in structured formats, the use of “evidence-
based medicine,” and the use of standards and best practices for treating patients. It is hoped that
the new evidence-based medicine requirement will significantly reduce health care costs and
provide better medical outcomes for all.

2010 Comprehensive Annual Financial Report
West Virginia Public Employees Insurance Agency 32
West Virginia Public Employees Insurance Agency
Management’s Discussion and Analysis (continued)
In 2010, PEIA‟s claims costs rose 7.5%. State employee premium rates were increased 11.6%,
state employer premium rates were increased 8.5%, and local employer premium rates were
increased 15.1%. No pay increases were granted to the state employees. The 2010 premium
increases have reduced disposable incomes of policyholders and stressed the operations of their
employers.
Premium increases totaling $22.5 million were placed into effect for the year that began July 1,
2010.
CAPITAL ASSET AND LONG-TERM DEBT ACTIVITY
During fiscal year 2008, PEIA adopted Governmental Accounting Standard Board Statement
No. 51, Accounting and Financial Reporting for Intangible Assets, in conjunction with our
implementation of new computer software. Following the provisions of Statement No. 51, we
capitalized computer software costs of $1.0 million, $2.7 million and $4.5 million in fiscal years
ended 2010, 2009 and 2008, respectively. These additions are expected to result in additional
annual depreciation over the next five years of $210,000, $540,000 and $900,000, respectively
(see Note 6).
PEIA has no long-term debt.
REQUEST FOR INFORMATION
This financial report is designed to provide PEIA‟s customers, governing officials, legislators,
citizens, and taxpayers with a general overview of PEIA‟s accountability for the money it
receives. If you have questions about this report or need additional information, contact the Chief
Financial Officer at (304) 558-7850.

2010 Comprehensive Annual Financial Report
West Virginia Public Employees Insurance Agency 33
2010 Comprehensive Annual Financial Report
West Virginia Public Employees Insurance Agency 34

2010 Comprehensive Annual Financial Report
West Virginia Public Employees Insurance Agency 35
2010 Comprehensive Annual Financial Report
West Virginia Public Employees Insurance Agency 36
West Virginia Public Employees Insurance Agency
Notes to Financial Statements
June 30, 2010
1. Reporting Entity
The State of West Virginia Public Employees Insurance Agency (PEIA) was established under
the Public Employees Insurance Act of 1971 (Act). PEIA is an agency of the State of West
Virginia and, accordingly, is reported as an enterprise fund of the primary government in the
State‟s Comprehensive Annual Financial Report (CAFR).
PEIA provides the following basic employee benefit coverage to all participants: hospital,
surgical, group major medical, basic group life, accidental death, and prescription drug coverage
for active employees of the State of West Virginia (State) and various related State and non-State
agencies. Additionally, all participants may elect to purchase additional life insurance under the
optional life insurance policy. All premium rates are established based upon projected coverage
costs as reviewed and approved by the Finance Board of PEIA. See “Budgetary Requirements”
for further discussion of this process. PEIA‟s enrollment consists of approximately 75,000 health
and basic life insurance policyholders, and 14,000 policyholders with life insurance only. PEIA
insures approximately 177,000 individuals, including participants and dependents.
During the 2006 Regular Session of the West Virginia Legislature, House Bill 4654 was enacted
creating the West Virginia Retiree Health Benefit Trust (RHBT) Fund for the purpose of
providing for and administering retiree post-employment health care benefits, and the respective
revenues and costs of those benefits as a cost-sharing multiple employer plan. As a consequence
of the legislation, health insurance policies covering approximately 34,000 retirees and their
dependents, along with the related revenues, claims costs, and expenses were transferred to
RHBT effective July 1, 2006. RHBT and PEIA jointly share administrative duties relating to the
other post-employment benefit (OPEB) operations. Both entities are housed in the same office
space and share expenses. Expenses directly attributable to the OPEB plan are charged to RHBT.
Other operating expenses, except personnel, are allocated based on policyholder count between
PEIA and RHBT. Personnel expenses attributable to three dedicated employees are charged in
full to RHBT; while the balance of the combined expense is allocated between the two entities
based on estimated time requirements.
The basic financial statements of PEIA are intended to present the financial position, changes in
financial position, and cash flows of only that portion of the business-type activities of the State
of West Virginia that is attributable to the transactions of PEIA. They do not purport to, and do
not, present fairly the financial position of the State of West Virginia as of June 30, 2010 and
2009, and the changes in its financial position or, where applicable, its cash flows for the years
then ended, in conformity with U.S. generally accepted accounting principles (GAAP).

2010 Comprehensive Annual Financial Report
West Virginia Public Employees Insurance Agency 37
West Virginia Public Employees Insurance Agency
Notes to Financial Statements (continued)
2. Summary of Significant Accounting Policies
Basis of Reporting
PEIA operates as an enterprise fund. Accordingly, the financial statements of PEIA have been
prepared on the accrual basis in conformity with GAAP for governmental entities as prescribed
or permitted by the Governmental Accounting Standards Board (GASB). Revenues mainly are
derived from premiums earned net of related reinsurance premiums, plus administrative fees
billed. Expenses consist primarily of claims, administrative service fees, and various general and
administrative costs.
In September 1993, GASB issued Statement No. 20, Accounting and Financial Reporting for
Proprietary Funds and Other Governmental Entities That Use Proprietary Fund Accounting. As
permitted by the Statement, PEIA has elected not to adopt Financial Accounting Standards Board
(FASB) statements and interpretations issued after November 30, 1989, unless GASB
specifically adopts such FASB statements or interpretations.
Annual Financial Plan
The Act requires the Finance Board of PEIA to prepare a proposed annual financial plan. The
plan must be designed to generate sufficient revenues to meet all expected expenses, including
insurance, administrative expenses, and incurred but not reported claims (IBNR) of PEIA. An
independent professional actuary must review the plan and give an opinion stating that the plan
may be reasonably expected to generate sufficient revenue to meet estimated insurance claims
and administrative expenses. The financial plan must be presented to the governor and the
legislature no later than January 1, prior to the beginning of the new plan year.
PEIA Finance Board establishes PEIA premiums based upon its approved annual financial plan.
The financial plan projects the anticipated costs of the program for each fiscal year and the
premium levels necessary to meet these costs. Any variances between projected and incurred
costs are incorporated into subsequent financial plans and subsequent premiums are adjusted
accordingly on a prospective basis. Premiums assessed by PEIA are not subject to retroactive
adjustment based upon actual costs incurred.
2010 Comprehensive Annual Financial Report
West Virginia Public Employees Insurance Agency 38
West Virginia Public Employees Insurance Agency
Notes to Financial Statements (continued)
2. Summary of Significant Accounting Policies (continued)
Cash and Cash Equivalents
Cash and cash equivalents include short-term investments with original maturities of 90 days or
less. Cash and cash equivalents principally consist of amounts on deposit with the West Virginia
State Treasurer‟s office, outside financial institutions, and amounts deposited in an internal
investment pool managed by the West Virginia Board of Treasury Investments (BTI) that is
reported as part of equity position in internal investment pool – current-unrestricted and
noncurrent-restricted, respectively.
Premiums Receivable
All premiums receivable are reported at their gross premium value due from employers and
individual subscribers. The gross value is then reduced by the estimated portion that is expected
to be uncollectible based upon management‟s review of the payment status of the underlying
accounts and other economic factors that are deemed necessary in the circumstances.
Accounts Receivable
Accounts receivable include overpayments made by third-party administrators that are due to
PEIA and estimated prescription refunds and rebates that are due PEIA from third-party
administrators and other drug companies. The estimated prescription refunds/rebate receivable is
based upon estimated prescription claim count and historical average rebate per claim. These
receivables have been reduced by the estimated portion that is expected to be uncollectible based
upon management‟s review of the payment status of the underlying accounts and other economic
factors that are deemed necessary in the circumstances.
Equity Position in Internal Investment Pools
PEIA owns equity positions in state government investment pools managed by the West Virginia
Investment Management Board (WVIMB) and the BTI. Some investment pool funds are subject
to market risk because of changes in interest rates, bond prices, and stock prices. Investment
earnings and losses are allocated to PEIA based on the balance of PEIA‟s investments
maintained in relation to the total investments of all state agencies participating in the pool. The
equity position in internal investment pools is reported at fair value and changes in fair value are
included in investment income.
2010 Comprehensive Annual Financial Report
West Virginia Public Employees Insurance Agency 39
West Virginia Public Employees Insurance Agency
Notes to Financial Statements (continued)
2. Summary of Significant Accounting Policies (continued)
A 13-member Board of Trustees governs the WVIMB. Three members of the Board serve by
virtue of their office: the Governor, the Auditor, and the Treasurer. The other ten are appointed
by the Governor and confirmed by the Senate. All appointees must have experience in pension
management, institutional management or financial markets. In addition, one must be an attorney
experienced in finance and investment matters and another must be a Certified Public
Accountant. Only six of the ten appointed Trustees may be from the same political party. The
Governor serves as Chairman of the Board. A Vice-Chairman is elected by the Trustees. A
Secretary, who need not be a member of the Board, is also elected by the Trustees to keep a
record of the proceedings of the Board. Details regarding these investment pools and a copy of
the WVIMB financial report can be obtained by contacting: West Virginia Investment
Management Board, 500 Virginia Street, East, Suite 200, Charleston, West Virginia 25301 or by
calling 1-304-345-2672.
A five-member Board of Directors governs the BTI. The Governor, Treasurer, and Auditor serve
as ex-officio members of the Board. The Governor appoints the two remaining members subject
to the advice and consent of the State Senate. Of the two members appointed by the Governor,
one shall be a certified public accountant and one shall be an attorney, and both shall have
experience in finance, investing, and management. The State Treasurer is Chairman of the
Board. The BTI prepares separately issued financial statements covering the pooled fund, which
can be obtained from its website or a published copy from the West Virginia Board of Treasury
Investments, 1900 Kanawha Boulevard, East, Building 1, Room E-122, Charleston, West
Virginia 25305.
Capital Assets
Capital assets with an initial cost of $1,000 or greater are recorded at cost. PEIA has assigned a
useful life of three to five years for capital assets. Depreciation expense computed using the
straight-line method was $1,806,132 and $1,419,757 for the years ended June 30, 2010 and 2009,
respectively.

2010 Comprehensive Annual Financial Report
West Virginia Public Employees Insurance Agency 40
West Virginia Public Employees Insurance Agency
Notes to Financial Statements (continued)
2. Summary of Significant Accounting Policies (continued)
Claims Payable and Expense
The liability for unpaid claims and claims processing costs is based on an actuarial estimate of
the ultimate cost of settling such claims incurred as of the statement of net assets date (including
claims reported and in process of settlement, claims reported but not yet processed for
settlement, and claims incurred but not yet reported or processed for settlement). The estimated
actuarial liability reflects certain assumptions, which include such factors as enrollment,
utilization, inflation, and other societal and economic factors. Adjustments to the estimated
actuarial liability for the final settlement of claims will be reflected in the year that the actual
results of the settlement of the claims are made and are known. The estimated liability is adjusted
annually based on the most current claim incurrence and claim settlement history (see Note 7).
Year-end claims payable balances are generally liquidated within the next fiscal year. Claims
relating to participants in managed care organizations (MCOs) as well as claims relating to
participants covered under the optional life insurance plan are not considered in the liability, as
PEIA has no liability for the participants who elect such coverage. Additionally, the estimated
liability for unpaid claims and claims processing costs is recorded net of amounts ceded to
reinsurers for basic life benefits, as management believes these reinsured risks are fully
recoverable. However, in the event a reinsurer is unable financially to satisfy an obligation, PEIA
is responsible for such liability. Claims expense is reported net of pharmacy rebate income of
$13,738,251 and $14,055,101 for the years ended June 30, 2010 and 2009, respectively.
Premium Deficiency Reserve
Premium deficiency is required when policies in force as of the financial statement date are
expected to produce a loss when claims cost (including IBNR), plus expected claims adjustment
expenses, are expected to exceed related premiums. Management has recorded a premium
deficiency reserve of $15,588,245 as of June 30, 2009. No such reserve was required as of the
end of fiscal year 2010. In making its determination, management took into consideration
anticipated premium revenue and claims costs. PEIA did not include anticipated investment
income in determining whether a premium deficiency exists. Adjustments to the estimated
premium deficiency liability are reflected as a change in estimate in the year the actual results are
known.
PEIA participants are not subject to supplemental assessment in the event of a premium
deficiency. At the time of premium payment, the risk of loss due to incurred benefit costs is
transferred from the participant to PEIA. If the assets of PEIA were to be exhausted, participants
would not be responsible for the liabilities.

2010 Comprehensive Annual Financial Report
West Virginia Public Employees Insurance Agency 41
West Virginia Public Employees Insurance Agency
Notes to Financial Statements (continued)
2. Summary of Significant Accounting Policies (continued)
Unearned Revenue
Unearned revenue includes premium revenues collected for future contract periods. These
revenues will be recognized in the operating periods in which they are earned.
Insurance Programs and Related Premium Revenues
PEIA offers the following types of coverage to its participants: health coverage through a self-
insured preferred provider benefit (PPB) plan, health coverage through external MCOs, and life
and accidental death and dismemberment (AD&D) insurance benefits under basic and optional
plans. PEIA collects premiums for participants in the PPB plan and uses these premiums in the
administration of the plan. Additionally, PEIA has the statutory authority to raise additional
revenues in the form of premiums without the need for external (legislative) action.
For participants who elect coverage through MCOs, PEIA collects premiums from employers
and remits a capitation fee to an MCO carrier. The capitation fees paid by PEIA to each MCO
are in accordance with their respective contracts. Benefits are the responsibility of each MCO
carrier. The premiums earned by PEIA have been included in gross premium revenue while the
capitation fees submitted to each MCO carrier are reflected as payments to MCOs on the
financial statements.
As of the June 2010 coverage month, PEIA provided health coverage to 121 state agency
divisions with approximately 22,000 primary participants (not including dependents), 55 county
school boards with approximately 32,000 primary participants, 547 local government entities
with approximately 11,000 primary participants, and 23 college and university entities with
approximately 10,000 primary participants. Approximately 88,000 dependents participated in
PEIA health plans as well.
As of the June 2009 coverage month, PEIA provided health coverage to 119 state agency
divisions with approximately 22,000 primary participants (not including dependents), 55 county
school boards with approximately 32,000 primary participants, 539 local government entities
with approximately 10,000 primary participants, and 23 college and university entities with
approximately 10,000 primary participants. Approximately 91,000 dependents participated in
PEIA health plans as well.
2010 Comprehensive Annual Financial Report
West Virginia Public Employees Insurance Agency 42
West Virginia Public Employees Insurance Agency
Notes to Financial Statements (continued)
2. Summary of Significant Accounting Policies (continued)
Employees covered through PEIA are eligible to obtain life insurance coverage under basic and
optional life insurance plans. Basic life benefits and AD&D benefits of $10,000 are provided to
active state employees under the age of 65 at no cost to the employee. Coverage amounts
decrease with age. No AD&D benefits are available to retirees. Basic life benefits are available
to retirees with coverage ranging from $2,500 to $5,000 depending on age. For these basic life
benefits, PEIA collects premiums and submits them to the insurance carrier. PEIA has reinsured
100% of these basic benefits; however, PEIA remains contingently liable in the event the insurer
does not honor its obligation. The premiums earned for basic life insurance are reflected in gross
premiums and the related amounts ceded to the reinsurer are reflected as life reinsurance
premiums on the financial statements.
Active employees may elect to obtain additional optional coverage for both life and AD&D with
coverage from $5,000 to $500,000 that decreases with age. Active employees may also elect
dependent optional life coverage and AD&D at a level up to $20,000 per spouse and $10,000 per
child. Retirees may obtain optional life insurance coverage from $5,000 to $150,000 depending
on age; however, optional AD&D insurance is not available to retirees. Retirees may also elect
dependent optional life coverage at levels up to $20,000 for spouse and $10,000 per child.
Amounts collected by PEIA from employees for optional coverage totaled $13,707,677 and
$13,417,453 during the fiscal years ended June 30, 2010 and 2009, respectively, and were
remitted directly to the carrier. In this instance, PEIA functions as an agent and, accordingly,
neither these premiums nor the related costs are reflected in the financial statements.
Revenues include an administrative fee that PEIA charges to all participating entities in the plan.
The fee is based on the participating entities‟ number of employees enrolled in the plan.
Administrative Service Fees
PEIA contracts with and pays administrative service fees to two third-party administrators.
Services include processing of insurance claims, precertification reviews, utilization reviews, and
various other duties. The majority of related fees are assessed each month based upon the
number of covered participants or claims processed at predetermined rates without regard to the
period in which a claim is incurred, processed, or settled.
2010 Comprehensive Annual Financial Report
West Virginia Public Employees Insurance Agency 43
West Virginia Public Employees Insurance Agency
Notes to Financial Statements (continued)
2. Summary of Significant Accounting Policies (continued)
Compensated Absences, Including Postretirement Benefits
Employees fully vest in all earned but unused annual leave and PEIA accrues for obligations that
may arise in connection with compensated absences for vacation at the current rate of employee
pay. In accordance with state personnel policies, employees vest in any remaining unused sick
leave only upon retirement, at which time any unused compensated absence time can be
converted into employer paid premiums for postretirement health care coverage through RHBT,
or be converted into a greater retirement benefit under the state‟s Public Employees‟ Retirement
System.
Operating Revenues and Expenses
Balances classified as operating revenues and expenses are those that comprise PEIA‟s ongoing
operations. Principal operating revenues include health insurance premiums, life insurance
premiums, and insurance administration fees, less amounts paid to managed care organizations
and life insurance reinsurers. Operating expenses include the cost of medical claims, drug claims,
claims adjudication, administration, and depreciation of capital assets. Other revenues and
expenses are classified as nonoperating in the financial statements.
Net Assets
As required by GASB Statement 34, PEIA displays net assets in three components, if applicable:
invested in capital assets, net of related debt; restricted; and unrestricted.
Invested in Capital Assets, Net of Related Debt – This component of net assets consists of
capital assets, net of accumulated depreciation and reduced by the outstanding balances of
any bonds, mortgages, notes, or other borrowings that are attributable to the acquisition,
construction, or improvement of those assets.
Unrestricted Net Assets – Unrestricted net assets consist of net assets that do not meet the
definition of “restricted” or “invested in capital assets, net of related debt.” In the
governmental environment, net assets are often designated to indicate that management does
not consider them to be available for general operations. These types of constraints on
resources are internal and management can remove or modify them. Such internal
designations are not reported on the face of the statements of net assets.
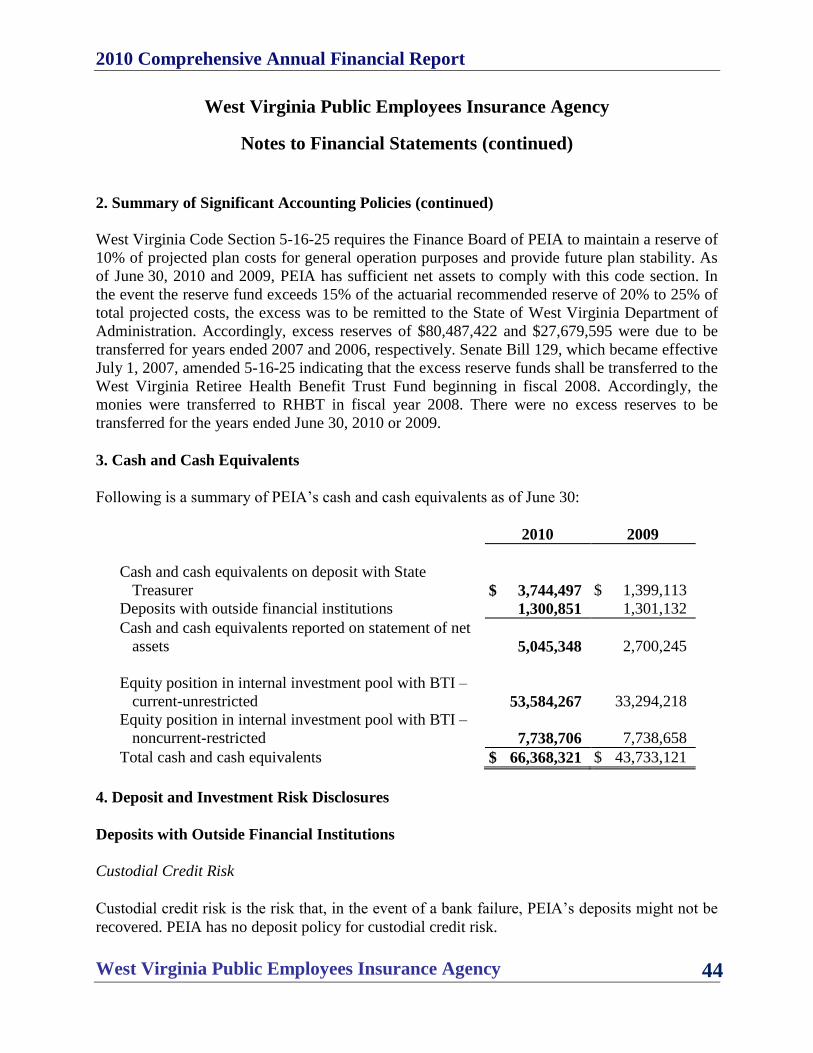
2010 Comprehensive Annual Financial Report
West Virginia Public Employees Insurance Agency 44
West Virginia Public Employees Insurance Agency
Notes to Financial Statements (continued)
2. Summary of Significant Accounting Policies (continued)
West Virginia Code Section 5-16-25 requires the Finance Board of PEIA to maintain a reserve of
10% of projected plan costs for general operation purposes and provide future plan stability. As
of June 30, 2010 and 2009, PEIA has sufficient net assets to comply with this code section. In
the event the reserve fund exceeds 15% of the actuarial recommended reserve of 20% to 25% of
total projected costs, the excess was to be remitted to the State of West Virginia Department of
Administration. Accordingly, excess reserves of $80,487,422 and $27,679,595 were due to be
transferred for years ended 2007 and 2006, respectively. Senate Bill 129, which became effective
July 1, 2007, amended 5-16-25 indicating that the excess reserve funds shall be transferred to the
West Virginia Retiree Health Benefit Trust Fund beginning in fiscal 2008. Accordingly, the
monies were transferred to RHBT in fiscal year 2008. There were no excess reserves to be
transferred for the years ended June 30, 2010 or 2009.
3. Cash and Cash Equivalents
Following is a summary of PEIA‟s cash and cash equivalents as of June 30:
2010 2009
Cash and cash equivalents on deposit with State
Treasurer $ 3,744,497 $ 1,399,113
Deposits with outside financial institutions 1,300,851 1,301,132
Cash and cash equivalents reported on statement of net
assets 5,045,348 2,700,245
Equity position in internal investment pool with BTI –
current-unrestricted 53,584,267 33,294,218
Equity position in internal investment pool with BTI –
noncurrent-restricted 7,738,706 7,738,658
Total cash and cash equivalents $ 66,368,321 $ 43,733,121
4. Deposit and Investment Risk Disclosures
Deposits with Outside Financial Institutions
Custodial Credit Risk
Custodial credit risk is the risk that, in the event of a bank failure, PEIA‟s deposits might not be
recovered. PEIA has no deposit policy for custodial credit risk.

2010 Comprehensive Annual Financial Report
West Virginia Public Employees Insurance Agency 45
West Virginia Public Employees Insurance Agency
Notes to Financial Statements (continued)
4. Deposit and Investment Risk Disclosures (continued)
As of June 30, 2010 and 2009, the carrying amount of PEIA‟s bank deposits was $1,300,851 and
$1,301,132, respectively, and the respective bank balances totaled $1,430,000 and $1,511,042,
respectively. Of the total bank balance, $1,428,856 and $1,510,741, respectively, were uninsured
and collateralized with government-sponsored enterprise securities held by financial institutions.
These securities are held in the name of the financial institution and not that of PEIA.
West Virginia Money Market Pool (Formerly Cash Liquidity Pool) – Equity Position in
Internal Investment Pool – Current – Managed by BTI
Credit Risk
The BTI administers the pool and limits exposure to credit risk by requiring all corporate bonds
held by their West Virginia Money Market Pool to be rated AA- by Standard & Poor‟s (or its
equivalent) or higher. Commercial paper must be rated at least A-1 by Standard & Poor‟s and P1
by Moody‟s. Additionally, the pool must have at least 15% of its assets in United States Treasury
issues.
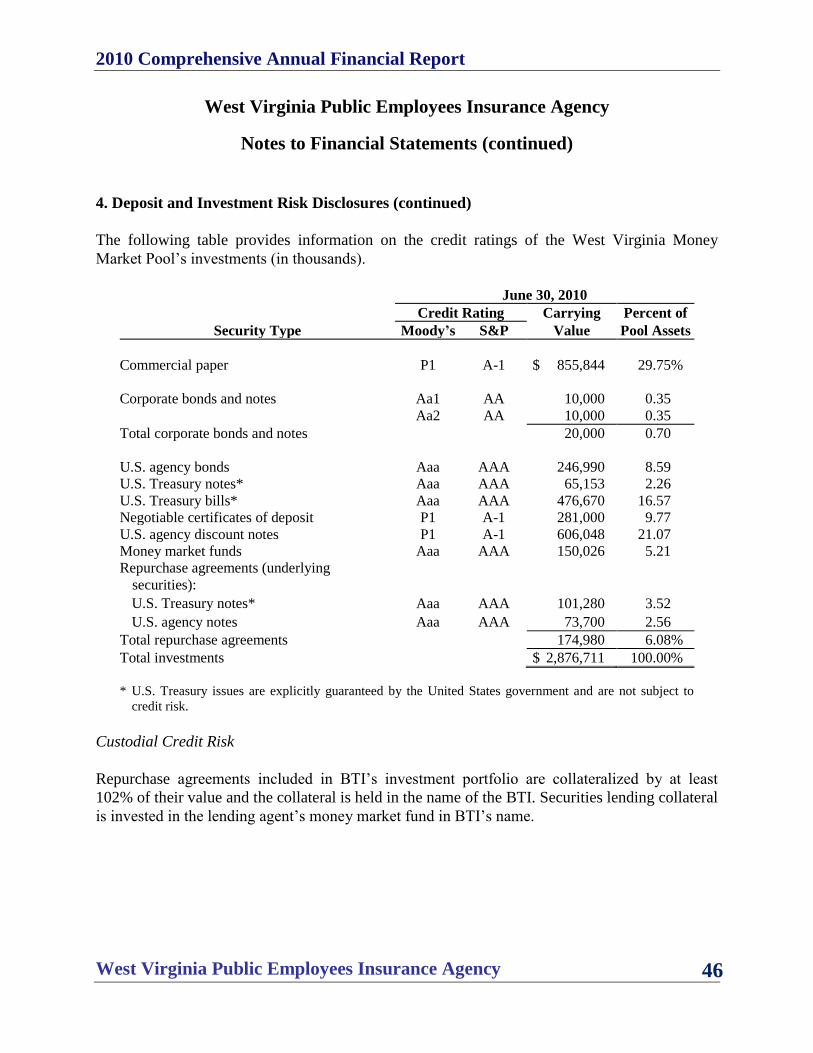
2010 Comprehensive Annual Financial Report
West Virginia Public Employees Insurance Agency 46
West Virginia Public Employees Insurance Agency
Notes to Financial Statements (continued)
4. Deposit and Investment Risk Disclosures (continued)
The following table provides information on the credit ratings of the West Virginia Money
Market Pool‟s investments (in thousands).
June 30, 2010
Credit Rating Carrying Percent of
Security Type Moody’s S&P Value Pool Assets
Commercial paper P1 A-1 $ 855,844 29.75%
Corporate bonds and notes Aa1 AA 10,000 0.35
Aa2 AA 10,000 0.35
Total corporate bonds and notes 20,000 0.70
U.S. agency bonds Aaa AAA 246,990 8.59
U.S. Treasury notes* Aaa AAA 65,153 2.26
U.S. Treasury bills* Aaa AAA 476,670 16.57
Negotiable certificates of deposit P1 A-1 281,000 9.77
U.S. agency discount notes P1 A-1 606,048 21.07
Money market funds Aaa AAA 150,026 5.21
Repurchase agreements (underlying
securities):
U.S. Treasury notes* Aaa AAA 101,280 3.52
U.S. agency notes Aaa AAA 73,700 2.56
Total repurchase agreements 174,980 6.08%
Total investments $ 2,876,711 100.00%
* U.S. Treasury issues are explicitly guaranteed by the United States government and are not subject to
credit risk.
Custodial Credit Risk
Repurchase agreements included in BTI‟s investment portfolio are collateralized by at least
102% of their value and the collateral is held in the name of the BTI. Securities lending collateral
is invested in the lending agent‟s money market fund in BTI‟s name.
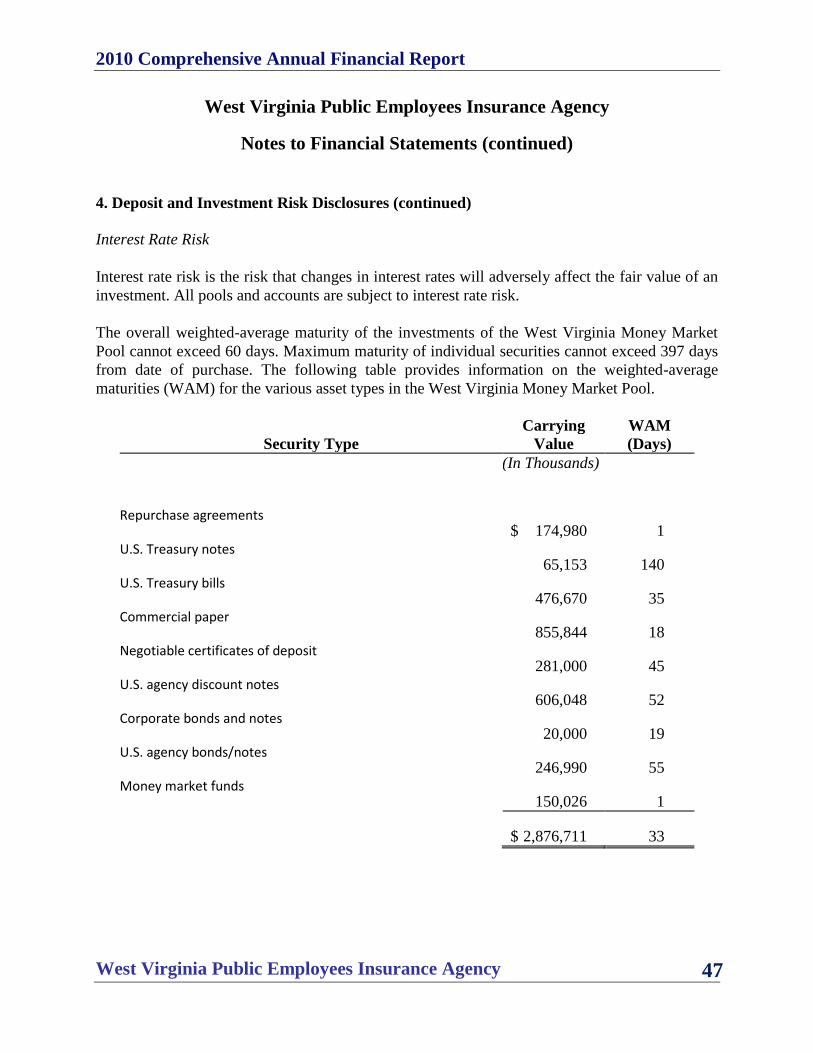
2010 Comprehensive Annual Financial Report
West Virginia Public Employees Insurance Agency 47
West Virginia Public Employees Insurance Agency
Notes to Financial Statements (continued)
4. Deposit and Investment Risk Disclosures (continued)
Interest Rate Risk
Interest rate risk is the risk that changes in interest rates will adversely affect the fair value of an
investment. All pools and accounts are subject to interest rate risk.
The overall weighted-average maturity of the investments of the West Virginia Money Market
Pool cannot exceed 60 days. Maximum maturity of individual securities cannot exceed 397 days
from date of purchase. The following table provides information on the weighted-average
maturities (WAM) for the various asset types in the West Virginia Money Market Pool.
Carrying WAM
Security Type Value (Days)
(In Thousands)
Repurchase agreements
$ 174,980 1 U.S. Treasury notes
65,153 140 U.S. Treasury bills
476,670 35 Commercial paper
855,844 18 Negotiable certificates of deposit
281,000 45 U.S. agency discount notes
606,048 52 Corporate bonds and notes
20,000 19 U.S. agency bonds/notes
246,990 55 Money market funds
150,026 1
$ 2,876,711 33
2010 Comprehensive Annual Financial Report
West Virginia Public Employees Insurance Agency 48
West Virginia Public Employees Insurance Agency
Notes to Financial Statements (continued)
4. Deposit and Investment Risk Disclosures (continued)
PEIA‟s investment in the BTI West Virginia Money Market Pool of $61,322,973 at June 30,
2010, represents approximately 2.1% of total investments in this pool.
Equity Position in Internal Investment Pools – Noncurrent-Unrestricted Managed by
WVIMB
PEIA Fund
This investment fund was specifically designed for PEIA by WVIMB based on PEIA‟s unique
cash flow needs. PEIA is the only state agency participating in this fund and owns 100% of the
total assets. The fund invests in various pools managed by WVIMB.
West Virginia statute mandates that the PEIA Fund shall be managed by WVIMB, a public
corporation.
Investment Objectives
This fund‟s investment objective is to achieve a total rate of return of at least 5.54% per annum,
net of fees.
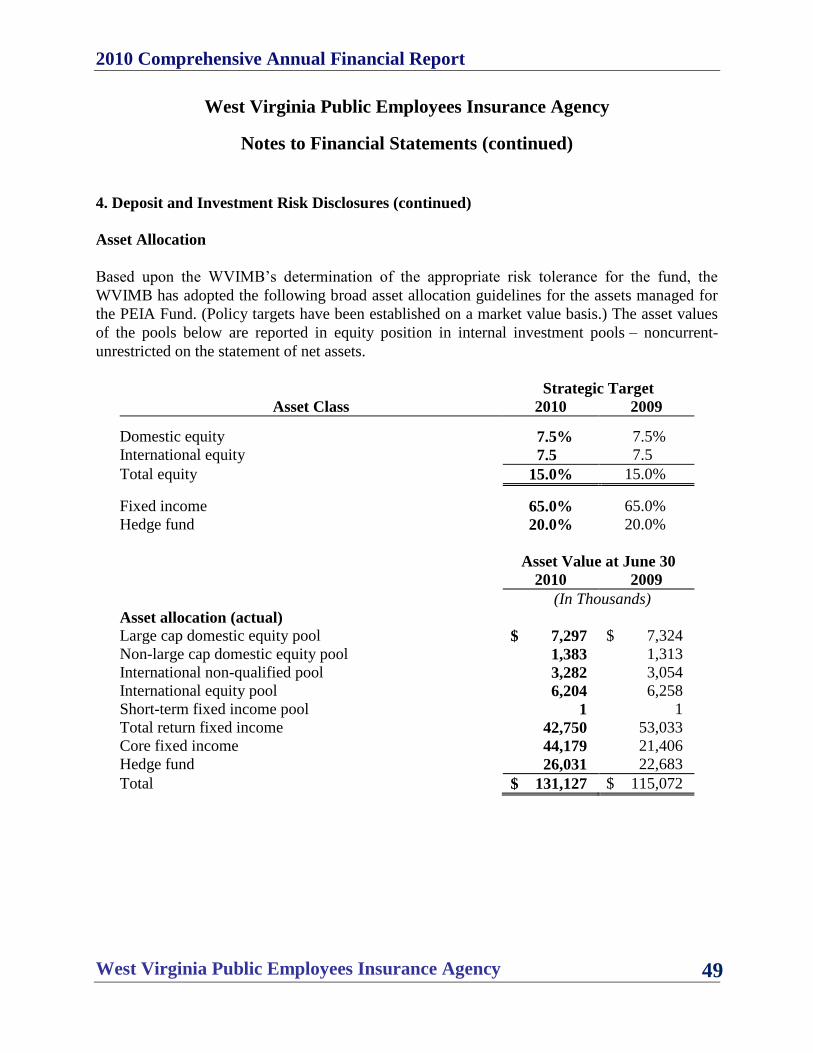
2010 Comprehensive Annual Financial Report
West Virginia Public Employees Insurance Agency 49
West Virginia Public Employees Insurance Agency
Notes to Financial Statements (continued)
4. Deposit and Investment Risk Disclosures (continued)
Asset Allocation
Based upon the WVIMB‟s determination of the appropriate risk tolerance for the fund, the
WVIMB has adopted the following broad asset allocation guidelines for the assets managed for
the PEIA Fund. (Policy targets have been established on a market value basis.) The asset values
of the pools below are reported in equity position in internal investment pools – noncurrent-
unrestricted on the statement of net assets.
Strategic Target
Asset Class 2010 2009 Domestic equity 7.5% 7.5%
International equity 7.5 7.5
Total equity 15.0% 15.0% Fixed income 65.0% 65.0%
Hedge fund 20.0% 20.0%
Asset Value at June 30
2010 2009
(In Thousands)
Asset allocation (actual)
Large cap domestic equity pool $ 7,297 $ 7,324
Non-large cap domestic equity pool 1,383 1,313
International non-qualified pool 3,282 3,054
International equity pool 6,204 6,258
Short-term fixed income pool 1 1
Total return fixed income 42,750 53,033
Core fixed income 44,179 21,406
Hedge fund 26,031 22,683
Total $ 131,127 $ 115,072

2010 Comprehensive Annual Financial Report
West Virginia Public Employees Insurance Agency 50
West Virginia Public Employees Insurance Agency
Notes to Financial Statements (continued)
4. Deposit and Investment Risk Disclosures (continued)
Asset Class Risk Disclosures
Large Cap Domestic Equity Pool
This pool holds equity securities of U.S. companies and money market funds with the highest
credit rating. PEIA‟s amount invested in the Large Cap Domestic Equity Pool of $7,297,000 and
$7,324,000 at June 30, 2010 and 2009, respectively, represents approximately 0.43% and 0.41%,
respectively, of total investments in this pool.
Non-Large Cap Domestic Equity Pool
This pool holds equity securities of U.S. companies and money market funds with the highest
credit rating. PEIA‟s amount invested in the Non-Large Cap Domestic Equity Pool of
$1,383,000 and $1,313,000 at June 30, 2010 and 2009, respectively, represents approximately
0.40% and 0.41%, respectively, of total investments in this pool.
International Non-qualified Pool
This pool holds an institutional mutual fund that invests in equities denominated in foreign
currencies. West Virginia statute limits the amount of international securities to no more than
30% of the total assets managed by the WVIMB. The value of this investment was $53,797,000
and $101,246,000 at June 30, 2010 and 2009, respectively. This investment, although
denominated in U.S. dollars, is exposed to foreign currency risk through underlying investments.
The specific currencies of the underlying investments were not available. West Virginia statute
limits the amount of international securities to no more than 30% of the total assets managed by
the WVIMB. PEIA‟s amount invested in the International Non-qualified Pool of $3,282,000 and
$3,054,000 at June 30, 2010 and 2009, respectively, represents approximately 6.10% and 3.02%,
respectively, of total investments in this pool.

2010 Comprehensive Annual Financial Report
West Virginia Public Employees Insurance Agency 51
West Virginia Public Employees Insurance Agency
Notes to Financial Statements (continued)
4. Deposit and Investment Risk Disclosures (continued)
International Equity Pool
This pool has both equity securities and cash that are denominated in foreign currencies and are
exposed to foreign currency risk. West Virginia statute limits the amount of international
securities to no more than 30% of the total assets managed by the WVIMB. PEIA‟s amount
invested in the International Equity Pool of $6,204,000 and $6,258,000 at June 30, 2010 and
2009, respectively, represents approximately 0.41% and 0.42%, respectively, of total investments
in this pool. The amounts (in U.S. dollars) of the securities and cash denominated in foreign
currencies as of June 30 were as follows:
2010
Currency
Equity
Securities Cash Total
(In Thousands) Australian Dollar $ 28,001 $ 8 $ 28,009 Brazil Cruzeiros Real 82,624 1,605 84,229 British Pound Sterling 141,897 435 142,332 Canadian Dollar 58,467 59 58,526 Czech Koruna 10,106 5 10,111 Danish Krone 7,115 6 7,121 Egyptian Pound 741 12 753 Euro Currency Unit 242,635 379 243,014 Hong Kong Dollar 137,405 848 138,253 Hungarian Forint 11,994 39 12,033 Indian Rupee 1,938 1 1,939 Indonesian Rupiah 4,049 24 4,073 Israeli Shekel 22,323 – 22,323 Japanese Yen 162,122 1,834 163,956 Malaysian Ringitt 10,960 206 11,166 Mexican New Peso 23,959 422 24,381 New Taiwan Dollar 51,582 2,875 54,457 New Turkish Lira 44,480 1 44,481 New Zealand Dollar 1,025 – 1,025 Norwegian Krone 11,570 33 11,603 Pakistani Rupee 923 – 923 Philippine Peso 6,158 15 6,173 Polish Zloty 7,912 5 7,917 Singapore Dollar 29,787 113 29,900 South African Rand 38,417 132 38,549 South Korean Won 103,072 1,207 104,279 Swedish Krona 18,257 45 18,302 Swiss Franc 41,481 417 41,898 Thailand Baht 8,775 180 8,955
Total $ 1,309,775 $ 10,906 $ 1,320,681

2010 Comprehensive Annual Financial Report
West Virginia Public Employees Insurance Agency 52
West Virginia Public Employees Insurance Agency
Notes to Financial Statements (continued)
4. Deposit and Investment Risk Disclosures (continued)
This table excludes cash and securities held by the pool that are denominated in U.S. dollars. The
fair value of the U.S. dollar denominated cash and securities is $185,968,000.
Short-Term Fixed Income Pool
Credit Risk
The WVIMB limits the exposure to credit risk in the Short-Term Fixed Income Pool by requiring
all corporate bonds to be rated AA or higher. Commercial paper must be rated A1 by Standard &
Poor‟s and P1 by Moody‟s. Additionally, the pool must have at least 15% of its assets in United
States Treasury issues.
The following table provides information on the weighted-average credit ratings of the Short-
Term Fixed Income Pool‟s investments as of June 30, 2010.
2010
Carrying
Security Type Moody’s S&P Value Percent
(In
Thousands)
Agency discount notes
P-1 A-1 $ 89,973 29.3% U.S. Treasury note
Aaa AAA 25,572 8.4 Commercial paper
P-1 A-1 38,997 12.7 U.S. Treasury bills
Aaa AAA 126,984 41.4 Agency notes
Aaa AAA 24,999 8.2 Money market fund
Aaa AAA 1 0.0
Total rated investments $ 306,526 100.0%
This table includes securities received as collateral for repurchase agreements with a fair value of
$70,971,000 as compared to the amortized cost of the repurchase agreements of $69,861,000.
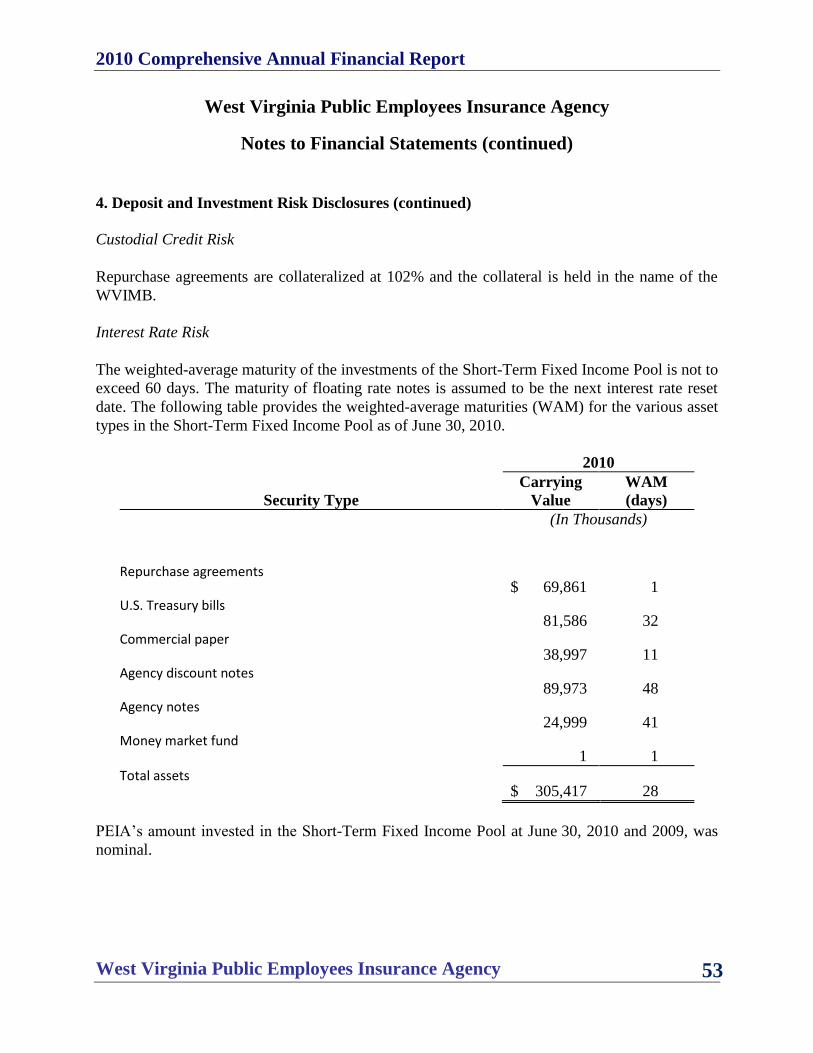
2010 Comprehensive Annual Financial Report
West Virginia Public Employees Insurance Agency 53
West Virginia Public Employees Insurance Agency
Notes to Financial Statements (continued)
4. Deposit and Investment Risk Disclosures (continued)
Custodial Credit Risk
Repurchase agreements are collateralized at 102% and the collateral is held in the name of the
WVIMB.
Interest Rate Risk
The weighted-average maturity of the investments of the Short-Term Fixed Income Pool is not to
exceed 60 days. The maturity of floating rate notes is assumed to be the next interest rate reset
date. The following table provides the weighted-average maturities (WAM) for the various asset
types in the Short-Term Fixed Income Pool as of June 30, 2010.
2010
Security Type
Carrying
Value
WAM
(days)
(In Thousands)
Repurchase agreements
$ 69,861 1 U.S. Treasury bills
81,586 32 Commercial paper
38,997 11 Agency discount notes
89,973 48 Agency notes
24,999 41 Money market fund
1 1
Total assets $ 305,417 28
PEIA‟s amount invested in the Short-Term Fixed Income Pool at June 30, 2010 and 2009, was
nominal.

2010 Comprehensive Annual Financial Report
West Virginia Public Employees Insurance Agency 54
West Virginia Public Employees Insurance Agency
Notes to Financial Statements (continued)
4. Deposit and Investment Risk Disclosures (continued)
Total Return Fixed Income Pool
Credit Risk
The WVIMB limits the exposure to credit risk in the Total Return Fixed Income Pool by
maintaining at least an average rating of investment grade as defined by the Nationally
Recognized Statistical Rating Organizations. The following table provides the weighted-average
credit ratings of the asset types in the fixed income pool as of June 30, 2010.
2010
Security Type Moody’s S&P Fair Value
Percent of
Assets
(In Thousands
Agency mortgage-backed securities Aaa AAA $ 200,978 11.2%
Money market funds Aaa AAA 268,245 14.9
Corporate bonds and notes Baa BBB 572,512 31.8
Corporate collateralized mortgage obligations Ba BB 65,134 3.6
U.S. Treasury inflation protection bonds Aaa AAA 30,997 1.7
Agency notes Aa A 4,004 0.2
U.S. Treasury bonds and notes Aaa AAA 165,854 9.2
Corporate preferred securities NR NR 891 0.0
Corporate asset-backed securities Aaa AAA 13,213 0.7
Agency collateralized mortgage obligations Aaa AAA 7,258 0.4
Municipal Bonds Aa A 26,929 1.5
Total rated investments $ 1,356,015 75.2%
Unrated securities include commingled investment pools valued at $441,720,000 and a contract
purchased valued at $1,349,000. These unrated securities represent 24.8% of the fair value of the
pool‟s investments.
Custodial Credit Risk
At June 30, 2010, the Total Return Fixed Income Pool held no securities that were subject to
custodial credit risk. Repurchase agreements, when held, are collateralized at 102% and the
collateral is held in the name of the WVIMB. Investments in commingled funds are held in an
account in the name of the WVIMB. All remaining securities are held by the WVIMB‟s
custodian in the name of the WVIMB. Securities lending collateral is invested in the lending
agent‟s money market fund.
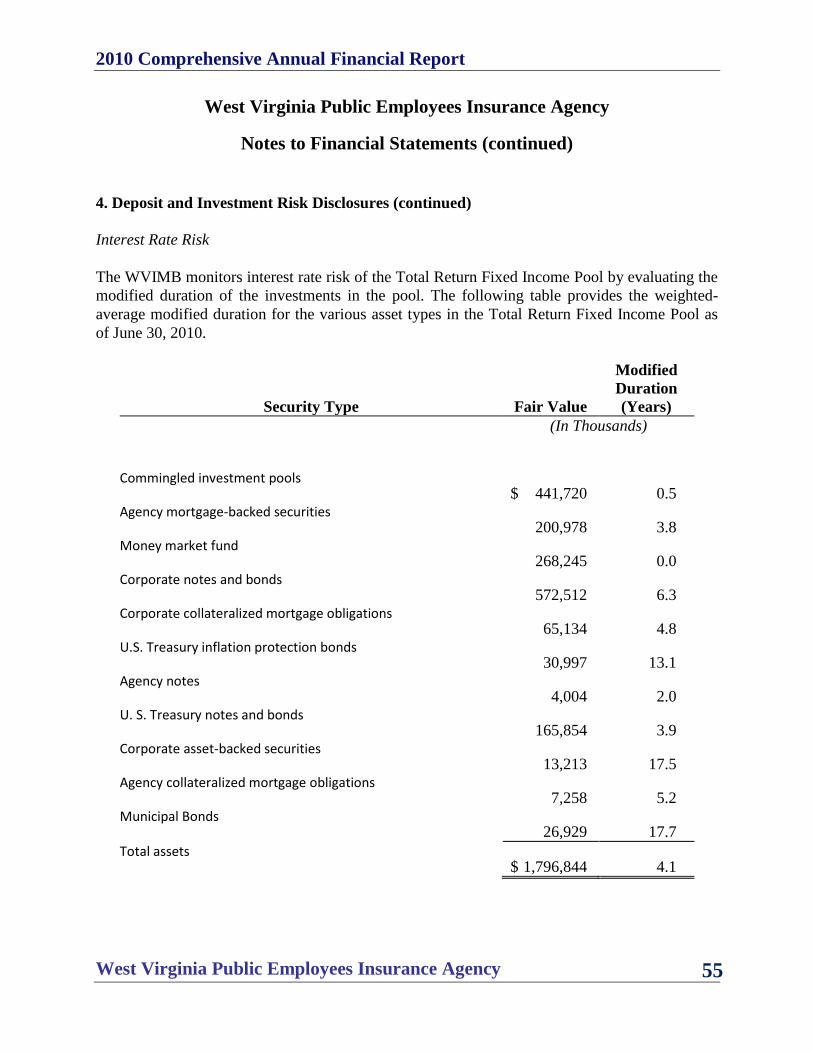
2010 Comprehensive Annual Financial Report
West Virginia Public Employees Insurance Agency 55
West Virginia Public Employees Insurance Agency
Notes to Financial Statements (continued)
4. Deposit and Investment Risk Disclosures (continued)
Interest Rate Risk
The WVIMB monitors interest rate risk of the Total Return Fixed Income Pool by evaluating the
modified duration of the investments in the pool. The following table provides the weighted-
average modified duration for the various asset types in the Total Return Fixed Income Pool as
of June 30, 2010.
Security Type Fair Value
Modified
Duration
(Years)
(In Thousands)
Commingled investment pools
$ 441,720 0.5 Agency mortgage-backed securities
200,978 3.8 Money market fund
268,245 0.0 Corporate notes and bonds
572,512 6.3 Corporate collateralized mortgage obligations
65,134 4.8 U.S. Treasury inflation protection bonds
30,997 13.1 Agency notes
4,004 2.0 U. S. Treasury notes and bonds
165,854 3.9 Corporate asset-backed securities
13,213 17.5 Agency collateralized mortgage obligations
7,258 5.2 Municipal Bonds
26,929 17.7
Total assets $ 1,796,844 4.1

2010 Comprehensive Annual Financial Report
West Virginia Public Employees Insurance Agency 56
West Virginia Public Employees Insurance Agency
Notes to Financial Statements (continued)
4. Deposit and Investment Risk Disclosures (continued)
The Total Return Fixed Income Pool invests in commercial and residential mortgage-backed and
asset-backed securities. The cash flows from these securities are based on the payment of the
underlying collateral. The modified duration and yield to maturity of these securities are
dependent on estimated prepayment assumptions that consider historical experience, market
conditions, and other criteria. Actual prepayments may vary with changes in interest rates. Rising
interest rates often result in a slower rate of prepayments while declining rates tend to lead to
faster prepayments. As a result, the fair values of these securities are highly sensitive to interest
rate changes. The Total Return Fixed Income Pool held $286,583,000 and $623,449,368 of these
securities at June 30, 2010 and 2009, respectively, which represented approximately 16% and
24%, respectively, of the value of the Total Return Fixed Income Pool.
PEIA‟s amount invested in the Total Return Fixed Income Pool of $42,750,000 and $53,033,000
at June 30, 2010 and 2009, respectively, represented approximately 2.38% and 2.00%,
respectively, of total investments in the pool.
Core Fixed Income Pool
Credit Risk
The WVIMB limits the exposure to credit risk in the Core Fixed Income Pool by maintaining at
least an average rating of investment grade as defined by the Nationally Recognized Statistical
Rating Organizations. The following table provides the weighted-average credit ratings of the
rated assets in the Core Fixed Income Pool as of June 30, 2010.
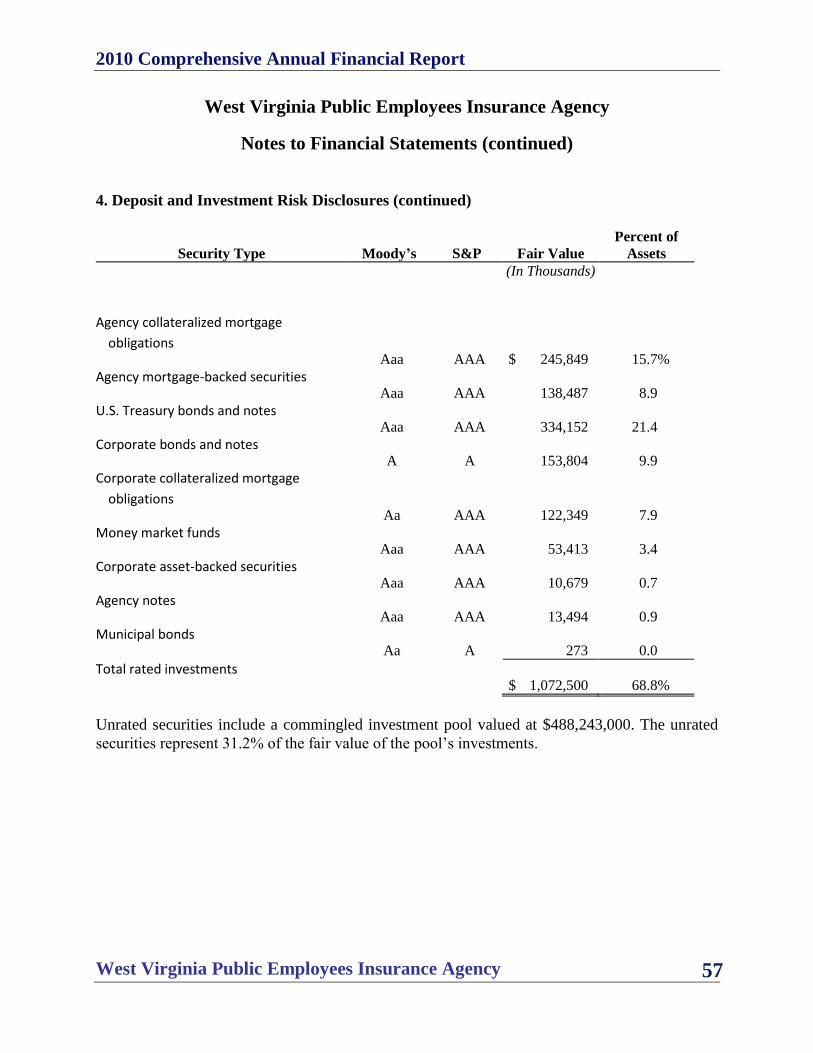
2010 Comprehensive Annual Financial Report
West Virginia Public Employees Insurance Agency 57
West Virginia Public Employees Insurance Agency
Notes to Financial Statements (continued)
4. Deposit and Investment Risk Disclosures (continued)
Security Type Moody’s S&P Fair Value
Percent of
Assets
(In Thousands)
Agency collateralized mortgage
obligations Aaa AAA $ 245,849 15.7%
Agency mortgage-backed securities Aaa AAA 138,487 8.9
U.S. Treasury bonds and notes Aaa AAA 334,152 21.4
Corporate bonds and notes A A 153,804 9.9
Corporate collateralized mortgage
obligations Aa AAA 122,349 7.9
Money market funds Aaa AAA 53,413 3.4
Corporate asset-backed securities Aaa AAA 10,679 0.7
Agency notes Aaa AAA 13,494 0.9
Municipal bonds Aa A 273 0.0
Total rated investments $ 1,072,500 68.8%
Unrated securities include a commingled investment pool valued at $488,243,000. The unrated
securities represent 31.2% of the fair value of the pool‟s investments.
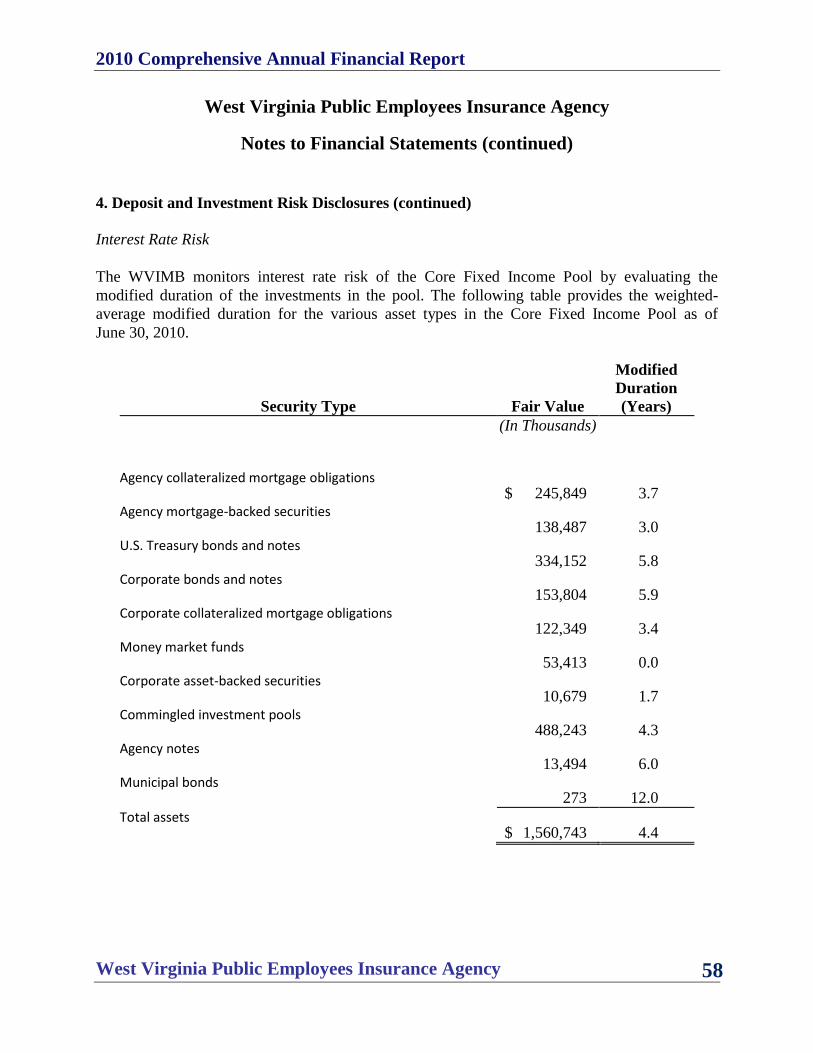
2010 Comprehensive Annual Financial Report
West Virginia Public Employees Insurance Agency 58
West Virginia Public Employees Insurance Agency
Notes to Financial Statements (continued)
4. Deposit and Investment Risk Disclosures (continued)
Interest Rate Risk
The WVIMB monitors interest rate risk of the Core Fixed Income Pool by evaluating the
modified duration of the investments in the pool. The following table provides the weighted-
average modified duration for the various asset types in the Core Fixed Income Pool as of
June 30, 2010.
Security Type Fair Value
Modified
Duration
(Years)
(In Thousands)
Agency collateralized mortgage obligations
$ 245,849 3.7 Agency mortgage-backed securities
138,487 3.0 U.S. Treasury bonds and notes
334,152 5.8 Corporate bonds and notes
153,804 5.9 Corporate collateralized mortgage obligations
122,349 3.4 Money market funds
53,413 0.0 Corporate asset-backed securities
10,679 1.7 Commingled investment pools
488,243 4.3 Agency notes
13,494 6.0 Municipal bonds
273 12.0
Total assets $ 1,560,743 4.4

2010 Comprehensive Annual Financial Report
West Virginia Public Employees Insurance Agency 59
West Virginia Public Employees Insurance Agency
Notes to Financial Statements (continued)
4. Deposit and Investment Risk Disclosures (continued)
The Core Fixed Income Pool invests in commercial and residential mortgage-backed securities,
asset-backed securities, and collateralized mortgage obligations. The cash flows from these
securities are based on the payment of the underlying collateral. The modified duration and yield
to maturity of these securities are dependent on estimated prepayment assumptions that consider
historical experience, market conditions, and other criteria. Actual prepayments may vary with
changes in interest rates. Rising interest rates often result in a slower rate of prepayments while
declining rates tend to lead to faster prepayments. As a result, the fair values of these securities
are highly sensitive to interest rate changes. At June 30, 2010, the Core Fixed Income Pool held
$44,179,058 of these securities. This represents approximately 33.7% of the value of the pool‟s
securities.
PEIA‟s amount invested in the Core Fixed Income Pool of $44,179,000 at June 30, 2010,
represented approximately 2.83% of total investments in this pool. At June 30, 2009, PEIA had
$21,406,000, which represented approximately 5.28% of total investments in this pool.
Hedge Fund Pool
The Hedge Fund Pool holds shares in various commingled institutional funds and shares of a
money market fund with the highest credit rating. The commingled institutional funds are not
rated by any of the nationally recognized statistical rating agencies and thus any credit risk
cannot be accurately reported. The pool is indirectly exposed to foreign currency risks as certain
of the funds have investments denominated in foreign currencies. West Virginia statute limits the
amount of international securities to no more than 30% of the total assets managed by the
WVIMB. At June 30, 2010, approximately $393,329,000 or 35.00%, of the market value of the
funds were held in foreign currencies. PEIA‟s amount invested in the Hedge Fund Pool of
$26,031,000 and $22,683,000 at June 30, 2010 and 2009, respectively, represented
approximately 2.34% and 2.04%, respectively, of total investments in this pool.
5. Equity Position in Internal Investment Pool – Restricted (Premium Stabilization Fund)
Managed by BTI
Optional life insurance premiums are funded entirely by program participants. The premium
stabilization fund consists of accumulated dividends and interest on the participant optional life
insurance policies. The premium stabilization fund is invested in the BTI Money Market Pool.
See pages 21 to 24 for investment risk disclosures related to this pool. To the extent that these
policyholder premiums are refunded to PEIA in the form of dividends and interest by the life
insurance company, the funds are refunded to the related optional life policyholders by way of
reductions in future premium increases. This account is utilized to track the accumulated balance
due to optional life policyholders. Cash and cash equivalents include $7,738,706 as of June 30,
2010 and 2009, restricted to meet this obligation.
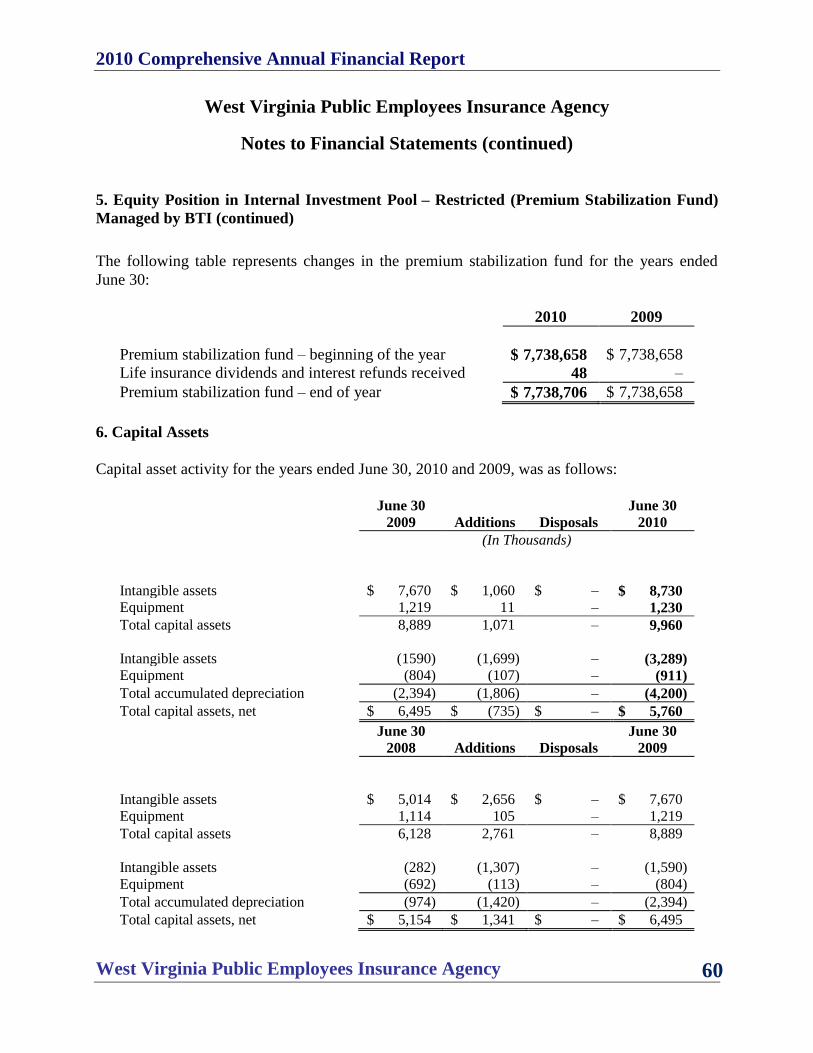
2010 Comprehensive Annual Financial Report
West Virginia Public Employees Insurance Agency 60
West Virginia Public Employees Insurance Agency
Notes to Financial Statements (continued)
5. Equity Position in Internal Investment Pool – Restricted (Premium Stabilization Fund)
Managed by BTI (continued)
The following table represents changes in the premium stabilization fund for the years ended
June 30:
2010 2009
Premium stabilization fund – beginning of the year $ 7,738,658 $ 7,738,658
Life insurance dividends and interest refunds received 48 –
Premium stabilization fund – end of year $ 7,738,706 $ 7,738,658
6. Capital Assets
Capital asset activity for the years ended June 30, 2010 and 2009, was as follows:
June 30 June 30
2009 Additions Disposals 2010
(In Thousands)
Intangible assets $ 7,670 $ 1,060 $ – $ 8,730
Equipment 1,219 11 – 1,230
Total capital assets 8,889 1,071 – 9,960
Intangible assets (1590) (1,699) – (3,289)
Equipment (804) (107) – (911)
Total accumulated depreciation (2,394) (1,806) – (4,200)
Total capital assets, net $ 6,495 $ (735) $ – $ 5,760
June 30 June 30
2008 Additions Disposals 2009
Intangible assets $ 5,014 $ 2,656 $ – $ 7,670
Equipment 1,114 105 – 1,219
Total capital assets 6,128 2,761 – 8,889
Intangible assets (282) (1,307) – (1,590)
Equipment (692) (113) – (804)
Total accumulated depreciation (974) (1,420) – (2,394)
Total capital assets, net $ 5,154 $ 1,341 $ – $ 6,495

2010 Comprehensive Annual Financial Report
West Virginia Public Employees Insurance Agency 61
West Virginia Public Employees Insurance Agency
Notes to Financial Statements (continued)
7. Unpaid Claims Liabilities
As discussed in Note 2, PEIA establishes a liability for both reported and unreported insured
events, which includes an estimate of future payments of losses. The following represents
changes in those aggregate liabilities for PEIA for the years ended June 30:
2010 2009 2008
(In Thousands)
Claims payable, beginning of year $ 56,462 $ 51,277 $ 52,999 Incurred claims expenses:
Provision for insured events of the current year 427,392 400,289 377,099
Increase (decrease) in provision for insured events
of prior years 530 (1,560) (1,030)
Total incurred claims expense 427,922 398,729 376,069 Payments:
Claim payments attributable to insured events of:
Current year 375,571 354,773 335,380
Prior years 44,358 38,771 42,411
Total payments 419,929 393,544 377,791
Claims payable, end of year $ 64,455 $ 56,462 $ 51,277
The above payments are net of pharmacy rebates of $12,607,269, $13,632,097, and $11,842,611
for the years ended June 30, 2010, 2009, and 2008, respectively.
8. Employee Benefit Plans
All full-time PEIA employees are eligible to participate in the State of West Virginia Public
Employees Retirement System (PERS), a cost-sharing, multiple-employer, public employee
retirement system. Employees who retire at or after age 60 with 5 or more years of contributory
service or who retire at or after age 55 and have completed 25 years of credited service are
eligible for retirement benefits as established by state statute. Retirement benefits are payable
monthly for life, in the form of a straight-line annuity equal to 2% of the employee‟s final
average salary, multiplied by the number of years of the employee‟s credited service at the time
of retirement. PERS also provides deferred retirement, early retirement, and death and disability
benefits, and issues an annual report that can be obtained by contacting PERS.
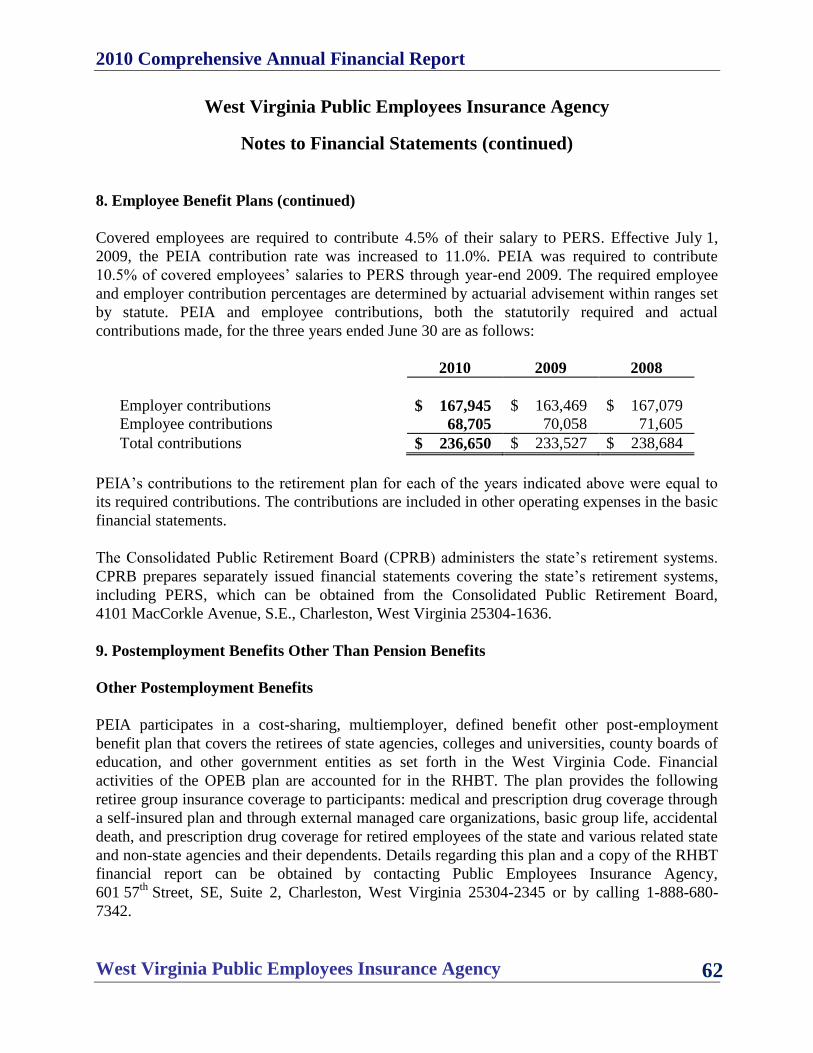
2010 Comprehensive Annual Financial Report
West Virginia Public Employees Insurance Agency 62
West Virginia Public Employees Insurance Agency
Notes to Financial Statements (continued)
8. Employee Benefit Plans (continued)
Covered employees are required to contribute 4.5% of their salary to PERS. Effective July 1,
2009, the PEIA contribution rate was increased to 11.0%. PEIA was required to contribute
10.5% of covered employees‟ salaries to PERS through year-end 2009. The required employee
and employer contribution percentages are determined by actuarial advisement within ranges set
by statute. PEIA and employee contributions, both the statutorily required and actual
contributions made, for the three years ended June 30 are as follows:
2010 2009 2008
Employer contributions $ 167,945 $ 163,469 $ 167,079
Employee contributions 68,705 70,058 71,605
Total contributions $ 236,650 $ 233,527 $ 238,684
PEIA‟s contributions to the retirement plan for each of the years indicated above were equal to
its required contributions. The contributions are included in other operating expenses in the basic
financial statements.
The Consolidated Public Retirement Board (CPRB) administers the state‟s retirement systems.
CPRB prepares separately issued financial statements covering the state‟s retirement systems,
including PERS, which can be obtained from the Consolidated Public Retirement Board,
4101 MacCorkle Avenue, S.E., Charleston, West Virginia 25304-1636.
9. Postemployment Benefits Other Than Pension Benefits
Other Postemployment Benefits
PEIA participates in a cost-sharing, multiemployer, defined benefit other post-employment
benefit plan that covers the retirees of state agencies, colleges and universities, county boards of
education, and other government entities as set forth in the West Virginia Code. Financial
activities of the OPEB plan are accounted for in the RHBT. The plan provides the following
retiree group insurance coverage to participants: medical and prescription drug coverage through
a self-insured plan and through external managed care organizations, basic group life, accidental
death, and prescription drug coverage for retired employees of the state and various related state
and non-state agencies and their dependents. Details regarding this plan and a copy of the RHBT
financial report can be obtained by contacting Public Employees Insurance Agency,
601 57th
Street, SE, Suite 2, Charleston, West Virginia 25304-2345 or by calling 1-888-680-
7342.
2010 Comprehensive Annual Financial Report
West Virginia Public Employees Insurance Agency 63
West Virginia Public Employees Insurance Agency
Notes to Financial Statements (continued)
9. Postemployment Benefits Other Than Pension Benefits (continued)
Upon retirement, an employee may apply unused sick leave and/or annual leave to reduce their
future insurance premiums paid to RHBT. Substantially all employees hired prior to July 1,
2001, may become eligible for these benefits if they reach normal retirement age while working
for PEIA. According to West Virginia State Code, employees hired prior to June 30, 1988, can
receive health care credit against 100% of their health care coverage. Employees hired between
June 30, 1988 and June 30, 2001, can receive health care credit against 50% of their health care
cost. Employees hired July 1, 2001, or later, may not convert sick leave into a health care benefit.
Legislation requires RHBT to determine through an actuarial study, the contractually required
contribution (CRC) that shall be sufficient to maintain the RHBT in an actuarially sound manner.
The CRC is allocated to respective cost-sharing employers, including PEIA, who are required by
law to fund at least the minimum annual premium component of the CRC. Revenues collected by
RHBT shall be used to fund current OPEB health care claims and administrative expenses with
residual funds held in trust for future OPEB costs. Based on the actuarial studies completed, the
contractually required contribution rates were determined for the fiscal year ended June 30,
2010, 2009, and 2008. PEIA‟s contributions to the RHBT were $55,596, $63,800, and $81,900
for fiscal years 2010, 2009, and 2008, respectively, which represent 16.0%, 48.5%, and 49.4%,
respectively, of the contractually required contributions. The cumulative unpaid balances of
$384,690, $98,000, and $30,000 for fiscal years 2010, 2009, and 2008, respectively, is recorded
in other accrued liabilities in the statements of net assets. The State, on PEIA‟s behalf, paid
$43,000 toward the annual required contribution for fiscal year 2008.
The West Virginia State Code provides that contribution requirements of the members and the
participating employers are established and may be amended by the RHBT Finance Board. A
non-Medicare plan member or beneficiaries receiving benefits contributes monthly premiums
ranging from $227 to $812 per month for retiree only coverage, and from $457 to $1,937 per
month for retiree and spouse coverage. Medicare covered retirees are charged premiums ranging
from $46 to $349 per month for retiree only coverage, and from $249 to $1,176 per month for
retiree and spouse coverage. Monthly premiums vary based on years of service and choice of
coverage.
10. Litigation
PEIA is engaged in various legal actions that it deems to be in the ordinary course of business.
PEIA believes that it has adequately provided for probable costs of current litigation. As these
legal actions are resolved, however, PEIA could realize positive and/or negative impact to its
financial performance in the period in which these legal actions are ultimately decided.

2010 Comprehensive Annual Financial Report
West Virginia Public Employees Insurance Agency 64
Required Supplemental Schedule

2010 Comprehensive Annual Financial Report
West Virginia Public Employees Insurance Agency 65
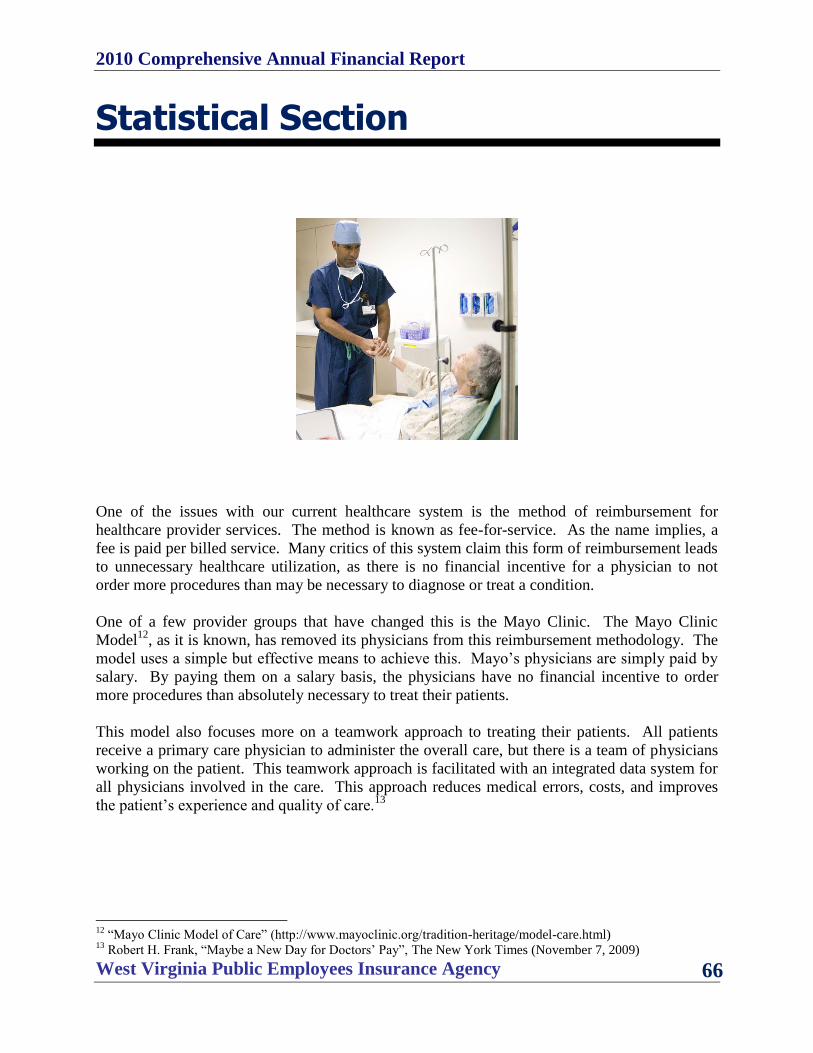
2010 Comprehensive Annual Financial Report
West Virginia Public Employees Insurance Agency 66
Statistical Section
One of the issues with our current healthcare system is the method of reimbursement for
healthcare provider services. The method is known as fee-for-service. As the name implies, a
fee is paid per billed service. Many critics of this system claim this form of reimbursement leads
to unnecessary healthcare utilization, as there is no financial incentive for a physician to not
order more procedures than may be necessary to diagnose or treat a condition.
One of a few provider groups that have changed this is the Mayo Clinic. The Mayo Clinic
Model12
, as it is known, has removed its physicians from this reimbursement methodology. The
model uses a simple but effective means to achieve this. Mayo‟s physicians are simply paid by
salary. By paying them on a salary basis, the physicians have no financial incentive to order
more procedures than absolutely necessary to treat their patients.
This model also focuses more on a teamwork approach to treating their patients. All patients
receive a primary care physician to administer the overall care, but there is a team of physicians
working on the patient. This teamwork approach is facilitated with an integrated data system for
all physicians involved in the care. This approach reduces medical errors, costs, and improves
the patient‟s experience and quality of care.13
12
“Mayo Clinic Model of Care” (http://www.mayoclinic.org/tradition-heritage/model-care.html) 13
Robert H. Frank, “Maybe a New Day for Doctors‟ Pay”, The New York Times (November 7, 2009)
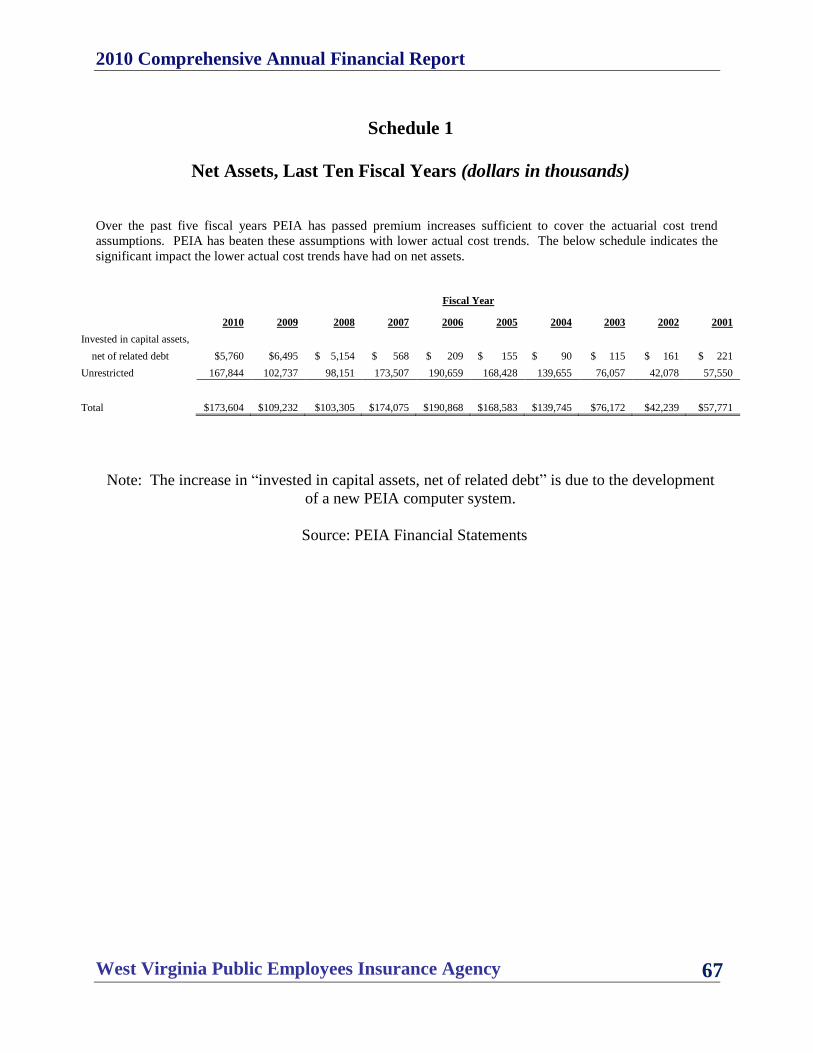
2010 Comprehensive Annual Financial Report
West Virginia Public Employees Insurance Agency 67
Schedule 1
Net Assets, Last Ten Fiscal Years (dollars in thousands)
Over the past five fiscal years PEIA has passed premium increases sufficient to cover the actuarial cost trend
assumptions. PEIA has beaten these assumptions with lower actual cost trends. The below schedule indicates the
significant impact the lower actual cost trends have had on net assets.
Fiscal Year
2010 2009 2008 2007 2006 2005 2004 2003 2002 2001
Invested in capital assets,
net of related debt $5,760 $6,495 $ 5,154 $ 568 $ 209 $ 155 $ 90 $ 115 $ 161 $ 221
Unrestricted 167,844 102,737 98,151 173,507 190,659 168,428 139,655 76,057 42,078 57,550
Total $173,604 $109,232 $103,305 $174,075 $190,868 $168,583 $139,745 $76,172 $42,239 $57,771
Note: The increase in “invested in capital assets, net of related debt” is due to the development
of a new PEIA computer system.
Source: PEIA Financial Statements

2010 Comprehensive Annual Financial Report
West Virginia Public Employees Insurance Agency 68
Schedule 2
Changes in Net Assets, Last Ten Fiscal Years
This schedule provides additional information on how PEIA has accomplished the positive change in net assets.
2010
2009 2008 2007 2006 2005 2004 2003 2002 2001
Operating Revenues:
Premiums
$542,095,539
$464,263,863 $416,040,777 $466,232,421 $630,474,784 $580,985,961 $567,836,346 $494,803,110 $418,663,654 $396,494,659
Less:
Payments to managed care
organizations
(55,278,092)
(54,666,461) (55,127,294)
(53,051,579)
(56,018,955)
(49,441,787)
(55,471,086)
(50,336,032)
(46,818,034)
(71,609,138)
Life reinsurance premiums
(5,633,432)
(5,520,045) (5,468,540)
(6,176,482)
(6,447,851)
(6,404,367)
(6,361,993)
(6,394,214)
(5,144,232)
(5,047,339)
Net premium revenue
481,184,015
404,077,357 355,444,943 407,004,360
568,007,978
525,139,807
506,003,267
438,072,864
366,701,388
319,838,182
Administrative fees, net of
refunds
4,742,682
4,693,824 4,487,011 4,450,017
6,058,949
6,011,411
6,035,393
4,766,910
4,656,388
4,612,838
Net operating revenues
485,926,697
408,771,181 355,444,943 411,454,377
574,066,927
531,151,218
512,038,660
442,839,774
371,357,776
324,451,020
Operating Expenses:
Claims expense
412,334,128
371,015,676 419,370,075 359,512,303
519,393,700
483,206,286
426,667,298
389,312,256
379,258,215
316,219,643
Administrative service fees
15,971,306
14,810,235 12,820,798
12,723,779
15,717,640
16,116,521
15,082,572
14,444,565
10,917,542
11,471,003
Other operating expenses
9,372,861
10,107,845 6,764,371 7,435,296
10,318,185
7,462,489
8,264,151
6,750,109
5,614,074
5,283,378
Total operating expenses
437,678,295
395,933,756 438,955,244 379,671,378
545,429,525
506,785,296
450,014,021
410,506,930
395,789,831
332,974,024
Operating Income (loss)
48,248,402
12,837,425 (79,023,290) 31,782,999
28,637,402
24,365,922
62,024,639
32,332,844
(24,432,055)
(8,523,004)
Nonoperating Revenues
(Expenses):
Investment income (loss), net
of fees
16,124,008
(6,903,009) 7,934,895
22,126,245
8,348,296
4,472,144
1,549,114
1,599,711
3,099,867
6,565,677
Litigation settlement
-
- - 3,085,000 - - - - - -
Retiree drug subsidy
-
-
- -
8,090,995 - - - - -
On behalf of contributions
-
- 43,412 - - - - - - -
Supplemental Appropriations
-
- - 6,700,000 4,887,369 - - - 5,800,000 10,000,000
Transfer out primary
government
(262)
(7,320) - (80,487,422)
(27,679,595) - - - - -
Change in Net Assets
$64,372,148
$5,927,096 $(71,044,983)
$(16,793,178)
$22,284,467
$28,838,066
$63,573,753
$33,932,555
$(15,532,188)
$8,042,673
Note: Retirees and Survivors are now accounted for in the WV RHBT beginning in 2007.
Source: PEIA Financial Statements
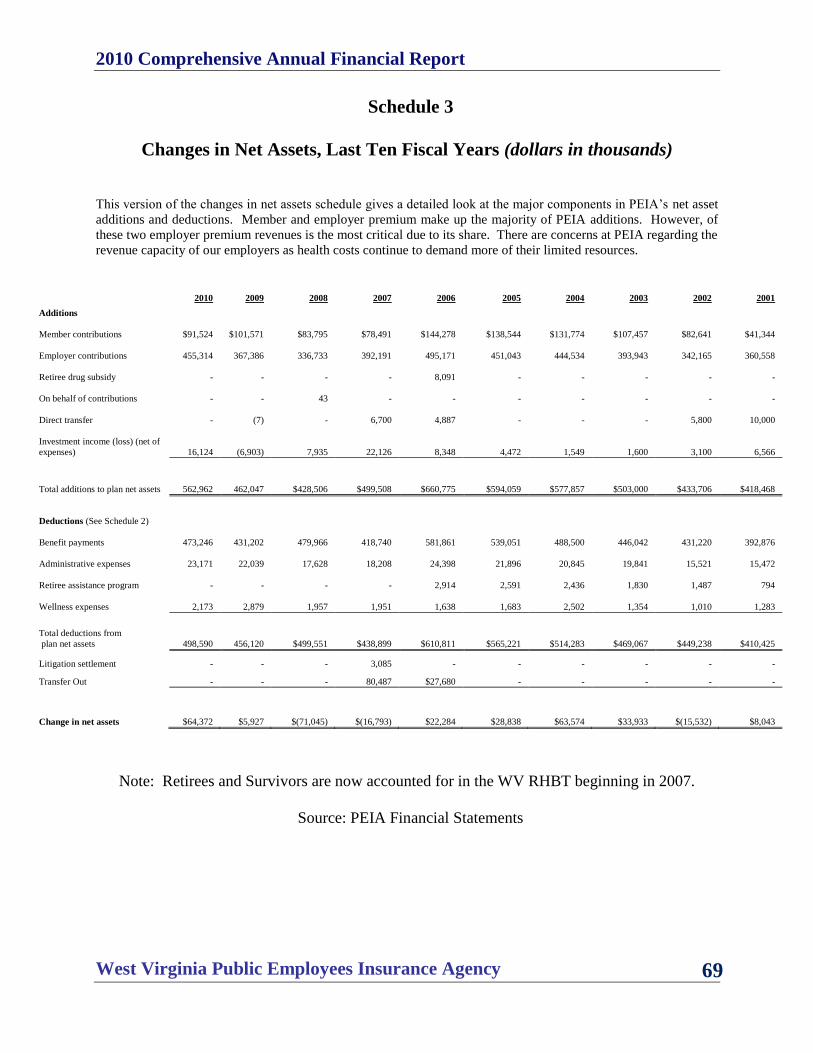
2010 Comprehensive Annual Financial Report
West Virginia Public Employees Insurance Agency 69
Schedule 3
Changes in Net Assets, Last Ten Fiscal Years (dollars in thousands)
This version of the changes in net assets schedule gives a detailed look at the major components in PEIA‟s net asset
additions and deductions. Member and employer premium make up the majority of PEIA additions. However, of
these two employer premium revenues is the most critical due to its share. There are concerns at PEIA regarding the
revenue capacity of our employers as health costs continue to demand more of their limited resources.
2010 2009 2008 2007 2006 2005 2004 2003 2002 2001
Additions
Member contributions $91,524 $101,571
$83,795 $78,491 $144,278 $138,544 $131,774 $107,457 $82,641 $41,344
Employer contributions 455,314 367,386 336,733 392,191 495,171 451,043 444,534 393,943
342,165 360,558
Retiree drug subsidy - - - - 8,091 - - -
- -
On behalf of contributions - - 43 - - - - - - -
Direct transfer - (7) - 6,700 4,887 - - -
5,800 10,000
Investment income (loss) (net of
expenses) 16,124 (6,903) 7,935 22,126 8,348 4,472 1,549 1,600
3,100 6,566
Total additions to plan net assets 562,962 462,047 $428,506 $499,508 $660,775 $594,059 $577,857 $503,000
$433,706 $418,468
Deductions (See Schedule 2)
Benefit payments 473,246 431,202 479,966 418,740 581,861 539,051 488,500 446,042
431,220 392,876
Administrative expenses 23,171 22,039 17,628 18,208 24,398 21,896 20,845 19,841
15,521 15,472
Retiree assistance program - - - - 2,914 2,591 2,436 1,830
1,487 794
Wellness expenses 2,173 2,879 1,957 1,951 1,638 1,683 2,502 1,354
1,010 1,283
Total deductions from
plan net assets 498,590 456,120 $499,551 $438,899 $610,811 $565,221 $514,283 $469,067
$449,238 $410,425
Litigation settlement - - - 3,085 - - - - - -
Transfer Out - - - 80,487 $27,680 - - - - -
Change in net assets $64,372 $5,927 $(71,045) $(16,793) $22,284 $28,838 $63,574 $33,933
$(15,532) $8,043
Note: Retirees and Survivors are now accounted for in the WV RHBT beginning in 2007.
Source: PEIA Financial Statements

2010 Comprehensive Annual Financial Report
West Virginia Public Employees Insurance Agency 70
Schedule 4
Benefit Deductions from Net Assets by Type, Last Ten Fiscal Years
(dollars in thousands)
Of note in this schedule is the trend of prescription drugs. Excepting fiscal year 2007 when PEIA transferred the
reporting of retirees to the RHBT, prescription drugs have increased over 200% in the past ten years.
Fiscal Year
2010 2009 2008 2007 2006 2005 2004 2003 2002 2001
Type of Benefit
Medical Claims $309,155 $280,156 $334,318 $263,995 $345,255 $327,242 $297,190 $271,009 $272,663 $234,047
Prescription Drug Claims 103,180 90,860 85,052 95,517 174,139 155,964 129,477 118,303 106,595 82,173
Managed Care Capitations 55,278 54,666 55,127 53,052 56,019 49,442 55,471 50,336 46,818 71,609
Life Insurance Premiums 5,633 5,520 5,469 6,176 6,448 6,404 6,362 6,394 5,144 5,047
Total Benefits $473,246 $431,202 $479,966 $418,740 $581,861 $539,051 $488,500 $ 446,042 $431,220 $392,876
Note: Retirees and Survivors are now accounted for in the WV RHBT beginning in 2007.
Source: PEIA Financial Statements

2010 Comprehensive Annual Financial Report
West Virginia Public Employees Insurance Agency 71
Schedule 5
Employer and Employee Health Contribution Rates, Last Ten Fiscal Years
The below schedule indicates the level of premium for various policyholder types over the past ten years. The rate
of increase should be noted for further indications of revenue capacity concerns.
Fiscal Year
Average Monthly
Premium 2010 2009 2008 2007 2006 2005 2004 2003 2002 2001
State Policyholders
PPB $121 $99 $100 $101 $108 $110 $106 $84 $58 $46
Managed Care $129 $117 $114 $114 $129 $131 $123 $106 $84 $78
State Employers
PPB $475 $419 $433 $443 $556 $499 $499 $445 $393 $401
Managed Care $461 $400 $415 $423 $537 $481 $476 $424 $381 $415
Local Employers
PPB $631 $537 $486 $482 $611 $593 $554 $486 $386 $368
Managed Care $542 $477 $436 $464 $552 $525 $506 $428 $421 $505
Retiree Policyholders
PPB - - - - $147 $136 $131 $113 $100 $98
Managed Care - - - - $442 $387 $359 $357 $459 $381
Note: Retirees and Survivors are now accounted for in the WV RHBT beginning in 2007.
Source: PEIA Actuarial Reports
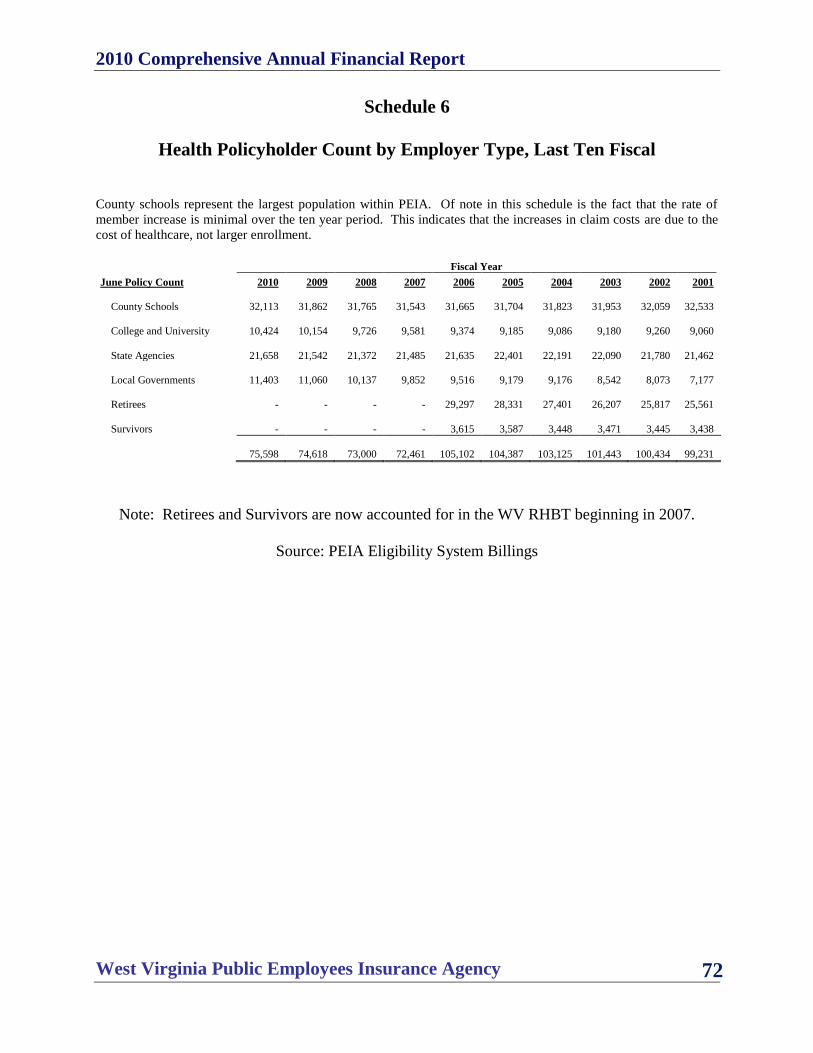
2010 Comprehensive Annual Financial Report
West Virginia Public Employees Insurance Agency 72
Schedule 6
Health Policyholder Count by Employer Type, Last Ten Fiscal
County schools represent the largest population within PEIA. Of note in this schedule is the fact that the rate of
member increase is minimal over the ten year period. This indicates that the increases in claim costs are due to the
cost of healthcare, not larger enrollment.
Fiscal Year
June Policy Count 2010 2009 2008 2007 2006 2005 2004 2003 2002 2001
County Schools 32,113 31,862 31,765
31,543 31,665
31,704
31,823
31,953
32,059
32,533
College and University 10,424 10,154 9,726 9,581 9,374 9,185
9,086
9,180
9,260 9,060
State Agencies 21,658 21,542 21,372
21,485
21,635
22,401
22,191 22,090
21,780
21,462
Local Governments 11,403 11,060 10,137 9,852 9,516 9,179
9,176
8,542
8,073 7,177
Retirees - - - -
29,297
28,331
27,401
26,207
25,817
25,561
Survivors - - - - 3,615 3,587 3,448 3,471 3,445 3,438
75,598 74,618 73,000
72,461
105,102
104,387
103,125
101,443
100,434
99,231
Note: Retirees and Survivors are now accounted for in the WV RHBT beginning in 2007.
Source: PEIA Eligibility System Billings
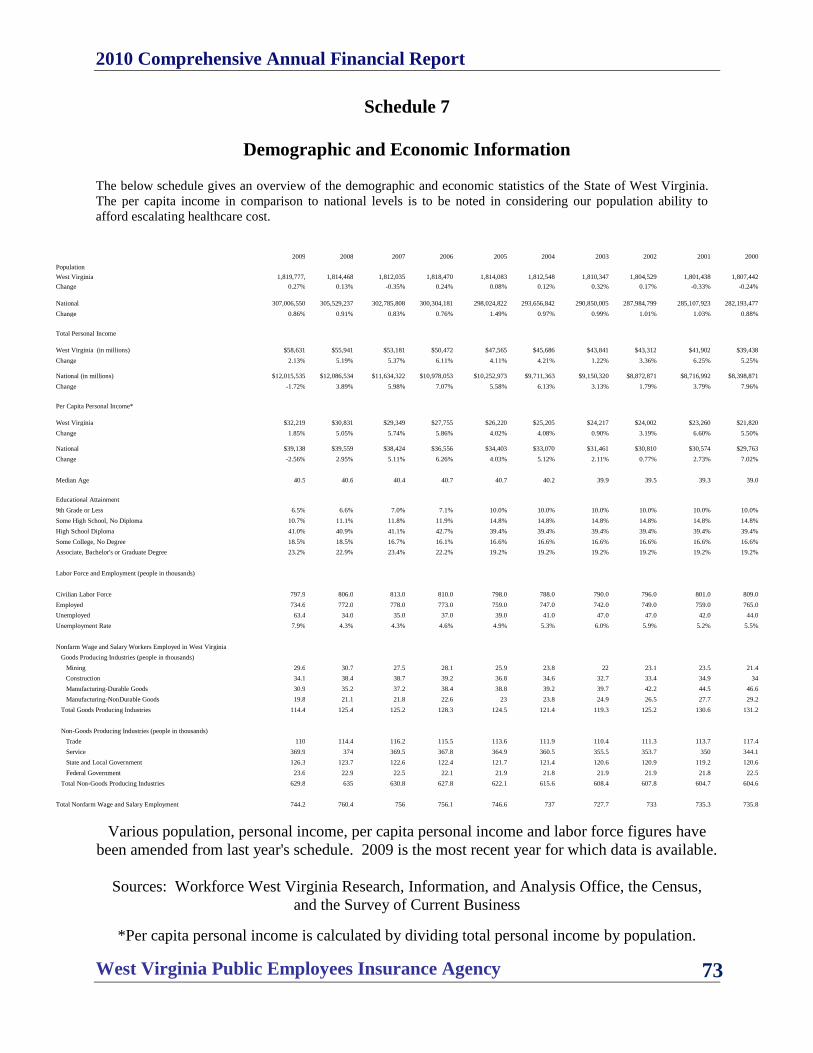
2010 Comprehensive Annual Financial Report
West Virginia Public Employees Insurance Agency 73
Schedule 7
Demographic and Economic Information
The below schedule gives an overview of the demographic and economic statistics of the State of West Virginia.
The per capita income in comparison to national levels is to be noted in considering our population ability to
afford escalating healthcare cost.
2009 2008 2007 2006 2005 2004 2003 2002 2001 2000
Population
West Virginia 1,819,777, 1,814,468 1,812,035 1,818,470 1,814,083 1,812,548 1,810,347 1,804,529 1,801,438 1,807,442
Change 0.27% 0.13% -0.35% 0.24% 0.08% 0.12% 0.32% 0.17% -0.33% -0.24%
National 307,006,550 305,529,237 302,785,808
300,304,181 298,024,822
293,656,842 290,850,005
287,984,799 285,107,923
282,193,477
Change 0.86% 0.91% 0.83% 0.76% 1.49% 0.97% 0.99% 1.01% 1.03% 0.88%
Total Personal Income
West Virginia (in millions)
$58,631
$55,941
$53,181
$50,472
$47,565
$45,686
$43,841
$43,312
$41,902
$39,438
Change 2.13% 5.19% 5.37% 6.11% 4.11% 4.21% 1.22% 3.36% 6.25% 5.25%
National (in millions)
$12,015,535
$12,086,534
$11,634,322
$10,978,053
$10,252,973
$9,711,363
$9,150,320
$8,872,871
$8,716,992
$8,398,871
Change -1.72% 3.89% 5.98% 7.07% 5.58% 6.13% 3.13% 1.79% 3.79% 7.96%
Per Capita Personal Income*
West Virginia
$32,219
$30,831
$29,349
$27,755
$26,220
$25,205
$24,217
$24,002
$23,260
$21,820
Change 1.85% 5.05% 5.74% 5.86% 4.02% 4.08% 0.90% 3.19% 6.60% 5.50%
National
$39,138
$39,559
$38,424
$36,556
$34,403
$33,070
$31,461
$30,810
$30,574
$29,763
Change -2.56% 2.95% 5.11% 6.26% 4.03% 5.12% 2.11% 0.77% 2.73% 7.02%
Median Age 40.5 40.6 40.4 40.7 40.7 40.2 39.9 39.5 39.3 39.0
Educational Attainment
9th Grade or Less 6.5% 6.6% 7.0% 7.1% 10.0% 10.0% 10.0% 10.0% 10.0% 10.0%
Some High School, No Diploma 10.7% 11.1% 11.8% 11.9% 14.8% 14.8% 14.8% 14.8% 14.8% 14.8%
High School Diploma 41.0% 40.9% 41.1% 42.7% 39.4% 39.4% 39.4% 39.4% 39.4% 39.4%
Some College, No Degree 18.5% 18.5% 16.7% 16.1% 16.6% 16.6% 16.6% 16.6% 16.6% 16.6%
Associate, Bachelor's or Graduate Degree 23.2% 22.9% 23.4% 22.2% 19.2% 19.2% 19.2% 19.2% 19.2% 19.2%
Labor Force and Employment (people in thousands)
Civilian Labor Force 797.9 806.0 813.0 810.0 798.0 788.0 790.0 796.0 801.0 809.0
Employed 734.6 772.0 778.0 773.0 759.0 747.0 742.0 749.0 759.0 765.0
Unemployed 63.4 34.0 35.0 37.0 39.0 41.0 47.0 47.0 42.0 44.0
Unemployment Rate 7.9% 4.3% 4.3% 4.6% 4.9% 5.3% 6.0% 5.9% 5.2% 5.5%
Nonfarm Wage and Salary Workers Employed in West Virginia
Goods Producing Industries (people in thousands)
Mining 29.6 30.7 27.5 28.1 25.9 23.8 22 23.1 23.5 21.4
Construction 34.1 38.4 38.7 39.2 36.8 34.6 32.7 33.4 34.9 34
Manufacturing-Durable Goods 30.9 35.2 37.2 38.4 38.8 39.2 39.7 42.2 44.5 46.6
Manufacturing-NonDurable Goods 19.8 21.1 21.8 22.6 23 23.8 24.9 26.5 27.7 29.2
Total Goods Producing Industries 114.4 125.4 125.2 128.3 124.5 121.4 119.3 125.2 130.6 131.2
Non-Goods Producing Industries (people in thousands)
Trade 110 114.4 116.2 115.5 113.6 111.9 110.4 111.3 113.7 117.4
Service 369.9 374 369.5 367.8 364.9 360.5 355.5 353.7 350 344.1
State and Local Government 126.3 123.7 122.6 122.4 121.7 121.4 120.6 120.9 119.2 120.6
Federal Government 23.6 22.9 22.5 22.1 21.9 21.8 21.9 21.9 21.8 22.5
Total Non-Goods Producing Industries 629.8 635 630.8 627.8 622.1 615.6 608.4 607.8 604.7 604.6
Total Nonfarm Wage and Salary Employment 744.2 760.4 756 756.1 746.6 737 727.7 733 735.3 735.8
Various population, personal income, per capita personal income and labor force figures have
been amended from last year's schedule. 2009 is the most recent year for which data is available.
Sources: Workforce West Virginia Research, Information, and Analysis Office, the Census,
and the Survey of Current Business
*Per capita personal income is calculated by dividing total personal income by population.

2010 Comprehensive Annual Financial Report
West Virginia Public Employees Insurance Agency 74
Schedule 8
Principal Participating Employers, Current Year and Nine Years Ago
The below schedule indicates the top employers in the plan. Interesting is the increase in the Berkeley Co Board of
Education, one of the few areas in West Virginia with increasing population trends.
2010 2001
% %
Covered
of Total Covered
of Total Product or
Participating Government Employees Rank System Employees Rank System Service
State of West Virginia 21,658 1 28.65% 21,366 1 21.53%
State
Government
West Virginia University 5,937 2 7.85 5,355 2 5.40
Higher
Education
Kanawha Co Board of Education 3,128 3 4.14 3,456 3 3.48 K-12
Education
Berkeley Co Board of Education 2,048 4 2.71 1,431 6 1.44
K-12
Education
Wood Co Board of Education 1,530 5 2.02 1,453 4 1.46
K-12
Education
Marshall University 1,409 6 1.86 1,284 8 1.29 Higher
Education
Cabell Co Board of Education 1,337 7 1.77 1,425 7 1.44
K-12
Education
Harrison Co Board of Education 1,320 8 1.75 1,273 9 1.28
K-12
Education
Raleigh Co Board of Education 1,296 9 1.71 1,447 5 1.46 K-12
Education
Monongalia Co Bd of Education 1,145 10 1.52 1,065 10 1.07
K-12
Education
All other a 34,790 46.02 59,676 60.15
Total 75,598 100.00 99,231 100.00
In 2010, "all other" consisted of:
Type Number Employees
Counties 40 2,651
Municipalities 90 2,134
School districts 48 20,309
Higher education 21 3,078
Political subdivisions & other 374 6,618
Total 573 34,790
Source: PEIA Eligibility System Billings
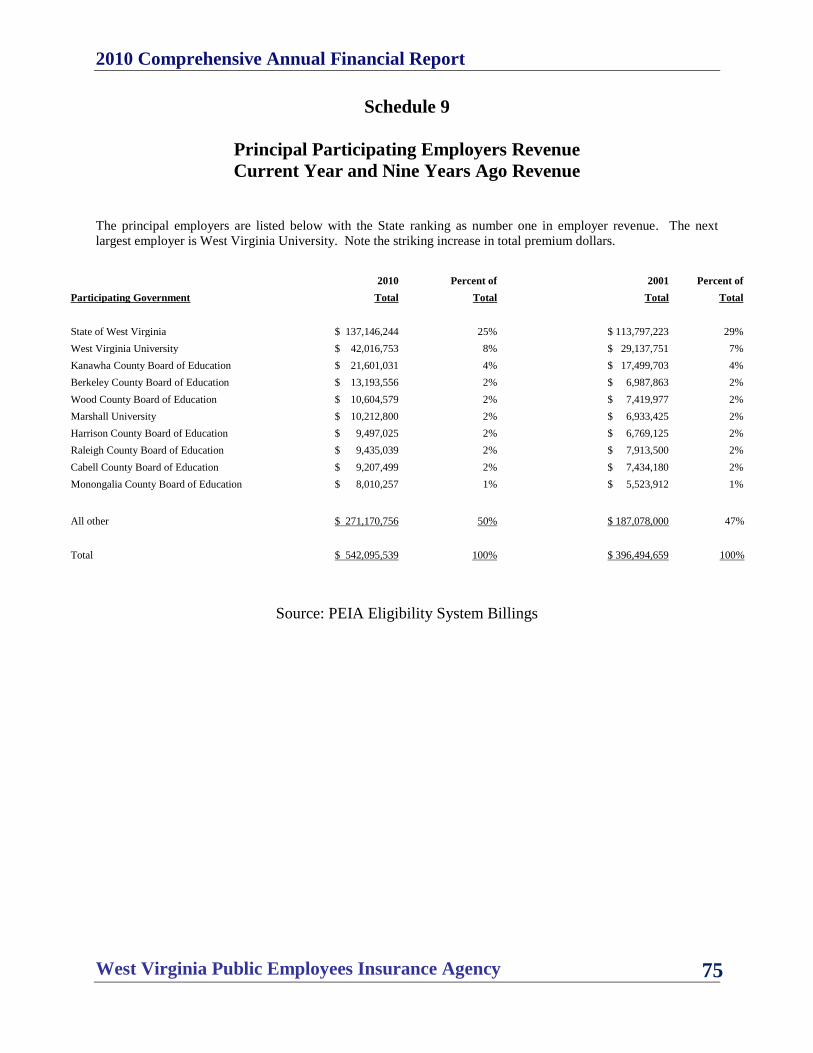
2010 Comprehensive Annual Financial Report
West Virginia Public Employees Insurance Agency 75
Schedule 9
Principal Participating Employers Revenue
Current Year and Nine Years Ago Revenue
The principal employers are listed below with the State ranking as number one in employer revenue. The next
largest employer is West Virginia University. Note the striking increase in total premium dollars.
2010 Percent of 2001 Percent of
Participating Government Total Total Total Total
State of West Virginia $ 137,146,244 25% $ 113,797,223 29%
West Virginia University $ 42,016,753 8% $ 29,137,751 7%
Kanawha County Board of Education $ 21,601,031 4% $ 17,499,703 4%
Berkeley County Board of Education $ 13,193,556 2% $ 6,987,863 2%
Wood County Board of Education $ 10,604,579 2% $ 7,419,977 2%
Marshall University $ 10,212,800 2% $ 6,933,425 2%
Harrison County Board of Education $ 9,497,025 2% $ 6,769,125 2%
Raleigh County Board of Education $ 9,435,039 2% $ 7,913,500 2%
Cabell County Board of Education $ 9,207,499 2% $ 7,434,180 2%
Monongalia County Board of Education $ 8,010,257 1% $ 5,523,912 1%
All other $ 271,170,756 50% $ 187,078,000 47%
Total $ 542,095,539 100% $ 396,494,659 100%
Source: PEIA Eligibility System Billings
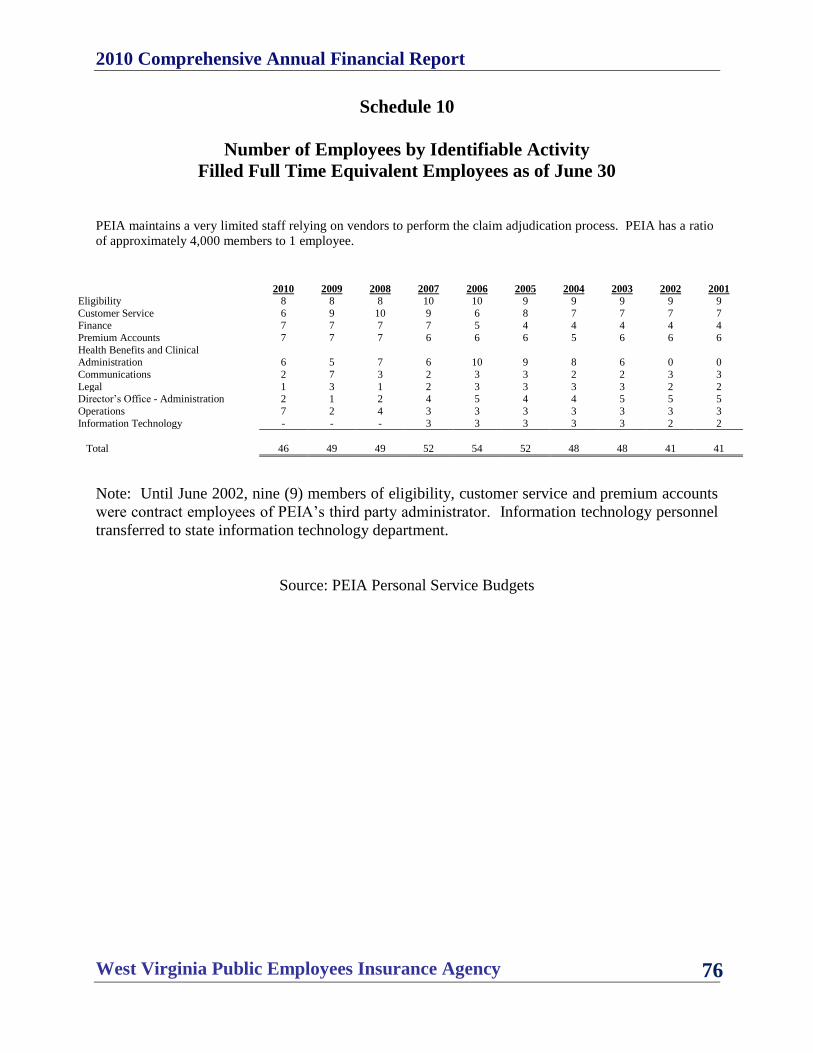
2010 Comprehensive Annual Financial Report
West Virginia Public Employees Insurance Agency 76
Schedule 10
Number of Employees by Identifiable Activity
Filled Full Time Equivalent Employees as of June 30
PEIA maintains a very limited staff relying on vendors to perform the claim adjudication process. PEIA has a ratio
of approximately 4,000 members to 1 employee.
2010 2009 2008 2007 2006 2005 2004 2003 2002 2001
Eligibility 8 8 8 10 10 9 9 9 9 9
Customer Service 6 9 10 9 6 8 7 7 7 7 Finance 7 7 7 7 5 4 4 4 4 4
Premium Accounts 7 7 7 6 6 6 5 6 6 6
Health Benefits and Clinical Administration 6 5 7
6 10 9 8 6 0 0
Communications 2 7 3 2 3 3 2 2 3 3
Legal 1 3 1 2 3 3 3 3 2 2 Director‟s Office - Administration 2 1 2 4 5 4 4 5 5 5
Operations 7 2 4 3 3 3 3 3 3 3
Information Technology - - - 3 3 3 3 3 2 2
Total 46 49 49 52 54 52 48 48 41 41
Note: Until June 2002, nine (9) members of eligibility, customer service and premium accounts
were contract employees of PEIA‟s third party administrator. Information technology personnel
transferred to state information technology department.
Source: PEIA Personal Service Budgets

2010 Comprehensive Annual Financial Report
West Virginia Public Employees Insurance Agency 77
Schedule 11
Policyholder Count by Type of Healthcare Benefit
Current Year and Previous Year
The following schedule demonstrates the high rate of participation in the PEIA self-funded
preferred provider benefit plan.
2010 2009
State Active Employees
Preferred Provider Benefit 56,681 55,767
Managed Care 7,514 7,791
Local Active Employees
Preferred Provider Benefit 10,692 10,405
Managed Care 711 655
Total 75,598 74,618
Source: PEIA Eligibility System Billings

2010 Comprehensive Annual Financial Report
West Virginia Public Employees Insurance Agency 78
Schedule 12
Average Monthly Claims Cost Per Policy/Contract
Current Year and Previous Year
Below is the average monthly claim cost by policyholder. The preferred provider benefit plan shows a lower cost
per month than the capitated managed care plans.
Year End 2010 Year End 2009
Medical Drug MCO Medical Drug MCO
Claims Claims Capitation Claims Claims Capitation
State Active Employees
Preferred Provider Benefit $400 $136 $ 397 $ 137 -
Managed Care - - $573 - - $ 548
Local Active Employees
Preferred Provider Benefit $402 $119 $ 368 $ 118 -
Managed Care - - $504 - - $ 441
Source: PEIA Actuarial Report