Embed Size (px)
Citation preview

Cape Cod Lumber 2015-2016 Wellness Campaign
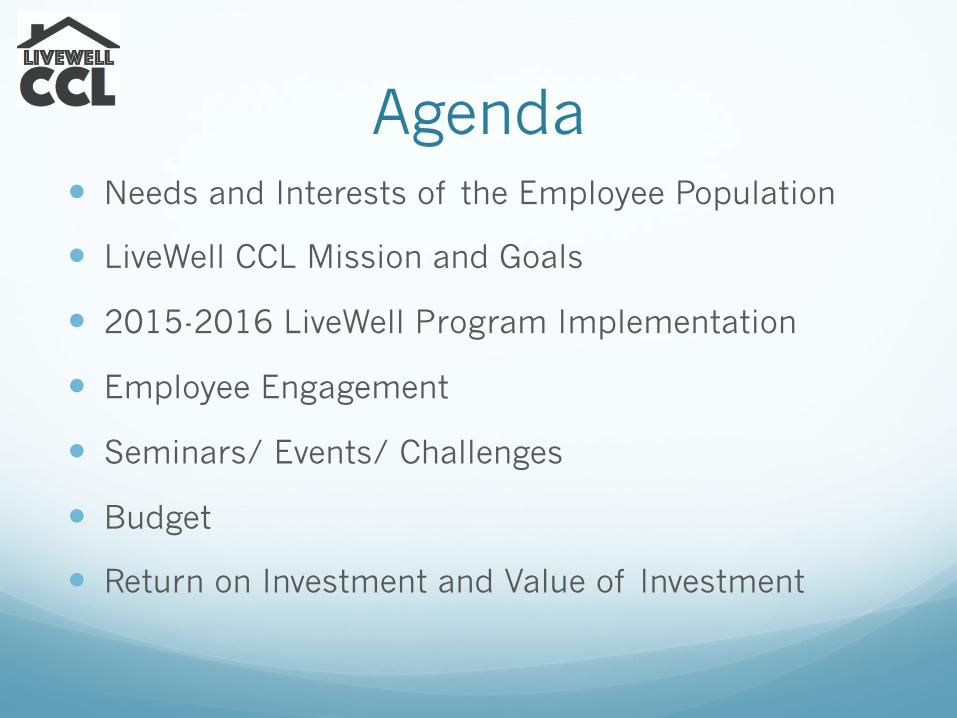
Agenda � Needs and Interests of the Employee Population
� LiveWell CCL Mission and Goals
� 2015-2016 LiveWell Program Implementation
� Employee Engagement
� Seminars/ Events/ Challenges
� Budget
� Return on Investment and Value of Investment
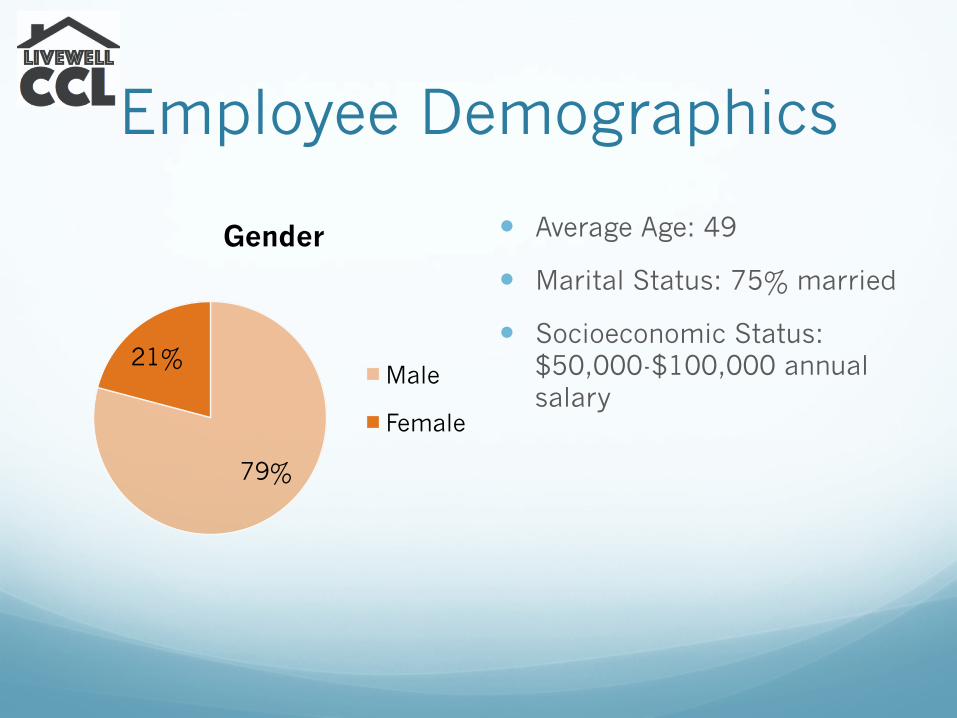
Employee Demographics
79%
21%
Gender
Male
Female
� Average Age: 49
� Marital Status: 75% married
� Socioeconomic Status: $50,000-$100,000 annual salary
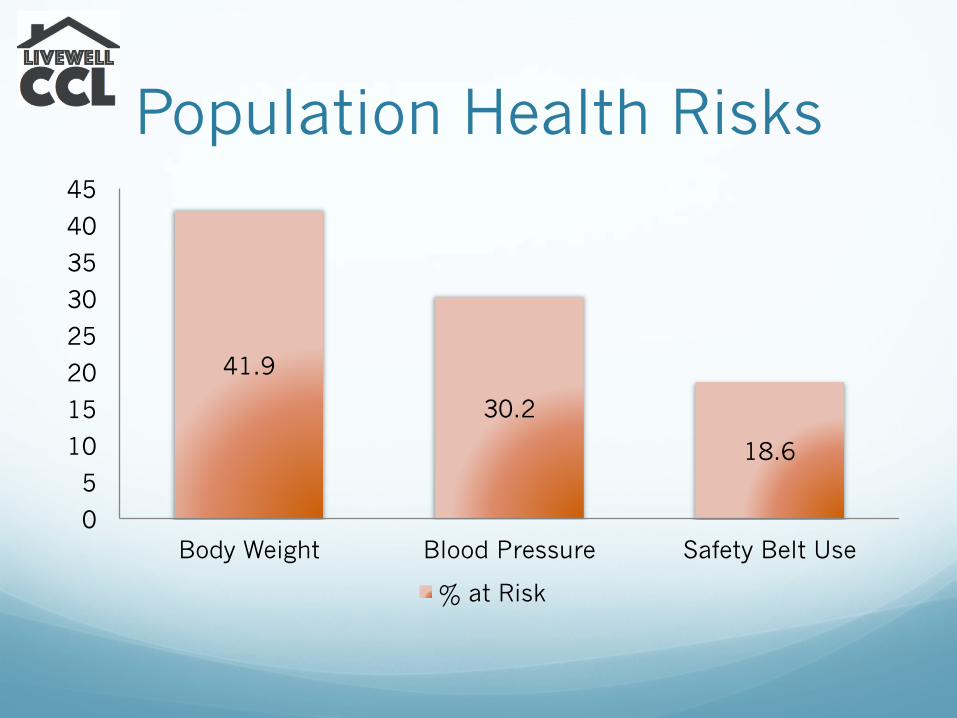
Population Health Risks
41.9
30.2
18.6
0
5
10
15
20
25
30
35
40
45
Body Weight Blood Pressure Safety Belt Use
% at Risk
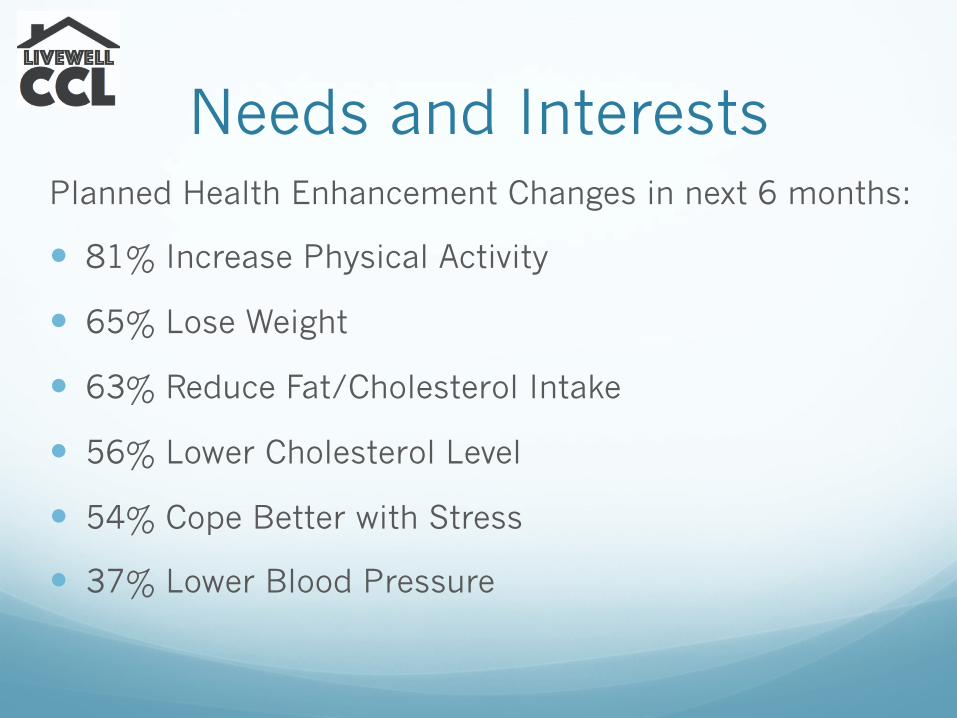
Needs and Interests Planned Health Enhancement Changes in next 6 months:
� 81% Increase Physical Activity
� 65% Lose Weight
� 63% Reduce Fat/Cholesterol Intake
� 56% Lower Cholesterol Level
� 54% Cope Better with Stress
� 37% Lower Blood Pressure
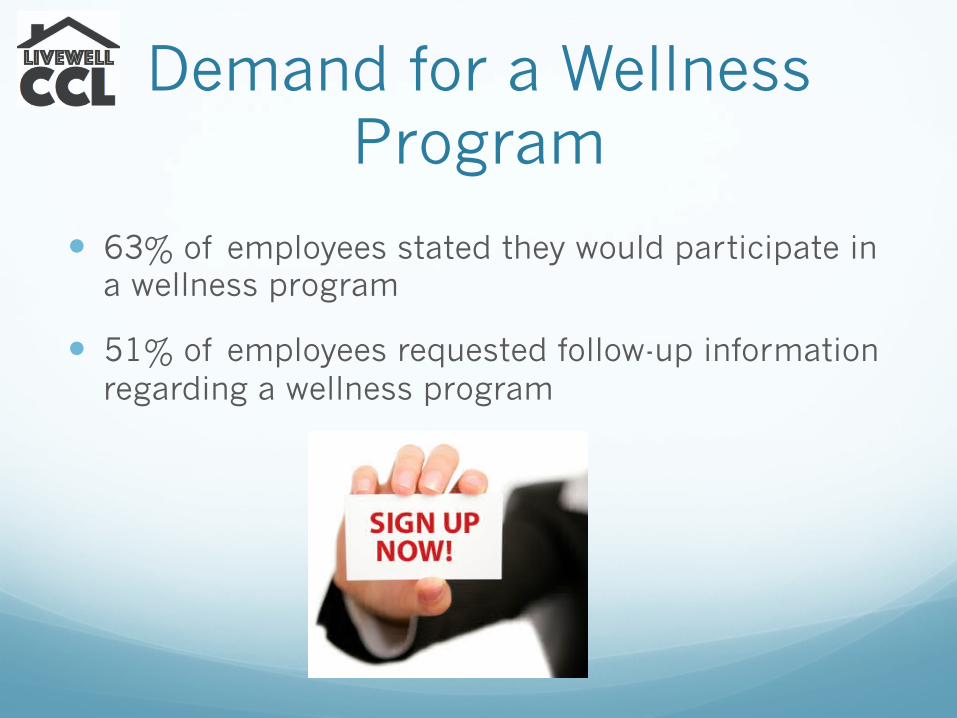
Demand for a Wellness Program
� 63% of employees stated they would participate in a wellness program
� 51% of employees requested follow-up information regarding a wellness program
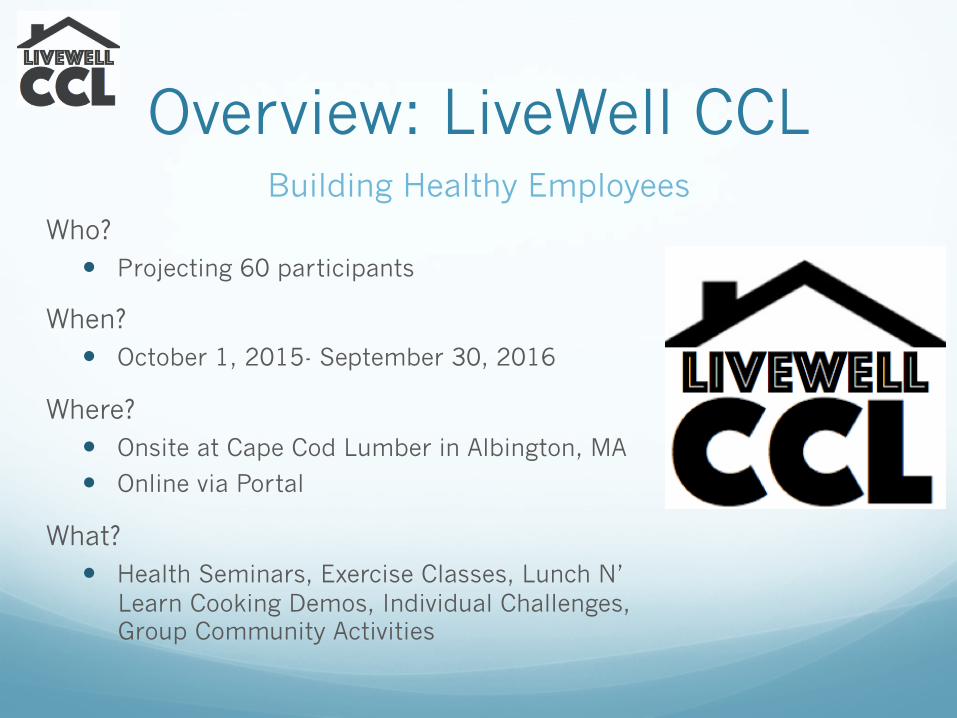
Overview: LiveWell CCL Building Healthy Employees
Who? � Projecting 60 participants
When? � October 1, 2015- September 30, 2016
Where? � Onsite at Cape Cod Lumber in Albington, MA
� Online via Portal
What? � Health Seminars, Exercise Classes, Lunch N’
Learn Cooking Demos, Individual Challenges, Group Community Activities
Mission Statement
Continue to improve the health and well-being of Cape Cod Lumber employees
through an individualized wellness plan that will prevent chronic disease and
support positive lifestyle changes.
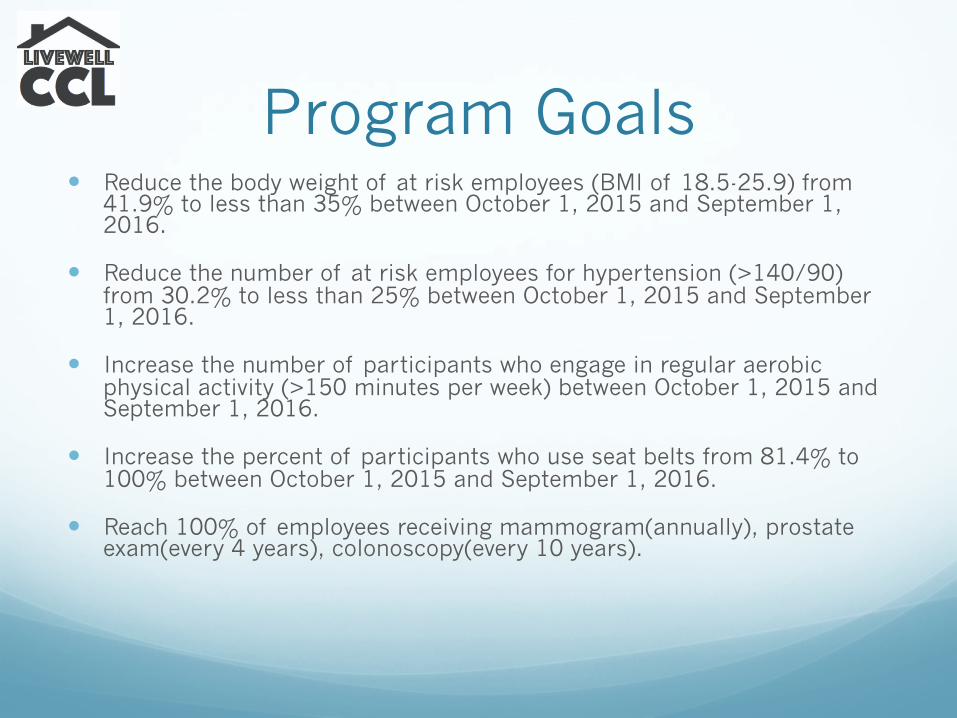
Program Goals � Reduce the body weight of at risk employees (BMI of 18.5-25.9) from
41.9% to less than 35% between October 1, 2015 and September 1, 2016.
� Reduce the number of at risk employees for hypertension (>140/90) from 30.2% to less than 25% between October 1, 2015 and September 1, 2016.
� Increase the number of participants who engage in regular aerobic physical activity (>150 minutes per week) between October 1, 2015 and September 1, 2016.
� Increase the percent of participants who use seat belts from 81.4% to 100% between October 1, 2015 and September 1, 2016.
� Reach 100% of employees receiving mammogram(annually), prostate exam(every 4 years), colonoscopy(every 10 years).
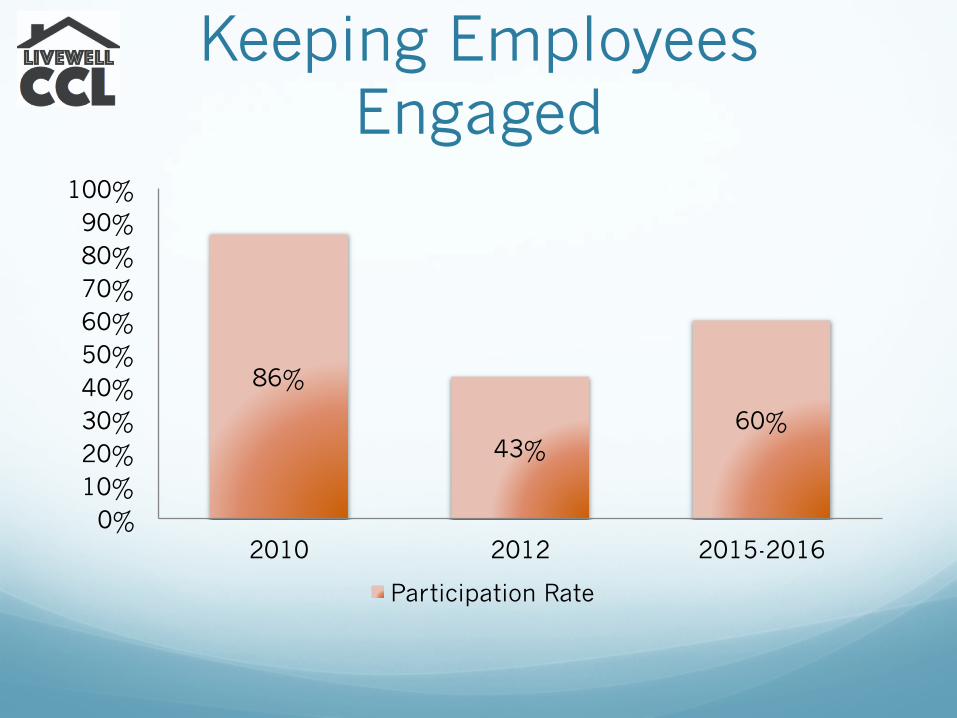
Keeping Employees Engaged
86%
43% 60%
0% 10% 20% 30% 40% 50% 60% 70% 80% 90%
100%
2010 2012 2015-2016
Participation Rate
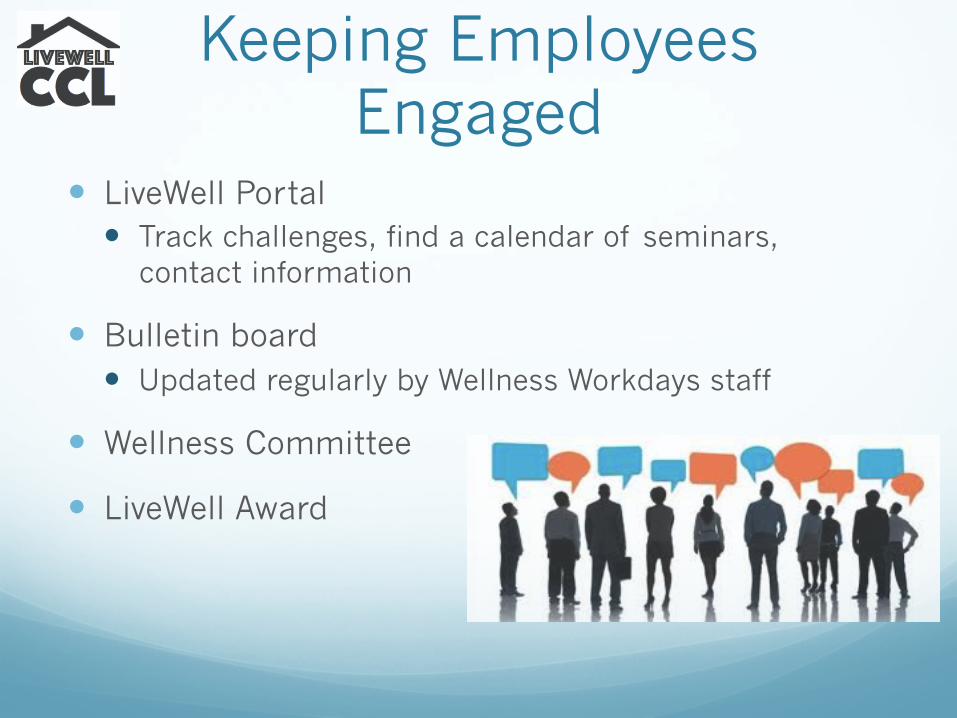
Keeping Employees Engaged
� LiveWell Portal � Track challenges, find a calendar of seminars,
contact information
� Bulletin board � Updated regularly by Wellness Workdays staff
� Wellness Committee
� LiveWell Award
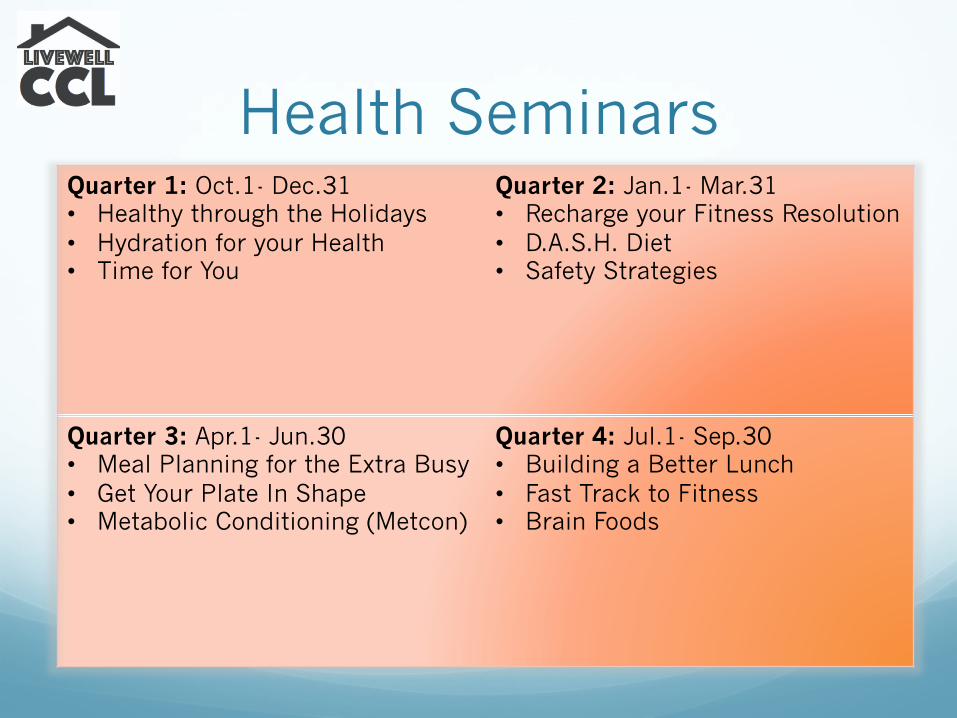
Health Seminars Quarter 1: Oct.1- Dec.31 • Healthy through the Holidays • Hydration for your Health • Time for You
Quarter 2: Jan.1- Mar.31 • Recharge your Fitness Resolution • D.A.S.H. Diet • Safety Strategies
Quarter 3: Apr.1- Jun.30 • Meal Planning for the Extra Busy • Get Your Plate In Shape • Metabolic Conditioning (Metcon)
Quarter 4: Jul.1- Sep.30 • Building a Better Lunch • Fast Track to Fitness • Brain Foods
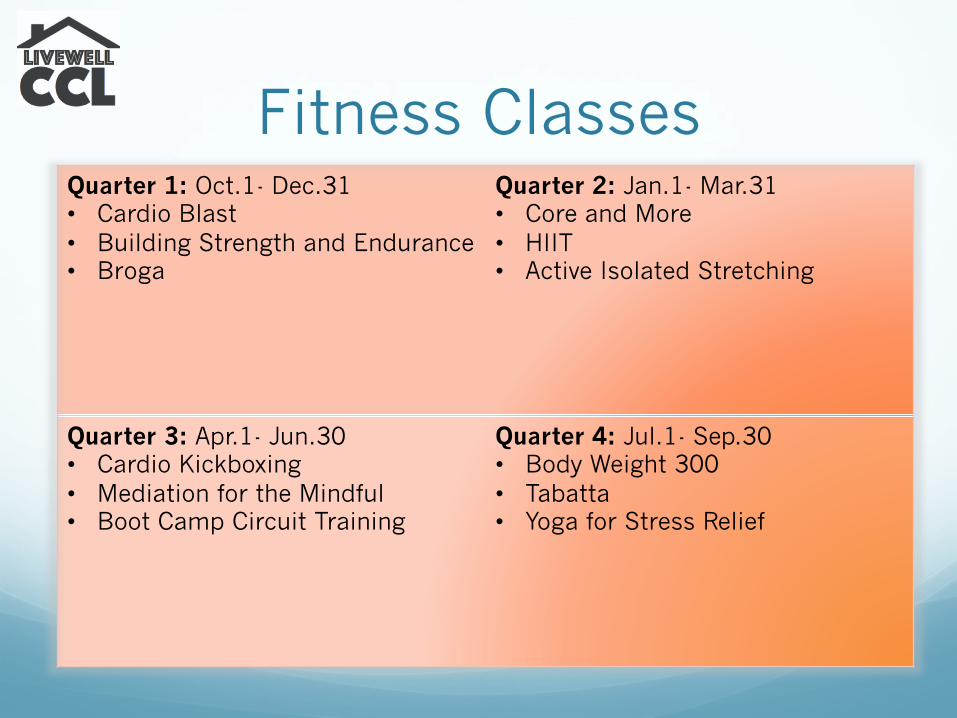
Fitness Classes Quarter 1: Oct.1- Dec.31 • Cardio Blast • Building Strength and Endurance • Broga
Quarter 2: Jan.1- Mar.31 • Core and More • HIIT • Active Isolated Stretching
Quarter 3: Apr.1- Jun.30 • Cardio Kickboxing • Mediation for the Mindful • Boot Camp Circuit Training
Quarter 4: Jul.1- Sep.30 • Body Weight 300 • Tabatta • Yoga for Stress Relief

Special Events � Lunch N’ Learn Cooking Demo
� Q1
� Q3
� Licensed Massage Therapist � Q2
� Q4
� 1-on-1 Health Coaching � Monthly
Biometric Screening & Personal Health Assessment
� Catered lunch for all who participate in Screenings and PHA’s
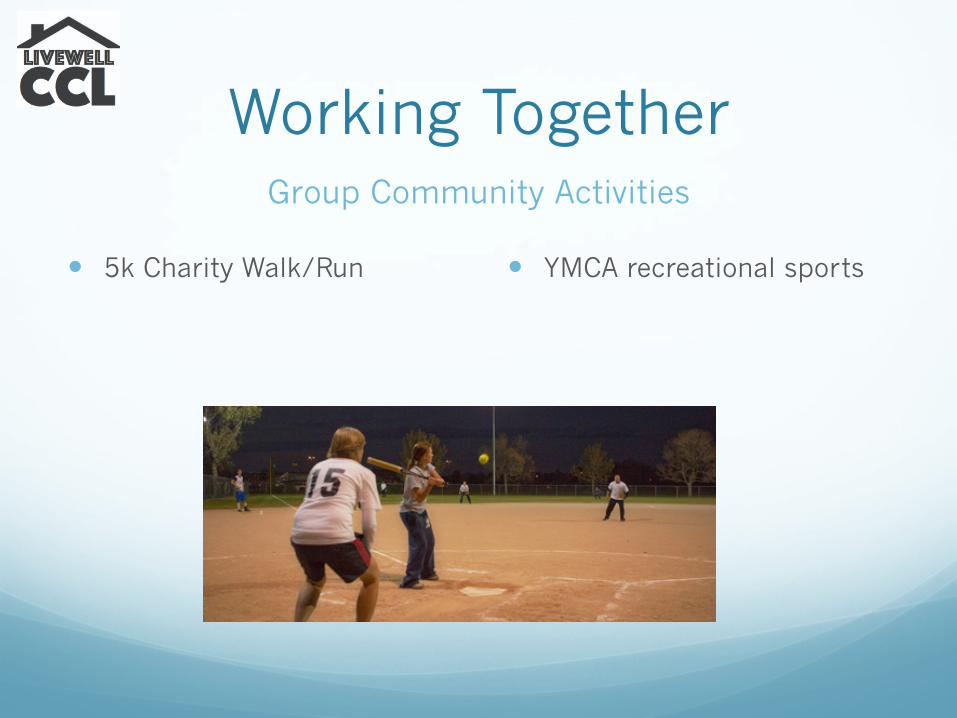
Working Together Group Community Activities
� 5k Charity Walk/Run � YMCA recreational sports
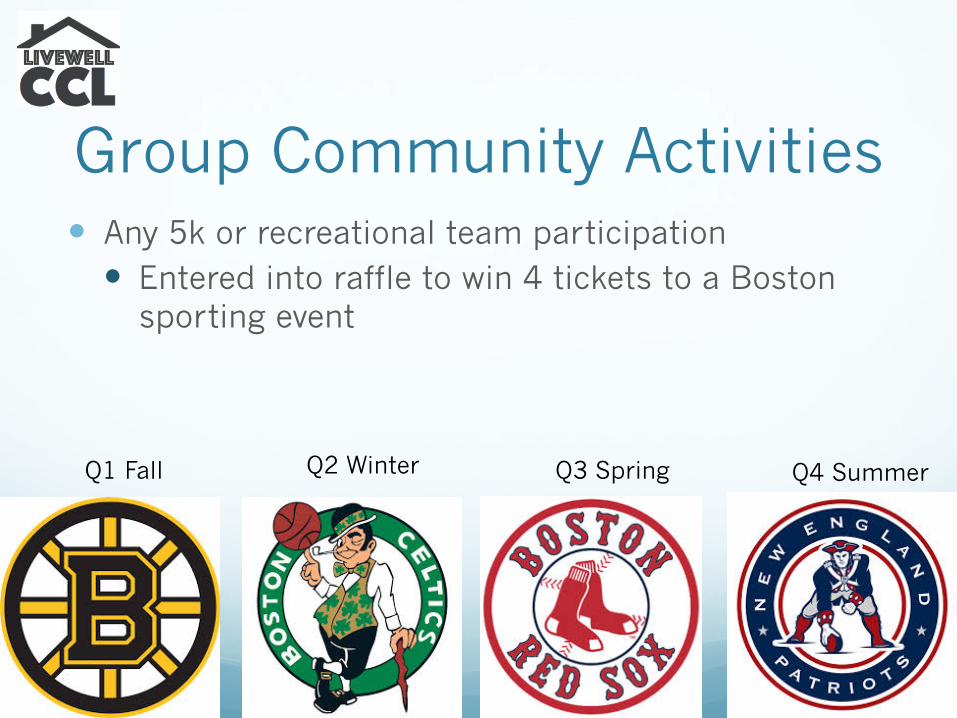
Group Community Activities � Any 5k or recreational team participation
� Entered into raffle to win 4 tickets to a Boston sporting event
Q1 Fall Q2 Winter Q3 Spring Q4 Summer
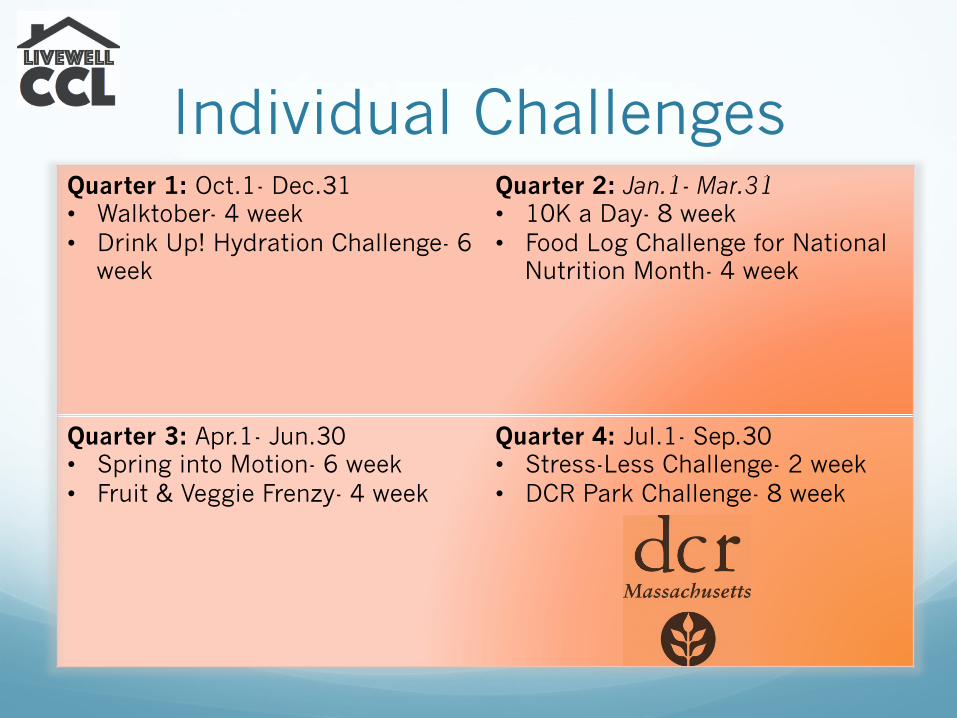
Individual Challenges Quarter 1: Oct.1- Dec.31 • Walktober- 4 week • Drink Up! Hydration Challenge- 6
week
Quarter 2: Jan.1- Mar.31 • 10K a Day- 8 week • Food Log Challenge for National
Nutrition Month- 4 week
Quarter 3: Apr.1- Jun.30 • Spring into Motion- 6 week • Fruit & Veggie Frenzy- 4 week
Quarter 4: Jul.1- Sep.30 • Stress-Less Challenge- 2 week • DCR Park Challenge- 8 week
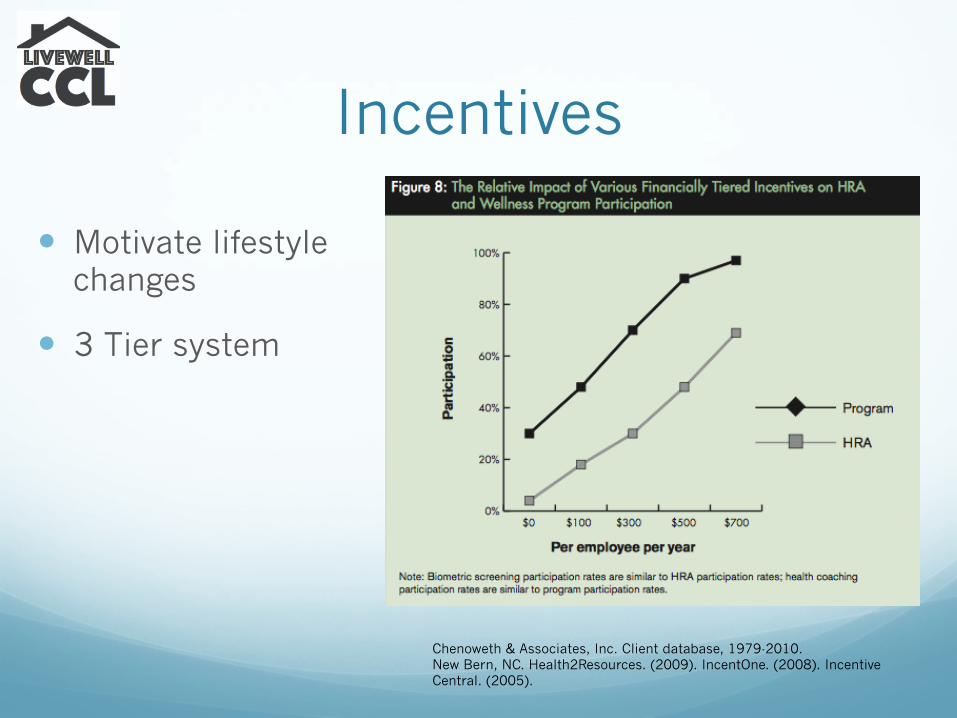
Incentives
� Motivate lifestyle changes
� 3 Tier system
Chenoweth & Associates, Inc. Client database, 1979-2010. New Bern, NC. Health2Resources. (2009). IncentOne. (2008). Incentive Central. (2005).
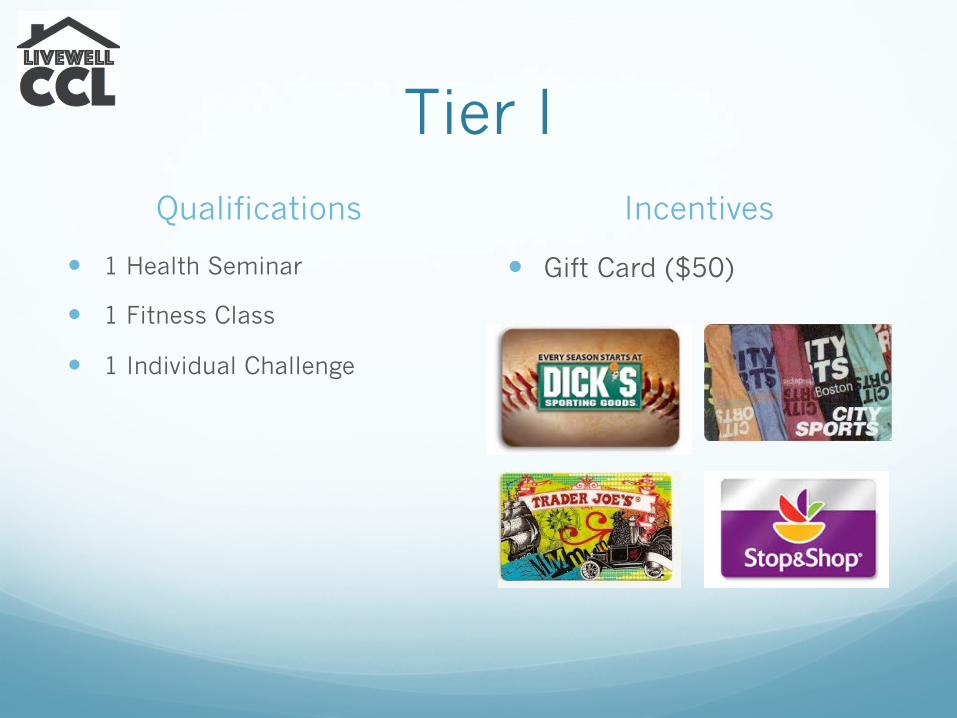
Tier I Qualifications
� 1 Health Seminar
� 1 Fitness Class
� 1 Individual Challenge
Incentives
� Gift Card ($50)
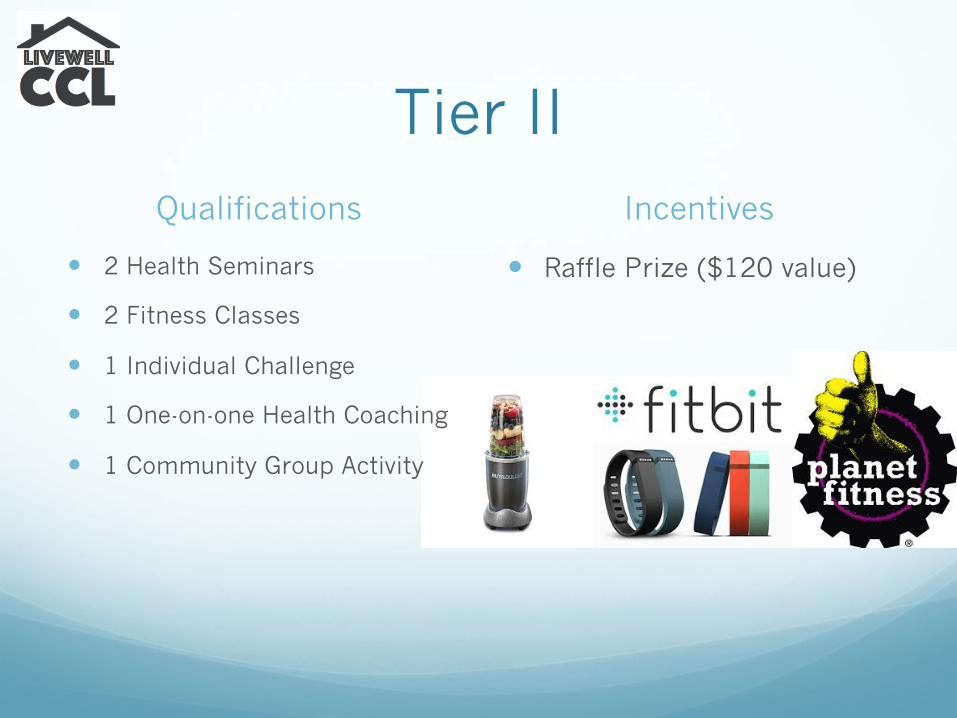
Tier II Qualifications Incentives
� Raffle Prize ($120 value) � 2 Health Seminars
� 2 Fitness Classes
� 1 Individual Challenge
� 1 One-on-one Health Coaching
� 1 Community Group Activity
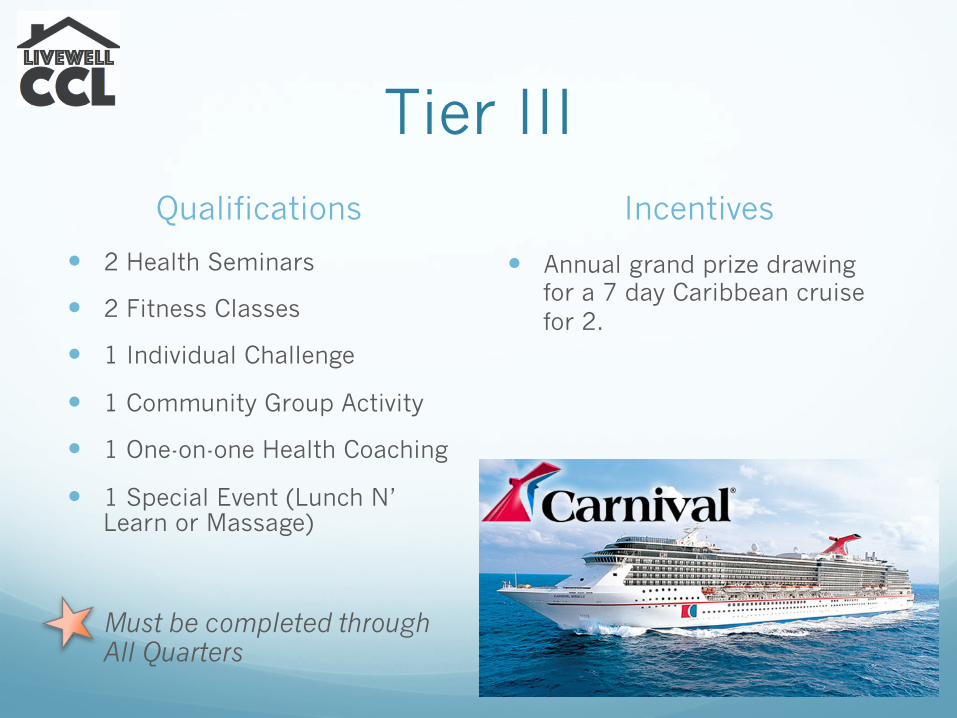
Tier III Qualifications
� 2 Health Seminars
� 2 Fitness Classes
� 1 Individual Challenge
� 1 Community Group Activity
� 1 One-on-one Health Coaching
� 1 Special Event (Lunch N’ Learn or Massage)
� Must be completed through All Quarters
Incentives
� Annual grand prize drawing for a 7 day Caribbean cruise for 2.
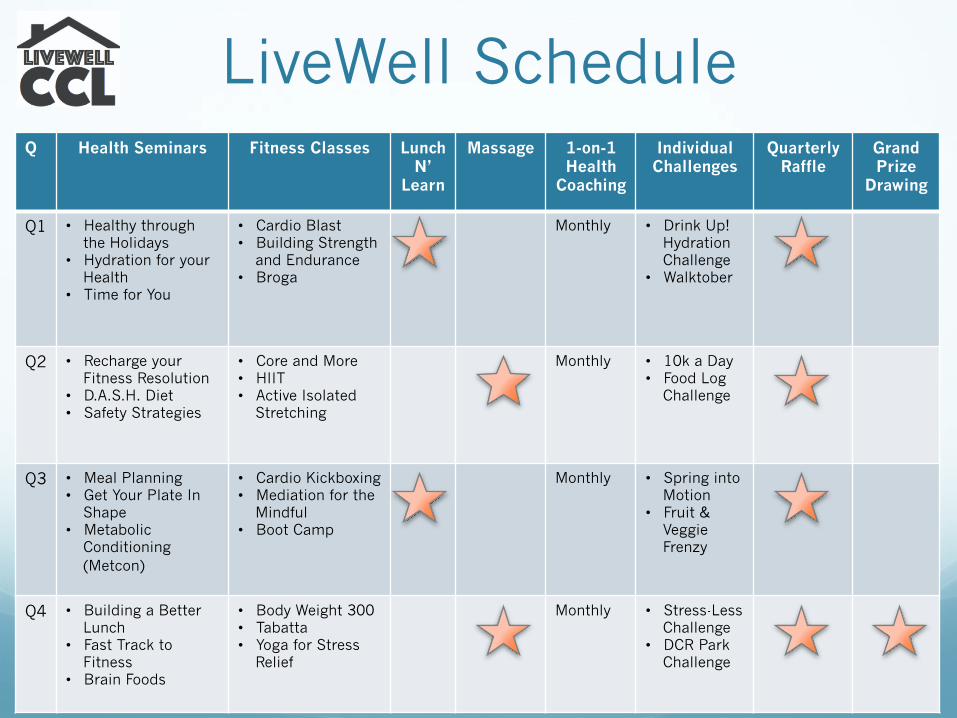
LiveWell Schedule Q Health Seminars Fitness Classes Lunch
N’ Learn
Massage 1-on-1 Health
Coaching
Individual Challenges
Quarterly Raffle
Grand Prize
Drawing
Q1 • Healthy through the Holidays
• Hydration for your Health
• Time for You
• Cardio Blast • Building Strength
and Endurance • Broga
Monthly • Drink Up! Hydration Challenge
• Walktober
Q2 • Recharge your Fitness Resolution
• D.A.S.H. Diet • Safety Strategies
• Core and More • HIIT • Active Isolated
Stretching
Monthly • 10k a Day • Food Log
Challenge
Q3 • Meal Planning • Get Your Plate In
Shape • Metabolic
Conditioning (Metcon)
• Cardio Kickboxing • Mediation for the
Mindful • Boot Camp
Monthly • Spring into Motion
• Fruit & Veggie Frenzy
Q4 • Building a Better Lunch
• Fast Track to Fitness
• Brain Foods
• Body Weight 300 • Tabatta • Yoga for Stress
Relief
Monthly • Stress-Less Challenge
• DCR Park Challenge
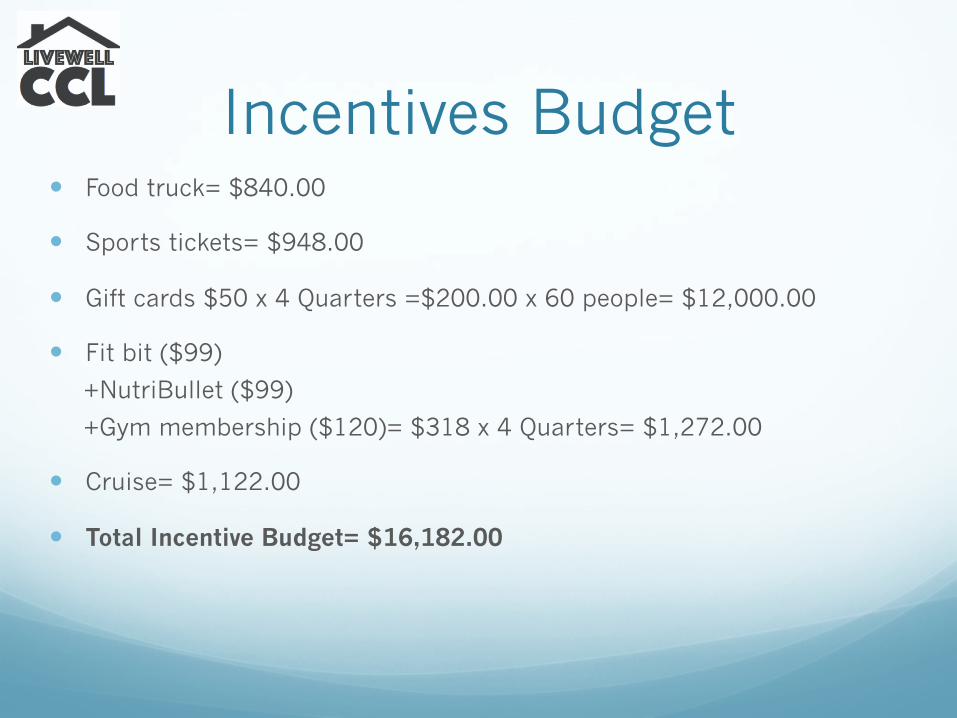
Incentives Budget � Food truck= $840.00
� Sports tickets= $948.00
� Gift cards $50 x 4 Quarters =$200.00 x 60 people= $12,000.00
� Fit bit ($99)
+NutriBullet ($99)
+Gym membership ($120)= $318 x 4 Quarters= $1,272.00
� Cruise= $1,122.00
� Total Incentive Budget= $16,182.00
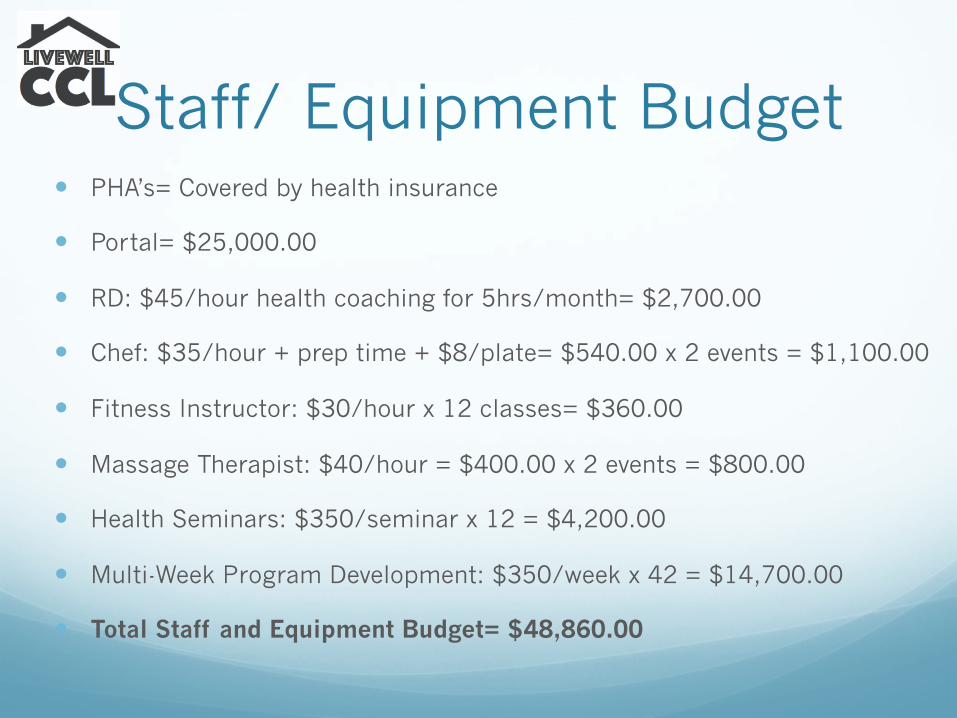
Staff/ Equipment Budget � PHA’s= Covered by health insurance
� Portal= $25,000.00
� RD: $45/hour health coaching for 5hrs/month= $2,700.00
� Chef: $35/hour + prep time + $8/plate= $540.00 x 2 events = $1,100.00
� Fitness Instructor: $30/hour x 12 classes= $360.00
� Massage Therapist: $40/hour = $400.00 x 2 events = $800.00
� Health Seminars: $350/seminar x 12 = $4,200.00
� Multi-Week Program Development: $350/week x 42 = $14,700.00
� Total Staff and Equipment Budget= $48,860.00
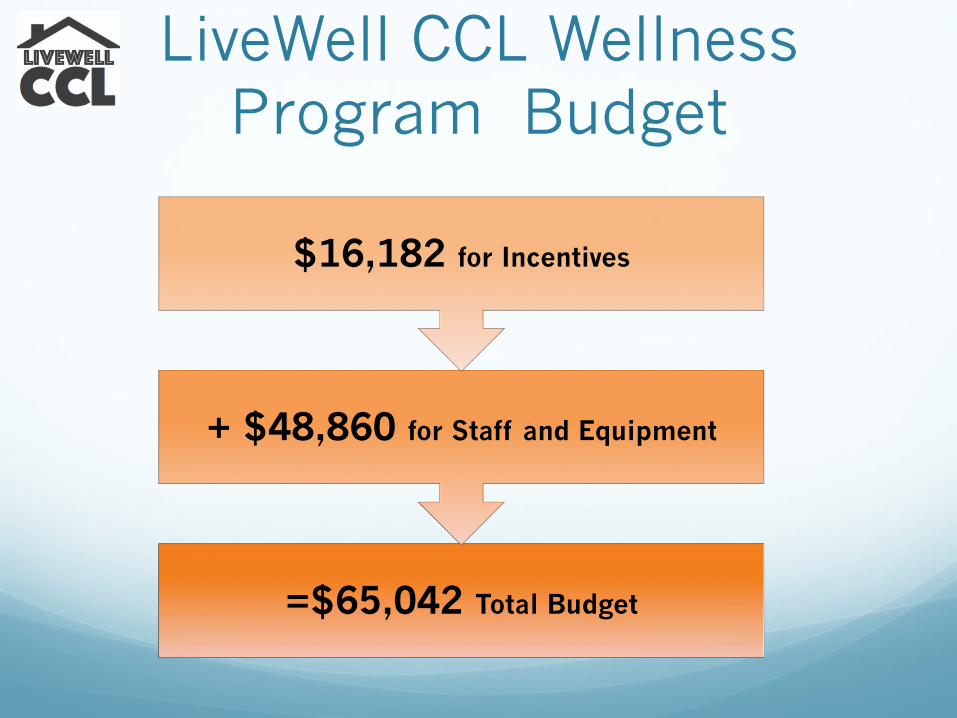
LiveWell CCL Wellness Program Budget
=$65,042 Total Budget
+ $48,860 for Staff and Equipment
$16,182 for Incentives
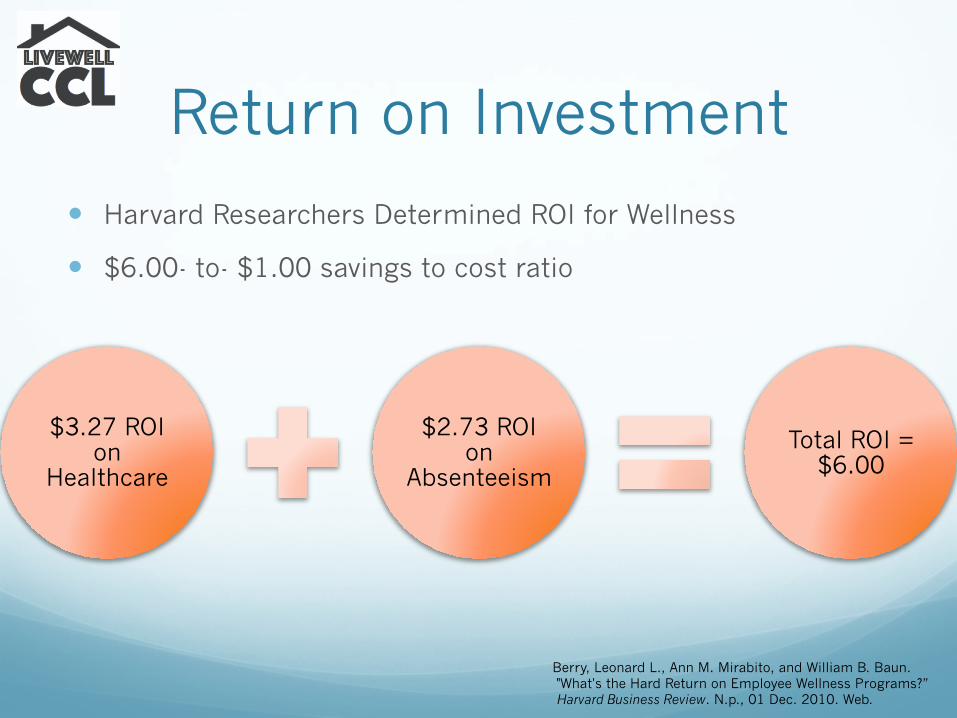
Return on Investment
$3.27 ROI on
Healthcare
$2.73 ROI on
Absenteeism
Total ROI = $6.00
� Harvard Researchers Determined ROI for Wellness
� $6.00- to- $1.00 savings to cost ratio
Berry, Leonard L., Ann M. Mirabito, and William B. Baun. "What's the Hard Return on Employee Wellness Programs?” Harvard Business Review. N.p., 01 Dec. 2010. Web.
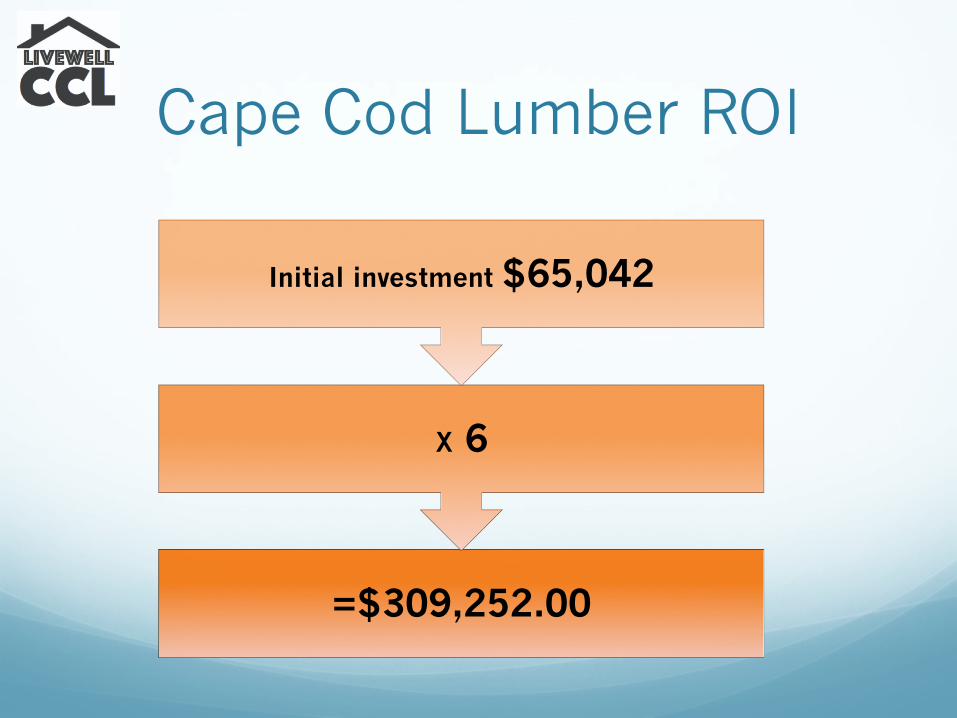
Cape Cod Lumber ROI
=$309,252.00
X 6
Initial investment $65,042
Beyond ROI Value of Investment
� Intangible assets that contribute heavily to an organization’s performance.
� Optum and National Business Group on Health found: � 91% of employers report
offering health & wellness programs for reasons beyond medical cost savings.
Karen Marlo, M.P.P., Seth Serxner, Ph.D., M.P.H. Beyond ROI: Building employee health & wellness value of investment. Optum Research, 2015.
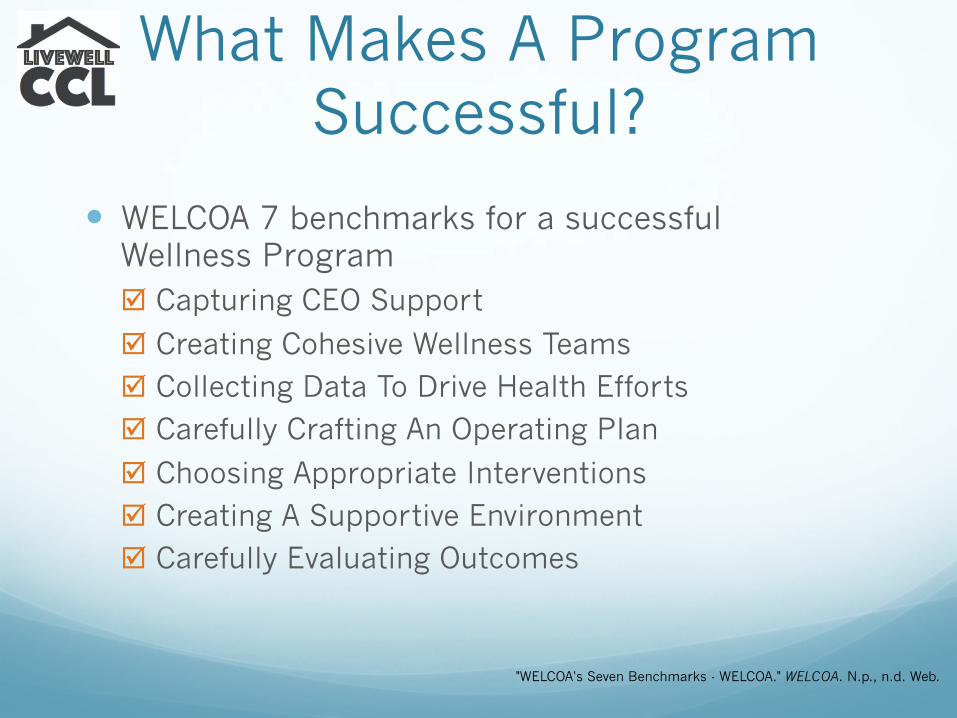
What Makes A Program Successful?
� WELCOA 7 benchmarks for a successful Wellness Program þ Capturing CEO Support
þ Creating Cohesive Wellness Teams þ Collecting Data To Drive Health Efforts þ Carefully Crafting An Operating Plan
þ Choosing Appropriate Interventions þ Creating A Supportive Environment þ Carefully Evaluating Outcomes
"WELCOA's Seven Benchmarks - WELCOA." WELCOA. N.p., n.d. Web.
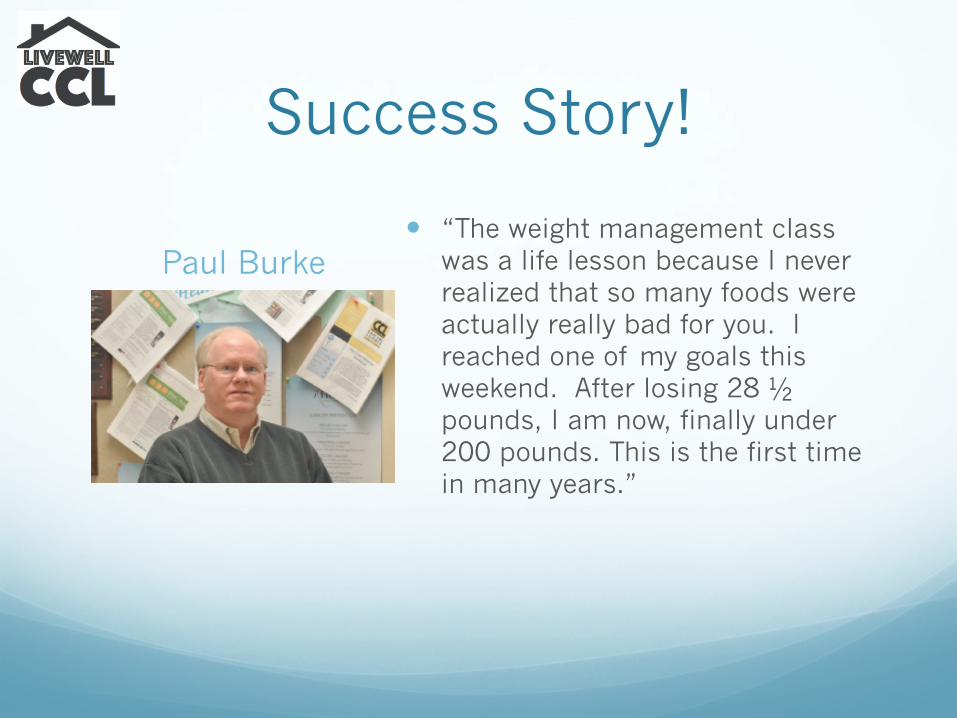
Success Story!
Paul Burke � “The weight management class
was a life lesson because I never realized that so many foods were actually really bad for you. I reached one of my goals this weekend. After losing 28 ½ pounds, I am now, finally under 200 pounds. This is the first time in many years.”

Thank you