Embed Size (px)
Citation preview

CBAL: Results From Piloting Innovative K–12 Assessments
Randy Elliot Bennett
June 2011
Research Report ETS RR–11-23
June 2011
CBAL: Results From Piloting Innovative K–12 Assessments
Randy Elliot Bennett
ETS, Princeton, New Jersey
Technical Review Editor: James Carlson
Technical Reviewers: Rebecca Zwick and Rick Morgan
Copyright © 2011 by Educational Testing Service. All rights reserved.
ETS, the ETS logo, and LISTENING. LEARNING. LEADING., are registered trademarks of Educational Testing Service (ETS).
C-RATER is a trademark of ETS.
As part of its nonprofit mission, ETS conducts and disseminates the results of research to advance
quality and equity in education and assessment for the benefit of ETS’s constituents and the field.
To obtain a PDF or a print copy of a report, please visit:
http://www.ets.org/research/contact.html

i
Abstract
CBAL, an acronym for Cognitively Based Assessment of, for, and as Learning, is a research
initiative intended to create a model for an innovative K–12 assessment system that provides
summative information for policy makers, as well as formative information for classroom
instructional purposes. This paper summarizes empirical results from 16 CBAL summative
assessment pilots involving almost 10,000 online administrations conducted between 2007 and
2010. The results suggest that, on average, the CBAL initiative was successful in building
innovative assessments in reading, writing, and mathematics that worked as intended. However,
there was considerable variation in the functioning of test forms, especially in writing and math.
That variation might suggest that the knowledge needed to produce high-quality forms of these
innovative tests in a replicable and scalable manner is not yet at hand. Further, although the
results described offer a significant start, many critical questions must be answered before CBAL
assessments (or ones like them) are ready for high-stakes operational use.
Key words: computer-based assessment, performance assessment, innovative testing approaches

ii
Acknowledgments
The work described in this paper was funded by ETS through the CBAL Initiative. Appreciation
is expressed to Jianbin Fu for his careful data and substantive reviews, Rebecca Zwick and Rick
Morgan for their comments on an earlier draft, Sam Chung and Max Wise for their help with
data analysis, Kim Fryer for editorial advice, and to the CBAL team for their invaluable
contributions to the Initiative’s work.

iii
Table of Contents
Page
Results From CBAL Reading ......................................................................................................... 3
Basic Psychometric Functioning ............................................................................................. 3
Internal Structure ..................................................................................................................... 7
External Relations .................................................................................................................... 9
Population-Group Performance and Differential Item Functioning (DIF) ............................ 10
Diagnostic Utility ................................................................................................................... 11
Automated Scoring ................................................................................................................ 14
Summary ................................................................................................................................ 17
Results From CBAL Writing ........................................................................................................ 18
Basic Psychometric Functioning ........................................................................................... 19
Internal Structure ................................................................................................................... 19
External Relations .................................................................................................................. 22
Population-Group Performance and Differential Item Functioning (DIF) ............................ 22
Automated Scoring ................................................................................................................ 25
Summary ................................................................................................................................ 25
Results From CBAL Math ............................................................................................................ 26
Basic Psychometric Functioning ........................................................................................... 26
Internal Structure ................................................................................................................... 29
External Relations .................................................................................................................. 29
Automated Scoring ................................................................................................................ 29
Summary ................................................................................................................................ 30
Conclusion .................................................................................................................................... 30
References ..................................................................................................................................... 34
Notes ............................................................................................................................................. 38

iv
List of Tables
Page
Table 1. Summary of Results From Reading Summative Assessment Pilot Administrations ..... 5
Table 2. Performance Within Each of Three Population Groups for Two CBAL Reading
Test Forms Administered as Part of the Multistate Study ........................................... 11
Table 3. Performance by Race/Ethnicity for Two CBAL Reading Test Forms
Administered as Part of the Multistate Study .............................................................. 12
Table 4. Summary of Results From Writing Summative Assessment Pilot Administrations ... 20
Table 5. Performance Within Each of Two Population Groups for Four CBAL Writing
Test Forms Administered as Part of the Multistate Study ........................................... 23
Table 6. Performance by Race/Ethnicity for Four CBAL Writing Test Forms Administered
as Part of the Multistate Study ..................................................................................... 24
Table 7. Summary of Results From Math Summative Assessment Pilot Administrations ....... 27
Table 8. Summary of Key Results Across Three CBAL Content Areas ................................... 32
v
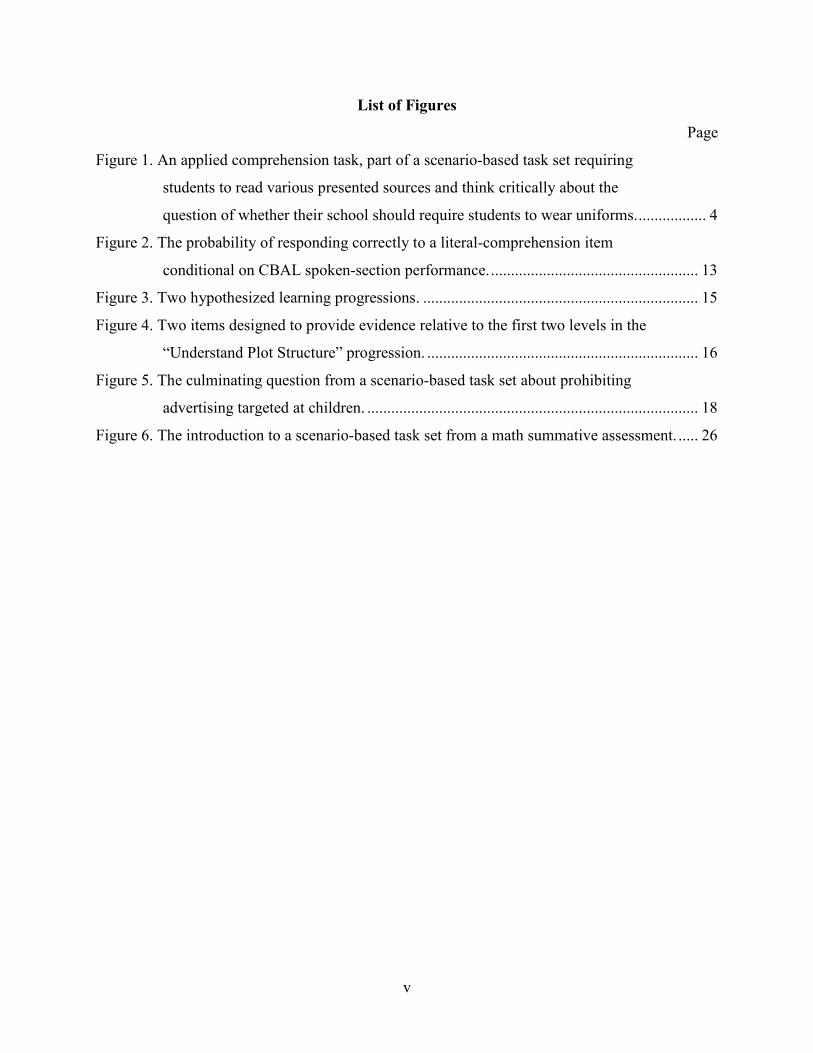
List of Figures
Page
Figure 1. An applied comprehension task, part of a scenario-based task set requiring
students to read various presented sources and think critically about the
question of whether their school should require students to wear uniforms. ................. 4
Figure 2. The probability of responding correctly to a literal-comprehension item
conditional on CBAL spoken-section performance. .................................................... 13
Figure 3. Two hypothesized learning progressions. ..................................................................... 15
Figure 4. Two items designed to provide evidence relative to the first two levels in the
“Understand Plot Structure” progression. .................................................................... 16
Figure 5. The culminating question from a scenario-based task set about prohibiting
advertising targeted at children. ................................................................................... 18
Figure 6. The introduction to a scenario-based task set from a math summative assessment. ..... 26
1
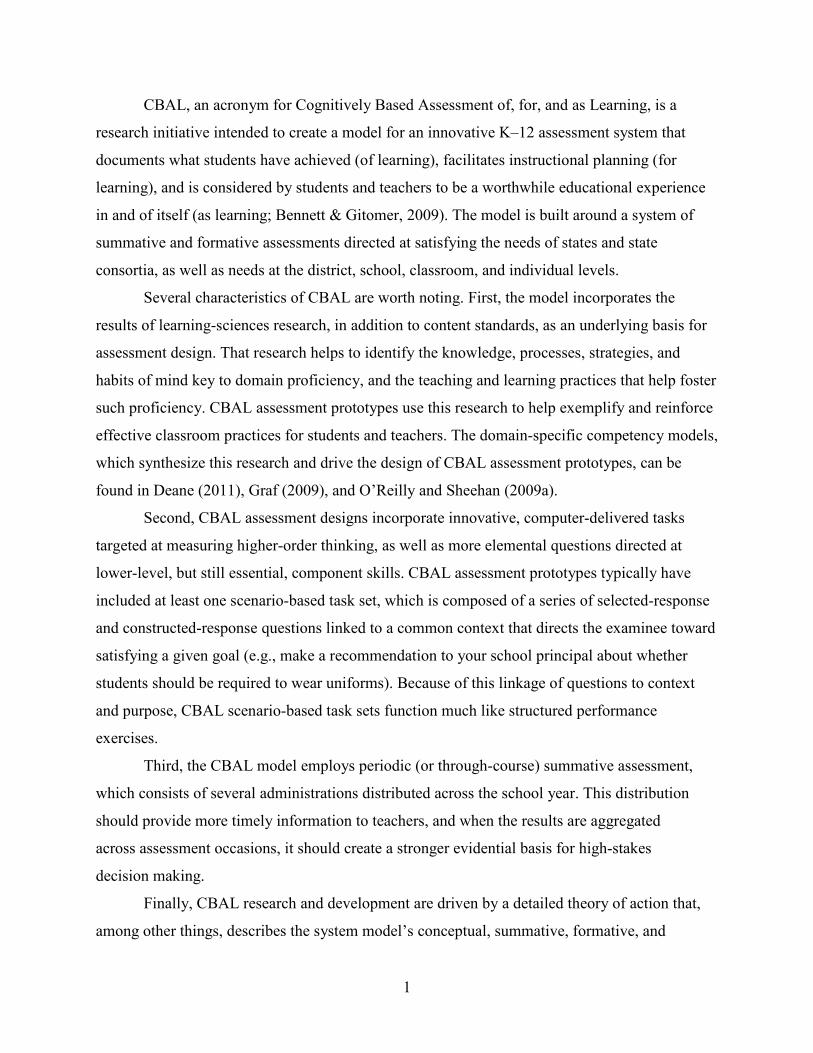
CBAL, an acronym for Cognitively Based Assessment of, for, and as Learning, is a
research initiative intended to create a model for an innovative K–12 assessment system that
documents what students have achieved (of learning), facilitates instructional planning (for
learning), and is considered by students and teachers to be a worthwhile educational experience
in and of itself (as learning; Bennett & Gitomer, 2009). The model is built around a system of
summative and formative assessments directed at satisfying the needs of states and state
consortia, as well as needs at the district, school, classroom, and individual levels.
Several characteristics of CBAL are worth noting. First, the model incorporates the
results of learning-sciences research, in addition to content standards, as an underlying basis for
assessment design. That research helps to identify the knowledge, processes, strategies, and
habits of mind key to domain proficiency, and the teaching and learning practices that help foster
such proficiency. CBAL assessment prototypes use this research to help exemplify and reinforce
effective classroom practices for students and teachers. The domain-specific competency models,
which synthesize this research and drive the design of CBAL assessment prototypes, can be
found in Deane (2011), Graf (2009), and O’Reilly and Sheehan (2009a).
Second, CBAL assessment designs incorporate innovative, computer-delivered tasks
targeted at measuring higher-order thinking, as well as more elemental questions directed at
lower-level, but still essential, component skills. CBAL assessment prototypes typically have
included at least one scenario-based task set, which is composed of a series of selected-response
and constructed-response questions linked to a common context that directs the examinee toward
satisfying a given goal (e.g., make a recommendation to your school principal about whether
students should be required to wear uniforms). Because of this linkage of questions to context
and purpose, CBAL scenario-based task sets function much like structured performance
exercises.
Third, the CBAL model employs periodic (or through-course) summative assessment,
which consists of several administrations distributed across the school year. This distribution
should provide more timely information to teachers, and when the results are aggregated
across assessment occasions, it should create a stronger evidential basis for high-stakes
decision making.
Finally, CBAL research and development are driven by a detailed theory of action that,
among other things, describes the system model’s conceptual, summative, formative, and

2
professional support components; the intended effects on individuals and institutions of
implementing CBAL assessments; and the action mechanisms hypothesized to lead to those
effects (Bennett, 2010).
As of December 2010, almost 10,000 CBAL summative assessments had been
administered online in the middle-school grades in more than a dozen states. Many of those
administrations were conducted in the Portland (ME) Public Schools, CBAL’s primary
development site. Portland is the largest urban district in Maine and represents a diverse mix of
students from different socio-economic strata, language groups, and ethnicities. Summative
pilots conducted in Portland were typically coordinated with the use of CBAL formative
materials covering related domain-relevant competencies and using formats similar to those
employed on the summative tests. All other pilots involved the CBAL summative assessments
only. In general, summative administrations were untimed but intended to fit within two class
periods. Test results were used for low-stakes purposes, including performance feedback to
teachers and, occasionally, student grading.
One purpose of the CBAL pilot administrations has been to try out various assessment
designs and tasks so that those ideas could be improved. Iterative refinement has, thus, been
central to the initiative’s work. A second, related purpose has been to gather the data needed to
address scientific questions. In keeping with these two purposes, analyses of pilot data have
focused on the technical characteristics of prototype CBAL assessments, including basic
psychometric functioning, internal structure, external relations, population-group performance
and differential item functioning (DIF), diagnostic utility, and the viability of automated scoring.
This paper summarizes empirical results from the CBAL summative assessment pilots,
many of which are described only in unpublished internal project reports. Even so, the results
may be of more general interest because they come from a research activity that incorporates
several of the key features proposed by the Race to the Top Assessment Program consortia (e.g.,
use of technology-based performance exercises, through-course assessment). Consequently,
CBAL results may provide an early indication of whether technically defensible assessments
built to incorporate those features can be created. In the following sections, we describe results
for reading, writing, and mathematics, respectively.

3
Results From CBAL Reading
CBAL reading summative prototypes have been constructed in keeping with the CBAL
reading competency model (O’Reilly & Sheehan, 2009a). That model has three major branches:
required skills, reading strategies, and text conventions. The required-skills branch, in turn,
encompasses three lower-level categories: prerequisite reading skills, model-building skills, and
applied-comprehension skills.
As of the end of 2010, five summative test forms had been created, enough to illustrate a
complete through-course design for a middle-school grade.1
Items that focus on model-building skills are routinely used in K–12 reading
accountability tests but applied skills are less often evaluated. Figure 1 gives an example of a
CBAL applied-comprehension task that calls upon critical reading skills to evaluate a piece of
persuasive writing (e.g., detecting the author’s purpose, position on the issue, potential bias,
logical flaws in his or her arguments, conflicts in those arguments). Such applied tasks play a key
role in CBAL reading assessments, typically as part of a scenario-based set.
The early test forms included both a
comprehension section and a spoken section. The two sections were intended to emphasize the
required-skills portion of the competency model, with the spoken section targeting prerequisite
reading skills (word recognition, decoding, oral fluency) and the comprehension section
(including the scenario-based task set) targeting model-building skills and applied-
comprehension skills. Subsequent CBAL summative test forms have contained only the
comprehension section, with the spoken section becoming an optional formative component.
Basic Psychometric Functioning
Table 1 summarizes the five reading summative pilots, including response data from over
2,900 online test administrations, mostly to seventh grade students but also to some in the eighth
grade. Except for one case noted in the table, all results relate to the comprehension section.
The forms listed in Table 1 fall into two groups: those administered to small samples (n <
250) in a single school district (Portland, ME) and those administered to relatively large samples
(n > 1,000) as part of a multistate study. Across all pilot administrations, the forms ran from 23
to 38 comprehension items, with the longer, multistate forms reflecting the addition of a section
containing discrete questions and minipassage sets that were not scenario based. Aside from that
difference, there is relatively little variability in the functioning of forms across pilot
administrations, with the four small-sample/single-district pilots producing results similar to

4
Figure 1. An applied comprehension task, part of a scenario-based task set requiring
students to read various presented sources and think critically about the question of
whether their school should require students to wear uniforms.
those of the two large-sample/multidistrict administrations. In general, the difficulty of the
forms appeared appropriate to the students tested, with the median item difficulties falling in
midrange (median of the medians across forms = .51, range of medians = .45 to .58). The
forms generally appeared to have reasonable missing-response rates (median of the medians
across forms = 0%, range of medians = 0% to 2%) and internal consistency reliabilities
(median = .88, range = .83 to .91).2
Internal consistency estimates take into account variation in the sample of items
contained in a test. Also relevant is variation in examinee performance from one occasion to the
next. Such variation, in combination with that for the sampling of items, can be captured in the
correlation between parallel forms administered to the same students close together in time.

5
Table 1
Summary of Results From Reading Summative Assessment Pilot Administrations
Pilot date, report, & scenario-based task set(s)
Grade N # of items
Median p+
Median & range of % missinga
Coeff. alpha
Internal structure
1. Fall 2007 (Liang & Rijmen, 2008a) A Keen Observer, Teen Girls
7th & 8th Portland
(ME)
216 23 .57 2% (0–18%)
.86 CFA, EFA: 1 factor (separable literal comprehension, vocabulary, inference and discourse-structure, and applied-comprehension factors not supported)
2. Spring 2008 (Liang & Rijmen, 2008b) School Uniforms
7th & 8th
Portland (ME)
190 29 .55 1% (0–4%)
.89 CFA: 1 factor (separable model-building, weak applied- and applied-skills factors not supported); r of general factor with spoken-section extension = .50c
3. Fall 2008
(ETS, 2009a; Steinberg, 2009a) Seasons
7th
Portland (ME)
146 33 .47 0% (0–22%)
.83 CFA: 1 factor (separable test-section factors not supported)
4. Spring 2009 (ETS, 2009a) Wind Power
7th Portland
(ME)
59 27 .58 0% (0–3%)
NR NA
5a. Fall 2009 (Fu, Wise, & Chung, 2011a; Yoo, Fu, Wise, & Chung, 2011) Seasonsb
7th multi-state
1,229 38 .45 0% (0–2%)
.88 CFA, EFA: 1 factor (not supported were separable scenario-based vs. discrete factors; selected-response vs. constructed-response factors; literary vs. vocabulary factors; or subscore factors).
Nonparametric methods: 2 task-clusters detected.d
6
Pilot date, report, & scenario-based task set(s)
Grade N # of items
Median p+
Median & range of % missinga
Coeff. alpha
Internal structure
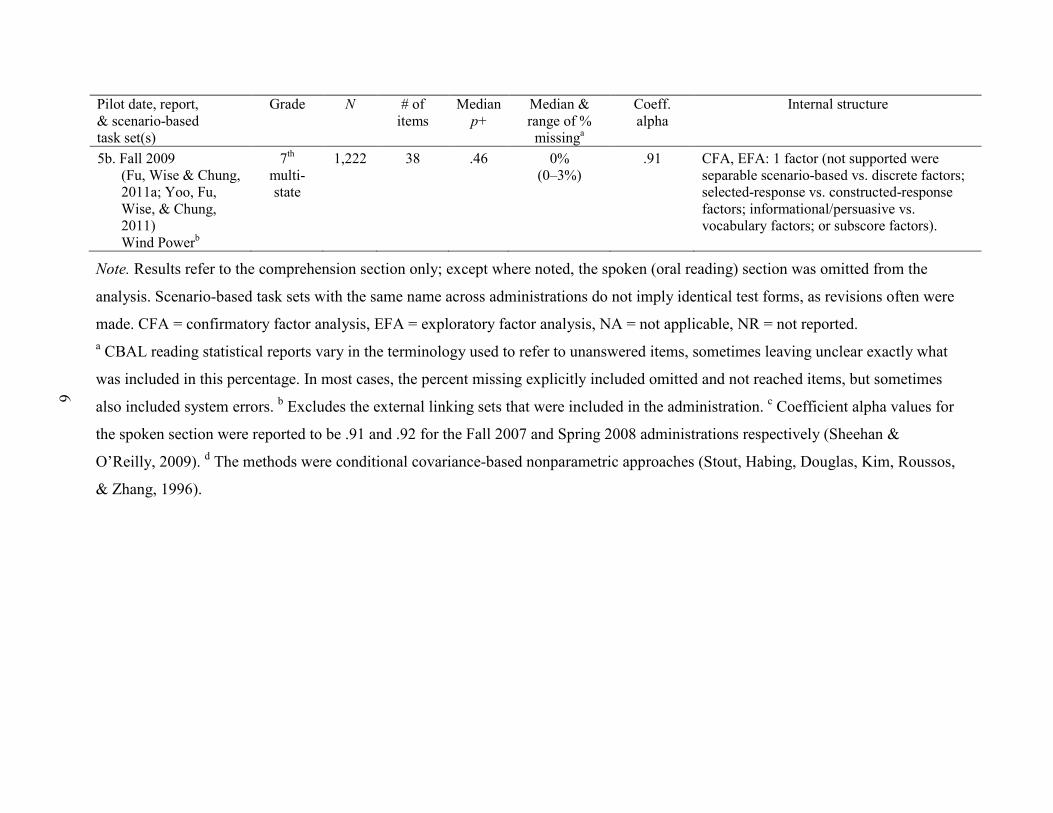
5b. Fall 2009 (Fu, Wise & Chung, 2011a; Yoo, Fu, Wise, & Chung, 2011) Wind Powerb
7th multi-state
1,222 38 .46 0% (0–3%)
.91 CFA, EFA: 1 factor (not supported were separable scenario-based vs. discrete factors; selected-response vs. constructed-response factors; informational/persuasive vs. vocabulary factors; or subscore factors).
Note. Results refer to the comprehension section only; except where noted, the spoken (oral reading) section was omitted from the
analysis. Scenario-based task sets with the same name across administrations do not imply identical test forms, as revisions often were
made. CFA = confirmatory factor analysis, EFA = exploratory factor analysis, NA = not applicable, NR = not reported. a CBAL reading statistical reports vary in the terminology used to refer to unanswered items, sometimes leaving unclear exactly what
was included in this percentage. In most cases, the percent missing explicitly included omitted and not reached items, but sometimes
also included system errors. b Excludes the external linking sets that were included in the administration. c Coefficient alpha values for
the spoken section were reported to be .91 and .92 for the Fall 2007 and Spring 2008 administrations respectively (Sheehan &
O’Reilly, 2009). d The methods were conditional covariance-based nonparametric approaches (Stout, Habing, Douglas, Kim, Roussos,
& Zhang, 1996).

7
That correlation should provide something nearer to a lower-bound reliability estimate. Both
Sheehan and O’Reilly (2009) and Yoo et al. (2011) presented analyses that included the
correlation between two nonparallel CBAL reading test forms, which might be expected to
underestimate the lower bound. In the case of the former investigation, the two tests were given
to students in a single district over a period of several months; for the latter study, the dual
administration was conducted in multiple states within one month for the overwhelming majority
of students. The correlation between the two forms, one primarily targeting the comprehension
of literary text and the other primarily informational/persuasive text, was .76 (in the small
sample) across the longer time period (where median coefficient alpha was equal to .88) and .79
(in the multistate sample) across the shorter period (where median coefficient alpha = .90).
Internal Structure
Table 1 also briefly recounts results from confirmatory factor analysis (CFA), exploratory
factor analysis (EFA), and conditional covariance-based nonparametric dimensionality
approaches (Stout et al., 1996). These results most often supported a single factor among the
comprehension items, not only within a test form but also across two forms putatively measuring
different skills given to the same students close together in time (Yoo et al., 2011). This latter
finding suggests a convenient basis for aggregating scores across forms (subject to replication
with forms spaced over longer time periods). Also of note with respect to the dimensionality
results is that, in the one (small-sample) case in which the spoken section was included, the
general factor extracted from the comprehension section was only moderately correlated with
scores on the spoken section, suggesting that those two sections, at least, were measuring
separable skills.
Although dimensionality results suggest that the comprehension test forms might
measure a single dimension, Sheehan and O’Reilly (2009) presented results that lend partial
support to the distinction between model-building and applied-comprehension skills depicted in
the CBAL reading competency model. The distinction supported is not of qualitatively different
skills but, rather, of differences in difficulty between items written to target the two hypothesized
skill types. To the extent that these skills are learned together or caused by a third skill, they will
not be separable in well-conducted factor analyses (which purposely control for difficulty
differences). Such difficulty differences may still have import if they result in regions of the
8
score scale taking on theoretically different meanings because each region is predictably
associated with a coherent set of items targeting the same skill.
For CBAL reading assessment-design purposes, model-building skills were defined as
“the ability to develop an accurate mental representation of the information presented in a single
text,” and applied comprehension skill as “the ability to use such representations, when
necessary, to solve applied problems such as reconciling information from different texts”
(Sheehan & O’Reilly, 2009, p. 28). Items written to measure applied-comprehension skills were,
therefore, hypothesized to be more difficult than those written to target model-building skills.
For the Fall 2007 test form, seven items were classified as model building and 23 as applied
comprehension; for the Spring 2008 form, the numbers were 16 and 13, respectively. For both
forms, the differences in mean percentage correct for each item category were calculated
separately in the grade 7 and grade 8 student samples. For each test form in each grade, the
model-building items were easier on average than the applied-comprehension items, with the
average differences ranging from 18 to 28 percentage points.
Sheehan and O’Reilly (2009) also evaluated the meaningfulness of the model-
building/applied-comprehension distinction through an examination of individual response
patterns. In this analysis, they classified each examinee as low or high on each of the two skills
based on a median split. Of particular interest were the proportions of students who were high on
model building but low on applied comprehension (a predicted ordering) versus the opposing,
theoretically inconsistent pattern. (Including students who are either low on both skills or high on
both skills does not constitute a strong test of the model.) The predicted pattern was shown by
36% of students on one test form and by 41% of students on the other form, versus 0% for the
inconsistent pattern. All other cases were either low or high on both skills.
Finally, Foo et al. (2011a) examined this skill distinction using the two test forms
administered as part of the multistate study. In their analysis, model-building items were divided
into two levels differentiated by the extent of activation between the text and comprehension
question, with higher-activation items posited to be easier than lower-activation items. On one
test form targeting the comprehension of literary text interpretation, 9 items were classified as
model-building/high-activation, 14 as model-building/low-activation, and 9 as applied-
comprehension, whereas for the other form focusing on information/persuasive text, the
classifications were 8, 10, and 14 items, respectively. On the informational/persuasive form, the

9
average item difficulties followed the predicted ordering (i.e., model-building/high-activation
being easier than model-building/low-activation being easier than applied-comprehension). On
the literary text form, the two model-building types functioned as predicted relative to one
another, but the applied-comprehension items proved to be easier, on average, than the model-
building/low-activation items, a reversal that might signal the need to revisit the underlying
theory as it relates to literary text, its instantiation in CBAL literary reading items, or both.
External Relations
In addition to analyses of internal structure, several analyses have been conducted of the
external relations of CBAL reading test scores to performance on other measures. A very gross
analysis comes from the Fall 2008 pilot administration (ETS, 2009a). In this administration,
scores from the Maine Educational Assessment (MEA) and from the Northwest Evaluation
Association’s Measures of Academic Progress (MAP) were collected, along with CBAL reading
comprehension scores. In this student sample (n~140), CBAL reading scores were correlated
more highly with MEA reading and with MAP reading scores (median r = .73) than with MEA
and MAP math scores (median r = .61).
Generally similar results were obtained with the data from the multistate study, in which
each of two CBAL reading forms were correlated with state tests in reading, English language
arts (ELA), and math (Yoo et al., 2011). For one CBAL form, the median correlation was .71
with four different state reading tests, .65 with five state ELA tests, and .59 with six state math
tests. For the other form, the median correlations (with the same numbers of tests) were .75 for
reading, .62 for ELA, and .66 for math.
A more refined external analysis comes from the Fall 2007 and Spring 2008
administrations listed in Table 1. Using combined seventh and eighth grade samples, Sheehan
and O’Reilly (2009, in press) and O’Reilly & Sheehan (2009b) examined the relations of the
CBAL comprehension and spoken sections to an external measure of comprehension, the Gates-
MacGinitie Reading Tests (4th Edition, Form S) (MacGinitie, MacGinitie, Maria, & Dreyer,
2000), and to a test of oral reading, the TOWRE (Torgesen, Wagner, & Rashotte, 1999). These
investigators report that the correlational pattern among the measures was as predicted: The total
CBAL comprehension score correlated significantly higher statistically with the Gates
comprehension section (r =.79 for Fall) than with the TOWRE spoken measure (r =.46 for Fall
and r =.58 for Spring). (TOWRE was given at both times but the Gates was only given in the
10
Fall.) Similarly, the CBAL spoken measure correlated significantly higher statistically with
TOWRE scores (r =.78 for Fall and r =.76 for Spring) than with the Gates comprehension scores
(r =.63).
Finally, O’Reilly and Sheehan evaluated the relationship of CBAL performance to school
grade. They reported that eighth graders taking the CBAL assessments scored higher than
seventh-grade students on both the comprehension and spoken measures, roughly by a half
standard deviation.
Population-Group Performance and Differential Item Functioning (DIF)
The performance of population groups on CBAL reading forms was investigated by Fu et
al. (2011a) using data from the multistate study, the only pilot administration with sample sizes
sufficient for meaningful analysis. For each of two forms, score means were compared within
groups categorized by gender, race/ethnicity, socio-economic status (SES), and English language
learner (ELL) status.3
The evaluation of population-group differences can be inappropriately influenced by
individual items that do not measure the same construct across groups, thereby contributing to
inaccurate depictions of one or another group’s performance. DIF methodology offers a tool for
screening such items. Fu et al. (2011a) examined DIF for the two Fall 2009 forms in Table 2
through application of the Mantel-Haenszel procedure (Holland & Thayer, 1988). They
investigated DIF for gender (male vs. female), race/ethnicity (White vs. Black; White vs.
combination of Native American, Asian American/Pacific Islander, and Hispanic), and socio-
economic status (low vs. not low).
Table 2 gives the results for all groups except race/ethnicity, which are
displayed in Table 3. As should be clear, the tables unfortunately show the same general pattern
of statistically significant group differences for SES, ELL status, and race/ethnicity commonly
found on such nationally representative reading assessments as the National Assessment of
Educational Progress (NAEP; NCES, 2007, p. 29, 31, 67). No other differences were statistically
significant.
4 Results were classified into three commonly used categories,
A through C, with C indicating a level of DIF requiring expert review for possible bias. Only 1
of the 76 items examined was found to exhibit C-category DIF. This selected-response item,
which was differentially difficult for female examinees, asked a mechanical comprehension
question related to a passage describing the workings of a windmill.

11
Table 2
Performance Within Each of Three Population Groups for Two CBAL Reading Test Forms
Administered as Part of the Multistate Study
Subgroup Category N Raw score Mean SD t p
Fall 2009 Seasons test form
Gender Male 542 22.5 9.8 -1.63 .10 Female 580 23.4 9.5
Low SES status No 344 25.5 10.5 7.20 .00 Yes 468 20.5 8.7
ELL status No 857 23.9 9.6 3.93 .00 Yes 35 17.5 8.5 Fall 2009 Wind Power test form
Gender Male 544 21.6 10.8 0.22 .83 Female 553 21.5 10.2
Low SES status No 335 24.9 10.9 8.98 .00 Yes 459 18.3 9.4
ELL status No 845 22.7 10.4 5.46 .00 Yes 35 15.2 7.9
Note. Student classifications were provided by school staff. ELL = English language learner,
SES = socio-economic status. Data from Statistical Report of Fall 2009 CBAL Reading Tests,
unpublished manuscript by J. Fu, M. D. Wise, & S. Chung, 2011, Princeton, NJ: Educational
Testing Service. Copyright 2011 by Educational Testing Service.
Diagnostic Utility
Sheehan and O’Reilly (2009, in press) explored the potential diagnostic value of the
CBAL summative measures, evaluating the use of differences in comprehension versus spoken
performance, and of learning progressions. In the first case, these investigators examined the
joint use of the spoken measure with the literal-comprehension items (i.e., the least cognitively
demanding questions) from the comprehension section. These measures identified two groups of
students, each of which might require different instructional treatment.
12
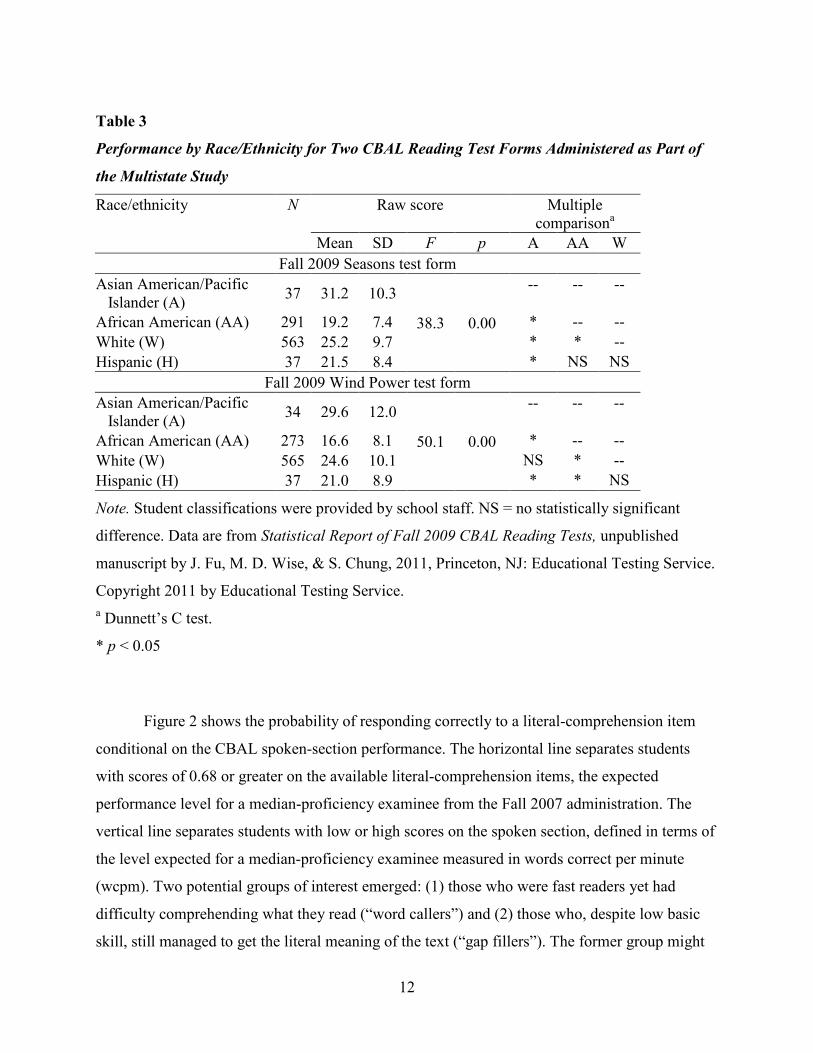
Table 3
Performance by Race/Ethnicity for Two CBAL Reading Test Forms Administered as Part of
the Multistate Study
Race/ethnicity N Raw score Multiple comparisona
Mean SD F p A AA W Fall 2009 Seasons test form
Asian American/Pacific Islander (A) 37 31.2 10.3
38.3 0.00
-- -- --
African American (AA) 291 19.2 7.4 * -- -- White (W) 563 25.2 9.7 * * -- Hispanic (H) 37 21.5 8.4 * NS NS
Fall 2009 Wind Power test form Asian American/Pacific Islander (A) 34 29.6 12.0
50.1 0.00
-- -- --
African American (AA) 273 16.6 8.1 * -- -- White (W) 565 24.6 10.1 NS * -- Hispanic (H) 37 21.0 8.9 * * NS
Note. Student classifications were provided by school staff. NS = no statistically significant
difference. Data are from Statistical Report of Fall 2009 CBAL Reading Tests, unpublished
manuscript by J. Fu, M. D. Wise, & S. Chung, 2011, Princeton, NJ: Educational Testing Service.
Copyright 2011 by Educational Testing Service. a Dunnett’s C test.
* p < 0.05
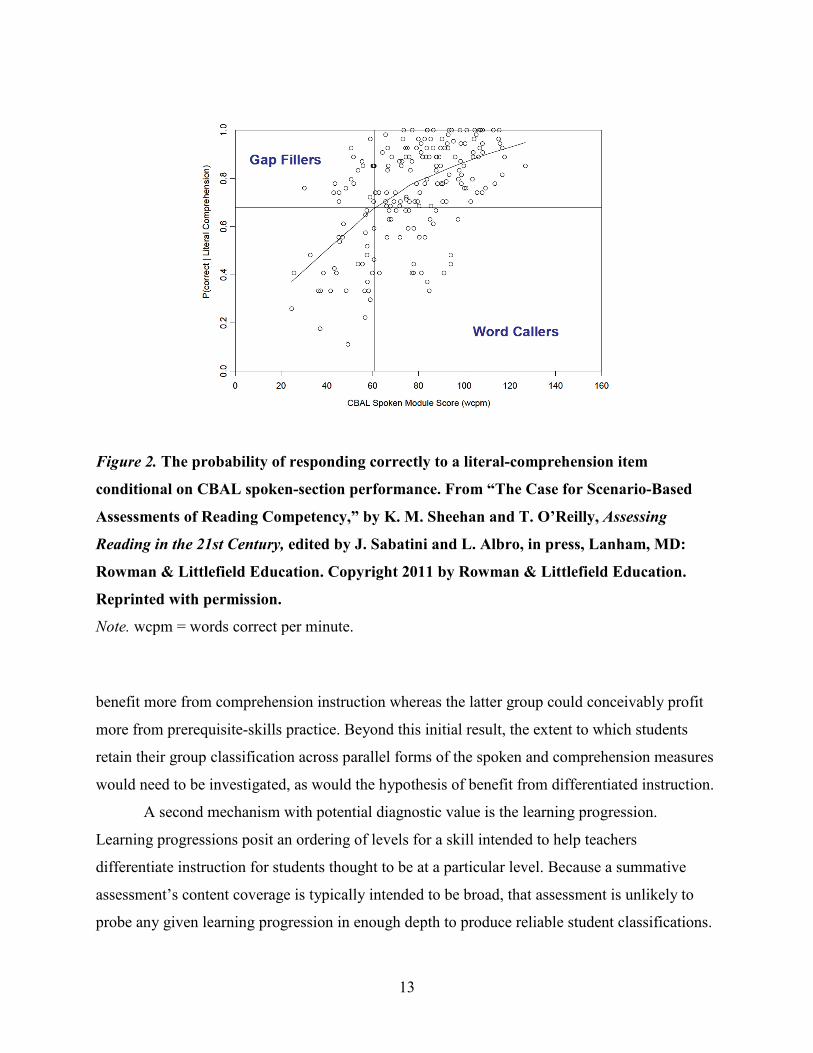
Figure 2 shows the probability of responding correctly to a literal-comprehension item
conditional on the CBAL spoken-section performance. The horizontal line separates students
with scores of 0.68 or greater on the available literal-comprehension items, the expected
performance level for a median-proficiency examinee from the Fall 2007 administration. The
vertical line separates students with low or high scores on the spoken section, defined in terms of
the level expected for a median-proficiency examinee measured in words correct per minute
(wcpm). Two potential groups of interest emerged: (1) those who were fast readers yet had
difficulty comprehending what they read (“word callers”) and (2) those who, despite low basic
skill, still managed to get the literal meaning of the text (“gap fillers”). The former group might
13
Figure 2. The probability of responding correctly to a literal-comprehension item
conditional on CBAL spoken-section performance. From “The Case for Scenario-Based
Assessments of Reading Competency,” by K. M. Sheehan and T. O’Reilly, Assessing
Reading in the 21st Century, edited by J. Sabatini and L. Albro, in press, Lanham, MD:
Rowman & Littlefield Education. Copyright 2011 by Rowman & Littlefield Education.
Reprinted with permission.
Note. wcpm = words correct per minute.
benefit more from comprehension instruction whereas the latter group could conceivably profit
more from prerequisite-skills practice. Beyond this initial result, the extent to which students
retain their group classification across parallel forms of the spoken and comprehension measures
would need to be investigated, as would the hypothesis of benefit from differentiated instruction.
A second mechanism with potential diagnostic value is the learning progression.
Learning progressions posit an ordering of levels for a skill intended to help teachers
differentiate instruction for students thought to be at a particular level. Because a summative
assessment’s content coverage is typically intended to be broad, that assessment is unlikely to
probe any given learning progression in enough depth to produce reliable student classifications.

14
CBAL summative assessments have consequently included only a few items linked to such
progressions. Along with evaluating overall performance, the intention is that the summative
assessment provide one or more formative hypotheses about student standing in a learning
progression, which teachers should confirm or refute through follow-up classroom assessment
(Bennett, 2011).
Figure 3 depicts two progressions, Understand Text Structure and Understand Plot
Structure, which were built into the assessment designs for the Fall 2007 and Spring 2008 pilot
administrations. Figure 4 shows two items intended to measure the first two levels in the
Understand Plot Structure progression. For students classified into the first level of that
progression by both the test and follow-up classroom assessment, the teacher might focus
instruction on the basic idea of plot. For students found to be in the second level, the teacher
might give instruction in distinguishing such essential plot elements as climax and resolution.
Sheehan and O’Reilly (2009) examined the extent to which students’ observed item-
response patterns were in keeping with the prerequisite relationships specified in the two
hypothesized learning progressions described above. They found that considerably more students
produced response patterns that could be viewed as consistent with the two assessed levels of the
progression than produced inconsistent patterns. For the Understand Text Structure progression,
30% of students produced the hypothesized right-wrong pattern and only 6% gave a wrong-right
pattern. For the Understand Plot Structure progression, the comparable values were 23% and 4%.
(The remaining students in both instances either got both items right or both items wrong, which
contributes no information theoretically to the evaluation of the progressions.) Since only two
items were used to measure each progression, and because the student samples were small, these
results require replication with more progressions, items, and examinees.
Automated Scoring
As mentioned, the CBAL comprehension section includes both selected-response and
constructed-response questions. Most of the latter are machine scored using c-rater™ (Sukkarieh
& Bolge, 2010). Results from the scoring of one set of seven reading comprehension items that
entailed short text responses were reported by Sukkarieh and Blackmore (2009). Responses
provided by seventh and eighth graders were scored independently by two human judges and by

15
Figure 3. Two hypothesized learning progressions. From “The Case for Scenario-Based
Assessments of Reading Competency,” by K. M. Sheehan and T. O’Reilly, Assessing
Reading in the 21st Century, edited by J. Sabatini and L. Albro, in press, Lanham, MD:
Rowman & Littlefield Education. Copyright 2011 by Rowman & Littlefield Education.
Reprinted with permission.
c-rater. A blind data set consisting of from 61 to 114 answers, depending upon the item, was
used to evaluate the accuracy of the c-rater scoring. Accuracy was assessed by comparing the
unweighted kappa statistic between the two human judges to that between c-rater and the average
of the judges. For six of the seven items, the two human judges agreed more closely with one
another than c-rater agreed with the two judges. Over all seven items, the median difference in
kappa values was .07 points higher for the human judges (range of differences = - .02 to .32, with
negative differences favoring c-rater–judge agreement).

16
Figure 4. Two items designed to provide evidence relative to the first two levels in the
“Understand Plot Structure” progression. From The CBAL Reading Assessment: An
Approach for Balancing Measurement and Learning Goals by K. Sheehan and T. O’Reilly,
2009, paper presented at the National Conference on Student Assessment, Los Angeles, CA.
Copyright 2009 by Educational Testing Service. Reprinted with permission.
17
In a second study, Sukkarieh (2010) evaluated several variations in c-rater’s scoring
methodology vis-à-vis human raters. This study employed eight reading comprehension items
(three of which overlapped with the study above) and a blind set of between 51 and 114 student
responses. For the best of three automated variations, results showed c-rater’s agreement with the
average of two human scores to be lower than the agreement between human raters in six of
the eight cases. Over all eight items, the median difference in kappa values was .04 points
higher for the human judges as compared with the c-rater-judge agreement (range of
differences = - .06 to .24).
Considering the results from both studies, the relatively small size of the median
differences suggests considerable promise for c-rater scoring for the types of constructed-
response reading questions studied. At the same time, the wide ranges in scoring discrepancy
attest to the fact that c-rater is not currently suitable for scoring a significant segment of items.
Summary
The five CBAL summative reading pilots have produced several notable results. With
respect to basic psychometric functioning, test forms have consistently shown reasonable internal
consistency reliabilities, appropriate difficulty levels, low missing-response rates, and reasonable
cross-form correlations. Although dimensionality analyses most often suggest a single factor,
items built to measure two key aspects of the reading competency model appeared to
differentiate themselves in expected ways based on difficulty and on examinee response patterns.
In terms of external relations, the CBAL reading forms appeared to be more highly correlated
with several other measures of reading than with measures of math. In addition, the CBAL
comprehension section was correlated more highly with another measure of comprehension than
it was with a measure of oral reading; similarly, the CBAL spoken section had the expected,
opposite pattern. Investigations of population-group performance showed differences very
similar to those found on national reading assessments. Those differences appeared to be
unrelated to DIF, which was largely absent from the reading forms studied.
Analyses of diagnostic utility suggested the potential for using CBAL summative tests to
provide initial formative information for classroom follow-up. Along these lines, evidence
suggested that the comprehension and spoken sections might be able to jointly identify student
groups with distinct skill patterns and that items written to learning progressions might be used
to place students tentatively into instructional levels. Finally, research on the machine scoring of

18
student answers to constructed-response questions showed that, although human judges generally
agreed more highly with themselves than with an automated system, the automated system’s
scores were, on average, not dramatically different from judges’ ratings.
Results From CBAL Writing
CBAL writing summative prototypes have been developed to align with the CBAL
writing competency model. In 2011, that model was subsumed by an English language arts
competency model, which crosses three modes of thought with five modes of cognitive
representation (Deane, 2011). The modes of thought are interpretation, deliberation, and
expression (which are closely related to reading, critical thinking, and writing, respectively). The
modes of representation are social, conceptual, discourse, verbal, and print. Through 2010, 14
test forms had been developed in association with earlier versions of this model.5 Figure 5 gives
an example of a culminating question from a scenario-based task set that requires students to
read multiple given sources and compose a persuasive essay arguing their chosen position on
whether advertizing targeted at children should be banned.
Figure 5. The culminating question from a scenario-based task set about prohibiting
advertising targeted at children.

19
Basic Psychometric Functioning
Table 4 summarizes five writing summative pilots conducted between 2007 and 2009.6
As for reading, the forms administered fall into two groups: five given to small samples in
Portland and four given to relatively large samples as part of a multistate study. Unlike reading,
however, there was considerably more variability across forms, possibly a result of more
substantial changes in form design over time. In terms of composition, the forms extended from 10
to 32 questions. Item difficulty varied from a median p+ of .35 to .62 (median of the medians
across forms = .57). Median missing-response rates went from 0% to 7% (median of the medians
across forms = 1%), though for some forms the range of missing responses was quite wide,
suggestive of potential difficulty, speededness, or motivational problems. Internal consistency
reliability ran from .76 to .94 (median = .82), but the upper value in the range probably should be
considered in conjunction with the very small sample size of that administration.
These pilots included data from over 4,800 online administrations carried out with eighth grade
students. In contrast to the CBAL reading summative assessments, the writing test design
entailed only a single scenario-based task set with no section of discrete questions.
7
Also relevant to the reliability of CBAL forms are results from Fu et al. (2011c) who
reported the correlations among all pairs of four (nonparallel) test forms given to the same
students over a short period. (The four forms were targeted at argumentation and summarization,
informational writing, literary analysis, and persuasive appeal, respectively.) The correlations
between the six pairs ran from .66 to .76, with the median at .73 (as compared to the internal
consistency median of .77 for the same four forms). Because of content differences among the
forms, this result may underestimate the lower bound for their reliability.
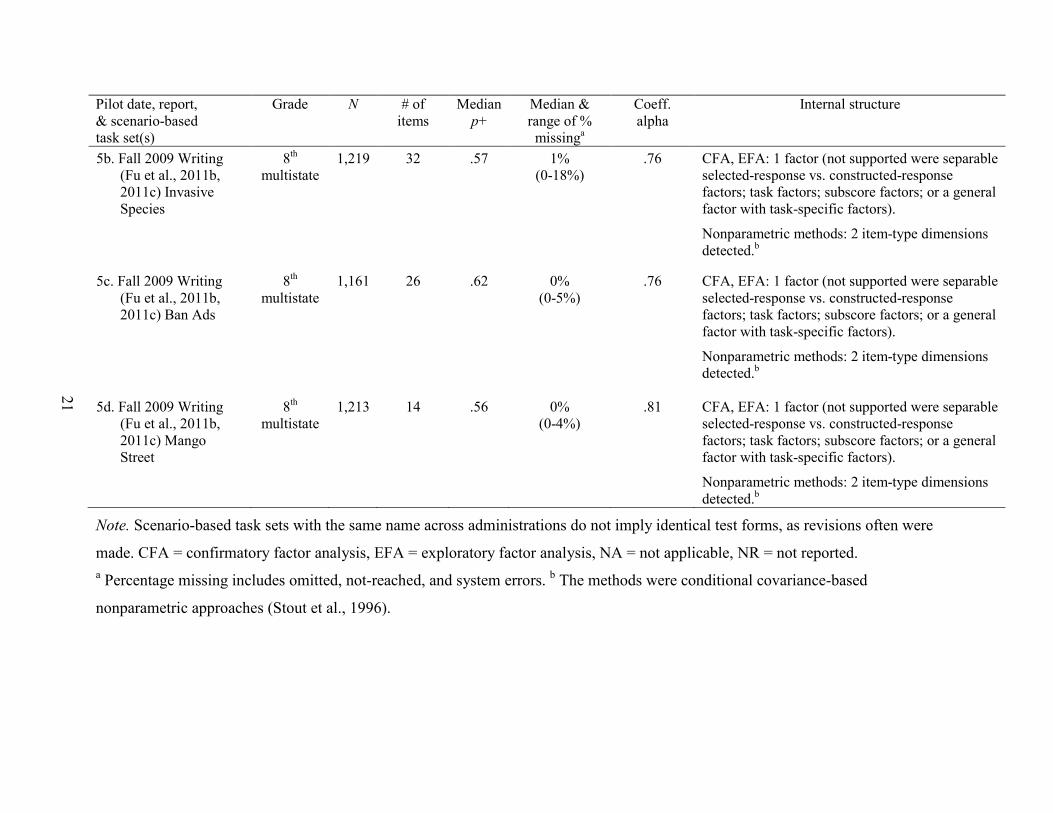
Internal Structure
Table 4 also briefly recounts dimensionality analysis results within a test form. In the
small-sample pilots, a single dimension was supported for each of the test forms administered.
Results from the large-sample pilots also recovered a single dimension (although two-dimensional
structures emerged when less conventionally used, conditional covariance-based nonparametric
methods were applied). Further, Fu et al. (2011b) found exploratory and confirmatory factory
analytic results for each of the six multistate form pairs to suggest that a single cross-pair
dimension might be tenable, even though each form was constructed to target a different writing

20
Table 4
Summary of Results From Writing Summative Assessment Pilot Administrations
Pilot date, report, & scenario-based task set(s)
Grade N # of items
Median p+
Median & range of % missinga
Coeff. alpha
Internal structure
1a. Fall 2007 (Rijmen, 2008a) Ban Ads
8th Portland
(ME)
45 10 NR NR .86 NA. Correlations among 3 subscores and with total score suggest 1 factor.
1b. Fall 2007 (Rijmen, 2008a) Service Learning
8th Portland
(ME)
46 12 NR NR .94 NA. Correlations among 3 subscores and with total score suggest 1 factor.
2. Spring 2008 (Rijmen, 2008b) Teen Agers and Sleep
8th Portland
(ME)
133 11 NR NR .82 NA. Correlations among 3 subscores and with total score suggest 1 factor.
3. Fall, 2008 (ETS, 2009b; Steinberg, 2009b) Name NR
8th Portland
(ME)
268 12 .51 7% (0-17%)
.85 CFA: 1 factor (not supported were separable subscore factors)
4. Spring, 2009 (ETS, 2009b) Ban Ads
8th Portland
(ME)
130 24 .57 1% (0-5%)
.86 CFA, EFA: 1 factor (not supported were separable subscore factors or skill factors)
5a. Fall 2009 Writing (Fu, Wise, & Chung, 2011b, 2011c) Service Learning
8th multistate
1,195 25 .35 1% (0-5%)
.78 CFA, EFA: 1 factor (not supported were separable selected-response vs. constructed-response factors; task factors; subscore factors; or a general factor with task-specific factors).
Nonparametric methods: 2 item-type dimensions detected.b
21
Pilot date, report, & scenario-based task set(s)
Grade N # of items
Median p+
Median & range of % missinga
Coeff. alpha
Internal structure
5b. Fall 2009 Writing (Fu et al., 2011b, 2011c) Invasive Species
8th multistate
1,219 32 .57 1% (0-18%)
.76 CFA, EFA: 1 factor (not supported were separable selected-response vs. constructed-response factors; task factors; subscore factors; or a general factor with task-specific factors).
Nonparametric methods: 2 item-type dimensions detected.b
5c. Fall 2009 Writing (Fu et al., 2011b, 2011c) Ban Ads
8th multistate
1,161 26 .62 0% (0-5%)
.76 CFA, EFA: 1 factor (not supported were separable selected-response vs. constructed-response factors; task factors; subscore factors; or a general factor with task-specific factors).
Nonparametric methods: 2 item-type dimensions detected.b
5d. Fall 2009 Writing (Fu et al., 2011b, 2011c) Mango Street
8th multistate
1,213 14 .56 0% (0-4%)
.81 CFA, EFA: 1 factor (not supported were separable selected-response vs. constructed-response factors; task factors; subscore factors; or a general factor with task-specific factors).
Nonparametric methods: 2 item-type dimensions detected.b
Note. Scenario-based task sets with the same name across administrations do not imply identical test forms, as revisions often were
made. CFA = confirmatory factor analysis, EFA = exploratory factor analysis, NA = not applicable, NR = not reported. a Percentage missing includes omitted, not-reached, and system errors. b The methods were conditional covariance-based
nonparametric approaches (Stout et al., 1996).

22
genre and constellation of competencies. As for the CBAL reading assessments, however,
replication of this finding with forms whose administration is distributed over longer periods is
needed.
External Relations
Aside from the internal analyses, the relations of CBAL writing scores to scores on the
MEA and MAP reading and math tests have been explored. Across two pilot administrations
(Fall 2008, Spring 2009), CBAL writing scores seemed, as expected, to be correlated more
highly in our samples with MEA reading scores (median r = .59) than with MEA math scores
(median r = .46; ETS, 2009b). A similar, though less distinct, differentiation appeared to hold
with MAP, for which the median reading correlation was .53 versus .47 for math.
Population-Group Performance and Differential Item Functioning (DIF)
Using data from the large-sample multistate study, Fu et al. (2011c) investigated the
performance of population groups on CBAL writing forms. For each of four forms, score
means were compared within groups categorized by gender, race/ethnicity, and SES.8
Following up on the examination of population-group differences, Fu et al. (2011c)
employed the Mantel-Haenszel procedure (Holland & Thayer, 1988) to identify instances of DIF
in each of the four writing forms. Groups categorized by gender (male vs. female), race/ethnicity
(White vs. Black; White vs. the combination of Native American, Asian American/Pacific
Islander, and Hispanic), and socio-economic status (low vs. not-low) were investigated for DIF.
Of the 94 items examined, only one was found to exhibit C-level DIF against the focal group.
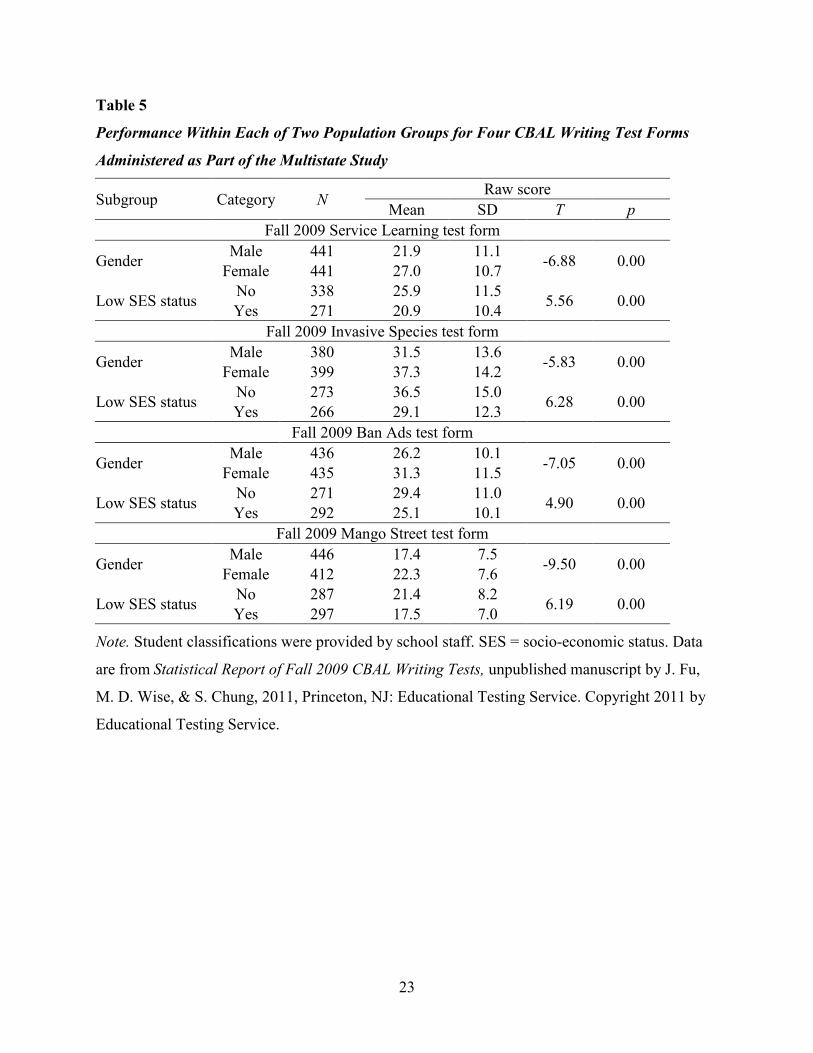
Table 5
shows the results for all groups except race/ethnicity, which are displayed in Table 6. Across
all four forms, female examinees achieved scores that were statistically significantly higher
than male examinees. Similarly, students from high SES groups achieved scores that were
greater than the scores of students from low SES groups. These (undesirable) patterns are
consistent with results commonly found on such writing assessments as NAEP (NCES, 2008,
p. 12). Differences among the racial/ethnic groups listed in Table 6 varied somewhat across the
four forms, likely due to the small sample sizes for minority students. However, the differences
that were statistically significant, unfortunately, also echo performance patterns found more
generally on NAEP (NCES, 2008, pp. 11, 18).
23
Table 5
Performance Within Each of Two Population Groups for Four CBAL Writing Test Forms
Administered as Part of the Multistate Study
Subgroup Category N Raw score Mean SD T p
Fall 2009 Service Learning test form
Gender Male 441 21.9 11.1 -6.88 0.00 Female 441 27.0 10.7
Low SES status No 338 25.9 11.5 5.56 0.00 Yes 271 20.9 10.4 Fall 2009 Invasive Species test form
Gender Male 380 31.5 13.6 -5.83 0.00 Female 399 37.3 14.2
Low SES status No 273 36.5 15.0 6.28 0.00 Yes 266 29.1 12.3 Fall 2009 Ban Ads test form
Gender Male 436 26.2 10.1 -7.05 0.00 Female 435 31.3 11.5
Low SES status No 271 29.4 11.0 4.90 0.00 Yes 292 25.1 10.1 Fall 2009 Mango Street test form
Gender Male 446 17.4 7.5 -9.50 0.00 Female 412 22.3 7.6
Low SES status No 287 21.4 8.2 6.19 0.00 Yes 297 17.5 7.0
Note. Student classifications were provided by school staff. SES = socio-economic status. Data
are from Statistical Report of Fall 2009 CBAL Writing Tests, unpublished manuscript by J. Fu,
M. D. Wise, & S. Chung, 2011, Princeton, NJ: Educational Testing Service. Copyright 2011 by
Educational Testing Service.

24
Table 6
Performance by Race/Ethnicity for Four CBAL Writing Test Forms Administered as Part of
the Multistate Study
Race/ethnicity N Raw score Multiple comparisona
Mean SD F p A AA W Fall 2009 Service Learning test form
Asian American/Pacific Islander (A) 29 32.3 12.0
34.0 0.00
-- -- --
African American (AA) 141 18.0 10.0 * -- -- White (W) 478 27.0 10.2 NS * -- Hispanic (H) 88 22.7 10.7 * * *
Fall 2009 Invasive Species test form Asian American /Pacific Islander (A) 23 51.2 12.9
26.1 0.00
-- -- --
African American (AA) 127 26.5 11.5 * -- -- White (W) 399 35.0 14.2 * * -- Hispanic (H) 75 31.9 13.9 * NS NS
Fall 2009 Ban Ads test form Asian American /Pacific Islander (A) 28 42.0 9.2
41.8 0.00
-- -- --
African American (AA) 163 22.4 9.7 * -- -- White (W) 406 30.4 10.5 * * -- Hispanic (H) 78 26.6 9.2 * * *
Fall 2009 Mango Street test form Asian American /Pacific Islander (A) 26 27.0 7.4
29.1 0.00
-- -- --
African American (AA) 166 15.6 7.2 * -- -- White (W) 422 21.2 7.9 * * -- Hispanic (H) 82 18.8 7.2 * * NS
Note. Student classifications were provided by school staff. NS = no statistically significant
difference. Data from Statistical Report of Fall 2009 CBAL Writing Tests, unpublished
manuscript by J. Fu, M. D. Wise, & S. Chung, 2011, Princeton, NJ: Educational Testing Service.
Copyright 2011 by Educational Testing Service. a Tukey HSD test.
* p < 0.05

25
The polytomous item in question was differentially difficult for Black examinees. A second
polytomous item was differentially easy for female examinees.
Automated Scoring
The scenario-based task set that composes each CBAL writing form requires, in addition
to the completion of short exercises, the production of a significant document such as an essay,
letter, or pamphlet. Deane (2010) explored the suitability of automated scoring methods using
the multistate data set. Across the four test forms, he reported a median correlation of .79
between the automated score and a pair of human scores on the document, as compared to a
median correlation of .82 between two pairs of human judges.9
Summary
In addition, Deane found a
median correlation of .73 between the automated document score and the total test score for the
form (of which the human-scored document was a part). Finally, Deane found a median
correlation of .53 between the automated document score and the total score for the other test
form taken (close in time) by the same students. No comparable data for human ratings were
reported.
As of 2010, results from five CBAL summative writing pilots had been reported,
accounting for over 5,400 online administrations. With respect to basic psychometric
functioning, the test forms piloted have been more variable in terms of internal consistency
reliability, difficulty, and missing-response rates than the CBAL reading forms, perhaps
reflecting more substantial experimentation in writing test design over time. The use of a test
design consisting of a single scenario per form produced internal consistencies in the high .70s,
with cross-form correlations close to that level. Also, analyses of internal structure generally
recovered a single factor, both within forms and across pairs of forms (though with
nonparametric methods, two-dimensional structures emerged). With respect to external relations,
writing scores appeared to be more highly correlated with reading scores than with math scores
on other standardized assessments. An examination of population-group performance showed
patterns similar to those found on NAEP. Finally, automated scores were highly correlated with
human scores, and reasonably correlated with both the same form’s total test score and with total
scores on another CBAL writing form taken by the same students.
26
Results From CBAL Math
Math summative prototypes were built to measure aspects of the CBAL math
competency model (Graf, 2009). The latest iteration of that model is composed of three major
branches: use cross-cutting processes (e.g., modeling, representation, argumentation), understand
and use content-specific procedures and language (e.g., numbers and operations, geometry,
algebra, measurement, data analysis, and probability), and use basic dimensions of mathematical
competency (e.g., conceptual knowledge, fluency). In contrast to the CBAL reading and writing
summative assessments, the math summative test design has typically involved an extended
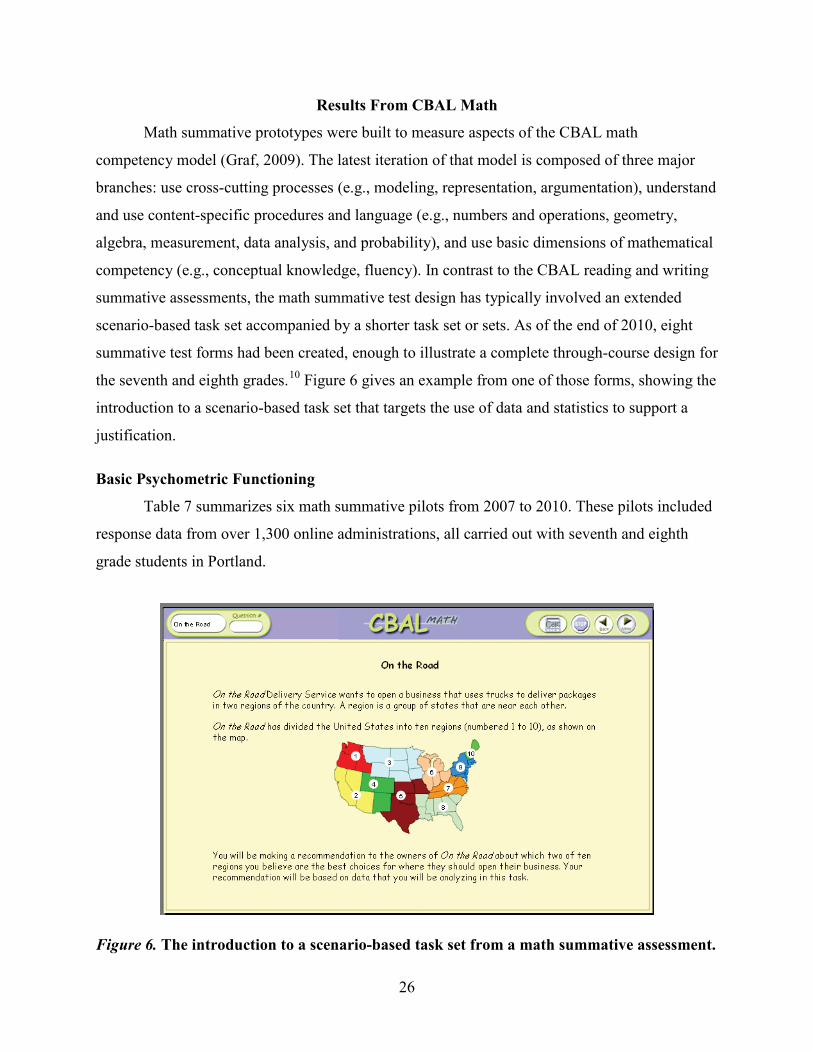
scenario-based task set accompanied by a shorter task set or sets. As of the end of 2010, eight
summative test forms had been created, enough to illustrate a complete through-course design for
the seventh and eighth grades.10
Basic Psychometric Functioning
Figure 6 gives an example from one of those forms, showing the
introduction to a scenario-based task set that targets the use of data and statistics to support a
justification.
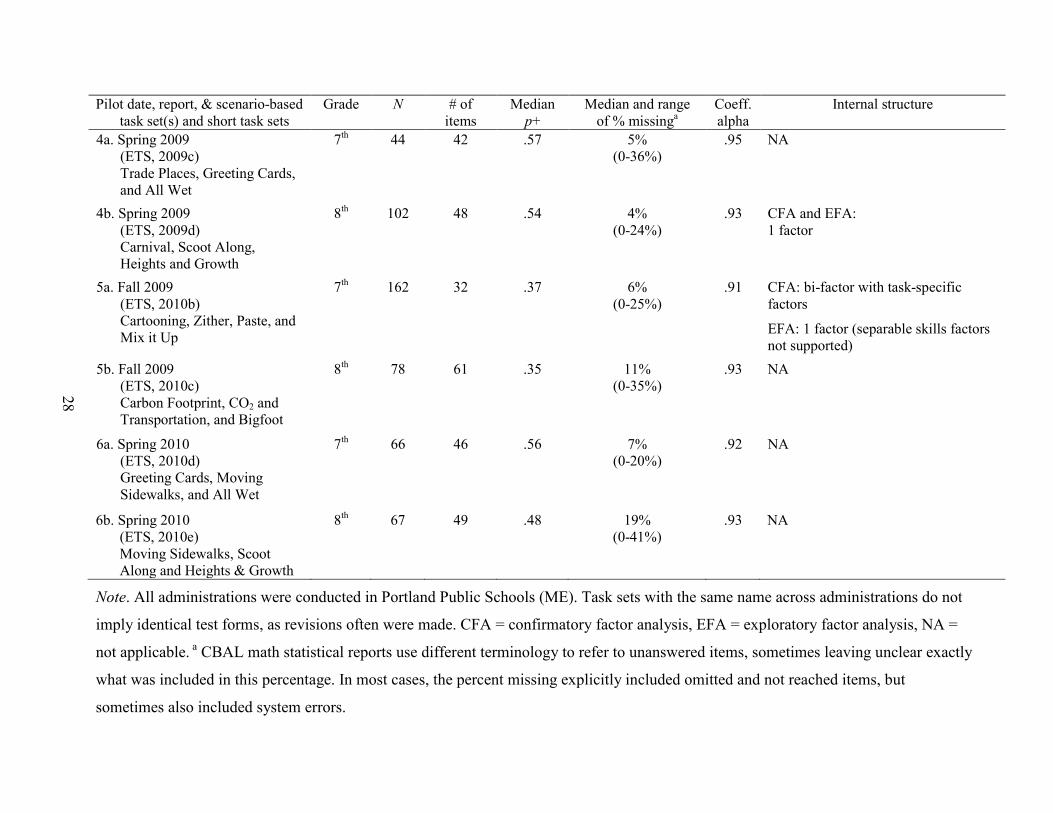
Table 7 summarizes six math summative pilots from 2007 to 2010. These pilots included
response data from over 1,300 online administrations, all carried out with seventh and eighth
grade students in Portland.
Figure 6. The introduction to a scenario-based task set from a math summative assessment.

27
Table 7
Summary of Results From Math Summative Assessment Pilot Administrations
Pilot date, report, & scenario-based task set(s) and short task sets
Grade N # of items
Median p+
Median and range of % missinga
Coeff. alpha
Internal structure
1a. Fall 2007 (Liang & Rijmen, 2008c) Wins and Losses, Fruit Drink, Zither, Paste, Mix it Up
7th 161 15 .20 4% (1-19%)
.80 CFA, EFA: 1 factor (separable skills factors not supported)
1b. Fall 2007 (Liang & Rijmen, 2008c) Magnifying Glass, Stage, Resizing photos
8th 129 14 .41 3% (0-10%)
.84 CFA, EFA: 1 factor (separable skills factors not supported)
2a. Spring 2008 (Liang & Rijmen, 2008d) Crane, Geometric Floor Plan, Watering the Garden
7th 193 32 .46 3% (0-23%)
.91 CFA: 1 factor (separable skills factors not supported)
EFA: 3-factor and 5-factor task-specific solutions
2b. Spring 2008 (Liang & Rijmen, 2008d) Buy Music, Dams and Drought, Heart Rate
8th 52 21 .44 12% (0-52%)
.89 NA
3a. Fall 2008 (ETS, 2009c; Steinberg, 2009c) Paper Crane, Watering the Garden, and Geometric Floor Design
7th 162 39 .49 3% (0-31%)
.90 CFA: 1 factor (separable skills factors not supported)
3b. Fall 2008 (ETS, 2009d; Steinberg, 2009d) Statistics Discrete, Bigfoot, and Forest Carbon
8th 131 86 .41 16% (0-36%)
.95 CFA and EFA: Analysis run only within each test section; No consistent structure supported
28
Pilot date, report, & scenario-based task set(s) and short task sets
Grade N # of items
Median p+
Median and range of % missinga
Coeff. alpha
Internal structure
4a. Spring 2009 (ETS, 2009c) Trade Places, Greeting Cards, and All Wet
7th 44 42 .57 5% (0-36%)
.95 NA
4b. Spring 2009 (ETS, 2009d) Carnival, Scoot Along, Heights and Growth
8th 102 48 .54 4% (0-24%)
.93 CFA and EFA: 1 factor
5a. Fall 2009 (ETS, 2010b) Cartooning, Zither, Paste, and Mix it Up
7th 162 32 .37 6% (0-25%)
.91 CFA: bi-factor with task-specific factors
EFA: 1 factor (separable skills factors not supported)
5b. Fall 2009 (ETS, 2010c) Carbon Footprint, CO2 and Transportation, and Bigfoot
8th 78 61 .35 11% (0-35%)
.93 NA
6a. Spring 2010 (ETS, 2010d) Greeting Cards, Moving Sidewalks, and All Wet
7th 66 46 .56 7% (0-20%)
.92 NA
6b. Spring 2010 (ETS, 2010e) Moving Sidewalks, Scoot Along and Heights & Growth
8th 67 49 .48 19% (0-41%)
.93 NA
Note. All administrations were conducted in Portland Public Schools (ME). Task sets with the same name across administrations do not
imply identical test forms, as revisions often were made. CFA = confirmatory factor analysis, EFA = exploratory factor analysis, NA =
not applicable. a CBAL math statistical reports use different terminology to refer to unanswered items, sometimes leaving unclear exactly
what was included in this percentage. In most cases, the percent missing explicitly included omitted and not reached items, but
sometimes also included system errors.
29
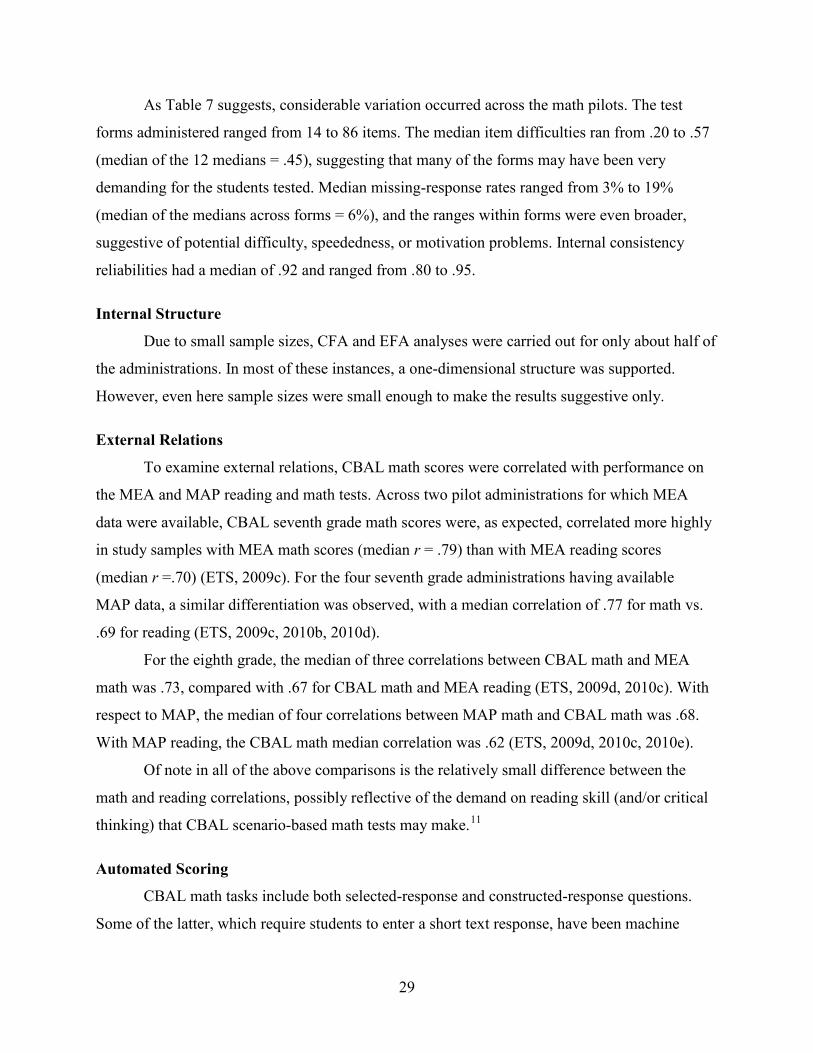
As Table 7 suggests, considerable variation occurred across the math pilots. The test
forms administered ranged from 14 to 86 items. The median item difficulties ran from .20 to .57
(median of the 12 medians = .45), suggesting that many of the forms may have been very
demanding for the students tested. Median missing-response rates ranged from 3% to 19%
(median of the medians across forms = 6%), and the ranges within forms were even broader,
suggestive of potential difficulty, speededness, or motivation problems. Internal consistency
reliabilities had a median of .92 and ranged from .80 to .95.
Internal Structure
Due to small sample sizes, CFA and EFA analyses were carried out for only about half of
the administrations. In most of these instances, a one-dimensional structure was supported.
However, even here sample sizes were small enough to make the results suggestive only.
External Relations
To examine external relations, CBAL math scores were correlated with performance on
the MEA and MAP reading and math tests. Across two pilot administrations for which MEA
data were available, CBAL seventh grade math scores were, as expected, correlated more highly
in study samples with MEA math scores (median r = .79) than with MEA reading scores
(median r =.70) (ETS, 2009c). For the four seventh grade administrations having available
MAP data, a similar differentiation was observed, with a median correlation of .77 for math vs.
.69 for reading (ETS, 2009c, 2010b, 2010d).
For the eighth grade, the median of three correlations between CBAL math and MEA
math was .73, compared with .67 for CBAL math and MEA reading (ETS, 2009d, 2010c). With
respect to MAP, the median of four correlations between MAP math and CBAL math was .68.
With MAP reading, the CBAL math median correlation was .62 (ETS, 2009d, 2010c, 2010e).
Of note in all of the above comparisons is the relatively small difference between the
math and reading correlations, possibly reflective of the demand on reading skill (and/or critical
thinking) that CBAL scenario-based math tests may make.11
Automated Scoring
CBAL math tasks include both selected-response and constructed-response questions.
Some of the latter, which require students to enter a short text response, have been machine

30
scored using c-rater (Sukkarieh & Bolge, 2010).12
In a second study, Sukkarieh (2010) used ten items (one overlapping with the study
above), and blind samples of 50 to 96 responses per item. She found c-rater agreement for the
best of three automated-scoring-method variations to be lower than human-human agreement for
all but one item. The median difference in kappa values across all ten items was, at .20, quite
substantial (range = -.10 to .52, with negative values favoring c-rater). Across these two studies,
the size and range of the differences suggest that c-rater scoring for the kinds of math items
evaluated is still noticeably below agreement levels attainable with human scoring.
Results from the scoring of one set of five
such items were reported by Sukkarieh and Blackmore (2009). Responses provided by seventh
and eighth graders were scored independently by two human judges and by c-rater. A blind data
set consisting of 67 answers per item was used to evaluate the quality of the automated scoring
by comparing the unweighted kappa statistic between the two human judges to that for c-rater
and the average of the judges. For all five items, the two human judges agreed more closely with
one another than with c-rater. The median difference in kappa values was .10 points higher for
the human judges (compared with the c-rater-judge agreement; range = .05 to .14).
Summary
In mathematics, six CBAL summative pilots have been conducted, involving more than
1,300 online test administrations. In contrast with reading and writing, which most often targeted a
single grade, the math pilots were generally conducted in both seventh and eighth grades. As for
writing, considerable variation occurred across pilot test forms with respect to internal consistency,
difficulty, and missing-response rates, perhaps partly reflecting the range of design changes
explored since 2007. Factor analytic results most often suggested a single dimension within forms.
As expected, CBAL math scores appeared to be more correlated with math scores from other
assessments than with reading scores from those assessments (but only by relatively modest
amounts). Finally, an analysis of automated scores showed that, for the types of items studied,
agreement with human raters was noticeably lower than that found between human raters.
Conclusion
The primary goal of CBAL research is to create and evaluate a model that is a significant
improvement over traditional approaches to K–12 assessment. Toward that end, CBAL
incorporates results from learning-sciences research (in addition to content standards); uses
31
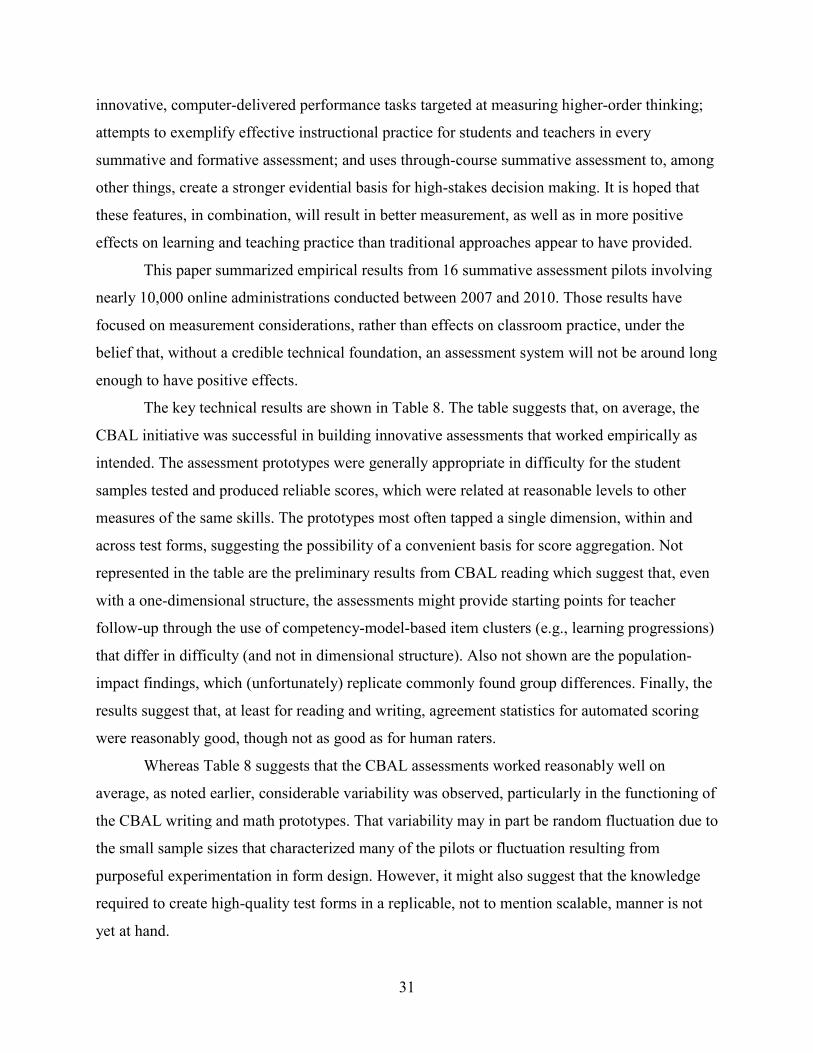
innovative, computer-delivered performance tasks targeted at measuring higher-order thinking;
attempts to exemplify effective instructional practice for students and teachers in every
summative and formative assessment; and uses through-course summative assessment to, among
other things, create a stronger evidential basis for high-stakes decision making. It is hoped that
these features, in combination, will result in better measurement, as well as in more positive
effects on learning and teaching practice than traditional approaches appear to have provided.
This paper summarized empirical results from 16 summative assessment pilots involving
nearly 10,000 online administrations conducted between 2007 and 2010. Those results have
focused on measurement considerations, rather than effects on classroom practice, under the
belief that, without a credible technical foundation, an assessment system will not be around long
enough to have positive effects.
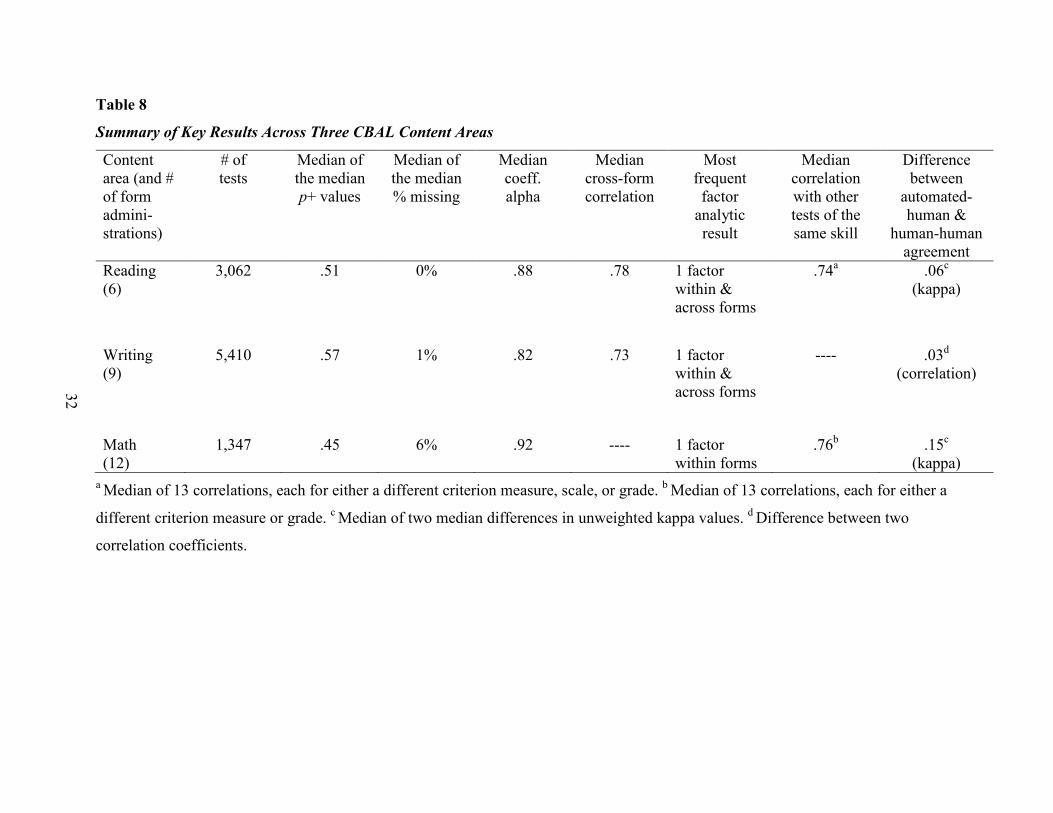
The key technical results are shown in Table 8. The table suggests that, on average, the
CBAL initiative was successful in building innovative assessments that worked empirically as
intended. The assessment prototypes were generally appropriate in difficulty for the student
samples tested and produced reliable scores, which were related at reasonable levels to other
measures of the same skills. The prototypes most often tapped a single dimension, within and
across test forms, suggesting the possibility of a convenient basis for score aggregation. Not
represented in the table are the preliminary results from CBAL reading which suggest that, even
with a one-dimensional structure, the assessments might provide starting points for teacher
follow-up through the use of competency-model-based item clusters (e.g., learning progressions)
that differ in difficulty (and not in dimensional structure). Also not shown are the population-
impact findings, which (unfortunately) replicate commonly found group differences. Finally, the
results suggest that, at least for reading and writing, agreement statistics for automated scoring
were reasonably good, though not as good as for human raters.
Whereas Table 8 suggests that the CBAL assessments worked reasonably well on
average, as noted earlier, considerable variability was observed, particularly in the functioning of
the CBAL writing and math prototypes. That variability may in part be random fluctuation due to
the small sample sizes that characterized many of the pilots or fluctuation resulting from
purposeful experimentation in form design. However, it might also suggest that the knowledge
required to create high-quality test forms in a replicable, not to mention scalable, manner is not
yet at hand.
32
Table 8
Summary of Key Results Across Three CBAL Content Areas
Content area (and # of form admini-strations)
# of tests
Median of the median p+ values
Median of the median % missing
Median coeff. alpha
Median cross-form correlation
Most frequent factor
analytic result
Median correlation with other tests of the same skill
Difference between
automated-human &
human-human agreement
Reading (6)
3,062 .51 0% .88 .78 1 factor within & across forms
.74a .06c (kappa)
Writing (9)
5,410 .57 1% .82 .73 1 factor within & across forms
---- .03d (correlation)
Math (12)
1,347 .45 6% .92 ---- 1 factor within forms
.76b .15c (kappa)
a Median of 13 correlations, each for either a different criterion measure, scale, or grade. b Median of 13 correlations, each for either a
different criterion measure or grade. c Median of two median differences in unweighted kappa values. d Difference between two
correlation coefficients.
33
Although this paper offered initial data on the technical quality of CBAL scores, studies
directed at addressing many critical questions have yet to be completed. These questions include
the alignment of CBAL forms to the Common Core State Standards; dimensionality of CBAL
test forms when distributed across time; impact of different aggregation methods on score
meaning; horizontal equating and vertical linking; fairness and accessibility for students from
special populations (e.g., those with disabilities or who are English language learners);
appropriateness of the reading load demanded by the math prototypes; measurement of growth;
instructional sensitivity; utility of formative information provided by the summative test;
effectiveness of different approaches to score reporting; and impact of CBAL assessments on
classroom teaching and learning practice, among other issues. Studies targeting many of these
issues, including fairness for special populations, are underway.
The list of the CBAL initiative’s empirical accomplishments, as compared with the list of
outstanding questions, should highlight the fact that, in consequential educational assessment,
meaningful innovation requires considerable investment, concerted effort, a significant tolerance
for failure, and an extended time horizon. For CBAL, as for the Race to the Top Assessment
Program consortia, the proposed innovations are extremely ambitious. The good news from the
CBAL initiative appears to be that modest progress is being made.
34
References
Bennett, R. E. (2010). Cognitively based assessment of, for, and as learning: A preliminary
theory of action for summative and formative assessment. Measurement:
Interdisciplinary Research and Perspectives, 8, 70–91.
Bennett, R. E. (2011). Formative assessment: A critical review. Assessment in Education:
Principles, Policy and Practice 18, 5–25.
Bennett, R. E., & Gitomer, D. H. (2009). Transforming K–12 assessment: Integrating
accountability testing, formative assessment, and professional support. In C. Wyatt-Smith
& J. Cumming (Eds.), Educational assessment in the 21st century (pp. 43–61). New
York, NY: Springer.
Bennett, R. E., Steffen, M., Singley, M. K., Morley, M., & Jacquemin, D. (1997). Evaluating an
automatically scorable, open-ended response type for measuring mathematical reasoning
in computer-adaptive tests. Journal of Educational Measurement, 34, 163–177.
Deane, P. (2010). Covering the writing construct: An exploration of automated essay scoring in
the context of a cognitively based approach to writing assessment. Unpublished
manuscript. Princeton, NJ: ETS.
Deane, P. (2011). Writing assessment and cognition (ETS Research Rep. No. RR-11-14).
Princeton, NJ: ETS.
Embretson, S. (2010). Cognitively based assessment and the integration of summative and
formative assessments. Measurement: Interdisciplinary Research & Perspective, 8, 180–
184.
ETS. (2009a). CBAL reading periodical accountability assessments: 2008–09 statistical report.
Unpublished manuscript. Princeton, NJ: ETS.
ETS. (2009b). CBAL writing periodical accountability assessments: 2008–09 statistical report.
Unpublished manuscript. Princeton, NJ: ETS.
ETS. (2009c). CBAL grade 7 mathematics periodical accountability assessments: 2008–09
statistical report. Unpublished manuscript. Princeton, NJ: ETS.
ETS. (2009d). CBAL grade 8 mathematics periodical accountability assessments: 2008–09
statistical report.. Unpublished manuscript. Princeton, NJ: ETS.
ETS. (2010a). CBAL writing periodic accountability assessments: February 2010 statistical
report. Unpublished manuscript. Princeton, NJ: ETS.
35
ETS. (2010b). CBAL grade 7 mathematics periodic accountability assessments: Fall 2009
statistical report. Unpublished manuscript. Princeton, NJ: ETS.
ETS. (2010c). CBAL grade 8 mathematics periodic accountability assessments: Fall 2009
statistical report. Unpublished manuscript. Princeton, NJ: ETS.
ETS. (2010d). CBAL grade 7 mathematics periodic accountability assessments: Spring 2010
statistical report. Unpublished manuscript. Princeton, NJ: ETS.
ETS. (2010e). CBAL grade 8 mathematics periodic accountability assessments: Spring 2010
statistical report. Unpublished manuscript. Princeton, NJ: ETS.
Fu, J., Wise, M. D., & Chung, S. (2011a). Statistical report of Fall 2009 CBAL reading tests.
Unpublished manuscript. Princeton, NJ: ETS
Fu, J., Wise, M. D., & Chung, S. (2011b). Dimensionality analysis of CBAL writing tests.
Unpublished manuscript. Princeton, NJ: ETS.
Fu, J., Wise, M. D., & Chung, S. (2011c). Statistical report of Fall 2009 CBAL writing tests.
Unpublished manuscript. Princeton, NJ: ETS
Graf, E. A. (2009). Defining mathematics competency in the service of cognitively based
assessment for grades 6 through 8 (ETS Research Rep. No. RR-09-42). Princeton, NJ:
ETS.
Holland, P. W., & Thayer, D. T. (1988). Differential item performance and the Mantel-Haenszel
procedure. In H. Wainer & H. I. Braun (Eds.), Test validity (pp. 129–145). Hillsdale, NJ:
Lawrence Erlbaum.
Liang, L., & Rijmen, F. (2008a). Exploratory statistical results for the Fall 2007 CBAL reading
comprehension periodically administered assessment. Unpublished manuscript.
Princeton, NJ: Educational Testing Service.
Liang, L., & Rijmen, F. (2008b). Exploratory statistical results for the Spring 2008 CBAL
reading comprehension periodically administered assessment. Unpublished manuscript.
Princeton, NJ: Educational Testing Service.
Liang, L., & Rijmen, F. (2008c). Exploratory statistical results for the Fall 2007 CBAL math
periodically administered assessment. Unpublished manuscript. Princeton, NJ:
Educational Testing Service.

36
Liang, L., & Rijmen, F. (2008d). Exploratory statistical results for the Spring 2008 CBAL math
periodically administered assessment. Unpublished manuscript. Princeton, NJ:
Educational Testing Service.
MacGinitie, W. H., MacGinitie, R. K,. Maria, K., Dreyer, L, & Hughes, K. E. (2000). Gates-
MacGinitie reading tests (4th ed., Form S). Itasca, IL: Riverside Publishing.
National Center for Education Statistics. (2007). The nation’s report card: Reading 2007 (NCES
2007-496). Washington, DC: Author.
National Center for Education Statistics. (2008). The nation’s report card: Writing 2007 (NCES
2008-468). Washington, DC: Author.
O’Reilly, T., & Sheehan, K. M. (2009a). Cognitively based assessment of, for and as learning: A
framework for assessing reading competency (ETS Research Report No. RR-09-26).
Princeton, NJ: ETS.
O’Reilly, T., & Sheehan, K. M. (2009b). Cognitively based assessment of, for and as learning: A
21st century approach for assessing reading competency (ETS Research Report No. RM-
09-04). Princeton, NJ: ETS.
Rijmen, F. (2008a). Exploratory statistical results for the Fall 2007 CBAL writing periodically
administered assessments. Unpublished manuscript. Princeton, NJ: ETS.
Rijmen, F. (2008b). Exploratory statistical results for the Spring 2008 CBAL writing
periodically administered assessments. Unpublished manuscript. Princeton, NJ: ETS.
Sandene, B., Bennett, R. E., Braswell, J., & Oranje, A. (2005). Online assessment in
mathematics. In B. Sandene, N. Horkay, R. E. Bennett, N. Allen, J. Braswell, B. Kaplan,
& A. Oranje (Eds.), Online assessment in mathematics and writing: Reports from the
NAEP Technology-Based Assessment Project (NCES 2005-457). Washington, DC:
National Center for Education Statistics.
Sheehan, K. M., & O’Reilly, T. (2009, June). The CBAL reading assessment: An approach for
balancing measurement and learning goals. Paper presented at the National Conference
on Student Assessment, Los Angeles, CA.
Sheehan, K. M., & O’Reilly, T. (in press). The case for scenario-based assessments of reading
competency. In J. Sabatini & L. Albro (Eds.), Assessing reading in the 21st century.
Lanham, MD: Rowman & Littlefield Education.
37
Steinberg, J. (2009a). Factor analysis of the Fall 2008 CBAL reading comprehension
periodically administered assessment. Unpublished manuscript. Princeton, NJ: ETS.
Steinberg, J. (2009b). Factor analysis of the Fall 2008 CBAL writing periodically administered
assessment. Unpublished manuscript. Princeton, NJ: ETS.
Steinberg, J. (2009c). Factor analysis of the Fall 2008 CBAL grade 7 mathematics periodically
administered assessment. Unpublished manuscript. Princeton, NJ: ETS.
Steinberg, J. (2009d). Factor analysis of the Fall 2008 CBAL grade 8 mathematics periodically
administered assessment. Unpublished manuscript. Princeton, NJ: ETS.
Stout, W., Habing, B., Douglas, J., Kim, H. R., Roussos, L., & Zhang, J. (1996). Conditional
covariance-based nonparametric multidimensionality assessment. Applied Psychological
Measurement, 20(4), 331–354.
Sukkarieh, J. Z. (2010, July). Using a MaxEnt classifier for the automatic content scoring of
free-text responses. Paper presented at the 30th International Workshop on Bayesian
Inference and Maximum Entropy Methods in Science and Engineering, Chamonix,
France. Retrieved from http://www.lss.supelec.fr/MaxEnt2010/paper/048.pdf
Sukkarieh, J. Z., & Blackmore, J. (2009). c-rater: Automatic content scoring for short
constructed responses. Paper presented at the Florida Artificial Intelligence Research
Society (FLAIRS) Conference, Sanibel, FL. Retrieved from
http://www.aaai.org/ocs/index.php/FLAIRS/2009/paper/download/122/302
Sukkarieh, J. Z., & Bolge, E. (2010, May). Building a textual entailment suite for evaluating
content scoring technologies. Paper presented at the Language Resources and Evaluation
Conference (LREC), Malta. Retrieved from http://www.lrec-
conf.org/proceedings/lrec2010/summaries/310.html
Torgesen, J., Wagner, R., & Rashotte, C. (1998). Test of word reading efficiency. Austin, TX:
Pro-Ed.
Yoo, H., Fu, J., Wise, M. D., & Chung, S. (2011). Dimensionality analysis of CBAL reading
tests. Unpublished manuscript. Princeton, NJ: Educational Testing Service.
38
Notes
1 Eight sets of formative assessment materials also had been created as of the end of 2010. These
sets combine reading and writing and are coordinated, in terms of skills focus, with the
reading and writing summative test forms.
2 The internal consistency reliabilities may be spuriously inflated due to the local dependency
induced by the scenario-based task set that, as noted, entailed a series of questions related to
the same context and purpose. Speededness can also inflate such estimates.
3 Students with individualized education programs (IEPs) were not included in either the impact
or DIF analyses because this indicator turned out to include both students with disabilities and
those classified as gifted/talented.
4 Status for ELL was not analyzed because of small sample sizes.
5 As noted earlier, eight sets of English language arts formative assessment materials that
combine reading and writing also had been created by the end of 2010.
6 The results of a sixth pilot, conducted in Spring 2010 (ETS, 2010a), are not included because
technology problems prevented delivery of the culminating essay to the majority of the
sample for both of the test forms administered.
7 Because each writing form is essentially a self-contained scenario-based task set, the internal
consistency reliabilities may be somewhat inflated by local dependency and possibly by
speededness.
8 Students who were ELL or who had IEPs were not included in either the impact or DIF
analyses, the former group because of small sample size and the latter group because the IEP
indicator included both individuals with disabilities and those classified as gifted/talented.
9 This correlation may slightly underestimate inter-rater agreement as it was computed between
rater pairs using different rubrics: one a rubric that focused on organization, word choice,
sentence fluency, and mechanics, and the other a rubric that centered on rhetorical
effectiveness and quality of reasoning.
10 As of the end of 2010, nine sets of formative assessment materials had been developed, several
of which are coordinated with the summative forms in their skills foci.

39
11 See Embretson (2010) for a commentary on the potential unintended consequences of
emphasizing critical thinking in the CBAL model.
12 Other CBAL math items call for entry of an expression, equation, numerical value, or points
on a grid. Responses to these items are usually scored by m-rater. In other testing contexts,
m-rater scoring has been reported to be highly accurate in comparison with both human rating
and multiple-choice scoring (Bennett, Steffen, Singley, Morley, & Jacquemin, 1997; Sandene,
Bennett, Braswell, & Oranje, 2005, pp. 31–35, identified as pattern-and-feature matching). A
formal analysis has not yet been reported for CBAL data.