Embed Size (px)
Citation preview

Causes of the Postal Service FERS Surplus
October 16, 2012
Sponsored by U.S. Postal Service Office of Inspector General Report Number: RARC-WP-13-001

U.S. Postal Service Office of Inspector General October 16, 2012 Causes of the Postal Service FERS Surplus RARC-WP-13-001
1
Causes of the Postal Service FERS Surplus
Introduction
The U.S. Postal Service has a $13.1 billion pension surplus as of September 30, 2011, according to projections by the Office of Personnel Management (OPM).1 Most of this pension surplus, $11.4 billion, is from the Federal Employees’ Retirement System (FERS).2 OPM’s funding estimates for FERS have shown a persistent surplus since 1992, and in the most recent estimate, the FERS surplus increased by $4 billion from the year before.3 The U.S. Postal Service Office of Inspector General (OIG) wanted to investigate the reasons behind the FERS surplus and discover whether the surplus is likely to decline, continue at the same level, or increase in the future. Specifically, we were interested in knowing whether there were distinctive characteristics of the Postal Service and its employees driving the surplus, and if so, whether there was reason to believe that these characteristics would continue to be different from the rest of the FERS population into the future. To find answers to these questions, the OIG contracted with Hay Group, an independent actuarial firm with expertise on Postal Service retirement liabilities.
The results of Hay Group’s work appear in the following report, Evaluation of the USPS Postal Service Fund for Employees Enrolled in the Federal Employees Retirement System. Hay Group found that the FERS surplus does result from differences between Postal Service characteristics and the characteristics of the rest of the federal government. The federal assumptions do not reflect these differences, leading the surplus to increase over time. The primary cause of the increasing surplus is that postal salary growth has been lower than the federal assumptions. Hay Group recommends using Postal Service-specific assumptions to estimate the FERS liability. When Postal Service-specific assumptions are used, the fiscal year (FY) 2011 surplus increases to $24.0 billion. On this basis, the Postal Service’s FERS obligation would be funded by more than 137 percent.
In addition to the FERS surplus, there is a $1.7 billion surplus in the Civil Service Retirement System (CSRS) fund. The OIG intends to conduct follow-up work examining the effect of using Postal Service-specific assumptions on the CSRS surplus. However, when the current CSRS surplus is included, the total projected Postal Service pension surplus increases to $25.7 billion.
1 For more information, see U.S. Postal Service Office of Inspector General, Pension and Retiree Health Care Funding Levels, Management Advisory Report Number FT-MA-12-002, June 18, 2012, http://www.uspsoig.gov/foia_files/FT-MA-12-002.pdf. 2 The remaining $1.7 billion surplus is from the older Civil Service Retirement System (CSRS) pension program. 3 OPM provides its pension estimates with a one year lag, and the results are projected forward to the most recent fiscal year. OPM’s funding estimate of the FERS surplus as of fiscal year (FY) 2010 was $10.9 billion, $4 billion more than the estimate as of FY 2009. The FY 2011 projection was $11.4 billion.
U.S. Postal Service Office of Inspector General October 16, 2012 Causes of the Postal Service FERS Surplus RARC-WP-13-001
2
Background
FERS is a pension program offered to federal employees hired since 1984.4 Congress designed FERS to be fully funded throughout an employee’s career. OPM calculates the percentage of each employee’s salary that must be contributed, called the normal cost percentage, and together the agency and the employee contribute that amount to the pension fund. In recent years, OPM has increased the normal cost percentage repeatedly to reflect changes in benefits and new assumptions, including increased longevity. For most federal employees, the FERS normal cost percentage for contributions is 12.7 percent, of which 0.8 percent is paid by the employee and the balance by the agency.5
The Postal Service pays the same normal cost percentage for FERS as other federal entities, and the amount due in fiscal year (FY) 2011 was $3.0 billion. To track the Postal Service’s FERS funding, OPM provides an annual estimate of the Postal Service’s liabilities and assets for FERS, separated out from the rest of the federal government. The assets include actual postal contributions and interest on those contributions less benefit payments paid to postal retirees. The liabilities include projections of future pension payments to postal annuitants less expected future contributions. The projections are made using many system-wide actuarial assumptions. A surplus exists when the assets exceed the estimate of the accrued liabilities.
Makeup of the FERS Estimate
The amount of the FERS annuity is based on the employee’s years of service and high-three salary — the average of the employee’s three highest consecutive annual salaries. Annuities are usually paid starting at retirement for the rest of the retiree’s or survivor’s lifespan. After retirement, annuitants who have reached age 62 also receive cost-of-living adjustments (COLAs) based on inflation. Therefore, in order to estimate the FERS liability, it is necessary to make assumptions about inflation, future salary growth, retirement patterns, and life expectancy. In addition, actuaries make assumptions about the expected interest rate on the fund’s assets. This interest rate assumption is called the discount rate. Each of these assumptions can affect the estimated liability. For example, an assumption that future salary growth will average 4 percent will result in a higher estimated liability than if the salary growth assumption were 3 percent.
As experience unfolds, actual values replace assumed values for inputs such as COLA and salary growth. For example, in 2009, OPM’s actuaries may have assumed that the average salary increase would be 3 percent in 2010. However, by 2012, OPM knows the actual average salary increase in 2010 and adjusts its estimated liabilities 4 Some employees hired prior to 1984 had the option to switch from CSRS into FERS. 5 FERS was designed so that employees would make the same contribution for Social Security and the FERS pension as CSRS employees made for their pension, since CSRS employees did not participate in Social Security. The FERS contribution rate for employees hired after January 1, 2013, will increase to 3.1 percent.

U.S. Postal Service Office of Inspector General October 16, 2012 Causes of the Postal Service FERS Surplus RARC-WP-13-001
3
accordingly. If the actual salary increase was only 2 percent, the estimated liability will be smaller than first estimated — an actuarial gain from experience; conversely, if the actual salary increase was 4 percent, the estimated liability will be greater than expected — an actuarial loss from experience.
Hay Group’s Results
To determine the source of the FERS surplus, Hay Group analyzed investment returns, salary growth rates, COLAs granted to retirees, and Postal Service demographic experience. Hay Group found that some Postal Service characteristics differ from the characteristics of the rest of the federal government, and these differences account for the FERS surplus. Under current OPM assumptions, the surplus will likely continue and increase over time. Specifically, Hay Group found
The primary reason for the FERS surplus is that Postal Service employees have received smaller pay increases than assumed. General increases have been lower than predicted, and postal employees tend to go through fewer steps in their pay scale than typical federal employees, so they reach the top step more quickly. Since more than 70 percent of postal craft employees have already reached the top of their pay scale, it is likely that the current salary growth assumptions overstate future salary growth. If adjustments are not made to these assumptions to account for lower expected salary growth, the surplus will likely continue to grow over time as experience unfolds. Adjusting the salary growth assumptions will provide a more accurate and stable estimate of the Postal Service’s FERS liability and surplus.
The recent $4 billion jump in the surplus was driven by OPM’s assumption of a 2-year freeze on general pay increases for federal employees. This assumption, holding all else constant, lowered the estimated liability, which increases the surplus.6
A secondary reason for the surplus is that actual COLAs for annuitants have been lower than assumed, so the liability is less than what was previously estimated.
The demographic characteristics and career patterns of postal employees differ from federal employees. Postal employees are less likely to leave their positions and withdraw from the system, less likely to take early retirement, yet more likely to die while employed or retire on disability. The combined effect of these demographic differences is a small increase in the surplus.
The mortality experience of Postal Service annuitants also differs from the system-wide mortality experience. Using Postal Service-specific mortality
6 Although the Postal Service’s pay systems are different from the federal pay systems, this assumption more closely matches the Postal Service’s pay increases than the previous assumption.

U.S. Postal Service Office of Inspector General October 16, 2012 Causes of the Postal Service FERS Surplus RARC-WP-13-001
4
assumptions for annuitants would decrease the liability by between 1 and 2 percent and increase the surplus.
In the first decade of the FERS program, investment returns on the fund were typically higher than assumed; however, since 2004 actual returns have been lower than expected. Given this trend, it is likely that the Board of Actuaries will recommend a reduction in the current assumption about the future rate of investment return (the discount rate). Reducing the assumed investment return rate would increase the liability estimate and decrease the surplus; however, even with such a reduction, a substantial surplus should still exist.
Hay Group concluded that estimates of Postal Service liability should be made using Postal Service-specific assumptions. The postal population is large enough to support the development of Postal Service-specific assumptions. Moreover, this approach would better align estimated liabilities with future payouts to postal annuitants, as these payouts will reflect Postal Service-specific demographic characteristics, career patterns, and salary growth.
The distinctive characteristics of the Postal Service FERS population suggest that the underlying postal FERS surplus is larger than $11.4 billion. Hay Group found that recalculating the Postal Service’s liability estimate based on Postal Service-specific assumptions increases the FY 2011 surplus from $11.4 billion to $24.0 billion. Most of the increase in the surplus is attributable to the change in the salary growth assumptions.
The OIG supports using Postal Service-specific assumptions whatever the effect on the FERS surplus as it provides a more accurate and stable estimate of Postal Service liability that is more likely to match the future payout stream. For the same reason, we believe that if Postal Service specific data are used for the calculation of the FERS surplus, they should also be used in liability calculations for other benefit programs, such as the CSRS pension program and retiree health benefits, regardless of the results.
Providing a more accurate estimate of the Postal Service’s FERS obligations is important for a better understanding of the Postal Service’s financial situation; however, a more accurate estimate cannot prevent a surplus from occurring or return it once it has accumulated. To prevent excessive surpluses from accumulating, Postal Service contribution rates could be adjusted to reflect Postal Service-specific assumptions. Under current law, there is no mechanism for addressing a FERS surplus once it has occurred. While amortization payments are required if the FERS valuation shows a deficit, no corresponding provision exists to return surpluses, although the Senate postal bill (S. 1789) provides a potential solution.7 The OIG described the problem of the FERS surplus in 2010, and we continue to believe a solution is important for the Postal
7 The bill reported by the House Committee on Oversight and Government Reform (H.R. 2309) also includes a one-time transfer of the FERS surplus to the Postal Service.
U.S. Postal Service Office of Inspector General October 16, 2012 Causes of the Postal Service FERS Surplus RARC-WP-13-001
5
Service’s financial health.8 The Postal Service cannot afford to make pension contributions that are not necessary for future benefits.
8 U.S. Postal Service Office of Inspector General, Federal Employees Retirement System Overfunding, Management Advisory Report Number FT-MA-10-001, August 16, 2010, http://www.uspsoig.gov/foia_files/FT-MA-10-001.pdf.

© 2012 Hay Group. All rights reserved.
www.haygroup.com
October 12, 2012
U.S. Postal Service
Evaluation of the USPS Postal Service Fund for Employees Enrolled in the Federal Employees Retirement System
Submitted by:
4301 N. Fairfax Drive Suite 600 Arlington, VA 22203 Phone: 703-841-3100 Fax: 703-841-3108

www.haygroup.com
Contents
EXECUTIVE SUMMARY ......................................................................................................................... 1
I. HISTORICAL SURPLUS ............................................................................................................ 5
II. ACTUARIAL ASSUMPTIONS ................................................................................................... 7
III. INVESTMENT RETURNS .......................................................................................................... 9
IV. GAINS AND LOSSES FROM EXPERIENCE.......................................................................... 11
V. PAY ANALYSIS .......................................................................................................................... 13
VI. COLA ANALYSIS ....................................................................................................................... 17
VII. USPS DEMOGRAPHIC EXPERIENCE................................................................................... 19
VIII. MORTALITY ANALYSIS ......................................................................................................... 22
IX. PROJECTION OF SURPLUS USING USPS-SPECIFIC ASSUMPTIONS .......................... 25
APPENDIX A. ECONOMIC ASSUMPTION HISTORY ................................................................ 27
APPENDIX B. FERS CENSUS DATA .............................................................................................. 28
APPENDIX C. EMPLOYEES BY PAY LEVEL ................................................................................ 30
ACTUARIAL CERTIFICATION ........................................................................................................... 34

1/34
www.haygroup.com
EXECUTIVE SUMMARY
USPS Office of Inspector General (OIG) retained Hay Group to perform an analysis of the USPS
portion of the Federal Employees Retirement System (FERS), including the origins and causes of
the current surplus.
The chart below shows that the USPS FERS fund has been in surplus since 1992.
($2,000)
$0
$2,000
$4,000
$6,000
$8,000
$10,000
$12,000
19
88
19
89
19
90
19
91
19
92
19
93
19
94
19
95
19
96
19
97
19
98
19
99
20
00
20
01
20
02
20
03
20
04
20
05
20
06
20
07
20
08
20
09
20
10
20
11
USPS FERS SurplusAmounts in $millions
Source: Office of Personnel Management (OPM) actuarial valuations.
The 2011 value is projected from the 2010 estimate.
Our key findings are:
The primary reason for the surplus is due to USPS pay increases having been smaller
than those assumed in the valuations. Furthermore, as over 70 percent of FERS Craft
employees have reached the top step of their pay scale, additional surpluses will emerge
unless the salary assumption is modified to reflect USPS experience and future
expectation.
The recent jump in surplus from nearly $7 billion as of September 30, 2009 to nearly
$11 billion as of September 30, 2010 was due in part to the use of a two-year pay freeze
assumption for fiscal years (FYs) 2011 and 2012. This assumption change was made

2/34
www.haygroup.com
for the entire FERS population to reflect the freeze of federal pay increases, but it also
more accurately reflects the expected changes in USPS salaries over these years than
the prior assumption.
An additional reason for the surplus is due to actual inflation experience being below
the rate of inflation assumed. Annuitants receive cost-of-living adjustments (COLAs)
to their annuities based on a measure reflecting actual inflation. As prices have
increased less than expected, the annuities have increased less than assumed, resulting
in experience gains.1
Partially offsetting the experience gains from lower than expected salary growth and
inflation, actual investment returns have fallen below the interest rate assumed for the
valuation. Historical asset gains, which grew to over $2 billion from higher investment
earnings than assumed, have now been erased by lower than expected investment
earnings since 2004.
Given the material difference between the USPS pay scales and the federal pay scales,
we recommend that the USPS FERS liability be measured using USPS-specific
assumptions. With USPS membership accounting for 20 percent of the FERS total,
USPS is easily large enough to warrant population specific assumptions. Given that
this assumption will more accurately reflect the likelihood that future payouts to postal
retirees will be based on lower salary increases, it will have the effect of reducing the
Postal Service’s liability and increasing the surplus. Our analysis shows that using
USPS-specific salary assumptions would reduce the FERS liability by $10.9 billion.
USPS workforce demographic experience (turnover, retirement, disability, etc.) differs
from the FERS overall experience. Reflecting the USPS specific demographic
experience would reduce the FERS liability by an additional $0.9 billion.
USPS annuitant mortality experience also differs from FERS overall mortality
experience. Reflecting USPS mortality rates lowers the Actuarial Accrued Liability by
about 1 to 2 percent. Using the USPS mortality rates in addition to the other USPS-
specific assumptions further reduces the liability by $0.8 billion.
Combining the USPS-specific assumptions for salary growth, workforce demographic
experience, and annuitant mortality (i.e. using all USPS-specific assumptions) increases
the FERS surplus from $11.4 billion to $24.0 billion.
1 Experience gains or losses occur when actual experience differs from assumptions.
3/34
www.haygroup.com
USPS-Specific vs. OPM Pay Increase Assumptions for FERS
The focus of our work has been on estimating the impact on USPS’s FERS funding using
alternative, USPS-specific actuarial assumptions to measure FERS liabilities/costs. These
liabilities/costs have traditionally been measured by OPM’s actuaries utilizing the same actuarial
assumptions used to value the system-wide population in FERS.
Our studies demonstrate that OPM should consider the use of a more accurate assumption set for
the USPS portion of FERS. That is, our review of the likely future experience of the USPS
FERS population tells us that this population has had, and is expected to have, significantly
different experience than OPM assumes in its FERS liability/cost measurements. With USPS’s
share of the overall FERS fund being over 20 percent, we believe sound actuarial practice calls
for the USPS’s liability/cost to be measured separately from the rest of FERS.
Specifically related to future pay increases for USPS FERS active employees, our analyses have
shown that:
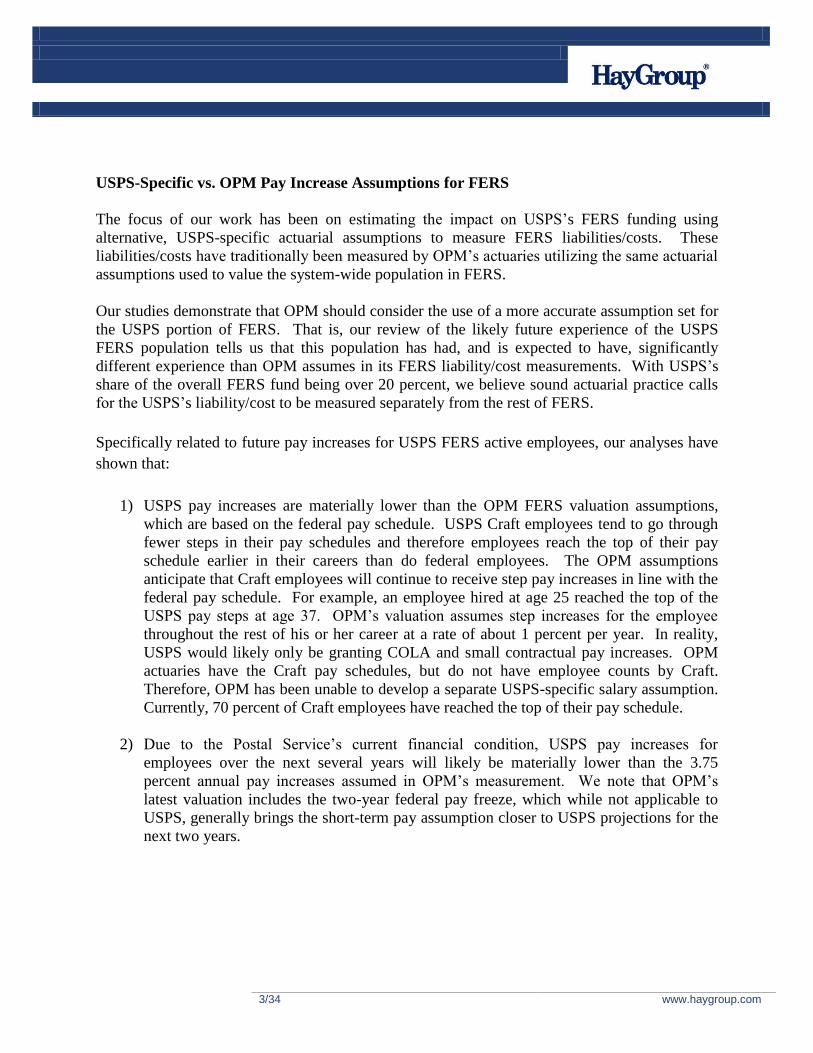
1) USPS pay increases are materially lower than the OPM FERS valuation assumptions,
which are based on the federal pay schedule. USPS Craft employees tend to go through
fewer steps in their pay schedules and therefore employees reach the top of their pay
schedule earlier in their careers than do federal employees. The OPM assumptions
anticipate that Craft employees will continue to receive step pay increases in line with the
federal pay schedule. For example, an employee hired at age 25 reached the top of the
USPS pay steps at age 37. OPM’s valuation assumes step increases for the employee
throughout the rest of his or her career at a rate of about 1 percent per year. In reality,
USPS would likely only be granting COLA and small contractual pay increases. OPM
actuaries have the Craft pay schedules, but do not have employee counts by Craft.
Therefore, OPM has been unable to develop a separate USPS-specific salary assumption.
Currently, 70 percent of Craft employees have reached the top of their pay schedule.
2) Due to the Postal Service’s current financial condition, USPS pay increases for
employees over the next several years will likely be materially lower than the 3.75
percent annual pay increases assumed in OPM’s measurement. We note that OPM’s
latest valuation includes the two-year federal pay freeze, which while not applicable to
USPS, generally brings the short-term pay assumption closer to USPS projections for the
next two years.

4/34
www.haygroup.com
USPS-Specific vs. OPM Demographic Assumptions for FERS
This report examines the assumptions used in the current FERS valuation and compares them to
recent experience using USPS-specific experience where appropriate.
In 2010, at the request of the USPS, we conducted an experience study on USPS demographic
experience. Section VII summarizes the findings from that analysis, which remain valid.
We obtained recent USPS annuitant experience and conducted a mortality study. Section VIII
reports the findings from that analysis.
The report concludes with an estimate of the FERS surplus using the available Postal Service-
specific assumptions.
Acknowledgement
Hay Group would like to note that the timely completion of this report was made possible due to
the cooperation we received from the actuaries in the OPM Office of the Actuary.

5/34
www.haygroup.com
I. Historical Surplus
If a retirement system is to operate on a sound actuarial basis, the funds on hand together with
the expected future contributions must be adequate to cover the value of future promised benefit
payments. Each year, as part of the actuarial valuation process, the actuary projects the expected
value of future benefits and the stream of contributions needed to meet the benefit payments.
The projection serves as the basis for the determination of the needed employer contributions to
the retirement fund.
A surplus exists if the funds on hand exceed the value of the accrued benefits. When the funds
on hand are less than the value of the accrued liabilities there is a deficit.
OPM conducts an annual actuarial valuation for the postal share of the FERS fund and issues a
valuation report in the fall. The valuation assesses the fund as of the previous fiscal year, with a
projection to the end of the current fiscal year. For example, the 2011 analysis evaluated the
fund as of September 30, 2010. The most recent long-term funding valuation showed a surplus
of $10.9 billion at the end of FY 2010 which was projected forwarded to $11.4 billion as of
September 30, 2011. This surplus was $4 billion greater than the previous year’s surplus.
The recent surplus is part of a historical trend in surpluses. As shown in Table I-1, since 1992,
the postal share of the FERS fund has shown a persistent surplus.

6/34
www.haygroup.com
Table I-1
USPS FERS Liability, Assets, and Surplus (Deficit) as of Year-End
Amounts in $millions
Year ending
September 30,
Actuarial Accrued
Liability
Postal FERS Assets Surplus (Deficit)
1988 $2,600 $2,157 ($443)
1989 $3,300 $3,224 ($76)
1990 $4,300 $4,493 $193
1991 $6,000 $5,982 ($18)
1992 $7,600 $7,659 $59
1993 $8,500 $9,470 $970
1994 $9,800 $11,487 $1,687
1995 $12,000 $13,708 $1,708
1996 $13,500 $16,091 $2,591
1997 $15,400 $19,344 $3,944
1998 $18,200 $22,610 $4,410
1999 $21,500 $26,074 $4,574
2000 $23,700 $30,040 $6,340
2001 $26,100 $34,179 $8,079
2002 $31,600 $38,532 $6,932
2003 $34,400 $43,056 $8,656
2004 $38,200 $47,732 $9,532
2005 $44,600 $52,800 $8,200
2006 $49,300 $58,000 $8,700
2007 $55,100 $63,500 $8,400
2008 $62,800 $69,300 $6,500
2009 $68,300 $75,200 $6,900
2010 $69,900 $80,800 $10,900
2011* $75,900 $87,300 $11,400
Source: OPM actuarial valuations. *For 2011, liability, assets, and surplus were projected by OPM from its 2010 estimate.

7/34
www.haygroup.com
II. Actuarial Assumptions
Actuarial projections are based on a number of actuarial assumptions including economic
assumptions, such as assumed investment returns and salary growth rates; and demographic
assumptions, such as rates of turnover and mortality.
Economic assumptions include rates of inflation, investment return and salary growth. These
relatively few rates, compared to the large number of demographic assumptions, have the most
significant effect on the estimate of future contributions. The Postal Service retirement plans use
the same economic assumptions as utilized by OPM’s actuaries in their annual valuations of the
Civil Service Retirement System (CSRS) and the Federal Employees Retirement System
(FERS). The CSRS and FERS economic assumptions are reviewed periodically by an
independent Board of Actuaries to assure that they continue to be current and appropriate
predictors of the future, and they are typically adjusted upward or downward to keep pace with
changes in the expected rate of general inflation.
Table II-1 shows the most recent economic assumptions set by the Board of Actuaries for CSRS
and FERS. A history of economic assumptions appears in Appendix A.
Demographic assumptions include the set of rates that predict certain events occurring to a
group of employees or annuitants. Events of significance to a retirement system are those that
result in a commencement or termination of a benefit payment. The events affecting active
employees include reasons for leaving the system such as retirement, becoming disabled,
terminating service, or death. The events affecting annuitants include death. If an annuitant
2 The interest rate is also referred to as the “discount rate” as future benefit payments are “discounted” to the measurement date
using the expected return on assets.
Table II-1
Current Economic Assumptions for FERS
Inflation 3.00%
CSRS COLA 3.00%
FERS COLA 2.40%
Interest Rate2 5.75%
Salary Growth 3.75%
Assumptions last revised on June 11, 2010.

8/34
www.haygroup.com
would return to service, or if a disabled annuitant were to recover, the benefit payments to the
annuitant would stop.
It is general practice to introduce some degree of conservatism in setting actuarial assumptions.
However, the degree of conservatism varies widely among retirement systems. Some systems
set assumptions so that the retirement plan contributions will be at least as great as the
contributions needed in the most adverse foreseeable circumstances. Other systems set
assumptions that are close to the actual experience but conservative enough to protect against
small deviations from past experience.
OPM conducts experience studies periodically and updates the demographic assumptions upon
completion of the experience study and development of recommended assumptions, reviewed by
the Board of Actuaries.

9/34
www.haygroup.com
III. Investment Returns
One potential source of the surplus is higher than expected investment returns. Using historical
data on employee and agency contributions, benefit payments, assets and reported investment
income, we compared the actual returns with the valuation interest rate assumption as well as the
amount of the annual asset gains (or losses).
Table III-1
FERS Contributions, Benefit Payments, Assets, and Investment Income, 1988 to 2011 (millions)
Year Employee
Contributions
USPS Employer
Contributions Amortization Payments
Benefit Payments
Reported Investment
Income
Postal Service
Fund EOY Actual Return
Assumed Return
1988 $55.7 $671.4 $170.0 $12.5 $133.2 $2,156.8 8.90% 7.00%
1989 $59.1 $787.2 $32.2 $20.6 $209.3 $3,224.0 8.14% 7.00%
1990 $58.0 $877.6 $32.2 $27.2 $328.1 $4,492.7 8.92% 7.00%
1991 $62.6 $987.4 $32.2 $30.6 $437.2 $5,981.6 8.74% 7.00%
1992 $67.5 $1,054.3 $32.2 $35.7 $559.2 $7,659.2 8.57% 7.00%
1993 $69.9 $1,087.4 $32.2 $50.6 $671.9 $9,470.2 8.18% 7.00%
1994 $78.5 $1,220.1 $0.0 $62.2 $780.6 $11,487.2 7.74% 7.00%
1995 $92.4 $1,263.8 $0.0 $72.0 $936.2 $13,707.6 7.72% 7.00%
1996 $107.5 $1,459.3 $0.0 $87.0 $903.5 $16,090.9 6.25% 7.00%
1997 $116.3 $1,579.5 $0.0 $109.5 $1,667.0 $19,344.2 9.87% 7.00%
1998 $127.2 $1,700.1 $0.0 $134.9 $1,573.8 $22,610.4 7.79% 7.00%
1999 $171.2 $1,739.5 $0.0 $159.4 $1,712.0 $26,073.8 7.29% 7.00%
2000 $223.2 $2,003.3 $0.0 $197.1 $1,937.1 $30,040.3 7.15% 7.00%
2001 $183.0 $2,042.6 $0.0 $243.2 $2,156.4 $34,179.1 6.95% 6.75%
2002 $165.6 $2,115.5 $0.0 $284.7 $2,356.6 $38,532.1 6.70% 6.75%
2003 $169.7 $2,176.6 $0.0 $327.4 $2,505.0 $43,056.1 6.34% 6.25%
2004 $175.2 $2,245.7 $0.0 $393.0 $2,647.9 $47,731.9 6.01% 6.25%
2005 $184.6 $2,484.5 $0.0 $481.3 $2,849.1 $52,768.8 5.84% 6.25%
2006 $195.7 $2,640.7 $0.0 $566.1 $2,968.1 $58,007.2 5.51% 6.25%
2007 $203.9 $2,767.8 $0.0 $681.7 $3,206.3 $63,503.4 5.42% 6.25%
2008 $211.6 $2,892.1 $0.0 $780.5 $3,503.3 $69,329.9 5.42% 6.25%
2009 $217.0 $2,955.0 $0.0 $951.0 $3,649.1 $75,200.2 5.18% 6.25%
2010 $213.4 $2,899.2 $0.0 $1,147.2 $3,632.7 $80,798.2 4.77% 5.75%
2011 $201.0 $2,993.0 $0.0 $1,310.0 $4,700.1 $87,382.3 TBD 5.75%
Source: OPM Valuation as of September 30, 2010. The FY 2011 values are projections, and the FY 2011 employer
contribution includes $911 million that was not paid until FY 2012.
10/34
www.haygroup.com
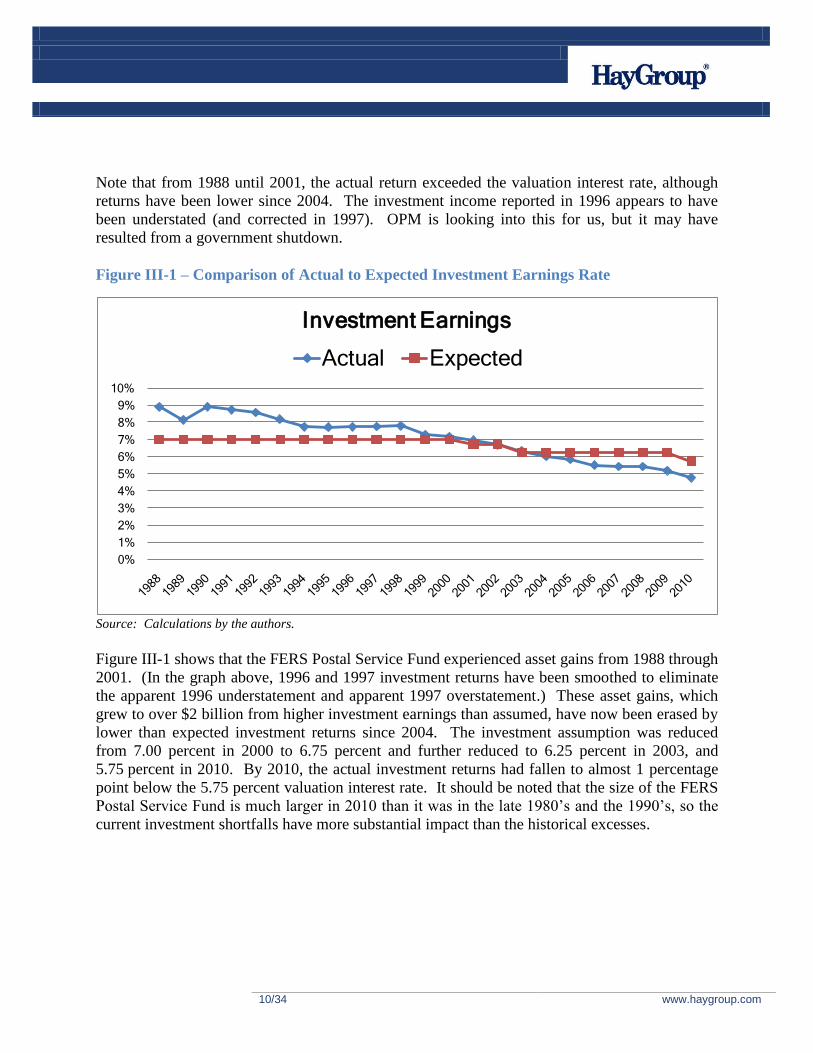
Note that from 1988 until 2001, the actual return exceeded the valuation interest rate, although
returns have been lower since 2004. The investment income reported in 1996 appears to have
been understated (and corrected in 1997). OPM is looking into this for us, but it may have
resulted from a government shutdown.
Figure III-1 – Comparison of Actual to Expected Investment Earnings Rate
0%
1%
2%
3%
4%
5%
6%
7%
8%
9%
10%
Investment Earnings
Actual Expected
Source: Calculations by the authors.
Figure III-1 shows that the FERS Postal Service Fund experienced asset gains from 1988 through
2001. (In the graph above, 1996 and 1997 investment returns have been smoothed to eliminate
the apparent 1996 understatement and apparent 1997 overstatement.) These asset gains, which
grew to over $2 billion from higher investment earnings than assumed, have now been erased by
lower than expected investment returns since 2004. The investment assumption was reduced
from 7.00 percent in 2000 to 6.75 percent and further reduced to 6.25 percent in 2003, and
5.75 percent in 2010. By 2010, the actual investment returns had fallen to almost 1 percentage
point below the 5.75 percent valuation interest rate. It should be noted that the size of the FERS
Postal Service Fund is much larger in 2010 than it was in the late 1980’s and the 1990’s, so the
current investment shortfalls have more substantial impact than the historical excesses.
11/34
www.haygroup.com
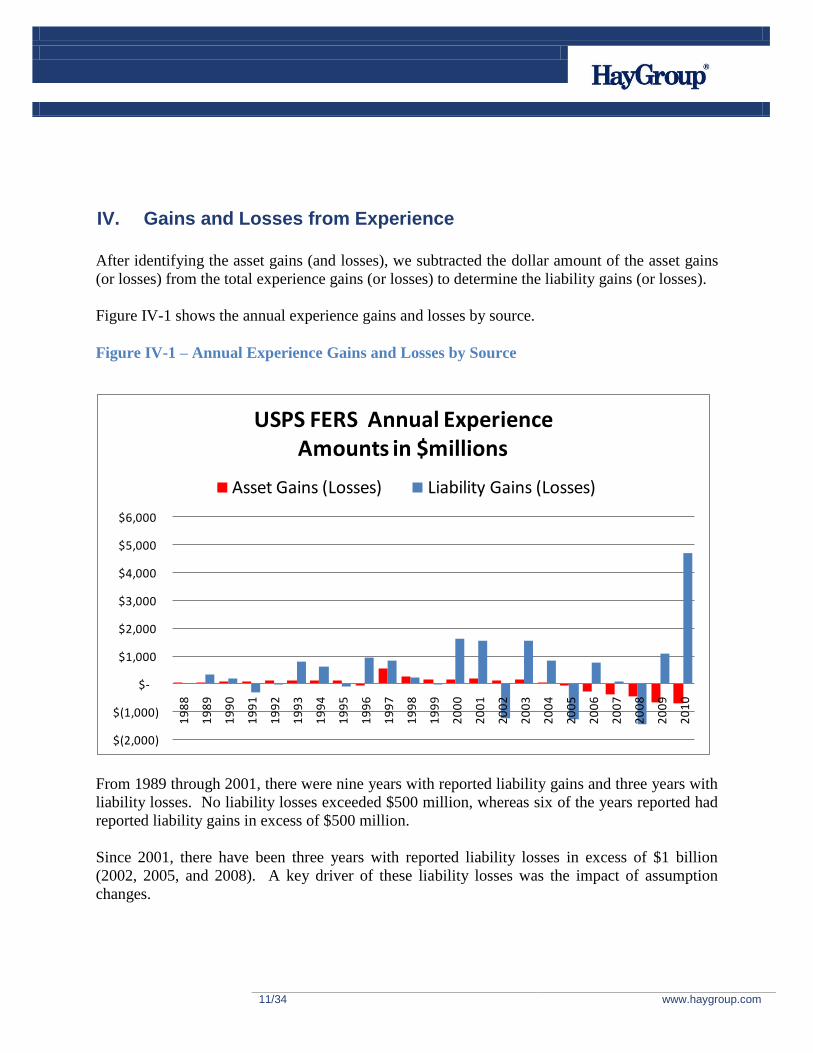
IV. Gains and Losses from Experience
After identifying the asset gains (and losses), we subtracted the dollar amount of the asset gains
(or losses) from the total experience gains (or losses) to determine the liability gains (or losses).
Figure IV-1 shows the annual experience gains and losses by source.
Figure IV-1 – Annual Experience Gains and Losses by Source
$(2,000)
$(1,000)
$-
$1,000
$2,000
$3,000
$4,000
$5,000
$6,000
19
88
19
89
19
90
19
91
19
92
19
93
19
94
19
95
19
96
19
97
19
98
19
99
20
00
20
01
20
02
20
03
20
04
20
05
20
06
20
07
20
08
20
09
20
10
USPS FERS Annual Experience Amounts in $millions
Asset Gains (Losses) Liability Gains (Losses)
From 1989 through 2001, there were nine years with reported liability gains and three years with
liability losses. No liability losses exceeded $500 million, whereas six of the years reported had
reported liability gains in excess of $500 million.
Since 2001, there have been three years with reported liability losses in excess of $1 billion
(2002, 2005, and 2008). A key driver of these liability losses was the impact of assumption
changes.

12/34
www.haygroup.com
The interest rate was reduced from 7.00 percent to 6.75 percent in 2001, first reflected in the
2002 valuation; reduced again in the 2004 valuation to 6.25 percent. In 2007, the inflation
assumption and salary increase assumption were each increased by 25 basis points.
Figure IV-2 – Cumulative Experience Gains or Losses by Source
$(2,000)
$-
$2,000
$4,000
$6,000
$8,000
$10,000
$12,000
19
88
19
89
19
90
19
91
19
92
19
93
19
94
19
95
19
96
19
97
19
98
19
99
20
00
20
01
20
02
20
03
20
04
20
05
20
06
20
07
20
08
20
09
20
10
USPS FERS Cumulative Experience Gains (Losses)Amounts in $millions
Assets Liability
Figure IV-2 shows the cumulative experience gains and losses by source. As shown in Figure
IV-1, the system had asset gains from inception through 2001. The lower than assumed
investment returns since 2004 have erased the cumulative asset gains. By 2010, the cumulative
asset performance was a small loss. In contrast, from 1988 through 1992, the system had
cumulative liability losses. Since 1993, the system has had cumulative liability experience gains.
Since 2000, the Postal Service Fund has had combined liability and asset gains of over $5 billion,
and by 2010 they increased to over $11 billion. Liability gains could result from more favorable
experience than assumed for salary growth, inflation, or demographic behavior.

13/34
www.haygroup.com
V. Pay Analysis
In general the pension awarded to any individual FERS employee is dependent on that
individual’s annual salaries just prior to retirement. Higher annual salaries will result in a larger
retirement benefit for an individual and, as such, a larger overall FERS liability.
In calculating the FERS liability, the OPM valuations used the assumed annual rate of general
salary increases approved by the Board of Actuaries plus a merit increase assumption developed
from actual experience. General salary increases are those granted to everyone and not
attributable to merit.
General Salary Increases
We performed an analysis to determine whether historical OPM general salary increase
assumptions were reasonable, compared to actual USPS general increases granted. This analysis
was performed for the period of 1/1/2002 through 1/1/2011.
We reviewed the OPM assumptions for annual general increases in pay.3 OPM historically
assumed general salary increases ranging from 3.75 percent annually to 4.25 percent annually
during our study period. The average annual growth assumption, for the time period studied,
was 4.11 percent. Table V-1 below shows the general salary increase assumptions used by
OPM. The dates shown are the dates on which an assumption was changed.
TableV-1
General Salary Increase
Assumption Used by OPM
Date Salary
Growth
03/16/01 4.25%
05/08/03 4.00%
06/08/06 4.25%
06/11/10 3.75%
3 The data provided included the salary increase assumption and a corresponding date of implementation. However, the data did
not show the OPM valuation for which the assumption was effective. We have assumed that all changes in the assumptions
were effective the following January 1.

14/34
www.haygroup.com
Hay Group was provided with actual pay increases equivalent to general salary increases for
NALC, NRLCA, APWU, and NPMHU union members, for the period from 2002 through 2010.4
Based on our analysis of the data, we have found that annual pay increases for the unions ranged
from a high of 3.41 percent for NRLCA, to a low of 2.77 percent for APWU. Based on these
results, we have determined that the general salary increases assumed by OPM are higher than
the actual pay increases awarded. This has resulted in OPM overestimating the salaries of USPS
employees and, as such, the FERS liability.
Figure V-1 below shows the average annual pay increases for the four major unions as well as
the average OPM assumption.
Figure V-1
3.41%
3.34%
3.03%
2.77%
4.11%
0.00% 0.50% 1.00% 1.50% 2.00% 2.50% 3.00% 3.50% 4.00% 4.50%
NRLCA
NPMHU
NALC
APWU
Assumption
Annualized Percentage Pay Increases 1/1/2002 to 1/1/2011
4 The pay increase data received for each union began with an increase at some time in 2002 and ended with an increase in
either 2010 or 2011. In order to perform a consistent analysis of pay increases, we required data for a uniform time period for
all unions. To this end, we assumed that the data included all 2002 increases. We did not include 2011 pay increases in our
analysis, as some unions did not have 2011 pay increase data shown. Therefore, our analysis was performed for the period of
1/1/2002 through 1/1/2011.

15/34
www.haygroup.com
Figure V-1 shows that over the last decade, USPS pay increases have been significantly lower
than the FERS valuation assumption. The APWU bargaining unit has the largest enrollment and
the NALC unit the second largest enrollment.
Other Salary Increases
We also reviewed differences in the step structure for USPS and federal employees. USPS Craft
employees tend to go through fewer steps in their pay schedules and therefore employees reach
the top of their pay schedule earlier in their careers than do federal employees. The OPM
assumptions anticipate that Craft employees will continue to receive step pay increases in line
with the federal pay schedule. For example, an employee hired at age 25 reaches the top of the
USPS pay steps at age 37. OPM’s valuation assumes step increases for the employee throughout
the rest of his or her career at a rate of about 1 percent per year. In reality, USPS would likely
only be granting cost-of-living adjustments and small contractual pay increases.
OPM actuaries have the Craft pay schedules, but do not have employee counts by Craft.
Therefore, OPM has been unable to develop a separate USPS-specific salary assumption.
Currently, 70 percent of FERS Craft employees have reached the top of their pay schedule. (See
Appendix C for more information.)
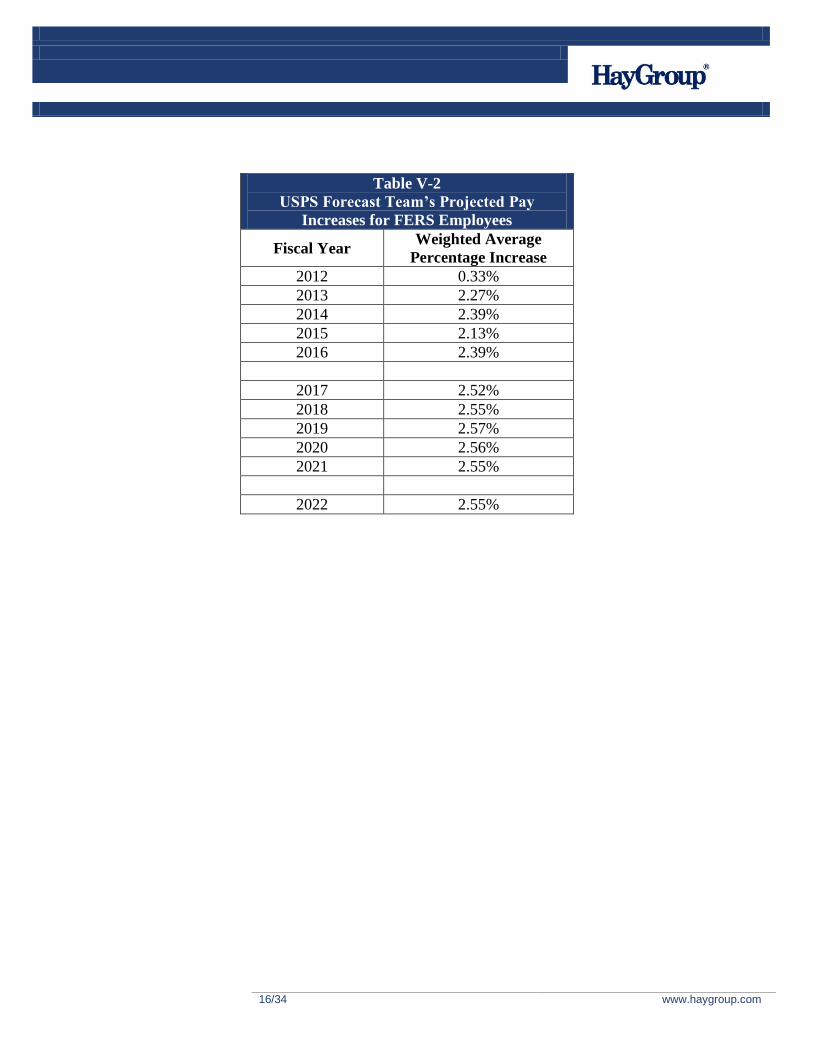
Assumptions for USPS-Specific Projections
To reflect this experience, we incorporated a lower salary growth assumption into our USPS-
specific projection in Section IX. In order to estimate the impact of the difference between
USPS’s expected future pay increases and the pay increase levels assumed in the OPM FERS
valuations, we have utilized the 11-year projection of expected future pay increases shown in
Table V-2, which was prepared by USPS’s expense forecasting team.
These weighted average pay increases take into account contractual increases (some known,
some estimated), step increases and COLA increases (across-the-board increases, generally
reflective of inflation). This forecast does not reflect pay increases in connection with
promotions. Therefore, for purposes of our analysis, to capture the weighted average impact of
promotions, we have added to each of these forecasted increase levels another 0.10 percent.
Based upon our discussions with Postal Service representatives, 0.10 percent is a conservative
estimate for this purpose. In our USPS-specific projection, these estimates were used together in
place of OPM’s general salary growth and merit growth assumptions.
16/34
www.haygroup.com
Table V-2
USPS Forecast Team’s Projected Pay
Increases for FERS Employees
Fiscal Year Weighted Average
Percentage Increase
2012 0.33%
2013 2.27%
2014 2.39%
2015 2.13%
2016 2.39%
2017 2.52%
2018 2.55%
2019 2.57%
2020 2.56%
2021 2.55%
2022 2.55%

17/34
www.haygroup.com
VI. COLA Analysis
Another source of experience gains is lower than expected inflation. After retirement, FERS
annuitants over age 62 receive annual cost-of-living adjustments (COLAs). The increases are
based on the Consumer Price Index (CPI), quarter ending September 30, and are applied
effective the following January 1.
When inflation is less than 2.00 percent the COLA is the actual rate of inflation. When inflation
is between 2.0 percent and 3.00 percent, the COLA is 2.00 percent. When inflation is over 3.00
percent, the COLA is the actual rate of inflation less 1.00 percentage point. USPS FERS retirees
receive the same COLA as Federal FERS retirees.
Figure VI-1 – Comparison of Actual to Expected COLA
0.0%
1.0%
2.0%
3.0%
4.0%
5.0%
6.0%
19
88
19
89
19
90
19
91
19
92
19
93
19
94
19
95
19
96
19
97
19
98
19
99
20
00
20
01
20
02
20
03
20
04
20
05
20
06
20
07
20
08
20
09
20
10
20
11
FERS Retiree COLA
Actual Increase Assumption
Figure VI-1 shows that since FERS was established through 2011, the actual COLA granted has
exceeded the valuation assumption three times and has been less than the assumption 21 times.
18/34
www.haygroup.com
When COLAs are smaller than assumed, annuities increase less than projected. The remeasured
liability is lower than expected, resulting in an increase in the surplus. Since the COLA is the
same for Postal Service and non-postal FERS participants, the entire FERS fund experiences
gains from lower than expected COLAs.
The inflation assumption is set by the Civil Service Retirement and Disability Fund (CSRDF)5
Board of Actuaries and was last changed effective June, 2010 when it was reduced from 3.50
percent to 3.00 percent. The FERS COLA assumption, which accounts for year to year
fluctuation around the long-term rate, is 80 percent of the inflation assumption, so the current
assumption is 2.40 percent.
5 CSRDF includes both the Civil Service Retirement System and the Federal Employees Retirement System.

19/34
www.haygroup.com
VII. USPS Demographic Experience
Experience gains (losses) can occur when demographic experience is different than expected.
Hay Group conducted an actuarial investigation (“Experience Analysis”) on the USPS FERS
population in 2010 to see how it differed from the total FERS population. Individual data on all
FERS members employed by USPS were gathered for nine snapshot annual dates, covering eight
years of elapsed time. Also, an additional file was provided for each year that documented the
Nature of Action for any active employee who separated between the snapshot dates.
A history for each member in the study was created for active employee’s status on each of the
nine snapshot dates. If the member was not yet hired, the status was blank. If the member was
actively employed or had separated, then a code was used to indicate the status of that member.
In the case of members who terminated during the study and then were rehired, the record
indicated active status in the earlier years then a termination status up until the member was
rehired. The first snapshot date following rehire then indicated that the member was active.
By stringing together the statuses for each employee, we were able to run the data through
Access programs to summarize all actual and expected occurrences in the data plus counts of all
members exposed to the valuation decrements. These actual counts, expected counts, and
exposure were then compiled and analyzed to compare to the FERS valuation assumptions, as
well as develop USPS specific assumptions.
All USPS specific rates were developed to be consistent with OPM rates. For example, if the
OPM rates were age and service based, then the USPS rates were developed to mirror the age
and service based rate format.
The actuarial investigation reviewed the following elements:
1. Distribution of new entrants by age, sex, and service;
2. Withdrawal rates;
3. Normal retirement rates;
4. Involuntary retirement rates;
5. Disability retirement rates;
6. Early retirement rates;
7. Employee death rates;
Development of demographic actuarial assumptions begins with the analysis of actual experience
to expected experience, and the calculation of the actual-to-expected ratio. The actual-to-
expected ratio gives a measure of how closely the assumption predicted what actually happened.

20/34
www.haygroup.com
If the actual-to-expected ratio is greater than 100 percent, then the actuarial assumption under-
predicted; if the actual-to-expected ratio is less than 100 percent, then the assumption over-
predicted the number of occurrences.
Figure VII-1 – Comparison of USPS Demographic Experience to OPM Assumptions
152%
136%
103%
102%
95%
68%
0% 20% 40% 60% 80% 100% 120% 140% 160%
Disability
Mortality
Involuntary Retirement
Normal Retirement
Early Retirement
Withdrawal
USPS Demographic Experience 2001-2009
Ratio of Actual to Assumption
The chart shows that the USPS withdrawal (voluntary turnover) rate was materially lower than
assumed. When withdrawal is lower than assumed, more employees remain employed and a
higher percent of employees vest in their benefits, resulting in a higher cost and therefore an
actuarial loss.
The retirement rates are in line with the overall FERS assumption, with the exception of slightly
lower rates for early retirement.
The in-service mortality rate is materially higher than the assumption, however OPM includes
margin for expected mortality improvement in its valuation assumption. Moreover, this assumption
has the smallest impact on liabilities for active employees of those shown.
The rate of disability retirement is over fifty percent higher than assumed.

21/34
www.haygroup.com
To determine the effect of using USPS-specific demographic data, we incorporated USPS-
specific assumptions in our projection in Section IX. The overall effect was to slightly reduce the
Postal Service’s liability.
22/34
www.haygroup.com
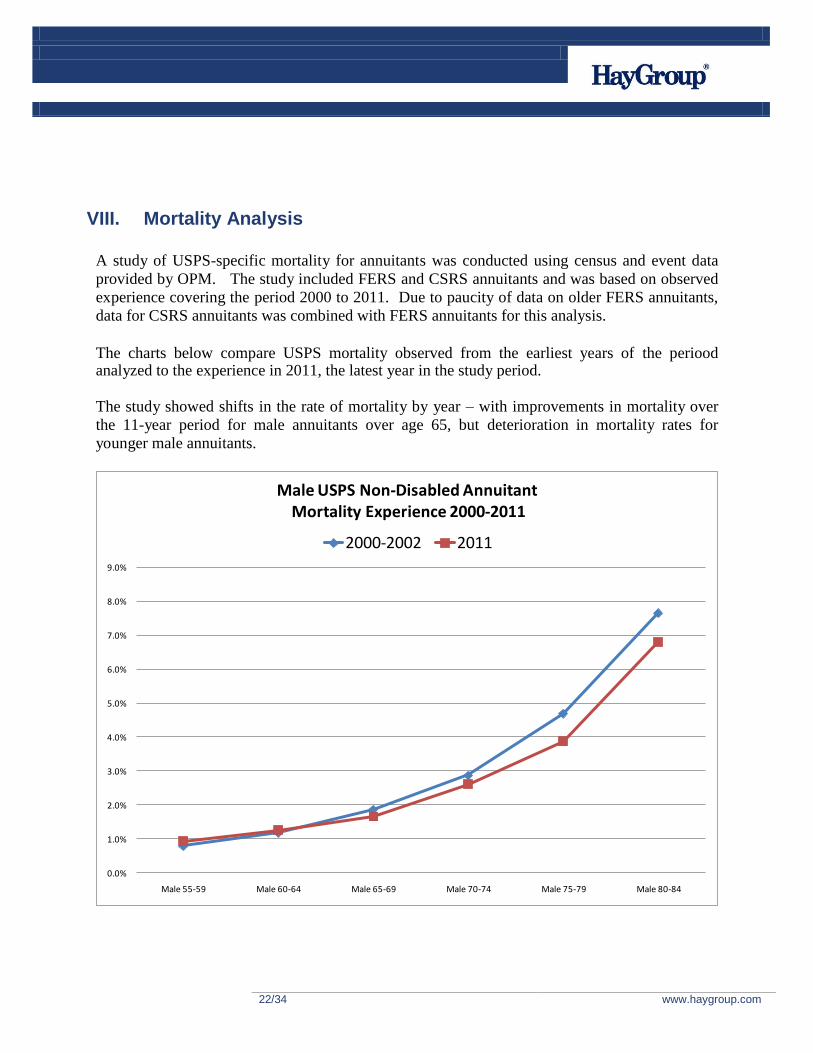
VIII. Mortality Analysis
A study of USPS-specific mortality for annuitants was conducted using census and event data
provided by OPM. The study included FERS and CSRS annuitants and was based on observed
experience covering the period 2000 to 2011. Due to paucity of data on older FERS annuitants,
data for CSRS annuitants was combined with FERS annuitants for this analysis.
The charts below compare USPS mortality observed from the earliest years of the periood analyzed to the experience in 2011, the latest year in the study period.
The study showed shifts in the rate of mortality by year – with improvements in mortality over
the 11-year period for male annuitants over age 65, but deterioration in mortality rates for
younger male annuitants.
0.0%
1.0%
2.0%
3.0%
4.0%
5.0%
6.0%
7.0%
8.0%
9.0%
Male 55-59 Male 60-64 Male 65-69 Male 70-74 Male 75-79 Male 80-84
Male USPS Non-Disabled AnnuitantMortality Experience 2000-2011
2000-2002 2011

23/34
www.haygroup.com
For females, the study showed a small improvement in mortality rates at ages under 65, no
material improvement at ages 65-74 and a small improvement at ages 75-79, with larger
improvement at the older ages.
Based on the observed rates and the pattern of mortality changes over the past 11 years, we
projected continued improvements at ages where we had seen improvements and stable rates for
ages where mortality rates had increased. This projected set of rates was smoothed to develop
the USPS specific mortality table.
This process (evaluation of historical changes and projection of future improvements) mirrors the
process used by the OPM Office of the Actuary in developing the FERS and CSRS annuitant
mortality rates.
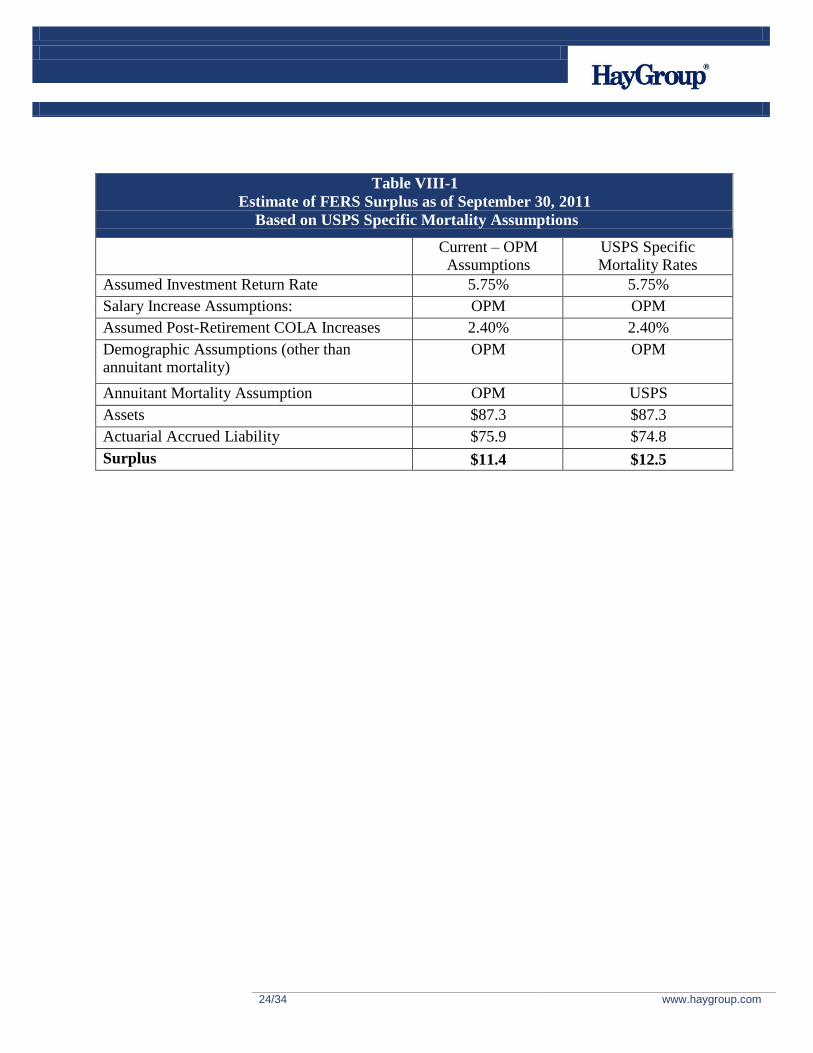
We applied the OPM mortality rates to the current annuitant data set and calibrated the results to
match the OPM valuation report on USPS FERS liability. We then applied the USPS specific
mortality rates to the annuitant and active employee census data. The table below shows the
impact of measuring the liability using the USPS specific mortality rates is a decrease in the
Actuarial Accrued Liability of 1.4 percent.
0.0%
1.0%
2.0%
3.0%
4.0%
5.0%
6.0%
Female 55 - 59 Female 60 - 64 Female 65 - 59 Female 70 - 74 Female 75 - 59 Female 80 - 84
Female USPS Non-Disabled Annuitant -
Mortality Experience 2000 - 2011
2000 - 2002 2011
24/34
www.haygroup.com
Table VIII-1
Estimate of FERS Surplus as of September 30, 2011
Based on USPS Specific Mortality Assumptions
Current – OPM Assumptions
USPS Specific Mortality Rates
Assumed Investment Return Rate 5.75% 5.75%
Salary Increase Assumptions: OPM OPM
Assumed Post-Retirement COLA Increases 2.40% 2.40%
Demographic Assumptions (other than annuitant mortality)
OPM OPM
Annuitant Mortality Assumption OPM USPS
Assets $87.3 $87.3
Actuarial Accrued Liability $75.9 $74.8
Surplus $11.4 $12.5

25/34
www.haygroup.com
IX. Projection of Surplus Using USPS-Specific Assumptions
To show the effect of using USPS-specific assumptions, we developed a projection of the FERS
surplus as of September 30, 2011. To be consistent with the current OPM economic assumptions
(most recently approved by the CSRDF Board of Actuaries), our FERS surplus estimates have
been based upon an interest rate of 5.75 percent and a post-retirement COLA increase rate of
2.40 percent per year.
To estimate the impact of the lower (versus those assumed by OPM) expected future USPS pay
increases, we have assumed overall FY 2012 through FY 2022 pay increases in accordance with
USPS’s forecast (as shown in Table V-2 above), plus the 0.10 percent adjustment for promotion
increases. For fiscal years 2023 and beyond, we have assumed USPS pay increase levels will be
consistent with those assumed by OPM general salary increases, no future step increases will be
applied, however we included the 0.10 percent adjustment for promotions. Using these USPS
specific salary increases, the Actuarial Accrued Liability is remeasured as $65.0 billion, a
decrease of $10.9 billion.
We also consider the Postal Service’s past demographic experience. Based upon Hay Group’s
Experience Study of Postal Service’s FERS population, we did see that USPS’s past
demographic experience (turnover, retirement, etc.) differed somewhat from what would have
been expected under OPM’s demographic assumptions. Using our USPS-specific demographic
assumptions in place of the OPM demographic assumptions, in fact, gives rise to a $0.9 billion
reduction in the FERS liability, and a slightly higher FERS surplus.
In addition to the demographic experience study, which examined the turnover, disability, and
retirement experience of employees, we also studied the mortality experience of non-disabled
annuitants. The study was based on an analysis of actual deaths covering the period 2000 to
2011. The remeasurement based on USPS mortality experience reduces the Actuarial Accrued
Liability by $0.8 billion.
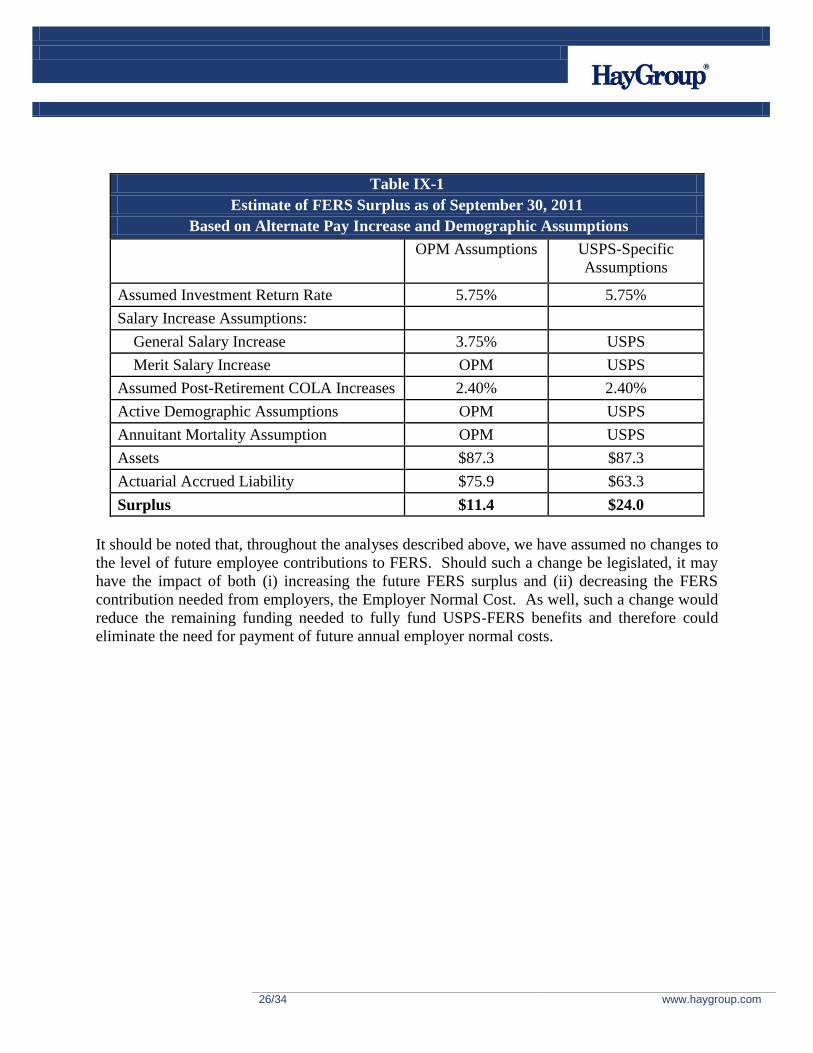
Table IX-I compares the FERS surplus as currently measured to the remeasured surplus using
USPS-specific assumptions. Whereas the current OPM FERS surplus measure of $11.4 billion
represents about 17 percent of annual Postal Service revenues and about 15 percent of the USPS
FERS liability, the revised FERS surplus estimate of $24.0 billion represents over 35 percent of
annual Postal Service revenues and over 37 percent of the USPS FERS liability.
26/34
www.haygroup.com
Table IX-1
Estimate of FERS Surplus as of September 30, 2011
Based on Alternate Pay Increase and Demographic Assumptions
Amounts in $Billions OPM Assumptions USPS-Specific
Assumptions
Assumed Investment Return Rate 5.75% 5.75%
Salary Increase Assumptions:
General Salary Increase 3.75% USPS
Merit Salary Increase OPM USPS
Assumed Post-Retirement COLA Increases 2.40% 2.40%
Active Demographic Assumptions OPM USPS
Annuitant Mortality Assumption OPM USPS
Assets $87.3 $87.3
Actuarial Accrued Liability $75.9 $63.3
Surplus $11.4 $24.0
It should be noted that, throughout the analyses described above, we have assumed no changes to
the level of future employee contributions to FERS. Should such a change be legislated, it may
have the impact of both (i) increasing the future FERS surplus and (ii) decreasing the FERS
contribution needed from employers, the Employer Normal Cost. As well, such a change would
reduce the remaining funding needed to fully fund USPS-FERS benefits and therefore could
eliminate the need for payment of future annual employer normal costs.
27/34
www.haygroup.com
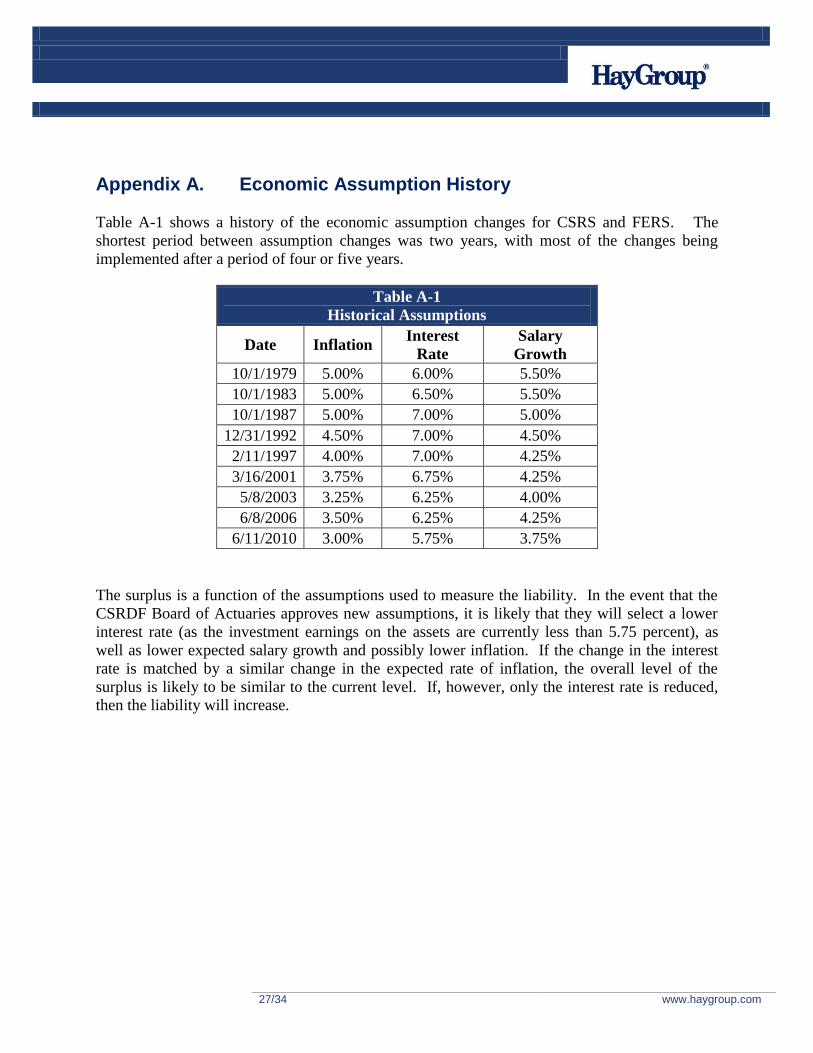
Appendix A. Economic Assumption History
Table A-1 shows a history of the economic assumption changes for CSRS and FERS. The
shortest period between assumption changes was two years, with most of the changes being
implemented after a period of four or five years.
Table A-1
Historical Assumptions
Date Inflation Interest
Rate
Salary
Growth
10/1/1979 5.00% 6.00% 5.50%
10/1/1983 5.00% 6.50% 5.50%
10/1/1987 5.00% 7.00% 5.00%
12/31/1992 4.50% 7.00% 4.50%
2/11/1997 4.00% 7.00% 4.25%
3/16/2001 3.75% 6.75% 4.25%
5/8/2003 3.25% 6.25% 4.00%
6/8/2006 3.50% 6.25% 4.25%
6/11/2010 3.00% 5.75% 3.75%
The surplus is a function of the assumptions used to measure the liability. In the event that the
CSRDF Board of Actuaries approves new assumptions, it is likely that they will select a lower
interest rate (as the investment earnings on the assets are currently less than 5.75 percent), as
well as lower expected salary growth and possibly lower inflation. If the change in the interest
rate is matched by a similar change in the expected rate of inflation, the overall level of the
surplus is likely to be similar to the current level. If, however, only the interest rate is reduced,
then the liability will increase.

28/34
www.haygroup.com
Appendix B. FERS Census Data
Categorization of Employees by Retirement System
USPS provided Hay Group with data for each union, by pay grade and career level. This data
was further broken out by retirement code. USPS also provided a description of each of the
retirement codes. Using the provided retirement codes and their corresponding descriptions, Hay
Group categorized employees as either CSRS or FERS participants. Table B-1 below shows
Hay Group’s assignment of retirement system to employees for each of the provided retirement
codes.
Table B-1
Assignment of Retirement System by Retirement Code
Retirement
Code Description
Hay Group
Categorization
1 CSRS- Initial Appointment Prior To 1/1/84 CSRS
2 FICA (Non Career) None
3 CSRS - Postal Inspectors CSRS
4 Excluded (Subject To Medicare) None
5 CSRS Offset (Meets “Five Year Test”) CSRS
6 CSRS Offset - Inspectors (Meets “Five Year
Test”) CSRS
7 CSRS - Postal Rate Commission CSRS
8 FERS FERS
9 FERS - Postal Inspectors FERS
A Converted From CSRS To FERS - Regular
Employees (Frozen CSRS Service) FERS
B Converted From CSRS To FERS - Postal
Inspectors (Frozen CSRS Service) FERS

29/34
www.haygroup.com
Table B-2 shows a summary of the FERS employee population by age and length of service.
Table B-2
FERS Employee Census by Age and Years of Service
Age
Years of Service
Under
10 10 - 14 15 - 19 20 - 24 25-29 30 – 34 35 - 39 40+ Total
< 20 2 - - - - - - - 2
20 -24 454 - - - - - - - 454
25 - 29 7,521 74 - - - - - - 7,595
30 - 34 16,915 5,033 67 - - - - - 22,015
35 - 39 17,140 17,157 6,071 67 - - - - 40,435
40 - 44 18,474 22,837 18,421 6,827 389 - - - 66,948
45 - 49 18,735 21,507 19,403 25,198 17,651 240 - - 102,734
50 - 54 16,436 21,595 17,728 25,839 33,589 3,419 91 - 118,697
55 - 59 10,706 16,389 15,458 18,626 23,780 3,065 665 10 88,699
60 - 64 5,278 7,982 9,459 9,649 11,762 1,469 317 72 45,988
65 - 69 1,415 1,980 2,173 2,240 2,311 336 58 34 10,547
70 - 74 289 403 386 373 413 45 15 14 1,938
75 + 71 71 88 130 118 12 4 12 506
Total 113,436 115,028 89,254 88,949 90,013 8,586 1,150 142 506,558
30/34
www.haygroup.com
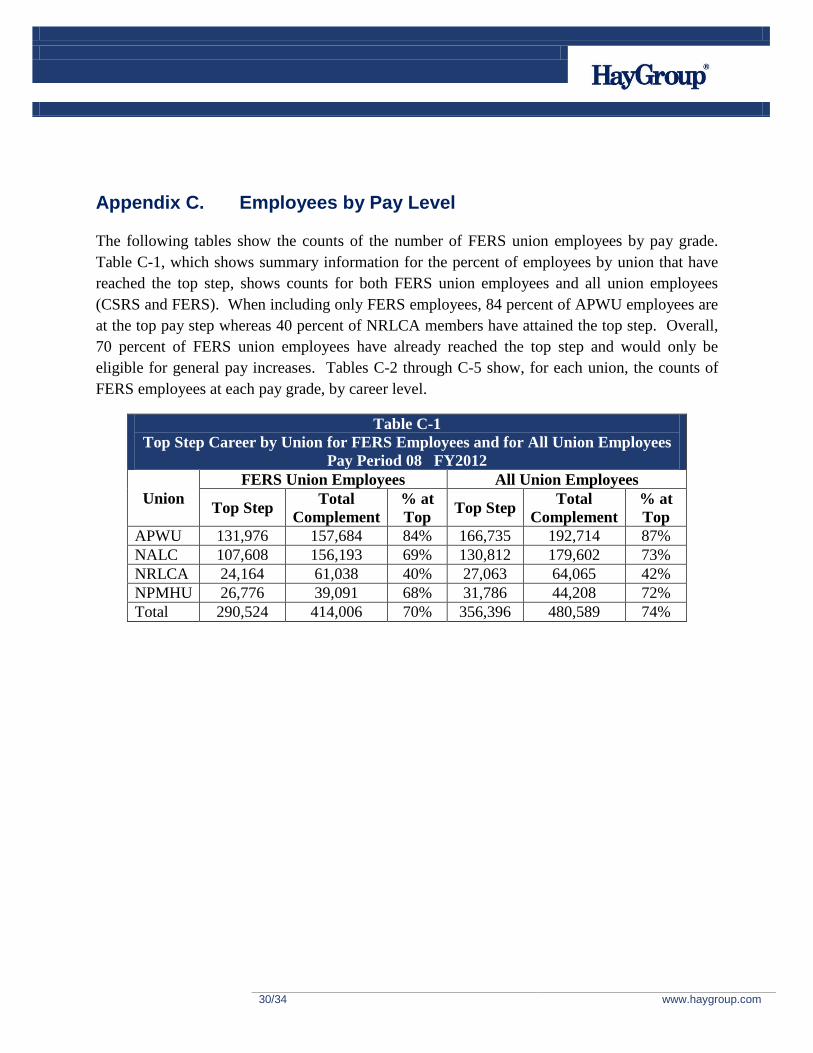
Appendix C. Employees by Pay Level
The following tables show the counts of the number of FERS union employees by pay grade.
Table C-1, which shows summary information for the percent of employees by union that have
reached the top step, shows counts for both FERS union employees and all union employees
(CSRS and FERS). When including only FERS employees, 84 percent of APWU employees are
at the top pay step whereas 40 percent of NRLCA members have attained the top step. Overall,
70 percent of FERS union employees have already reached the top step and would only be
eligible for general pay increases. Tables C-2 through C-5 show, for each union, the counts of
FERS employees at each pay grade, by career level.
Table C-1
Top Step Career by Union for FERS Employees and for All Union Employees
Pay Period 08 FY2012
Union
FERS Union Employees All Union Employees
Top Step Total
Complement
% at
Top Top Step
Total
Complement
% at
Top
APWU 131,976 157,684 84% 166,735 192,714 87%
NALC 107,608 156,193 69% 130,812 179,602 73%
NRLCA 24,164 61,038 40% 27,063 64,065 42%
NPMHU 26,776 39,091 68% 31,786 44,208 72%
Total 290,524 414,006 70% 356,396 480,589 74%

31/34
www.haygroup.com
APWU
There are 157,684 FERS employees in the APWU. Of these, 131,976 or 84 percent are at the top step.
Table C-2
APWU
FERS Employees by Pay Grade and Career Level
Level FF EE BB AA A B C D E F G H I J K L M N O P
3 - - - - - - 2 2 7 9 7 7 1 3 8 4 10 5 224 -
4 - - 1 1 - 11 24 148 286 182 297 263 145 137 149 308 402 401 7,568 -
5 349 - - - - - 2 2 6 18 21 34 136 131 23 40 135 31 1,229 -
6 3 1 - - 5 2 7 16 37 691 1,690 1,114 2,104 3,156 2,989 1,593 691 348 86,414 -
7 1 - - - 4 13 29 45 55 144 187 157 227 299 252 185 143 172 20,761 -
8 18 2 - - - 5 3 6 8 47 122 214 196 282 220 258 217 140 4,994 -
9 - - - - - - - 29 67 84 155 140 141 245 242 226 216 311 396 5,665
10 - - - - - - - 8 23 56 62 104 133 206 175 216 206 200 218 5,057
11 - - - - - - - - - - - - - 1 - - - 1 1 64
Total 371 3 1 1 9 31 67 256 489 1,231 2,541 2,033 3,083 4,460 4,058 2,830 2,020 1,609 121,805 10,786
32/34
www.haygroup.com
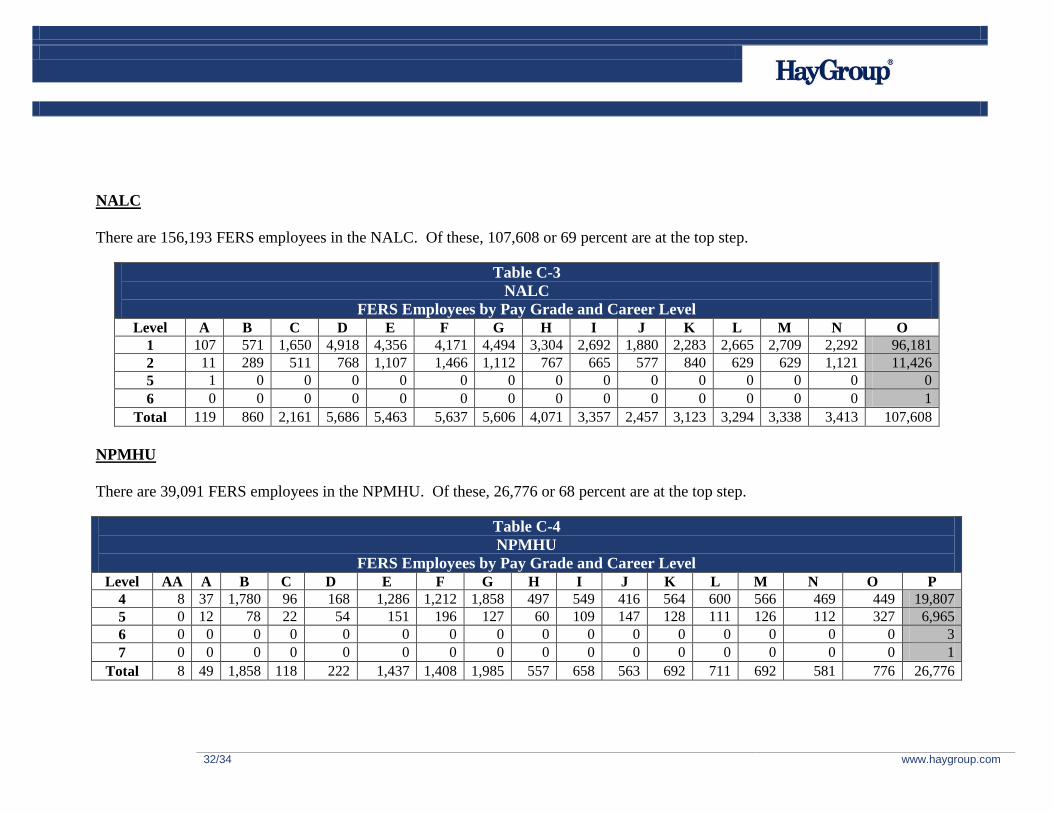
NALC
There are 156,193 FERS employees in the NALC. Of these, 107,608 or 69 percent are at the top step.
Table C-3
NALC
FERS Employees by Pay Grade and Career Level
Level A B C D E F G H I J K L M N O
1 107 571 1,650 4,918 4,356 4,171 4,494 3,304 2,692 1,880 2,283 2,665 2,709 2,292 96,181
2 11 289 511 768 1,107 1,466 1,112 767 665 577 840 629 629 1,121 11,426
5 1 0 0 0 0 0 0 0 0 0 0 0 0 0 0
6 0 0 0 0 0 0 0 0 0 0 0 0 0 0 1
Total 119 860 2,161 5,686 5,463 5,637 5,606 4,071 3,357 2,457 3,123 3,294 3,338 3,413 107,608
NPMHU
There are 39,091 FERS employees in the NPMHU. Of these, 26,776 or 68 percent are at the top step.
Table C-4
NPMHU
FERS Employees by Pay Grade and Career Level
Level AA A B C D E F G H I J K L M N O P
4 8 37 1,780 96 168 1,286 1,212 1,858 497 549 416 564 600 566 469 449 19,807
5 0 12 78 22 54 151 196 127 60 109 147 128 111 126 112 327 6,965
6 0 0 0 0 0 0 0 0 0 0 0 0 0 0 0 0 3
7 0 0 0 0 0 0 0 0 0 0 0 0 0 0 0 0 1
Total 8 49 1,858 118 222 1,437 1,408 1,985 557 658 563 692 711 692 581 776 26,776

33/34
www.haygroup.com
NRLCA
There are 61,038 FERS employees in the NRLCA. Of these, 24,164 or 40 percent are at the top step.
Table C-5
NRLCA
FERS Employees by Pay Grade and Career Level Level A B C 1 2 3 4 5 6 7 8 9 10 11 12
0 2,958 3,833 3,627 3,192 3,536 3,476 2,986 2,306 2,267 1,727 1,948 1,940 1,557 1,521 24,164
Total 2,958 3,833 3,627 3,192 3,536 3,476 2,986 2,306 2,267 1,727 1,948 1,940 1,557 1,521 24,164

34/34
www.haygroup.com
Actuarial Certification
USPS Office of Inspector General (OIG) retained the Hay Group to perform an analysis of the
USPS portion of the Civil Service Retirement and Disability Fund (CSRDF). The scope of this
assignment was limited to the Federal Employees Retirement System. Use of these results for
other purposes may not be appropriate.
This analysis has been conducted in accordance with generally accepted actuarial principles and
practices.
The results shown in this report are reasonable actuarial results. However, a different set of
results could also be considered reasonable actuarial results. The reason for this is that actuarial
standards of practice describe a "best-estimate range" for each assumption, rather than a single
best-estimate value. Thus, reasonable results differing from those presented in this report could
have been developed by selecting different points within the best-estimate ranges for various
assumptions.
The actuaries certifying to this report are members of the American Academy of Actuaries and
other professional actuarial organizations, and meet the General Qualification Standards of the
American Academy of Actuaries for purposes of issuing Statements of Actuarial Opinion.
Adam J. Reese, FSA, FCA, MAAA, EA
Craig Graby, FCA, MAAA, EA
October 12, 2012