Embed Size (px)
Citation preview

CAUSES OF MALNUTRITION AMONG CHILDREN 1–5 YEARS IN INFORMAL SETTLEMENTS,
WINDHOEK, NAMIBIA
Submitted in fulfillment of the requirements for the degree of
Masters of Public Healthof
the University of Namibia
BY
PHILOMENA OCHURUS
November 2007
Main Supervisor: Dr. L. Haoses-Gorases
Co-supervisor: Mrs. E. de Villiers
1

CAUSES OF MALNUTRITION AMONG CHILDREN 1 – 5 YEARS IN INFORMAL
SETTLEMENTS, WINDHOEK, NAMIBIA
PHILOMENA OCHURUS
NOVEMBER 2007
2

DECLARATION
I declare that “Causes of Malnutrition among children 1–5 years in Informal
Settlements in Windhoek, Namibia” is my own work and that all the sources that I
used were indicated and acknowledged by complete references.
____________
P. Ochurus
November 2007
3

ABSTRACTThis study was conducted during the month of May 2006 in the informal settlements
of Windhoek, Namibia. The aim of the study was to describe the prevalence of
malnutrition among children between the ages of one and five years and to correlate
possible causes, and other factors, with nutritional status.
A cross-sectional descriptive study design was chosen. The sample was comprised of
350 respondents, mothers or caregivers of children between one and five years,
residing in the non-formal settlements of Windhoek. Both urban and rural settlements
were included in the study.
Clusters coincided with the
enumeration areas (EA) pre-
determined for national census
taking. The sample size was chosen
to permit generalization of the
results to the population under
investigation.
Descriptive statistics were used to
analyse and present the data using
4

SPSS and EPINUT databases. Data
is presented in graphs and tables.
Three main indices were used to report the nutritional status of children: weight-for-
height (WH), height-for-age (HA) and weight-for-age (WA). The WH index
determines the wasting rate, which in this study was found to be 19.7%, and is
classified as “high”. The second indicator, HA, identifies stunting; it is caused by
chronic malnutrition. In this study the stunting rate, with and incidence of 28.8%, was
rated “medium”. The third indicator, WA, indicates an underweight condition. This
indicator is complex as it takes into account both stunting and wasting. The
underweight rate in the non-formal settlements was 35.7%, which is considered very
high.
Finally, recommendations were made based on the study’s findings.
KEYWORDS
Anthropometry
Food security
Informal settlement
Malnutrition
Nutritional status
Stunting
5

Underweight
Wasting
6

ACKNOWLEDGEMENTS
First and foremost, I wish to express my gratitude to my Heavenly Father for enabling
and carrying me through to the end of this study.
I would like to thank my research supervisors Dr. L. Haoses-Gorases and Mrs. E. de
Villiers. Without their support and guidance this study would not have been possible.
Special thanks are given to Ms. A. Kaduma who patiently encouraged and guided me
through the data analysis process.
My gratitude to Dr. F. Soroses and Ms. M. van Wyk is enormous for their assistance
with the analysis of the anthropometrical data.
I would also like to thank my editors, Ms. S. English, Peace Corps volunteer, and Don
Stevenson, who assisted in the preparation of the final document.
I would be remiss if I did not also mention my gratitude to the National Planning
Commission for providing aerial photographs, maps and also the anthropometrical
measuring tools.
My sincere gratitude to Sister L. Gaingos for her prayers and encouragement and
being available throughout the study.
Last but not least, I would like to thank the Ministry of Health, in particular the
National Health Training Center, for providing the research assistants.
To every one who contributed in any way, be that through prayer or other means of support,
May God Bless you.
7

DEDICATION
This work is dedicated to the Youth of Ebenezer Pentecostal Church, in particular
the Junior Youth Group. Let this be a source of inspiration to them. With God all
things are possible and one can excel both spiritually and academically.
8

ABBREVIATIONSACC Administrative Committee on Coordination
BMI Body Mass Index
CDC Center for Disease Control
CSA Central Statistics Authority
DHS Demographic and Health Surveys
EA Enumeration Area
EPINUT Data Analysis Program for Anthropometrical Measurements
FAO Food and Agriculture Organization of the United Nations
GDP Gross Domestic Product
HA Height for Age
HIV Human Immunodeficiency Virus
HW Height for Weight
MICS Multiple Indicator Surveys from UNICEF
MoHSS Ministry of Health and Social Services
NCHS National Center for Health Statistics
NPC National Planning Commission
SADC Southern Africa
Development Community SCN Sub-Committee on Nutrition (of the United Nations)
SPSS Data Analysis Software for the Social Sciences
VAD Vitamin A Deficiency
WA Weight for Age
WHO World Health Organization
9

TABLE of CONTENTS PAGEDECLARATION i
ABSTRACT ii
KEYWORDS iii
ACKNOWLEDGEMENTS iv
DEDICATION v
ABBREVIATIONS vi
Chapter 1Chapter 1ORIENTATION OF THE STUDY1.1 INTRODUCTION 1
1.1.1 Background to the Problem 4
1.1.2 Problem Statement 7
1.1.3 Research Questions 7
1.2. AIM AND OBJECTIVES 8
1.2.1 Aim 8
1.2.2. Specific Objectives 8
1.3. JUSTIFICATION OF THE STUDY 8
1.4 OPERATIONAL DEFINITIONS 9
1.5 OUTLINE OF RESEACH REPORT 11
1.6 SUMMARY 11
10

CHAPTER 2
LITERATURE REVIEW
2.1 INTRODUCTION 12
2.2 STUDIES CARRIED OUT IN
OTHER COUNTRIES 12
2.3 STUDIES CARRIED OUT IN
SUB-SAHARAN AFRICA AND
NAMIBIA 14
2.4 SUMMARY 18Chapter 3
RESEARCH METHODOLOGY3.1 INTRODUCTION 19
3.2 RESEARCH DESIGN 19
3.2.1 Quantitative Research 19
3.2.2 Descriptive Research 20
3.3. RESEACH METHODS 20
3.3.1 Study Population 20
3.3.1.1 Inclusion 21
3.3.1.2 Exclusion 21
3.3.2 Sampling 21
11

3.3.3. Sample Size 22
3.4 TRAINING OF RESEARCH ASSISTANTS AND PILOT STUDY 23
3.5 DATA COLLECTION 24
3.6 DATA ANALYSIS 24
3.7 ETHICAL CONSIDERATIONS 25
3.7.1 Permission 25
3.7.2 Right of Privacy and Participation 25
3.7.3 Anonymity 25
3.7.4 Confidentiality 26
3.7.5 Benefit 26
3.7.6 Reliability and Validity of Data 27
3.7.6.1 Validity 27
3.7.6.2 Reliability 27
3.8 SUMMARY 27
CHAPTER 4
DATA ANALYSIS AND DISCUSSION OF RESEARCH FINDINGS
4.1 INTRODUCTION 28
4.2 ANALYSIS AND DISCUSSION OF FINDINGS 28
4.2.1 General Information 28
4.2.2 Demographic Information 29
4.2.3 Household Morbidity and Elderly 32
4.2.4 Household Mortality 32
4.2.5 Food Consumption 33
4.2.6 Food Avoidances or Taboos 36
4.2.7 Food Distribution and Storage/Preservation in Household 37
4.2.8 Breastfeeding and Weaning 38
4.2.9 Household Food Security 40
4.2.10 Water and Sanitation 43
4.2.11 Nutritional Status and Anthropometrical Measurements 44
4.2.12 Childhood Morbidity during the Previous Two Weeks 47
4.3 SUMMARY 49
12

Chapter 5CONCLUSIONS, LIMITATIONS AND RECOMMENDATIONS 5.1 INTRODUCTION 51
5.2 CONCLUSION AND RECOMMENDATIONS ABOUT THE OBJECTIVES 51
5.3 LIMITATIONS 53
5.4 RECOMMENDATIONS 54
5.5 SUMMARY 55
6. REFERENCES 56
7. ANNEXURES
13

LIST OF TABLESTable 1.1 Trends of Nutritional Status of Children 0 – 5 Years in Philippines 4
Table 1.2 Comparison of Acute and Chronic Malnutrition 5
Table 1.3 Nutritional Status (Stunting Rates) by Region 6
Table 2.1 Dietary Energy Supplies in Namibia 17
Table 3.1 Population Distribution of Non-Formal Settlements 23
Table 4.1 Consumption of Carbohydrates 33
Table 4.2 Consumption of Protein 34
Table 4.3 Consumption of Fruits and Vegetables 35
Table 4.4 Consumption of Fats and Sugars 36
Table 4.5 Fluids Taken by the Child in the Last 24 Hours (n = 350) 39
Table 4.6 Solid Foods Taken by the Child in the Last 24 Hours (n = 350) 40
Table 4.7 Household Wealth/ Ownership of Livestock 43
Table 4.8 Sanitary Facilities 44
Table 4.9 Relative Prevalence of Low Anthropometric Values 45
Table 4.10 Nutritional Status by Location 46
Table 4.11 Childhood Morbidity during the Previous Two Weeks 47
Table 4.12 Health-Seeking Behaviour 48
14

LIST OF FIGURESFigure 4.1 Sample Strata 28
Figure 4.2 Gender of the Head of Household 29
Figure 4.3 Age of the Head of Household 30
Figure 4.4 Marital Status of the Head of Household 30
Figure 4.5 Length of Stay at Present Residence 31
Figure 4.6 Family Size 31
Figure 4.7 Number of Chronically Ill in the Household 32
Figure 4.8 Fluids Introduced within 72 Hours 38
Figure 4.9 Duration of Breastfeeding 39
Figure 4.10 Main Source of Food Supplies 41
Figure 4.11 Main Source of Income 41
Figure 4.12 Monthly Income 42
Figure 4.13 Vitamin A Status 47
15

LIST OF ANNEXURESAnnexure A: Letters to Stakeholders
Annexure B: Responses from Stakeholders
Annexure C: Questionnaire
Annexure D: City Map
Annexure E: Arial Photographs
ABBREVIATIONS
ACC - Administrative Committee on Coordination,
AIDS - Acquired immunodeficiency syndrome
BMI - Body mass index
CDC - Center for Disease Control
ECSA - Ethopia Central Statistics Authority
DHS - Demographic and Health Surveys
EA - Enumeration Area
FAO - Food and Agriculture Organization of the United Nations
GDP - Gross Domestic Product
HIV - Human Immunodeficiency Virus
16

MoHSS - Ministry of Health and
Social Services MICS - Multiple Indicator Surveys from UNICEF
NPC - National Planning Commision
SADC - Southern Africa
Development Community SCN - Sub-Committee on Nutrition (of the United Nations)
VAD - Vitamin A deficiency
WHO - World Health Organization
CHAPTER 1ORIENTATION OF THE STUDY1.1 INTRODUCTIONMalnutrition is a universal problem that affects myriads of people, especially children.
More than 150 million children of pre-school age in the world are underweight and
200 million have stunted growth. In addition, one out of four babies born in
developing countries has intrauterine growth retardation and is at risk of mental
impairment (Brown, 2000, p. 1). The Ministry of Foreign Affairs of the Netherlands
states in its Sectoral and Theme Policy Document of Development Cooperation that
“the contribution of malnutrition – even moderate malnutrition – to child mortality is
17

high: 56.0% of all deaths amongst children are associated with malnutrition”
(Randstad 1998, p. 7).
Sub-Saharan Africa is not excluded
from the urgent public health
problem of malnutrition and
governments and private
institutions need to act to ensure
that the region is productive and
self-reliant. The importance of
addressing malnutrition was
acknowledged by the South African
Minister of Health, Dr. Manto
Tshabalala-Msimang, in her
opening and closing speeches at the
Southern African Development
Community (SADC) ministerial
18

consultative meeting on nutrition
and HIV/AIDS. She reiterated the
importance of addressing nutrition
as one of the critical elements in
health programmes and health
interventions (Giraldo, 2003, p. 2).
Dr. Tshabalala-Msimang also noted
that a food and nutrition review of
the Commonwealth revealed that
about 40% of children under the
age of five years were reported to be
stunted and over 50% of the women
in the reproductive age group suffer
from iron deficiency in Eastern,
Central and Southern Africa.
19

Malnutrition is a major impediment
to socioeconomic development and
contributes to a vicious cycle of
underdevelopment, drastically
affecting already underprivileged
groups. It has long ranging effects
on health, learning ability and
productivity. Overall, one in six
households in Namibia is 100
kilometres or more from a
government hospital. The mean
time required to reach these
facilities is 76 minutes. People from
two out of three households report
that they must walk to the nearest
20

health facility. Because rural
households are situated farther
away from health facilities, it takes
longer to reach them (MoHSS, 2003,
p. 186). Namibia is a vast country situated in south-western Africa. It is bordered by South
Africa to the south, Botswana to the east and Angola and Zambia to the north. It
covers approximately 824 269 square kilometers. The topographic regions of Namibia
are the western coastal plain of the Namib Desert and the central plateau, which
stretches from the northern to the southern border and covers almost half of the
country.
Most of the country’s climate is arid and semi-arid in the southern, central and coastal
areas, changing to subtropical in the far north–east (Van Schalkwyk, 2004, p. 5).
Only 8% of the land surface in Namibia receives between 501 and 700 millimetres of
rain annually, while 22% of the land, mostly desert, receives less than 100 millimetres
annually. Namibia has the driest climate in Sub-Saharan Africa with a mean rainfall
of approximately 270 millimetres. There is a wide regional variation in annual
rainfall, from less than 20 millimetres in the western Namib, to more than 700
millimetres at the east end of the Caprivi strip (Sweet, 1998, p. 70).
Food production in Namibia is
influenced by natural rainfall, and
national cereal production
21

fluctuates according to rainfall
patterns. The cultivation of rain-fed
crops is regionally concentrated and
is mainly confined to the northern
communal areas, though a small but
significant area of commercial
maize production is found in the so-
called maize triangle, that is, Otavi,
Tsumeb and Grootfontein area. The
country depends mainly on imports
to ensure food security for its
inhabitants. Considering the
country as a whole, food availability
seems not to be a major problem.
However, food security is
22

problematic in a number of
households due to unemployment,
low farming outputs, and the impact
of HIV/AIDS (Sweet, 1998, p. 3). The Khomas region is the most centrally located and is also the region where the
nation’s capital is situated. It covers a total area of 37 007 square kilometres.
According to the Population and Housing Census (NPC, 2003, p. 4), the total
population of Namibia is approximately 1 830 330 with an annual growth rate of
3.1%. The sparsely distributed population is mainly rural (67.0%) while the rest
(33.0%) resides in urban areas.
Khomas is the only region in the country with a rural population of less than 10%.
The total population in Khomas is 250 262 with a total growth rate of 4.0%. It is the
most densely populated region in the southern part of the country with a population
density of 6.8 persons per square kilometer (NPC, 2003, p. 10). The annual growth
rate poses a continuous challenge in providing necessary health, municipal and other
services to the inhabitants.
The main sources of income, by which food is acquired, are wages from employment,
old age pensions and trade activities. According to the 2001 population census report,
the national unemployment rate is 31.0% (185 258), while the Khomas region reports
a 29.4% (40 431) unemployment rate. About half of all Namibians are considered
poor, of which 13.0% are considered extremely poor (Van Schalkwyk, 2004, p. 25).
Namibia’s main sources of income are the agricultural and mining industries. The
mining industry accounts for almost 25% of the gross domestic product (GDP) while
beef production accounts for 85% of the gross agricultural income (MoHSS, 2003, p.
1). In the Khomas region, wages and salaries account for 74.0% of household income.
Only 1.0% of households depend on farming and 11.0% on informal businesses,
according to the 2001 Population Census data (NPC, 2003, p. 10).
23

Income distribution in Namibia is one of the most unequal in the world with 65.0% of
the wealth concentrated among 10.0% of the population. The gross domestic product
(GDP) per capita at current prices is indicated as N$1 465 per month while the
average GDP at constant prices per capita, per month is N$2 676.33 (Van Schalkwyk,
2004, p. 4).
According to Lutter (2003, p. 4),
productive years of life are impaired
and diminished by disabilities due to
inadequate nutrition and hunger.
Food insecurity has a severe
negative influence on individuals,
families and communities as well as
on the economy of Namibia.
Malnutrition especially affects
vulnerable and dependent
population groups. Infants and
children suffer cognitive deficits and
irreversible faltering in linear
24

growth. These deficits have a
negative consequential influence on
their sufferers’ contribution as
adults to the economy. A vicious
cycle results from poverty and
malnutrition. Contributing to this
problem is the high prevalence of
HIV and AIDS. Poor countries in
the SADC region indicate high
HIV/AIDS rates: Botswana (38.8%),
Lesotho (31.0%), Swaziland (33.4%)
and Zimbabwe (33.7%) (Makinwa,
2003, p. 3).
25

1.1.1 Background to the Problem
Malnutrition is a major public
health problem, especially in
developing countries. Chronic food
deficit affects about 792 million
people in the world. The situation is
particularly troubling in Sub-
Saharan Africa where the number
of malnourished children has
increased by 70.0% (Smith &
Haddad, 2000, p. 3). According to
Smith and Haddad, this increase in
Africa is occurring at a time when
the rest of the world is showing a
decline in malnutrition rates.
26

Protein-energy malnutrition is the most lethal form of malnutrition, which is mostly
visible in children. Malnutrition is considered a “silent emergency”. It is the cause of
at least half of the 10.9 million child deaths each year (WHO, 2003a, p. 2). According
to the same report, Protein-energy malnutrition affects every fourth child worldwide,
while 150 million (26.7%) are underweight, and 182 million (32.5%) are stunted.
Geographically, about a quarter of those affected (26.0%) live in Africa (WHO,
2003b, p. 1). Mercando (2004, p. 4) did an analysis of nutritional statistics in the
Philippines and reported that about four in ten children between the ages of five and
ten years are suffering from stunted growth and 2.49 million are underweight. The
following table (1.1) illustrates the findings of Mercando’s analysis.
Table 1.1: Trends of Nutritional
Status of Children 0 – 5 Years in
PhillipinesNutritional status 1998 2003
Underweight 32.0% 27.6%
Stunted 34.0% 30.5%
Wasted 6.0% 5.5%
Source: Mercando 2004:8
A Nutritional Surveillance Project in Bangladesh (1999-2000) explored the quality
and diversity of diet in rural Bangladesh, a country experiencing high rates of
malnutrition. This study revealed that about 50% of the children under the age of five
years had stunted growth, and 45.0% of mothers were underweight (Hafes, Torlesse,
Moestue, Hall, Kless, & Bloem, 2003, p. 45). The Ethiopian Demographic Health
Survey (2000) revealed that slightly more than half (51.0%) of children under five
years of age were stunted, compared to 43.0% in Tanzania, 38.0% in Uganda, and
33.0% in Kenya (ECSA, 2000, p. 3). These statistics are comparable with the 47.0%
stunting rate in the Khomas region of Namibia.
27

Table 1.2: Comparison of Acute and Chronic Malnutrition in Southern Africa
Country Wasting Stunting
Namibia – 1992 8.6% 28.0%
Namibia – 2000 9.0% 23.0%
Botswana – 2000 5.0% 23.0%
Zambia – 1999 4.0% 59.0%
Zimbabwe 6.0% 27.0%
Sub-Saharan Africa – 2000 10.0% 41.0%
Source: SADC 2003
Table1.2 compares the prevalence of acute and chronic malnutrition between
countries in the region and also the changes within Namibia between the 1992
Namibia Demographic and Health Survey (NDHS) and that of 2000. Overall, the
prevalence of wasting in Namibia is higher than in neighbouring countries. However,
the prevalence of stunting decreased between 1992 and 2000 and is comparable to
that found in Botswana and Zimbabwe, though it is much lower than what occurs in
Zambia and the Southern African region as a whole.
The problem of malnutrition in
Namibia does not reveal itself
differently than in most other
developing countries. The available
nutrition data in this study is only
for children under five years of age,
measured during the Namibia
28

Demographic and Health Survey
(MoHSS, 2003, p. 153). This study
revealed that a total of 31.4% of
Namibian children under five years
were stunted, referring to long-term
malnutrition. Of these children,
7.8% were severely stunted and
23.0% moderately stunted. This
shows slight improvement
compared to the 1992 NDHS, which
showed that 36.7% were stunted,
8.3% were severely stunted, and
28.4% were moderately stunted.
Available figures are still cause for
concern, particularly because of
29

emergent urban food insecurity
among poorer households in
Namibia. According to the 2000
NDHS report, the Khomas region
has the highest (47.0%) stunting
rate in the country (MoHSS, 2003,
p. 152). Approximately one quarter
(24.0%) of Namibian children under
five years are considered to be
underweight (low weight for age).
Table 1.3: Nutritional Status (Stunting Rates) by RegionRegion Total stunted Severely stunted Moderately Stunted
Khomas 47.0% 14.7% 32.3%
Kavango 42,5% 11.8% 30.7%
Ohangwena 36.2% 8.7% 27.5%
Omusati 34.5% 8.0% 26.5%
Omaheke 34.3% 8.7% 25.6%
Oshikoto 28.4% 5.2% 23.2%
Caprivi 26.6% 6.8% 19.8%
30

Hardap 25.1% 6.0% 19.1%
Kunene 25.1% 6.8% 18.3%
Oshana 23.9% 5.6% 18.3%
Otjozondjupa 22.0% 4.6% 17.4%
Karas 17.7% 2.7% 15.0%
Erongo 11.4% 2.7% 8.7%
Source: MoHSS, 2003, p. 152
Stunting, which is defined as the
condition of being too short for
one’s age, has an immense impact
on the productivity of individuals
and occurs when children do not get
adequate nutrients in quantity
and/or quality during intra-uterine
life, the first two years of life, or
both (ECSA, 2000, p. 6).
Namibia is considered food secure
at the national level due to a well-
31

developed commercial agriculture
sector, and at the sub-national level
due to the ability to import a
sufficient amount of food to cover
production deficits. However, the
situation is far from satisfactory and
many households are vulnerable to
chronic or acute food insecurity —
which could lead to malnutrition —
due to low agricultural production,
recurrent drought, and low incomes
as well as limited off-farm
employment opportunities. Barnett
and Rugalema (2001, p. 1) state that
morbidity and mortality caused by
32

HIV/AIDS reduces food security of
households by reducing the ability
to produce and/or buy food. Assets
such as livestock and other
possessions, which could be a source
of income and nutrition, may be
sold to generate cash for patient
care and treatment due to
HIV/AIDS and other chronic
illnesses. This may lead to high
levels of food insecurity and
malnutrition, especially among
orphans and vulnerable children.
33

1.1.2 Problem Statement
Malnutrition constitutes a global
“silent emergency”, killing millions
annually. Bekele reports (1998, p. 2)
that nearly 12 million children
under the age of five years (over
four million of them in Sub-Saharan
Africa) die annually and about 55%
of these deaths are related to
malnutrition. Namibia, as a part of
Sub-Saharan Africa, also
experiences the problem of
malnutrition as reported in the
NDHS (MoHSS, 2003, p. 152). A
total of 31.4% of Namibian children
34

under five years were stunted
(chronic malnutrition). Nationally,
the highest stunting rate (47.0%)
was recorded in the Khomas region. The conceptual framework for malnutrition in young children shows that the major
factors associated with malnutrition are poor nutritional intake and illnesses related to
lack of access to food, lack of health care, maternal care, and other services.
According to the UNICEF conceptual framework for the causes of malnutrition
(WHO, 2003a, p. 1) political ideology and national policies form the root of the
problem of malnutrition.
This study will attempt to gather necessary information on the causes of malnutrition
in informal settlements in Windhoek. This information will highlight some of the
reasons why some children are well–fed while others are not. The study could
potentially be utilised in health programmes to prevent malnutrition among children
under five years and to promote the general health of this vulnerable group, ensuring
that each individual reaches his or her full potential both physically and economically.
1.1.3 Research Questions• What are the main causes of malnutrition in the informal settlements of
Windhoek?
• What is the correlation between the nutritional status of children under the age of
five years and factors that may contribute to malnutrition in the informal
settlements of Windhoek?
35

1. 2 AIM AND OBJECTIVES
1.2.1 Aim
The aim of the study is to explore and describe the prevalence and causes of
malnutrition amongst children under five years of age in informal settlements of
Windhoek in order to provide information to stakeholders for designing a
comprehensive project that will address the problem of malnutrition.
1.2.2 Specific ObjectivesThe specific objectives of the study are:
• To determine the prevalence and causes of malnutrition in selected communities
in Windhoek;
• To correlate nutritional status (well nourished, malnourished children) and
contributing factors for children under five years (weaning, knowledge);
• To describe factors associated with malnutrition in children between one and five
years of age in the informal settlements of Windhoek.
1.3 JUSTIFICATION OF THE
STUDYWhile it is known that 47.0% of children suffer from malnutrition in the Khomas
region (MoHSS, 2003, p. 152), this study will attempt to determine the prevalence
and main causes of malnutrition for children under five years in the informal
settlements of Windhoek. The study will correlate nutritional status (well fed or
malnourished) with different factors that may contribute to malnutrition in the
selected sample group. The study will attempt to gather necessary information on the
causes of malnutrition in informal settlements in Windhoek. This information will
reveal the nutritional status of children between one and five years of age.
Proper nutrition is essential for both mental and physical development as well as
performance at school. It is essential for people to be able to achieve their full
potential. It may be assumed that access to food is a basic human right. It is the
36

author’s hope that this study will lead to the improvement of general health status
through improved nutrition. The study will also contribute to public health research
in Namibia, hopefully leading to the design and implementation of a comprehensive
programme by stakeholders to improve the health of Namibian children.
1.4 OPERATIONAL DEFINITIONS Anthropometry
Use of human body measurements
to obtain information about
nutritional status (WHO, 2004. p.
129).
Food insecurity
A situation that exists when people
lack secure access to sufficient
amounts of safe and nutritious food
for normal growth and development
and an active and healthy life. It
may be caused by the unavailability
37

of food, insufficient purchasing
power, inappropriate distribution,
or inadequate use of food at the
household level, which may be
chronic, seasonal or transitory
(WHO, 2004. p. 129).Food security
A situation that exists when people
have physical, social and economic
access, at all times, to sufficient, safe
and nutritious food that meets their
dietary needs and food preferences
for an active, healthy life (WHO,
2004. p. 129).Malnutrition
38

A nutritional disorder or condition
resulting from faulty or inadequate
nutrition, or intakes of energy
and/or nutrients below or in excess
of needs for prolonged periods of
time (WHO, 2004. p. 129).
Informal settlements
A collection of makeshift dwellings
forming a community, especially on
the outskirts of a town or city
(researcher’s definition).
Nutrition indicator
A measure used at the individual
and population level to determine
39

nutritional status (WHO, 2004. p.
129).
Nutritional status
The physiological state of an
individual that results from the
relationship between nutrient intake
and requirements and from the
body’s ability to digest, absorb and
use these nutrients (WHO, 2004. p.
129).
Protein-Energy Malnutrition
A situation caused by an inadequate
consumption of calories, resulting in
a deficiency of proteins and
40

micronutrients (Berkow, Beers, &
Bogin, 1999, p. 10).Stunting
Refers to shortness (deficit of linear
growth) in an individual who has
failed to reach genetic potential as a
result of poor diet and disease.
Stunting is defined as < -2 standard
deviations (SD) of the height-for-age
median value of the National Center
for Health Statistics/World Health
Organization (NCHS/WHO)
international reference data. The
height-for-age index is used to
compare a child’s height with the
expected value of a child of the same
41

age from a reference population
(WHO, 2004. p. 129).Undernourishment
Food intake that is continuously
inadequate to meet dietary energy
requirements (WHO, 2004. p. 129).
Undernutrition
The result of undernourishment,
poor absorption or poor biological
use of nutrients consumed (WHO,
2004. p. 129).Underweight
A low weight-for-age ratio and a
composite of stunting and wasting.
Underweight is defined as < -2 SD of
the weight-for-age median value of
42

the National Center for Health
Statistics/World Health
Organization (NCHS/WHO)
international reference data.
Weight-for-age Index is used to
compare a child’s weight with the
expected value of a child of the same
age (WHO, 2004. p. 129).
Wasting
Describes a recent and severe
process that produces substantial
weight loss, usually as a
consequence of acute shortage of
food and/or disease. Wasting is
defined as < -2 SD of the weight-for-
43

height median value of the
NCHS/WHO international
reference data. Weight-for-height
Index is used to compare a child’s
weight with the expected value of a
child of the same height (WHO,
2004. p. 129).
44

1.5 OUTLINE OF RESEARCH
REPORT
The report is organized into five
chapters covering the following
subjects:
Chapter 1 – Orientation to the
study
Chapter 2 – Literature review
Chapter 3 – Research
methodology
Chapter 4 – Data analysis and
discussion of findings
Chapter 5 – Limitations,
conclusions and recommendations
45

1.6 SUMMARY
Good nutrition is essential for
mental and physical development,
and for people to reach their full
potential. The preceding orientation
chapter presented an overview of
the research process. Its central
concern was to provide background
information on malnutrition, and on
the design and methodology to be
used in the study. Included were a
problem statement, justification of
the study, and operational
definitions.
46

CHAPTER 2
LITERATURE REVIEW
2.1 INTRODUCTION
This chapter will present a review of
existing literature on the subject.
The literature review will link the
purpose of the study to various
theoretical perspectives and the
current nature of variables related
to the phenomenon.
Malnutrition is a universal problem,
but affects the developing countries
in Asia and Africa in particular.
Less fortunate people are unable to
secure food to provide them with
necessary nutrients that enable
47

them to meet daily dietary needs.
This inability severely affects their
physical, social and economic status.
There is a definite relationship
between nutritional status and the
prevalence of ill health and
disabilities in individuals.2.2 STUDIES CARRIED OUT IN OTHER COUNTRIES
Lutter (2003, p. 5) reports that the
prevalence of stunting exceeds that
of low weight–for-age. This is
considered true for Latin America,
where stunting is twice that of low
weight-for-age. A study of
malnutrition among children aged
six months to two years from a 48

settlement colony in Delhi revealed
a 60.7% prevalence rate of
malnutrition. The undesirable
practices of discarding colostrums,
not exclusively breastfeeding a child
up to four months, delayed weaning,
and the use of bottle and nipple for
feeding, were still widely prevalent
in Delhi among children five years
and under (Khokhar, Sigh, Talwar,
Rasania, Badhan & Mehra, 2003, p.
1).Mercando (2004, p. 8) reported that about four out of ten children between the ages of
five and ten in Bangladesh are shorter (stunted growth) and 2.49 million are thinner
than the growth reference curves developed by the National Center for Health
statistics and the CDC, using data from the Fels Research Institute and US Health
Examination Surveys (MoHSS, 2003, p.150). A study was conducted in Bangladesh
from 1999 to 2000 by the Nutrition Surveillance Project of Bangladesh to explore the
quality and diversity of diet in rural Bangladesh. This study revealed that about 50%
49

of children under the age of five years had stunted growth and 45% of the mothers
were underweight (Mercando, 2004, p. 45).
The impact of HIV/AIDS on
nutrition and nutritional status is
phenomenal. Nutrition and HIV are
closely linked, as HIV negatively
impacts household food security and
also reduces the production rate of
food. The Nutrition Surveillance
Project analysis revealed that
HIV/AIDS is linked to poverty and,
in particular, occurs in populations
with endemic malnutrition and
micronutrient deficiencies. The rate
at which the disease progresses to
full-blown AIDS could be affected
50

by the nutritional status of the host.
It is estimated that energy needs
increase by 10% during the HIV
stage and increase from 20 to 30%
during the AIDS stage (Mercando,
2004, p. 9).
Engle, Menon and Haddad (1996, p.
28) describe “care” as the provision
of time, attention and support to
meet the physical, mental and social
needs of a growing child both in the
household and the community.
Resources for care are defined as
caregiver education, knowledge and
beliefs, caregiver physical health
51

and nutritional status, caregiver
mental health and self-confidence,
autonomy and control of resources,
workload and time availability, and
family and community social
support (Engle et al, 1996, p. 28).
Although research on the direct
linkages between indicators of
caregiver nutritional status and
care-giving is limited, chronic
energy deficiency, measured using
body mass index, has been thought
to have effects on productivity by
modifying physical activity patterns.
The nutritional status of the mother
52

is also expected to affect her ability
to care for children. The blood iron
status that determines whether an
individual is aneamic also affects the
level of productivity of that
individual (Engle et al, 1996, p. 28). In the Gambia, it has been reported that children of mothers who have several
children have poorer early growth and lower catch-up growth in height than children
of mothers with few children. Short inter-pregnancy intervals are also associated with
increased risk of pre-term low birth weight. According to Engle et al (1996, p. 29), the
case for improving maternal health and nutritional status is stronger than ever before,
based on existing evidence of the effects of maternal health on birth outcomes and
emerging evidence of their effect on infant behaviour and care giving.
A study done by Girma and Genebo (2002, p. 23) on the nutritional status of women
and children reports that more than 55% of children of malnourished mothers were
underweight, while 44.9% of children of well-nourished mothers were underweight.
A positive relationship between maternal and child nutritional status was observed.
Engle et al (1996, p. 33) further report that, in the United States of America, a large
body of literature links maternal depression with poor care-giving and problematic
outcomes for children. A UNICEF report on the slum improvement project in
Bangladesh, referenced by Engle et al (1996, p. 33), suggested that the social isolation
of women, coupled with lack of extended family networks in urban areas, has a
negative effect on the mental health of women, which in turn is likely to reduce the
quality of care, even when the mother is physically present. The most important social
support for mothers is alternating child-care, which may be lacking when women are
isolated.
53

A study done by Castle (cited by
Engle et al) reports that some of the
most malnourished children in Mali
belonged to low-status women in
high-income households. She
suggested that it may not be the
level of a household’s wealth that
determines the mother’s resources
for childcare, but the mother’s
access to these resources (Engle et
al, 1996, p. 33).2.3 STUDIES CARRIED OUT IN SUB-SAHARAN AFRICA AND NAMIBIA
After reviewing country trends in malnutrition for Sub-Saharan Africa, it became
evident that in most countries the trend toward underweight children has shifted from
an improving trend to a deteriorating or static trend. It is important to note that this
deteriorating trend also coincides with increased food insecurity in Southern Africa
and increasing numbers of people affected by HIV/AIDS (Mason, Rivers & Helwig.
2005, p. 94).
Feeding practices are important determinants of children’s nutritional status. The
2000 Namibia Demographic and Health Survey indicates that infant feeding has an
54

impact on both the mother and the child (MoHSS, 2003, p. 143). Breastfeeding has an
indirect effect on the post partum fecundity of mothers as more frequent breastfeeding
is associated with longer periods of amenorrhoea, which leads to longer birth
intervals. The 2000 Namibia Demographic and Health Survey (NDHS) further reveals
that over 93% of infants were put on the breast within one day and 81.0% within one
hour, which is a significant increase from the 1992 data of 80.0% and 52.0%
respectively (MoHSS, 2003, p. 144). Some of the benefits of breast milk include, but
are not limited to, the balanced composition of nutrients, the reduction of
contamination, and the composition of passive immunity system for the baby. The
time when other foods are introduced is as important as initiating breastfeeding. On
the other hand, weaning foods might be contaminated and might also not contain
required nutrients. The NDHS further reports that a mere 26.0% of Namibian children
are exclusively breastfed up to the age of four months. Khomas and Erongo are the
two regions with the lowest duration of breastfeeding, while Caprivi and Kavango
have the longest duration, between 22 and 28 months (MoHSS, 2003, p. 145).
Feeding practices, with emphasis on the quality and quantity of food eaten, are
important determinants of a child’s nutritional status, which further determine the
child’s susceptibility to infection. Young children need more feedings (between five
and six) than an adult in order to meet their daily nutritional requirements. The
Namibia Demographic Health Survey has reported that between two and three meals
are being fed to infants in Namibia (MoHSS, 2003, p. 147). About a quarter of
Namibian children (24%) under the age of five are reported to be stunted. Stunting
rates are highest in the Khomas (47.0%) and Kavango (42.0%) regions. In Namibia
the underweight rate is at 24.0% while the severe underweight rate is at 5.0%
(MoHSS, 2003, p. 153). The process of becoming stunted due to chronic under-
nutrition begins before birth and continues during the first three years of life. The
stunting that occurs during this time cannot be corrected later. Unfortunately, when
energy intake is adequate, these stunted children are at higher risk of becoming obese.
Childhood obesity is associated with chronic diseases in later life such as,
hyperinsulinemia, hypertension, hyperlipidemia, type 2 diabetes mellitus and arterio-
sclerotic cardiovascular diseases. The burden of ill health will be double in
developing countries due to poverty related infections such as malaria and
tuberculosis, stunting and the related likelihood of being overweight (Julie, Van
55

Weissenbruch, Delemarre-van de Waal & Surjono, 2004, p. 354). Bloss, Wainaina
and Bailey (2004, p. 267) suggest in their report that immunization gives protection
against stunting. Children whose vaccinations were not up-to-date were more than
twice likely to be stunted than children with current vaccinations. A study done by
Verhoef, West, Veenemans, Beguin and Kok (2002, p. 4) in Kenya report that
stunting peaks at the age of 24 months and stabilizes thereafter. They further report
that nutritional inadequacies that cause stunting also impair host immunity, and
thereby increase the degree to which malaria is associated with decreased
concentration of hemoglobin, with increased inflammation and with increased iron
required for erythroblasts. The report suggested that increased intake of
micronutrients may not only reduce stunting and nutritional anemia, but malaria
related anemia. The prevalence of stunted and wasted children among the study
population was 39.0% and 5.0% respectively. The prevalence of anemia in the whole
study group was 71.0% (Verhoef et al 2002, p. 4).
Insufficient food intake is one of the
primary causes of malnutrition.
Poor child appetite plays a major
role in adequate nutrient intake.
Factors that reduce a child’s
appetite may include a monotonous
diet, lack of nutrients needed for
appetite (e.g. zinc), and illnesses
such as fever, diarrhoea, malaria,
56

measles, intestinal parasites, chronic
malnutrition and sores in the
mouth. A World Health
Organization study on “Food
Security and Caring Patterns of
Vulnerable Young Children in
South Africa” reported stunting to
be the major nutritional problem in
children under five years of age,
especially in urban informal
settlements and in rural areas. The
study findings suggested that, in
many cases, chronic malnutrition
was related to inadequate resources,
to monotonous, poor quality diets,
57
and to poor appetites (WHO, 2002,
p. 23).
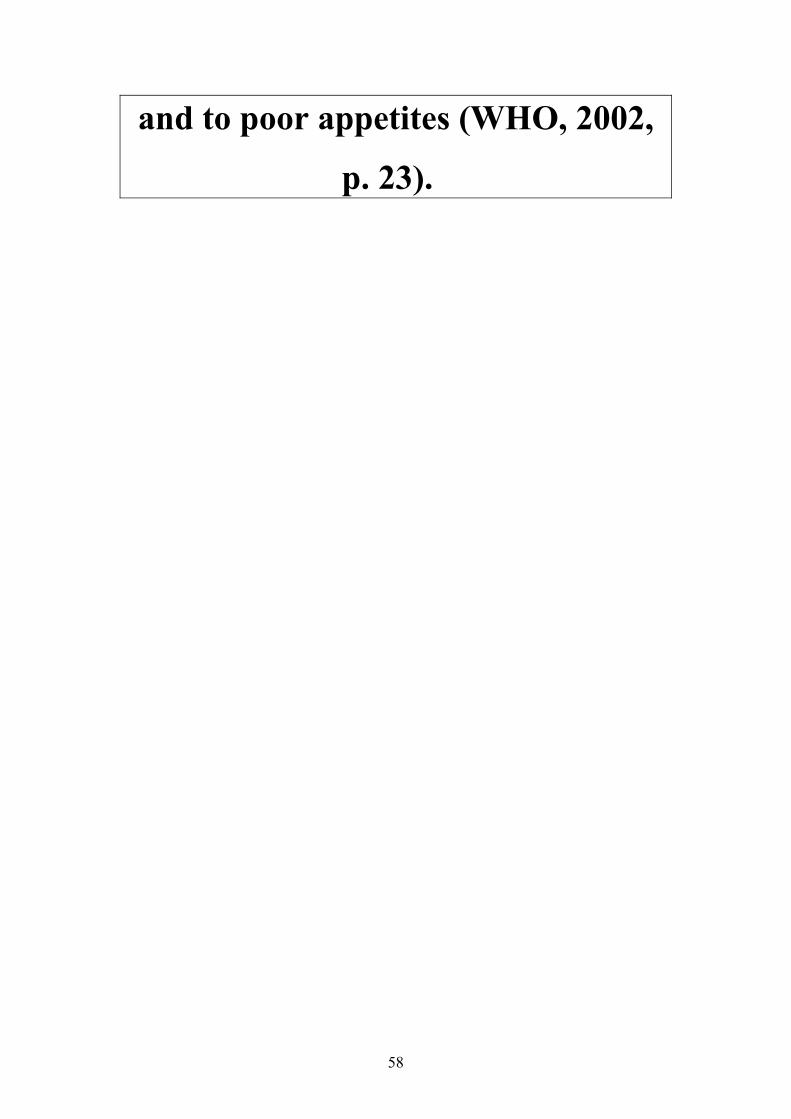
58
Table 2.1: Suppliers of Dietary
Energy in Namibia
Source Percentag
e
Cereals 53.0%
Starchy roots 14.0%
Sweeteners 14.0%
Pulses, nuts
and oil crops
4.0%
Fruits and
vegetables
2.0%
Vegetable oils 3.0%
Animal fats 2.0%
Meat and
offals
4.0%
59

Fish and
seafood
1.0%
Milk and eggs 3.0%(Source: Mittendorfer (2001, p. 5)
Mittendorfer (2001, p. 5) reports
that 53.0% of dietary energy comes
from cereals, while meat and milk
are the main sources of protein in
Namibia. This finding suggests that
diet in Namibia is predominantly
monotonous.
The latest Namibia Demographic
Health Survey (NDHS) (MoHSS,
2003, p. 148) reports that Namibian
children are introduced to
supplementary feedings long before 60

the recommended age. Foote and
Marriott (2003, p. 488), in their
review of weaning of infants, state
that early weaning has an
immediate effect on the health of
infants in economically developing
countries due to factors such as the
lack of availability of suitable
alternatives to breast milk,
microbial contamination of foods
and fluids, replacement of breast
milk by less nutritious alternatives,
and the return of fertility with the
cessation of lactation.
61

The NDHS further states that the
frequency of feedings was on
average between two and three
meals per day for ten month old
babies. This is below the
recommended number of meals for
children. Infection and poor health
also play a major role in
malnutrition. Household food
insecurity, being one of the three
underlying causes of malnutrition
(WHO, 2003a, p. 1), could in fact
determine the number of meals
eaten, as well as the diversity of
foods consumed by the family.
62

Employment for wages, old age
pensions and trade activities are the
most common sources of income by
which food is accessed
(Mittendorfer, 2001, p. 5).
In addition to protein energy
malnutrition, insufficient food
consumption leads to other
problems that are of public health
importance. Among these problems
are deficiencies in iron, iodine and
vitamin A, to list a few.2.4 SUMMARY
In this chapter, possible factors that
contribute to malnutrition in
63

informal settlements were discussed.
The main objective was to link the
literature to the current nature of
the variables related to malnutrition
in the informal settlements of
Windhoek.
Some of the factors discussed
include feeding practices,
immunization status, susceptibility
to infections, household food
security and the main source of
income for purchasing food. Household food security can be improved through poverty reduction programmes that
improve the economic status, and thus the buying power, of households.
64

CHAPTER 3
RESEARCH METHODOLOGY3.1 INTRODUCTION
This chapter provides an outline on how the research process was carried out to get
answers to research questions. The research questions are: What are the main causes
of malnutrition in the informal settlements of Windhoek? What is the correlation
between the nutritional status of children under the age of five years and factors that
may contribute to malnutrition in the informal settlements of Windhoek?
Focus will be on the study
population, sampling techniques,
sample size, data collection methods
and the control measures taken to
ensure validity and reliability. 3.2 RESEARCH DESIGN
This research is a cross-sectional descriptive study that describes the current
prevalence and possible causes of malnutrition of children born from May 2001 to
May 2005 (one to five years of age) residing in the informal settlements in Windhoek.
In this study, the height and weight measurements of the children, taking age and sex
into consideration, were converted into z-scores based on the National Center for
Health Statistics reference populations recommended by the World Health
Organization. Thus, those below a –2 standard deviation of the National Center for
Health Statistics median reference for height-for-age, weight-for-age and weight-for-
height were defined as stunted, underweight and wasted, respectively. In this study all
three indicators were used to describe the levels of child malnutrition and the
65

relationships between nutritional status and contributing factors. The survey was
limited to assessing protein-energy malnutrition without attempting to assess other
deficiencies.
3.2.1 Quantitative Research
Quantitative research relies upon
measurement to analyse different
variables and uses various scales
(Bless & Higson-Smith 1995, p. 38).
This is a formal, objective and
systematic process, which aims to
analyse, compare and describe
different variables.The quantitative research approach was considered to be suitable for measuring the
nutritional status of children between one and five years and contributing factors in
the informal settlements of Windhoek.
3.2.2 Descriptive Research
This study is descriptive. It was conducted to provide a description of the nutritional
status in relation to different variables of the target population such as age, sex,
educational level, and socio-economic status. The purpose of descriptive studies is to
describe and document aspects of situations (Polit, Beck & Hungler 2001, p. 180).
The researcher sought to describe and report on the nutritional status of children
between one and five years of age with respect to various contributing factors.
66

3.3 RESEARCH METHODS
A survey study was considered the best method to gather information. This method is
described as the collection of information on a wide range of cases, each case
focusing only on the particular aspect under consideration (Bless & Higson-Smith,
1995, p. 41). The quantitative research approach is a method that often employs
measuring instruments.
The researcher and research assistants used a structured questionnaire with both open-
ended and closed-ended questions to collect data through face-for-face interviews.
Anthropometric measurements of children were taken to determine factors of
stunting, wasting and underweight.
3.3.1 Study Population
“Population” is a term that sets
boundaries on the study units
according to Strydom, Fouche and
Delport (2004, p. 198). It refers to
individuals in the world that possess
specific characteristics. The study
area was the informal settlements in
Windhoek. The population in this
study included all mothers or
caregivers of all children between
67

one and five years of age.
Households without children in this
age group were excluded. Visitors
were also excluded.
Sub-populations consisted of people
living in the Windhoek district
based on the following strata: 6 715
urban households and 628 rural
households.3.3.1.1 Inclusion
Households with children born
between May 2001 and May 2005
were included in the study (children
one to five years of age). 3.3.1.2 Exclusion
Households with children below one year of age, over five years of age and visitors
were excluded.
68
3.3.2 Sampling
Bless and Higson-Smith (1995, p. 85) describe sampling as a process of selecting a
smaller group of people from the research population as representative of that
population. Sampling is less costly and time-consuming for a researcher than
including an entire population.
A sample was drawn from the 49 informal settlements in Windhoek, which included
seven major settlements, three of which (Havana, Okuryangava and Otjomuise) were
urban, and four of which (Aris, Dordabis, Kappsfarm and Groot-Aub) were rural.
First, the stratified random sampling method was employed to ensure fair
representation of each section as the informal settlements are at different locations.
Secondly, cluster sampling was used. The identified clusters coincided with the
enumeration areas (EA) pre-determined for national census. The EAs were grouped
according to their geographic location and final clusters were selected randomly by
drawing the EA numbers from a hat. The researcher visited the study area prior to the
study and identified the enumeration areas on the ground as demarcated on an aerial
photograph, with assistance from officials of the National Planning Commission.
Even though houses were not numbered, street names existed which facilitated the
identification of clusters.
Households in the study area were selected randomly. The first household was
determined by locating the center of the cluster and spinning a bottle. The household
indicated by the bottle was taken as the starting point. Once the starting point was
determined, the next household selected was the adjacent one on the left side. This
process was repeated until the desired number was reached.
3.3.3 Sample Size
The sample size is designed to permit generalization of the results to the population
under investigation. As per population census records from the Central Bureau of
Statistics, the population of the informal settlements is 25 475 individuals residing in
69

7 343 households. A study of the entire population would be time consuming and
costly, therefore a sample of the population was studied. A confidence interval of
95.0% was taken and a sample of n households. The sample proportion P is 0.5 with a
reliability of 5.0%.
The population is known, therefore the sample size is calculated as:( )
( ) ( )PPLNNn
−+
=
196.1100/1 2
2
( )( ) ( )5.015.096.1
100/573431
7343
2
2
−+
=n
= 365
NotationN1 = population for urban Windhoek
N2 = population for rural Windhoek
To calculate the sample for each stratum:
Urban Stratum
NNW ÷= 11 = 73436715 ÷ = 0.914
nWn ×= 11 = 365914.0 × = 334
Rural Stratum
NNW ÷= 22 = 7343628 ÷ = 0.086
nWn ×= 22 = 365086.0 × = 31
70

Table 3.1: Population Distribution of Informal Settlements
Settlement Population Households Percentage of population and sample
Number of respondents
Aris 175 88 1.1% 4
Dordabis 493 87 1.1% 4
Groot-Aub 1638 384 5.2% 19
Kappsfarm 293 69 0.82% 3
Havana 9278 2978 40.7% 148
Otjomuise 219 97 1.4% 5
Okuryangava 13 379 3640 49.7% 181
TOTAL POPULATION
25 475 7343 100% 364
3.4 TRAINING OF RESEARCH ASSISTANTS AND PILOT STUDYThe National Health Training Center made second-year students available during
their two-week break to participate in the study as research assistants. Their selection
was intended to provide an experiential learning opportunity for the students. The
students had prior theoretical lessons on research methodologies. The researcher
conducted training for the research assistants in preparation for the study a week
before the actual fieldwork. The researcher built on students’ existing knowledge and
focused on the research design that was employed for the current study. The objective
of the training was to provide necessary knowledge and skills in order to minimize
mistakes. The research assistants were provided with the opportunity to practice in
pairs and were given questionnaires to interview at least one household in Katutura.
This was done in order to check the validity of the questionnaires, to ascertain
whether the study tools employed would result in the expected responses, and to
confirm that the questions were not ambiguous. Because research assistants could
only participate in the data collection process during the two weeks scheduled for
their practical training, no formal pilot study was conducted.
71

3.5 DATA COLLECTION
Data was collected through face-to-face interviews from May 8, 2006 to May 20,
2006, using a questionnaire. Structured closed- and open-ended questions were
compiled (Polit et al, 2001, p. 154). A cluster sampling method was employed. All
eligible subjects in specific clusters were interviewed and anthropometrical
measurements were taken. All children in each household between the ages of one
and five were included. Dates of birth were ascertained through birth certificates,
Road-to-Health Cards, and parental recall.
The weight of the children was taken using an electronic UNICEF Secca scale. The
children were weighed with little clothing (limited to a nappy and a vest). Weights
were recorded to the nearest 100g.
The length of a child below the age of two was measured by having the child lie flat
on his back on a UNICEF roller band, with his head touching the base. During
measurement, it was ensured that the child would be looking straight ahead with his
back straight and feet positioned flat against the cursor.
The height of a child more than two years old was measured standing with his feet flat
on the base of a special L-shaped, metal height measure. Heels, buttocks and back
were made to touch the backboard. The head was positioned so that the child was
looking directly forward.
The data collection team was comprised of second-year student nurses from the
National Health Training Center. The team conducted the interviews and took the
anthropometrical measurements of all the children included in the study population.
DATA ANALYSIS
Data analysis entails categorizing, ordering, manipulating and summarizing the data
and then describing them in meaningful terms (Brink, 2002, p. 178). In this study,
data were analyzed using SPSS computer software, Microsoft Excel and EPI INFO 6
with the assistance of a statistician from the University of Namibia to obtain
descriptive statistics. The calculations and analysis of the anthropometrical indicators
were carried out using EPINUT. These data are presented in tables and graphs.
Variables were all coded.
72

The anthropometrical calculations described in this report are based on the growth
reference curves developed by the National Center for Health statistics and the CDC,
using data from the Fels Research Institute and US Health Examination Surveys. The
World Health Organization (WHO) recommends these growth curves for international
use (MoHSS, 2003, p. 150). The use of this reference population is based on the
findings that young children of all population groups have similar genetic potential
for growth.
Three standard indices of physical
growth that describe the nutritional
status of children are presented. • Height-for-age (stunting)
• Weight-for-height (wasting)
• Weight-for-age (underweight)
Each of these indices gives different information about growth and body composition
that can be used to assess nutritional status (MoHSS, 2003, p. 151).
3.7 ETHICAL CONSIDERATIONS3.7.1 PermissionFirst, permission was obtained from the University of Namibia’s Post-graduate
Studies Committee (Senate), where the research proposal was reviewed to ensure
compliance with scientific research methodologies.
Secondly, community leaders were informed through the office of the Chief
Executive Officer of the city of Windhoek. The purpose of the study was explained to
community leaders and dates of the actual study were communicated to them so that
they could inform the communities and thus avoid surprise and consequent anxiety
which could otherwise be invoked by strangers seeking to examine their children.
73

Community leaders on the ground were also informed while the clusters were
demarcated in the study area.
Thirdly, verbal consent was obtained from every interviewee (mother or caretaker)
after the researcher had explained the purpose and procedures of the survey.
3.7.2 Right of Privacy and Participation
The right to privacy is an
individual’s right to decide when,
where, to whom, and to what extent
his or her attitudes, beliefs and
behaviour will be revealed (Strydom
et al 2004, p. 67). Mothers and
caretakers who took part in the
study did so voluntarily. Each
studied participant was given a full
explanation of the study and
interviewed in private.
Participation in the process was
totally voluntary and without fear of
74

victimization. The participant had
the right to withdraw from the
study at any given point. The
culture of the subject was respected
at all times.3.7.3 Anonymity
Anonymity means that no one,
including the researcher, should be
allowed to identify subjects
afterwards (Strydom et al 2004, p.
63). Anonymity was adhered to
throughout this study, as subjects
were not identified either by name
or residence. The results are also
reported as averages and
75

percentages, and do not indicate any
subject specifically.3.7.4 Confidentiality
The interviewees remained anonymous, as each interviewee was assigned a unique
number and personal information was kept confidential. No unauthorized person had
access to the information. Privacy was maintained at all times.
3.7.5 Benefit
The benefits of the research were explained to the respondents. For example, it was
explained to mothers how they could benefit from knowing the nutritional status of
their children, which prompted them to provide honest information. They were also
informed that the results would be shared with relevant authorities for consideration
in planning purposes.
76

3.7.6 Reliability and Validity of Data
3.7.6.1 Validity
77

Validity refers to the extent to
which a research design is
scientifically sound or
appropriately conducted. Validity
has two subcategories: external
and internal validity. External
validity refers to the extent to which
you can generalize the results of a
study, while internal validity
addresses the issue of confounding
variables (Struwig & Stead, 2004,
p. 136). A quasi-pilot study was
used to determine the extent to
which the study tool, the structured
78

questionnaire, would measure the
intended variables and rule out
ambiguity.3.7.6.2 Reliability According to Struwig and Stead (2004, p. 130), reliability is the extent to which test
scores are accurate, consistent and stable. The researcher ensured reliability by
selecting and training research assistants with prior knowledge in research and also by
explaining the questions in simple words to these research assistants. These research
assistants were trained health workers who were already familiar with the weighing
and measuring techniques. Their knowledge was refreshed on the techniques to
ensure reliability of the data. The weighing scales were checked for accuracy against
established standards (such as packages of food) and faulty scales were replaced
daily. The subjects were weighed wearing minimal clothing and barefoot.
Questionnaires were compiled using simple language and explanations of questions
were given to respondents.
3.8 SUMMARY
The preceding chapter presented an in-depth discussion of the research methodology.
The aim was to outline how the researcher approached the methodology of data
collection, sampling, and selection of the study population. Explanations were also
given as to how validity and reliability were ensured and ethics observed.
79

CHAPTER 4DATA ANALYSIS AND DISCUSSION OF RESEARCH FINDINGS4.1 INTRODUCTION
This chapter will focus on the
analysis, interpretation and main
findings of the data acquired from
the structured interviews and the
anthropometrical measurements.
The calculated sample size was 365,
but the actual sample was 350
subjects. The calculations are based
on the actual sample.4.2. ANALYSIS AND DISCUSSION OF FINDINGS
4.2.1 General Information
80

Sample Strata
89.7
10.3
urban
rural
Figure 4.1: Sample Strata
The majority of the respondents
(314 or 89.7%) were urban-based,
while only 36 (10.3%) were rural-
based. The proportion of urban
population in the Khomas region
was reported by the Population and
Housing Census (NPC, 2003, p. 10)
to be 93.0% while rural was only
7.0%. The second highest urban-
81

based population in Namibia is in
the Erongo region (80.0%). Of the respondents, 225 (64.3%) were parents of a child in the study. Of these parents,
only 25 (11.0%) were fathers.
Of the respondents, 158 (45.0%)
had an educational level of junior
secondary (grade 8–10) while 119
(34.0%) completed lower primary
(grade 1–7). Only 28 (8.0%) of the
respondents had never attended
school, 29 (8.2%) had completed
senior secondary level (grade 11–12)
and 16 (4.6%) did not respond. Data
compares well with the 2001
Population and Housing Survey that
reported 8.0% of the persons age six
82

and above never attended school
(NPC 2003:25). An overwhelming
majority of the respondents, (337 or
96.3%) had not reached the tertiary
educational level while only one
respondent (0.3%) had obtained a
secretarial diploma, post grade 12.
Educational status, especially of
women, plays a key role in
household food security and in
caring for children on a day-to-day
basis. The educational level of
mothers as primary caregivers can
be correlated to their income and
higher purchasing power promotes
83

household food security. Education
also serves to broaden their
understanding of the importance of
nutrition and influences household
budgeting in a constructive manner.More than two thirds of the respondents (248 or 70.8%), spoke “Oshiwambo” as their
main language. The second most commonly spoken first language was
Damara/Nama, with 62 respondents (or 17.7%), and the remaining 40 respondents
(11.4%) were comprised of Otjiherero, Afrikaans, Rukwangali and Setswana
speakers. Similarly, the 2001 Population and Housing Census reported that
“Oshiwambo” is the language spoken by the majority of people in Namibia (37.0%),
followed by Afrikaans (24.0%), and Damara/Nama (13.0%) (NPC, 2003, p. 39).
4.2.2 Demographic information
Gender of the Head of Household
43.7
56.3
female
male
Figure 4.2: Gender of the Head of Household
Just over half of the households studied (197 or 56.3%), were headed by males, while
153 households (43.7%) were headed by females. Similarly, the Population and
84

Housing Census reports that 64.0% of all households in the Khomas region are male-
headed (NPC, 2003, p. 10).
Age of the Household Head
0
10
20
30
40
50
<20 20-29 30-39 40-49 50-59 >60
perc
ent
Figure 4.3: Age of the Head of Household
A majority of the heads of households (311 or 88.9%), were in the productive age
group between 20 and 49 years, while only 38 (10.8%) were above the age of 50 and
one (0.3%) was less than 20 years of age. In all cases adults headed the houses. Child-
headed households were not identified in the study population.
85

0
10
20
30
40
50
60
perc
ent
married single divorced/separated
Marital Status
Figure 4.4: Marital Status of the
Head of HouseholdClose to one third of the heads of households (122 or 34.9%), were married, whereas
the majority (209 or 59.7%), were single. The rest, 19 (5.4%), were either separated
or widowed. The 2001 Population and Housing Census also reported that 61.0% of
the population 15 years or older was never married (NPC, 2003, p. 10).
Length of Stay at Residence
0
50
100
150
200
<1 year 1-2 years 3-5 years >5 years
num
ber o
f par
ticip
ants
Figure 4.5: Length of Stay at Present Residence
86

Almost half of the respondents (179 or 51.1%) reported to have lived more than five
years at their current residence while a quarter (25.1%) reported to have lived at their
current residence for a period between three and five years.
Family Size
60%
34%
6%
1 - 5 members
6 - 10 members
> 10 members
Figure 4.6: Family Size
The majority of the households (210 or 60.0%) had between one and five members
and a third had between six and ten members. Only 21 households (6.0%) had more
than ten members. The Population and Housing Census (NPC, 2003, p. 10) reported
the average family size as 4.2 for the Khomas region, which is comparable with the
study findings.
87

4.2.3 Household Morbidity and Elderly
Chronically Ill Members of Household
9%
86%
5%
yes
no
no response
Figure 4.7: Chronically Ill
Members of HouseholdThirty-five (10.0%) of the respondents reported to having at least one chronically ill
family member.
Only 44 (12.6%) of the respondents reported that they had elderly persons that were
unable to work for an income, while 306 (87.4%) did not report elderly people as
family members.
4.2.4 Household Mortality
Less than one tenth of families surveyed (26 or 7.4%), reported deaths in the past
year. From the respondents that reported a death in the family, 18 (69.2%) reported
that the death was due to long-term illness and only eight (30.8%) reported a case of
sudden death. Of the deceased, 19 (73.1%) were male while seven (26.9%) were
reported to be female. Evaluation of the ages of the deceased indicated that 14
(53.8%) died during their reproductive period, age 21 to 50 years. Death rates for age
groups were: under five years, 2 (7.7%); 5-10 years, 2 (7.7%); 21-30 years, 5
(19.2%); 31-40 years, 6 (23.1%); 41-50 years, 3 (11.5%); and 50+ years, 8 (30.8%).
Namibia ranks in the top ten countries most affected by the HIV/AIDS pandemic. It
can also be assumed that a major cause of death in long-term illnesses is HIV/AIDS
related.
88

4.2.5 Food Consumption
Table 4.1. Consumption of Carbohydrates
Food item Once a day - more than twice a day
(Percentage of 350)
Never - once a month (Percentage of 350)
Maize (stiff) 45.1% 17.5%
Maize (soft) 35.1% 18.0%
Mahangu 37.5% 34.6%
Oshikundu 36.0% 32.9%
Bread 48.9% 10.9%
Rice 28.5% 26.8%
Pasta 23.4% 32.2%
Breakfast cereal 10.0% 60.0%
Table 4.1 reveals that bread was eaten most frequently. That is, bread is eaten
between once a day and more than twice a day by the majority (48.9%) of the
subjects. Maize (stiff) ranked second with 45.1% of the subjects reporting that they
consume Maize (stiff) between once and more than twice a day. Breakfast cereal
ranked last with 10.0%. Cumulatively, maize (prepared either soft or stiff), mahangu,
oshikundu, and bread comprised the staple for the sample population.
89

Table 4.2: Consumption of ProteinFood item Once a day - more than
twice a day(Percentage of 350)
Never - once a month (Percentage of 350)
Meat 38.9% 21.7%
Chicken 24.5% 33.7%
Fish 31.2% 26.3%
Beans 15.7% 54.0%
Peas 8.0% 66.0%
Nuts 5.2% 67.5%
Seeds 3.5% 72.3%
Soybeans 5.1% 69.7%
Milk 26.6% 32.8%
Eggs 17.7% 38.6%
Mopani worms 16.0% 50.0%
Other insects eaten 3.1% 39.1%
According to table 4.2, meat
(38.9%), fish (31.2%), milk (26.6)
and chicken (24.5%) were
consumed from once to more than
twice a day and served as the main
90

sources of protein for the sample
population. Edible seeds and
legumes were not mentioned
frequently even though they are less
costly than animal products. Less
than half of the respondents
consumed listed foods as a source of
protein on a daily basis. Animals
were mentioned frequently as a
source of protein despite the price of
meat being higher than that of
legumes.
91

Table 4.3: Consumption of Fruits and Vegetables
Food item Once a day – more than twice a day
(Percentage of 350)
Never – once a month (Percentage of 350)
Pawpaw 4.3% 68.3%
Eembe 9.4% 60.2%
Oranges 21.1% 34.9%
Apples 22.8% 31.1%
Other fruits and
berries
12.0% 28.3%
Pumpkin 13.7% 56.0%
Carrots 17.5% 52.0%
Spinach 19.5% 44.8%
Potatoes 28.9% 28.3%
Sweet potatoes 15.4% 56.3%
Other vegetables 13.1% 31.7%
Table 4.3 shows that 28.9%
respondents consume potatoes at
least once a day. Other types of
vegetables were consumed less
frequently. About a fifth (21.1% –
92

22.8%) reported consuming oranges
and apples at least once a day.
Fruits and vegetables were lacking
in the diet of the respondents, as less
than a third (33.0%) mentioned
consuming a fruit or vegetable on a
regular basis. Based on this finding,
the researcher assumes that the
respondents could be deficient in
important micronutrients (vitamins
and mineral salts).
93

Table 4.4: Consumption of Fats and Sugars
Food item One a day – more than twice a day
(Percentage of 350)
Never – once a month (Percentage of 350)
Butter 30% 36.9%
Margarine 33.4% 37.1%
Cooking oil 54.2% 14.6%
Lard 12.3% 59.7%
Cream 8.9% 67.1%
Sugar 58.0% 12.6%
Honey 8.0% 72.6%
Jam 20.8% 54.3%
Syrup 4.3% 71.4%
Cumulatively, cooking oil (54.2%), margarine (33.4%), and butter (30.0%) were the
most frequently mentioned fats and oils that are used on a daily basis. Sugar was
mentioned by 58.0% of the respondents for daily use.
The four preceding tables suggest that the diet of the respondents mainly consists of
cereals (carbohydrates), with few variations. This monotonous diet may not meet
nutritional requirements.
4.2.6 Food Avoidances and Taboos
Most food avoidances reported by the respondents were based on issues concerning
pregnancy or illness. Avoidance of alcohol during illness, based on the belief that it
would interfere with an associated treatment, was mentioned frequently. Milk was
believed to cause diarrhoea during illness.
Any food product with a linear shape, such as intestines and dried meat (in the form
of biltong), was believed to cause foetal strangulation by the umbilical cord and was
therefore avoided by pregnant women. Eating mopani worms was thought to cause
salivating in babies. Eggs were believed to cause baldness. Some women believe that
game meat should also be avoided during pregnancy, as the child would inherit the
characteristics of the specific animal (i.e. a kudu jumps too much). Prolonged labour
94

and complications in childbirth were believed to be associated with eating tortoise
meat during pregnancy. Oranges and chilli peppers were linked to jaundice if eaten
during pregnancy. As most of the avoided foods mentioned are good sources of
protein which would be beneficial for foetal development, such avoidances might
result in monotonous diets which fail to meet the nutritional needs of a pregnant
woman. Findings of a study done in South Africa by the World Health Organization
(WHO, 2002, p. 23) suggested that chronic malnutrition was related to inadequate
resources, monotonous, poor-quality diets, and poor appetites.
During the weaning period, sweets and sweet foods were believed to reduce appetite,
pulses were believed to cause stomach distension and a bloated feeling, and wild
spinach was believed to cause diarrhoea and should consequently be avoided during
weaning.
4.2.7 Food Distribution, Storage and Preservation in Households
The majority of the respondents reported that females distribute food at mealtime - a
mother, wife, grandmother or daughter, who is present. Occasionally a father,
husband or boyfriend was mentioned. Slightly over half of the household heads (184
or 52.6%) stated that the family ate from the same plate or dish while the remaining
respondents (166 or 47.4%) ate from their own plates.
A sizeable number of respondents (157 or 44.9%) reported that they experience an
occasional reduction in the frequency of meals consumed. Reasons cited for the
reduction were the lack of money, food or water. A reduction in the amount of food
consumed each meal was reported by 166 (47.4%) respondents, and again the reasons
given by 162 (46.3%) respondents were a lack of money, food or water.
Most of the respondents reported that they store uncooked food in cool dry places,
such as cupboards, baskets or refrigerators, and a few mentioned that they dry meat.
Cooked food was reported to be stored covered and in cool places, such as under the
bed or refrigerator. Some reported cooking only enough food for a single mealtime
with no leftovers kept. Some respondents even reported that left-over food was given
to children or thrown away.
4.2.8 Breastfeeding and Weaning
An overwhelming number (311 or 88.9%) of the respondents reported that they
breastfed their children. Only 39 (11.1%) reported that they did not breastfeed of
95

which 25 (7.1%) were males. Almost all Namibian children (95.0%) are breastfed for
some period of time, regardless of the background characteristics of the mother or
child (MoHSS, 2003, p. 143).
More than three quarters of the respondents (273 or 78.0%) reported that they did not
introduce any other fluids within 72 hours after birth, while 70 (20.0%) reported
introducing other fluids. The remaining seven respondents (2.0%) did not remember
whether other fluids were introduced.
Fluids introduced within 72 hours after birth
05
10152025303540
milk
(oth
erth
anbr
east
milk
)
gluc
ose
wat
er
salt
&su
gar
solu
tion
fruit
juic
e
infa
ntfo
rmul
a
tea
hone
y
othe
rnum
ber o
f par
ticip
ants
Figure 4.8: Fluids introduced within 72 hours after birth
Sugar water was most frequently mentioned by those who introduced fluids within the
first 72 hours after delivery. Infant formula ranked second, and milk (other than
breastmilk) was third.
About one third (108 or 30.9%) of the respondents reported that they were
breastfeeding at the time of the interview, while the remaining 242 (69.1%) reported
that they were not breastfeeding at the time.
96

Duration of Breastfeeding
0102030405060708090
< 1 M
onth
1 - 3
Months
4 - 6
Months
7 - 9
Months
10 -1
2 Mon
ths
13 - 1
8 Mon
ths
19 - 2
4 Mon
ths
25 - 3
0 Mon
ths
31 - 3
6 Mon
ths
37 - 4
2 Mon
ths
43 - 4
8 Mon
ths
num
ber o
f par
ticip
ants
Figure 4.9: Duration of
Breastfeeding
Fig 4.9 reveals that the majority of
children were breastfed for about 24
months. Very few children were
breastfed after 24 months of age.
The median duration for
breastfeeding is 20 months for rural
areas and 13 months for urban
97

areas (MoHSS, 2003, p. 146). This
finding indicates that women in the
informal settlements tend to
breastfeed longer than the median
for urban areas.
Table 4.5: Fluids Taken by the Child
in the Last 24 Hours (n = 350)Type of drink Daytime Night Time Day and Night
Breastmilk 52 14.9% 7 2% 43 12.3%
Plain water 121 34.6% 13 3.7% 99 28.3%
Commercially produced infant formula
19 5.4% 7 2.0% 14 4.0%
Any other milk 27 7.7% 7 2.0% 14 4.0%
Fruit juice 34 9.7% 3 0.9% 18 5.1%
Any other liquid 88 25.1% 9 2.6% 38 10.9%
Cumulatively, 121 (34.6%) of the respondents reported to have given plain water to
their children sometime during the previous 24 hours. Although water is important for
maintaining health, it has no nutritional value. Water displaces nutritious substances,
especially in the case of growing children, who require a substantial nutritional intake.
98

Table 4.6: Solid Foods Taken by the Child in the Last 24 Hours (n = 350)
Type
of
Food
Daytime Night Time Day and Night
Millet 35 10.0% 9 2.6% 14 4.0%
Sorghum 22 6.3% 10 2.9% 20 5.7%
Maize
porridge125 35.7% 23 6.6% 121 34.6%
Rice 37 10.6% 16 4.5% 30 8.6%
Wheat 30 8.6% 11 3.1% 46 13.1%
Other local grains 26 7.4% 9 2.6% 17 4.9%
Of the respondents, 125 (35.7%)
mentioned they gave maize porridge
as a solid food to their child
sometime during the previous 24
hours. Just over half (182 or 52.0%) of the respondents reported that their children consumed
three meals a day, while 107 (30.6%) reported only two meals a day. Only 10 (2.9%)
99

respondents stated that their children had five meals a day, while 15 (4.2%) reported
only one meal a day. This information is in agreement with that reported in the
Namibian Demographic Health Survey, that the majority of Namibian children 10
months of age or older were given solid foods two or three times a day (MoHSS,
2003, p. 157). In general, children were given protein-source foods only when
available, and the source most mentioned was eggs.
4.2.9 Household Food security
The majority of the respondents (293 or 83.7%) reported to have staple food (maize
meal) in their house at the time of the interview while 57 (16.3%) reported not to have
any staple food remaining.
Main Source of Food Supplies
0
20
40
60
80
100
Ow
nP
rodu
ctio
n
Pur
chas
ed
Beg
ged
Food
Gift
from
Rel
ief
Age
ncy
orO
ther
perc
ent
Figure 4.10: Main Source of
Food Supplies
Fig. 4.10 reveals that the majority of
the respondents purchased food.
Only 46 (13.1%) depended on their
100

own production as the main source
of food. The statistical analysis did
not reveal an association between
the main source of food supply and
nutritional indicators, be they
underweight, wasting or stunting.
However, an association was
reported between the phenomenon
of begging for food and stunting
p<0.05=0.0183. From this finding it
can be concluded that households
who find it necessary to beg for food
are more likely to have children who
are stunted.
101

Main Source of Income
0102030405060
Social
gran
t
Busine
ss
Employm
ent
Borrow
ed M
oney
Asset
Sales
Pensio
n
Odd Jo
bsOthe
r
perc
ent
Figure 4.11: Main Source of Income
Employment for wages or salary is the main source of income for purchasing food
items, as 175 (50.0%) respondents reported as such. The 2001 Population and
Housing Census data reported that the main source of income, 75.0%, was wages and
salaries (NPC 2003, p. 51). This support the current findings that respondents in urban
settings primarily dependent on employment to purchase food items.
0
10
20
30
40
50
perc
ent
< N$ 500 > N$ 500 Not Recorded
Monthly Income
Figure 4.12: Monthly Income
102

Slightly less than half of the
respondents (168 or 48.0%),
reported a monthly income below
N$500.00 while 144 (41.1%)
reported earning more than
N$500.00. The remaining 38
respondents (10.9%) did not report
their earnings. The overwhelming
majority, 276 or 78.9%, spent less
than N$500.00 per month on food
while only 74 (21.1%) spent between
N$501 and N$1500. Only 73 respondents (20.9%) reported that they eat away from home while the
majority (277 or 79.1%) reported eating at home.
103

Table 4.7: Household Wealth/
Ownership of LivestockLivestock Yes No
Goats 11.3% 88.7%
Chicken 12.3% 87.7%
Other poultry 3.6% 96.4%
Pigs 2.9% 97.1%
Cattle 7.0% 93.0%
Other 7.3% 92.7%
Possession of livestock would
indicate an additional source of
income and food which could
contribute greatly to household food
security, a determinant of the
nutritional status of household
members. The majority of the respondents reported they were not involved in any form of
agricultural production.
4.2.10 Water and Sanitation
104

An overwhelming majority of the
respondents (331 or 94.6%)
reported that their main source of
water was a tap. This finding
compares favorably with the 2001
population and housing census data
that reported that 98.0% of
households in Khomas region had
access to safe drinking water. Lack
of access to water and a lack of
sanitary facilities create an
environment conducive to infectious
diseases. Such conditions could be
linked to the 2006 outbreak of polio
in Namibia (NPC 2003, p. 49). From
105

the remaining respondents, only
eight (2.3%) sourced water from a
river or stream, six (1.7%) from
unprotected wells and five (1.4%)
from either a tanker or a borehole.
The distance to a water source, in
terms of the time needed to reach it,
was reported by the majority of
subjects (325 or 92.9%) to be within
15 minutes, while 20 (5.7%) could
reach their water source in 15 to 30
minutes. Only five subjects (1.4%)
reported they required more than
30 minutes to reach their water
source.
106

Table 4.8: Sanitary FacilitiesFacility selected Frequency out of 350 Percentage
Bush 148 42.3%
Uncovered latrine 16 4.6%
Covered latrine 26 7.4%
Flush toilet 160 45.7%
More than one third (42.3%) of the
respondents reported that they
make use of the nearby bush for
sanitary facilicites. Less than half of
the respondents (45.7%) reported
using flush toilets. The remaining
12.0% of respondents used both
covered and uncovered latrines.
Once again, this data concurs with
census data which reported that
42.0% of households in the Khomas
107

region were without toilet facilities
(NPC 2003, p. 51).
The majority of the respondents
(89.1%) could reach their sanitary
facilities within 15 minutes, 8.6%
required between 15 and 30
minutes, while only 2.3% used
sanitary facilities which were more
than 30 minutes away.
4.2.11 Nutritional Status and
Anthropometrical MeasurementsMore than three quarters of the respondents (280 or 80.0%) reported that their
children had birth certificates, while only 70 (20.0%) reported that they did not.
Slightly over half of the children covered by the survey (50.8%) were male; 49.2%
were female.
Oedema was observed in only 6.1%
of the children in the study. The
108

majority (93.9%) did not have any
oedema.Nutritional status is a major determinant of children’s susceptibility to disease.
Anthropometry can be used to assess nutritional status at both the individual and
community levels. Two preferred anthropometric indices for determining nutritional
status are weight-for-height (WH) and height-for-age, as these discriminate between
different physiological processes (Sullivan & Gorstein, (n.d.) p.3).
Table 4.9: Relative Prevalence of
Low Anthropometric ValuesIndex Low Medium High Very High
Low WH <5.0% 5.0 – 9.9% 10.0 – 14.9% ≥15.0%
Low HA <20.0% 20.0 – 29.9% 30.0 – 39.9% ≥40.0%
Low WA <10.0% 10.0 19.9% 20.0 – 29.9% ≥30.0%
Source: (Sullivan and Gorstein, (n.d.) p.3)
WastingA low WH ratio is considered an indicator of wasting and is generally associated with
a failure to gain weight or with a loss of weight (Sullivan & Gorstein, (n.d.) p.3).
According to the table above, the prevalence rate (19.7%) for wasting in the informal
settlements was found to be greater than 15.0% and is therefore classified as having a
very high prevalence. Also, when compared to the Namibia Demographic Health
Survey (NDHS) findings (9.0%), it is very high (MoHSS, 2003, p. 146).
109

Underweight Weight-for-age (WA) is a composite index of weight-for-height and height-for-age
and as such does not distinguish between acute malnutrition (wasting) and chronic
malnutrition (stunting). A child may be underweight for his age because he is stunted,
wasted or both. However, the weight-for-age index is a useful tool in clinical settings
for continuous assessment of nutritional progress and growth (MoHSS, 2003, p. 151).
This study found that 35.7% of children in informal settings were underweight. This
finding is rated as very high (ie. above 30.0%) in the reference table. The NDHS
revealed that 24.0% (a high rating) of children under five years of age are
underweight.
Stunting A low Height-for-Age index (HA) is considered an indicator of stunting which is
associated with poor overall economic conditions and/or repeated exposure to adverse
conditions (Sullivan & Gorstein, (n.d.) p.3). The stunting rate of children under five
years of age residing in the informal settlements of Windhoek was found to be 28.8%,
which is lower than the Khomas region stunting rate of 47.0%.
In this study, stunting was rated medium prevalence (28.8%), wasting was rated high
(19.7%), and underweight very high (35.7%).
According to the statistical analysis, no association was discovered to exist between
the nutritional status of the mother/caretaker and the child’s nutritional status.
The number of children orphaned by their mother was only 3.3% percent. The
mothers of the remaining 96.7% of children covered were still alive. Similarly,
children orphaned by their fathers were only 5.7% of the sample. The fathers of the
remaining 94.3% were still alive.
110

Table 4.10 Nutritional Status by
Location
Locatio
nWasting rate Stunting rate Underweight rate
Okuryangava 52.2% 55.8% 51.6%
Havana 34.8% 26.2% 33.0%
Otjomuise 4.3% 0.0% 6.6%
Windhoek rural 8.7% 18.0% 8.8%
From table 4.10, Okuryangava is shown to have the highest figure for each of the
three indicators. There is an acute shortage of nutritious food in urban locations. This
shortage can possibly be attributed to the unemployment rate and low income levels
reported by households. On the other hand, Otjomuise seems to have relatively low
indicators of malnutrition.
111

4.2.12Childhood Morbidity during the
Previous Two Weeks
Table 4.11: Childhood Morbidity
during the Previous Two Weeks
Condition
selectedFrequency out of 350 Percentage
Diarrhoea 84 24.0%
Fever/ Difficult breathing 49 14.0%
Fever/Chills 57 16.3%
Childhood morbidity was only reported by 190 (54.3%) respondents. Diarrhoea was
the most frequently (24.0%) mentioned category of morbidity, followed by fever and
chills (16.3%).
It was reported verbally that the majority of children 326 (93.1%) were up-to-date for
immunization for their respective ages, only 24 (6.9%) did not report. Slightly more
than three quarter 276 (78.9%) presented their health passports for verification of the
immunization status.
112

0.00%
20.00%
40.00%
60.00%
80.00%
Vitamin A Status
Yes No Not Recorded
Figure 4.13: Vitamin A Status
The majority of the respondents (271 or 77.4%) reported that the children received
Vitamin A supplements at six months while 64 (18.3%) reported that the children did
not receive them. The remaining 15 (4.3%) were not recorded. The statistical analysis
did found no association between Vitamin A status and stunting or wasting.
Of the respondents, 56 (16.0%)
reported that their children
experienced some difficulty seeing at
night while 294 (84.0%) reported
that they did not experience this
problem. A study done by the
Ministry of Health reported that for
113

12 out of 19 villages examined,
vitamin A deficiency was observed
as being a problem (MoHSS, 1993,
p. 21).Table 4.12: Health-Seeking Behaviour
Action selected Frequency out of 350 Percentage
No treatment sought outside home 65 18.6%
Health Centre/clinic 218 62.3%
Self medication without consultation 17 4.9%
Traditional healer 15 4.3%
Private physician 7 2.0%
Outreach clinic 5 1.4%
Other 4 1.1%
Close to two thirds of the
respondents (62.3%) visited the
clinic when their child had been sick
recently while a sizeable number
114

(18.6%) did not seek treatment
outside the home.The distance to the nearest health facility (in walking time) ranged from 15 minutes to
more than two hours. Rural communities experienced difficulties accessing
transportation, and a distance of 30 kilometres could easily require two to three hours
in transit, depending on the availability of transportation.
The distance to a health facility definitely influences the utilization of health services:
the shorter the distance to a health centre, the more likely it will be used.
115

4.3 SUMMARY
The researcher was able to reach
only 95.9% (350) of the households
indicated for the study. Statistical
analysis was done using the SPSS
and EPI INFO 6 and with assistance
from a statistician and a
nutritionist. The majority of the
respondents were in the age group
of 20 to 59 years of age. Over half
the households were male-headed;
close to two thirds were headed by
single parents. Both urban and
rural informal settlements were
included in the study and all
subsections represented.
116

The majority of households had between one and five family members with only few
elderly and sick people. Death in the family was not experienced frequently by
respondents, with only 26 households (7.4%) reporting a death occurring within the
past year. About two thirds of the family deaths were due to long illness. With
consideration of the age group covered in the study (21 to 50 years) and the
prevalence of HIV/AIDS in Namibia, there could be an association between
HIV/AIDS and these deaths, but this eventuality was not explored.
In the informal settlements the main food consumed by the majority of respondents
was maize; this majority maintained diets which may be classified as monotonous
since only few consumed a combination of fruits, vegetables and meat. Sources of
protein were influenced by cultural beliefs and some available sources were avoided
during pregnancy, weaning or illness. For the most part, women were responsible for
distributing food to family members.
Just below half of the respondents reported occasional reduction in meal frequency
due to lack of resources such as money, food and/or water. Locally available
resources were used to preserve and store both cooked and uncooked food supplies.
The overwhelming majority of children were breastfed initially and these feedings
were provided on demand. Fluids such as sugar water were introduced quite early in a
child’s life (within 72 hours after birth).
While the majority of households had access to food supplies through purchasing,
more than half earned less than N$500.00 per month. These earnings were derived
mainly from employment and businesses. The majority of the respondents were
neither involved in agricultural production nor kept livestock.
The study revealed that the majority of respondents had a safe source of water that
was within 15 minute’s walk of their household. Only 5.4% did not have access to
safe drinking water. On the other hand, accessible sanitary facilities were inadequate,
with 42.3% of the respondents reporting that they used nearby bush. This situation
presents a risk to public health because it could lead to an outbreak of disease, as was
indicated in the 2006 polio outbreak, which mainly affected the informal settlements
areas of Windhoek.
The malnutrition rates revealed by this study are: stunting rated medium prevalence
with 28.8%, wasting rated high (19.7%) and underweight very high (35.7%).
117
The majority of the variables did not show an association with nutritional status.
However, a link between begging for food and stunting was indicated.
Only a small percentage of children included in the study population were orphaned
either by their mother and/or father. A sizeable number of respondents reported to
have visited a health facility recently when their child was sick. The most frequently
mentioned illness was diarrhoea. Immunization and Vitamin A coverage was reported
to be more than 75.0%.
118

CHAPTER 5
CONCLUSIONS, LIMITATIONS
AND RECOMMENDATIONS
5.1 INTRODUCTION
In this chapter, findings, conclusions
and recommendations based on the
findings of the study and its
limitations will be presented. A
study of this nature is important
because good nutrition, which is
indicated by nutritional status, is
essential if an individual is to
achieve his or her full potential both
physically and economically.
119

Research Questions• What are the main causes of malnutrition in the informal settlements of
Windhoek?
• What is the correlation between the nutritional status of children under the age of
five years and factors that may contribute to malnutrition in the informal
settlements of Windhoek?
5.2 CONCLUSION AND RECOMMENDATIONS ABOUT THE OBJECTIVES
The findings of the study are
concluded and recommendations
made in relation to the study as
follows:Aim
The aim of the study is to explore and describe the prevalence and causes of
malnutrition among children under five years of age in the informal settlements of
Windhoek in order to provide information for stakeholders to assist them design a
comprehensive project that will address the problem.
Objective 1
To determine the prevalence and causes of malnutrition in selected communities in
Windhoek.
120

Conclusion (Objective 1)
The study results indicate that the prevalence of malnutrition ranges from medium to
very high in the informal settlements. The stunting rate was 28.8%, the wasting rate
was 19.7%, while the underweight rate was 35.7%. The nutritional indicators were
explained in detail in the study. The majority of respondents earn a salary of less than
N$500.00 per month, and consequently could not afford food that is adequate in both
quantity and quality. Diets were found to be monotonous. Very few respondents
reached school grade 12, a factor which would limit employment opportunities on the
level of working class, for which wages are also low.
Types of food avoided during pregnancy and weaning were predominantly sources of
protein, a crucial nutrient for the normal growth of a baby or foetus. This could
contribute to malnutrition in utero.
Objective 2
To correlate nutritional status (well nourished, malnourished children) and the
contributing factors for children under the age of five years (weaning, knowledge).
Correlation is a statistical measure referring to the relationship between two or more
variables. A correlation between two variables suggests some causal relationship
between them (www.nzforex.co.nz).
Conclusion (Objective 2)
The study indicated that there was no association between:
underweight, stunting, wasting and oedema.
underweight, stunting, wasting and vaccination status
underweight, stunting, wasting and mother/caretaker’s body mass index
underweight, stunting, wasting and difficult breathing or fever
underweight, stunting, wasting and fever or chills
underweight, stunting, wasting and the presence of staple food
121

There is an association between
diarrhoea and underweight,
p<0.05=0.0063. Therefore, babies
who are ill with diarrhoea are more
likely to be underweight.
There is an association between
begging for food and the stunting
rate, p<0.05=0.0183. It was
concluded that households which
begged for food are more likely to
have children that are stunted.Objective 3
To describe factors associated with malnutrition in children between one and five
years of age in the informal settlements of Windhoek.
Conclusion (Objective 3)
Malnutrition prevents children, women and communities from achieving their full
mental, physical and economic capacity, thereby creating dependence and hindering
development of the nation.
122

The findings in several categories indicate that the root of malnutrition can be linked
to poverty, which could be caused by unemployment, low educational levels or a
combination of both.
5.3 LIMITATIONS
Insufficient Time
Time available to conduct the study was the main constraint, as the researcher had
other commitments which encroached on that time. Research assistants were available
for a total of only seven days and the data collection process had to be completed
within that period.
Language Barrier
The main language of a majority of the respondents was “Oshiwambo”.
Communicating with the respondents was challenging and the duration of interviews
became lengthy, as translators were needed. In addition, information gathered through
translation was often incomplete.
Limited Resources
Computers outfitted with
appropriate data analysis
programmes were not available at
the resource center, a factor which
caused delays in data analysis and
interpretation. The costs involved
in conducting a project of this
nature are too great to be carried by 123

a private individual, necessitating
the procurement of sponsorships
and recruitment of students who
would be willing to sponsor
themselves.
Research AssistanceA pilot study was not conducted because MoHSS would not make anthropometrical
equipment available. Due to this hindrance, preparation of the research assistants was
also problematic.
5.4 RECOMMENDATIONS
Among the serious developmental
problems facing Namibia,
malnutrition is one which could be
reduced significantly. It is possible
to design and implement cost-
effective programmes which could
address the problem in
124

collaboration with all stakeholders.
Some suggestions which could assist
in the achievement of viable
solutions are: Improve the quality and quantity of diets by improving household food
security through income-generating activities, micro-gardening, poultry
farming, rabbit breeding, or fish-farming.
Promote micro-gardening or homestead gardening, practices which facilitate
an increased intake of additional nutrients, such as Vitamin A, through leafy
green vegetables.
Implement a programme for nutrition extension workers (nurses and other
health practitioners who focus on this area of activity), or volunteers to create
awareness and educate communities on the importance of nutrition and the
dangers of malnutrition in the informal settlements.
Establish or strengthen community-based growth monitoring activities in
order to identify children who fail to thrive.
Identify and involve stakeholders who could contribute to solutions to the
nutrition crisis. These could include the community, the government of
Namibia, non-governmental organizations, faith-based organizations, and the
international community.
Establish poverty reduction programmes which are linked to education for
long-term solutions.
As an interim measure, the World Food Program should be approached to
provide food baskets to meet pressing needs. Malnutrition represents a serious
crisis and needs to be treated as such.
125

Follow-up research needs to be conducted to identify development agencies already
active in the informal settlements. Studies are needed as well, which would compare
prevalence rates between formal and informal settlements.
5.5 SUMMARY
This chapter highlighted main conclusions drawn from the study findings, which
indicated that malnutrition is a serious problem facing the inhabitants of the In-formal
settlements in Windhoek. The government, civil society and the community at large
need to joint efforts in addressing this problem. Language barrier, limited resources
and insufficient time were considered as main study limitations.
126

6. REFERENCES
Barnett, A. and Rugalema, G. (2001). Health and Nutrition Emerging and
Reemerging Issues in Developing Countries. HIV/AIDS: 2020 Focus 5, Brief 3 of
11. Retrieved June 7, 2005 from
http://www.ifri.org/2020/focus/focus05/focus05_03.htm.
Bekele, F. (1998). Malnutrition: The ‘Silent Emergency’. Africa Recovery, Vol.
11 #3 p. 3. Retrieved March 21, 2005 from
http://www.un.org/ecosocdev/geninfo/afrec/subjindx/113hung.htm.
Berkow, R., Beers, & H. M., Bogin, M. R. (1999). Merck Manual. Whitehouse
Station. N.J.: Merck & Co., Inc.
Brink, H. I. (2002). Fundamentals of Research Methodology for Health Care
Professionals. Landsdowne: Juta & Co. Ltd.
Brown, P. (2000). Coordinated Global Action Could End Malnutrition in Young
Children. British Medical Journal. March 25, 2000 v320 i7238 p. 825. Retrieved
on June 7, 2005 from: http://www.galenet.galegroup.com/servlet/HWRC/hits.
Bless, C., & Higson-Smith, C. (1995). Social Research Method: An African
Perspective. RSA: Juta and Co, Ltd.
Bloss, E., Wainaina, F., & Bailey, R. C. (2004). Prevalence and Predictors of
Underweight, Stunting and Wasting Amongst Children Aged 5 and under in
Western Kenya. Journal of Tropical Pediatrics. Vol. 50 no 5. Oxford University
Press.
127

Engle, P. L., Menon, P., & Haddad, L. (1996). Care and Nutrition: Concepts and
Measurement. FCND Discussion Paper no 18. Washington D.C.: International
Food Policy Research Institute.
Ethiopia Central Statistical Authority (ECSA). (2000). Ethiopian Demographic
Health Survey. Addis Ababa: Central Statistical Authority.
Foote, K. D., & Marriott, L. D. (2003). Weaning of Infants: A Review. Ach dis
Child 88: pp. 488 – 493.
Giraldo, R. (2003). Southern African Development Community (SADC)
Ministerial Consultative meeting on Nutrition and AIDS. Retrieved on March 20,
2005 from: http://www.robertogiraldo.com/eng/papers/SADC_Report_2003.html.
Girma W., & Genebo, T. (2002). Determinants of Nutritional Status of Women
and Children in Ethiopia. Maryland, USA. ORC Marco.
Hafes, A., Torlesse, H., Moestue, H., Hall, S., Kless, L., & Bloem, M. W. (2003).
Dietary Diversity in Bangladesh (Unpublished).
Julie, M., Van Weissenbruch M. M., Delemarre-van de Waal, H. A. & Surjono, A.
(2004). Influence of socioeconomic status on the prevalence of stunted growth
and obesity in prepubertal Indonesian children. Food and Nutrition Bulletin, vol.
25 no 1. The United Nations University.
Khokhar, A., Sigh, S., Talwar, R., Rasania, S.K., Badhan, S.R., & Mehra, M.
(2003). A Study of Malnutrition Among Children Aged 6 Months and 2 Years
from Resettlement Colony of Delhi. Indian Journal of Medical Sciences. July
2003 v57 i7 p NA (7). Retrieved on March 20, 2005 from
http://www.galenet.galegroup.com/servlet/HWRC/hits.
128

Lutter, C. (2003). Meeting the Challenge to Improve Complementary Feeding:
Standing Committee on Nutrition News, December 2003. United Kingdom:
Lavenham Press.
Makinwa, B. (2003). HIV/AIDS and Famine in SADC Region. SADC Meeting
Proceedings. Accessed on March 20, 2005 from
http://www.robertogiraldo.com/eng/papers/SADC_Reports_2003.html.
Mason, J., Rivers, J., & Helwig. (2005). Recent Trends in Malnutrition in
Developing Regions: Vitamin A Deficiency, Anemia, Iodine Deficiency and
Child Underweight. Food and Nutrition Bulletin, vol. 26 no1. The United Nations
University.
Mercando, J. (2004). Making Sense of Nutritional Statistics. Result of the
Philippine National Nutritional Survey of 2003. (Unpublished).
Ministry of Health and Social Services (MOHSS) (1993). Iodine Deficiency
Disorders and Data on the Status of Vitamin A and Iron. Windhoek, Namibia:
MOHSS.
Ministry of Health and Social Services (MOHSS). (2003). Namibia Demographic
Health Survey 2000 . Windhoek, Namibia: MOHSS.
Mittendorfer, E. (2001). Nutrition Country Profile. FAO, ESNA. Rome.
Randstad, B.V. (1998). Nutrition: Interaction of Food, Health and Care. Sectoral
and Theme Policy Document of Development Cooperation. Amsterdam, The
Netherlands: Ministry of Foreign Affairs.
129

National Planning Commission (NPC) Central Statistics Office (2003).
Population and Housing Census 2001: Basic Analysis and Highlights. Windhoek,
Namibia.
Polit, D. F., Beck, C. T. and Hungler, B. P. (2001). Essentials of Nursing
Research Methods, Appraisal, and Utilization. Lippincott. New York.
Smith, L. C., & Haddad, L. (2000). Overcoming Child Malnutrition in
Developing Countries: Past Achievements and Future Choices. 2020 Brief No 64.
Retrieved on April 14, 2005 from:
http://www.ifpri.org/2020/briefs/number64.htm.
Southern African Development Community (SADC). (2003). Namibia
Emergency Needs Assessment Report. DFID et al., Windhoek, Namibia.
Struwig, F. W., & Stead, G. B. (2004). Planning, Designing, and Reporting
Research. Cape Town: Maskew Miller Longman (Pty) Ltd.
Strydom, H., Fouche, C.B., & Delport, C. S. L. (2004). Research at Grassroots.
Pretoria: Van Schaik Publishers.
Sullivan, K., & Gorstein, J. Programs for Nutritional Anthropometry.
(Unpublished – Tutorial).
Sweet, J. (1998). Livestock – Coping with Drought: Namibia – A Case Study.
(Unpublished).
Van Schalkwyk, P. (2004). A Review of Namibian Trade and Industry. Windhoek,
Namibia: John Meinert Printing Ltd.
130

Verhoef, H., West, C. E., Veenemans, J., Beguin, Y. & Kok, F. J. (2002). Stunting
May Determine the Severity of Malaria-Associated Aneamia in African Children.
Pediatrics. Vol. 110 no 4. October, p. 1 – 5.
WHO (2002). Multi-country study on improving household food and nutritional security for the vulnerable. A qualitative study on food security and caring patterns of vulnerable young children in South Africa (unpublished)
WHO (2003a). Alleviating Protein-Energy Malnutrition: The Challenge.
Retrieved on March 23, 2005 from http://www.who.int/nut/pem.htm.
WHO (2003b). Nutrition Research: Pursuing Sustainable Solutions. Retrieved on
April 14, 2005 from http://www.who.int/nut/research2.htm.
WHO (2004). 5th Report on the World Nutrition Situation – Nutrition for
Improved Development Outcomes. Standing Committee on Nutrition (SCN).
Geneva.
131

Annexure A: Letters to stakeholders
132

P. 0. Box 8795B achbrecht
WindhoekMay7, 2006
The Office of CEOCity of WindhoekWindhoek
Re: Study on Causes of malnutrition anzongst children 1-5 years in non-formal settlement in Windhoek, May 8— 12, 2006
I (Philomena Ochurus) am a Master in Public Health student with the University of Namibia. I am planning to do data collection on the aforementioned topic during the second week in May. The national Health Training Center availed 95 student nurses as research assistants and the National Planning Commissioned availed the anthropometrical equipment for the study.
Hereby I would like to humbly request your office to inform the all protocol (Political and Community Leaders) and the community to grand us permission and cooperation to do the data collection. The study will be done in Havana, Otjomuise, Okuryangava, Aris, Kappsfarm and Dordabis (Non-Formal Settlements) From May 8 — 12, 2006; a preliminary study will be done on Tuesday May 2, 2006 in Katutura and Khomasdal. The study results will be use in planning and implementation of services for these communities.
If possible, during the second week of may could we have the presence of the City Police just to ensure the safety of the research assistants.Should you have any questions, please do not hesitate to contact me at 0812217994.Counting on your support and cooperation.
Thanking you in advance.
Yours Faithfully
Philomena Ochurus2 1
133

P.O. Box 8795BachbrechtWindhoek
April 12 2006The Permanent SecretaryNational Planning CommissionPrivate Bag 13356Windhoek
Attention Government Statistician
Re: Request for scales and measuring boardsfor a nutrition study
I (Philomena Ochurus) am currently enrolled for the Masters in public Health at the University of Narnibia and will be writing my thesis this year.My area of my interest has always been nutrition and the high stunting rate in Khomas regiontriggered my curiosity to wanting to find out the reasons why,therefore the title of my study isCauses of Malnutrition amongst children 1 — 5 years in Non -Fol7nal Settlement – In WindhoekA preliminary study is planned for April 29, 2006 at the Five Rand Camp. a Non-formal Settlement just outside Okahandja whilst the actual study is planned from May 3 — 16. 2006. Second year students (95) have been granted as research assistant. To expose all students to the research process it was decided to divide them into 10 small groups and only 2 groups will be out in the field on a daily basis. Hereby, your office is humbly to provide us with 6 Salter scales, 6 bathroom scales, 6 measuring board to determine length of the babies and 6 measuring stands/tapes to measure the height of the caretakers and children. Use of standard equipment is crucial for this study.
Initially request was send to the Ministry of Health and Social Services and the response was that they also borrow from the National Planning when they do surveys.
I can be reached at telephone #061-226525 or 0812217994 for further clarifications or to set up a meeting with you.
Thanking you in advance for your usual cooperation and assistance, which is as always highly appreciated.
Yours Sincerely,
Philomena Ochurus, R.NMaster in Public Health StudentUniversity of Namibia
134

U. S. Peace CorpsP.O. Box 6862
AusspannplatzWindhoek
February 21. 2006The Permanent SecretaryMinistry of Health and Social ServicesPrivate Bag 13198Windhoek
Dear Dr. Shangula
Re: Request for the Students of the National Health Training Center as research assistants
I (Philomena Ochurus) am currently enrolled for the Masters in public Health at the University of Namibia and will be writing my thesis this year.
My area of my interest has always been nutrition and the high stunting rate in Khomas regiontriggered my curiosity to wanting to find out the reasons why, therefore the title of my study isCauses of Malnutrition amongst children 1 — 5 years in Non-Formal Settlement - InWindhoek.
I thought involving the student in my study will benefit both the students and myself in the sense that they will have a practical exposure of research and also help with accurate data collection as especially the anthropometrical measurements and interviewing the respondent that might be difficult for the a person from the street.
A preliminary study is planned for April 7, 2006 at the Five Rand Camp, a Non-formalSettlement just outside Okahandja v’hilst the actual study is planned from May 1 — 14, 2006.Depending on the number of available students data collection could be done in less than a week.In collaboration with The NHTC staff maximum learning could be ensured. The informationgathered could be utilized in programme planning and implementation.
Hereby, you are kindly requested to avail the students to participate in this study. I can be reached at telephone #061-226525 or 0812217994 for further clarifications or to set up a meeting with you.
Thanking you in advance for your usual cooperation and assistance, which is as always highly appreciated.
Yours Sincerely.Phulomena Ochurus, R.N.Peace Corps HI V/A IDS Technical coordinator
135

P.O. Box 8795BachbrechtWindhoekAugust 11,2005The Permanent SecretaryMinistry of Health and Social ServicesPrivate Bag 13198Windhoek
Dear Dr. Shangula,
Re: Request for growth monitoring equipment for nutrition surveyAs a requirement for the Masters in Public Health Degree a student has to do a thesis on the topic of his/her choice. I, Philomena Ochurus, am currently enrolled with the University of Namibia for the Masters of Public Health Program and am required to do a thesis/dissertation of the topic of my interest. Child Nutrition has always been a subject of my interest, therefore I decided to a study on the. “Prevalence and causes of malnutrition a mongst children under 5 years of age in n on-formal settlement Khomas Region” in August —September 2005.• The objectives of the study is to determine the prevalence and causes of malnutrition in selected communities in Khomas region• To correlate nutritional status (well nourished, malnourished children) and the contributing factors for children under five years (weaning, knowledge)• To describe factors associated with malnutrition in the non-formal settlements of the Khomas regionHereby your office is kindly requested to provide me with the following equipment in order to determine the nutritional status of the children, viz. 2 Salter scales & pants, 2 measuring boards, 2 bathroom scales, 4 IVFUAC tapes and 4 measuring tapes. This equipment will be returned to the Ministry on completion of the study.Your assistance is as always highly appreciated. Thanking you in advanceYours Sincerely,
Philoniena Ochurus, R.N.Master in Public Health StudentUniversity of Nainibia
136

P.O. Box 8795BachbrechtWindhoekJune 2, 2005
Ms. Kafidi
Central Bureau of StatisticsNational Planning CommissionPrivate bag 13356Windhoek
Dear Ms. Kafidi
Re: Request for p opulation statistics o f t he non-formal settlements i n K homas RegionI am a Public Health student at UNAM and required to do a study as part of the course. The chosen study area is the non-formal settlements in Khomas Region. Therefore your office is kindly requested to provide the aforementioned information for both urban and rural communities.Information per settlement is required and if possible also breakdown in age groups such as under fives, males females.It will be highly appreciated if information could be provided by June 3, 2005.
Contact me on Cell #0811246981 or 231640/226525. Fax 239676.
Thanking you in advance
Yours Sincerely,
137

Annexure B: Responses from
stakeholders
138

03 MAY2006TO WHOM IT MAY CONCERN
Ministry/Organization
Date Received
Return date
Person responibIe
Name
Signature
Telephone/cell
Type of equipment/number/Please attach copy of request. A
The equipment appears above should be returned before/on the date of return tothe NATIONAL PLANNING COMMISSION-CENTRAL BUREAU OFSTATISTICS. Fr
Issuing officer, division and title DECTP.AT
Date.3 __._i
F PFVATE dAG i326
WINDHOEK
NOTE: (NAMPOL) To the officer in charge please allow the said number of equipment to pass through to the said ministry/organization.
139

REPUBLIC OF NAMIBIAMINISTRY OF HEALTH AND SOCIAL SERVICESNATIONAL HEALTH TRAINING CENTREPrivate Bag 13198Mahatina Gandhi Street Tel: (061) 2032579Windhoek Windhoek Fax: (061) 232830Namibia Email: nhtc(äiafrica.coin.na
Enquiries: Ms J. Leboea Ref: 17/8 Date:5” April 2006
DIRECTORATE: POLICY, PLANNING & HRD NATIONAL HEALTH TRAINING CENTRE
Dear Ms P. Ochurus
RE: REQUEST FOR NHTC STUDENTS ASSISTANCE IN DATA COLLECTION
In response to your letter requesting assistance of NHTC students in data collection. I would like to inform you that the NHTC welcomed the idea and also saw it as a golden opportunity for our 2nd year students who are having Research as a subject to be exposed to reality.The period indicated for data collection in your letter collides with the time when the students will be fulltime in the practical area and therefore can be utilized for that purpose. A number of ninety-five (95) students will be availed to you thus presume that a week will be enough to complete the task.You are therefore granted permission to make use of our students. All you need now will be to engage with Ms A. Kuutondokwa to arrange for this exercise. You can contact her at Tel no: 2032583 or 2032586Thanks in advance for granting our students the opportunity of a lifetime.
Yours sincerely
MS J. LEBOEA
140

ACTING: PRE-SERVICE HEADEDUCATION, TRAINING, COMPETENCE AND COMMITMENT FOR HEALTH AND SOCIAL DEVELOPMENT
UNIVERSITY OF NAMIBIAPrivate Bag 13301. 340 Mandume Ndemufayo Avenue, Pionierspark. Windhoek. NamihiaFACULTY OF MEDICAL AND HEALTH SCIENCES
Letter of permission:Post graduate students
To:From:Post graduate studentsProf A van DykProf L SmallDate:Dear Student:
The post graduate studies committee has approved your research proposal.
You may now proceed with your study and data collection.It may be required that you need to apply for additional permission to utilize your target population. If so, please submit this letter to the relevant organizations involved. It is stressed that you should n proceed with data collection and fieldwork before you have received this letter and got permission from the other institutions to conduct the study. It may also be expected that these organizations may require additional information from you.Please contact your supervisors on a regular basis.
Prof A van Dyk Prof L Small
Committee Chairperson of the Post Graduate
141

UNIVERSITY OF NAMIBIA -Private Bag 1330, 340 Mandume Ndemufayo Avenue, Pioneerspark, Windhoek, Namibia
From: Acting Dean of Faculty (Dr. L Haoses) Faculty of Medical and Health Sciences
Date: 10 February 2004
To who it may concern (e.g. School principal, Church leader, Head of village etc)
Subject: Undertaking Public Health Project
This is to confirm that Ms.. v (Student number$is studying for Masters of Public Health at the University of Namibia, Faculty of Medical and Health science and is in her/his 1st year of study.As part of course work, this student has to do a Public health project in a form of research project.The Faculty hereby requests your permission to allow her/him to use your facilities in order for her/him to complete her/his assignment.Your assistance in this regard is highly appreciated.
Thanking you in advance.
L. Haoses Dr. S. N. Iiginge(Acting Dean of Faculty) (Head of Department)
142

Annexure D: City map
143

OFFICE OF THE PRESIDENTNATIONAL PLANNING COMMISSION SECRETARIATCENSUS OFFICETel.: (061) 2834111 Private Bag 13356Fax: (061) 2834502 WINDHOEK
Enquiries: E. Kahitu
Our Ref 13/6 Your Ref: 6 June 2005
Ms. P. OchurusUNAMWindhoek
RE: REQUEST FOR POPULATION STATISTICS - NON-FORMAL SETTLEMENT IN KHOMAS
Dear Madam.
With reference to your letter dated the 2nd June 2005, regarding the above. Please find attached the information as requested.Please take note that for some settlements the information includes the whole settlement and not only the squatters.We hope that the information conforms to your request.Yours Sincerely,L. N. Kafid4Deputy Manager, Central Bureau of StatisticsREPUBLIC OF NAMIBIAAll official correspondence must be addressed to the Permanent Secretary
144

OFFICE OF THE PRESIDENTNATIONAL PLANNING COMMISSION SECRETARIATCENSUS OFFICETel.: (061) 2834111 Private Bag 13356Fax: (061) 2834502 WINDHOEKEnquiries: E. Kahitu
Our Ref 13/6 Your Ref: 6 June 2005
Ms. P. OchurusUNAMWindhoek
RE: REQUEST FOR POPULATION STATISTICS - NON-FORMAL SETTLEMENT IN KHOMAS
Dear Madam.
With reference to your letter dated the 2nd June 2005, regarding the above. Please find attached the information as requested.Please take note that for some settlements the information includes the whole settlement and not only the squatters.
We hope that the information conforms to your request.
Yours Sincerely,
L. N. KafidiDeputy Manager, Central Bureau of StatisticsREPUBLIC OF NAMIBIAAll official correspondence must be addressed to the Permanent Secretary
145