Embed Size (px)
Citation preview
Causes and Implications of Extreme Atmospheric Moisture Demand during theRecord-Breaking 2011 Wildfire Season in the Southwestern United States*
A. PARK WILLIAMS,a RICHARD SEAGER,b MAX BERKELHAMMER,c ALISON K. MACALADY,d,e
MICHAEL A. CRIMMINS,f THOMAS W. SWETNAM,e ANNA T. TRUGMAN,g
NIKOLAUS BUENNING,h NATALIA HRYNIW,i NATE G. MCDOWELL,j
DAVID NOONE,c CLAUDIA I. MORA,j AND THOM RAHNj
aDivision of Biology and Paleo Environment, Lamont-Doherty Earth Observatory, Columbia University,
Palisades, New YorkbDivision of Ocean and Climate Physics, Lamont-Doherty Earth Observatory, Columbia University,
Palisades, New YorkcDepartment of Atmospheric and Oceanic Sciences, and Cooperative Institute for Research in
Environmental Sciences, University of Colorado Boulder, Boulder, ColoradodSchool of Geography and Development, The University of Arizona, Tucson, Arizona
eLaboratory of Tree-Ring Research, The University of Arizona, Tucson, ArizonafCollege of Agriculture and Life Sciences, The University of Arizona, Tucson, Arizona
gDepartment of Atmospheric and Oceanic Sciences, Princeton University, Princeton, New JerseyhDepartment of Earth Sciences, University of Southern California, Los Angeles, California
iDepartment of Atmospheric Sciences, University of Washington, Seattle, WashingtonjEarth and Environmental Sciences Division, Los Alamos National Laboratory, Los Alamos, New Mexico
(Manuscript received 14 February 2014, in final form 11 August 2014)
ABSTRACT
In 2011, exceptionally low atmospheric moisture content combined with moderately high temperatures to
produce a record-high vapor pressure deficit (VPD) in the southwestern United States (SW). These condi-
tions combined with record-low cold-season precipitation to cause widespread drought and extremewildfires.
Although interannual VPD variability is generally dominated by temperature, high VPD in 2011 was also
driven by a lack of atmospheric moisture. TheMay–July 2011 dewpoint in the SWwas 4.5 standard deviations
below the long-term mean. Lack of atmospheric moisture was promoted by already very dry soils and am-
plified by a strong ocean-to-continent sea level pressure gradient and upper-level convergence that drove dry
northerly winds and subsidence upwind of and over the SW. Subsidence drove divergence of rapid and
dry surfacewinds over the SW, suppressing southerlymoisture imports and removingmoisture fromalready dry
soils. Model projections developed for the fifth phase of the Coupled Model Intercomparison Project (CMIP5)
suggest that by the 2050s warming trends will cause mean warm-season VPD to be comparable to the record-
high VPD observed in 2011. CMIP5 projections also suggest increased interannual variability of VPD, in-
dependent of trends in background mean levels, as a result of increased variability of dewpoint, temperature,
vapor pressure, and saturation vapor pressure. Increased variability in VPD translates to increased proba-
bility of 2011-type VPD anomalies, which would be superimposed on ever-greater background VPD levels.
Although temperaturewill continue to be the primary driver of interannualVPDvariability, 2011 served as an
important reminder that atmospheric moisture content can also drive impactful VPD anomalies.
1. Introduction
The southwestern United States (SW) experienced
extreme drought in 2011, related at least in part to a La
Niña event in the tropical Pacific Ocean (Rupp et al.
2012; Hoerling et al. 2013; Seager et al. 2014a). The 2011
SW drought event was accompanied by record-breaking
total burned area (Williams et al. 2014) and record-size
* Supplemental information related to this paper is available at
the Journals Online website: http://dx.doi.org/10.1175/JAMC-D-
14-0053.s1.
Corresponding author address: A. Park Williams, Division of
Biology and Paleo Environment, Lamont-Doherty Earth Obser-
vatory, 61 Rte. 9W, Palisades, NY 10964.
E-mail: [email protected]
DECEMBER 2014 W I LL IAMS ET AL . 2671
DOI: 10.1175/JAMC-D-14-0053.1
� 2014 American Meteorological Society
‘‘megafires’’ in the forests of eastern Arizona and
northern New Mexico. Extreme drought and wildfire
conditions prompted widespread concern as to whether
the anomalous 2011 conditions foreshadowed continued
intensification of regional drought-driven wildfires in
the SW as a result of greenhouse warming (e.g., Miller
2012; Nijhuis 2012).
Temperature has been shown to influence wildfire
behavior in the SW by positively influencing drought
(e.g.,Westerling et al. 2006; Littell et al. 2009;Abatzoglou
and Kolden 2013). The effect of temperature on drought
operates through an exponential forcing on atmospheric
moisture demand, or vapor pressure deficit (VPD)
(Anderson 1936; Williams et al. 2013, 2014). VPD is
defined as atmospheric saturation vapor pressure (the
water vapor holding capacity, which is purely a function
of temperature) minus actual vapor pressure. Therefore,
the influence of temperature on drought conditions can
be mitigated or amplified by variations in atmospheric
moisture content. Important is that temperature expo-
nentially influences VPD via its Clausius–Clapeyron
effect on saturation vapor pressure.
In 2011, a very large burned area in the SWco-occurred
with a high moisture deficit (driven by high VPD and low
precipitation), consistent with the well-known positive
correlation between drought and wildfire in the region
(e.g., Swetnam and Betancourt 1990, 1998; Westerling
et al. 2003, 2006; Westerling and Swetnam 2003; Littell
et al. 2009; Abatzoglou and Kolden 2013; Williams et al.
2013, 2014). The causes of low cold-season precipitation
in 2010/11 (which only reached extreme anomalies in
Texas, eastern New Mexico, and Mexico) have been di-
agnosed (Hoerling et al. 2013; Seager et al. 2014a), but
causes of extreme warm-season VPD have not. Here, we
diagnose the large-scale climate processes that resulted in
exceptionally high VPD in 2011. We then evaluate
modeled projections to better understand whether
projected trends in background mean climate resemble
the 2011 climate state in any important respects. We
also evaluate projected interannual variability of SW
VPD and its subcomponents to determine whether the
likelihood of extreme 2011-like excursions of VPD
from expected background levels may change in the
future.
2. Data and methods
We define the SW as the areas of Arizona, New
Mexico, Texas, Oklahoma, Colorado, and Utah that lie
south of 388N, north of 28.58N, and west of 1008W (as in
Williams et al. 2014). We used the ;4-km gridded
monthly (1895–2014) Parameter-Elevation Regressions
on Independent Slopes Model (PRISM) dataset
developed at Oregon State University (accessed in
August 2014) to evaluate precipitation, maximum daily
temperature Tmax, minimum daily temperature Tmin,
dewpoint, and VPD anomalies [VPD is calculated as in
Williams et al. (2013)]. Precipitation and temperature
data come from the latest version of the PRISM dataset
(http://www.prism.oregonstate.edu), but dewpoint data
come from the previous version (http://oldprism.nacse.
org) because dewpoint data are not yet included in the
new dataset. We calculate VPD using temperature from
the old dataset through 2013 to be consistent with the
dewpoint data. We calculate 2014 VPD using new-
dataset temperature because the old-dataset tempera-
ture record ends in 2013. Although PRISM may not be
ideal for evaluating long-term trends or temporal
anomalies at some specific locations or regions (e.g.,
Hamlet and Lettenmaier 2005), Williams et al. (2014)
demonstrate that PRISM climate records for the SW are
comparable to those calculated using a wide variety of
data products. An exception is for records of atmo-
spheric moisture (dewpoint) prior to 1961, when station-
based humidity measurements were rare. We therefore
report dewpoint andVPD anomalies relative to both the
post-1895 and post-1961 periods.
In addition, we accessed surface wind speed (hourly)
and soil moisture (monthly) data gridded at 0.1258 res-olution from the North American Land Data Assimi-
lation System project, phase 2 (NLDAS-2;Mitchell et al.
2004), for 1979–2014. NLDAS-2 near-surface (10m)
wind data are based upon the National Centers for En-
vironmental Prediction 3-hourly, 32-km North Ameri-
can Regional Reanalysis (NARR), produced using an
assimilation of surface measurements, radiosonde data,
and atmospheric modeling (Mesinger et al. 2006). For
soil moisture, we used NLDAS-2 data modeled with the
‘‘Noah’’ land surface model (Xia et al. 2012). We also
evaluated three-dimensional reanalysis climate data
using the Modern-Era Retrospective Analysis for Re-
search and Applications (MERRA; Rienecker et al.
2011). The geographic resolution of MERRA data
ranges from 0.58 to 1.258, and the span of temporal
coverage is 1979–2014. Data are available at a vertical
resolution of 25 hPa from the surface to 700 hPa and
50 hPa for 700–100 hPa. Climate indices evaluated were
the Pacific decadal oscillation (PDO; Mantua et al.
1997), the Southern Oscillation index (SOI; Trenberth
1984), and the Pacific–North American pattern [PNA;
based upon Wallace and Gutzler (1981) but with the
modified pointwise method described online at http://
www.cpc.ncep.noaa.gov/products/precip/CWlink/pna/
month_pna_index2.shtml].
We utilized the ensemble of monthly climate model
projections made for the fifth phase of the Coupled
2672 JOURNAL OF APPL IED METEOROLOGY AND CL IMATOLOGY VOLUME 53

Model Intercomparison Project (CMIP5) using the In-
tergovernmental Panel on Climate Change historical
experiment through 2005 and the emissions scenario
‘‘RCP 8.5’’ for 2006–2100 (anthropogenic radiative forc-
ing is;8.5Wm22 by 2100; Moss et al. 2010; van Vuuren
et al. 2011). A list of the 37 models considered is pro-
vided in Table S1 in the online supplemental material
for this paper. For temperature, precipitation, dewpoint,
and wind speed, we created monthly time series for the
SW by linearly interpolating monthly climate fields to
0.258 geographic resolution and calculating the mean
monthly value of grid cells within the SW.We calculated
monthly modeled VPD as in Williams et al. (2013). We
also calculated modeled projections of the PDO index,
the SOI, and the PNA index. We calculated the PDO
index following Lapp et al. (2012), the PNA index using
the modified pointwise method, and the SOI as the dif-
ference in surface pressure between Tahiti in French
Polynesia and Darwin, Australia (Trenberth 1984). All
model realizations of climate have biases in terms of
mean and variance. For each variable, we standardized
all model realizations of climate to a mean of 0 and
a standard deviation of 1 (i.e., z scores) during 1961–
2005. We measured magnitudes of future climate
changes as the ensemble-median and inner-quartile
anomalies averaged across 2035–79 versus those for
1961–2005. Ensemble-median and inner-quartile dif-
ferences between the two time periods were calculated
by considering each model only once, regardless of the
number of model runs available for each model. Multi-
ple model runs for a given model were averaged to-
gether. For each variable and each model run, we
generated 10 000 pseudorandom time series that contain
the modeled historical 1961–2005 lag-1 autocorrelation
and variability to determine 95% and 99% confidence
intervals for significant anomalies, accounting for lag-1
autocorrelation. Interannual variability of modeled SW
April–June (AMJ) dewpoint, temperature, vapor pres-
sure, saturation vapor pressure, and VPD were evalu-
ated after removing the long-term projected trend from
all modeled annual time series. The long-term projected
trend for each variable was developed in four steps.
First, eachmodel run for the historic and future scenario
was smoothed with a 31-yr filter. Then, all 31-yr
smoothed time series were averaged together to create
a single smoothed record for 1900–2099 for each model.
Next, the long-term projected trend was calculated as
the ensemble-median smoothed record, where decadal
variability is canceled out as a result of the large number
of models and multiple runs considered for many
models. Last, the long-term trend was removed from
each model run by linearly fitting the ensemble-median
smoothed trend to each model’s 1900–2099 annual time
series, averaged across all runs, and then subtracting the
adjusted trend from each annual time series. Variabil-
ities of the resulting detrended time series were ana-
lyzed.
3. Results and discussion
a. Drought anomalies in 2011
We expect that temperature, precipitation, VPD, and
dewpoint are all related and that anomalies in all of
these variables influenced the anomalous drought con-
ditions in 2011. For each variable, we identified the
window of three or more consecutive months during
August 2010–July 2011 for which SW conditions were
most anomalous relative to 1895–2014. Figure 1 in-
dicates that these four climate variables had strong
anomalies in the months before and during the peak
drought conditions and wildfire season of spring and
early summer in 2011. These windows were January–
July for precipitation total (Fig. 1a), March–July for
Tmax (Fig. 1b), May–July for dewpoint (Fig. 1c), and
March–July for VPD (Fig. 1d). Maps in Fig. 1 indicate
that subregional anomalies for precipitation, dewpoint,
and VPD exceeded 6 standard deviation units s in parts
of eastern New Mexico, western and northern Texas,
and southwestern Oklahoma. Anomalies for dewpoint
were, by far, the strongest among the variables evalu-
ated. Averaged across the SW, the May–July dewpoint
anomaly was24.5s (23.6s relative to 1961–2014). This
dewpoint anomaly was expressed as a vapor pressure
anomaly of 23.9s, or 221% (23.2s, or 220% relative
to 1961–2014) and 10% lower than the second-most
anomalous May–July vapor pressure value in 1971. The
Tmax anomalies were not as severe when averaged across
the SW (fifth highest on record for March–July), but
anomalies reached 14s in eastern New Mexico and
parts of Texas and were the highest on record when
averaged across the portion of the SW east of 1058W.
March–July Tmin was also high in this portion of the SW
(third highest on record).
Although March–July Tmax and Tmin anomalies were
only 11.9 and 11.7s, respectively, when averaged
across the SW (11.7 and 11.2s relative to 1961–2014),
the March–July VPD anomaly was 13.1s (12.6s rela-
tive to 1961–2014). Part of the discrepancy between
temperature and VPD anomalies was due to a dispro-
portionately large influence of strong Tmax anomalies in
the eastern SW (caused by the exponential influence of
temperature on VPD). The 2011 VPD anomaly was also
strongly influenced by extremely low specific humidity,
as shown in Fig. 1c. In Fig. 2, red and blue lines indicate
the contributions of temperature and dewpoint variability,
DECEMBER 2014 W I LL IAMS ET AL . 2673

respectively, toward VPD anomalies (black line) during
March–July, the period during which VPD was most
anomalous. Dewpoint contributions were calculated by
holding monthly temperatures within each PRISM grid
cell at their climatological means and only allowing
dewpoint to vary. Temperature contributions were cal-
culated oppositely. Although temperature normally
dominates VPD variability in the SW (R. Seager et al.
2014, unpublished manuscript), an exceptionally low
dewpoint in 2011 was responsible for 45% of the record-
breaking VPD anomaly in March–July 2011 (57% when
only May–July is considered). The powerful impact of
low dewpoint on VPD in 2011 is in contrast to the more
negligible impact of dewpoint anomalies during other
recent temperature-driven anomalous VPD years such as
2000–02, 2006, and 2012 (Fig. 2), highlighting the unique-
ness of the 2011 drought event.
b. Causes of low humidity and high VPD in 2011
Although VPD was anomalously high during all
spring and summer months, we focus for the rest of this
paper on AMJ, which are the three months centered
within the most anomalous period. In 2011, sustained
upper-level convergence occurred above and to the west
(upwind) of the SW (Fig. 3b) as a result of the wave train
of circulation anomalies likely associated with the La
Niña sea surface temperature (SST) pattern and reducedatmospheric heating over the tropical Pacific Ocean
FIG. 1. Surface climate anomalies in 2011 for (a) log(precipitation), (b) daily maximum temperature, (c) dewpoint,
and (d) VPD. For each variable, the period of 3–6 months during August 2010–July 2011 with the strongest anomaly
in the SW is shown. Maps show spatial distributions of anomalies as standard deviations from the 1895–2014 mean.
Time series show annual values averaged across the SW region, with red dots indicating 2011 values. In the maps, red
polygons bound the SW, black contours represent drought anomalies of 2 standard deviations, and yellow areas
indicate locations of 2011 fires (Williams et al. 2014).
2674 JOURNAL OF APPL IED METEOROLOGY AND CL IMATOLOGY VOLUME 53

(Fig. 3h). Consistent with La Niña–like atmospheric cir-
culation, upper-level westerly anomalies above the central
and eastern Pacific Ocean were contained within cyclones
straddling the equator. Poleward and east of these cy-
clones were enhanced upper-level anticyclonic circulation
patterns that, over the North Pacific, translated into
a weaker-than-normal Aleutian low (Figs. 3b,d,f). On the
eastern flanks of the upper-level subtropical cyclone and
midlatitude anticyclone (near the west coast of Mexico),
southerly wind anomalies converged with northerly
anomalies above western North America (Figs. 3b,d),
forcing subsidence.
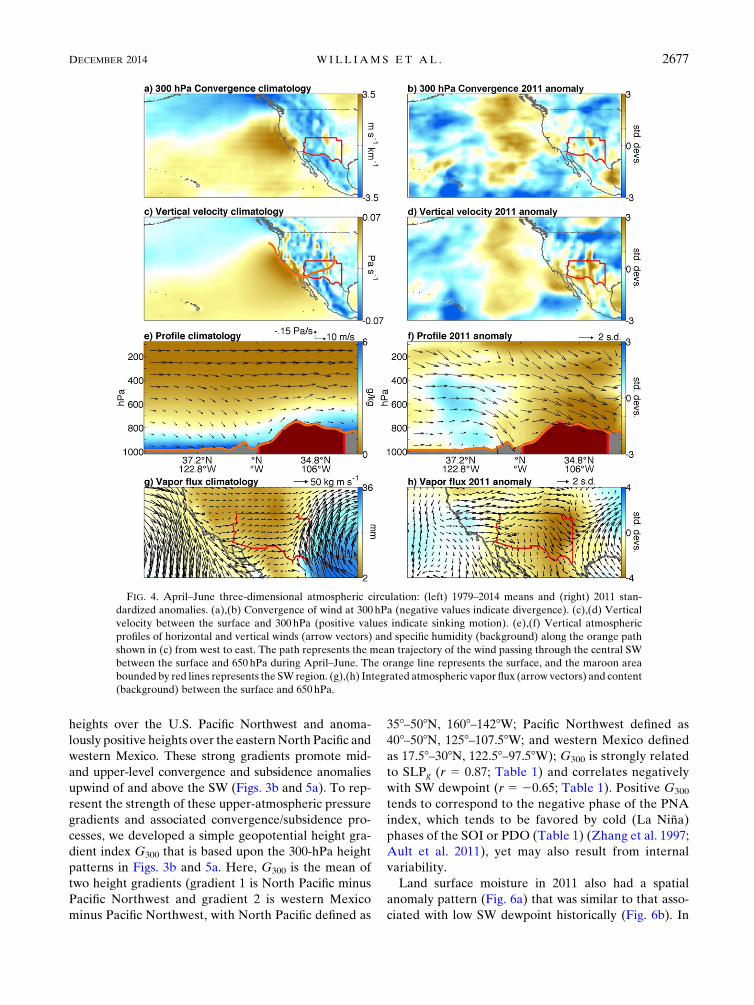
Figure 4b indicates a large region over the eastern
North Pacific in which upper-level (300 hPa) conver-
gence anomalies exceeded 2s (relative to 1979–2014)
during AMJ 2011 across the northeastern and south-
eastern flanks of the North Pacific high pressure zone. In
addition to the impact of upper-level convergence, the
northerly flow anomaly along the North American west
coast was, on its own, associated with descendingmotion
through balances between advection of planetary vor-
ticity and vortex stretching and between anomalous cold
(northerly) advection and compressional warming.
Reanalysis data indicate that AMJ 2011 vertical veloc-
ities averaged across the SW between the surface and
300 hPa were anomalously downward (Fig. 4d), with
AMJ 2011 downward velocities ranking second stron-
gest on record according to MERRA and strongest on
record according to the NARR (Mesinger et al. 2006;
see online supplemental section S1). Figure 4d indicates
that 2011 vertical velocity anomalies (MERRA) were
spatially heterogeneous, with subsidence anomalies ex-
ceeding 2–3s throughout much of Arizona and New
Mexico and ascending anomalies in west Texas.
Figures 4e and 4f show the vertical structure of specific
humidity and the northwesterly wind pattern traveling
along the average low-level wind path from the coastal
northeastern Pacific toward and across the SW (path
indicated by the orange line in Fig. 4c). This profile view
indicates that the subsidence anomalies described above
were generally present throughout the atmospheric
profile upwind of and over the SW (Fig. 4f).
Subsidence brings dry, high-altitude air to the surface
and contributes to enhanced low-level divergence.
According to NLDAS-2 hourly surface wind data, the
AMJ 2011 wind speed averaged across the SW was 2.6s
(18%) above the 1979–2014 mean and surface wind di-
vergence anomalies were greater than 2s across much
of the SW (not shown). Divergence of dry, rapidly
moving air over the SW worked to suppress low-level
moisture fluxes from the usual sources in the subtropical
Pacific and Gulf of Mexico regions (Figs. 4g,h; southerly
surface moisture flux anomalies into the SW were from
20.5 to 22s). This result is corroborated by a vapor-
tagging experiment (see online supplemental section
S2), indicating that SW atmospheric moisture trans-
ported from the subtropical Pacific and Gulf of Mexico
regions was substantially reduced in 2011.
Low-level humidity in the SW was further suppressed
by low evaporation rates from land that were due to very
dry soils, which resulted from low precipitation in pre-
ceding months. Near-surface (0–10 cm) modeled soil
moisture averaged across the SWwas the lowest on record
(22.1s), causing evapotranspiration to be the lowest on
record (22.0s) despite record-breaking potential evapo-
transpiration (2.2s) (anomalies are based on 1979–2014
NLDAS-2).On the basis of our vapor-tagging analysis, it is
seen that water vapor derived from land surface evapo-
ration in and around the SWwas virtuallymissing from the
eastern portion of the SW atmosphere in AMJ 2011 (see
online supplemental section S2). Continuous exposure
to dry westerly winds and high sensible heat flux due to
very dry soils combined to cause record-breaking spring
and early summer temperature anomalies throughout
much of western Texas, further amplifying VPD in this
region.
c. Interrelation among variables underlying theunique 2011 conditions
Figure 5 shows howatmospheric circulation (wind speed
and geopotential height) and surface temperatures corre-
lated with SW dewpoint (panels on left) and temperature
(panels on right) duringAMJ 1979–2014. There are strong
similarities between the conditions typically associated
with low dewpoints (Fig. 5, left) and the climate anomalies
in 2011 (Fig. 3). There is less correspondence between
anomalies in 2011 and the conditions typically associated
with high temperature (Fig. 5, right).
FIG. 2. March–July VPD anomalies (departure from the 1961–
2014 mean of 15.17 hPa). Red and blue lines indicate partial con-
tributions of temperature and dewpoint anomalies, respectively,
toward the total anomaly (thick black line). Partial contributions of
temperature and dewpoint anomalies were calculated by allowing
only one variable at a time to vary from its 1961–2014 mean.
DECEMBER 2014 W I LL IAMS ET AL . 2675

Correspondence between the 2011 anomaly maps in
Fig. 3 and the dewpoint correlation maps in Fig. 5 in-
dicates that AMJ 2011 climate was in many ways an
amplification of the same atmospheric and oceanic
conditions responsible for low dewpoints in the SW
during other years in recent decades. In particular, the
2011 anomaly patterns and dewpoint correlation fields
share a sea level pressure (SLP) gradient between the
North Pacific high and low pressure over central North
America (Figs. 3f and 5e). If one considers 1961–2014,
the AMJ SLP gradient SLPg between the North Pacific
(208–458N, 908–1108W) and North America (308–508N,
1308–1708W) was the strongest on record in 2011 (2.8s)
and correlates negatively with AMJ dewpoint in the SW
(correlation coefficient r 5 20.59; Table 1) (see sup-
plemental section S3 for methods to calculate SLPg). A
strong SLPg drives northerly winds down the North
American coast, exposing the SW to anomalously dry air
from the north and from above through subsidence.
Strong SLPg and low SW dewpoint are associated with
SST patterns resembling the cold phase of the PDO and
La Niña (Figs. 3h and 5g), in which intensified SLPg
promotes, and is reinforced by, northerly low-level wind
that drives upwelling of cold water in the eastern North
Pacific. The SW dewpoint may be also partially sup-
pressed during cold-phase years because relatively cool
SSTs suppress atmospheric moisture across large spatial
scales. During AMJ 1961–2014, the PDO correlated
positively and the SOI correlated negatively with SW
dewpoint (r 5 0.47 and 20.46, respectively; Table 1).
Crimmins (2010) shows that La Niña and the PDO coldphase correspond positively to the frequency of daysduring whichmeteorological conditions are conducive towildfire in the SW.Another key similarity between the 2011 anomalies
and the conditions that are generally associated with low
SW dewpoint is a strengthened mid- and upper-level
geopotential height gradient between anomalously low
FIG. 3. April–June atmospheric circulation and surface temperature: (left) 1979–2014 means and (right) 2011
standardized anomalies. Arrow vectors show the vertically integrated wind velocity. (a),(b) The upper troposphere
(300–200hPa), where the background is the 300-hPa geopotential height. (c),(d) The middle troposphere (600–
400 hPa), where the background is 500-hPa geopotential height. (e),(f) The lower troposphere (surface–700 hPa),
where the background is SLP. (g),(h) The surface temperature.
2676 JOURNAL OF APPL IED METEOROLOGY AND CL IMATOLOGY VOLUME 53
heights over the U.S. Pacific Northwest and anoma-
lously positive heights over the easternNorth Pacific and
western Mexico. These strong gradients promote mid-
and upper-level convergence and subsidence anomalies
upwind of and above the SW (Figs. 3b and 5a). To rep-
resent the strength of these upper-atmospheric pressure
gradients and associated convergence/subsidence pro-
cesses, we developed a simple geopotential height gra-
dient index G300 that is based upon the 300-hPa height
patterns in Figs. 3b and 5a. Here, G300 is the mean of
two height gradients (gradient 1 is North Pacific minus
Pacific Northwest and gradient 2 is western Mexico
minus Pacific Northwest, with North Pacific defined as
358–508N, 1608–1428W; Pacific Northwest defined as
408–508N, 1258–107.58W; and western Mexico defined
as 17.58–308N, 122.58–97.58W); G300 is strongly related
to SLPg (r 5 0.87; Table 1) and correlates negatively
with SW dewpoint (r 5 20.65; Table 1). Positive G300
tends to correspond to the negative phase of the PNA
index, which tends to be favored by cold (La Niña)phases of the SOI or PDO (Table 1) (Zhang et al. 1997;Ault et al. 2011), yet may also result from internal
variability.
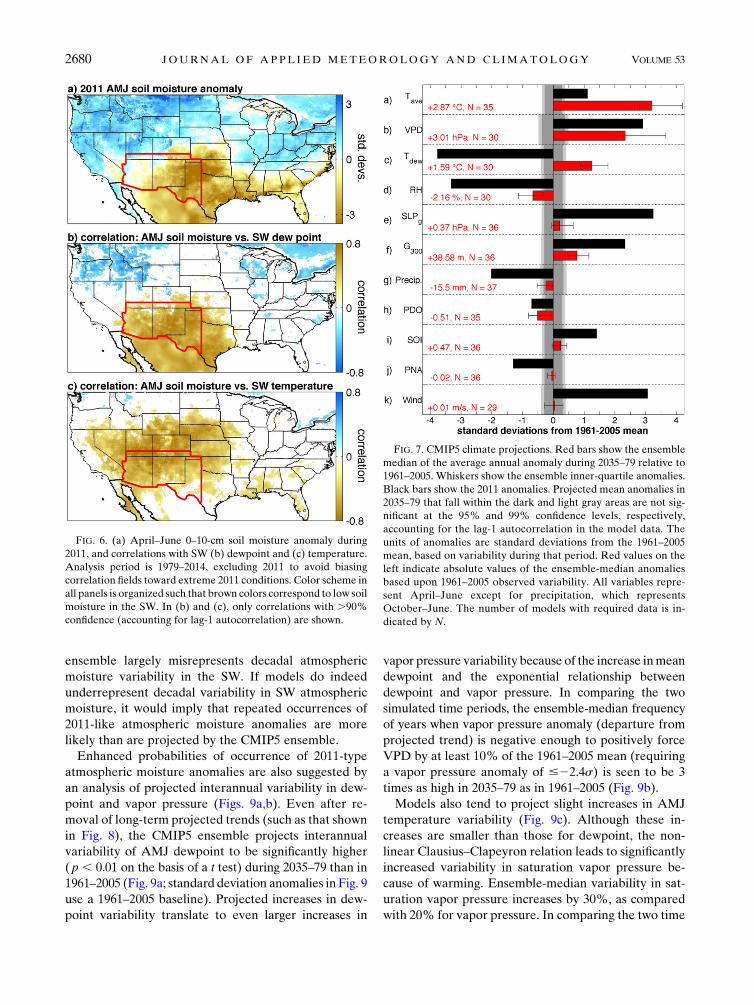
Land surface moisture in 2011 also had a spatial
anomaly pattern (Fig. 6a) that was similar to that asso-
ciated with low SW dewpoint historically (Fig. 6b). In
FIG. 4. April–June three-dimensional atmospheric circulation: (left) 1979–2014 means and (right) 2011 stan-
dardized anomalies. (a),(b) Convergence of wind at 300 hPa (negative values indicate divergence). (c),(d) Vertical
velocity between the surface and 300 hPa (positive values indicate sinking motion). (e),(f) Vertical atmospheric
profiles of horizontal and vertical winds (arrow vectors) and specific humidity (background) along the orange path
shown in (c) from west to east. The path represents the mean trajectory of the wind passing through the central SW
between the surface and 650 hPa during April–June. The orange line represents the surface, and the maroon area
bounded by red lines represents the SW region. (g),(h) Integrated atmospheric vapor flux (arrow vectors) and content
(background) between the surface and 650hPa.
DECEMBER 2014 W I LL IAMS ET AL . 2677

the past, low dewpoint has corresponded to dry soil across
much of the SWand northernMexico and towet soil in the
Pacific Northwest, similar to spatial structures for pre-
cipitation and temperature 2011 anomalies in Fig. 1. This
is due partly to the influences that the SOI and PDO os-
cillations have on the geographic distribution of winter
and spring precipitation in western North America (e.g.,
Dettinger et al. 1998), which subsequently affect warm-
season humidity and temperature (Table 1). Positive SOI
and negative PDO also tend to enhance SLPg and
G300, promoting northerly wind and cool temperatures
throughout much of the west (as in Fig. 1b). Enhanced
subsidence, decreased cloud shading, and increased surface
wind speed combine to increase temperature and potential
evapotranspiration toward the eastern SW, however,
drawing soil moisture down and increasing surface sensible
heat fluxes when soil moisture is limiting, as in 2011. The
resultant spatial structure of surface temperature and
moisture in 2011mayhave further promoted highVPD in
the SW through land surface feedbacks on large-scale at-
mospheric circulation (e.g., enhancement of a surface heat
low and tropospheric ridging) that reinforced lowhumidity
and high surface temperature throughoutmuch of the SW,
as in the European heat wave of 2003 (e.g., Zaitchik et al.
2006; Fischer et al. 2007). Therefore, although extreme
2011-like years appear possible onlywhen a suite of factors
are in place,many of these factors are interrelated andmay
be largely distilled down to factors that promote dry soils
(primarily low precipitation) and strong, dry wind sourced
from the north (primarily G300 and SLPg).
d. Implications for the future
Figure 7 shows CMIP5 ensemble-median (red bars)
and inner-quartile climate-model projections of climate
FIG. 5. April–June atmospheric circulation and surface temperature vs SW(left) dewpoint and (right) temperature.
Analysis period is 1979–2014, excluding 2011 to avoid biasing correlation fields toward extreme 2011 conditions. (a),
(b) The upper troposphere (300–200hPa), where the background is correlation with 300-hPa geopotential height.
(c),(d) Themiddle troposphere (600–400hPa), where the background is correlationwith 500-hPa geopotential height.
(e),(f) The lower troposphere (surface–700hPa), where the background is the correlation with SLP. (g),(h) The
surface temperature. Only correlations with .90% confidence (accounting for lag-1 autocorrelation) are shown.
Wind-vector directions and color schemes reflect conditions associated with high VPD (low dewpoint on left; high
temperature on right) in the SW. Arrow vectors in (a)–(f) show the correlation with vertically integrated wind velocity.
2678 JOURNAL OF APPL IED METEOROLOGY AND CL IMATOLOGY VOLUME 53
anomalies during 2035–79 (relative to 1961–2005) for
the variables that appear to have contributed to the
extreme 2011 VPD event in the SW. Black bars show
2011 anomalies for comparison. During AMJ, the mean
SW temperature anomaly is projected to be 12.878C in
2035–79 (Fig. 7a). The projected warming trend drives
an ensemble-median VPD anomaly of13.01 hPa during
2035–79 (19.5% higher than for 1961–2005) (Fig. 7b).
The other component of VPD, atmospheric moisture
content, is also projected to rise (Fig. 7c) in accordance
with general increases in atmospheric and ocean tem-
peratures globally. Increasing atmospheric moisture
content mitigates the effect of warming on VPD, but the
exponential Clausius–Clapeyron relationship between
temperature and saturation vapor pressure dictates that
VPD would increase as a result of warming even if at-
mospheric moisture content increased enough to main-
tain constant relative humidity (RH; Anderson 1936). In
reality, models do not project atmospheric moisture in-
creases to be substantial enough to maintain stable RH
levels in the SW (Fig. 7d). This is partly because of
limited surface moisture in the SW but also because of
moisture divergence trends in the mean state of the SW
atmospheric circulation (Seager et al. 2014b). Sup-
pressed increases in atmospheric moisture content work
to amplify the effects of warming on SW VPD.
It appears that the processes involved in suppressing
projected increases in atmospheric moisture content
were also at work in suppressing 2011 atmospheric
moisture content in multiple respects. In considering the
climate variables identified in sections 3b and 3c as
generally associated with SW dewpoint variability and
also anomalous in 2011 (SLPg, G300, October–June
precipitation, PDO, SOI, PNA, and wind speed),
Figures 7e–k indicate that ensemble-median projected
trends share the same sign as 2011 anomalies for all
variables evaluated (although the projected trends are
very weak for some variables). Although the ensemble-
median trend in SLPg is relatively weak, the spatial pat-
tern of ensemble-median projected SLP trends is similar
to that associated with low SW dewpoint (Figs. 3 and 5),
and 35 of the 36 models evaluated converge upon in-
creased SLP over the northeastern Pacific Ocean in the
region of the Aleutian low (see supplemental Fig. S4).
The projections evaluated here suggest that some of the
large-scale processes projected to suppress future in-
creases in SW atmospheric moisture content in the SW
were also at work in 2011.
Model projections of increasing atmospheric moisture
imply that the extremely low atmospheric moisture
levels observed in 2011 and the multidecade decline that
began in the early 1990s should be becoming in-
creasingly improbable (Fig. 8a). The observed decadal
trends shown in Fig. 8a are undoubtedly dominated by
internal climate variability, but models within the
CMIP5 archive do not tend to simulate the observed
level of multidecadal internal variability. During 1990–
2014, observed AMJ dewpoint declined by 3.828C (ac-
cording to the linear trend), corresponding to a vapor
pressure decline of 20.9%. Histograms in Figs. 8b and 8c
show the CMIP5 ensemble distribution of linear changes
in dewpoint and vapor pressure, respectively, during all
possible 25-yr periods of the historical scenario (1850–
2005). Only one of the 30 models with adequate data
(Commonwealth Scientific and Industrial Research
Organisation, Mark 3.6.0) simulates a 25-yr dewpoint
decline of more than 3.828C, and this occurs at the be-
ginning of the twentieth century in just 1 of 10 historical
runs. This is also the only model that simulates a 25-yr
period when vapor pressure declines by 20.9% or more.
The mismatch between observed and modeled decadal
variability in atmospheric moisture content indicates
that either the ongoing decline in SW atmospheric
moisture is a truly exceptional event or that the CMIP5
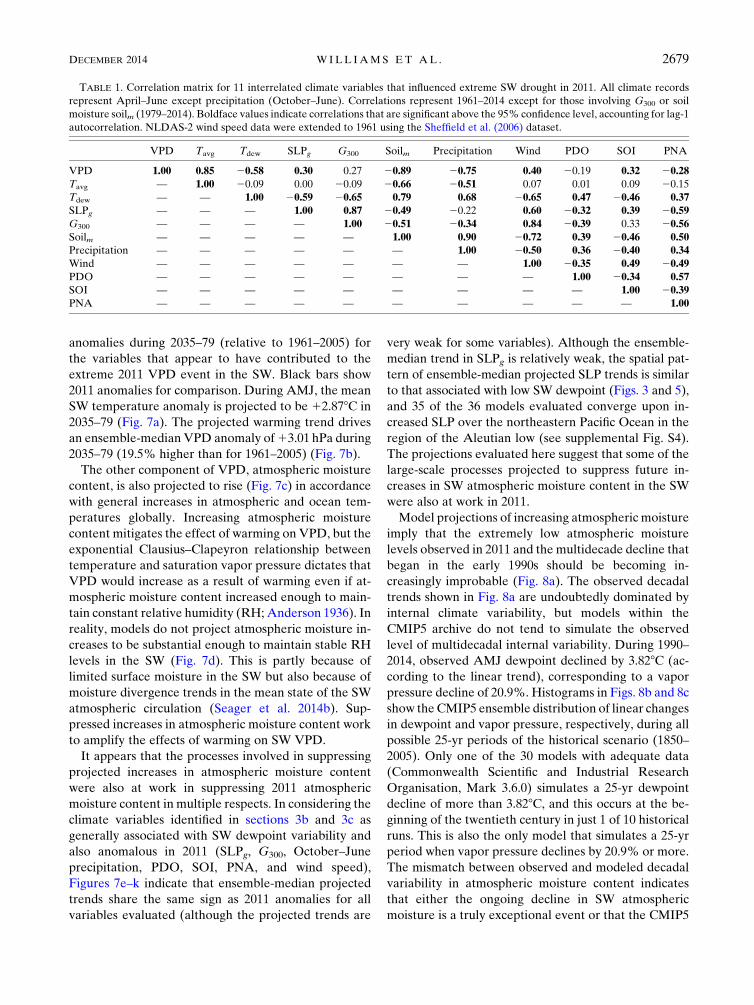
TABLE 1. Correlation matrix for 11 interrelated climate variables that influenced extreme SW drought in 2011. All climate records
represent April–June except precipitation (October–June). Correlations represent 1961–2014 except for those involving G300 or soil
moisture soilm (1979–2014). Boldface values indicate correlations that are significant above the 95% confidence level, accounting for lag-1
autocorrelation. NLDAS-2 wind speed data were extended to 1961 using the Sheffield et al. (2006) dataset.
VPD Tavg Tdew SLPg G300 Soilm Precipitation Wind PDO SOI PNA
VPD 1.00 0.85 20.58 0.30 0.27 20.89 20.75 0.40 20.19 0.32 20.28
Tavg — 1.00 20.09 0.00 20.09 20.66 20.51 0.07 0.01 0.09 20.15
Tdew — — 1.00 20.59 20.65 0.79 0.68 20.65 0.47 20.46 0.37
SLPg — — — 1.00 0.87 20.49 20.22 0.60 20.32 0.39 20.59
G300 — — — — 1.00 20.51 20.34 0.84 20.39 0.33 20.56
Soilm — — — — — 1.00 0.90 20.72 0.39 20.46 0.50Precipitation — — — — — — 1.00 20.50 0.36 20.40 0.34
Wind — — — — — — — 1.00 20.35 0.49 20.49
PDO — — — — — — — — 1.00 20.34 0.57
SOI — — — — — — — — — 1.00 20.39PNA — — — — — — — — — — 1.00
DECEMBER 2014 W I LL IAMS ET AL . 2679
ensemble largely misrepresents decadal atmospheric
moisture variability in the SW. If models do indeed
underrepresent decadal variability in SW atmospheric
moisture, it would imply that repeated occurrences of
2011-like atmospheric moisture anomalies are more
likely than are projected by the CMIP5 ensemble.
Enhanced probabilities of occurrence of 2011-type
atmospheric moisture anomalies are also suggested by
an analysis of projected interannual variability in dew-
point and vapor pressure (Figs. 9a,b). Even after re-
moval of long-term projected trends (such as that shown
in Fig. 8), the CMIP5 ensemble projects interannual
variability of AMJ dewpoint to be significantly higher
(p , 0.01 on the basis of a t test) during 2035–79 than in
1961–2005 (Fig. 9a; standard deviation anomalies in Fig. 9
use a 1961–2005 baseline). Projected increases in dew-
point variability translate to even larger increases in
vapor pressure variability because of the increase inmean
dewpoint and the exponential relationship between
dewpoint and vapor pressure. In comparing the two
simulated time periods, the ensemble-median frequency
of years when vapor pressure anomaly (departure from
projected trend) is negative enough to positively force
VPD by at least 10% of the 1961–2005 mean (requiring
a vapor pressure anomaly of #22.4s) is seen to be 3
times as high in 2035–79 as in 1961–2005 (Fig. 9b).
Models also tend to project slight increases in AMJ
temperature variability (Fig. 9c). Although these in-
creases are smaller than those for dewpoint, the non-
linear Clausius–Clapeyron relation leads to significantly
increased variability in saturation vapor pressure be-
cause of warming. Ensemble-median variability in sat-
uration vapor pressure increases by 30%, as compared
with 20% for vapor pressure. In comparing the two time
FIG. 6. (a) April–June 0–10-cm soil moisture anomaly during
2011, and correlations with SW (b) dewpoint and (c) temperature.
Analysis period is 1979–2014, excluding 2011 to avoid biasing
correlation fields toward extreme 2011 conditions. Color scheme in
all panels is organized such that brown colors correspond to low soil
moisture in the SW. In (b) and (c), only correlations with .90%
confidence (accounting for lag-1 autocorrelation) are shown.
FIG. 7. CMIP5 climate projections. Red bars show the ensemble
median of the average annual anomaly during 2035–79 relative to
1961–2005. Whiskers show the ensemble inner-quartile anomalies.
Black bars show the 2011 anomalies. Projected mean anomalies in
2035–79 that fall within the dark and light gray areas are not sig-
nificant at the 95% and 99% confidence levels, respectively,
accounting for the lag-1 autocorrelation in the model data. The
units of anomalies are standard deviations from the 1961–2005
mean, based on variability during that period. Red values on the
left indicate absolute values of the ensemble-median anomalies
based upon 1961–2005 observed variability. All variables repre-
sent April–June except for precipitation, which represents
October–June. The number of models with required data is in-
dicated by N.
2680 JOURNAL OF APPL IED METEOROLOGY AND CL IMATOLOGY VOLUME 53

periods, the ensemble-median frequency of years when
AMJ saturation vapor pressure anomaly is positive
enough to positively force VPD anomalies by at least
10% (requiring a saturation vapor pressure anomaly of
$1.3s) of the 1961–2005mean is projected to increase by
approximately 84% (Fig. 9d). While this relative change
is much less than the threefold increase projected for
vapor pressure (Fig. 9a), the interannual variability of
saturation vapor pressure is approximately 65% larger
than the variability of actual vapor pressure, dictating
that temperature variability will continue to be the
dominant driver ofVPDdepartures from the background
trend (Fig. 9f). Nonetheless, 2011 serves as an example of
the potential for extreme vapor pressure anomalies to
have impactful effects on VPD. Although models gen-
erally do not simulate dewpoint and vapor pressure
anomalies that are as strong as those observed in 2011,
projections of increased interannual variability for these
variables suggests an increasing likelihood of repeated
2011-like events in which humidity is substantially re-
duced relative to the projected trend, contributing to
extremely positive VPD anomalies.
Combining the lessons learned from analyses of pro-
jected trends and variability, it is clear from Fig. 7 that
warming and suppressed increases in atmospheric
moisture content alone are projected to contribute to an
increased frequency of years in which VPD matches or
exceeds 2011 levels. Superimposed upon the projected
increase in mean VPD, interannual variations of tem-
perature and dewpoint (e.g., departures of dewpoint
from the projected trend line in Fig. 8) will have in-
creasingly amplified effects on interannual VPD anom-
alies because of the exponential relationship between
temperature and saturation vapor pressure. Figure 10
demonstrates how VPD would be influenced by a 2011-
type event in the 2050s, where observed 2011
FIG. 8. Observed AMJ dewpoint in the SW during 1961–2014
overlaid on the CMIP5 ensemble-median (thick black curve) and
inner-quartile (gray shading) trends. Dotted curves indicate stan-
dard deviation departures from the ensemble-median trend, based
on 1961–2005 observed variability. Model time series were ad-
justed to exhibit observed variability during 1961–2005 (the period
when the observed record overlaps with the historical model sim-
ulations) and the observed mean during 1961–2014. Arrows in
(b) and (c) indicate observed changes in dewpoint and vapor
pressure during 1990–2014 (23.82hPa and 220.9%, respectively).FIG. 9.Modeled interannual variability for historic and projected
scenarios. Scatterplots compare interannual variability during
2035–79 with that of 1961–2005 for AMJ (a) dewpoint, (c) tem-
perature, and (e) dewpoint depression (temperature2 dewpoint).
Each number corresponds to a CMIP5 model, as listed in Table S1
of the supplemental material. Variability is calculated after the
long-term trend is removed. Themagnitude of a standard deviation
is based on the 1961–2005 period. Bar plots compare the frequency
of extreme years when interannual anomalies in AMJ (b) vapor
pressure, (d) saturation vapor pressure, and (f) VPD are strong
enough to positively force VPD by at least 10% of the 1961–2005
mean.Double asterisks above the bar plots indicate significant ( p,0.01) differences in simulated frequencies of extreme years for the
two time periods.
DECEMBER 2014 W I LL IAMS ET AL . 2681

temperature and dewpoint anomalies are superimposed
upon mean 2050s levels. For March–August, the period
when VPD correlates most strongly with SW burned
forest area (Williams et al. 2014), a 2011-type event in
the 2050s would cause VPD to be 47% higher than the
1961–2005 average and 16% higher than in 2011.
4. Summary and conclusions
The year 2011 was interesting in terms of drought-
related climate impacts in the SW because it was not
exceptionally warm throughout the parts of Arizona and
New Mexico where record-breaking forest fires oc-
curred. VPD, on the other hand, was record breaking in
these areas because of exceptionally low atmospheric
moisture content. Abatzoglou and Kolden (2013) and
Williams et al. (2014) showed that SW annual burned
area is closely tied to spring–summer potential evapo-
transpiration, VPD, and moisture deficit. These studies
make it clear that record-breaking wildfire activity in
2011 was very likely promoted by record-low pre-
cipitation and record-high VPD.
It is interesting that VPD, which is normally dominated
by temperature, was substantially amplified in 2011 by
extremely low atmospheric moisture content. The mete-
orological conditions responsible for extremely low at-
mospheric moisture in 2011were driven by an interaction
of atmospheric, oceanic, and land surface conditions.
Among the most important contributing factors appear
to have been record-setting low precipitation totals and
a record-setting strong sea level pressure gradient be-
tween the North Pacific Ocean and North America that
drove dry northwesterly wind and subsidence anomalies
toward the SW throughout the troposphere. Subsidence
over the SW was enhanced by upper-level convergence
associated with the La Niña–forced atmospheric wave
train. Subsidence aloft led to divergence of dry, lower-
atmospheric winds across Arizona and much of New
Mexico, blocking advection of moist air from both the
subtropical Pacific and theGulf ofMexico.Convergence of
warm, drywinds in easternNewMexico andwesternTexas
interacted with exceptionally dry soils to cause record-
breaking heat, further amplifying VPD in these areas.
Model projections suggest that 2011 conditions were
representative of projected future climate in limited
ways. CMIP5 climate projections tend to agree upon an
enhanced sea level pressure gradient between the North
Pacific and North America, an enhanced upper-level
pressure gradient between Mexico and the Pacific
Northwest that drives convergence and subsidence up-
wind of and above the SW, a more negative PDO, and
lower October–June precipitation totals. As atmo-
spheric moisture content increases with warming glob-
ally, projected trends in the variables listed here
combine to slow the projected atmospheric moisture
increases in the SW, thereby allowing for an amplified
influence of background VPD levels. These projections
do not necessarily indicate an increased frequency of
2011-type circulation extremes, but they nonetheless
positively influence the frequency with which 2011 levels
of VPD are achieved in the CMIP5 projections. Further,
CMIP5 models generally project the interannual vari-
ability of SW dewpoint, temperature, vapor pressure,
saturation vapor pressure, and VPD to increase in-
dependent of background trends, suggesting that large
negative deviations of VPD from the background trend,
such as that which occurred in 2011, will become in-
creasingly probable. Increased interannual variability in
dewpoint amplifies the increase in interannual VPD var-
iability that is already expected as a result of the expo-
nential Clausius–Clapeyron response to warming alone.
Although the exceptional negative atmospheric
moisture anomaly in spring–summer 2011 was un-
precedented in the observed record, CMIP5 pro-
jections suggest that extreme 2011-like deviations in
atmospheric moisture content from background
levels will become increasingly probable as the globe
warms. Recurrences of 2011-type events in which
temperature and atmospheric moisture deviations
combine to substantially amplify VPD will be super-
imposed upon increasingly warm background tempera-
tures that, on their own, will drive substantial increases in
SW VPD. By the 2050s, average spring–summer VPD is
projected to surpass that of 2011. Strong and nonlinear
relationships among temperature, VPD, and SW burned
area (Williams et al. 2014) suggest that 2011-type
FIG. 10. Annual VPD cycle. Annual cycles for 1961–2005 and
2011 represent observed data. Gray shading bounds inner quartiles
of 1961–2005 annual values. Annual cycles for 2050s represent
CMIP5 ensemble means (lines and circles) and inner quartiles
(shading). For the case of the 2011-type event in the 2050s, 2011
temperature and dewpoint anomalies were superimposed upon
2050s modeled temperature and dewpoint.
2682 JOURNAL OF APPL IED METEOROLOGY AND CL IMATOLOGY VOLUME 53

precipitation and circulation anomalies, superimposed
upon substantially warmer background conditions, could
have far more catastrophic wildfire consequences than
they did in the record-breaking wildfire year of 2011 if
fuel characteristics are not limiting.
Acknowledgments. This work was supported by the
Los Alamos National Laboratory (LANL) Laboratory
Directed Research and Development program and the
U.S. Department of Energy (DOE) Biological and En-
vironmental Research program. Author RS was sup-
ported by NOAA awards NA10OAR4310137 (Global
Decadal Hydroclimate Variability and Change) and NSF
Award EASM2: Linking Near-term Future Changes in
Weather andHydroclimate inWestern North America to
Adaptation for Ecosystem and Water Management.
Thanks are given to C. D. Allen, C. Baisan, C. Daly,
D. Griffin, R. Linn, and S. A. Rauscher for helpful con-
versations and insights.
REFERENCES
Abatzoglou, J. T., and C. A. Kolden, 2013: Relationships between
climate and macroscale area burned in the western United
States. Int. J. Wildland Fire, 22, 1003–1020, doi:10.1071/
WF13019.
Anderson, D. B., 1936: Relative humidity or vapor pressure deficit.
Ecology, 17, 277–282, doi:10.2307/1931468.
Ault, T. R., A. K. Macalady, G. T. Pederson, J. L. Betancourt, and
M. D. Schwartz, 2011: Northern Hemisphere modes of vari-
ability and the timing of spring in western North America.
J. Climate, 24, 4003–4014, doi:10.1175/2011JCLI4069.1.
Crimmins, M. A., 2010: Interannual to decadal changes in extreme
fire weather event frequencies across the southwestern United
States. Int. J. Climatol., 31, 1573–1583.
Dettinger, M. D., D. R. Cayan, H. F. Diaz, and D. M. Meko, 1998:
North–south precipitation patterns inwesternNorthAmerica on
interannual-to-decadal timescales. J. Climate, 11, 3095–3111,
doi:10.1175/1520-0442(1998)011,3095:NSPPIW.2.0.CO;2.
Fischer, E. M., S. I. Seneviratne, P. L. Vidale, D. Lüthi, and
C. Schär, 2007: Soil moisture–atmosphere interactions during
the 2003 European summer heat wave. J. Climate, 20, 5081–5099, doi:10.1175/JCLI4288.1.
Hamlet, A. F., and D. P. Lettenmaier, 2005: Production of tem-
porally consistent gridded precipitation and temperature
fields for the continental United States. J. Hydrometeor., 6,
330–336, doi:10.1175/JHM420.1.
Hoerling, M., and Coauthors, 2013: Anatomy of an extreme event.
J. Climate, 26, 2811–2832, doi:10.1175/JCLI-D-12-00270.1.
Lapp, S. L., J. M. St Jacques, E. M. Barrow, and D. J. Sauchyn,
2012: GCM projections for the Pacific decadal oscillation un-
der greenhouse forcing for the early 21st century. Int. J. Cli-
matol., 32, 1423–1442, doi:10.1002/joc.2364.Littell, J. S., D.McKenzie,D. L. Peterson, andA. L.Westerling, 2009:
Climate and wildfire area burned in western US ecoprovinces,
1916–2003. Ecol. Appl., 19, 1003–1021, doi:10.1890/07-1183.1.Mantua, N. J., S. R. Hare, Y. Zhang, J. M. Wallace, and R. C.
Francis, 1997: A Pacific interdecadal climate oscillation
with impacts on salmon production. Bull. Amer. Meteor.
Soc., 78, 1069–1079, doi:10.1175/1520-0477(1997)078,1069:
APICOW.2.0.CO;2.
Mesinger, F., and Coauthors, 2006: North American Regional
Reanalysis.Bull. Amer.Meteor. Soc., 87, 343–360, doi:10.1175/
BAMS-87-3-343.
Miller, P., 2012:Weather gone wild.Natl. Geogr. Mag., 222 (3), 30–
53. [Available online at http://ngm-beta.nationalgeographic.
com/2012/09/issues/september-20121/.]
Mitchell, K. E., and Coauthors, 2004: The multi-institution North
American Land Data Assimilation System (NLDAS): Utiliz-
ing multiple GCIP products and partners in a continental
distributed hydrological modeling system. J. Geophys. Res.,
109, D07S90, doi:10.1029/2003JD003823.
Moss, R.H., and Coauthors, 2010: The next generation of scenarios
for climate change research and assessment. Nature, 463, 747–
756, doi:10.1038/nature08823.
Nijhuis, M., 2012: Forest fires: Burn out. Nature, 489, 352–354,
doi:10.1038/489352a.
Rienecker, N.M., andCoauthors, 2011:MERRA:NASA’sModern-
Era Retrospective Analysis for Research and Applications.
J. Climate, 24, 3624–3648, doi:10.1175/JCLI-D-11-00015.1.
Rupp, D. E., P. W. Mote, N. Massey, C. J. Rye, R. Jones, and M. R.
Allen, 2012:Didhuman influenceon climatemake the 2011Texas
drought more probable?Bull. Amer. Meteor. Soc., 93, 1052–1054.
Seager, R., L. Goddard, J. Nakamura, N. Henderson, and D. E.
Lee, 2014a: Dynamical causes of the 2010/11 Texas–northern
Mexico drought. J. Hydrometeor., 15, 39–68, doi:10.1175/
JHM-D-13-024.1.
——, and Coauthors, 2014b: Dynamical and thermodynamical
causes of large-scale changes in the hydrological cycle over
North America in response to global warming. J. Climate, 27,
7921–7948, doi:10.1175/JCLI-D-14-00153.1.
Sheffield, J., G. Goteti, and E. F. Wood, 2006: Development of
a 50-year high-resolution global dataset of meteorological
forcings for land surface modeling. J. Climate, 19, 3088–3111,
doi:10.1175/JCLI3790.1.
Swetnam, T. W., and J. L. Betancourt, 1990: Fire–Southern Os-
cillation relations in the southwestern United States. Science,
249, 1017–1020, doi:10.1126/science.249.4972.1017.
——, and ——, 1998: Mesoscale disturbance and ecological re-
sponse to decadal climatic variability in the American
southwest. J. Climate, 11, 3128–3147, doi:10.1175/
1520-0442(1998)011,3128:MDAERT.2.0.CO;2.
Trenberth, K. E., 1984: Signal versus noise in the Southern
Oscillation. Mon. Wea. Rev., 112, 326–332, doi:10.1175/
1520-0493(1984)112,0326:SVNITS.2.0.CO;2.
van Vuuren, D. P., and Coauthors, 2011: The representative con-
centration pathways: An overview. Climatic Change, 109, 5–31,
doi:10.1007/s10584-011-0148-z.
Wallace, J. M., and D. S. Gutzler, 1981: Teleconnections in the
geopotential height field during the Northern Hemisphere
winter. Mon. Wea. Rev., 109, 784–812, doi:10.1175/
1520-0493(1981)109,0784:TITGHF.2.0.CO;2.
Westerling, A. L., and T. W. Swetnam, 2003: Interannual to de-
cadal drought and wildfire in the western United States. Eos,
Trans. Amer. Geophys. Union, 84, 545–554, doi:10.1029/
2003EO490001.
——,A.Gershunov, T. J. Brown,D.R. Cayan, andM.D.Dettinger,
2003: Climate and wildfire in the western United States. Bull.
Amer. Meteor. Soc., 84, 595–604, doi:10.1175/BAMS-84-5-595.
——, H. G. Hidalgo, D. R. Cayan, and T. W. Swetnam, 2006:
Warming and earlier spring increase western US forest wildfire
activity. Science, 313, 940–943, doi:10.1126/science.1128834.
DECEMBER 2014 W I LL IAMS ET AL . 2683

Williams, A. P., and Coauthors, 2013: Temperature as a potent
driver of regional forest drought stress and tree mortality.Nat.
Climate Change, 3, 292–297, doi:10.1038/nclimate1693.
——, and Coauthors, 2014: Correlations between components of the
water balance and burned area reveal new insights for predicting
fire activity in the southwestUS. Int. J.Wildland Fire, doi:10.1071/
WF14023, in press.
Xia, Y., and Coauthors, 2012: Continental-scale water
and energy flux analysis and validation for the North
American Land Data Assimilation System project phase 2
(NLDAS-2): 1. Intercomparison and application of model
products. J. Geophys. Res., 117, D03109, doi:10.1029/
2011JD016048.
Zaitchik, B. F., A. K. Macalady, L. R. Beonneau, and R. B. Smith,
2006: Europe’s 2003 heat wave: A satellite view of impacts and
land–atmosphere feedbacks. Int. J. Climatol., 26, 743–769,
doi:10.1002/joc.1280.
Zhang, Y., J. M. Wallace, and D. S. Battisti, 1997: ENSO-like in-
terdecadal variability: 1900–93. J. Climate, 10, 1004–1020,
doi:10.1175/1520-0442(1997)010,1004:ELIV.2.0.CO;2.
2684 JOURNAL OF APPL IED METEOROLOGY AND CL IMATOLOGY VOLUME 53