Embed Size (px)
Citation preview

STEVEN A. MORRISON Northeastern University
CLIFFORD WINSTON Brookings Institution
Causes and Consequences of Airline Fare Wars
The airline business is the closest thing there is to legalized warfare. Robert L. Crandall
Chief Executive Officer, American Airlines
SINCE THE AIRLINE industry was deregulated, its financial performance has continued to be extremely volatile. ' During its most recent down- turn, which lasted from 1990 to 1993, industry losses totaled nearly $13 billion, prompting worried policymakers to create the National Commission to Ensure a Strong Competitive Airline Industry in 1993.2 Although the primary recommendation of that commission-to estab- lish another commission to provide financial advice to the industry- has been ignored, it nevertheless raised the possibility of some form of government intervention in the airline industry if performance did not improve. Although the airlines rallied nicely after the losses of the early 1990s, even the near-record profits made during 1995 only partially offset those losses.
We acknowledge helpful comments from Alfred Kahn, John Kwoka, John Meyer, Roger Noll, Peter Reiss, and Kenneth Small, and from conference participants at Brook- ings and seminar participants at Chicago, Harvard, Northwestern, U.S. Department of Justice, Virginia, and Washington.
1. During the last nineteen years of full regulation (1958-76), the standard deviation and coefficient of variation of the industry's gross profit margin were 3.9 percent and 0.67; during the first nineteen years of administrative and full deregulation (1977-95), the standard deviation fell to 3.0 percent, but the coefficient of variation rose to 1.67.
2. Morrison and Winston (1995) caution that this figure overestimates the underlying plight of the industry because of accounting changes and the large losses incurred by a few firms in bankruptcy, but we still conclude that airlines did sustain considerable losses.
85

86 Brookings Papers: Microeconomics 1996
The large fluctuations in industry earnings may be an inevitable result of the business cycle and the high income elasticity of demand for air travel. But they may also be attributable to the fare wars that have marked the industry since deregulation-to the delight of travelers and the dismay of industry shareholders.3
The airline industry is not the only U.S. industry to engage in price wars. The popular press routinely contains stories about price wars in supermarkets, consumer electronics, and service industries, wars that break out when a firm attempts to "steal" market share.4 But the price wars in the airline industry are of particular interest. First, they are part of the airline industry's turbulent and ongoing adjustment to deregula- tion, a fact that warrants policymakers' attention at a time when other major industries such as communications and electricity are embarking on substantial deregulation. Second, the industry's technology and in- vestment behavior, unpredictable demand, and complex patterns of network competition invite competing theories about why airlines en- gage in fare wars, and they provide a rich laboratory in which to test those theories. Finally, industry executives, some of whom are eager to believe that fare wars are a temporary rather than a permanent phe- nomena, and policymakers, many of whom continue to scrutinize the industry's financial performance, could benefit from an explanation of what causes fare wars and the extent to which they affect airline industry profitability.
That is the purpose of this paper. We first develop some stylized facts about fare wars-how often they occur, how long they last, and how much they lower fares. Then we identify the chief causes of fare wars, particularly external economic effects, competitive conditions on airline routes, and route characteristics. Finally, we estimate the effect of fare wars on airline financial performance. Fare wars, we find, have substantially reduced industry profitability, particularly since 1990. The most important influences on these wars have been the amount of com-
3. During 1995 some airline executives were quoted as claiming that the days of ferocious fare wars were over. Indeed, John Dasburg, CEO of Northwest Airlines, asserted in November 1995 that "airlines are no longer engaged in monumental efforts to steal market share." (See Andrew Osterland, "Can the Airlines Stand Prosperity?" Financial World, November 21, 1995, p. 26.) In March 1996 Northwest cut fares by as much as 50 percent. United and American Airlines matched these cuts.
4. See, for example, Bill Saporito, "Why the Price War Never Ends," Fortune, March 23, 1992, pp. 68-78.

Steven A. Morrison and Clifford Winston 87
petition on a route, the unpredictability of economic growth, and the extent to which carriers compete in the same markets, which has inten- sified carrier competition rather than facilitated cooperation.
Conceptual and Measurement Issues
The ideal way to measure and analyze fare wars is to develop a model that endogenously determines their initiation and duration. This approach appears to be difficult. Ultimately, some assumption has to be made about when a fare war begins and when it ends. Our approach, therefore, is to specify a base-case definition of a fare war and subject our findings to extensive sensitivity analysis.
We assume that a fare war on a route (defined by its origin and destination airports) begins when the average fare on that route falls in a single quarter at least 20 percent (in nominal terms) from the preced- ing quarter's average fare. The war ends when its average fare rises by any amount. Besides investigating the sensitivity of our main conclu- sions to alternative assumptions of when a fare war starts and ends, we investigate the sensitivity of our conclusions to alternative parts of the fare distribution. This sensitivity analysis is important because a change in the average fare that we define as a fare war could simply reflect an exogenous change in the number of travelers on a route who pay dis- count fares. Finally, we explore the sensitivity of our results to the use of real instead of nominal fares and to the use of cities instead of airports to define a route.
In the airline industry it is important to distinguish between fare wars and other causes of steep fare declines. We view a fare war as a spon- taneous event: it begins when one carrier on a route initiates a fare cut and other carriers match or exceed it, and it continues until carriers raise their fares. That is, a fare war is more than just a drop in prices. Prices could fall because entry by low-cost carriers makes previous (higher) fare levels unsustainable. Other carriers on the route may match the low-cost carriers' fares, but it is not likely that fares will subsequently rise to the levels they were before the low-cost entry occurred. It could therefore be argued that fare declines initiated by the entry of a low-cost carrier are not indicative of a fare war, but of the industry shedding the legacy of regulation that elevated the cost and

88 Brookings Papers: Microeconomics 1996
price of airline service. A sharp fare decline could also occur on highly seasonal routes as carriers try to encourage discretionary pleasure trav- elers to take an airline trip. Again, it might be argued that declines in fares on seasonal routes, followed by a rise in fares when the travel season ends, do not signal a fare war per se. In our empirical analysis we distinguish between conventional influences on fare wars and (low- cost) entry and seasonality.S
A general concern with any empirical attempt to identify a price war is whether one is actually measuring a "normal" price response to an exogenous change in the demand or cost of the industry's product. In the airline industry, demand continues to grow almost every year, so a precipitous decline in air fares that is not attributable to a fare war, seasonality, or entry could be caused by a sharp decline in industry costs. Figure 1 shows, however, that the largest quarterly decline in the industry's (average) costs since 1978 has been 6.3 percent.6 Thus, decreases in industry costs cannot by themselves explain fare decreases of at least 20 percent.
The data set we use in our analysis is the Ticket Origin and Desti- nation Survey, U.S. Department of Transportation, Data Bank IA; this is a 10 percent sample, conducted every quarter, of all airline tickets. Our sample of routes is derived from the 1,000 most heavily traveled domestic routes in 1993.7 To be included in the sample, a route had to
5. Although our analysis controls for the effect of different seasons on the likelihood of a fare war, we do not seasonally adjust average fares because we are interested in absolute fare changes (nominal or real) from quarter to quarter.
6. The data in the figure are based on an input price index, which is an approximation of changes in average cost. Of course, on a given route average cost may have fallen by more than 6.3 percent, which could occur because of the entry of a low-cost carrier.
7. These routes cover the contiguous forty-eight states. To make certain that the fare reflected travel between a single origin and destination and not a series of trips with intermediate stops, only one-way tickets with two or fewer segments and round-trip tickets with two or fewer segments on each of the outbound and return legs of the trip were included. In addition, round-trip tickets had to have only one destination and the passenger had to return to the point of origin. Open jaw tickets (that is, those with a ground segment) and trips involving an intermediate foreign airport were excluded as were tickets involving more than one airline (that is, interline tickets). Because of coding errors in the data that airlines provide to the Department of Transportation, the U.S. General Accounting Office's (1990) fare screen was used to eliminate tickets with fares that seemed too high or low; thus we are eliminating frequent flier tickets. That is appropriate because we are interested in posted fares, not in tickets given away because of accumulated travel.
Steven A. Morrison and Clifford Winston 89
Figure 1. Quarterly Changes in Airline Industry Costs, 1978:2-95:4
Percentage
15
10
5
50 v -V v
-5-
-10o I I II I 1 I 1980:1 1983:1 1986:1 1989:1 1992:1 1995:1
Source: Air Transport Association, Air-linie Cost Index, Washington, DC.
have at least 600 sampled passengers a quarter, which is equivalent to one jet flight a day.8 Any route that did not have data for all quarters from the initiation of service until discontinuation of service (if appli- cable) was dropped. These conditions reduced the sample to 521 routes. Based on this sample and our assumption of what constitutes a fare war, we find that when a route experiences a fare war, fares fall, on average, 32.4 percent, with a range of 20 percent to 79 percent, and that the initial rise that ends the war is, on average, 16 percent, with a range of less than 1 percent to 90 percent.
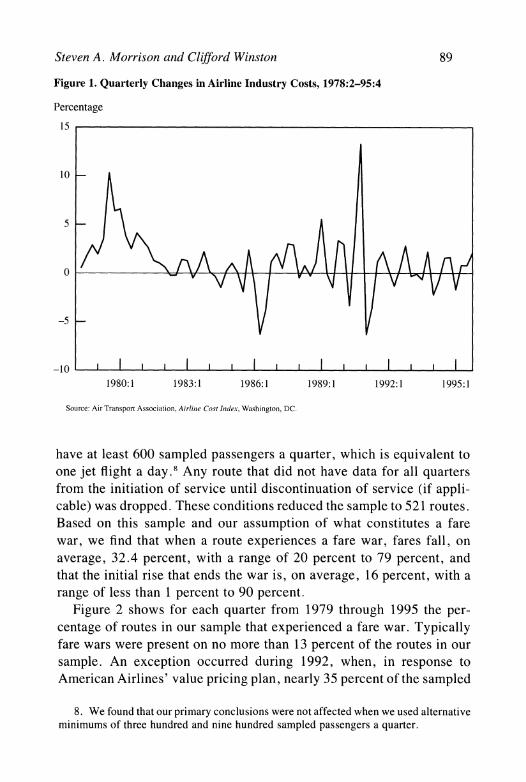
Figure 2 shows for each quarter from 1979 through 1995 the per- centage of routes in our sample that experienced a fare war. Typically fare wars were present on no more than 13 percent of the routes in our sample. An exception occurred during 1992, when, in response to American Airlines' value pricing plan, nearly 35 percent of the sampled
8. We found that our primary conclusions were not affected when we used alternative minimums of three hundred and nine hundred sampled passengers a quarter.
90 Brookings Papers: Microeconomics 1996
Figure 2. Percentage of Routes with a Fare War, 1979:1-95:4
Percentage
35
30-
25 -
20-
15-
10
5
0 J
1980 1983 1986 1989 1992 1995
Source: Authors' calculations. See text for explanation.
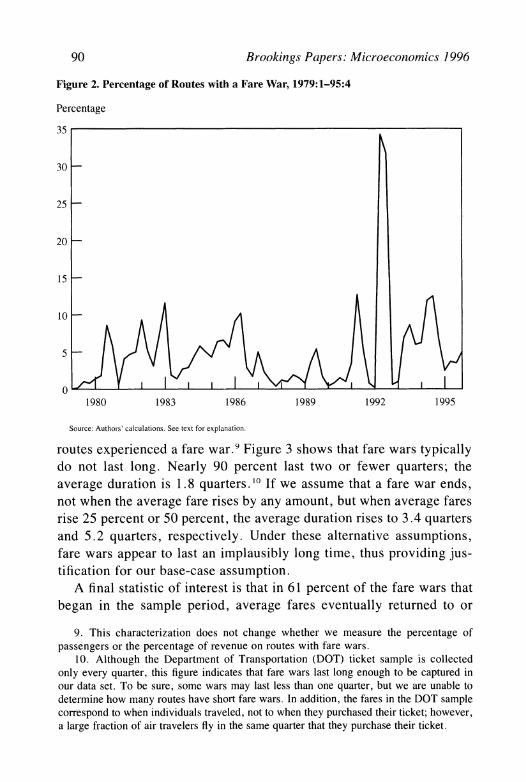
routes experienced a fare war.9 Figure 3 shows that fare wars typically do not last long. Nearly 90 percent last two or fewer quarters; the average duration is 1.8 quarters. '0 If we assume that a fare war ends, not when the average fare rises by any amount, but when average fares rise 25 percent or 50 percent, the average duration rises to 3.4 quarters and 5.2 quarters, respectively. Under these alternative assumptions, fare wars appear to last an implausibly long time, thus providing jus- tification for our base-case assumption.
A final statistic of interest is that in 61 percent of the fare wars that began in the sample period, average fares eventually returned to or
9. This characterization does not change whether we measure the percentage of passengers or the percentage of revenue on routes with fare wars.
10. Although the Department of Transportation (DOT) ticket sample is collected only every quarter, this figure indicates that fare wars last long enough to be captured in our data set. To be sure, some wars may last less than one quarter, but we are unable to determine how many routes have short fare wars. In addition, the fares in the DOT sample correspond to when individuals traveled, not to when they purchased their ticket; however, a large fraction of air travelers fly in the same quarter that they purchase their ticket.

Steven A. Morrison and Clifford Winston 91
Figure 3. Distribution of Duration of Fare Wars
Percentage of wars
50
45-
40-
35 -
30-
25
20-
15-
10
5
0 m
1 2 3 4 5 6 7 8 9
Duration (Quarters)
SoLirce: Authors' calculations. Note: Data are for wars that have ended.
exceeded the average fare for the quarter preceding the war. On aver- age, it took 8.4 quarters for fares to return to their prewar levels. In 19 percent of the wars, another war broke out before fares returned to their prewar levels. And in the remaining 20 percent of the wars, the fare series ended before fares returned to their prewar levels. These figures suggest that a large fraction of the sharp fare declines are generated, at least in part, by fare wars. That is, fares that fall precipitously because of seasonality should return to preseason levels in only a few quarters. I I
Fares that decline because of low-cost entry should not return to their preentry level. In summary, fare wars in the airline industry generally
11. Our data indicate that fare wars do occur in each quarter of the year. Based on our sample, 17.8 percent of the route quarters during which a fare war occurs are in the first (winter) quarter, 33.3 percent are in the spring quarter, 31.7 percent are in the summer quarter, and 17.2 percent are in the fall quarter.

92 Brookings Papers: Microeconomics 1996
occur on a small percentage of routes at any given time and last no more than six months, but when they occur, fares decline precipitously and take a long time to return to prewar levels, if they ever do. 12
Although our descriptive statistics of fare wars are plausible, it would be useful to provide some corroborating evidence that we are in fact identifying fare wars. One suggestive approach is to compare our em- pirical characterization with accounts about fare wars in national pub- lications that follow the airline industry. The correlation between the number of wars we identified using our base-case definition of a war (a war begins when fares fall 20 percent from the preceding quarter, and the war ends when fares rise any amount) and the number of articles about fare wars in Aviation Week and Space Technology, The Wall Street Journal, and The New York Times was 75 percent. 13 Thus, our base-case definition appears to conform reasonably well to popular perceptions of when the airline industry is engaged in fare wars. The estimated correlation was hardly affected when we assumed that a fare war began when fares fell 15 percent or 25 percent, thus we maintain our mid-range assumption. The correlation did fall substantially when we assumed a war ended when fares rose 25 percent or 50 percent, providing additional evidence that these alternative definitions charac- terize fare wars as lasting longer than they actually do. 14
The effect and duration of fare wars for the heavily traveled route between Los Angeles and San Francisco are shown in figure 4. Accord- ing to our base-case definition, this route has experienced two wars. The first began in the third quarter of 1990 and lasted until the second quarter of 1991. As a result of this war, the average one-way fare declined 46 percent (falling from $93, the average fare in the quarter preceding the start of the war, to $50, the average fare in the quarter preceding the end of the war). The average fare returned to its prewar
12. Eighty percent of the routes in our sample experienced a fare war at some time. Only 21 routes out of 521 had ten or more quarters during which a fare war occurred. These routes account for 14 percent of the wars, which suggests that a few routes do not account for a large share of the wars.
13. The number of articles about fare wars was derived from CompuServe's Knowl- edge Index data base. The estimated correlations were affected only slightly when they were based on passengers instead of routes.
14. Because several of the articles included reporting of actual fares during the wars, it is not likely that the correlation fell because the media grew tired of reporting about a fare war.

Steven A. Morrison and Clifford Winston 93
Figure 4. Average One-Way Fare between Los Angeles (LAX) and San Francisco (SFO), 1979:1-95:4
Average fare
100
90 _ Fa re
war ends 80 -
70-
60 - Fa re war begins
50 - Fa re war begins
40 - Fa re war ends
30
20 1980 1983 1986 1989 1992 1995
Source: Authors' calculations.
level seven quarters after the war ended. The second war began in the third quarter of 1993 and lasted until the second quarter of 1994. As a result of this war, the average one-way fare declined 21 percent (falling from $86 to $68). The average fare had not yet returned to its prewar level by the beginning of 1996. These fare wars, which are typical of those we studied, had been preceded by a period in which average fares on the route had been steadily rising since deregulation in 1978. What factors lead carriers to break from past pricing practices and engage in behavior that may be responsible for lowering their profits? We turn to this question by developing an empirical model of fare wars.
An Empirical Model of Fare Wars
According to economic theory, a necessary condition for a price war is interfirm rivalry. Thus, price wars occur in an industry because

94 Brookings Papers: Microeconomics 1996
oligopolistic coordination breaks down or because a new firm threatens to enter the market. These wars could be equilibrium strategies as part of a supergame or disequilibrium phenomena. Empirical estimates of conjectural variations and causality in the airline industry strongly sug- gest that interfirm rivalry combines with other factors to precipitate fare wars. '5
We have not found a comprehensive empirical model of price wars in a specific industry that we can extend for our purposes.'6 Thus we build a model of fare wars by drawing on various general theories of price wars to motivate our specification. We then integrate these theo- ries with institutional factors pertaining to the airline industry to quan- tify the relevant variables. Theories of price wars can be organized around external economic effects, which will not vary by airline route, and internal competitive conditions, which will vary by route.
External Economic Effects
External economic effects include changes in the macroeconomy that influence industry demand or cost or events that generate uncertainty about demand or cost. They also include seasonal or temporal influences.
UNANTICIPATED OR FLUCTUATING DEMAND. Two theories, unantici- pated demand shocks and fluctuating demand, collectively argue that price wars could develop during either a contracting economy or an expanding one because of changes in demand conditions. The first theory suggests that price cuts and repeated undercutting occur in a contracting economy as the industry evolves to a new equilibrium.'7 This theory motivates the inclusion of some measure of a decline in gross domestic product (GDP) in a model that seeks to explain the occurrence of price wars. The second theory argues that price wars could develop in an expanding economy. 18 The reasoning is that, given a fluctuating economy, a firm would gain from cutting prices in a boom because the benefits of cheating are high relative to the costs of punish-
15. See Brander and Zhang (1990) for estimates of conjectural variations, and Mor- rison and Winston (1995) for estimates of causality and price leadership in the airline industry.
16. Existing empirical work on price wars generally tests a particular theory of why price wars occur, rather than simultaneously testing many theories.
17. Slade (1992). 18. Rotemberg and Saloner (1986).

Steven A. Morrison and Clifjbrd Winston 95
ment anticipated in future periods. Rival firms, however, anticipate this behavior and try to deter it by lowering prices, which sets off a price war. This theory motivates the inclusion of some measure of an increase in GDP in a price war model.
As discussed in Morrison and Winston, profitability in the airline industry is affected by carriers' ability to align seat capacity with de- mand. '9 That is, airlines must make their capacity decisions years in advance because of the time it takes to acquire new aircraft. Accord- ingly, they must make periodic forecasts of the economy to reduce the possibility that their decisions will result in excess or insufficient ca- pacity. Thus, the unpredictability of GDP is particularly relevant to a fare war model. Following Morrison and Winston, we develop a plau- sible basis for predicting the trend in GDP and then calculate overesti- mates and underestimates of GDP's trend from its actual value. We, of course, do not know how individual carriers predict GDP, but our simple procedure correlates strongly with actual industry capacity and profit margins. The procedure is to predict GDP m years in the future using actual GDP growth during the previous n years. We found that an eleven-year trend projected two years in the future best predicted GDP.20 Then we calculated deviations from actual GDP based on this trend-projection structure.2' The deviations are charted in figure 5. We specify these underpredictions and overpredictions as separate explan- atory variables in our model of fare wars.22
UNCERTAINTY. Another theory argues that price wars could develop because "noise" in the economy makes prices uncertain.23 In general, competition in the airline industry is not characterized by a lack of information about prices and costs (see below). Uncertainty about air-
19. Morrison and Winston (1 995). 20. For a two-year lead, which approximates the lead time required to order new
aircraft, we selected the lag that minimized the sum of squared deviations of actual GDP from predicted GDP. Morrison and Winston (1995) found that a GDP prediction devia- tion variable that used a two-year lead best predicted aggregate industry gross profit margins.
21. The fit that maximized the value of the log-likelihood of our fare war model was a ten-year trend projected two years in the future. Use of this alternative trend-projection structure had no perceptible effects on our findings.
22. The unpredictability of demand inherently arises at the system level. Thus the absence of a route-specific measure of this variable does not appear to be a serious shortcoming.
23. Stigler (1964).

96 Brookings Papers: Microeconomics 1996
Figure 5. Percentage Deviation of GDP Trend from GDP, 1978:1-95:4
Percentage
8
6
GDP trend > GDP
4~~~~~~~
-4 GDP trend < GDP
-6
-8 l I I I I l 1980 1983 1986 1989 1992 1995
SoLurce: Authors' calculations; see text for explanation.
line demand may have arisen, however, during the Persian Gulf War, because some people may not have flown in response to their fear of terrorist attacks. Thus we specify a Gulf War dummy variable in our model to capture this effect.
OTHER EXTERNAL EFFECTS. As indicated earlier, it is important to distinguish between price wars and declines in prices caused by declines in cost. Thus our model controls for changes in the Air Transport Association airline cost index.24 In addition, because airline pricing is subject to seasonal fluctuations-in particular, carriers are more likely to encourage discretionary pleasure travel during the spring and summer by lowering fares-it is important to control for seasonal effects on the likelihood of a fare war with seasonal dummy variables.
24. Cost changes could also lead to price cuts that, because they are misinterpreted, could increase the likelihood of a fare war. We also specified the standard deviation of the airline cost index, as a control for cost uncertainty, but this variable was not statis- tically significant.

Steven A. Morrison and Clifford Winston 97
Internal Competitive Conditions
Internal competitive conditions include the characteristics of firms that compete in a market, such as their reputation, financial condition, and so on, and the characteristics of the market, such as market struc- ture, degree of multimarket contact, and entry barriers.
REPUTATION. This theory, discussed by Tirole, argues that rivals may signal that they have lower costs or cannot be trusted.25 The reputation of a rival for pricing aggressively-even to the point of engaging in predatory behavior-could therefore lead to a price war. In the airline industry, Morrison and Winston find that an airline's fare on a route and its response to other carriers' fares depends on the specific airline (or airlines) it is competing against.26 Thus we attempt to control for the effect of carrier reputation on the likelihood of a fare war by spec- ifying a dummy variable for each airline that indicates whether it is serving a particular route during a given quarter.
SWITCHING COSTS. Another theory argues that a price war is triggered because a new entrant initially sets a low price to capture market share from an incumbent firm that has an advantage because its customers face costs if they switch to the new entrant.27 Morrison and Winston find that travelers develop carrier loyalty based on previous travel ex- periences and place a high value on frequent flier mileage that they accumulate on a carrier; thus new entrants to a route may have switching costs to overcome.28 We specify dummy variables for each airline that indicate whether it has entered the route in the current quarter, thus capturing the effect that entry may have on the likelihood of a fare war. To be sure, the entry dummies could also be capturing the effect of new, especially low-cost, competition on the likelihood of a fare war. Conversely, carrier exit could reduce the likelihood of a fare war; thus we also specify dummy variables for each airline that indicate whether it has exited the route in the current quarter. The exit dummies could capture the outcome of predatory behavior that motivated the fare war.
MARKET STRUCTURE. This theory argues that it is easier to maintain collusive agreements, and avoid price wars, when the number of firms
25. Tirole (1988). 26. Morrison and Winston (1995). 27. Klemperer (1989). 28. Morrison and Winston (1995).

98 Brookings Papers: Microeconomics 1996
in a market is small.29 In the airline industry, market structure is mea- sured at the route level by the number of actual (equal-sized) competi- tors that serve the route and the (minimum) number of (equal-sized) competitors that serve the two airports at either end of the route. The measure of equal-sized (or effective) competitors is the inverse of the Herfindahl index based on each carrier's market share. These variables control for the effect of market structure on the likelihood of a fare war.30
MARKET SHARE CHANGES. This theory argues that if a firm's market share has been eroding, its management may attempt to regain market share by cutting prices, which could precipitate a price war.3' We control for this effect on the likelihood of a fare war by including the maximum loss in market share, lagged one quarter, over all carriers serving the route.
MULTIMARKET CONTACT. Multimarket contact means that two firms encounter each other in many markets. It is directly relevant to a net- work industry such as airlines because some carriers share many routes. To the extent that a large part of a carrier's revenue is earned in markets in which it repeatedly competes with another carrier, both carriers have strong financial incentives to avoid fare wars.32 Conversely, multimar- ket contact could stimulate fare wars because carriers engage in "price disciplining," where they respond to price cuts by a rival in their most profitable markets by cutting prices in their rival's most profitable mar- kets. This behavior could escalate into a fare war. Notwithstanding the theoretical uncertainty of its effect, we include a measure of multimar- ket contact in our model of fare wars. Multimarket contact between carrier A and carrier B for any given quarter is defined as the percentage of carrier A's revenue (in the top 1,000 routes) that it earns in markets
29. Tirole (1988). 30. These measures of market structure are highly correlated with other variables
related to route competition, such as the price-cost margin on a route or whether one of the airports is dominated by a hub carrier. A mechanical approach would be to identify the quarters when fares are at their highest levels on a route and argue that fare wars amount to a "correction." However, the same factors that lead to high fare levels (for example, a low number of effective competitors) are also likely to lower the probability of a fare war. An increase in the probability of a fare war is likely to arise from a change in these factors.
31. Tirole (1988). 32. Bernheim and Whinston (1990).

Steven A. Morrison and Clifford Winston 99
where it competes with carrier B. The variable we use to summarize multimarket contact on the route is the average multimarket contact over all carriers serving the route.33
BANKRUPT CARRIERS. The airline industry has witnessed several bankruptcies during the past decade. It has been argued that bankrupt carriers have slashed fares in a desperate attempt to raise cash. Alter- natively, bankrupt carriers could be the target of predatory price cuts designed to hasten their exit from the industry. Either behavior could precipitate fare wars, thus we use dummy variables to identify the presence of a carrier in bankruptcy on a route.
IMPERFECT INFORMATION. This theory argues that price wars arise when a firm cannot tell with certainty whether a fall in its profits has been caused by a rival's deviation from an implicit collusive agreement or by worsened market conditions.34 Although this theory may be rel- evant to some industries, it is unlikely that imperfect information is a factor in the airline industry. Carriers know their rivals' fares and frequencies in specific markets. And the widespread use of yield man- agement systems has enabled carriers to have a good idea about how their rivals allocate seats among different fare classes. In addition, carriers that own a computer reservation system can use it to obtain information about their rivals' allocation of seat capacity.35 Thus im- perfect information about rivals' behavior is not relevant to our speci- fication of fare wars in the airline industry.
Route Characteristics
Because fare wars do not occur on all routes simultaneously, there may be dynamic effects or characteristics of a route that influence the likelihood of a fare war. We attempt to control for dynamic influences
33. Multimarket contact partially captures the effect of a carrier's route system on the likelihood of a fare war. A more explicit variable capturing system effects (that is, whether a fare war on one of a carrier's routes increases the likelihood of a fare war on many of its other routes) does not appear to be necessary. We found that the weighted average share of a carrier's routes involved in a fare war during a given quarter was 6.8 percent.
34. Porter (1983); Green and Porter (1984). 35. Carriers do not appear to be especially guarded about revealing information
about their capacity. According to one airline executive, carriers routinely exchange information about their load factors on specific routes.

100 Brookings Papers. Microeconomics 1996
on a route by specifying a dummy variable that indicates whether the route experienced a fare war in the preceding quarter. Fare wars may be more likely to occur on routes where the traffic mix generates a higher elasticity of demand. They may also be influenced by network competition that tends to make fare wars more likely on shorter or longer routes. We therefore include route distance in our fare war model, and to control for traffic mix, we include the population and real per capita personal income of the metropolitan area of the airports at each end of the route.36 Finally fare wars may be less likely to occur on routes that involve one or more slot-controlled airports. (To relieve congestion, the Federal Aviation Administration has imposed limits on the number of hourly takeoffs and landings at these airports.) Thus we specify a dummy variable to identify routes involving Washington Na- tional, Chicago O'Hare, New York Kennedy, or New York LaGuardia.
Estimation Results
Based on our definition of a fare war, the dependent variable in our analysis takes on a value of 1 if the route is experiencing a fare war in a given quarter, 0 otherwise.37 A binary probit model is used to estimate the effect of external economic factors, internal competitive conditions, and route characteristics on the probability of a fare war.38 Because a war may last more than one quarter, the estimated parameters capture the effect of the independent variables on the initiation and continuation of a fare war. As indicated previously, we control for the dynamic
36. Population and real per capita personal income for the metropolitan statistical area (or county where appropriate) in which each endpoint airport was located were obtained from the U.S. Department of Commerce's Regional Economic Information System.
37. Because there is no definitive way to identify a fare war, measurement error of the dependent variable is likely to arise. We assess the implications of this error by conducting sensitivity analysis of our base-case assumption of when a fare war starts and ends.
38. Initial estimations explored specifications that controlled for fixed effects, using dummy variables for some specific routes, and random effects. These specifications, however, did not lead to any improvement in the model or have much effect on the other parameter estimates. In addition, we were unable to detect any structural shift in the parameters during our period of analysis. Finally, because certain variables vary over time but do not vary for individual routes, their standard errors may be understated.

Steven A. Morrison and Clifford Winston 101
influence on the probability of a fare war by including a dummy variable that takes on a value of 1 if the route experienced a fare war in the previous quarter, 0 otherwise.39 The sample is derived from the 1,000 most heavily traveled routes from the fourth quarter of 1978 to the fourth quarter of 1995, employing the same assumptions described previously.40 A carrier was considered to serve the route if it had at least a 5 percent share of the traffic on that route.4' In addition, each route had to contain complete data for the entire period of our analysis. This eliminated 34 routes from the 521 that remained. The final sample was a balanced panel of 487 routes for sixty-seven quarters, which amounts to 32,629 observations.42
The estimation results are presented in table 1. Beginning with the external economic effects, we find that predicting either more or less growth in GDP than actually occurs increases the likelihood of a fare war.43 Our findings are consistent with the collective implications of previous theoretical work; that is, fare wars can break out in an ex-
39. We could not identify any unobserved effects that persisted through time; thus it appears reasonable to treat this variable as exogenous. As a statistical check, we instrumented the dummy variable using lagged exogenous variables as instruments and found no material changes in the parameter estimates. Thus the uninstrumented dummy was used in the final specification.
40. The sample is from the U.S. Department of Transportation's Data Bank IA. Although potential competition could cause fare wars to occur on routes with only one effective competitor, it seemed desirable to analyze fare wars on routes that had some effective competition. Thus, another assumption we made was that there had to be at least 1.2 effective competitors for a 20 percent (or greater) fare decrease to be considered as the start of a fare war. This assumption eliminated 136 fare wars. We found, however, that the parameter estimates were not affected when we used 1.0, 1. 1, or 1.3 effective competitors as minimum levels of competition.
41. This criterion was used to construct all variables related to carrier presence on a route (that is, presence in bankruptcy, presence, entry, and multimarket contact). Assuming that a carrier had to have at least 10 percent of the traffic on the route did not affect our findings.
42. A fare war could not start in 1978:4 because deregulation began in that quarter. So the earliest a fare war could have started is 1979:1. But because the market share variable was lagged one quarter and calculated based on a four-quarter change (see below), the data used in the estimations start in 1979:2. Thus, although our initial sample is based on data from 1978:4 to 1995:4 (sixty-nine quarters), estimation is based on data for sixty-seven quarters.
43. The deviation defined for negative values increases the likelihood of a fare war because its negative coefficient is multiplied by a variable whose values are always negative.

102 Brookings Papers: Microeconomics 1996
Table 1. Probit Fare War Parameter Estimates
Variable Coefficient
Constant - 3.855 (0.126)
External economic effects Positive deviation of GDP trend from actual GDP 0.180
(percent that GDP trend exceeds actual GDP, defined for positive (0.009) value, 0 otherwise)
Negative deviation of GDP trend from actual GDP - 0.124 (percent that GDP trend exceeds actual GDP, defined for negative (0.011) value, 0 otherwise)
Gulf War dummy - 0.587 (1 for 1990:4-1991:1 period, 0 otherwise) (0.109)
Percentage change in airline cost index from previous quarter -0.028 (0.007)
First quarter dummy 0.063 (1 if first quarter of a given calendar year, 0 otherwise) (0.048)
Second quarter dummy 0.438 (1 if second quarter of a given calendar year, 0 otherwise) (0.047)
Third quarter dummy 0.246 (1 if third quarter of a given calendar year, 0 otherwise) (0.044)
Time trend (1 in 1978:4, 69 in 1995:4) 0.010 (0.001)
Route presence dummy (1 if the carrier served the route in the current quarter, 0 otherwise) Alaska Airlines 0.297
(0.076)
America West Airlines 0.082 (0.071)
American Airlines -0.049 (0.038)
Braniff Airlines 0.183 (0.074)
Continental Airlines 0.086 (0.045)
Delta Air Lines -0.250 (0.038)
Eastern Air Lines -0.249 (0.053)
(continued)

Steven A. Morrison and Clifford Winston 103
Table 1. (continued)
Variable Coefficient
Northwest Airlines -0.167 (0.047)
Pan American World Airways 0.038 (0.085)
People Express Airlines -0.017 (0.133)
Southwest Airlines -0.140 (0.065)
Trans World Airlines -0.137 (0.048)
United Airlines -0.020 (0.041)
USAir -0.147 (0.042)
ValuJet Air Express -0.383 (0.211)
Entry dummy (1 if the carrier entered the route in the current quarter, 0 otherwise) Alaska Airlines -0.221
(0.360)
America West Airlines 0.414 (0.149)
American Airlines 0.157 (0.084)
Braniff Airlines 0.363 (0.147)
Continental Airlines 0.159 (0.082)
Delta Air Lines 0.159 (0.099)
Eastern Air Lines 0.404 (0.139)
Northwest Airlines 0.175 (0.119)
(continued)

104 Brookings Papers: Microeconomics 1996
Table 1. (continued)
Variable Coefficient
Pan American World Airways 0.485 (0.185)
People Express Airlines 0.854 (0.204)
Southwest Airlines 1.239 (0.130)
Trans World Airlines 0.141 (0.107)
United Airlines 0.146 (0.106)
USAir 0.270 (0.109)
ValuJet Air Express 1.494 (0.307)
Other carriers 0.306 (0.057)
Competitive factors
Number of effective competitors on the route 0.257 (defined if the number is less than 3, 0 otherwise) (0.035)
Number of effective competitors on the route 0.119 (defined if the number is greater than or equal to 3, 0 otherwise) (0.027)
Minimum number of effective competitors at the origin and destination 0.118 airports that serve the route (defined if the number is less than 2, (0.035) 0 otherwise)
Minimum number of effective competitors at the origin and destination 0.009 airports that serve the route (defined if the number is greater than or (0.012) equal to 2, 0 otherwise)
Maximum percent loss in market share for a carrier on a route (based 0.002 on changes in market share over four quarters), lagged one quarter (0.001)
Average amount of multimarket contact on a route (percent) 0.008 (0.001)
America West bankruptcy -0.536 (1 if America West served the route during its bankruptcy 1991:3- (0. 109) 1994:2, 0 otherwise)
(continued)

Steven A. Morrison and Clifford Winston 105
Table 1. (continued)
Variable Coefficient
First Continental bankruptcy 0.147 (1 if Continental served the route during its first bankruptcy 1983:4- (0.080) 1986:3, 0 otherwise)
Second Continental bankruptcy - 0.179 (1 if Continental served the route during its second bankruptcy (0.071) 1991:1-1993: 1, 0 otherwise)
Eastern bankruptcy -0.292 (1 if Eastern served the route during its bankruptcy 1989:2-1991:1, 0 (0.181) otherwise)
Pan American bankruptcy - 1.074 (1 if Pan American served the route during its bankruptcy 1991: 1- (0.346) 1991:4, 0 otherwise)
TWA bankruptcy 0.377 (1 if TWA served the route during its bankruptcy 1992:1-1993:3, 0 (0.086) otherwise)
Route characteristics Previous war dummy 1.721
(1 if a fare war occurred on the route in the previous quarter, 0 (0.037) otherwise)
Slot-controlled airport dummy - 0.106 (1 if the route involves one or more slot-controlled airports-(DCA, (0.042) JFK, LGA, ORD, 0 otherwise)
Product of origin and destination metropolitan area populations 0.0013 (millions squared) (0.0005)
Product of origin and destination metropolitan area real average 0.0014 incomes (thousands squared) (0.0004)
Distance (one-way statute miles) -0.0002 (0.00004)
Number of observations 32,629
Estimation by maximum likelihood Log-likelihood at zero -6,718 Log-likelihood at convergence -4.705
Source: Authors' calculations. Note: Standard errors in parentheses.

106 Brookings Papers: Microeconomics 1996
panding or contracting economy.44 The findings suggest, however, that each theory predicts correctly only in one direction (that is, when a fare war is more likely). A more general theory is necessary to explain why fare wars can break out in any stage of a business cycle. The estimated coefficients indicate that when carriers have excess capacity, caused by GDP growth falling short of its predicted trend, they are more likely to engage in fare wars to fill that capacity than when they have insufficient capacity, caused by GDP growth exceeding its predicted trend.45
The negative sign for the Gulf War dummy suggests that carriers responded to the uncertainty in demand caused by the Gulf War by trying not to engage in fare wars that might have a small demand response.46 The remaining effects are as expected: the likelihood of a fare war decreases as industry costs rise; it increases during the spring and summer travel quarters, relative to the fall quarter (which is nor- malized to zero) and to the winter quarter, because more discretionary travel occurs in the spring and summer.47 The time trend shows that the likelihood of a fare war has risen over time, all else constant. That may indicate that the nature of competition in the airline industry has con- tinued to intensify in the wake of deregulation or that advances in
44. We also estimated a model that specified the change in GDP (defined separately for increases and decreases). This simpler "business cycle" specification, although yielding similar results, produced worse fits than the specification of the unpredictability of GDP.
45. This interpretation of our findings appears to be justified because we found that the estimated deviations had a positive, statistically significant effect on actual excess capacity. In addition, carriers do incur fixed (capacity) costs of market presence because of the importance of flight frequency in the determination of market shares. Carriers may therefore find it difficult to shed excess capacity and have to lower fares to fill that capacity. Carriers with insufficient capacity may be forced to lower fares to compete more effectively with carriers that offer more flight frequency.
46. Fuel prices did increase right after the Gulf War. Because our specification holds costs constant with the Air Transport Association cost index, however, the Gulf War dummy should be interpreted as capturing the effect of uncertain demand. (We noted previously that we found the standard deviation of costs to be statistically insignificant.) Carriers did contribute some of their planes to help with the war effort, but these planes came primarily from operations on international routes.
47. This finding is also consistent with our descriptive statistics that decompose fare wars by season (see footnote 1 1). It could be argued that the seasonal influences largely reflect the fare war that was precipitated by American Airlines' value-pricing plan (initiated in April 1992 and abandoned in October 1992). We therefore included a value- pricing dummy variable in the specification (defined for 1992:2 and 1992:3), but its inclusion did not affect the estimates of the seasonal dummy variables.

Steven A. Morrison and Clifford Winston 107
information technology, which make it easier for carriers to monitor competitors' fares and to respond to fare changes, are increasing the likelihood of fare wars.48
The carrier presence dummies reveal that carrier reputation does have an effect on the probability of a fare war but that this effect tends to vary with a carrier's stake in the established order.49 That is, the op- posite signs of some of the carrier presence dummies suggest that the presence of the established (former trunk) carriers, such as American, United, and Delta, generally tends to discourage (weakly) fare wars on routes that they serve.50 But the presence of the carriers that entered or restructured after deregulation, such as Alaska, America West, and Braniff, tends to encourage fare wars, possibly because these smaller (maverick) carriers see fare wars-to the extent they have lower costs- as one of the few tactics they can use to increase market share or fend off larger carriers.
48. We specified separate trends for different time periods (for example, a time trend for 1979-83 and one for 1984-95), but these did not lead to any improvements over the simple linear trend. We also specified a dummy variable that identified the time period (March 1994 to the present) that the U.S. Justice Department's consent decree has been in effect. This decree has prohibited all carriers from announcing the ending dates of their fare promotions. It might be expected that this has lowered the likelihood of a fare war, but we found that thus far it has had a statistically insignificant effect.
49. Carriers other than those in the table are omitted from the specification; thus their presence dummy is normalized to zero and the estimates of the presence dummies in the table should be interpreted as relative to the effect of the "other" carriers. Although a carrier's presence or entry on a route may be associated with a higher (or lower) probability of a fare war, we cannot tell whether the carrier is actually responsible for starting (or diffusing) the war. For example, Alaska Air has been cited as meeting sharp fare cuts instituted by competitors and setting a few of its own. (See Polly Lane, "Alaska Air Survives Fare-War Stress," Seattle Times, December 14, 1995, p. El.) We also caution that presence dummies could be picking up the effects of omitted variables.
50. One example of this behavior had been Delta's benign response to ValuJet's growth in the Southeast.
51. These findings are broadly consistent with descriptive statistics in our sample. That is, Alaska Air is engaged in fare wars in 12.5 percent of its route-quarters, while Delta is engaged in fare wars in 4.1 percent of its route-quarters. The average engage- ment for all carriers is 5.2 percent. We investigated various ways to control explicitly for differences between carriers' costs. Because route-specific carrier cost data are not available, we specified dummy variables that identified whether particular pairs of car- riers with large cost differences (for example, Southwest and USAir) are serving the same route. We found, however, that these dummy variables were statistically insignif- icant.

108 Brookings Papers. Microeconomics 1996
Although the established carriers appear to "keep the peace" on routes they serve, this changes, as indicated by the positive sign of their entry dummies, when they are new entrants on a route. The magnitudes of the entry dummies suggest that the likelihood of a fare war is even greater when a start-up carrier, such as ValuJet, enters a route. This finding is consistent with the theory that new entrants to a route, espe- cially smaller carriers, try to overcome switching costs by undercutting incumbent carriers' fares, which increases the likelihood of a fare war.52 Of course, the positive sign of all the statistically significant entry dummies is consistent with the more general interpretation that new competition, especially when supplied by a low-cost carrier such as Southwest, increases the likelihood of a fare war. Finally, we generally found that a carrier's exit from a route had little effect on the probability of a fare war. If fare wars were initiated to drive a carrier out of a market (in accordance with a predatory-based theory), one would expect that a carrier's exit would lower the probability of a fare war. It appears, in fact, that fare wars have only a small effect on the number of carriers in a market.53
Competitive factors on the route also influence the likelihood of a fare war. Consistent with theory, an increase in the number of effective competitors on the route increases the probability of a fare war, but we found that this effect was greater when there were fewer than three effective competitors on a route than when a "critical mass" of three or more effective competitors were on a route.54 Similarly, an increase in the (minimum) number of effective competitors at the two airports that compose the route increases the probability of a fare war, but this
52. It is reasonable to treat entry as exogenous in our analysis because entry is a long-term strategy with implications for a carrier's entire network. Entry is also planned months in advance. Some low-cost carriers may be able to enter routes without a great deal of planning, although their typical behavior is simply to enter with a low price, not in response to an existing fare war. In contrast, fare wars are "'spontaneous," occurring on about 5 percent of route-quarters in our sample and lasting for a couple of quarters. Thus fare wars are unlikely to influence entry.
53. The average decline in the number of carriers in the quarter before a war started and the number of carriers in the first quarter after the war ended was 11.9 percent.
54. We segmented our sample by the number of effective competitors on a route to investigate whether the determinants of fare wars varied across markets with different levels of competition. Estimation of fare war models based on different cuts of the data (for example, a sample that included only routes with 2.5 or fewer effective competitors) did not produce findings that were at variance with those in our base case.

Steven A. Morrison and Clifford Winston 109
effect becomes statistically insignificant when there are two or more effective competitors at the origin or destination airport. Finally, an increase in the maximum loss in market share on a route also increases the probability of a fare war."
Economic theory combined with institutional factors pertaining to competition in the airline industry did not yield an unambiguous pre- diction of the effect of multimarket contact on the probability of a fare war. Recall that multimarket contact can facilitate carrier cooperation that could reduce the chance of a fare war, but it also exposes rivals to competition over more routes, and a breakdown in cooperation in one market could lead to a retaliation in another market and escalate to a fare war. The estimated positive coefficient for the multimarket contact variable suggests that the latter characterization more accurately depicts the way in which multimarket contact affects the likelihood of a fare war.56 To be sure, in the absence of a fare war on a route, multimarket contact can and does facilitate fare increases; the finding presented here simply indicates that its effect on the probability of a fare war leads to fare decreases.57
The bankruptcies of various carriers have had mixed effects on the probability of a fare war. The first Continental bankruptcy and the TWA bankruptcy increased the likelihood of a fare war, but Continental's second bankruptcy and the Eastern, America West, and Pan Am bank- ruptcies reduced the likelihood of a fare war. The strategy pursued by TWA and Continental, in its first bankruptcy, of pricing for cash ap- parently escalated into fare wars on some routes.58 But that did not
55. The increase in the maximum loss in market share was based on changes in market share over four quarters. Constructing changes in market share over fewer quar- ters produced lower values of the log likelihood at convergence. Because the market share variable is lagged and because we could not identify the presence of unobserved effects that persist through time, it is reasonable to treat this variable as exogenous.
56. The previous argument to treat entry as exogenous can also be applied to mul- timarket contact. The estimated coefficient captures the interaction between two carriers and reflects any constraint placed on them by other carriers. We explored disaggregate specifications of the multimarket contact variable (that is, specifying separate coeffi- cients for several pairs of carriers) but did not find that this revealed any distinct effects.
57. See Evans and Kessides (1994); Morrison and Winston (1995) on facilitation of fare increases. The effect of multimarket contact suggests that as a carrier's presence extends to a large part of another carrier's network, efforts by carriers to avoid fare wars are compromised.
58. Fare wars involving these bankrupt carriers could have also erupted because fare cuts were directed toward them.

110 Brookings Papers: Microeconomics 1996
happen in the other bankruptcies presumably because these bankrupt carriers' reputations were so diminished that other carriers were able to ignore their fare cuts. 9
Finally, route characteristics influence the probability of a fare war. As expected, fare wars in a given quarter are more likely on routes that experienced a fare war in the preceding quarter, and less likely on routes with a slot-controlled airport. Fare wars are also more likely on routes whose origin and destination metropolitan areas have larger populations and higher incomes. This finding probably reflects the higher elasticities of travelers' demand on these types of routes. Finally, fare wars turn out to be more likely on shorter routes, which could reflect the effect of competition from other modes.
It is important to explore the sensitivity of our estimation results to alternative ways of characterizing fare wars.60 Our analysis was con- ducted using routes that were determined by origin and destination airports and defining fare wars based on nominal fares. Estimation of our fare war model using city routes instead of airport routes and real fares instead of nominal fares leads to only modest changes in the estimated parameters.6'
We did observe changes in parameter estimates when we analyzed the probability of a fare war based on different parts of the distribution of fares instead of just the average fare. Figure 6 presents the percentage
59. Morrison and Winston (1995) found that fares on a route fell when the route was served by TWA or Pan Am during their bankruptcies or by Continental during its first bankruptcy, but that fares rose when the route was served by Eastern or America West during their bankruptcies or by Continental during its second bankruptcy. These findings are largely consistent with the effects of these bankruptcies on the likelihood of a fare war. Pan Am's presence on a route during its bankruptcy led to lower fares, but it did not lead to fare wars.
60. We have indicated that our basic findings were not sensitive to the number of sampled passengers on a route that is required for a route to be included in our sample, to the market share on a route that a carrier must have to be considered as serving the route, and to the number of effective competitors on a route that is required to conclude that a 20 percent decline in fares signifies the start of a fare war.
61. Defining a route by origin and destination cities instead of by airports accounts for the fact that some cities are served by more than one airport (for example, Chicago is served by O'Hare and Midway). Because city routes have more competitors than airport routes, it is not surprising that we found that the number of effective competitors had a smaller effect on the probability of a fare war when we used city routes instead of airport routes. It is also not surprising that we found that the Air Transport Association cost index had a smaller effect on the probability of a fare war when we used real fares to define a fare war instead of nominal fares.

Steven A. Morrison and Clifford Winston 111
Figure 6. Percentage of Routes with a Fare War by Type of Fare, 1979:1-95:4
Percentage
60
50 - 20th percentile
--0--- 80th percentile
40-
30-
20 -
0 ~~~~~~~~~~~~~~~~I Ii t I 1
1980 1983 1986 1989 1992 1995
Source: Authors' calculations.
of routes in our sample that have experienced a fare war based on fares representative of those paid by pleasure travelers (we used the 20th percentile fare) and of those paid by business travelers (we used the 80th percentile fare). That is, a fare war occurs in situations when the 20th percentile fare falls at least 20 percent, and when the 80th percen- tile fare falls at least 20 percent. The figure shows that the presence of fare wars based on these parts of the fare distribution is somewhat higher than the presence based on the average fare but has followed a similar pattern over time.62
Table 2 shows that the statistical significance and sign of the effect of certain carriers' presence and entry on the likelihood of a fare war are sensitive to which fares are considered. These results indicate more precisely the competitive effects of carriers in particular segments of
62. Based on the average fare, 5 percent of route-quarters in our sample have ex- perienced a fare war. Based on the 20th percentile fare and the 80th percentile fare, the percentages are 1l .9 percent and 9.7 percent, respectively.

112 Brookings Papers: Microeconomics 1996
Table 2. Fare War Parameter Estimates for Different Parts of the Fare Distribution
20th 80th percentile percentile
fare fare Variable coefficient coefficient
Constant - 2.998 - 2.870 (0.085) (0.090)
Evternal economic effects Positive deviation of GDP trend from actual GDP 0.116 0.106
(percent that GDP trend exceeds actual GDP, defined for (0.006) (0.006) positive value, 0 otherwise)
Negative deviation of GDP trend from actual GDP -0.100 -0.068 (percent that GDP trend exceeds actual GDP, defined for (0.007) (0.008) negative value, 0 otherwise)
Gulf War dummy -0.532 -0.334 (1 for 1990:4-1991:1 period, 0 otherwise) (0.067) (0.070)
Percentage change in airline cost index from previous -0.010 -0.015 quarter (0.004) (0.005)
First quarter dummy 0.216 -0.140 (1 if first quarter of a given calendar year, 0 otherwise) (0.031) (0.033)
Second quarter dummy 0.296 0.169 (1 if second quarter of a given calendar year, 0 (0.032) (0.032) otherwise)
Third quarter dummy 0.206 0.067 (1 if third quarter of a given calendar year, 0 otherwise) (0.030) (0.031)
Time trend (1 in 1978:4, 68 in 1995:3) 0.003 0.005 (0.001) (0.001)
Route presence dummy (1 if the carrier served the route in the current quarter, 0 otherwise) Alaska Airlines 0.080 0.257
(0.062) (0.063)
America West Airlines 0.186 0.143 (0.049) (0.052)
American Airlines -0.011 -0.112 (0.026) (0.028)
Braniff Airlines 0.054 0.272 (0.054) (0.053)
Continental Airlines -0.035 0.122 (0.033) (0.033)
Delta Air Lines -0.112 -0.136 (0.026) (0.027)
(continued)

Steven A. Morrison and Clifford Winston 113
Table 2. continued
20th 80th percentile percentile
fare fare Variable coefficient coefficient
Eastern Air Lines -0.157 -0.173 (0.034) (0.037)
Northwest Airlines 0.010 -0.094 (0.031) (0.034)
Pan American World Airways 0.107 0.144 (0.056) (0.058)
People Express Airlines -0.032 -0.009 (0.095) (0.105)
Southwest Airlines -0.120 -0.105 (0.046) (0.048)
Trans World Airlines -0.060 -0.007 (0.032) (0.033)
United Airlines -0.003 0.011 (0.029) (0.030)
USAir -0.070 0.005 (0.028) (0.030)
ValuJet Air Express -0.436 0.383 (0.166) (0.134)
Entry dummy (1 if the carrier entered the route in the current quarter, 0 otherwise) Alaska Airlines 0.018 -0.409
(0.246) (0.331)
America West Airlines 0.173 0.232 (0.117) (0.119)
American Airlines 0.149 0.146 (0.060) (0.063)
Braniff Airlines 0.126 -0.087 (0.116) (0.118)
Continental Airlines 0.181 0.068 (0.059) (0.061)
Delta Air Lines -0.077 0.037 (0.072) (0.071)
(continued)

114 Brookings Papers: Microeconomics 1996
Table 2. continued
20th 80th percentile percentile
far-e fare Variable coefficient coefficient
Eastern Air Lines 0.462 0.231 (0.081) (0.092)
Northwest Airlines 0.254 0.044 (0.076) (0.086)
Pan American World Airways 0.230 0.053 (0.140) (0.150)
People Express Airlines 0.362 0.445 (0.166) (0.179)
Southwest Airlines 0.659 0.736 (0.117) (0.116)
Trans World Airlines 0.034 0.057 (0.076) (0.077)
United Airlines 0.132 0.077 (0.074) (0.078)
USAir 0.072 0.006 (0.077) (0.084)
ValuJet Air Express 1.330 0.503 (0.269) (0.250)
Other carriers 0.305 0.141 (0.041) (0.045)
Competitive factors Number of effective competitors on the route 0.241 0.222
(defined if the number is less than 3, 0 otherwise) (0.025) (0.026)
Number of effective competitors on the route 0.153 0.117 (defined if the number is greater than or equal to 3, 0 (0.018) (0.019) otherwise)
Minimum number of effective competitors at the origin and 0.081 0.073 destination airports that serve the route (defined if the (0.024) (0.026) number is less than 2, 0 otherwise)
Minimum number of effective competitors at the origin and -0.006 0.005 destination airports that serve the route (defined if the (0.008) (0.009) number is greater than 2, 0 otherwise)
Maximum percent loss in market share for a carrier on a 0.001 0.002 route (based on changes in market share over four (0.0005) (0.0005) quarters), lagged one quarter
(continued)

Steven A. Morrison and Clifford Winston 115
Table 2. continued
20th 80th percentile percentile
fare fare Variable coefficient coefficient
Average amount of multimarket contact on a route 0.009 0.007 (percent) (0.001) (0.001)
America West bankruptcy -0.318 -0.272 (1 if America West served the route during its (0.074) (0.077) bankruptcy 1991:3-1994:2, 0 otherwise)
First Continental bankruptcy 0.172 0.205 (1 if Continental served the route during its first (0.058) (0.059) bankruptcy 1983:4-1986:3, 0 otherwise)
Second Continental bankruptcy 0.053 -0.375 (1 if Continental served the route during its second (0.053) (0.060) bankruptcy 1991:1-1993: 1, 0 otherwise)
Eastern bankruptcy 0.202 0.164 (1 if Eastern served the route during its bankruptcy (0.072) (0.079) (1989:2--1991: 1, 0 otherwise)
Pan American bankruptcy -0.799 -0.622 (1 if Pan American served the route during its (0.213) (0.216) bankruptcy 1991:1-1991:4, 0 otherwise)
TWA bankruptcy 0.268 0.184 (1 if TWA served the route during its bankruptcy (0.066) (0.071) 1992:1-1993:3, 0 otherwise)
Route Characteristics Previous war dummy 1.179 1.246
(1 if a fare war occurred on the route in the previous (0.023) (0.025) quarter, 0 otherwise)
Slot-controlled airport dummy -0.069 -0.027 (1 if the route involves one or more slot-controlled (0.028) (0.030) airports-DCA, JFK, LGA, ORD, 0 otherwise)
Product of origin and destination metropolitan area 0.0001 0.0002 populations (millions squared) (0.0004) (0.0004)
Product of origin and destination metropolitan area real 0.0018 0.0007 average incomes (thousands squared) (0.0003) (0.0003)
Distance (one-way statute miles) -0.0002 0.0001 (0.00004) (0.00003)
Number of observations 32,629 32,629
Estimation by maximum likelihood Log-likelihood at zero - 12,395 - 10,870 Log-likelihood at convergence - 10,254 -8,890
Source: Authors' calculations Note: Standard errors in parentheses.

116 Brookings Papers: Microeconomics 1996
the travel market. For example, the presence of American, an estab- lished carrier that derives substantial patronage from business travelers, has a much larger effect on reducing the probability of a fare war on fares that are more likely to be paid by business travelers than on fares that are more likely to be paid by pleasure travelers. In contrast, the presence of Continental, an established carrier that has been restruc- tured as a low-cost carrier, reduces (weakly) the probability of a fare war on fares that are more likely to be paid by pleasure travelers, but increases the probability of a fare war based on fares paid by business travelers. The presence of America West, a maverick low-cost carrier, increases the probability of a fare war on both types of fares. Based on average fares, the entry of either Southwest or ValuJet on a route increases the probability of a fare war more than the entry of any of the other carriers. Their entry also generates the largest increase in the probability of a fare war for specific types of fares.
The table also shows that the effects of some of the other variables are sensitive to which fares are considered. We find that the Gulf War tended to lower the probability of a fare war for fares more likely to be paid by pleasure travelers than for fares more likely to be paid by business travelers, presumably because pleasure travelers were more inclined to postpone travel, regardless of fare levels, in response to their fear of terrorism. The effects of different seasons on increasing the likelihood of a fare war are larger for fares more likely to be paid by pleasure travelers than for fares more likely to be paid by business travelers, presumably because seasonal fare declines are directed to- ward discretionary pleasure travelers. Finally, variables such as multi- market contact, the unpredictability of GDP, and the number of effec- tive competitors on a route persistently increase the likelihood of a fare war regardless of which part of the fare distribution is used in the analysis.63
Finally, we investigated the sensitivity of our findings to alternative definitions of when a fare war starts and ends. We found that the
63. As indicated previously, our findings are potentially sensitive to the concern that changes in the average fare that we use to define a fare war could simply reflect an exogenous change in the number of travelers on a route who pay discount fares. This concern, however, does not appear to be important given that we obtained many of the same central findings using specific parts of the fare distribution that we obtained using the average fare.

Steven A. Morrison and Clifford Winston 117
estimates were not particularly affected when we assumed a fare war began when fares fell from the preceding quarter's fares by either 15 percent or 25 percent, instead of by 20 percent.64 Recall that alternative assumptions of when a fare war began had a minor effect on the esti- mated correlation between our identification of fare wars and the num- ber of media articles about fare wars. Alternative definitions of the end of a fare war did show an effect: several of the carrier presence and entry dummies and a few other parameters were affected when we assumed a fare war ended when fares rose from the preceding quarter's fares by at least 25 percent or 50 percent, instead of by any positive amount. It will be recalled, however, that these alternative assumptions about when a fare war ends generated less plausible durations of fare wars and sharply lowered the correlation between our identification of fare wars and the number of media articles about fare wars. We will pursue the implications of using alternative definitions of the beginning and end of a fare war when we estimate the effect of fare wars on industry profitability.
A final set of estimation results indicated that the unpredictability of demand has the greatest influence on whether a fare war ends. Variables pertaining to internal competitive conditions generally had statistically insignificant effects. The insignificance of the exit dummies is consis- tent with our previous finding that the causes of fare wars are at odds with a theory based on predatory behavior.
Fare Wars and Airline Industry Profitability
The plethora of theories of price wars and various institutional factors relevant to the airline industry strongly suggested that an empirical investigation of fare wars would not culminate in a simple explanation for this phenomenon. Indeed, our parameter estimates by themselves do not yield one. They are consistent with the predictions of several
64. Our base case uses a 20 percent decline in fares that took place over one quarter to define a fare war. A possible concern with this approach is that the 20 percent decline in fares could have taken place over two quarters (for example, a 15 percent decline in the first quarter and a 5 percent decline in the second quarter). Hence, we would not have specified a fare war as beginning when fares fell by 15 percent. This concern, however, is not likely to be important given that our findings do not appear to be particularly sensitive to plausible assumptions of when a fare war begins.

118 Brookings Papers: Microeconomics 1996
theories and reveal the influence of factors that are beyond the scope of general theoretical models.
Our study, however, is motivated by an interest in assessing the impact of fare wars on the financial performance of the airline industry. We therefore use our model to estimate the effect of wars on industry profitability and then decompose our findings by the most important influences on the likelihood of a fare war. This decomposition also enables us to reveal the effect of influences, namely, seasonality and low-cost entry, on price declines that are possibly distinct from fare wars.
To perform this calculation, we have to specify the appropriate coun- terfactual: What would average fares be in the absence of fare wars? There is obviously no definitive answer to this question, but a reason- able base case is the average fare in the quarter that preceded the war. In our analysis the absence of fare wars can result by assuming that the parameters in the fare war equation approach zero; that is, carriers may, for example, still have difficulty predicting demand, but this unpre- dictability no longer leads to fare wars.
One might argue that average fares would fall in the absence of fare wars. But that is not entirely clear. First, fare wars do not seem to affect the most important explanatory variables typically found in fare equations, namely, distance and the number of competitors on a route. Second, because fare wars are sporadic and have distinctive effects that would be hard to duplicate, their absence is not likely to affect fare equation parameters. Consider, for example, the major fare war in the early 1990s that substantially lowered average industry fares. It does not seem likely that average industry fares would have fallen by a comparable amount had that war not occurred. Nonetheless, to the extent that average fares would fall in the absence of fare wars, our estimate of the profit loss from fare wars should be interpreted as an upper bound.
The expected change in airline industry profitability caused by fare wars was calculated as follows. First, the predicted probability of a fare war during each quarter was calculated for each route in our sample using the estimated probit model. A summary probability for each quarter was then obtained using a weighted average of the route-level probabilities, where the weights were each route's revenue. This sum- mary probability was multiplied by the fraction that fares would have

Steven A. Morrison anid Clifford Winston 119
to increase to eliminate the effect of the fare war. Because fares during a war fell on average by 32.4 percent from prewar levels in the preced- ing quarter, this base-case counterfactual amounts to raising average fares by 47.9 percent [1/(1 - 0.324) - 1] to eliminate the effect of the war. The result was multiplied by quarterly industry domestic passenger revenue to obtain the expected decrease in revenue from a fare war and then converted to the expected loss in profit using a conversion formula in Morrison and Winston.65 The total loss for each year was then de- composed by the various influences in our fare war model.66
The findings presented in figure 7 show that, accounting for all influences, the annual cost of fare wars to the airline industry, in the form of reduced profits, clustered around $300 million between 1980 and 1990. Net annual income during this period, ranged from -$915 million in 1982 to $1.68 billion in 1988, hence this loss had a moderate impact on industry profitability. But since 1990 the loss in profits from fare wars has risen, peaking at $1.53 billion in 1992 and remaining above $500 million each year since then. To put these figures in per- spective, in 1994 the industry lost $280 million in net income; its losses from fare wars during that year were $1.04 billion.
Figure 7 also presents the effects of the most important causes of fare wars: the unpredictability of GDP, the amount of route competi- tion, and multimarket contact.67 The unpredictability of GDP accounts, on average, for 25 percent of the losses from fare wars during 1979- 95, the amount of route competition accounts for 28 percent of the losses, and multimarket contact accounts for 13 percent of the losses. The contributions of summer seasonality effects and entry are small-
65. Morrison and Winston (1995). The conversion formula is (1 - q + (1 - MOq), where - is the absolute value of the price elasticity of demand, 0 is the cost elasticity, and M is the gross profit margin. Two rules of thumb in the industry are a price elasticity of demand of -0.7-this figure is also obtained by Gordon (1995) and is consistent with the implied elasticity based on our data-and a cost elasticity of 0.2 in the short run when capacity is taken as given. We use these elasticities here, but we will indicate the sensitivity of our findings to alternative elasticity assumptions. The gross margin, M, is approximately zero, even in good years.
66. The fraction of total losses from fare wars attributable to a particular variable equaled the fraction that the variable and its coefficient contributed to the systematic part of the regression, excluding the constant.
67. The effect of the amount of competition at the route level is distinct from the effect of entry because the number of effective competitors at the route level will change just in response to a change in the market shares of the incumbent carriers.

120 Brookings Papers: Microeconomics 1996
Figure 7. Effect of Fare Wars on Industry Profit, 1979-95
Lost profit in millions of dollars
1,600
Wz GDP effects 1,400
Route competition
1,200 Multimarket contact
Other
1,000
800
600
400
200
0 1980 1983 1986 1989 1992 1995
Source: Authors' calculations.
each accounts, on average, for less than 5 percent of the losses. Thus the potential for mixing pure fare wars with these types of price declines does not appear to be an important concern. Because route competition and multimarket contact in the airline industry are unlikely to decline, it is quite likely that fare wars will continue to break out. But if carriers can do a better job of aligning their capacity with demand, the frequency and cost of fare wars to them can be reduced.
From 1979 to 1995, we estimate that fare wars lowered industry profits by $7.8 billion. The total cost of fare wars to industry profita- bility was not sensitive to whether we used nominal or real fares to identify fare wars or whether we used airport routes or city routes in the analysis. The total cost of fare wars was sensitive to our definition of when a fare war began and ended. If we assumed that a fare war began when fares fell 25 percent, the loss from fare wars during 1979-

Steven A. Morrison and Clifford Winston 121
95 was $5.2 billion. The loss was lower than that in our base case because fewer routes were classified as experiencing a fare war. Alter- natively, if we assumed that a fare war began when fares fell 15 percent, thus increasing the number of routes that were classified as experiencing a war, the loss was $11.3 billion. Finally, if we assumed that a war began when fares fell 20 percent, but ended when fares rose 25 percent, thus prolonging the cost of a war, then the loss from fare wars ap- proached $20 billion. This latter assumption is suggestive of the resid- ual effect of fare wars: a fare war may end but fares are slow to return to prewar levels. Our findings were much less sensitive to our assump- tion of the elasticity of demand, to an alternative approach to estimating the average fare in the absence of a war, or to estimating the initiation and continuation of a war jointly instead of separately.68
Conclusion
Fare wars have become an important aspect of the airline industry's ongoing adjustment to deregulation and have affected the welfare of both carriers and travelers. We estimate that from 1979 to 1995, fare wars lowered industry profits by nearly $8 billion, but they have also been an important source of the benefits that travelers have gained from deregulation .69
Because two prime causes of fare wars, competition on airline routes and multimarket contact between carriers, are unlikely to change sub-
68. Our base case assumed an elasticity of demand of - 0.7. If we assume a demand elasticity of -0.5, the loss in profits rises from $7.8 billion to $10.7 billion. If we assume a demand elasticity of - 1.0, the loss in profits becomes $3.6 billion. Our estimate of the change in fares in the absence of a fare war was based on the average fare in the quarter preceding a war. Using this benchmark, we found that fares declined, on average, by 32 percent because of fare wars. As an alternative benchmark, we used the average fare for the four quarters preceding the war. This yielded a 28 percent decline in fares and reduced the profit losses from fare wars by roughly 20 percent. Finally, using our base-case specification we estimated separate models to explain the initiation of a fare war and the continuation of a fare war. The loss in profits from fare wars was roughly 7 percent greater when these models were used in the calculation instead of the joint model.
69. Given a downward sloping demand curve for air travel (and prices greater than marginal cost), the $7.8 billion loss in industry profits from fare wars represents a lower bound on consumer gains. This amounts to some 10 percent of the estimated total benefits to consumers from the deregulation of airline fares.

122 Brookings Papers: Microeconomics 1996
stantially, fare wars will continue to play a role in industry competition. The other major cause of fare wars, the unpredictability of GDP, should serve as a constant reminder to the industry of the costs of failing to align capacity with demand. The hopes of airline managers to the con- trary, the days of fare wars are not numbered.
Fare wars undoubtedly lower industry profits overall and contribute to their volatility, but they are not necessarily a threat to net economic welfare. Indeed, fare wars are likely to be a permanent consequence of the nature of competition, demand, and technology in this deregulated industry. Policymakers would be well advised to let deregulation take its course and take the resulting dramatic swings in the industry's earn- ings in stride.
References
Bernheim, B. Douglas, and Michael D. Whinston. 1990. "Multimarket Con- tact and Collusive Behavior." Rand Journal of Economics 21 (Spring): 1- 26.
Brander, James A., and Anming Zhang. 1990. "Market Conduct in the Airline Industry: An Empirical Investigation." Rand Journal of Economics 21 (Win- ter): 567-83.
Evans, William N., and loannis N. Kessides. 1994. "Living by the 'Golden Rule': Multimarket Contact in the U.S. Airline Industry." Quarterly Journal of Economics 109 (May): 341-66.
Gordon, Robert J. 1995. "Airline Traffic and Profits: The Sun Rises or a False Dawn?" Northwestern University, Department of Economics, Evanston, Illinois.
Green, Edward J., and Robert H. Porter. 1984. "Noncooperative Collusion under Imperfect Price Information." Econometrica 52 (January): 87-100.
Klemperer, Paul. 1989. "Price Wars Caused by Switching Costs." Review of Economic Studies 56 (July): 405-20.
Morrison, Steven A., and Clifford Winston. 1995. The Evolution of the Airline Industry. Washington, D.C.: Brookings.
Porter, Robert H. 1983. "Optimal Cartel Trigger Pricing Strategies." Journal of Economic Theory 29 (April): 313-38.
Rotemberg, Julio J., and Garth Saloner. 1986. "A Supergame-Theoretic Model of Price Wars during Booms.'" American Economic Review 76 (June): 390- 407.
Slade, Margaret E. 1992. "Vancouver's Gasoline-Price Wars: An Empirical

Steven A. Morrison and Clifford Winston 123
Exercise in Uncovering Supergame Strategies." Review of Economic Studies 59 (April): 257-76.
Stigler, George J. 1964. "A Theory of Oligopoly.'" Journal of Political Econ- omy 72 (February): 44-61.
Tirole, Jean. 1988. The Theory of Industrial Organization. MIT Press. U.S. General Accounting Office. 1990. Airline Competition: Higher Fares and
Reduced Competition at Concentrated Airports. GAO/RCED 90-102. Wash- ington, D.C.: Government Printing Office. July.

Comments
Comment by Elizabeth E. Bailey: Three criteria seem particularly relevant for critiquing the paper by Steven A. Morrison and Clifford Winston on airline price wars: Is the paper empirically true? Is it intel- lectually interesting? And is it practically useful?
First, the authors define airline fare wars. They could find no theo- retical guideline favoring one particular definition over another, so they chose a rule of thumb that an airline fare war happens when there is a 20 percent drop in average fare from the preceding quarter followed by an increase in average fare in a later quarter. The arbitrariness of their definition is addressed by conducting sensitivity analysis (for example, fares falling 15 percent or 25 percent as the trigger for the fare wars, fares having to rise again to their former level to indicate the end of a fare war, and so on). They also conduct correlation analysis between their base-case definition of fare wars and the number of articles about airline fare wars in leading newspapers, both specialized (Aviation Week and Space Technology) and general purpose (Wall Street Journal, New York Times). They find a 75 percent correlation with the media articles and a robustness around their sensitivity analysis. So there appears to be some practical usefulness to their definition of an airline fare war.
Using their definition of airline fare wars, several stylized empirical facts emerge. More than 90 percent of airline price wars last one or two quarters only. Fare wars are continual in that at any moment of time there are at least some routes experiencing such wars. Typically fare wars are present on no more than 13 percent of routes (the average is 6-8 percent of the routes). These empirical facts, which emerge from
125

126 Brookings Papers: Microeconomics 1996
the Morrison-Winston study, were not understood or quantified previ- ously and thus are intellectually interesting.
Next, the authors address the causes of fare wars. One feature I found most provocative concerns the unpredictability of demand for travel. The authors argue that airlines must make their capacity deci- sions years in advance because of the time it takes to acquire new aircraft. They present a model in which they assume that all carriers forecast gross domestic product (GDP) based on a simple procedure in which they predict GDP m years in the future using actual GDP growth during the previous n years. The authors then calculate deviations from actual GDP based on this trend-projection structure. The deviations are shown to be highly cyclical, involving periodic overpredictions and underpredictions of economic growth. These deviations seem to support the stylized empirical fact that the industry periodically orders too many planes, so too much capacity later comes on stream.
The unpredictability of demand growth, when combined with the authors' model of the procedure describing how firms forecast such growth, does indeed increase the likelihood of fare wars. As one might have guessed, the correlation is strongest during periods of excess ca- pacity. Although the authors attribute this causation to an external economic effect, I think of it as involving not just fluctuation of de- mand, but also of firm behavior. By their parallel ordering behavior, firms are implicitly attempting not to lose market share. The result might be practically useful to the industry if some players recognize that overcapacity will result from their forecasting behavior and stra- tegically choose to stop the cycle.
Most stories about fare wars focus on interfirm rivalry. A carrier wants to initiate entry on a route it did not serve before and lowers price in an effort to get customers to shift to its planes. Or there may be multimarket contacts between large trunk carriers. Here, price wars on particular routes are undertaken to signal to another carrier, "if you lower the price on this route that is important to me, then I will lower the price on some other route that is important to you. " Evidence from computer reservation systems presented in antitrust cases abounds with examples of such price signaling behavior. So it is intellectually inter- esting to see the empirical evidence compiled by the authors linking price war behavior to carrier size. They find that the presence of large trunk carriers, such as American, United, and Delta, tends to discourage

Steven A. Morrison and Clifford Winston 127
(weakly) fare wars on routes that they serve. Conversely, the entry by smaller carriers, such as Southwest, Alaska, and AmericaWest, tends to encourage fare wars. These carriers often have lower costs, and fare wars are a tactic they can use to fend off larger carriers or to increase market share.
Another interesting result dealing with causation concerns the use of fare wars to encourage exit. Morrison and Winston find that fare wars have had only a small effect on the number of carriers in a market. Moreover, the time trend shows that the likelihood of a fare war has risen over time, all else constant. So the degree of collusive ability to either cause exit or to keep air fares at a high average level is not as strong as one might fear given the consolidation that has taken place during the past two decades in the airline industry. Instead, the lowering of equilibrium prices in the industry is continuing. Deregulation is working at the route level to lower prices even in the face of significant concentration of air carriers at the national level.
Finally, does the paper offer insight into the future pattern of airline fare wars? To firms, it appears that many of their efforts to maintain oligopoly behavior, free of fare wars, are at best only weakly successful and often are failures. An airline seat has too many of the features of a commodity product. The industry has too many diverse players with heterogeneous incentives. The hope that the industry will soon shake out seems to go unrealized. A major initiative by American Airlines to simplify industry pricing structures caused further fare wars rather than price structure matches. To policymakers, the authors are quite con- vincing that the particular nature of imperfect competition in this in- dustry most likely involves continuing price wars. Overall, lower prices will not be evenly spread across all markets and will not occur in many markets across all periods of time. Thus, while the views of what constitutes imperfections in competition differ between policymakers and industry, both groups agree that competition is indeed imperfect and that fare wars will continue as a reflection of this imperfection. Both also agree that these imperfections are preferable to the imperfec- tions imposed by rate and route regulation.
Comment by Dennis W. Carlton: This paper provides a significant contribution to our understanding of the forces responsible for airline fare wars. The paper relies on the contributions of oligopoly theory to

128 Brookings Papers: Microeconomics 1996
identify the important economic forces and, after estimating a probit model for predicting fare wars, calculates the reduction in industry profits from fare wars. The paper presents a thorough, careful, and thought-provoking analysis. In this comment I raise three issues. First, are there any structural features of the airline industry that make it peculiarly susceptible to unstable behavior such as fare wars? Second, are the empirical facts of the airline industry consistent with the oli- gopoly theories used? Third, is the counterfactual profit experiment informative beyond being a summary of the probit coefficients?
Instability in the Airline Industry
The paper treats fare wars as the result of a breakdown of a collusive price agreement in an oligopolistic industry. Without the oligopolistic structure, we should apparently expect reasonably stable price behav- ior. Although that may be the correct textbook prediction in many industries, I am not certain it is correct for all industries. That is, I am not certain that the common perception is correct that airline fare wars are an unusual phenomenon especially when compared with what are considered to be competitive industries. Often when one looks at these competitive industries, the amount of turbulence at the micro level is enormous. (Two examples are price studies that show a lot of large price changes in "stable times, " and entry studies that show large gross entry and exit rates for "stable" industries.) This turbulence raises the question whether the empirical phenomenon of price wars is particularly unique to airlines or whether it is a common one prevalent in both oligopolistic and nonoligopolistic market structures. Is figure 2 signif- icantly different for the airline industry than for other industries? Know- ing the answer to that question would help put the contribution of this paper in better perspective.
Some have argued that several industries, such as airlines, are plagued with instability. In these industries a core does not exist for structural reasons, and any price equilibrium breaks down. In these theories it is not the breakdown of collusion that causes fare wars, but rather the distinguishing structural features of these industries. Those features in the airline industry include uncertain demand, short-run fixed capacity, and the effect that both the level and the variance of demand have on a firm's cost of operation. Both the level and variance

Steven A. Morrison and Clifford Winston 129
of demand can be affected by rivals, and demand on one route can be affected by supply and demand elsewhere in the network. All these features distinguish airlines from simple textbook models of either com- petitive or collusive industries. Some or all of these features also apply to other transport systems, such as railroads, less-than-truckload ser- vice, and ocean shipping, and to some nontransport systems. Several articles analyzing the instability in many of these industries have been published.' It would help my understanding of this paper's empirical results to know how these key underlying structural characteristics af- fect the observed fare wars. For example,, how do airlines with more developed networks behave compared with those that rely on less feeder traffic? Is it the theory of the core or the theory of oligopoly that is driving the results? I suspect both.
Oligopoly Theory and Specific Quantitative Results
The authors use the many variants of oligopoly theory to focus their empirical analysis. In fact, as they recognize, many of the oligopoly models are based on an information setting much different from that of the airline industry. Airlines learn of their rivals' fares and capacity decisions immediately and may have good information on load factors. There is not much room here for theories based on secret fare discounts. Information flows in the airline industry have gotten much better during the past twenty years with widespread information sharing through computer networks. It is interesting that this improved information sharing seems not to have affected the frequency of price wars.
The authors find that the presence of more competitors raises the likelihood of a price war, although with even one firm, fare wars seem to occur (see footnote 40 of the paper). With only one firm, it seems to me that any price "wars" have little to do with oligopoly theory, unless the influence of potential competition is large. I would like to learn more about why the authors think "price wars" appear with only one firm. If oligopoly theory is used to explain fare wars, should an alter- native econometric specification be used wherein the number of firms interacts with all the other variables so that when there is only one firm, the oligopoly theory is "turned off"?
1. See Lester G. Telser, "Competition and the Core. " Journal of Political Economy 104 (February 1996), pp. 85-107, for a good review of both the theory and recent applications.

130 Brookings Papers. Microeconomics 1996
I have a few specific comments on the empirical results and model- ing. First, the uncertainty in gross domestic product is surely less im- portant in any theory of oligopoly than the demand uncertainty on individual routes in explaining fare wars on individual routes. Can measures of route-specific uncertainty be created? Moreover, the au- thors should analyze whether fare wars that are route specific should be modeled differently from fare wars that occur across the entire route network.
Second, I would model the effect of number of competitors differ- ently. Not only would I use an interactive specification as described above, but I would estimate separately the effect of a single firm and then estimate a nonlinear effect of additional competitors. I would focus on determining whether the incremental effect of additional competitors on the likelihood of fare wars ever vanishes. In other words, is there an equilibrium value for the probability of a fare war as the number of competitors increases? Finally, the reader must be wary of using the paper's results on fare wars to predict the overall changes in exogenous variables on the industry because fare levels and duration of fare wars may also change in response to changes in exogenous variables.
Counterfactual Experiment
I am not sure I appreciate the contribution of the paper' s counterfac- tual experiment measuring the financial effect of fare wars. If the ex- periment is used as a way to present the probit coefficients and illustrate the magnitude of those coefficients, then fine. But if it is to assess how the removal of fare wars could raise industry profitability, then I do not feel that the counterfactual poses a relevant-thought experiment because it fails to postulate an achievable alternative state of the world.
Suppose, as the authors suggest, that the airlines are in some sort of collusive oligopoly equilibrium with breakdowns occasionally leading to fare wars. How does the counterfactual experiment alter exogenous structural characteristics to eliminate the probability of a fare war? The counterfactual seems to hold constant all exogenous variables affecting fare wars. If, for example, a law were enacted preventing fare wars, it is not at all clear to me that other important equilibrium variables such as the number of competitors or the average fare would not also change. Instead of having infrequent fare wars, there may be more competitors

Steven A. Morrison and Clifford Winston 131
or persistently lower fares. Any financial gain from the removal of fare wars could be offset by the additional entry or by the decline in average fares. It is not a relevant-thought experiment to eliminate fare wars and to hold all else constant if entry and fare wars are part of the equilibrium oligopoly outcome. Therefore I do not ascribe much empirical relevance to the observation that elimination of fare wars would greatly improve industry financial performance.
I conclude by complimenting the authors on adding a thoughtful and thorough contribution to their impressive research on the airline industry.
Authors' Response: Dennis Carlton raises the question why price wars appear on routes with only one firm. Our findings, however, are based on fare wars that occur on routes with more than one carrier. Carlton also suggests that any profit gains from eliminating fare wars could be offset by a decline in average fares. We argue in the paper that this is not clear, because fare wars do not appear to affect the most important influences on average fares and because fare wars have distinctive ef- fects that would be hard to duplicate. We believe that the appropriate thought experiment is to assume carriers exercise much greater "dis- cipline" in capacity expansion and pricing decisions and not, as Carlton suggests, to assume a law is passed to prevent fare wars. Airline ex- ecutives appear to be confident that the recent discipline in capacity expansion will endure.2 It will be interesting to see whether they are correct.
2. See Adam Bryant, "U.S. Airlines Finally Reach Cruising Speed," New Yor-k Times, October 20, 1996, p. 3-1, 3-10.
![[adj.] crowded, modern, best, fast, most, close, British, quick [n.] journey, ferry, taxi, terminal, station, airline, distance, hour, way, fare [adv.]](https://img.dokumen.tips/doc/110x75/56649e155503460f94afff3f/adj-crowded-modern-best-fast-most-close-british-quick-n-journey.jpg)


![[PPT]PowerPoint Presentation - CABI · Web viewKey Concepts Airline reservation system (ARS) Baggage handling system (BHS) Customer relationship system (CRS) Fare Quote System Flight](https://img.dokumen.tips/doc/110x75/5ad730157f8b9a32618bf59d/pptpowerpoint-presentation-cabi-viewkey-concepts-airline-reservation-system.jpg)