Embed Size (px)
Citation preview
Mathematical Statistics
Stockholm University
Cause-specific mortality forecasting for
the Scandinavian nations by using
Lee-Carter model
Hulya Goker
Examensarbete 2008:15

Postal address:Mathematical StatisticsDept. of MathematicsStockholm UniversitySE-106 91 StockholmSweden
Internet:http://www.math.su.se/matstat

Mathematical StatisticsStockholm UniversityExamensarbete 2008:15,http://www.math.su.se/matstat
Cause-specific mortality forecasting for the
Scandinavian nations by using Lee-Carter
model
Hulya Goker∗
November 2008
Abstract
Reliable forecasts of mortality are of importance for the pricing oflife annuities in life insurance industry. Most often, historical datesof mortality is used in order to forecast the future mortality. In thisstudy, we investigate how the Lee-Carter approach can be used toforecast mortality, by using cause-specific mortality experience of theperiod 1951-1980 for Scandinavian nations and compare the resultingprojections with the official projections 1981-2005. In order to assessthe performance of the cause-specific estimations we have applied theLee-Carter model to all-cause mortality data (the number of peoplewho have died regardless of cause) and thereafter we have comparedthe results with the Lee-Carter approach. The World Health Orga-nization publishes death rates by disease in specific countries. ICD(International Classification of Diseases) are used to classify diseases.The classifications of the causes of death are very detailed so we havechosen to collect the death causes into ten groups. Since Iceland hasa small population, we could only classify causes of death into fourgroups. Cancer together with diseases of heart and arteries is the mostcommon cause of death in Scandinavia. The reductions in the trendsfor these diseases are the major factor for the total mortality declinefrom about 1970. The result indicates that the cause-specific mortalityforecasts yield higher mortality in the future than the all-cause fore-casts. This is because the total mortality rates have decreasing ratesover time but some causes of death actually have increasing rates andthey will be forecast to increase over time by the Lee-Carter model.
∗Postal address: Mathematical Statistics, Stockholm University, SE-106 91, Sweden.E-mail: [email protected]. Supervisor: Ake Svensson.

4
Foreword
This report is a 30 credits thesis in mathematical statistics and has been performed at the Swedish office of Hannover Life Re, which is one of the leading reinsurance groups in the world. First of all, I want to express my gratitude to Hannover Re and my supervisor Erik Alm, General Manager, for accepting me to carry out my Master’s Thesis with them. Erik patiently guided me during the entire project of writing my thesis, took the time to answer all my questions and inspired me with great ideas. It was extremely enjoyable to work with him and take advantage of his knowledge. I would also like to state here that carrying out this Master’s Thesis at Hannover Re has allowed me discovering a new culture, growing as a person and seeing the insurance branch from a different perspective. Finally, I would also like to thank my supervisor, Åke Svensson, Professor of Mathematical Statistics at Stockholm University, for supporting me in completing my thesis. 2008 Hülya Göker

5
Contents 1. Introduction .................................................................................................................................7
2. Model and Data............................................................................................................................8
2.1 International Classification of Diseases (ICD) ......................................................................8
2.2 The Lee-Carter Model .........................................................................................................10
3. Application of the Lee-Carter model ........................................................................................11
3.1 Estimations of the parameters.............................................................................................11
3.2 Figures of the parameters ....................................................................................................14
3.2.1: Figures of the xa values for males. ..............................................................................14
3.2.2: Figures of the xa values for females. ...........................................................................15
3.2.3: Figures of the estimated xb values for males ..............................................................16
3.2.4: Figures of the estimated xb values for females ...........................................................18
3.2.5: Figures of the estimated tk values for males. .............................................................19
3.2.6 Figures of the estimated tk values for females. ...........................................................20
3.3 Graphical Presentations of the trends and forecasts of mortality causes for Scandinavian
males...........................................................................................................................................21
3.3.1 Infections & Males ........................................................................................................22
3.3.2 Neoplasm & Males ........................................................................................................24
3.3.3Nervous system & Male .................................................................................................25
3.3.4 Heart and arteries & Males ..........................................................................................26
3.3.5 Respiratory diseases & Males .......................................................................................28
3.3.6 Digestive systems & Males ............................................................................................29
3.3.7 Urinary systems & Males..............................................................................................30
3.3.8 Accidental causes & Males............................................................................................31
3.3.9 Suicide & Males.............................................................................................................32
3.3.10 The other diseases & Males.........................................................................................34
3.4 Graphical Presentations of the trends and forecasts of mortality causes for Scandinavian
females........................................................................................................................................35
3.4.1 Infections & Females.....................................................................................................35
3.4.2 Neoplasm & Females.....................................................................................................36
3.4.3 Nervous systems & Females..........................................................................................38
3.4.4 Heart and arteries & Females.......................................................................................39

6
3.4.5 Respiratory diseases & Females ...................................................................................40
3.4.6 Digestive systems & Females.........................................................................................41
3.4.7 Urinary systems & Females ..........................................................................................42
3.4.8 Accidental causes & Females ........................................................................................44
3.4.9 Suicide & Females .........................................................................................................45
3.4.10 The other diseases & Females .....................................................................................46
4. Comparison of the results between Lee-Carter applications to all-causes mortality data and
cause-specific mortality data .........................................................................................................48
4.1 Sweden..................................................................................................................................48
4.2 Norway .................................................................................................................................50
4.3 Denmark...............................................................................................................................51
4.5 Iceland ..................................................................................................................................53
5. Sum of squares of residuals per age and per year ....................................................................54
5.1 Graphical Representation of the Lee-Carter Residual Term for males.............................54
5.2 Graphical Representation of the Lee-Carter Residual Term for females..........................56
6. Discussion and conclusions........................................................................................................59
7. References ..................................................................................................................................61

7
1. Introduction
Mortality rates have been decreased in many industrialised countries for several years. Knowledge of the future trends in mortality is of interest in the context of population forecasting, on which economic, social and health planning is based. For insurers, mortality reduction present risks if they do not take into considerations the changes in trends. To face this risk, it is necessary to project the mortality with good precision. Lee-Carter (Ronald D. and Lawrence R. Carter; 1992 ) is an extrapolative method for modelling and forecasting mortality, based on the analysis of long term trends. The important feature of the Lee-Carter model is that it is driven by a single time-varying parameter, namely, the mortality index. The mortality forecast relies on the extrapolation of this index under an appropriate statistical linear time-series model. The Lee-Carter model has been applied to data for the US, giving results that were significantly better than official US forecasts. The model has become a leading statistical model of mortality forecasting in the demographic literature and is now being applied to all-causes and cause-specific mortality data (The Lee-Carter method for forecasting mortality, with various extensions and applications; Ronald Lee; 2003) In this study, a comparative analysis of trends in different causes of mortality in the Scandinavian nations is performed. Because of the small size of the death numbers it was not possible to analyze the trend for each cause of death. Therefore, we have chosen to collect the mortality causes into ten groups for Sweden, Norway, Denmark and Finland and into three groups for Iceland. In the first application we have used the Lee-Carter model for each mortality cause separately and then we have added the estimated and projected cause-specific mortality rates for each age-group. Finally we have applied the Lee-Carter to all-cause mortality rates for respective countries in order to assess the performances of both applications. The use of residual plots is used to aid the assessment of the goodness of fit. We describe the forecasting model and the data in section two. In section three we present how the trends for different mortality causes have changed and how good our estimates are for each country in Scandinavia. The comparison of the fits and forecasts from both of the Lee-Carter applications is carried out in section four, residuals are shown in section five and finally the discussion and conclusion of our study is found in section six.

8
2. Model and Data
2.1 International Classification of Diseases (ICD)
The mortality data used in this study is taken from the World Health Organization (www.who.int) web site. It comprises deaths registered in national vital registration systems, with underlying cause of death as coded by the relevant national authority. WHO is the directing and coordinating authority for health within the United Nations system. Data is included only for countries reporting data properly coded according to the International Classification of Diseases (ICD). The first edition of ICD, known as the International List of Causes of Death, was adopted by the International Statistical Institute in 1893. WHO took over the responsibility for the ICD at its creation in 1948. The ICD has become the international standard diagnostic classification for all general epidemiological and many health management purposes. The database contains number of deaths by country, year, sex, age group and cause of death as far back as 1950. As we mentioned earlier, we will apply the Lee-Carter method to the cause-specific mortality data 1951-1980 for females and males separately, in order to obtain forecasts of mortality for use in projecting the elderly population, and to compare the resulting projections with the official projections 1981-2004. For Finland we use data from 1952 since they did not start reporting data from 1951. In the table below, we show the periods for ICD-code classifications in the Scandinavian nations:
Table 2.1.1 Using the ICD-code classifications in Scandinavia
Country Country code
ICD-7 ICD-8 ICD-9 ICD-10
Sweden 4290 1951-1968 1969-1986 1987-1996 1997-2004 Norway 4220 1951-1968 1969-1985 1986-1995 1996-2004 Denmark 4050 1951-1968 1969-1993 - 1994-2001 Finland 4070 1952-1968 1969-1986 1987-1995 1996-2004 Iceland 4160 1951-1970 1971-1980 1981-1995 1996-2004
The small size of the number of deaths does not give us the possibility to examine the trends in each and every type of death causes. Therefore, in this work we have chosen to collect death causes under nine central groups as presented in the table below. The rest of the death causes we have grouped under the “Other death causes”. Groups of causes of death that we have studied in this paper (observe that the diseases are written in order of abundance i.e. Diseases of Heart and arteries are the most common causes of death):

9
Table 2.1.2 ICD classifications of diseases
Diseases
ICD-7 ICD-8 ICD-9 ICD-10
Heart and arteries
A070,A079-86 A080-88 B25-30 I00-I99,I00-I09,-I99, F01
Malignant neoplasm
A044-60 A045-61 B08-17 C00-D48
Accidental causes
A138-147,149 A138-146,149 B47-53,B56 V01-X59, X85-Y349,Y831-
Respiratory system
A087-97 A089-96 B31-32 J00-J98
Digestive system
A099-107 A098-104 B34 K11-K92
Genito-urinary system
A108-114 A105-111 B35-37 N00-N98
Infective and parasitic
A001-43 A001-44 B01-07, B184-185
A00-B99
Suicide and self-inflicted injury
A148 A147 B54 X60-X84
Nervous system
A067-69,71-73,78
A069-74,79 B21-22 F03-F99,G00-G98
Other death causes
Other Other Other Other
Diseases that we have collected under the “Other death causes” are:
Endocrine, metabolic, and blood diseases, diseases of teeth and supporting structures, skin and musculoskeletal system, congenital malformations, diseases of early infancy, peculiar to early infancy and immaturity unqualified, senility without mention of psychosis, defined and unknown causes of morbidity and mortality, injury resulting from operations of war. We note here that “homicide injury purposely inflicted by other persons” has been treated under the “Accidental causes”. The information about the historical population size for each country could be found in the Human Mortality Database (www.mortality.org). All data files on The World Health Organization site are organized by sex, age, cause of death and time. The cause-specific data is given for five-year age groups, 0, 1, 2, 3, 4, 5-9, 10-14, …, 80-84, 85+. In order to get sufficiently large data in each individual cell, we have chosen to use the data for ten-year age groups. All ranges of age and time describe inclusive sets of one-year intervals. For example, the age group 10-14 extends from exact age 10 up to (but not including) exact age 15, and the time period designated by 1980 begins at the first moment of January 1, 1980, and ends at the last moment of December 31, 1980.

10
Some of the diseases do not occur so often at young people and then the dates contain some zero values. We therefore used a moving average formula:
)*2*3*2(*9994.0
2112 ++−− ++++= xxxxxx AAAAAB , with special conditions:
00 AB =
11 AB =
)*2(*31
322 AAB +=
)*2(*4
14323 AAAB ++=
The factor 0,994 is chosen since mortality is normally an exponential function of the age, which creates a minor upward bias when we use a straight linear moving average formula. If we assume that actual mortality xx QQ *%1101 =+ our formula would, without the correction, give the fallowing
estimation of xQ (assuming xA is a good estimator of xQ ):
xx
xxx
xx
AAAAA
*006.1*)134.0244.0333.0202.0092.0(
)*21.1*1.1*2*31.1
*2
21.1(*
91
=++++=
=++++
2.2 The Lee-Carter Model
The Lee-Carter model expresses the logarithms of death rates at any given age and time.
xttxxxt kbam ε++=)ln( t = 1, 2, ..., T, x =1, 2, ...n Where
xm : The central rate of death at age x in year t
tk : is an index describing the general level of mortality at different times
xa : is a set of age-specific constants describing the general pattern of mortality at different ages
xb : describes the way mortality varies at the age x as a reaction to the change of the general level of mortality
xtε : The residual term at age x and time t.
The time-related parameter (tk ) can be extrapolated into the future and used to derive projections of
future mortality. Constraints are imposed to obtain a unique solution:
tx
tx
xtE
Dm
,
,=
Where
txD , : The number of deaths between ages x and 1+x in year t
txE , : The number of exposures-to-risk ages x and 1+x in year t

11
For detailed interpretations of the above notation, we refer readers to Page 32 of methods protocol for the Human Mortality Database. The xa is calculated as the average of )ln( xtm over time,
)ln(1∑=
t
xtx mT
a
In the original Lee-Carter paper, the sums of xb and tk are normalized to unity and zero, respectively and the singular value decomposition (SVD) method is used to estimate the model parameters xb and tk .
1=∑x
xb 0=∑t
tk
3. Application of the Lee-Carter model
3.1 Estimations of the parameters
The parameters to be estimated in the model are xa , xb and tk . Once we estimate the parameters that
are depending on age, i.e. xa , xb , they stay constant and invariant through time. Hence, when we
know k , we can use the parameters for any year of interest. The mortality forecast relies on the extrapolation of this index. In this study, instead of using the central rate of death xtm , we use
idcxtq )( the probability of dying of
the death cause i (idc ) in any one year t at age x :
( )tx
dctx
dcxtP
Dq i
i
,
, )(=
Where
idctxD )( , : The number of deaths of the death cause i for age-group x in year t
txP , : Population size for age-group x in year t
We rewrite the model as:
txxtxdcxt bkaqi ,)log( ε++=
The set of age-specific constants xa is calculated as the average of )log( xtq over the whole period
∑=1980
1951
)log(30
1idcxtx qa
In this paper, we do not use the singular value decomposition (SVD) method to estimate the model parameters xb and tk . We have instead chosen to use an iteration method (von Bahr, Bengt (2006)) as we describe below.

12
The constraint 0=∑t
tk immediately implies that the parameter xa is simply the empirical average
over time of the age profile in age group x. We therefore rewrite the model in terms of the mean-centred log-mortality rate, xdctxtx aqr
i−= )log( ,, to approximate
tx kb .
Here 0, =∑t
txr x∀ , where 1951 ≤ t ≤ 1980
Now the model is:
xtxttx bkr ε+=,
We have chosen to normalize tk and xb according to conditions 12 =∑x
xb and 0=∑t
tk
In order to estimate tk and xb we define sum of squares of residuals as below:
Q= 2,
,
)( txx
tx
t rbk −∑
The method of Lagrange multipliers is a powerful tool finding maxima or minima of a function. We therefore introduce Lagrange multipliers α and β to minimize
∑∑ −−=x
x
t
t bkQR2
βα
The derivatives of R with respect to t and x are:
α−−= ∑ )(2 ,txxt
x
x
t
rbkbdk
dR t∀
xtxxt
t
t
x
brbkkdb
dRβ2)(2 , −−= ∑ x∀
We set the first derivatives equal to zero and get:
tx
x
x
x
xt rbbk ,
2
2 ∑∑ −=α
⇔ tx
x
xt rbk ,2 ∑−=α
We summarise both sides over t and get:
)(2 ,∑ ∑∑ −=
t x
txxt
t
rbkα
⇔ 0=α Because of 0, =∑t
txr and 0=∑t
tk
Thereafter we calculate the set of values of tk :
∑=x
xtxt rbk
We can check here that the condition is met:
0)( === ∑ ∑∑∑∑x t
xtx
t x
xtx
t
t rbrbk , since 0=∑t
xtr x∀
13
We now set the other derivatives equal to zero and get:
−∑
t
tx kb β2 = xt
t
t rk∑ x∀
We can easily see that the xb values are proportional to the sum in the right side. Because of the
condition 12 =∑x
xb we retype xb as below:
=
∑ ∑
∑
x t
xtt
t
xtt
x
rk
rk
b2
In order to make the calculations easier we set:
∑=t
txtx rkc ,
And we can now rewrite:
∑=
x
x
x
x
c
cb
2 x∀
We can set the initial values of n
bx
1)0( = for all x . Where n is number of the age groups.
The iterations continue as below:
∑ −=x
i
xxt
i
t brk )1()(
∑=t
i
txt
i
x krc)()(
∑
=
x
i
x
i
xi
x
c
cb
2)(
)()(
)(
Where i =1, 2, 3, … We iterate until we get that the absolute values of differences between iterations are less than 0.0001. After about ten iterations estimations of the parameters can be obtained with a high accuracy.

14
3.2 Figures of the parameters
3.2.1: Figures of the xa values for males.
Infections, Men
-6
-5
-4
-3
-2
-1
0
5-14y 15-24 25-34 35-44 45-54 55-64 65-74 75-84 85-
a(x
)
Sweden
Norway
Denmark
Finland
Neoplasms, Men
-6
-5
-4
-3
-2
-1
0
5-14y 15-24 25-34 35-44 45-54 55-64 65-74 75-84 85-
a(x
)SwedenNorwayDenmarkFinlandIceland
Nervous systems, Men
-5
-4,5
-4
-3,5
-3
-2,5
-2
5-14y 15-24 25-34 35-44 45-54 55-64 65-74 75-84 85-
a(x
)
Sweden
Norway
Denmark
Finland
Heart, Men
-6
-5
-4
-3
-2
-1
0
5-14y 15-24 25-34 35-44 45-54 55-64 65-74 75-84 85-
a(x
)
SwedenNorwayDenmarkFinlandIceland
Respiratory deases, Men
-6
-5
-4
-3
-2
-1
0
5-14y 15-24 25-34 35-44 45-54 55-64 65-74 75-84 85-
a(x
)
Sweden
Norway
Denmark
Finland
Digesive systems, Men
-6
-5
-4
-3
-2
-1
0
5-14y 15-24 25-34 35-44 45-54 55-64 65-74 75-84 85-
a(x
)
Sweden
Norway
Denmark
Finland
Accidental causes, Men
-6
-5
-4
-3
-2
-1
0
5-14y 15-24 25-34 35-44 45-54 55-64 65-74 75-84 85-
a(x
)
SwedenNorwayDenmarkFinlandIceland
Urinary systems, Men
-7
-6
-5
-4
-3
-2
-1
0
5-14y 15-24 25-34 35-44 45-54 55-64 65-74 75-84 85-
a(x
)
Sweden
Norway
Denmark
Finland
Suicide, Men
-6
-5,5
-5
-4,5
-4
-3,5
-3
-2,5
-2
5-14y 15-24 25-34 35-44 45-54 55-64 65-74 75-84 85-
a(x
)
Sweden
Norway
Denmark
Finland
The other diseases, Men
-6
-5
-4
-3
-2
-1
0
5-14y 15-24 25-34 35-44 45-54 55-64 65-74 75-84 85-
a(x
)
SwedenNorwayDenmarkFinlandIceland
Total, Men
-6
-5
-4
-3
-2
-1
0
5-14y 15-24 25-34 35-44 45-54 55-64 65-74 75-84 85-
a(x
)
SwedenNorwayDenmarkFinlandIceland
As seen in the graphs, the various causes of death by classification affect the age groups variously. Compared to other countries mortality by infectious diseases shows higher performance among Finnish males aged over 25 years. Heart disease is the leading cause of death and the mortality of heart diseases is also higher among middle aged Finnish males. Cancer is the second leading cause of death and the logarithmic increase is almost the same in all Scandinavian countries.

15
We note here that suicides almost never occurs in males at ages 5-9. On the other hand it can occur at ages 10-14. It could also be noted that the other diseases show higher values for Iceland since we have treated more diseases under the other diseases for this country. As we see in the graph which represents xa for all diseases, the number of various causes of mortality increases with age. Mortality of urinary systems and digestive systems are quite exceptional among young people but these diseases show a considerable increase with age. We observe also that the Scandinavian males over the age of 65 have a higher mortality risk from accidental causes.
3.2.2: Figures of the xa values for females.
Infections, Women
-5,5
-5
-4,5
-4
-3,5
-3
-2,5
-2
5-14y 15-24 25-34 35-44 45-54 55-64 65-74 75-84 85-
a(x
)
Sweden
Norway
Denmark
Finland
Neoplasms, Women
-6
-5
-4
-3
-2
-1
0
5-14y 15-24 25-34 35-44 45-54 55-64 65-74 75-84 85-
a(x
)
SwedenNorwayDenmarkFinlandIceland
Nervous systems, Women
-5
-4,5
-4
-3,5
-3
-2,5
-2
5-14y 15-24 25-34 35-44 45-54 55-64 65-74 75-84 85-
a(x
)
Sweden
NorwayDenmark
Finland
Heart, Women
-6
-5
-4
-3
-2
-1
0
5-14y 15-24 25-34 35-44 45-54 55-64 65-74 75-84 85-
a(x
)
SwedenNorwayDenmarkFinlandIceland
Respiratory diseases,Women
-6
-5
-4
-3
-2
-1
0
5-14y 15-24 25-34 35-44 45-54 55-64 65-74 75-84 85-
a(x
)
Sweden
Norway
Denmark
Finland
Digesive systems,Women
-6
-5,5
-5
-4,5
-4
-3,5
-3
-2,5
-2
-1,5
-1
5-14y 15-24 25-34 35-44 45-54 55-64 65-74 75-84 85-
a(x
)
SwedenNorwayDenmarkFinland
Urinary systems, Women
-6
-5,5
-5
-4,5
-4
-3,5
-3
-2,5
-2
-1,5
-1
5-14y 15-24 25-34 35-44 45-54 55-64 65-74 75-84 85-
a(x
)
Sweden
NorwayDenmark
FInland
Accidental causes, Women
-6
-5
-4
-3
-2
-1
0
5-14y 15-24 25-34 35-44 45-54 55-64 65-74 75-84 85-
a(x
)
SwedenNorwayDenmarkFinlandIceland
Suicide, Women
-7
-6
-5
-4
-3
-2
-1
0
5-14y 15-24 25-34 35-44 45-54 55-64 65-74 75-84 85-
a(x
)
SwedenNorwayDenmarkFinland
16
The other diseases, Women
-6
-5
-4
-3
-2
-1
0
5-14y 15-24 25-34 35-44 45-54 55-64 65-74 75-84 85-
a(x
)
SwedenNorwayDenmarkFinlandIceland
Total, Women
-6
-5
-4
-3
-2
-1
0
5-14y 15-24 25-34 35-44 45-54 55-64 65-74 75-84 85-
a(x
)
SwedenNorwayDenmarkFinlandIceland
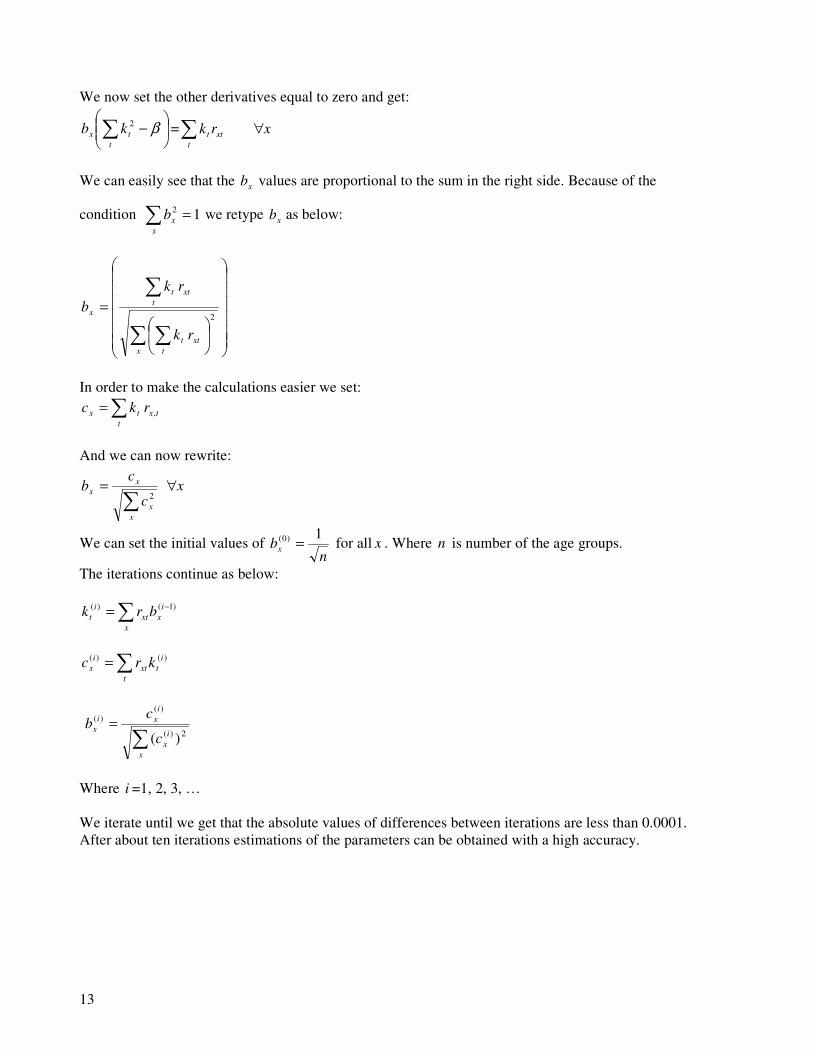
We see in the first graph that the mortality from infectious diseases is higher among Finnish females than the other Scandinavian females. Because of the small numbers of suicides, we could not estimate xa -values for the age groups 5-14
and 85- for Norway and Finland, 5-14 for Denmark. xa -values have been estimated for all age-groups for Sweden even the estimation was not so successfully for the age group 5-14. In general,
xa -curves for Finnish females differs a little more from the other curves. Some xa -curves
for mortality due to digestive system diseases, suicide and accidental causes for Norwegian females are lower than the curves for other Scandinavian females.
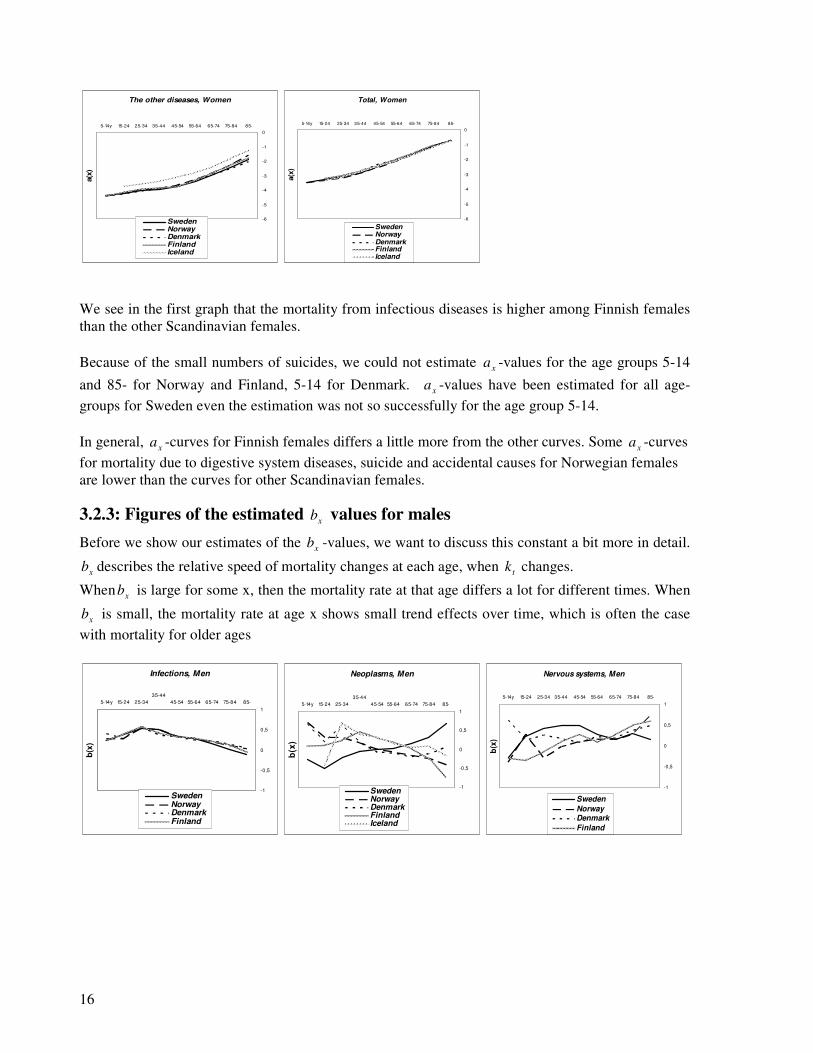
3.2.3: Figures of the estimated xb values for males
Before we show our estimates of the xb -values, we want to discuss this constant a bit more in detail.
xb describes the relative speed of mortality changes at each age, when tk changes.
When xb is large for some x, then the mortality rate at that age differs a lot for different times. When
xb is small, the mortality rate at age x shows small trend effects over time, which is often the case with mortality for older ages
Infections, Men
-1
-0,5
0
0,5
1
5-14y 15-24 25-34
35-44
45-54 55-64 65-74 75-84 85-
b(x
)
SwedenNorwayDenmarkFinland
Neoplasms, Men
-1
-0,5
0
0,5
1
5-14y 15-24 25-34
35-44
45-54 55-64 65-74 75-84 85-
b(x
)
SwedenNorwayDenmarkFinlandIceland
Nervous systems, Men
-1
-0,5
0
0,5
1
5-14y 15-24 25-34 35-44 45-54 55-64 65-74 75-84 85-
b(x
)
Sweden
NorwayDenmark
Finland

17
Heart, Men
-1
-0,5
0
0,5
1
5-14y 15-24 25-34 35-44 45-54 55-64 65-74 75-84 85-
b(x
)
SwedenNorwayDenmarkFinlandIceland
Urinary systems, Men
-1
-0,5
0
0,5
1
5-14y 15-24 25-34 35-44 45-54 55-64 65-74 75-84 85-
b(x
)
Sweden
Norway
Denmark
Finland
Accidental causes, Men
-1
-0,5
0
0,5
1
5-14y 15-24 25-34 35-44 45-54 55-64 65-74 75-84 85-
b(x
)
SwedenNorwayDenmarkFinlandIceland
Suicide, Men
-1
-0,5
0
0,5
1
5-14y 15-24 25-34 35-44 45-54 55-64 65-74 75-84 85-
b(x
)
SwedenNorwayDenmarkFinland
The other diseases, Men
-1
-0,5
0
0,5
1
5-14y 15-24 25-34 35-44 45-54 55-64 65-74 75-84 85-b
(x)
SwedenNorwayDenmarkFinlandIceland
Total, Men
-1
-0,5
0
0,5
1
5-14y 15-24 25-34 35-44 45-54 55-64 65-74 75-84 85-
b(x
)
SwedenNorwayDenmarkFinlandIceland
We can see that when xb is large for some x, then the mortality rate for related death cause at age x
varies much when the general level of mortality of this disease changes. The large values of xb from infectious diseases for males aged 25-45 indicate that mortality from infections diseases has changed a lot for this age group in different times. We see some negative values of xb in the other graph and we come to the conclusion that mortality rates for Cancer among elderly Norwegian and Finnish males has been stable over time. For middle aged Swedish males, xb -values for mortality from nervous system diseases are quite high which indicates that the mortality from nervous system diseases has had relatively big trend changes over time. Mortality caused by heart and arteries diseases has quite high
xb -values for younger males nevertheless the values are close to zero for elderly males. The xb curves for urinary systems diseases are quite stable for all countries. xb -values from
accidental causes for Swedish males deviate clearly from the others. According to xb -values for the total mortality, trend changes have been higher among Finnish males and mortality trends have changed much more for younger males than for older males.

18
3.2.4: Figures of the estimated xb values for females
Infections, Women
-1
-0,5
0
0,5
1
5-14y 15-24 25-34 35-44 45-54 55-64 65-74 75-84 85-
b(x
)
SwedenNorwayDenmarkFinland
Neoplasms, Women
-1
-0,5
0
0,5
1
5-14y 15-24 25-34 35-44 45-54 55-64 65-74 75-84 85-
b(x
)
SwedenNorwayDenmarkFinlandIceland
Nervous systems, Women
-1
-0,5
0
0,5
1
5-14y 15-24 25-34 35-44 45-54 55-64 65-74 75-84 85-
b(x
)
Sweden
Norway
Denmark
Finland
Heart, Women
-1
-0,5
0
0,5
1
5-14y 15-24 25-34 35-44 45-54 55-64 65-74 75-84 85-
b(x
)
SwedenNorwayDenmarkFinlandIceland
Respiratory diseases, Women
-1
-0,5
0
0,5
1
5-14y 15-24 25-34 35-44 45-54 55-64 65-74 75-84 85-
b(x
)
SwedenNorwayDenmarkFinland
Digesive systems, Women
-1
-0,5
0
0,5
1
5-14y 15-24 25-34 35-44 45-54 55-64 65-74 75-84 85-
b(x
)
Sweden
Norway
Denmark
Finland
Urinary systems, Women
-0,5
0
0,5
1
5-14y 15-24 25-34 35-44 45-54 55-64 65-74 75-84 85-
b(x
)
SwedenNorwayDenmarkFinland
Accidental causes, Women
-1
-0,5
0
0,5
1
5-14y 15-24 25-34 35-44 45-54 55-64 65-74 75-84 85-
b(x
)
SwedenNorwayDenmarkFinlandIceland
Suicide, Women
-1
-0,5
0
0,5
1
5-14y 15-24 25-34 35-44 45-54 55-64 65-74 75-84 85-
b(x
)
Sweden
Norway
Denmark
Finland
The other diseases, Women
-0,6
-0,4
-0,2
0
0,2
0,4
0,6
0,8
1
5-14y 15-24 25-34 35-44 45-54 55-64 65-74 75-84 85-
b(x
)
SwedenNorwayDenmarkFinlandIceland
Total, Women
-1
-0,5
0
0,5
1
5-14y 15-24 25-34 35-44 45-54 55-64 65-74 75-84 85-
b(x
)
SwedenNorwayDenmarkFinlandIceland
For Finnish females, xb -values for mortality caused by nervous system diseases deviate clearly from
the others i.e. xb -values are increasing in parallel with increasing age for Finnish females,
The xb -curves for the mortality caused by urinary system diseases, infections and digestive system diseases show quite similar development for females from every Scandinavian country.

19
We also observe that the xb -values for the other diseases for Danish females differ a lot from the
other. The xb -curves for mortality from all causes are more stable for females compared with males.
3.2.5: Figures of the estimated tk values for males.
As we have explained earlier, tk is an index describing the general level of mortality at different
times. tk captures the main trend in death rates at all ages and the mortality forecast relies on the extrapolation of this index.
Infections, Men
-2,5
-2
-1,5
-1
-0,5
0
0,5
1
1,5
2
2,5
3
k(t)
SwedenNorwayDenmarkFinland
Neoplasms, Men
-0,6
-0,4
-0,2
0
0,2
0,4
0,6k(t
)
SwedenNorwayDenmarkFinlandIceland
Nervous systems, Men
-0,8
-0,6
-0,4
-0,2
0
0,2
0,4
0,6
0,8
k(t
)
SwedenNorwayDenmarkFinland
Heart, Men
-0,6
-0,4
-0,2
0
0,2
0,4
0,6
k(t
)
SwedenNorwayDenmarkFinlandIceland
Respiratory diseases, Men
-1,5
-1
-0,5
0
0,5
1
k(t
)
SwedenNorwayDenmarkFinland
Digesive systems, Men
-0,1
0
0,1
0,2
0,3
0,4
k(t
)
SwedenNorwayDenmarkFinland
Urinary systems, Men
-2,5
-2
-1,5
-1
-0,5
0
0,5
1
1,5
k(t
)
SwedenNorwayDenmarkFinland
Accidental causes, Men
-1
-0,5
0
0,5
1
k(t
)
SwedenNorwayDenmarkFinlandIceland
Suicide, Men
-1
-0,5
0
0,5
1
k(t
)
SwedenNorwayDenmarkFinland
The other diseases, Men
-1
-0,5
0
0,5
1
1,5
k(t
)
SwedenNorwayDenmarkFinlandIceland
Total, Men
-0,5
0
0,5
k(t
)
SwedenNorwayDenmarkFinlandIceland

20
The graphs above show us that the mortality from infectious diseases was more common among Finnish males between1952-1970, although the mortality caused by infections has decreased for all Scandinavian males during the period. Except for Swedish males, tk -curves for mortality caused by neoplasm decrease for Scandinavian males. Apart from nervous system diseases and suicide, most causes of death have a decreasing tk -values. Although the tk -curves for Icelandic males are irregular one can nevertheless see that the curves do not differ so much from the other. We noted earlier that, the
xb -values for the other diseases for Danish people deviate a little more
from the xb -values for the other Scandinavian people. We observe here that the
tk -curves for Danish males are also different from the other curves.
3.2.6 Figures of the estimated tk values for females.
Infections, Women
-2
-1,5
-1
-0,5
0
0,5
1
1,5
2
2,5
3
k(t
)
SwedenNorwayDenmarkFinland
Neoplasms, Women
-0,5
-0,4
-0,3
-0,2
-0,1
0
0,1
0,2
0,3
0,4
0,5
k(t
)
SwedenNorwayDenmarkFinlandIceland
Nervous systems, Women
-1,5
-1
-0,5
0
0,5
1
k(t
)
SwedenNorwayDenmarkFinland
Heart, Women
-1
-0,8
-0,6
-0,4
-0,2
0
0,2
0,4
0,6
0,8
1
k(t
)
SwedenNorwayDenmarkFinlandIceland
Respiratory diseases, Women
-1
-0,8
-0,6
-0,4
-0,2
0
0,2
0,4
0,6
0,8
1
k(t
)
SwedenNorwayDenmarkFinland
Digesive systems, Women
-1,5
-1
-0,5
0
0,5
1
1,5
k(t
)
SwedenNorwayDenmarkFinland
Accidental causes, Women
-1,5
-1
-0,5
0
0,5
1
k(t
)
SwedenNorwayDenmarkFinlandIceland
Urinary systems, Women
-2
-1,5
-1
-0,5
0
0,5
1
1,5
k(t
)
SwedenNorwayDenmarkFinland
Suicide, Women
-1,5
-1
-0,5
0
0,5
1
k(t
)
SwedenNorwayDenmarkFinland
21
The other diseases, Women
-1
-0,5
0
0,5
1
1,5
k(t
)
SwedenNorwayDenmarkFinlandIceland
Total, Women
-0,8
-0,6
-0,4
-0,2
0
0,2
0,4
0,6
k(t
)
SwedenNorwayDenmarkFinlandIceland
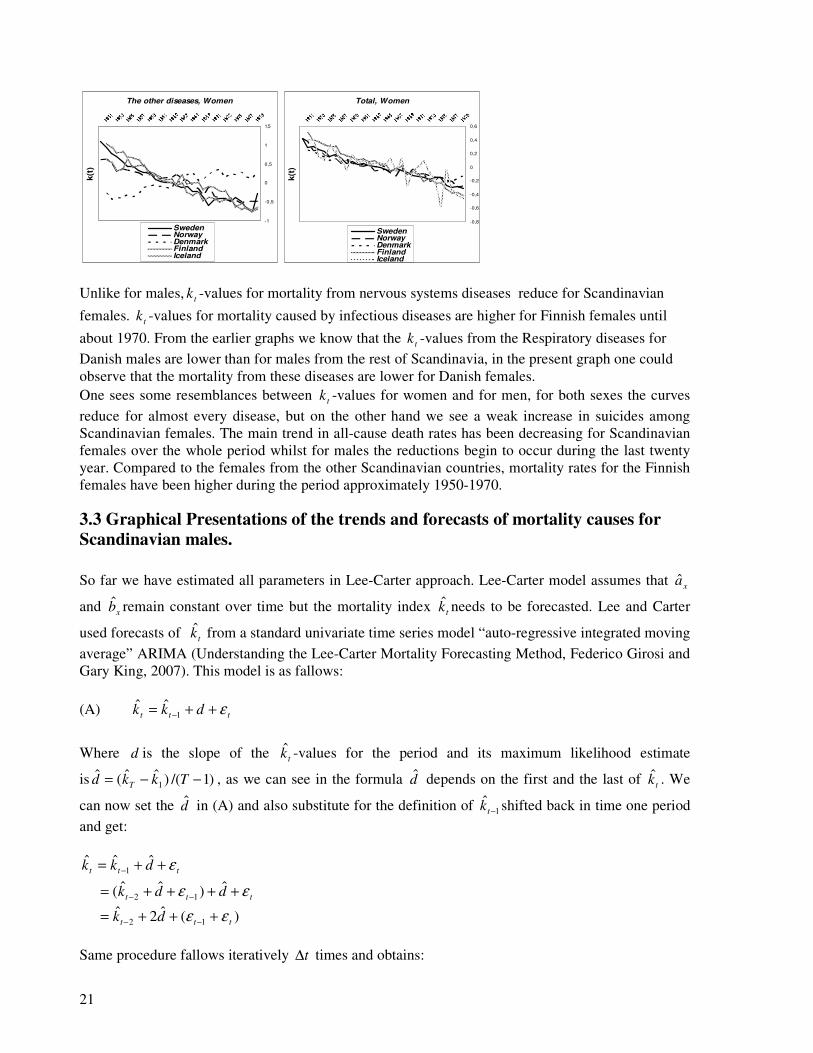
Unlike for males, tk -values for mortality from nervous systems diseases reduce for Scandinavian
females. tk -values for mortality caused by infectious diseases are higher for Finnish females until
about 1970. From the earlier graphs we know that the tk -values from the Respiratory diseases for Danish males are lower than for males from the rest of Scandinavia, in the present graph one could observe that the mortality from these diseases are lower for Danish females. One sees some resemblances between tk -values for women and for men, for both sexes the curves reduce for almost every disease, but on the other hand we see a weak increase in suicides among Scandinavian females. The main trend in all-cause death rates has been decreasing for Scandinavian females over the whole period whilst for males the reductions begin to occur during the last twenty year. Compared to the females from the other Scandinavian countries, mortality rates for the Finnish females have been higher during the period approximately 1950-1970.
3.3 Graphical Presentations of the trends and forecasts of mortality causes for
Scandinavian males.
So far we have estimated all parameters in Lee-Carter approach. Lee-Carter model assumes that xa
and xb remain constant over time but the mortality index tk needs to be forecasted. Lee and Carter
used forecasts of tk from a standard univariate time series model “auto-regressive integrated moving average” ARIMA (Understanding the Lee-Carter Mortality Forecasting Method, Federico Girosi and Gary King, 2007). This model is as fallows:
(A) ttt dkk ε++= −1ˆˆ
Where d is the slope of the tk -values for the period and its maximum likelihood estimate
is )1/()ˆˆ(ˆ1 −−= Tkkd T , as we can see in the formula d depends on the first and the last of tk . We
can now set the d in (A) and also substitute for the definition of 1ˆ
−tk shifted back in time one period and get:
ttt dkk ε++= −ˆˆˆ
1
ttt ddk εε ++++= −−ˆ)ˆˆ( 12
)(ˆ2ˆ12 ttt dk εε +++= −−
Same procedure fallows iteratively t∆ times and obtains:

22
∑∆
−+∆+ +∆+=t
l
lTTtT dtkk 1ˆˆˆ ε
tT tdtk ε∆+∆+= ˆˆ
We ignore the error term and forecast tk at time tT ∆+ :
dtkk TtTˆˆˆ ∆+=∆+
1
ˆˆˆ 1
−∆+= −
T
kktk T
T
Figure 3.3 Illustration of the fitted and forecasted mortality index
tk .
Sweden, females
-1
-0,8
-0,6
-0,4
-0,2
0
0,2
0,4
0,6
kt
In order to forecast future mortality rates, from the end of the calendar year 1980=T , we use the
predicted mortality index tTk ∆+ˆ as below:
txxtx kbam ++ +≈ 19801980, )log(
In the graphs below, we show the fitted and forecasted mortality rates for different mortality causes. Please observe that our forecasted mortality rates have been represented by black solid lines.
3.3.1 Infections & Males
Diseases such as HIV/AIDS, malaria, Cholera, Diarrheal diseases and tuberculosis are some examples of infectious diseases.
Infections,Males,Sweden
-6,5
-6
-5,5
-5
-4,5
-4
-3,5
-3
-2,5
-2
1951
1955
1959
1963
1967
1971
1975
1979
1983
1987
1991
1995
1999
2003
35-44,actual 65-74,actual
85-,actual Estimated
Estimated Estimated
Infections,Males,Sweden
-6,5
-6
-5,5
-5
-4,5
-4
-3,5
-3
-2,5
-2
1951
1955
1959
1963
1967
1971
1975
1979
1983
1987
1991
1995
1999
2003
15-24,actual 45-54,actual
75-84,actual Estimated
Estimated Estimated
Infections,Males,Sweden
-7
-6,5
-6
-5,5
-5
-4,5
-4
-3,5
-3
-2,5
-2
1951
1956
1961
1966
1971
1976
1981
1986
1991
1996
2001
5-14,actual 25-34,actual
55-64,actual Estimated
Estimated Estimated

23
Infections, Male, Norway
-7
-6,5
-6
-5,5
-5
-4,5
-4
-3,5
-3
-2,5
-2
1951
1955
1959
1963
1967
1971
1975
1979
1983
1987
1991
1995
1999
2003
35-44,actual 65-74,actual
85-,actual Estimated
Estimated Estimated
Infections, Male, Norway
-6
-5,5
-5
-4,5
-4
-3,5
-3
-2,5
-2
1951
1955
1959
1963
1967
1971
1975
1979
1983
1987
1991
1995
1999
2003
15-24,actual 45-54,actual
75-84,actual Estimated
Estimated Estimated
Infections,Males,Norway
-7
-6,5
-6
-5,5
-5
-4,5
-4
-3,5
-3
-2,5
1951
1955
1959
1963
1967
1971
1975
1979
1983
1987
1991
1995
1999
2003
5-14,actual 25-34,actual
55-64,actual Estimated
Estimated Estimated
Infections,Males,Denmark
-6,5
-6
-5,5
-5
-4,5
-4
-3,5
-3
-2,5
-2
1952
1956
1960
1964
1968
1972
1976
1980
1984
1988
1992
1996
2000
2004
35-44,actual 65-74,actual
85-,actual Estimated
Estimated Estimated
Infections,Males,Denmark
-7
-6,5
-6
-5,5
-5
-4,5
-4
-3,5
-3
-2,5
-2
1952
1956
1960
1964
1968
1972
1976
1980
1984
1988
1992
1996
2000
2004
15-24,actual 45-54,actual
75-84,actual Estimated
Estimated Estimated
Infections,Males,Denmark
-8
-7,5
-7
-6,5
-6-5,5
-5
-4,5
-4-3,5
-3
-2,5
-2
1952
1956
1960
1964
1968
1972
1976
1980
1984
1988
1992
1996
2000
2004
5-14,actual 25-34m,actual
55-64,actual Estimated
Estimated Estimated
Infections,Males,Finland
-6,5
-6
-5,5
-5
-4,5
-4
-3,5
-3
-2,5
-2
1952
1956
1960
1964
1968
1972
1976
1980
1984
1988
1992
1996
2000
2004
35-44,actual 65-74,actual
85-,actual EstimatedEstimated Estimated
Infections,Males,Finland
-7
-6,5
-6
-5,5
-5
-4,5
-4
-3,5
-3
-2,5
-2
1952
1956
1960
1964
1968
1972
1976
1980
1984
1988
1992
1996
2000
2004
15-24,actual 45-54,actual
75-84,actual Estimated
Estimated Estimated
Infections,Males,Finland
-8-7,5-7-6,5-6-5,5-5-4,5-4-3,5-3-2,5-2
1952
1956
1960
1964
1968
1972
1976
1980
1984
1988
1992
1996
2000
2004
5-14,actual 25-34,actual
55-64,actual EstimatedEstimated Estimated
The trends for infectious diseases have begun to change from 1980s, especially for middle-aged Scandinavian males there were strongly increases in deaths due to infectious diseases. The Lee-Carter projections are quite good for elderly Swedish males but for the most age groups the projections from the model are lower than the observed trends.
24
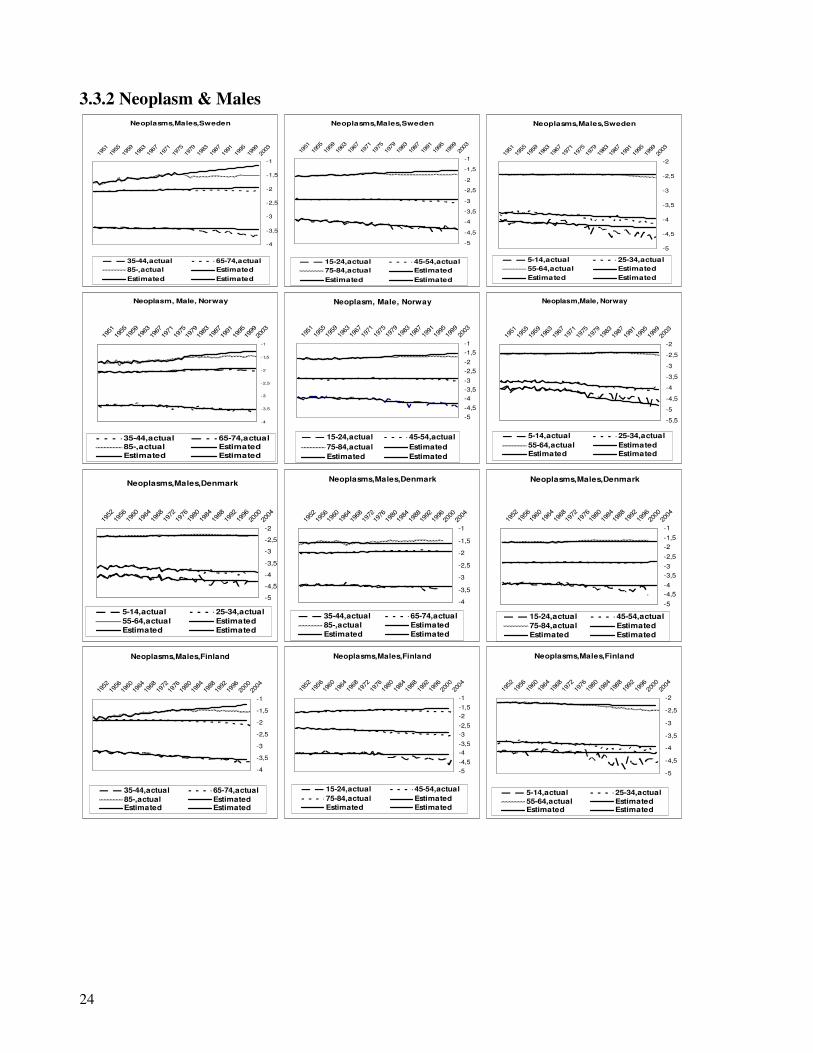
3.3.2 Neoplasm & Males
Neoplasms,Males,Sweden
-4
-3,5
-3
-2,5
-2
-1,5
-1
1951
1955
1959
1963
1967
1971
1975
1979
1983
1987
1991
1995
1999
2003
35-44,actual 65-74,actual
85-,actual Estimated
Estimated Estimated
Neoplasms,Males,Sweden
-5
-4,5
-4
-3,5
-3
-2,5
-2
-1,5
-1
1951
1955
1959
1963
1967
1971
1975
1979
1983
1987
1991
1995
1999
2003
15-24,actual 45-54,actual
75-84,actual Estimated
Estimated Estimated
Neoplasms,Males,Sweden
-5
-4,5
-4
-3,5
-3
-2,5
-2
1951
1955
1959
1963
1967
1971
1975
1979
1983
1987
1991
1995
1999
2003
5-14,actual 25-34,actual
55-64,actual Estimated
Estimated Estimated
Neoplasm, Male, Norway
-4
-3,5
-3
-2,5
-2
-1,5
-1
1951
1955
1959
1963
1967
1971
1975
1979
1983
1987
1991
1995
1999
2003
35-44,actual 65-74,actual
85-,actual Estimated
Estimated Estimated
Neoplasm, Male, Norway
-5
-4,5
-4
-3,5
-3
-2,5
-2
-1,5
-1
1951
1955
1959
1963
1967
1971
1975
1979
1983
1987
1991
1995
1999
2003
15-24,actual 45-54,actual
75-84,actual Estimated
Estimated Estimated
Neoplasm,Male, Norway
-5,5
-5
-4,5
-4
-3,5
-3
-2,5
-2
1951
1955
1959
1963
1967
1971
1975
1979
1983
1987
1991
1995
1999
2003
5-14,actual 25-34,actual
55-64,actual Estimated
Estimated Estimated
Neoplasms,Males,Denmark
-5
-4,5
-4
-3,5
-3
-2,5
-2
1952
1956
1960
1964
1968
1972
1976
1980
1984
1988
1992
1996
2000
2004
5-14,actual 25-34,actual
55-64,actual Estimated
Estimated Estimated
Neoplasms,Males,Denmark
-4
-3,5
-3
-2,5
-2
-1,5
-1
1952
1956
1960
1964
1968
1972
1976
1980
1984
1988
1992
1996
2000
2004
35-44,actual 65-74,actual
85-,actual Estimated
Estimated Estimated
Neoplasms,Males,Denmark
-5
-4,5
-4
-3,5
-3
-2,5
-2
-1,5
-1
1952
1956
1960
1964
1968
1972
1976
1980
1984
1988
1992
1996
2000
2004
15-24,actual 45-54,actual
75-84,actual Estimated
Estimated Estimated Neoplasms,Males,Finland
-4
-3,5
-3
-2,5
-2
-1,5
-1
1952
1956
1960
1964
1968
1972
1976
1980
1984
1988
1992
1996
2000
2004
35-44,actual 65-74,actual
85-,actual EstimatedEstimated Estimated
Neoplasms,Males,Finland
-5
-4,5
-4
-3,5
-3
-2,5
-2
-1,5
-1
1952
1956
1960
1964
1968
1972
1976
1980
1984
1988
1992
1996
2000
2004
15-24,actual 45-54,actual
75-84,actual Estimated
Estimated Estimated
Neoplasms,Males,Finland
-5
-4,5
-4
-3,5
-3
-2,5
-2
1952
1956
1960
1964
1968
1972
1976
1980
1984
1988
1992
1996
2000
2004
5-14,actual 25-34,actual
55-64,actual EstimatedEstimated Estimated

25
Neoplasms,Males,Iceland
-4,5
-4
-3,5
-3
-2,5
-2
-1,5
-1
1952
1956
1960
1964
1968
1972
1976
1980
1984
1988
1992
1996
2000
2004
35-44,actual 65-74,actual85-,actual EstimatedEstimated Estimated
Neoplasms,Males,Iceland
-5,5
-5
-4,5
-4
-3,5
-3
-2,5
-2
-1,5
-1
1952
1956
1960
1964
1968
1972
1976
1980
1984
1988
1992
1996
2000
2004
15-24,actual 45-54,actual75-84,actual EstimatedEstimated Estimated
Neoplasms,Males,Iceland
-5
-4,5
-4
-3,5
-3
-2,5
-2
1952
1956
1960
1964
1968
1972
1976
1980
1984
1988
1992
1996
2000
2004
25-34,actual 55-64,actual
Estimated Estimated
Cancer is the second most common cause of death in the Scandinavia, exceeded only by heart disease. Tobacco use and obesity are some of cancer risk factors. As seen in the present graphs, our estimates are a little bit higher than the actual mortality due to Cancer. The projections from the model seem to be better for younger males and also the reductions are clearer for these age groups. The Cancer mortality projections for Danish males are successfully for almost every age-group. For Finnish males the trend reductions are clearer and therefore the curves for the estimated mortality rates are higher than the curves for the actual mortality rates..
3.3.3Nervous system & Male
The nervous system is a complex, sophisticated system that regulates and coordinates body activities. It is made up of two major divisions, central nervous system - consisting of the brain and spinal cord and peripheral nervous system - consisting of all other neural elements. In addition to the brain and spinal cord, principal organs of the nervous system are: eyes, ears, sensory organs of taste and sensory organs of smell.
Nervous systems,Males,Sweden
-4,5
-4
-3,5
-3
-2,5
-2
-1,5
-1
1951
1955
1959
1963
1967
1971
1975
1979
1983
1987
1991
1995
1999
2003
35-44,actual 65-74,actual
85-,actual Estimated
Estimated Estimated
Nervous systems,Males,Sweden
-5
-4,5
-4
-3,5
-3
-2,5
-2
-1,5
-1
1951
1955
1959
1963
1967
1971
1975
1979
1983
1987
1991
1995
1999
2003
15-24,actual 45-54,actual
75-84,actual Estimated
Estimated Estimated
Nervous systems,Males,Sweden
-6
-5,5
-5
-4,5
-4
-3,5
-3
-2,5
-2
1951
1955
1959
1963
1967
1971
1975
1979
1983
1987
1991
1995
1999
2003
5-24,actual 25-34,actual
55-64,actual Estimated
Estimated Estimated
Nervous systems, Male, Norway
-4,5
-4
-3,5
-3
-2,5
-2
-1,5
-1
1951
1955
1959
1963
1967
1971
1975
1979
1983
1987
1991
1995
1999
2003
35-44,actual 65-74,actual
85-,actual Estimated
Estimated Estimated
Nervous systems, Male, Norway
-5
-4,5
-4
-3,5
-3
-2,5
-2
-1,5
1951
1955
1959
1963
1967
1971
1975
1979
1983
1987
1991
1995
1999
2003
15-24,actual 45-54,actual
75-84,actual Estimated
Estimated Estimated
Nervous systems,Male, norway
-5,5
-5
-4,5
-4
-3,5
-3
-2,5
1951
1955
1959
1963
1967
1971
1975
1979
1983
1987
1991
1995
1999
2003
5-14,actual 25-34,actual
55-64,actual Estimated
Estimated Estimated

26
Nervous systems,Males,Denmark
-5
-4,5
-4
-3,5
-3
-2,5
-2
-1,5
1952
1956
1960
1964
1968
1972
1976
1980
1984
1988
1992
1996
2000
2004
35-44,actual 65-74,actual
85-,actual Estimated
Estimated Estimated
Nervous systems,Males,Denmark
-5,5
-5
-4,5
-4
-3,5
-3
-2,5
-2
1952
1956
1960
1964
1968
1972
1976
1980
1984
1988
1992
1996
2000
2004
15-24,actual 45-54,actual
75-84,actual EstimatedEstimated Estimated
Nervous systems,Males,Denmark
-6
-5,5
-5
-4,5
-4
-3,5
-3
-2,5
-2
1952
1956
1960
1964
1968
1972
1976
1980
1984
1988
1992
1996
2000
2004
5-14,actual 25-34m,actual
55-64,actual Estimated
Estimated Estimated
Nervous systems,Males,Finland
-4,5
-4
-3,5
-3
-2,5
-2
-1,5
1952
1956
1960
1964
1968
1972
1976
1980
1984
1988
1992
1996
2000
2004
35-44,actual 65-74,actual
85-,actual EstimatedEstimated Estimated
Nervous systems,Males,Finland
-5
-4,5
-4
-3,5
-3
-2,5
-2
-1,5
1952
1956
1960
1964
1968
1972
1976
1980
1984
1988
1992
1996
2000
2004
15-24,actual 45-54,actual
75-84,actual Estimated
Estimated Estimated
Nervous systems,Males,Finland
-5,5
-5
-4,5
-4
-3,5
-3
1952
1956
1960
1964
1968
1972
1976
1980
1984
1988
1992
1996
2000
2004
5-14,actual 25-34,actual
55-64,actual EstimatedEstimated Estimated
Among Swedish males mortality from the nervous system diseases has increased for ages 65 and over, for the other age groups the trends seem to be either reducing or stable. The actual mortality from the nervous system diseases shows a drastic increasing in Norwegian males aged 25-34. When we have analyzed the ICD-10 classifications in detail for the Norwegian males we saw that the reason for increases was that the following mortality cause was very common among these age-group “F110-Mental and behavioural disorders due to use of opioids, acute intoxication”. We have also noticed that of some reason the F110 classification is lacking for the years 2003, 2004 and therefore the curve shows a strong decrease for these years. In general, mortality from diseases of nervous systems has increased over time especially in elderly males. In most cases the actual mortality rates are higher than the projected mortality rates however for middle aged Finnish males the Lee-Carter projects are quite good.
3.3.4 Heart and arteries & Males
Heart problems are the leading cause of death among people in Scandinavia. Some of the risk factors for heart diseases are cholesterol foods, smoking and obesity. People who are under a lot of stress have an increased risk of heart disease.
Heart and arteries,Males,Sweden
-4
-3,5
-3
-2,5
-2
-1,5
-1
-0,5
0
1951
1955
1959
1963
1967
1971
1975
1979
1983
1987
1991
1995
1999
2003
35-44,actual 65-74,actual
85-,actual Estimated
Estimated Estimated
Heart and arteries,Males,Sweden
-5
-4,5
-4
-3,5
-3
-2,5
-2
-1,5
-1
-0,5
1951
1955
1959
1963
1967
1971
1975
1979
1983
1987
1991
1995
1999
2003
15-24,actual 45-54,actual
75-84,actual Estimated
Estimated Estimated
Heart and arteries,Males,Sweden
-6
-5,5
-5
-4,5
-4
-3,5
-3
-2,5
-2
-1,5
1951
1955
1959
1963
1967
1971
1975
1979
1983
1987
1991
1995
1999
2003
5-14,actual 25-34,actual
55-64,actual Estimated
Estimated Estimated

27
Heart and Arteries, Male, Norway
-4
-3,5
-3
-2,5
-2
-1,5
-1
-0,5
0
1951
1955
1959
1963
1967
1971
1975
1979
1983
1987
1991
1995
1999
2003
35-44,actual 65-74,actual
85-,actual Estimated
Estimated Estimated
Heart and Arteries, Male, Norway
-5
-4,5
-4
-3,5
-3
-2,5
-2
-1,5
-1
-0,5
1951
1955
1959
1963
1967
1971
1975
1979
1983
1987
1991
1995
1999
2003
15-24,actual 45-54,actual
75-84,actual Estimated
Estimated Estimated
Heart and arteries,Male, norway
-6
-5,5
-5
-4,5
-4
-3,5
-3
-2,5
-2
-1,5
1951
1955
1959
1963
1967
1971
1975
1979
1983
1987
1991
1995
1999
2003
5-14,actual 25-34,actual
55-64,actual Estimated
Estimated Estimated
Heart and arteries,Males,Denmark
-4
-3,5
-3
-2,5
-2
-1,5
-1
-0,5
0
1952
1956
1960
1964
1968
1972
1976
1980
1984
1988
1992
1996
2000
35-44,actual 65-74,actual
85-,actual EstimatedEstimated Estimated
Heart and arteries,Males,Denmark
-5,5
-5
-4,5
-4
-3,5
-3
-2,5
-2
-1,5
-1
1952
1956
1960
1964
1968
1972
1976
1980
1984
1988
1992
1996
2000
15-24,actual 45-54,actual
75-84,actual EstimatedEstimated Estimated
Heart and arteries,Males,Denmark
-7-6,5-6-5,5-5-4,5-4-3,5-3-2,5-2-1,5-1
1952
1956
1960
1964
1968
1972
1976
1980
1984
1988
1992
1996
2000
5-14,actual 25-34,actual55-64,actual EstimatedEstimated Estimated
Heart and arteries,Males,Finland
-4
-3,5
-3
-2,5
-2
-1,5
-1
-0,5
1952
1956
1960
1964
1968
1972
1976
1980
1984
1988
1992
1996
2000
2004
35-44,actual 65-74,actual
85-,actual EstimatedEstimated Estimated
Heart and arteries,Males,Finland
-5,5
-5
-4,5
-4
-3,5
-3
-2,5
-2
-1,5
-1
-0,5
1952
1956
1960
1964
1968
1972
1976
1980
1984
1988
1992
1996
2000
2004
15-24,actual 45-54,actual75-84,actual EstimatedEstimated Estimated
Heart and arteries,Males,Finland
-6,5
-6-5,5
-5
-4,5-4
-3,5-3
-2,5
-2-1,5
-1
1952
1956
1960
1964
1968
1972
1976
1980
1984
1988
1992
1996
2000
2004
5-14,actual 25-34,actual
55-64,actual EstimatedEstimated Estimated
Heart and arteries,Males,Iceland
-4,5
-4
-3,5
-3
-2,5
-2
-1,5
-1
-0,5
0
1955
1959
1963
1967
1971
1975
1979
1983
1987
1991
1995
1999
2003
35-44,actual 65-74,actual85-,actual EstimatedEstimated Estimated
Heart and arteries,Males,Iceland
-6
-5
-4
-3
-2
-1
0
1955
1959
1963
1967
1971
1975
1979
1983
1987
1991
1995
1999
2003
15-24,actual 45-54,actual75-84,actual EstimatedEstimated Estimated
Heart and arteries,Males,Iceland
-6
-5
-4
-3
-2
-1
0
1955
1959
1963
1967
1971
1975
1979
1983
1987
1991
1995
1999
2003
25-34,actual 55-64,actual
Estimated Estimated
The graphs presented above show us that the mortality caused by heart diseases has decreased during the last 20 years. The changes can depend on that more people in Scandinavia have chosen to quit smoking cigarettes. As seen in the graphs that the Lee-Carter forecasts are quite successfully for the younger age-groups but for the elderly age groups the estimated mortality rates are higher than the observed mortality rates. Although Iceland has a small population one sees that the curves are quite regular and the forecasts are unexpected good for some Icelandic age-groups

28
3.3.5 Respiratory diseases & Males
Diseases of respiratory systems include diseases of the lung, pleural cavity, bronchial tubes, trachea, upper respiratory tract and of the nerves and muscles of breathing.
Respiratory diseases,Male,Sweden
-5,5
-5
-4,5
-4
-3,5
-3
-2,5
-2
-1,5
-1
1951
1955
1959
1963
1967
1971
1975
1979
1983
1987
1991
1995
1999
2003
35-44,actual 65-74,actual
85-,actual Estimated
Estimated Estimated
Respiratory diseases,Male,Sweden
-6
-5,5
-5
-4,5
-4
-3,5
-3
-2,5
-2
-1,5
-1
1951
1955
1959
1963
1967
1971
1975
1979
1983
1987
1991
1995
1999
2003
15-24,actual 45-54,actual
75-84,actual Estimated
Estimated Estimated
Respiratory diseases,Male,Sweden
-8
-7
-6
-5
-4
-3
-2
1951
1955
1959
1963
1967
1971
1975
1979
1983
1987
1991
1995
1999
2003
5-14,actual 25-34,actual
55-64,actual Estimated
Estimated Estimated
Respiratory diseases, Male, Norway
-5,5
-5
-4,5
-4
-3,5
-3
-2,5
-2
-1,5
-1
-0,5
0
1951
1955
1959
1963
1967
1971
1975
1979
1983
1987
1991
1995
1999
2003
35-44,actual 65-74,actual
85-,actual Estimated
Estimated Estimated
Respiratory diseases, Male, Norway
-6-5,5-5-4,5-4-3,5-3-2,5-2-1,5-1-0,5
1951
1955
1959
1963
1967
1971
1975
1979
1983
1987
1991
1995
1999
2003
15-24,actual 45-54,actual
75-84,actual Estimated
Estimated Estimated
Respiratory diseases,Male, norway
-6
-5,5
-5
-4,5
-4
-3,5
-3
-2,5
-2
-1,5
1951
1955
1959
1963
1967
1971
1975
1979
1983
1987
1991
1995
1999
2003
5-14,actual 25-34,actual
55-64,actual Estimated
Estimated Estimated
Respiratory diseases,Males,Denmark
-5
-4,5
-4
-3,5
-3
-2,5
-2
-1,5
-1
1952
1956
1960
1964
1968
1972
1976
1980
1984
1988
1992
1996
2000
2004
35-44,actual 65-74,actual
85-,actual EstimatedEstimated Estimated
Respiratory diseases,Males,Denmark
-6
-5,5
-5
-4,5
-4
-3,5
-3
-2,5
-2
-1,5
-1
1952
1956
1960
1964
1968
1972
1976
1980
1984
1988
1992
1996
2000
2004
15-24,actual 45-54,actual
75-84,actual Estimated
Estimated Estimated
Respiratory diseases,Males,Denmark
-7
-6,5
-6
-5,5
-5
-4,5
-4
-3,5
-3
-2,5
-2
1952
1956
1960
1964
1968
1972
1976
1980
1984
1988
1992
1996
2000
2004
5-14,actual 25-34,actual55-64,actual EstimatedEstimated Estimated
Respiratory diseases,Males,Finland
-5
-4,5
-4
-3,5
-3
-2,5
-2
-1,5
-1
-0,5
1952
1956
1960
1964
1968
1972
1976
1980
1984
1988
1992
1996
2000
2004
35-44,actual 65-74,actual85-,actual EstimatedEstimated Estimated
Respiratory diseases,Males,Finland
-6,5
-6
-5,5
-5
-4,5
-4
-3,5
-3
-2,5
-2
-1,5
1952
1956
1960
1964
1968
1972
1976
1980
1984
1988
1992
1996
2000
2004
15-24,actual 45-54,actual
75-84,actual Estimated
Estimated Estimated
Respiratory diseases,Males,Finland
-7
-6,5
-6
-5,5
-5
-4,5
-4
-3,5
-3
-2,5
-2
1952
1956
1960
1964
1968
1972
1976
1980
1984
1988
1992
1996
2000
2004
5-14,actual 25-34,actual
55-64,actual EstimatedEstimated Estimated
The Lee-Carter forecasts for mortality due to respiratory diseases for Swedish males look quite good. However one could see a little reduction in the trends for middle-aged Swedish males. In general, mortality from respiratory diseases decreases weakly for Scandinavian males.

29
3.3.6 Digestive systems & Males
The digestive system includes the mouth, stomach, intestines, liver, and pancreas.
Digestive systems,Males,Sweden
-5
-4,5
-4
-3,5
-3
-2,5
-2
-1,5
-1
1951
1955
1959
1963
1967
1971
1975
1979
1983
1987
1991
1995
1999
2003
35-44,actual 65-74,actual
85-,actual Estimated
Estimated Estimated
Digestive systems,Male,Sweden
-6,5
-6
-5,5
-5
-4,5
-4
-3,5
-3
-2,5
-2
1951
1955
1959
1963
1967
1971
1975
1979
1983
1987
1991
1995
1999
2003
15-45,actual 45-54,actual
75-84,actual EstimatedEstimated Estimated
Digestive systems,Male,Sweden
-7
-6,5
-6
-5,5
-5
-4,5
-4
-3,5
-3
-2,5
-2
1951
1955
1959
1963
1967
1971
1975
1979
1983
1987
1991
1995
1999
2003
5-14,actual 25-34,actual
55-64,actual EstimatedEstimated Estimated
Digestive systems, Male, Norway
-5
-4,5
-4
-3,5
-3
-2,5
-2
-1,5
-1
1951
1955
1959
1963
1967
1971
1975
1979
1983
1987
1991
1995
1999
2003
35-44,actual 65-74,actual
85-,actual Estimated
Estimated Estimated
Digestive systems, Male, Norway
-6,5-6-5,5-5-4,5-4-3,5-3-2,5-2-1,5
1951
1955
1959
1963
1967
1971
1975
1979
1983
1987
1991
1995
1999
2003
15-24,actual 45-54,actual
75-84,actual Estimated
Estimated Estimated
Digestive systems,Male, norway
-7,5
-7
-6,5
-6
-5,5
-5
-4,5
-4
-3,5
-3
-2,5
1951
1955
1959
1963
1967
1971
1975
1979
1983
1987
1991
1995
1999
2003
5-14,actual 25-34,actual
55-64,actual Estimated
Estimated Estimated
Digestive systems,Males,Denmark
-4,5
-4
-3,5
-3
-2,5
-2
-1,5
-1
1952
1956
1960
1964
1968
1972
1976
1980
1984
1988
1992
1996
2000
2004
35-44,actual 65-74,actual85-,actual EstimatedEstimated Estimated
Digestive systems,Males,Denmark
-6,5-6-5,5-5-4,5-4-3,5-3-2,5-2-1,5-1
1952
1956
1960
1964
1968
1972
1976
1980
1984
1988
1992
1996
2000
2004
15-24,actual 45-54,actual75-84,actual EstimatedEstimated Estimated
Digestive systems,Males,Denmark
-7
-6,5
-6
-5,5
-5
-4,5
-4
-3,5
-3
-2,5
-2
1952
1956
1960
1964
1968
1972
1976
1980
1984
1988
1992
1996
2000
2004
5-14,actual 25-34,actual55-64,actual EstimatedEstimated Estimated
Digestive systems,Males,Finland
-4,5
-4
-3,5
-3
-2,5
-2
-1,5
1952
1956
1960
1964
1968
1972
1976
1980
1984
1988
1992
1996
2000
2004
35-44,actual 65-74,actual85-,actual EstimatedEstimated Estimated
Digestive systems,Males,Finland
-6
-5,5
-5
-4,5
-4
-3,5
-3
-2,5
-2
1952
1956
1960
1964
1968
1972
1976
1980
1984
1988
1992
1996
2000
2004
15-24,actual 45-54,actual
75-84,actual EstimatedEstimated Estimated
Digestive systems,Males,Finland
-7
-6,5
-6
-5,5
-5
-4,5
-4
-3,5
-3
-2,5
-2
1952
1956
1960
1964
1968
1972
1976
1980
1984
1988
1992
1996
2000
2004
5-14,actual 25-34,actual
55-64,actual EstimatedEstimated Estimated
Lee-Carter forecasts for the mortality from digestive system diseases for Swedish males are higher than the actual mortality trends but on the other hand for Finnish males the actual mortality trends are higher than the expected. Our forecasts for the Norwegian males are quite good since the trends for these mortality causes have not changed so much during the last years. We notice also that, unlike for

30
other Scandinavian males, mortality caused by digestive system diseases increases for Danish males aged 35-44.
3.3.7 Urinary systems & Males
The urinary system (also called excretory system or the genitourinary system (GUS)) is the organ system that produces, stores, and eliminates urine. Urinary diseases are explored includes: urinary tract infections, incontinence, and bladder cancer.
Urinary systems,Male,Sweden
-6,5
-6
-5,5
-5
-4,5
-4
-3,5
-3
-2,5
-2
-1,5
1951
1955
1959
1963
1967
1971
1975
1979
1983
1987
1991
1995
1999
2003
35-44,actual 65-74,actual
85,actual Estimated
Estimated Estimated
Urinary systems,Males,Sweden
-7,5
-7-6,5
-6-5,5-5-4,5-4-3,5
-3-2,5-2
1951
1955
1959
1963
1967
1971
1975
1979
1983
1987
1991
1995
1999
2003
15-24,actual 45-54,actual
75-84,actual Estimated
Estimated Estimated
Urinary systems,Males,Sweden
-8,5
-8
-7,5
-7
-6,5
-6
-5,5
-5
-4,5
-4
-3,5
-3
1951
1955
1959
1963
1967
1971
1975
1979
1983
1987
1991
1995
1999
2003
5-24,actual 25-34,actual
55-64,actual Estimated
Estimated Estimated
Urinary systems, Male, Norway
-6,5
-6
-5,5
-5
-4,5
-4
-3,5
-3
-2,5
-2
-1,5
-1
1951
1955
1959
1963
1967
1971
1975
1979
1983
1987
1991
1995
1999
2003
35-44,actual 65-74,actual
85-,actual Estimated
Estimated Estimated
Urinary systems, Male, Norway
-6,5-6-5,5-5-4,5-4-3,5-3-2,5-2-1,5
1951
1955
1959
1963
1967
1971
1975
1979
1983
1987
1991
1995
1999
2003
15-24,actual 45-54,actual
75-84,actual Estimated
Estimated Estimated
Urinary systems,Male, norway
-7,5
-7
-6,5
-6
-5,5
-5
-4,5
-4
-3,5
-3
-2,5
1951
1955
1959
1963
1967
1971
1975
1979
1983
1987
1991
1995
1999
2003
5-14,actual 25-34,actual
55-64,actual Estimated
Estimated Estimated
Urinary systems,Males,Denmark
-6
-5,5
-5
-4,5
-4
-3,5
-3
-2,5
-2
-1,5
1952
1956
1960
1964
1968
1972
1976
1980
1984
1988
1992
1996
2000
35-44,actual 65-74,actual
85-,actual Estimated
Estimated Estimated
Urinary systems,Males,Denmark
-7
-6,5
-6
-5,5
-5
-4,5
-4
-3,5
-3
-2,5
-2
1952
1956
1960
1964
1968
1972
1976
1980
1984
1988
1992
1996
2000
15-24,actual 45-54,actual
75-84,actual Estimated
Estimated Estimated
Urinary systems,Males,Denmark
-7,5
-7
-6,5
-6
-5,5
-5
-4,5
-4
-3,5
-3
-2,5
-2
1952
1956
1960
1964
1968
1972
1976
1980
1984
1988
1992
1996
2000
2004
5-14,actual 25-34,actual55-64,actual EstimatedEstimated Estimated
Urinary systems,Males,Finland
-9-8,5-8-7,5-7-6,5-6-5,5-5-4,5-4-3,5-3-2,5-2
1952
1956
1960
1964
1968
1972
1976
1980
1984
1988
1992
1996
2000
2004
15-24,actual 45-54,actual
75-84,actual EstimatedEstimated Estimated
Urinary systems,Males,Finland
-6
-5,5
-5
-4,5
-4
-3,5
-3
-2,5
-2
-1,5
1952
1956
1960
1964
1968
1972
1976
1980
1984
1988
1992
1996
2000
2004
35-44,actual 65-74,actual
85-,actual EstimatedEstimated Estimated
Urinary systems,Males,Finland
-7,5-7-6,5-6-5,5-5-4,5-4-3,5-3-2,5-2-1,5-1-0,50
1952
1956
1960
1964
1968
1972
1976
1980
1984
1988
1992
1996
2000
2004
25-34,actual 55-64,actual
Estimated Estimated

31
Mortality from urinary system diseases is not so common among young people. Because of that the curves are quite irregular for males aged below 25. For elderly males mortality caused by urinary system has decreased slower than expected, because of that the forecasts are lower than the actual trends. Generally we see a reduction in the mortality trends of the urinary system diseases in whole Scandinavia.
3.3.8 Accidental causes & Males
Accidental deaths in this analysis include a broad array of causes ranging from vehicular accidents including railway, motor vehicle, boating, aircraft, accidental poisoning, fire, environmental extremes, suffocation, falls, and many others. Accidental causes are the third biggest cause of death in Scandinavia and a higher proportion of men than women die because of accidents.
Accidental causes,Males,Sweden
-4
-3,5
-3
-2,5
-2
-1,5
-1
-0,5
0
1951
1955
1959
1963
1967
1971
1975
1979
1983
1987
1991
1995
1999
2003
35-44,actual 65-74,actual
85-,actual Estimated
Estimated Estimated
Accidental causes,Males,Sweden
-3,8
-3,6
-3,4
-3,2
-3
-2,8
-2,6
-2,4
-2,2
-2
1951
1955
1959
1963
1967
1971
1975
1979
1983
1987
1991
1995
1999
2003
15-24,actual 45-54,actual
75-84,actual Estimated
Estimated Estimated
Accidental causes,Males,Sweden
-3,8
-3,6
-3,4
-3,2
-3
-2,8
-2,6
-2,4
-2,2
-2
1951
1955
1959
1963
1967
1971
1975
1979
1983
1987
1991
1995
1999
2003
15-24,actual 45-54,actual
75-84,actual Estimated
Estimated Estimated
Accidental causes, Male, Norway
-4
-3,5
-3
-2,5
-2
-1,5
-1
1951
1955
1959
1963
1967
1971
1975
1979
1983
1987
1991
1995
1999
2003
35-44,actual 65-74,actual
85-,actual Estimated
Estimated Estimated
Accidental causes, Male, Norway
-4
-3,6
-3,2
-2,8
-2,4
-2
-1,6
1951
1955
1959
1963
1967
1971
1975
1979
1983
1987
1991
1995
1999
2003
15-24,actual 45-54,actual
75-84,actual Estimated
Estimated Estimated
Accidental causes,Male, norway
-5
-4,5
-4
-3,5
-3
-2,5
1951
1955
1959
1963
1967
1971
1975
1979
1983
1987
1991
1995
1999
2003
5-14,actual 25-34,actual
55-64,actual Estimated
Estimated Estimated
Accidental causes,Males,Denmark
-4
-3,5
-3
-2,5
-2
-1,5
1952
1956
1960
1964
1968
1972
1976
1980
1984
1988
1992
1996
2000
2004
35-44,actual 65-74,actual
85-,actual Estimated
Estimated Estimated
Accidental causes,Males,Denmark
-4
-3,5
-3
-2,5
-2
1952
1956
1960
1964
1968
1972
1976
1980
1984
1988
1992
1996
2000
2004
15-24,actual 45-54,actual
75-84,actual Estimated
Estimated Estimated
Accidental causes,Males,Denmark
-4,5
-4
-3,5
-3
1952
1956
1960
1964
1968
1972
1976
1980
1984
1988
1992
1996
2000
2004
5-14,actual 25-34,actual55-64,actual EstimatedEstimated Estimated

32
Accidental causes,Males,Finland
-3,5
-3
-2,5
-2
-1,5
1952
1956
1960
1964
1968
1972
1976
1980
1984
1988
1992
1996
2000
2004
35-44,actual 65-74,actual
85-,actual EstimatedEstimated Estimated
Accidental causes,Males,Finland
-4
-3,5
-3
-2,5
-2
1952
1956
1960
1964
1968
1972
1976
1980
1984
1988
1992
1996
2000
2004
15-24,actual 45-54,actual
75-84,actual EstimatedEstimated Estimated
Accidental causes,Males,Finland
-4,5
-4
-3,5
-3
-2,5
-2
1952
1956
1960
1964
1968
1972
1976
1980
1984
1988
1992
1996
2000
2004
25-34,actual 55-64,actual
Estimated Estimated5-14,actual Estimated
Accidental causes,Males,Iceland
-4-3,8-3,6
-3,4-3,2-3-2,8-2,6
-2,4-2,2-2
1952
1956
1960
1964
1968
1972
1976
1980
1984
1988
1992
1996
2000
2004
35-44,actual 65-74,actual85-,actual EstimatedEstimated Estimated
Accidental causes,Males,Iceland
-4
-3,8
-3,6
-3,4
-3,2
-3
-2,8
-2,6
-2,4
1952
1956
1960
1964
1968
1972
1976
1980
1984
1988
1992
1996
2000
2004
15-24,actual 45-54,actual75-84,actual EstimatedEstimated Estimated
Accidental causes,Males,Iceland
-4
-3,7
-3,4
-3,1
-2,8
-2,5
1952
1956
1960
1964
1968
1972
1976
1980
1984
1988
1992
1996
2000
2004
25-34,actual 55-64,actual
Estimated Estimated The number of deaths due to accidents has decreased after about 1980 for Swedish males from all age groups and the observed mortality rates are lower than the Lee-Carter projections. The trends for Norwegian males are more stable compared with the trends for Swedish males but also for Norwegian males the actual number of accidents has reduced. For older Danish males the actual mortality from accidental causes has been higher than the expected. The Lee-Carter application to Finnish data gives relatively better forecasts compared to the other Scandinavian countries but the forecasts from the model to Icelandic data were not so successful because of the small population size. But we can nevertheless clearly see that the mortality from accidents has fallen among Icelandic males.
3.3.9 Suicide & Males
Suicide,Males,Sweden
-3,8
-3,5
-3,2
-2,9
1951
1955
1959
1963
1967
1971
1975
1979
1983
1987
1991
1995
1999
2003
35-44,actual 65-74,actual
85-,actual Estimated
Estimated Estimated
Suicide,Males,Sweden
-4,5
-4,3
-4,1
-3,9
-3,7
-3,5
-3,3
-3,1
-2,9
-2,7
-2,5
1951
1955
1959
1963
1967
1971
1975
1979
1983
1987
1991
1995
1999
2003
15-24,actual 45-54,actual
75-84,actual Estimated
Estimated Estimated
Suicide,Males,Sweden
-6,5
-6
-5,5
-5
-4,5
-4
-3,5
-3
-2,5
-2
1951
1955
1959
1963
1967
1971
1975
1979
1983
1987
1991
1995
1999
2003
5-14,actual 25-34,actual
55-64,actual Estimated
Estimated Estimated

33
Suicide, Male, Norway
-4,5
-4
-3,5
-3
1951
1955
1959
1963
1967
1971
1975
1979
1983
1987
1991
1995
1999
2003
35-44,actual 65-74,actual
85-,actual Estimated
Estimated Estimated
Suicide, Male, Norway
-5
-4,6
-4,2
-3,8
-3,4
-3
1951
1955
1959
1963
1967
1971
1975
1979
1983
1987
1991
1995
1999
2003
15-24,actual 45-54,actual
75-84,actual Estimated
Estimated Estimated
Suicide,Male, norway
-6
-5,5
-5
-4,5
-4
-3,5
-3
-2,5
1951
1955
1959
1963
1967
1971
1975
1979
1983
1987
1991
1995
1999
2003
5-14,actual 25-34,actual
55-64,actual Estimated
Estimated Estimated
Suicide,Males,Denmark
-4
-3,5
-3
-2,5
1952
1956
1960
1964
1968
1972
1976
1980
1984
1988
1992
1996
2000
2004
35-44,actual 65-74,actual
85-,actual Estimated
Estimated Estimated
Suicide,Males,Denmark
-4,5
-4
-3,5
-3
-2,5
1952
1956
1960
1964
1968
1972
1976
1980
1984
1988
1992
1996
2000
2004
15-24,actual 45-54,actual
75-84,actual Estimated
Estimated Estimated
Suicide,Males,Denmark
-6
-5,5
-5
-4,5
-4
-3,5
-3
1952
1956
1960
1964
1968
1972
1976
1980
1984
1988
1992
1996
2000
2004
5-14,actual 25-34,actual
55-64,actual Estimated
Estimated Estimated Suicide,Males,Finland
-3,6
-3,5
-3,4
-3,3
-3,2
-3,1
-3
1952
1956
1960
1964
1968
1972
1976
1980
1984
1988
1992
1996
2000
2004
35-44,actual 65-74,actual
85-,actual EstimatedEstimated Estimated
Suicide,Males,Finland
-3,9
-3,7
-3,5
-3,3
-3,1
-2,9
1952
1956
1960
1964
1968
1972
1976
1980
1984
1988
1992
1996
2000
2004
15-24,actual 45-54,actual
75-84,actual EstimatedEstimated Estimated
Suicide,Males,Finland
-6
-5,5
-5
-4,5
-4
-3,5
-3
-2,5
1952
1956
1960
1964
1968
1972
1976
1980
1984
1988
1992
1996
2000
2004
5-14,actual 25-34,actual
55-64,actual EstimatedEstimated Estimated
According to the statistics, women have high rates for attempted suicide but the mortality rates of suicides are almost two times higher for males. We see in the graphs that the trends of suicides have decreased over time for Swedish males, but the trends show various developments for different ages and because of considerable trend changes the Lee-Carter model does not give us good forecasts. Between 1960 and 1980 suicides have increased among Norwegian and Danish young males, a weak reduction in suicides could be seen thereafter. The graph for Finland also shows that from the start of the 1960s the trends in the suicide rate for men in the 15-24 age groups have increased until 1990, but thereafter we see a reduction in the suicide rate for these age groups. In most cases the Lee-Carter forecasts are higher than the actual mortality rates.

34
3.3.10 The other diseases & Males
The other diseases,Males,Sweden
-4,5
-4
-3,5
-3
-2,5
-2
-1,5
-1
1951
1955
1959
1963
1967
1971
1975
1979
1983
1987
1991
1995
1999
2003
35-44,actual 65-74,actual
85-,actual Estimated
Estimated Estimated
The other diseases,Males,Sweden
-5
-4,5
-4
-3,5
-3
-2,5
-2
-1,5
-1
1951
1955
1959
1963
1967
1971
1975
1979
1983
1987
1991
1995
1999
2003
15-24,actual 45-54,actual
75-84,actual Estimated
Estimated Estimated
The other diseases,Males,Sweden
-5
-4,5
-4
-3,5
-3
-2,5
1951
1955
1959
1963
1967
1971
1975
1979
1983
1987
1991
1995
1999
2003
5-14,actual 25-34,actual
55-64,actual Estimated
Estimated Estimated
The other diseases, Male, Norway
-4,5
-4
-3,5
-3
-2,5
-2
-1,5
-1
1951
1955
1959
1963
1967
1971
1975
1979
1983
1987
1991
1995
1999
2003
35-44,actual 65-74,actual
85-,actual Estimated
Estimated Estimated
The other diseases, Male, Norway
-5
-4,6
-4,2
-3,8
-3,4
-3
-2,6
-2,2
1951
1955
1959
1963
1967
1971
1975
1979
1983
1987
1991
1995
1999
2003
15-24,actual 45-54,actual
75-84,actual Estimated
Estimated Estimated
The other diseases,Male, norway
-5,5
-5
-4,5
-4
-3,5
-3
-2,5
1951
1955
1959
1963
1967
1971
1975
1979
1983
1987
1991
1995
1999
2003
5-14,actual 25-34,actual
55-64,actual Estimated
Estimated Estimated
The other diseases,Males,Denmark
-4,5
-4
-3,5
-3
-2,5
-2
-1,5
-1
1952
1956
1960
1964
1968
1972
1976
1980
1984
1988
1992
1996
2000
2004
35-44,actual 65-74,actual
85-,actual Estimated
Estimated Estimated
The other diseases,Males,Denmark
-5
-4,5
-4
-3,5
-3
-2,5
-2
-1,5
1952
1956
1960
1964
1968
1972
1976
1980
1984
1988
1992
1996
2000
2004
15-24,actual 45-54,actual
75-84,actual Estimated
Estimated Estimated
The other diseases,Males,Denmark
-5,5
-5
-4,5
-4
-3,5
-3
-2,5
-2
1952
1956
1960
1964
1968
1972
1976
1980
1984
1988
1992
1996
2000
2004
5-14,actual 25-34,actual
55-64,actual Estimated
Estimated Estimated
The other diseases,Males,Finland
-4,5
-4
-3,5
-3
-2,5
-2
-1,5
-1
-0,5
1952
1956
1960
1964
1968
1972
1976
1980
1984
1988
1992
1996
2000
2004
35-44,actual 65-74,actual
85-,actual Estimated
Estimated Estimated
The other diseases,Males,Finland
-6
-5,5
-5
-4,5
-4
-3,5
-3
-2,5
-2
-1,5
1952
1956
1960
1964
1968
1972
1976
1980
1984
1988
1992
1996
2000
2004
15-24,actual 45-54,actual
75-84,actual EstimatedEstimated Estimated
The other diseases,Males,Finland
-5,5
-5
-4,5
-4
-3,5
-3
-2,5
1952
1956
1960
1964
1968
1972
1976
1980
1984
1988
1992
1996
2000
2004
5-14,actual 25-34,actual
55-64,actual EstimatedEstimated Estimated

35
The other diseases,Males,Iceland
-4,5
-4
-3,5
-3
-2,5
-2
-1,5
-1
-0,5
1952
1956
1960
1964
1968
1972
1976
1980
1984
1988
1992
1996
2000
2004
35-44,actual 65-74,actual85-,actual EstimatedEstimated Estimated
The other diseases,Males,Iceland
-4,5
-4
-3,5
-3
-2,5
-2
-1,5
-1
1952
1956
1960
1964
1968
1972
1976
1980
1984
1988
1992
1996
2000
2004
15-24,actual 45-54,actual75-84,actual EstimatedEstimated Estimated
The other diseases,Males,Iceland
-4,5
-4
-3,5
-3
-2,5
-2
1952
1956
1960
1964
1968
1972
1976
1980
1984
1988
1992
1996
2000
2004
25-34,actual 55-64,actual
Estimated Estimated
As we mentioned earlier, we have collected the less common mortality causes under the name of the other diseases. We have presented the names of these diseases on page 6. As seen in the graphs, after 1980 the trends in these death causes have begun to change for elderly Swedish males and show a large increase especially for males aged 85 and above. Whilst the actual trends for Swedish males are higher than the Lee-Carter forecasts, for Norwegian males the actual trends are quite regular and lower than the forecasted mortality rates. Our Lee-Carter estimates for middle-aged Finnish males are quite good but the reductions in trends for males aged above 75 and for males aged below 35 are lower than the expected. Please here be reminded that the other diseases from Icelandic data contain also infectious diseases, nervous systems diseases, respiratory diseases, digestive systems diseases, urinary systems diseases and suicides.
3.4 Graphical Presentations of the trends and forecasts of mortality causes for
Scandinavian females.
3.4.1 Infections & Females
Infections,Female, Sweden
-8
-7,5
-7
-6,5
-6
-5,5
-5
-4,5
-4
-3,5
-3
1951
1955
1959
1963
1967
1971
1975
1979
1983
1987
1991
1995
1999
2003
5-14,actual 25-34,actual
55-64,actual Estimated
Estimated Estimated
Infections, Female, Sweden
-6,5
-6
-5,5
-5
-4,5
-4
-3,5
-3
-2,5
-2
1951
1955
1959
1963
1967
1971
1975
1979
1983
1987
1991
1995
1999
2003
35-44,actual 65-74,actual
85-,actual Estimated
Estimated Estimated
Infections, Female, Sweden
-7
-6,5
-6
-5,5
-5
-4,5
-4
-3,5
-3
-2,5
-2
1951
1955
1959
1963
1967
1971
1975
1979
1983
1987
1991
1995
1999
2003
15-24,actual 45-54,actual
75-84,actual Estimated
Estimated Estimated Infections,Females,Norway
-7-6,5-6-5,5-5
-4,5-4-3,5-3-2,5-2
1951
1955
1959
1963
1967
1971
1975
1979
1983
1987
1991
1995
1999
2003
35-44,actual 65-74,actual
85-,actual Estimated
Estimated Estimated
Infections,Females,Norway
-6,5
-6
-5,5
-5
-4,5
-4
-3,5
-3
-2,5
-2
1951
1955
1959
1963
1967
1971
1975
1979
1983
1987
1991
1995
1999
2003
15-24,actual 45-54,actual
75-84,actual Estimated
Estimated Estimated
Infections,Females,Norway
-7
-6,5
-6
-5,5
-5
-4,5
-4
-3,5
-3
-2,5
1951
1955
1959
1963
1967
1971
1975
1979
1983
1987
1991
1995
1999
2003
5-24,actual 25-34,actual
55-64,actual Estimated
Estimated Estimated

36
Infections,Females,Denmark
-6,5
-6
-5,5
-5
-4,5
-4
-3,5
-3
-2,5
1952
1956
1960
1964
1968
1972
1976
1980
1984
1988
1992
1996
2000
2004
35-44,actual 65-74,actual
85-,actual Estimated
Estimated Estimated
Infections,Females,Denmark
-7
-6,5
-6
-5,5
-5
-4,5
-4
-3,5
-3
-2,5
1952
1956
1960
1964
1968
1972
1976
1980
1984
1988
1992
1996
2000
2004
15-24,actual 45-54,actual
75-84,actual Estimated
Estimated Estimated
Infections,Females,Denmark
-7
-6,5
-6
-5,5
-5
-4,5
-4
-3,5
-3
1952
1956
1960
1964
1968
1972
1976
1980
1984
1988
1992
1996
2000
2004
5-14,actual 25-34,actual
55-64,actual Estimated
Estimated Estimated
Infections,Females,Finland
-7
-6,5
-6
-5,5
-5
-4,5
-4
-3,5
-3
-2,5
-2
1952
1956
1960
1964
1968
1972
1976
1980
1984
1988
1992
1996
2000
2004
35-44,actual 65-74,actual
85,-actual Estimated
Estimated Estimated
Infections,Females,Finland
-7,5
-7
-6,5
-6
-5,5
-5
-4,5
-4
-3,5
-3
-2,5
-2
1952
1956
1960
1964
1968
1972
1976
1980
1984
1988
1992
1996
2000
2004
15-24,actual 45-54,actual
75-84,actual Estimated
Estimated Estimated
Infections,Females,Finland
-8
-7,5
-7
-6,5
-6
-5,5
-5
-4,5
-4
-3,5
-3
1952
1956
1960
1964
1968
1972
1976
1980
1984
1988
1992
1996
2000
2004
5-14,actual 25-34,actual
55-64,actual EstimatedEstimated Estimated
Strongly trend changes in infectious diseases do not give us possibility to receive good forecasts from the Lee-Carter model. When we compare the graphs for males with the graphs for females, we see that the trend changes are quite similar for both sexes. Mortality caused by infections decreases until 1980s. Thereafter the trends begin to increase especially for middle aged Scandinavian females.
3.4.2 Neoplasm & Females
Neoplasms, Females, Sweden
-4
-3,5
-3
-2,5
-2
-1,5
-1
1951
1955
1959
1963
1967
1971
1975
1979
1983
1987
1991
1995
1999
2003
35-44,actual 65-74,actual
85-,actual Estimated
Estimated Estimated
Neoplasms,Females, Sweden
-5
-4,5
-4
-3,5
-3
-2,5
-2
-1,5
-1
1951
1955
1959
1963
1967
1971
1975
1979
1983
1987
1991
1995
1999
2003
15-24,actual 45-54,actual
75-84,actual Estimated
Estimated Estimated
Neoplasms, Females, Sweden
-5,5
-5
-4,5
-4
-3,5
-3
-2,5
-2
1951
1955
1959
1963
1967
1971
1975
1979
1983
1987
1991
1995
1999
2003
5-14,actual 25-34,actual
55-64,actual Estimated
Estimated Estimated Neoplasms,Females,Norway
-4
-3,5
-3
-2,5
-2
-1,5
-1
1951
1955
1959
1963
1967
1971
1975
1979
1983
1987
1991
1995
1999
2003
35-44,acual 65-74,actual
85-,actual Estimated
Estimated Estimated
Neoplasms,Females,Norway
-5
-4,5
-4
-3,5
-3
-2,5
-2
-1,5
-1
1951
1955
1959
1963
1967
1971
1975
1979
1983
1987
1991
1995
1999
2003
15-24,actual 45-54,actual75-84,actual EstimatedEstimated Estimated
Neoplasms,Females,Norway
-5,5
-5
-4,5
-4
-3,5
-3
-2,5
-2
-1,5
-1
1951
1955
1959
1963
1967
1971
1975
1979
1983
1987
1991
1995
1999
2003
5-14,actual 25-34,actual
55-64,actual Estimated
Estimated Estimated

37
Neoplasms,Females,Denmark
-3,5
-3
-2,5
-2
-1,5
-1
1952
1956
1960
1964
1968
1972
1976
1980
1984
1988
1992
1996
2000
2004
35-44,actual 65-74,actual
85-,actual Estimated
Estimated Estimated
Neoplasms,Females,Denmark
-5
-4,5
-4
-3,5
-3
-2,5
-2
-1,5
-1
1952
1956
1960
1964
1968
1972
1976
1980
1984
1988
1992
1996
2000
2004
15-24,actual 45-54,actual
75-84,actual Estimated
Estimated Estimated
Neoplasms,Females,Denmark
-5
-4,5
-4
-3,5
-3
-2,5
-2
1952
1956
1960
1964
1968
1972
1976
1980
1984
1988
1992
1996
2000
2004
5-14,actual 25-34,actual
55-64,actual Estimated
Estimated Estimated
Neoplasms,Females,Finland
-4
-3,5
-3
-2,5
-2
-1,5
-1
1952
1956
1960
1964
1968
1972
1976
1980
1984
1988
1992
1996
2000
2004
35-44,actual 65-74,actual
85,-actual Estimated
Estimated Estimated
Neoplasms,Females,Finland
-5
-4,5
-4
-3,5
-3
-2,5
-2
-1,5
1952
1956
1960
1964
1968
1972
1976
1980
1984
1988
1992
1996
2000
2004
15-24,actual 45-54,actual
75-84,actual Estimated
Estimated Estimated
Neoplasms,Females,Finland
-5,5
-5
-4,5
-4
-3,5
-3
-2,5
-2
1952
1956
1960
1964
1968
1972
1976
1980
1984
1988
1992
1996
2000
2004
5-14,actual 25-34,actual
55-64,actual Estimated
Estimated Estimated
Neoplasms,Females,Iceland
-3,5
-3
-2,5
-2
-1,5
1952
1956
1960
1964
1968
1972
1976
1980
1984
1988
1992
1996
2000
2004
45-54,actual 65-74,actual
85-,actual Estimated
Estimated Estimated
Neoplasms,Females,Iceland
-5,5
-5
-4,5
-4
-3,5
-3
-2,5
1952
1956
1960
1964
1968
1972
1976
1980
1984
1988
1992
1996
2000
2004
15-24,actual 25-34,actual
Estimated Estimated
Neoplasms,Females,Iceland
-4
-3,5
-3
-2,5
-2
-1,5
-1
1952
1956
1960
1964
1968
1972
1976
1980
1984
1988
1992
1996
2000
2004
35-44,actual 55-64,actual
75-84,actual Estimated
Estimated Estimated We had seen a small increment in neoplasm trends among elderly Swedish males but for Swedish females from all age groups, the trends have reduced. We can also note here that the trend changes are considerably more for elderly Swedish females aged over 85. The forecasts from the model are quite good except for the women aged 75 and above. We remind you about that certain types of cancer occur mainly in women, for instance breast cancer and the other side prostate cancer occurs only in men. It is therefore there are differences between women and men cancer mortality trends. For elderly Norwegian females the model gives us relatively better forecasts. For Danish females from the age-groups 55-64 and 65-74 the cancer mortality shows a small increase but in all other age groups the trends have reduced over time. We can also see a weak reduction in the trends for middle-aged Icelandic females. Although the small chances in trends we can easily observe that for every single country in Scandinavia, the Lee-Carter projections for cancer mortality are well matched to the official projections.

38
3.4.3 Nervous systems & Females
Nervous systems, Females, Sweden
-5
-4,5
-4
-3,5
-3
-2,5
-2
-1,5
-1
1951
1955
1959
1963
1967
1971
1975
1979
1983
1987
1991
1995
1999
2003
35-44,actual 65-74,actual
85-,actual Estimated
Estimated Estimated
Nervous systems,Females, Sweden
-5,5
-5
-4,5
-4
-3,5
-3
-2,5
-2
1951
1955
1959
1963
1967
1971
1975
1979
1983
1987
1991
1995
1999
2003
15-24,actual 45-54,actual
75-84,actual Estimated
Estimated Estimated
Nervous systems, Females, Sweden
-6
-5,5
-5
-4,5
-4
-3,5
-3
1951
1955
1959
1963
1967
1971
1975
1979
1983
1987
1991
1995
1999
2003
5-14,actual 25-34,actual
55-64,actual Estimated
Estimated Estimated Nervous systems,Females,Norway
-5
-4,5
-4
-3,5
-3
-2,5
-2
-1,5
1951
1955
1959
1963
1967
1971
1975
1979
1983
1987
1991
1995
1999
2003
35-44,actual 65-74,actual
85-,actual Series4
Series5 Series6
Nervous systems,Females,Norway
-5,5
-5
-4,5
-4
-3,5
-3
-2,5
-2
1951
1955
1959
1963
1967
1971
1975
1979
1983
1987
1991
1995
1999
2003
15-24,actual 45-54,actual
75-84,actual Estimated
Estimated Estimated
Nervous systems,Females,Norway
-5,5
-5
-4,5
-4
-3,5
-3
-2,5
-2
1951
1955
1959
1963
1967
1971
1975
1979
1983
1987
1991
1995
1999
2003
5-14,actual 25-34,actual
55-64,actual Estimated
Estimated Estimated Nervous systems,Females,Denmark
-6
-5,5
-5
-4,5
-4
-3,5
-3
1952
1956
1960
1964
1968
1972
1976
1980
1984
1988
1992
1996
2000
2004
5-14,actual 25-34,actual
55-64,actual Estimated
Estimated Estimated
Nervous systems,Females,Denmark
-5
-4,5
-4
-3,5
-3
-2,5
-2
-1,5
1952
1956
1960
1964
1968
1972
1976
1980
1984
1988
1992
1996
2000
2004
35-44,actual 65-74,actual
85-,actual Estimated
Estimated Estimated
Nervous systems,Females,Denmark
-6
-5,5
-5
-4,5
-4
-3,5
-3
-2,5
-2
1952
1956
1960
1964
1968
1972
1976
1980
1984
1988
1992
1996
2000
2004
15-24,actual 45-54,actual
75-84,actual Estimated
Estimated Estimated
Nervous systems,Females,Finland
-5,5
-5
-4,5
-4
-3,5
-3
-2,5
-2
-1,5
-1
1952
1956
1960
1964
1968
1972
1976
1980
1984
1988
1992
1996
2000
2004
35-44,actual 65-74,actual
85,-actual Estimated
Estimated Estimated
Nervous systems,Females,Finland
-5,5
-5
-4,5
-4
-3,5
-3
-2,5
-2
-1,5
1952
1956
1960
1964
1968
1972
1976
1980
1984
1988
1992
1996
2000
2004
15-24,actual 45-54,actual
75-84,actual Estimated
Estimated Estimated
Nervous systems,Females,Finland
-5,5
-5
-4,5
-4
-3,5
-3
1952
1956
1960
1964
1968
1972
1976
1980
1984
1988
1992
1996
2000
5-14,actual 25-34,actual
55-64,actual Estimated
Estimated Estimated We remember from the previous sections, the nervous system disease is one of the a few mortality causes that have an increased trend over time. We can clearly see in the present graphs that the trends for Swedish females aged over 65 have shown an unexpected increase in the last 20 years. For elderly Norwegian females the curves are more precipitous. On the other hand for younger

39
Norwegian females one expects a reduction in trends but in actual, the trends have not changed so much. Compared with the other Scandinavian females the increases in trends for middle-aged Danish females have been a bit clearer over time. The changes in trends for Finnish females do not differ so much from the trends for the other Scandinavian females and generally the Lee-Carter projections do not match so well to the actual trends.
3.4.4 Heart and arteries & Females
Heart and arties, Females, Sweden
-4,5
-4
-3,5
-3
-2,5
-2
-1,5
-1
-0,5
0
1951
1955
1959
1963
1967
1971
1975
1979
1983
1987
1991
1995
1999
2003
35-44,actual 65-74,actual
85-,actual Estimated
Estimated Estimated
Heart and arties,Females, Sweden
-5,5
-5
-4,5
-4
-3,5
-3
-2,5
-2
-1,5
-1
-0,5
0
1951
1955
1959
1963
1967
1971
1975
1979
1983
1987
1991
1995
1999
2003
15-24,actual 45-54,actual
75-84,actual Estimated
Estimated Estimated
Heart and arties, Females, Sweden
-6
-5,5
-5
-4,5
-4
-3,5
-3
-2,5
-2
1951
1955
1959
1963
1967
1971
1975
1979
1983
1987
1991
1995
1999
2003
5-14,actual 25-34,actual
55-64,actual Estimated
Estimated Estimated
Heart and arteries,Females,Norway
-4,5
-4
-3,5
-3
-2,5
-2
-1,5
-1
-0,5
0
1951
1955
1959
1963
1967
1971
1975
1979
1983
1987
1991
1995
1999
2003
35-44,actual 65-74,actual
85-,actual Estimated
Estimated EStimated
Heart and arteries,Females,Norway
-6-5,5-5-4,5-4-3,5-3-2,5-2-1,5-1
1951
1955
1959
1963
1967
1971
1975
1979
1983
1987
1991
1995
1999
2003
15-24,actual 45-54,actual
75-84,actual Estimated
Estimated Estimated
Heart and arteries,Females,Norway
-6
-5,5
-5
-4,5
-4
-3,5
-3
-2,5
-2
1951
1955
1959
1963
1967
1971
1975
1979
1983
1987
1991
1995
1999
2003
5-14,actual 25-34,actual
55-64,actual Estimated
Estimated Estimated
Heart and arteries,Females,Denmark
-6,5
-6
-5,5
-5
-4,5
-4
-3,5
-3
-2,5
-2
1952
1956
1960
1964
1968
1972
1976
1980
1984
1988
1992
1996
2000
2004
5-14,actual 25-34,actual
55-64,actual Estimated
Estimated Estimated
Heart and arteries,Females,Denmark
-6
-5,5
-5
-4,5
-4
-3,5
-3
-2,5
-2
-1,5
-1
1952
1956
1960
1964
1968
1972
1976
1980
1984
1988
1992
1996
2000
2004
15-24,actual 45-54,actual
75-84,actual Estimated
Estimated Estimated
Heart and arteries,Females,Denmark
-4,5
-4
-3,5
-3
-2,5
-2
-1,5
-1
-0,5
0
1952
1956
1960
1964
1968
1972
1976
1980
1984
1988
1992
1996
2000
2004
35-44,actual 65-74,actual
85-,actual Estimated
Estimated Estimated Heart and arteries,Females,Finland
-4,5
-4
-3,5
-3
-2,5
-2
-1,5
-1
-0,5
0
1952
1956
1960
1964
1968
1972
1976
1980
1984
1988
1992
1996
2000
2004
35-44,actual 65-74,actual85,-actual EstimatedEstimated Estimated
Heart and arteries,Females,Finland
-6
-5,5
-5
-4,5
-4
-3,5
-3
-2,5
-2
-1,5
-1
-0,5
1952
1956
1960
1964
1968
1972
1976
1980
1984
1988
1992
1996
2000
2004
15-24,actual 45-54,actual75-84,actual EstimatedEstimated Estimated
Heart and arteries,Females,Finland
-6,5
-6
-5,5
-5
-4,5
-4
-3,5
-3
-2,5
-2
-1,5
1952
1956
1960
1964
1968
1972
1976
1980
1984
1988
1992
1996
2000
2004
5-14,actual 25-34,actual55-64,actual EstimatedEstimated Estimated

40
Heart and arteries,Females,Iceland
-5
-4,5
-4
-3,5
-3
-2,5
-2
-1,5
-119
5219
5619
6019
6419
6819
7219
7619
8019
8419
8819
9219
9620
0020
04
35-44,actual 55-64,actual
75-84,actual Estimated
Estimated Estimated
Heart and arteries,Females,Iceland
-4,5
-4
-3,5
-3
-2,5
-2
-1,5
-1
-0,5
0
1952
1956
1960
1964
1968
1972
1976
1980
1984
1988
1992
1996
2000
2004
45-54,actual 65-74,actual
85-,actual Estimated
Estimated Estimated Mortality rates from heart and arteries have decreased slowly among Swedish females but projections from the Lee-Carter model are quite good compared with the results for the other mortality causes. For Norwegian females, trend reductions have begun from the end of 1970s and the observed mortality rates are lower than the forecasted mortality rates. Unlike the other age groups, the actual mortality rates for the age group 25-34 are higher than the projected mortality rates for Danish females. In general, mortality caused by heart diseases has reduced for Scandinavian females and in most cases, the Lee-Carter model overestimates the mortality from heart diseases.
3.4.5 Respiratory diseases & Females
Respiratory diseases, Females, Sweden
-6
-5,5
-5
-4,5
-4
-3,5
-3
-2,5
-2
1951
1955
1959
1963
1967
1971
1975
1979
1983
1987
1991
1995
1999
2003
15-24,actual 45-54,actual
75-84,actual Estimated
Estimated Estimated
Respiratory diseases, Females, Sweden
-7
-6,5
-6
-5,5
-5
-4,5
-4
-3,5
-3
1951
1955
1959
1963
1967
1971
1975
1979
1983
1987
1991
1995
1999
2003
5-24,actual 25-34,actual
55-64,actual Estimated
Estimated Estimated
Respiratory diseases, Females, Sweden
-5
-4,5
-4
-3,5
-3
-2,5
-2
-1,5
-1
1951
1955
1959
1963
1967
1971
1975
1979
1983
1987
1991
1995
1999
2003
35-44,actual 65-74,actual
85-,actual Estimated
Estimated Estimated
Respiratory diseases,Females,Norway
-5,5
-5
-4,5
-4
-3,5
-3
-2,5
-2
-1,5
-1
1951
1955
1959
1963
1967
1971
1975
1979
1983
1987
1991
1995
1999
2003
35-44,actual 65-74,actual
85-,actual Estimated
Estimated Estimated
Respiratory diseases,Females,Norway
-6
-5,5
-5
-4,5
-4
-3,5
-3
-2,5
-2
-1,5
1951
1955
1959
1963
1967
1971
1975
1979
1983
1987
1991
1995
1999
2003
15-24,actual 45-54,actual
75-84,actual EstimatedEstimated Estimated
Respiratory diseases, Females,Norway
-6,5
-6
-5,5
-5
-4,5
-4
-3,5
-3
-2,5
-2
1951
1955
1959
1963
1967
1971
1975
1979
1983
1987
1991
1995
1999
2003
5-14,actual 25-34,actual
55-64,actual Estimated
Estimated Estimated

41
Respiratory diseases,Females,Denmark
-6
-5,5
-5
-4,5
-4
-3,5
-3
-2,5
-2
1952
1956
1960
1964
1968
1972
1976
1980
1984
1988
1992
1996
2000
15-24,actual 45-54,actual
75-84,actual Estimated
Estimated Estimated
Respiratory diseases,Females,Denmark
-5
-4,5
-4
-3,5
-3
-2,5
-2
-1,5
-1
1952
1956
1960
1964
1968
1972
1976
1980
1984
1988
1992
1996
2000
35-44,actual 65-74,actual
85-,actual Estimated
Estimated Estimated
Respiratory diseases,Females,Denmark
-6,5
-6
-5,5
-5
-4,5
-4
-3,5
-3
-2,5
1952
1956
1960
1964
1968
1972
1976
1980
1984
1988
1992
1996
2000
5-14,actual 25-34,actual
55-64,actual Estimated
Estimated Estimated Respiratory diseases,Females,Finland
-6,5-6-5,5-5-4,5-4-3,5-3-2,5-2-1,5-1-0,5
1952
1956
1960
1964
1968
1972
1976
1980
1984
1988
1992
1996
2000
2004
15-24,actual 45-54,actual75-84,actual EstimatedEstimated Estimated
Respiratory diseases,Females,Finland
-6,5
-6
-5,5
-5
-4,5-4
-3,5
-3
-2,5
-2
-1,5
1952
1956
1960
1964
1968
1972
1976
1980
1984
1988
1992
1996
2000
2004
5-14,actual 25-34,actual55-64,actual EstimatedEstimated Estimated
Respiratory diseases,Females,Finland
-5,5
-5
-4,5
-4
-3,5
-3
-2,5
-2
-1,5
-1
1952
1956
1960
1964
1968
1972
1976
1980
1984
1988
1992
1996
2000
2004
35-44,actual 65-74,actual85,-actual EstimatedEstimated Estimated
Mortality from respiratory diseases decreases weakly among middle-aged Swedish females. On the other hand, the observed mortality rates are higher than expected for elderly Swedish females. For elderly Norwegian females mortality rates from respiratory diseases have not change so much but a clearly trend reduction occurs for younger females. We can see a small increase in mortality trends for Danish females aged between 55 and 75. Unlike the other Scandinavian females the number of deaths from the respiratory diseases has reduced among Finnish females from all age groups and the forecasts from the model are relatively better for this country.
3.4.6 Digestive systems & Females
Digestive systems, Females,Sweden
-5
-4,5
-4
-3,5
-3
-2,5
-2
1951
1955
1959
1963
1967
1971
1975
1979
1983
1987
1991
1995
1999
2003
35-44,actual 65-74,actual
85,actual Estimated
Estimated Estimated
Digestive systems, Females, Sweden
-6
-5,5
-5
-4,5
-4
-3,5
-3
-2,5
-2
1951
1955
1959
1963
1967
1971
1975
1979
1983
1987
1991
1995
1999
2003
15-24,actual 45-54,actual
75-84,actual Estimated
Estimated Estimated
Digestive systems, Females, Sweden
-7
-6,5
-6
-5,5
-5
-4,5
-4
-3,5
-3
1951
1955
1959
1963
1967
1971
1975
1979
1983
1987
1991
1995
1999
2003
5-14,actual 25-34,actual
55-64,actual Estimated
Estimated Estimated

42
Digestive systems,Females,Norway
-5,5
-5
-4,5
-4
-3,5
-3
-2,5
-2
-1,5
1951
1955
1959
1963
1967
1971
1975
1979
1983
1987
1991
1995
1999
2003
35-44,actual 65-74,actual
85-,actual Estimated
Estimated Estimated
Digestive systems,Females,Norway
-9
-8
-7
-6
-5
-4
-3
-2
1951
1955
1959
1963
1967
1971
1975
1979
1983
1987
1991
1995
1999
2003
15-24,actual 45-54,actual
75-84,actual Estimated
Estimated Estimated
Digestive systems,Females,Norway
-9
-8,5
-8
-7,5
-7
-6,5
-6
-5,5
-5
-4,5
-4
-3,5
-3
1951
1955
1959
1963
1967
1971
1975
1979
1983
1987
1991
1995
1999
2003
5-24,actual 25-34,actual
55-64,actual Estimated
Estimated Estimated Digestive systems,Females,Denmark
-5
-4,5
-4
-3,5
-3
-2,5
-2
1952
1956
1960
1964
1968
1972
1976
1980
1984
1988
1992
1996
2000
35-44,actual 65-74,actual
85-,actual Estimated
Estimated Estimated
Digestive systems,Females,Denmark
-6,5
-6
-5,5
-5
-4,5
-4
-3,5
-3
-2,5
-2
1952
1956
1960
1964
1968
1972
1976
1980
1984
1988
1992
1996
2000
15-24,actual 45-54,actual
75-84,actual Estimated
Estimated Estimated
Digestive systems,Females,Denmark
-8-7,5
-7-6,5
-6-5,5
-5-4,5
-4-3,5
-3-2,5
1952
1956
1960
1964
1968
1972
1976
1980
1984
1988
1992
1996
2000
5-14,actual 25-34,actual
55-64,actual Estimated
Estimated Estimated
Digestive systems,Females,Finland
-5,5
-5
-4,5
-4
-3,5-3
-2,5
-2
-1,5
-1
1952
1956
1960
1964
1968
1972
1976
1980
1984
1988
1992
1996
2000
2004
35-44,actual 65-74,actual85,-actual EstimatedEstimated Estimated
Digestive systems,Females,Finland
-7
-6,5
-6
-5,5
-5
-4,5
-4
-3,5
-3
-2,5
-2
1952
1956
1960
1964
1968
1972
1976
1980
1984
1988
1992
1996
2000
2004
15-24,actual 45-54,actual75-84,actual EstimatedEstimated Estimated
Digestive systems,Females,Finland
-7
-6,5
-6
-5,5
-5
-4,5
-4
-3,5
-3
-2,5
1952
1956
1960
1964
1968
1972
1976
1980
1984
1988
1992
1996
2000
2004
5-14,actual 25-34,actual55-64,actual EstimatedEstimated Estimated
As we have mentioned earlier, mortality from digestive system diseases is more common among elderly people and therefore the curves are quite irregular for younger females. We see in the graphs that the projections are quite good for middle aged Swedish females and in most cases the actual mortality rates are lower than the projected mortality rates. The projections from the model are quite good for Norwegian females. For Danish females the Lee-Carter projections are lower than the actual mortality rates.
3.4.7 Urinary systems & Females Urinary systems, Females, Sweden
-6,5
-6
-5,5
-5
-4,5
-4
-3,5
-3
-2,5
-2
1951
1955
1959
1963
1967
1971
1975
1979
1983
1987
1991
1995
1999
2003
35-44,actual 65-74,actual
85-,actual Estimated
Estimated Estimated
Urinary systems, Females, Sweden
-9-8,5-8-7,5-7-6,5-6-5,5-5-4,5-4-3,5-3-2,5
1951
1956
1961
1966
1971
1976
1981
1986
1991
1996
2001
25-24,actual 45-54,actual
75-84,actual Estimated
Estimated Estimated
Urinary systems, Females, Sweden
-8
-7,5
-7
-6,5
-6
-5,5
-5
-4,5
-4
-3,5
-3
1951
1955
1959
1963
1967
1971
1975
1979
1983
1987
1991
1995
1999
2003
5-14,actual 25-34,actual
55-64,actual Estimated
Estimated Estimated

43
Urinary systems,Females,Norway
-7,5-7
-6,5-6
-5,5-5-4,5
-4-3,5
-3-2,5-2
19511955
19591963
19671971
19751979
19831987
19911995
19992003
35-44,actual 65-74,actual
85-,actual Estimated
Estimated Estimated
Urinary systems,Females,Norway
-8,5-8-7,5-7-6,5
-6-5,5-5-4,5-4-3,5-3-2,5-2
1951
1955
1959
1963
1967
1971
1975
1979
1983
1987
1991
1995
1999
2003
15-24,actual 45-54,actual
75-84,actual Estimated
Estimated Estimated
Urinary systems,Females,Norway
-11
-10
-9
-8
-7
-6
-5
-4
-3
1951
1956
1961
1966
1971
1976
1981
1986
1991
1996
2001
5-14,actual 25-34,actual
55-64,actual EstimatedEstimated Estimated
Urinary systems,Females,Denmark
-6
-5,5
-5
-4,5
-4
-3,5
-3
-2,5
-2
1952
1956
1960
1964
1968
1972
1976
1980
1984
1988
1992
1996
2000
2004
35-44,actual 65-74,actual
85-,actual Estimated
Estimated Estimated
Urinary systems,Females,Denmark
-9-8,5-8-7,5-7-6,5-6-5,5-5-4,5-4-3,5-3-2,5-2
1952
1956
1960
1964
1968
1972
1976
1980
1984
1988
1992
1996
2000
2004
15-24,actual 45-54,actual
75-84,actual Estimated
Estimated Estimated
Urinary systems,Females,Denmark
-8
-7,5
-7
-6,5
-6
-5,5
-5
-4,5
-4
-3,5
-3
1952
1956
1960
1964
1968
1972
1976
1980
1984
1988
1992
1996
2000
2004
5-14,actual 25-34,actual
55-64,actual Estimated
Estimated Estimated Urinary systems,Females,Finland
-5
-4,5
-4
-3,5
-3
-2,5
-2
-1,5
1952
1956
1960
1964
1968
1972
1976
1980
1984
1988
1992
1996
2000
2004
35-44,actual 65-74,actual85,-actual EstimatedEstimated Estimated
Urinary systems,Females,Finland
-11
-10
-9
-8
-7
-6
-5
-4
-3
-2
1952
1956
1960
1964
1968
1972
1976
1980
1984
1988
1992
1996
2000
2004
15-24,actual 45-54,actual75-84,actual EstimatedEstimated Estimated
Urinary systems,Females,Finland
-6
-5,5
-5
-4,5
-4
-3,5
-3
-2,5
1952
1956
1960
1964
1968
1972
1976
1980
1984
1988
1992
1996
2000
2004
65-74,actual 55-64,actualEstimated Estimated25-34,actual Estimated
Problems in the urinary system can be caused by aging. As you get older, the muscles in your ureters, bladder, and urethra tend to lose some of their strength. You may have more urinary infections because the bladder muscles do not tighten enough to empty your bladder completely. We can also see that in the graphs that the mortality from urinary system diseases is more common among elderly people. The curves for young females aged 5-24 are quite irregular because of the small size of deaths from urinary system diseases. The largest trend changes for mortality from urinary system diseases have occurred in middle-aged Finnish females i.e. at the end of 1970s the trends for respective age-groups have begun increase clearly. The curves are more stable for Danish and Norwegian females and because of that the model gives us better forecasts for these countries.

44
3.4.8 Accidental causes & Females
Accidental causes, Females,Sw eden
-4,5
-4
-3,5
-3
-2,5
-2
-1,5
-1
1951
1955
1959
1963
1967
1971
1975
1979
1983
1987
1991
1995
1999
2003
35-44,actual 65-74,actual
85-,actual Estimated
Estimated Estimated
Accidental causes,Females,Sweden
-4,5
-4
-3,5
-3
-2,5
-2
-1,5
-1
1951
1955
1959
1963
1967
1971
1975
1979
1983
1987
1991
1995
1999
2003
15-24,actual 45-54,actual
75-84,actual Estimated
Estimated Estimated
Accidental causes,Females,Sweden
-5
-4,5
-4
-3,5
-3
-2,5
-2
1951
1955
1959
1963
1967
1971
1975
1979
1983
1987
1991
1995
1999
2003
5-14,actual 25-34,actual
55-64,actual Estimated
Estimated estimated
Accidental causes,Females,Norway
-5
-4,5
-4
-3,5
-3
-2,5
-2
-1,5
-1
1951
1955
1959
1963
1967
1971
1975
1979
1983
1987
1991
1995
1999
2003
35-44,actual 65-74,actual
85-,actual EstimatedEstimated Estimated
Accidental causes,Females,Norway
-5
-4,5
-4
-3,5
-3
-2,5
-2
-1,5
-1
1951
1955
1959
1963
1967
1971
1975
1979
1983
1987
1991
1995
1999
2003
15-24,actual 45-54,actual
75-84,actual Estimated
Estimated Estimated
Accidental causes,Females,Norway
-5,5
-5
-4,5
-4
-3,5
-3
-2,5
-2
1951
1956
1961
1966
1971
1976
1981
1986
1991
1996
2001
5-14,actual 25-34,actual
55-64,actual Estimated
Estimated Estimated
Accidental causes,Females,Denmark
-4,5
-4
-3,5
-3
-2,5
-2
-1,5
-1
1952
1956
1960
1964
1968
1972
1976
1980
1984
1988
1992
1996
2000
2004
35-44,actual 65-74,actual
85-,actual EstimatedEstimated Estimated
Accidental causes,Females,Denmark
-4,5
-4
-3,5
-3
-2,5
-2
-1,5
1952
1956
1960
1964
1968
1972
1976
1980
1984
1988
1992
1996
2000
2004
15-24,actual 45-54,actual
75-84,actual Estimated
Estimated Estimated
Accidental causes,Females,Denmark
-5
-4,5
-4
-3,5
-3
1952
1956
1960
1964
1968
1972
1976
1980
1984
1988
1992
1996
2000
2004
5-14,actual 25-34,actual
55-64,actual Estimated
Estimated Estimated
Accidental causes,Females,Finland
-4,5
-4
-3,5
-3
-2,5
-2
-1,5
1952
1956
1960
1964
1968
1972
1976
1980
1984
1988
1992
1996
2000
2004
35-44,actual 65-74,actual85,-actual EstimatedEstimated Estimated
Accidental causes,Females,Finland
-5
-4,5
-4
-3,5
-3
-2,5
-2
1952
1956
1960
1964
1968
1972
1976
1980
1984
1988
1992
1996
2000
2004
15-24,actual 45-54,actual75-84,actual EstimatedEstimated Estimated
Accidental causes,Females,Finland
-5
-4,5
-4
-3,5
-3
-2,5
1952
1956
1960
1964
1968
1972
1976
1980
1984
1988
1992
1996
2000
2004
5-14,actual 25-34,actual55-64,actual EstimatedEstimated Estimated

45
Accidental causes,Females,Iceland
-5,5
-5
-4,5
-4
-3,5
-3
-2,5
-2
-1,5
-1
1952
1956
1960
1964
1968
1972
1976
1980
1984
1988
1992
1996
2000
2004
35-44,actual 55-64,actual
75-84,actual Estimated
Estimated Estimated
Accidental causes,Females,Iceland
-5
-4,5
-4
-3,5
-3
-2,5
-2
-1,5
1952
1956
1960
1964
1968
1972
1976
1980
1984
1988
1992
1996
2000
2004
45-54,actual 65-74,actual
85-,actual EstimatedEstimated Estimated
Accidental causes,Females,Iceland
-5,5
-5
-4,5
-4
-3,5
-3
-2,5
1952
1956
1960
1964
1968
1972
1976
1980
1984
1988
1992
1996
2000
2004
15-24,actual 25-34,actual
Estimated Estimated Mortality from accidental causes has decreased over time among Swedish females from all age-groups and these trend changes make it difficult for us to get good forecasts from the Lee-Carter model. For Norwegian females projected mortality rates are higher than the actual mortality trends. Mortality due to accidents has been higher than the expected among elderly Danish and Finnish females but the trends decrease strongly for younger females. Mortality by accidental causes among Icelandic females has decreased over time but we can see in the graphs that the projections of mortality rates are much higher than the actual mortality rates.
3.4.9 Suicide & Females
Suicide, Females,Sweden
-4,5
-4,3
-4,1
-3,9
-3,7
-3,5
1951
1955
1959
1963
1967
1971
1975
1979
1983
1987
1991
1995
1999
2003
35-44,actual 65-74,actual
85-,actual Estimated
Estimated Estimated
Suicide,Females,Sweden
-5
-4,7
-4,4
-4,1
-3,8
-3,5
-3,2
1951
1955
1959
1963
1967
1971
1975
1979
1983
1987
1991
1995
1999
2003
15-24,actual 45-54,actual75-84,actual EstimatedEstimated Estimated
Suicide, Females, Sweden
-7,5
-7
-6,5
-6
-5,5
-5
-4,5
-4
-3,5
-3
1951
1955
1959
1963
1967
1971
1975
1979
1983
1987
1991
1995
1999
2003
5-14,actual 25-34,actual
55-64,actual Estimated
Estimated Estimated Suicide,Females,Norway
-5,5
-5
-4,5
-4
-3,5
-3
1951
1955
1959
1963
1967
1971
1975
1979
1983
1987
1991
1995
1999
2003
35-44,actual 65-74,actual
Estimated Estimated
Suicide,Females,Norway
-6,5
-6
-5,5
-5
-4,5
-4
-3,5
-3
-2,5
1951
1955
1959
1963
1967
1971
1975
1979
1983
1987
1991
1995
1999
2003
15-24,actual 45-54,actual
75-84,actual Estimated
Estimated Estimated
Suicide,Females,Norway
-5,5
-5
-4,5
-4
-3,5
-3
-2,5
1951
1955
1959
1963
1967
1971
1975
1979
1983
1987
1991
1995
1999
2003
25-34,actual 55-64,actual
Estimated Estimated

46
Suicide,Females,Denmark
-4,5
-4
-3,5
-3
1952
1956
1960
1964
1968
1972
1976
1980
1984
1988
1992
1996
2000
2004
35-44,actual 65-74,actual
85-,actual EstimatedEstimated Estimated
Suicide,Females,Denmark
-5
-4,5
-4
-3,5
-3
1952
1956
1960
1964
1968
1972
1976
1980
1984
1988
1992
1996
2000
2004
15-24,actual 45-54,actual
75-84,actual Estimated
Estimated Estimated
Suicide,Females,Denmark
-5
-4,5
-4
-3,5
-3
1952
1956
1960
1964
1968
1972
1976
1980
1984
1988
1992
1996
2000
2004
25-34,actual 55-64,actual
Estimated Estimated
Suicide,Females,Finland
-4,5
-4
-3,5
-3
1952
1956
1960
1964
1968
1972
1976
1980
1984
1988
1992
1996
2000
2004
35-44,actual 65-74,actual
Estimated Estimated
Suicide,Females,Finland
-5
-4,5
-4
-3,5
-3
1952
1956
1960
1964
1968
1972
1976
1980
1984
1988
1992
1996
2000
2004
15-24,actual 45-54,actual75-84,actual EstimatedEstimated Estimated
Suicide,Females,Finland
-4,2
-4
-3,8
-3,6
-3,4
-3,2
1952
1956
1960
1964
1968
1972
1976
1980
1984
1988
1992
1996
2000
2004
25-34,actual 55-64,actual
Estimated Estimated Since the Swedish data was sufficiently large we could apply the Lee-Carter model even to data for age-groups 5-14 and 85-. But for remaining countries we have chosen to neglect these ages because of the small size of suicides. The observed number of mortality by suicide has begun to decrease at the beginning of 1980s for Swedish females from all age-groups. We had observed increases in suicides among Norwegian young males and we can see it in current graphs that the suicides have become more common among Norwegian young females too. But the increases were not as much as expected. A clearly reduction in mortality caused by suicide among Danish females from all age-groups in the last 20 years could be noticed after seeing the actual trends in suicides. Apart from the small increase in suicides among females in age-group 45-54, in general the suicide trends have decreased among Finnish females. In generally, the projected suicide rates are higher than the actual suicide rates.
3.4.10 The other diseases & Females
The other diseases,Females,Sweden
-5
-4,5
-4
-3,5
-3
-2,5
-2
-1,5
-1
1951
1955
1959
1963
1967
1971
1975
1979
1983
1987
1991
1995
1999
2003
35-44,actual 65-74,actual
85-, Estimated
Estimated Estimated
The other diseases,Females,Sweden
-5
-4,5
-4
-3,5
-3
-2,5
-2
-1,5
1951
1955
1959
1963
1967
1971
1975
1979
1983
1987
1991
1995
1999
2003
15-24,actual 45-54,actual
75-84,actual Estimated
Estimated Estimated
The other diseases,Females,Sweden
-5,5
-5
-4,5
-4
-3,5
-3
1951
1955
1959
1963
1967
1971
1975
1979
1983
1987
1991
1995
1999
2003
5-24,actual 25-34,actual
55-64,actual Estimated
Estimated Estimated

47
The other diseases,Females,Norway
-5,5
-5
-4,5
-4
-3,5
-3
-2,5
-2
-1,5
-1
1951
1955
1959
1963
1967
1971
1975
1979
1983
1987
1991
1995
1999
2003
35-44,actual 65-74,actual
85-,actual EstimatedEstimated Estimated
The other diseases,Females,Norway
-5
-4,5
-4
-3,5
-3
-2,5
-2
-1,5
1951
1955
1959
1963
1967
1971
1975
1979
1983
1987
1991
1995
1999
2003
15-24,actual 45-54,actual75-84,actual EstimatedEstimated Estimated
The other diseases,Females,Norway
-5,5
-5
-4,5
-4
-3,5
-3
1951
1955
1959
1963
1967
1971
1975
1979
1983
1987
1991
1995
1999
2003
5-14,actual 25-34,actual
55-64,actual Estimated
Estimated Estimated
The other diseases,Females,Denmark
-4,5
-4
-3,5
-3
-2,5
-2
-1,5
-1
1952
1956
1960
1964
1968
1972
1976
1980
1984
1988
1992
1996
2000
35-44,actual 65-74,actual
85-,actual EstimatedEstimated Estimated
The other diseases,Females,Denmark
-5
-4,5
-4
-3,5
-3
-2,5
-2
1952
1956
1960
1964
1968
1972
1976
1980
1984
1988
1992
1996
2000
15-24,actual 45-54,actual
75-84,actual Estimated
Estimated Estimated
The other diseases,Females,Denmark
-5
-4,5
-4
-3,5
-3
-2,5
1952
1956
1960
1964
1968
1972
1976
1980
1984
1988
1992
1996
2000
5-14,actual 25-34,actual
55-64,actual Estimated
Estimated Estimated
The other diseases,Females,Finland
-5
-4,5
-4
-3,5
-3
-2,5
-2
-1,5
-1
1952
1956
1960
1964
1968
1972
1976
1980
1984
1988
1992
1996
2000
2004
35-44,actual 65-74,actual85,-actual EstimatedEstimated Estimated
The other diseases,Females,Finland
-5
-4,5
-4
-3,5
-3
-2,5
-2
-1,5
1952
1956
1960
1964
1968
1972
1976
1980
1984
1988
1992
1996
2000
2004
15-24,actual 45-54,actual75-84,actual EstimatedEstimated Estimated
The other diseases,Females,Finland
-5,5
-5
-4,5
-4
-3,5
-3
-2,5
1952
1956
1960
1964
1968
1972
1976
1980
1984
1988
1992
1996
2000
2004
5-14,actual 25-34,actual55-64,actual EstimatedEstimated Estimated
The other diseases,Females,Iceland
-5
-4,5
-4
-3,5
-3
-2,5
-2
-1,5
-1
1952
1956
1960
1964
1968
1972
1976
1980
1984
1988
1992
1996
2000
2004
35-44,actual 55-64,actual75-84,actual EstimatedEstimated Estimated
The other diseases,Females,Iceland
-4
-3,5
-3
-2,5
-2
-1,5
-1
-0,5
1952
1956
1960
1964
1968
1972
1976
1980
1984
1988
1992
1996
2000
2004
45-54,actual 65-74,actual85-,actual EstimatedEstimated Estimated
Since we have treated many different diseases under “the other diseases”, it is difficult to know which of the diseases has most impact on the trend changes. Mortality from “the other diseases” has increased among elderly Swedish females but on the other hand the trends have decreased among younger females. Forecasts from the model are relatively better but because of the trend changes the forecasts are not so successful for the other age groups. The trend decreases in “the other diseases” are lower than the expected for elderly Finnish females but in generally the Lee-Carter approaches to Finnish data works quite well. The observed mortality rates for Icelandic females are larger than the estimated mortality rates.

48
4. Comparison of the results between Lee-Carter applications to all-
causes mortality data and cause-specific mortality data
As we have explained earlier the aim of this study is firstly applying the Lee-Carter model to Scandinavian all-cause mortality data and secondly applying the same model to Scandinavian cause-specific mortality data in order to obtain forecasts of mortality for use in projecting the elderly population, and comparing the resulting projections with the most recent official projections. We can also remind you that the central question in this study is: Do the mortality forecasts improve when the Lee-Carter model is applied to cause-specific mortality data? In section three we have defined
idcxtq )( as the probability of dying of the death cause i ( idc ) in any
one year t at age x . We have applied the Lee-Carter model to ten different death causes and now in the matrix below we describe how to sum up estimated and forecasted death rates we have got from the model. 5-14, 15-24, …………………, 85+
T
t
t
M
1+
∑∑
∑∑
))ˆ(log())ˆ(log(
))ˆ(log())ˆ(log(
1010
1010
i
dctxdc
i
tx
i
dctxdc
i
tx
ii
ii
L
MOM
L
Where 1951=t for Sweden, Norway and Iceland, 1952=t for Finland and Denmark. 2001=T for Denmark, 2004=T for Sweden and Norway, Finland and Iceland. In the graphs below we present our results from the both Lee-Carter estimations for respective Scandinavian nations and we can also note here that we have chosen to present our results only for some age groups since we have realized that it was not necessary to present results for all age groups.
4.1 Sweden
Sweden,Male
-3,3
-3,2
-3,1
-3
-2,9
-2,8
-2,7
-2,6
25-34,actualEstimatedCause-specific estimation
Sweden,Male
-3
-2,9
-2,8
-2,7
-2,6
-2,5
-2,4
-2,3
1951
1955
1959
1963
1967
1971
1975
1979
1983
1987
1991
1995
1999
2003
35-44,actualEstimatedCause-specific estimation
Sweden,Male
-2,7
-2,6
-2,5
-2,4
-2,3
-2,2
-2,1
-2
1951
195519
59196
319
6719
7119
7519
7919
8319
87199
119
9519
9920
03
45-54,actualEstimatedCause-specific estimation

49
Sweden,Male
-1,7
-1,6
-1,5
-1,4
-1,3
1951
1955
1959
1963
1967
1971
1975
1979
1983
1987
1991
1995
1999
2003
65-74,actualEstimatedCause-specific estimation
Sweden,Male
-1,3
-1,2
-1,1
-1
-0,9
1951
195519
5919
6319
6719
71197
519
7919
83198
719
91199
519
9920
03
75-84,actualEstimatedCause-specific estimation
Sweden,Females
-3,6
-3,5
-3,4
-3,3
-3,2
-3,1
-3
-2,9
25-34,actualEstimatedCause-specific estimation
Sweden,Females
-3,2
-3,1
-3
-2,9
-2,8
-2,7
35-44,actualEstimatedCause-specific estimation
Sweden,Females
-2,5
-2,4
-2,3
-2,2
-2,1
-2
-1,9
55-64,actualEstimatedCause-specific estimation
Sweden,Females
-2
-1,9
-1,8
-1,7
-1,6
-1,5
-1,4
65-74,actualEstimatedCause-specific estimation
The time series graphics show more or less a decreasing tendency of the mortality rates, for both sexes. But when we analyze the graphs more detailed we can clearly see that the mortality rates have been higher in men than in women during all periods. We observe also that the declines in death rates among men have begun at the end of 1970s but the declines in the women mortality rates have begun already from 1950s and show a more stable decreasing tendency compared with the men. The Lee-Carter application to all-causes mortality data shows a relatively better performance but because of the trend changes in mortality the forecasts become more and more incorrect over time. We see in the graphs that the cause-specific mortality forecasts are higher than the all-cause mortality forecasts. For instance mortality caused by Cancer, Heart diseases, Suicide were more common among Swedish people before 1980s, and thereafter deaths due to these causes have begun to decrease. Since the Lee-Carter model can not take considerations to the trend changes it assumes that the trends continue to increase after 1980s. The last two graphs show us that the observed mortality rates for older females do not decrease as much as expected. It probably depends on mortality from infections and nervous system diseases has had a tendency to increase in Sweden, in this case the cause-specific mortality forecasts show a better performance than the all-cause mortality forecasts.

50
4.2 Norway
Norway,Males
-3,4
-3,2
-3
-2,8
-2,6
25-34,actualEstimatedCause-specific estimation
Norway,Males
-3
-2,8
-2,6
-2,4
1951195
5195
9196
3196
7197
1197
5197
9198
3198
7199
1199
5199
9200
3
35-44,actualEstimatedCause-specific estimation
Norway,Males
-3
-2,8
-2,6
-2,4
-2,2
-2
1951 1956 1961 1966 1971 1976 1981 1986 1991 1996 2001
45-54,actualEstimatedCause-specific estimation
Norway,Males
-2,5
-2
-1,5
55-64,actualEstimatedCause-specific estimation
Norway,Males
-1,7
-1,6
-1,5
-1,4
-1,3
-1,2
65-74,actualEstimatedCause-specific estimation
Norway,Females
-4
-3,7
-3,4
-3,1
-2,8
-2,5
25-34,actualEstimatedCause-specific estimation
Norway,Females
-2
-1,9
-1,8
-1,7
-1,6
-1,5
-1,4
65-74,actualEstimatedCause-specific estimation
Norway,Females
-1,4
-1,35
-1,3
-1,25
-1,2
-1,15
-1,1
-1,05
-1
1951
1955
1959
1963
1967
1971
1975
1979
1983
1987
1991
1995
1999
2003
75-84,actualEstimatedCause-specific estimation
Norway,Females
-3,3
-3,1
-2,9
-2,7
-2,5
-2,3
-2,1
35-44,actualEstimatedCause-specific estimation
For Norwegian males from the age group 25-34 the actual mortality rates are higher than the both forecasts, because of the strongly increases in mortality caused by infections and nervous system diseases, and in this case the curves for cause-specific estimations are closer to the observed mortality rates. Cause-specific mortality forecast for Norwegian males aged 35-44 shows an increased trend from about 1980. It depends probably on suicide has a strict increased trend until 1980s. Although the mortality caused by suicide ends to increase after 1980, the model assumes that the trend continues to increase ahead. Otherwise, the Lee-Carter forecast for mortality caused by heart diseases and accidents is higher than the observed mortality trend for the same age group. The strict increased cause-specific estimations for younger Norwegian females depend probably on the increased suicide trends after 1950s, although the trend changes have begun to become more stable after 1980s, the forecasts from the Lee-Carter model continue to increase during the whole

51
period. Generally, the mortality rates are decreasing for Norwegian females. Cause-specific forecast gives better results for the age-group 35-44 but on the other hand for the age groups 65-74 and 75-84 cause-specific forecast are worse than the all-causes mortality forecasts.
4.3 Denmark
Denmark,Males
-3,2
-3,1
-3
-2,9
-2,8
25-34,actualEstimatedCause-specific estimation
Denmark,Males
-2,5
-2,4
-2,3
-2,2
-2,1
-2
1952
1956
1960
1964
1968
1972
1976
1980
1984
1988
1992
1996
2000
2004
45-54,actualEstimatedCause-specific estimation
Denmark,Males
-1,6
-1,5
-1,4
-1,3
-1,2
65-74,actualEstimatedCause-specific estimation
Denmark,Males
-0,8
-0,75
-0,7
-0,65
-0,6
85-,,actualEstimatedCause-specific estimation
Denmark,Females
-3,5
-3,4
-3,3
-3,2
-3,1
-3
-2,9
25-34,actualEsimatedCause-specific estimation
Denmark,Females
-3
-2,95
-2,9
-2,85
-2,8
-2,75
-2,7
-2,65
-2,6
35-44,actualEsimatedCause-specific estimation
Denmark,Females
-2,15
-2,1
-2,05
-2
-1,95
-1,9
-1,85
-1,8
55-64,actualEsimatedCause-specific estimation
Denmark,Females
-1,4
-1,3
-1,2
-1,1
-1
-0,9
-0,8
75-84,actualEsimatedCause-specific estimation
Denmark,Females
-0,85
-0,8
-0,75
-0,7
-0,65
-0,6
-0,55
-0,5
85-,actualEsimatedCause-specific estimation
The graphs show that the pace of decline varies appreciable by country, age-group and over time. When we do a general comparison between Sweden, Norway and Denmark we become aware that the actual mortality rates for Danish people are a little bit higher than the mortality rates for Swedish and Norwegian people. We see in the first graph that the observed changes in mortality rates are irregular for Danish males aged 25-34. Increases in mortality from infections have the biggest effect to the total trend changes. The curves for the cause-specific estimations and observed mortality rates for the age-groups 45-54 and 65-74 are almost in opposite directions i.e. while the actual mortality rates decrease the estimated mortality rates increase over time. It depends probably on the fact that the suicides and heart diseases

52
show an increased trend until 1980s and thereafter begins to decrease. For elderly Danish males the Lee-Carter model applied to all-cause mortality data gives relatively better forecasts. Between the period 1980 and 1990 the observed mortality rates increase for elderly Danish females especially for the females aged 55-64, it depends probably on mortality from nervous system diseases, respiratory diseases and digestive system diseases has increased for this age group. For females aged 75 and above both of the Lee-Carter forecasts underestimate the future mortality rates and projections received from each model are quite similar to each other. 4.4 Finland
Finland,Males
-3,1
-3
-2,9
-2,8
-2,7
-2,6
-2,5
-2,4
25-34,actualEstimatedCause-specific estmation
Finland,Males
-2,7
-2,65
-2,6
-2,55
-2,5
-2,45
-2,4
-2,35
-2,3
-2,25
-2,2
35-44,actualEstimatedCause-specific estmation
Finland,Males
-2
-1,9
-1,8
-1,7
-1,6
-1,5
-1,4
55-64,actualEstimatedCause-specific estmation
Finland,Males
-2,3
-2,25
-2,2
-2,15
-2,1
-2,05
-2
-1,95
-1,9
-1,85
-1,8
45-54,actualEstimatedCause-specific estmation
Finland,Males
-1,2
-1,1
-1
-0,9
-0,8
-0,7
75-84,actualEstimatedCause-specific estmation
Finland,Females
-3,8
-3,6
-3,4
-3,2
-3
-2,8
-2,6
-2,4
1952
1956
1960
1964
1968
197219
7619
8019
8419
8819
9219
96200
0200
4
25-34,actualEstimatedCause-specific estimation
Finland,Females
-3,4
-3,3
-3,2
-3,1
-3
-2,9
-2,8
-2,7
-2,6
-2,5
-2,4
1952
1956
1960
1964
1968
1972
1976
1980
1984
1988
1992
1996
2000
2004
35-44,actualEstimatedCause-specific estimation
Finland,Females
-2,9
-2,8
-2,7
-2,6
-2,5
-2,4
-2,3
-2,2
1952
1956
1960
196419
6819
721976
1980198
4198
819
9219
9620
00200
4
45-54,actualEstimatedCause-specific estimation
Finland,Females
-2,4
-2,3
-2,2
-2,1
-2
-1,9
-1,8
1952
1956
1960
1964
1968
1972
1976
1980
1984
1988
1992
1996
2000
2004
55-64,actualEstimatedCause-specific estimation
In Finland, and in many other industrialized countries, heart disease mortality rates have halved recently, mainly as a result of reductions in major risk factors cholesterol, smoking, and blood pressure. These reductions in the mortality trends of the heart diseases effect the changes strongly in the total mortality rates. Mortality rates in middle aged Finnish males, in general, seem to be higher than in males from the rest of Scandinavian countries. Health authorities have attributed the high mortality rates of the middle aged Finnish male to diet, excessive use of tobacco and alcohol,

53
disruption of communities through migration, and a tradition of high-risk behaviour that is particularly marked in working-class men in eastern Finland. Finnish males from age group 25-34 have higher mortality rates than expected because of the increased trend changes in infections. Finnish females in general have lower mortality rates and higher rates of improvement in mortality rates than the females in the other Scandinavian countries. Even then, reductions in mortality rates are lower than the expected. Because of that cause-specific Lee-Carter forecasts seem to be better than the all-cause mortality forecasts for Finnish females.
4.5 Iceland
Iceland,Males
-3,4
-3,2
-3
-2,8
-2,6
-2,4
25-34,actualEstimatedCause-specific estimation
Iceland,Males
-3,4
-3,2
-3
-2,8
-2,6
-2,4
-2,2
-2
19521956
19601964
196819
721976
19801984
1988199
2199
620
002004
35-44,actualEstimatedCause-specific estimation
Iceland,Males
-2,2
-2,1
-2
-1,9
-1,8
-1,7
-1,6
55-64,actualEstimatedCause-specific estimation
Iceland,Males
-1,3
-1,2
-1,1
-1
-0,9
75-84,actualEstimatedCause-specific estimation
Iceland,Females
-3,6
-3,4
-3,2
-3
-2,8
-2,6
-2,4
-2,2
-2
35-44,actualEstimatedCause-specific estimation
Iceland,Females
-2,6
-2,4
-2,2
-2
-1,8
55-64,actualEstimatedCause-specific estimation
Iceland,Females
-2
-1,9
-1,8
-1,7
-1,6
-1,5
-1,4
65-74,actualEstimatedCause-specific estimation
Iceland,Females
-1,5
-1,4
-1,3
-1,2
-1,1
-1
75-84,actualEstimatedCause-specific estimation
Iceland,Females
-1,3
-1,2
-1,1
-1
-0,9
-0,8
-0,7
-0,6
-0,5
85-,actualEstimatedCause-specific estimation
People in the smallest Scandinavian country Iceland has the lowest mortality rates compared with the people in the rest of Scandinavia. The decreases in mortality for males have begun at the end of 1970s. Mortality rates for females have also decreased substantially, but from a lower level. Death rates for Icelandic women 75 and over, which had been high, have declined rapidly in the last few

54
years. Ischemic heart disease is the biggest killer in Iceland. According to health authorities, currently one out of four Icelandic men is a daily smoker and men have a higher risk of dying of cancer in Iceland. For mental disorders and diseases of the nervous system has increased rapidly in Iceland, faster for women than for men.
Mortality curves are quite irregular for Iceland and in general, all-cause mortality forecasts fit better to the actual mortality curves.
5. Sum of squares of residuals per age and per year
In this part of our work we will compare the sum of squares of residuals between the Lee-Carter model which we have applied to the total mortality rates and to the cause-specific mortality rates. Observe that, LC-1 curves are residuals from the Lee-Carter application to the total mortality rates and have been represented by black solid lines and LC-2 curves are residuals from Lee-Carter application to cause-specific mortality rates and have been represented by dotted lines.
Forecasting error in log death rates (actual-estimated) is averaged over forecast years, or ages. The calculations are received through the formula:
txxtxtx kbamiiiii
ˆˆˆ)ln( ,, −−=ε
The array of sum of squares of residuals per age:
∑∑
t
tx
t
tx ni
22 )()( εε L , where ix is the age group number i and t =1951…2004
The array of sum of squares of residuals per year:
∑
∑
n
i
tx
n
i
tx
i
i
2
2
)(
)(
ε
ε
M
5.1 Graphical Representation of the Lee-Carter Residual Term for males
Figure 5.1.1: Sweden & Males
Comparation between sum of squares
of residuals per age & Swedish males
0
0,1
0,2
0,3
0,4
0,5
0,6
0,7
0,8
0,9
1
Residuals from LC-1Residuals from LC-2
Comparation between sum of squares
of residuals per year & Swedish males
-0,1
0
0,1
0,2
0,3
0,4
0,5
0,6
Residuals from LC-1Residuals from LC-2

55
Figure 5.1.2: Norway & Males
Comparation between sum of
squares of residuals per age &
Norwegian males
0
0,2
0,4
0,6
0,8
1
1,2
Residuals from LC-1Residuals from LC-2
Comparation between sum of
squares of residuals per year &
Norwegian males
-0,1
0
0,1
0,2
0,3
0,4
0,5
0,6
0,7
0,8
Residuals from LC-1Residuals from LC-2
Figure 5.1.3: Denmark & Males
Comparation between sum of
squares of residuals per age &
Danish males
-0,5
-0,3
-0,1
0,1
0,3
0,5
0,7
0,9
1,1
Residuals from LC-1Residuals from LC-2
Comparation between sum of
squares of residuals per year &
Danish males
-0,2
-0,1
0
0,1
0,2
0,3
0,4
0,5
Residuals from LC-1Residuals from LC-2
Figure 5.1.4: Finland& Males
Comparation between sum of
squares of residuals per age &
Finnish males
-0,5
-0,3
-0,1
0,1
0,3
0,5
0,7
0,9
Residuals from LC-1Residuals from LC-2
Comparation between sum of squares
of residuals per year & Finnish males
-0,2
-0,1
0
0,1
0,2
0,3
0,4
Residuals from LC-1Residuals from LC-2
Figure 5.1.4: Iceland& Males
Comparation between sum of
squares of residuals per age &
Icelandic males
-0,5
0
0,5
1
1,5
2
2,5
3
Residuals from LC-1Residuals from LC-2
Comparation between sum of
squares of residuals per year &
Icelandic males
-0,2
0
0,2
0,4
0,6
0,8
1
Residuals from LC-1Residuals from LC-2

56
For Swedish males the sum of squares of residuals per age from LC-2 are higher for younger and elderly. It can depend on that the observed mortality trends from heart diseases, infectious diseases, nervous system diseases and suicides have changed a lot especially for these ages. We can see that the obtained residual estimations in these two approaches are close to each other for middle-aged Swedish males. The curve for the sum of squares of residuals per year from LC-2 increases strongly as the fitting period increases in length. For Norwegian males the sum of squares of residuals per age from both applications has almost same appearance but residuals from LC-2 are higher than the residuals from LC-1 for middle-aged Norwegian males. Since the largest mortality trend changes have occurred in middle aged Norwegian males thus the sum of squares of residuals are higher for these ages. The LC-2 curve for the sum of squares of residuals per year has a tendency to increase faster than the LC-1 curve over time. But it is noteworthy to mention that the differences between the two curves are very small.
The residuals from LC-2 for middle-aged Danish and Finnish males are high of the same reasons that we have noticed earlier for Swedish and Norwegian males. The curves to the sum of squares of residuals for Icelandic males are as expected quite irregular and we see in the last graph that the sum of squares of residuals from both applications show almost same development over time.
5.2 Graphical Representation of the Lee-Carter Residual Term for females
5.2.1: Sweden & Females
Comparation between sum of squares
of residuals per age & Swedish
females
0
0,2
0,4
0,6
0,8
1
1,2
Residuals from LC-1 Residuals from LC-2
Comparation between sum of squares
of residuals per year & Swedish
females
0
0,04
0,08
0,12
0,16
0,2
Residuals from LC-1 Residuals from LC-2
5.2.2: Norway & Females
Comparation between sum of squares
of residuals per age & Norwegian
females
-1
-0,5
0
0,5
1
1,5
Residuals from LC-1 Residuals from LC-2
Comparation between sum of squares
of residuals per year & Norwegian
females
0
0,05
0,1
0,15
0,2
0,25
0,3
0,35
0,4
Residuals from LC-1
Residuals from LC-2

57
5.2.3: Denmark & Females Comparation between sum of squares
of residuals per age & Danish females
-0,1
0,1
0,3
0,5
0,7
0,9
Residuals from LC-1 Residuals from LC-2
Comparation between sum of squares
of residuals per year & Danish females
0
0,05
0,1
0,15
0,2
0,25
Residuals from LC-1 Residuals from LC-2
5.2.4: Finland & Females
Comparation between sum of squares
of residuals per age & Finnish females
-0,1
0,1
0,3
0,5
0,7
0,9
Residuals from LC-1 Residuals from LC-2
Comparation between sum of squares
of residuals per year & Finnish females
-0,05
0
0,05
0,1
0,15
0,2
0,25
0,3
Residuals from LC-1 Residuals from LC-2
5.2.5: Iceland& Females
Comparation between sum of squares
of residuals per age & Icelandic females
-0,1
0,1
0,3
0,5
0,7
0,9
1,1
1,3
Residuals from LC-1 Residuals from LC-2
Comparation between sum of squares of
residuals per year & Icelandic females
-0,05
0
0,05
0,1
0,15
0,2
0,25
0,3
0,35
Residuals from LC-1 Residuals from LC-2
As seen in the present graphs above the general pattern of the residuals for females from different ages is not similar to the residuals for males. We have already seen in previous sections that because of the small number of deaths the Lee-Carter applications to the cause-specific data for younger females did not give us good projections. It is therefore not unexpected that the sum of squares of residuals from LC-2 is higher especially for younger females from every Scandinavian country. We could see in earlier sections that the trend changes in different mortality causes for Finnish females were weaker compared to the other Scandinavian females and therefore the LC-2 forecasts were relatively better for Finnish females. Because of this reason the sum of squares of residuals from LC-2 is lower than the residuals from LC-1. For Norwegian middle-aged females, residuals from both applications are close to zero but for males the residuals are higher especially for these age groups.

58
Apart from Norwegian elderly females, the trend changes in different mortality causes have been more stable for elderly Scandinavian females than for males and because of this reason sum of squares of residuals from LC-1 and LC-2 are almost equal to each other, for females from age groups 45 and above. Although the differences are small between residuals from both applications, LC-2 gives a little bit higher sum of squares of residuals than LC-1 for elderly females. To sum up the result we can add here that only when the trend changes in different mortality causes are stable and the data is sufficiently large then LC-1 and LC-2 gives either equally good results or LC-2 gives better results than LC-1 otherwise, LC-1 seems to give the best forecasts.

59
6. Discussion and conclusions
For the most part, different historical estimation periods of mortality rates have been used to study how the performance of Lee-Carter projections was influenced. In this master thesis we wanted to examine if it should be possible to improve the mortality forecasts for individual Scandinavian countries by considering the trend in cause specific death rates. Regarding cause specific mortality data, probabilities of dying by classification of causes and by ten-year age groups are estimated from data available in the World Health Organisation Mortality Database (www.who.int). It is noteworthy to mention that one of the difficulties in this study was to classifiy hundreds of different causes of death in ten central groups with a high precision as possible. We present our table of classifications of mortality causes in the section two. Information about the historical population size for these five countries could be found in the Human Mortality Database (www.mortality.org). The estimation period 1951-1980 was used to project in the first stage the cause-specific mortality rates and thereafter the all-causes mortality rates for 1981-2004. As presented in section three, for parameter estimating we have derived an iteration formula by using of Lagrange multipliers. The calculations have been done with the aid of spreadsheet Microsoft Excel. Generally, the health improvement is phased in over 20 years. For example, the changes in smoking behaviour in the whole of Scandinavia has contributed significantly to the decrease in mortality especially from cardiovascular (heart and arteries diseases) diseases and cancer. There are of course other factors which also lead to further mortality decline such as medical advances, better food habits and training. But factors which could work in the opposite direction such as new infectious disease HIV, increasing consumption of alcohol and drugs among young people should not be forgotten. When we analyse the graphs which include each cause of death for different age-groups in section three we see that the various cause of death by classification affect the age groups variously. For example, infectious diseases (include AIDS, malaria, and tuberculosis…) affect the middle-ages more than the other ages. On the other hand for older ages, cardiovascular disease is the leading killer. Urinary system and digestive system diseases are quite exceptional among young people however these diseases tend to increase with age. Although most of the observed trends for mortality causes have decreased, the nervous system diseases have a tendency to increase over time. The patterns are generally similar for females, although slightly lower than for males. Another thing we have observed was that the suicides among young females and males in Norway have increased dramatically over time whilst in the rest of Scandinavia the changes in trends have been more stable. According to the observed trends in all-cause mortality rates (presented in section four) the death risks have been higher in men than in women during all periods. Another difference between male and female mortality is that the declines in death rates for men have begun to occur at the end of 1970s whilst for women the declines had already begun to occur at 1950s. At the beginning of this work we had expected that we would get a bit better projections from the Lee-Carter applications to the cause-specific mortality data than the projections from the Lee-Carter to the all-cause mortality data but unfortunately the estimates became instead poorer. The result indicated that the cause-specific mortality forecasts yield higher mortality in the future than the all-cause forecasts. We believe that the reason for the overestimated mortality forecasts is some causes of death actually have increasing rates during the period 1951-1980s, although the trends begin to

60
change after this period the Lee-Carter model assumes that the trends continue to increase ahead over time. For Swedish males, mortality trends are quite stable between 1951 and 1980, on the other hand the mortality decreases drastically after 1980s. Mortality forecasts received from each Lee-Carter application quite similar to each other although the cause-specific mortality forecasts are higher than the all-cause mortality forecasts for elderly Swedish males. For Swedish females, mortality has a tendency to decrease during the whole period i.e. 1951-2004, nevertheless, among elderly Swedish females the mortality does not decrease as much as expected and cause-specific mortality forecasts match well with the actual mortality trends for females aged above 55. Norwegian males aged above 45 have an increased mortality until about 1980s, thereafter the mortality begins to decrease drastically but forecasts received from both of the Lee-Carter applications show increased mortality trends. For Norwegian females cause-specific forecasts give better results for the age-groups 25-34 and 35-44, because of mortality caused by suicide and nervous system diseases has had an increased trend over time and the total mortality has been higher than the expected mortality trends, for the age groups 25-34 and 35-44. On the other hand for the age groups 65-74 and 75-84 all-cause mortality forecasts match better with the actual mortality. For middle aged and elderly Danish males total mortality curves increase weakly until 1980. It depends probably on the fact that the suicides and heart diseases show an increased trend until 1980s. Cause-specific Lee-Carter application gives increased mortality forecasts for Danish males however; all-cause Lee-Carter application gives relatively better forecasts. Mortality from nervous system diseases, respiratory diseases and digestive system diseases has increased among elderly Danish females and the actual mortality rates are higher than both of the Lee-Carter projections. Since the trend changes are quite stable for elderly Danish females until 1980s, both of the Lee-Carter applications give projections which are quite similar to each other. For younger Finnish males, the observed mortality rates are higher than the expected; it depends probably on increased trend changes in mortality caused by infections. For younger males cause-specific mortality forecasts fit better to the actual mortality trends. Since the mortality increases more clearly, all-cause mortality forecasts give better results for elderly Finnish males. Lee-Carter applied to the cause-specific data for Finnish females gives relatively better forecasts since the trend changes for total mortality are quite stable for some age groups even then, the observed mortality is higher than the expected. Mortality curves are quite irregular for Icelandic people; nevertheless, all-cause mortality forecasts give better results than the cause-specific mortality forecasts for every age group. The forecasts produced by the Lee-Carter model in this paper, can only show us what will happen in the future if the current patterns hold. If future mortality is driven by factors we have not included or mortality changes develop in unexpected ways, our forecasts will be wrong. For example new infectious diseases can turn up and kill millions, such as HIV pandemic, the 1918 flu or the SARS 2003. Unexpected developments in medical technology can reduce the effects of a disease, as occurred with HIV treatments in the developed countries. The conclusion is that when the forecasts are incorrect it does not mean that the used model is also incorrect.

61
7. References
1. The World Health Organisation Mortality Database (www.who.int) 2. Human Mortality Database (www.mortality.org).
3. Von Bahr, Bengt (2006), ”skatta parametrarna i Lee-Carters modell för dödlighet”, DUS
4. Ronald Lee (2003), The Lee-Carter method for forecasting mortality, with various extensions
and applications.
5. Ronald D. and Lee Lawrence R. Carter (1992)
6. Federico Girosi and Gary King (2007) “Understanding the Lee-Carter Mortality Forecasting Method”.,.
7. Wikipedia, “The Free Encyclopedia” (Information about diseases can be found here).