Embed Size (px)
Citation preview

Catalyst Manufacturing: MAGGI 2-minute
Noodle wrapper project
By
LUZANNE RAUTENBACH
25106334
Submitted in partial fulfilment of the requirements for
the degree of
BACHELORS OF INDUSTRIAL ENGINEERING
In the
FACULTY OF ENGINEERING, BUILT ENVIROMENT AND
INFORMATION TECHNOLOGY
UNIVERSITY OF PRETORIA
October 2010

2
EXECUTIVE SUMMARY
The main product manufactured at Catalyst Manufacturing is MAGGI 2-minutes noodles. The
noodle line consists of 8 lines which are designed to do 40 cuts x 4 lines a minute, yielding 160
noodle cakes per minute.
Catalyst Manufacturing is currently experiencing major problems within the production line,
resulting in large overhead costs and a vast number of defective products.
2009 year-end statistics indicate an average noodle loss (noodle cake and dough) of 7.94%
against an allowed loss of 4%. Rework that could not be absorbed during 2009 amounted to
328 tons at a product value of R 3.8 million.
The nature of this project will mainly focus on the application of simulation and management
financing techniques applied in the production line at Catalyst Manufacturing.
The goal of the project is to allocate weight to each individual problem to establish the financial
overheads associated with each area. By means of this data, a variety of cost-efficient solutions
can be generated to reduce the overall losses in the system.

3
TABLE OF CONTENTS
Executive Summary ........................................................................................................ 1
Chapter 1 – Introduction.................................................................................................. 7
1. Company background....................................................................................... 7
2. Problem statement............................................................................................ 8
3. Project aim and scope .................................................................................... 10
3.1 Project aim ........................................................................................................ 10
3.2 Specific objective/scope .................................................................................... 11
3.3 Deliverables....................................................................................................... 11
Chapter 2 – Research methodology.............................................................................. 12
2.1 Research question formulation.......................................................................... 12
2.2 Research question analysis .............................................................................. 13
2.3 Research design ............................................................................................... 13
Chapter 3 – Literature study.......................................................................................... 15
1. Literature study aim ........................................................................................ 15
2. Cost benefit analysis....................................................................................... 15
3. Quality control ................................................................................................. 17
4. Mechanical design .......................................................................................... 20
5. Conclusion – Literature study.......................................................................... 23
Chapter 4 – Analysis and findings................................................................................. 24
1. Quality control ................................................................................................. 24
1.1 p Chart .............................................................................................................. 24
1.2 Stabilised p Chart .............................................................................................. 28

4
1.3 p Chart conclusion............................................................................................. 30
1.4 X-R Chart .......................................................................................................... 31
1.5 Stabilised X-R Chart.......................................................................................... 32
1.6 X-R Chart conclusion ........................................................................................ 34
1.7 Process capability ............................................................................................. 34
1.8 Process capability conclusion ........................................................................... 37
2. Cost benefit analysis....................................................................................... 39
2.1 Current situation................................................................................................ 40
2.2 Option 1............................................................................................................. 42
2.3 Option 2............................................................................................................. 44
2.3 Cost benefit analysis conclusion ....................................................................... 45
3. Conclusion ...................................................................................................... 47
References.................................................................................................................... 48
Appendices ................................................................................................................... 50
Appendix A................................................................................................................. 50
Appendix B................................................................................................................. 51
Appendix C................................................................................................................. 54
Appendix D................................................................................................................. 57
Appendix E................................................................................................................. 60

5
LIST OF TABLES
Table 1 Criteria for not being in a state of statistical control .......................................... 19
Table 2 United States patent (Patent number 4 998 528) ............................................. 20
Table 3 United States patent (Patent number 5 042 369) ............................................. 21
Table 4 Statistical data from stabilised X-R Chart ......................................................... 34
Table 5 Process capability conclusion........................................................................... 37
Table 6 Current situation: Number of defective cakes per annum................................. 40
Table 7 Current situation: Relevant costs and losses.................................................... 41
Table 8 Option 1: Number of defective cakes per annum ............................................. 42
Table 9 Option 1: Relevant costs and losses ................................................................ 43
Table 10 Option 2: Number of defective cakes per annum ........................................... 44
Table 11 Option2: Relevant costs and losses ............................................................... 45
Table 12 Statistical data - March p Chart ...................................................................... 51
Table 13 Statistical data - April p Chart ......................................................................... 52
Table 14 Statistical data - May p Chart ......................................................................... 53
Table 15 Stabilised data – March p Chart ..................................................................... 54
Table 16 Stabilised data – April p Chart ........................................................................ 55
Table 17 Stabilised data – May p Chart ........................................................................ 56
Table 18 Statistical data – X-R Chart ............................................................................ 57
Table 19 Statistical data – R Chart................................................................................ 58
Table 20 Statistical data – X Chart................................................................................ 59
Table 21 Stabilised data – R Chart................................................................................ 60
Table 22 Stabilised data – X Chart................................................................................ 61

6
LIST OF FIGURES
Figure 1 Top view of cooling unit/conveyer 1 under perfect conditions ........................... 9
Figure 2 Research methodology ................................................................................... 12
Figure 3 Research design ............................................................................................. 13
Figure 4 General format of a quality control chart ......................................................... 18
Figure 5 Side view of production line............................................................................. 22
Figure 6 Dough through cutter rolls ............................................................................... 22
Figure 7 p Chart for March ............................................................................................ 25
Figure 8 p Chart for April ............................................................................................... 26
Figure 9 p Chart for May ............................................................................................... 27
Figure 10 Stabilised p Chart for March.......................................................................... 29
Figure 11 Stabilised p Chart for April............................................................................. 29
Figure 12 Stabilised p Chart for May............................................................................. 30
Figure 13 R Chart.......................................................................................................... 31
Figure 14 X Chart .......................................................................................................... 32
Figure 15 Stabilised R Chart ......................................................................................... 33
Figure 16 Stabilised X Chart ......................................................................................... 33
Figure 17 Number of defective cakes per annum.......................................................... 46
Figure 18 Total cost per annum .................................................................................... 46
Figure 19 Flow diagram……………………………………………………………………….50

7
CHAPTER 1 – INTRODUCTION
1. COMPANY BACKGROUND
“Libstar Manufacturing Solutions was founded in 2008 to provide food manufacturing and
packaging solutions in the fast-moving consumer goods (FMCG) industry. This manufacturing
arm of the Libstar Group, Retailer Brands comprises Catalyst Manufacturing, Dickon Hall
Foods, Liqui-Pak, Montagu Foods, Retailer Brands and The Blenders.
Catalyst Manufacturing is fast becoming a key player in the food industry, thanks to blue-chip
clients such as Nestlé.
The company concentrates mainly on manufacturing instant noodles for Nestlé. It also produces
and co-packs South African brand legends such as Nescafé, Cremora Lite and Ricoffy – from
single-serve coffee, coffee creamers and tea whitener to bulk packs of hot chocolate.
Quality forms the basis of the organisation, and the on-site laboratory ensures that various tests
can be conducted effortlessly. Over and above this, the company also enjoys access to other
laboratories within the group, ensuring that quality standards are continuously met. HACCP
accreditation was completed in 2009 with ISO22000 being the objective going forward to 2010.
The company's packaging capabilities extend to various flexible pack options, such as 3- and 4-
sided sealing, plastic jars and PET containers. These containers are filled, sealed, labelled,
date-stamped, code-printed and palletised on site.” (Libstar Manufacturing Solutions [Sa])

8
2. PROBLEM STATEMENT
The main product manufactured at Catalyst is MAGGI 2-minutes noodles. The noodle line
consists of 8 lines which are designed to do 40 cuts x 4 lines a minute, yielding 160 noodle
cakes per minute.
2009 year-end statistics indicate an average noodle loss (noodle cake and dough) of 7.94%
against an allowed loss of 4%. Rework that could not be absorbed during 2009 amounted to
328 tons at a product value of R 3.8 million. The area of concern within the production line is
schematically explained by means of a flow diagram in Appendix A.
The cooling unit consists of an 8-lane conveyer. The noodle cakes are split into two 4-lanes as
they leave the cooling unit onto conveyers 2 and 3.
2.1 PROBLEM 1
The end of the cooling unit of the conveyor is step shaped. A rotating bar pushes the cakes, two
at a time, onto conveyor 1. Conveyor 1 consists of horizontal iron rods that keep the cakes in
place. Currently the rotating bars are perished and need constant maintenance. This results in 3
to 4 cakes between each horizontal rod. Conveyor 1 is narrowed before reaching conveyor 2 to
create a single cake line. The excess cakes in each slot are pressed together, which results in
portions of the cakes breaking off.

9
Figure 1 Top view of cooling unit/conveyer 1 under perfect conditions
2.2 PROBLEM 2
The two single rows of cakes are dropped onto conveyors 2 and 3. There is no instrument in
place to control the orientation of the cakes as they move to conveyors 2 and 3. This results in a
blockage at the entrance of conveyors 4 and 5 because cakes can only enter these conveyors
lengthways. Currently, placing two workers at conveyors 2 and 3 solves this problem. Workers 1
and 2 are responsible to remove broken cakes from problem 1 and to rotate cakes lengthways.

10
2.3 PROBLEM 3
Conveyors 4 and 5 move the cakes to the in-feed. The in-feed machine shoots each cake
individually onto a conveyor belt with plastic separating columns. These columns create single
slots for each cake as it moves to the sachet dispenser. The conveyor carrying the cakes in
slots moves from the in-feed to the sachet dispenser. The sachet dispenser places a flavour
sachet on top of each cake. The cakes with sachets are moved to the wrapping area. Workers 5
and 6 man the wrapping unit. Every 40 minutes the wrapper will stop for ±2 minutes to change
the foil in which the cakes are wrapped. The wrapper cannot be equipped with splicing
equipment and would therefore always cause a stoppage. The rest of the production line cannot
be stopped and is continuously producing 160 noodle cakes per minute.
3. PROJECT AIM AND SCOPE
3.1 PROJECT AIM
� Confirm that the area before the two flow-wrappers is where the most rework is
generated.
� Reduce damage to cakes after leaving the cooling unit.
� Identify the route course for the rework generation.
� Create a solution to catch cakes when the wrapper is idle.
� Create a cost-efficient solution for the overall problem.
� Establish whether the number of workers can be reduced.

11
3.2 SPECIFIC OBJECTIVE/SCOPE
The scope is constrained mainly to the area between the cooling unit and the packaging area.
The area before the two flow-wrappers will generate the most rework. Different industrial
engineering methods, as well as trial and error runs will be used to reduce damage to noodle
cakes after leaving the cooling unit.
A weight allocation will be given to each problem to establish the financial overheads associated
with each area. With this data a variety of cost-efficient solutions can be generated to reduce
the overall losses in the system.
Mechanical rework will be done on the production line with the overall goal to remove workers 1
and 2.
3.3 DELIVERABLES
The deliverables of the project will consist of the following:
� Quality control charts, firstly to identify the cause of the different problems and to
eliminate them, and, secondly, to control the improved system.
� A financial report of each problem area and possible solutions. This overview will be
used to measure all the options and so achieve the most cost-effective solution.
� Mechanical and design rework to construct physical changes to the production line.

12
CHAPTER 2 – RESEARCH METHODOLOGY
The research methodology will be following the construction shown in figure 2:
Figure 2 Research Methodology
2.1 RESEARCH QUESTION FORMULATION
Research questions help formulate the objectives of the project. Before the formulations of the
research question, Catalyst Manufacturing’s projected expectations must be taken into account.
The research question can be formulated and better understood by viewing all Catalyst’s
expectations and needs:
• How many workers can be removed from the problem area?
• Which stations produce the most defects?
• How to minimize defect?
Thus the research question:
How many workers can be removed from the most defect producing areas by minimising
defects?
13
2.2 RESEARCH QUESTION ANALYSIS
Different steps can be used to analyse the research question:
1. Reviewing similar projects that have been solved in the past, as shown in chapter
2.
2. Developing supplementary methods, tools and techniques.
3. Analysing data.
4. Developing conceptual design and solutions.
2.3 REASEARCH DESIGN
An illustration of the research design is shown in figure 3:
Figure 3 Research Design
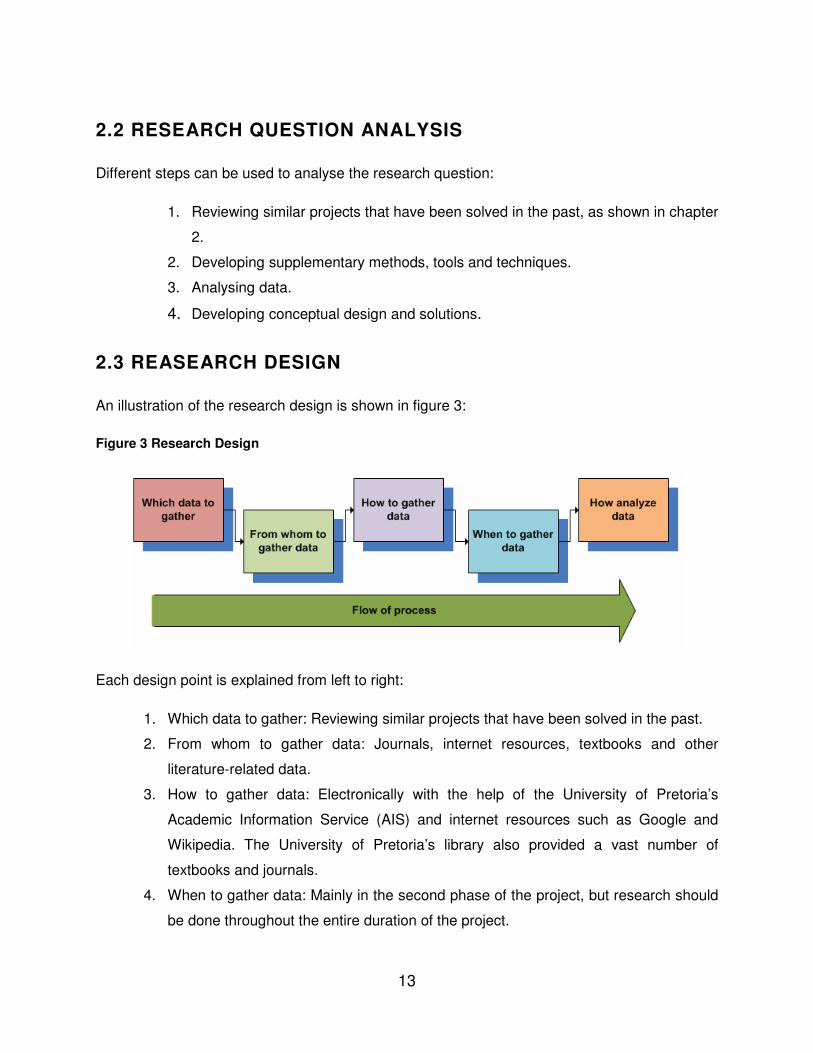
Each design point is explained from left to right:
1. Which data to gather: Reviewing similar projects that have been solved in the past.
2. From whom to gather data: Journals, internet resources, textbooks and other
literature-related data.
3. How to gather data: Electronically with the help of the University of Pretoria’s
Academic Information Service (AIS) and internet resources such as Google and
Wikipedia. The University of Pretoria’s library also provided a vast number of
textbooks and journals.
4. When to gather data: Mainly in the second phase of the project, but research should
be done throughout the entire duration of the project.

14
5. How to analyse data: Similar projects will be compared to the current problem.
Different methods and tools used in the past can also be reviewed to get a better
understanding of the task at hand.

15
CHAPTER 3 – LITERATURE STUDY
1. LITERATURE STUDY AIM
“A literature study can be defined as a systematic, comprehensive search for published material
on a specific subject” (Botha & Du Toit, 1999).
The researched information in this literature study will be used as guidelines for the
improvement and additional implementation of the MAGGI 2-minute noodle line.
The review is catorised according to the project deliverables:
• Cost-benefit analysis
• Quality control
• Mechanical design
2. COST-BENEFIT ANALYSIS
A.R. Prest and R. Turvey defines cost benefit as “...a practical way of assessing the desirability
of projects, where it is important to take a long view (in the sense of looking at repercussions in
the further, as well as the nearer, future) and a wide view (in the sense of allowing for side-
effects), i.e. it implies the enumeration and evaluation of all the relevant costs and benefits”
(A.R. Prest & R. Turvey, 1965, p.683). To clarify, the cost-benefit method is used to weigh
certain options against one another.

16
Steven Kelman (2001, p.55) view cost benefit purely as efficiently thinking about decision
making and also the course of action to be taken. He also assumes that frequent users of this
method require a more wide-ranging prescription. The prescriptions comprise the following
views:
• Only when the benefits dominate the costs should action be taken.
• In order to determine whether the benefits dominate the costs, all the benefits and costs
must be compared with each other even if they do not have an established Rand value.
• Using cost-benefit techniques, it is important to understand the extent to which data
must be gathered to undertake an effective cost-benefit study.
A.R. Prest and R. Turvey states two important preliminary considerations to be taken into
account when using the cost-benefit method:
1) Statement of the problem
“Cost-benefit analysis is a way of setting out the factors which need to be taken into
account in making certain economic choices” (A.R. Prest & R. Turvey, 1965, p.685).
These choices that have to be made consist of the maximisation and minimisation of
certain areas in the production line. Prest and Turvey states, “The aim is to maximise the
present value of all benefits less that of all costs, subject so specified constraints” (A.R.
Prest & R. Turvey, 1965, p.686). A number of questions can be asked to compose the
principles of the above discussion (A.R. Prest & R. Turvey, 1965, p.686):
1. Which costs and which benefits are to be included?
2. How are they to be valued?
3. At what interest rate are they to be discounted?
4. What are the relevant constraints?

17
2) Valuation of costs and benefits
Certain costs and benefits can be defined in monetary terms. It is important to
compensate for the expected prices of future inputs and outputs. These inputs and
outputs will have an effect on the relative price of the items involved. The general price
level will not be influenced by the future inputs and outputs.
3. QUALITY CONTROL
Quality is defined as “… a predictable degree of uniformity and dependability, at low cost and
suited to the market” (Gitlow, Oppenheim, Oppenheim & Livine, 2005, p.18).
Erwin M. Saniga (1989, p.313) states that “Statistical process control is an effective method for
improving a firm’s quality and productivity. The primary tool of statistical process control is the
statistical control chart.” According to James C. Benneyan (1998, p.69), control charts are
chronological graphs of process data that are easily interpreted.
Reasons why quality control charts are useful in a system as quoted by James C. Benneyan
(1998, p.69) are the following:
• “testing for and establishing a state of statistical control;
• monitoring an in-control process for change in process and outcome quality;
• identifying, testing and verifying process improvement opportunities.”
When designing control charts, a number of decisions have to be made. According to Erwin M.
Saniga (1989, p.313), some of these decisions include:
• sample size;
• control limit width;
• sampling frequency.

18
William H. Woodall (2000) addresses the importance of choosing the correct control chart. By
using the wrong data and the wrong chart, inaccurate system information will be generated and
serves no purpose to the firm. When using the wrong chart, the areas that are “out of control”
will remain undetected. Time will be wasted as the output of the charts will give false points that
need attention.
James C. Benneyan (1998, p.70) illustrates the construction of a control chart. Firstly, data is
collected in subgroups. A recommended subgroup size is 25. Secondly, both an upper control
limit and a lower control limit must be calculated within the limitations of the process. Thirdly,
each control chart has a centre line. This centre line measures the processes tendency to be “in
control”. In most charts the centre line is simply the mean value of the process. Figure 4 (James
C. Benneyan, 1998, p. 70) gives a general format of a quality control chart.
Figure 4 General format of a quality control chart

19
The term “out of statistical control” is explained by William H. Woodall (2000). A system is “out
of control” when the chronological plotted data points are outside the specified control limits.
Table 1 contains criteria for an “out of statistical control” process as stated by James C.
Benneyan (1998, p.70).
Table 1 Criteria for not being in a state of statistical control

20
4. MECHANICAL DESIGN
For the purpose of explaining the mechanical design of the process more clearly, patents with
similar design is reviewed.
Table 2 United States Patent (Patent number: 4,998,528)

21
Table 3 United States patent (Patent number 5,042,369)
Both designs work in exactly the same way; only the claim of each patent differs.
According to U.S. Patent number 4,988,528, first water, maize and other secret ingredients are
mixed together to form a dough. The dough goes through a multistage roll-noodle apparatus to
reach the desired thickness of the noodles. See figure 1 (2a, 2b, 3a, 3b, 6a, 6b).
Secondly, the dough goes through a pair of cutter rolls (5a, 5b) that cuts the dough into linear
strips. See figure 5.
Thirdly, the cut noodles move through a steam chamber (11) and are then cut to the correct
noodle size cake (13).
The noodles finally move through an oil fryer (12) before they are cooled down (22) and packed.

22
Figure 5 Side view of production line
Figure 6 Dough through cutter rolls

23
5. CONCLUSION – LITERATURE STUDY
The goal of the cost-benefit approach is to allocate weight to each individual problem in order to
establish the financial overheads associated with each area. With this data, a variety of cost-
effective solutions can be generated to reduce the overall losses in the system. Costs and
benefits of the different problem areas will be retrieved and weighed against one another to
identify the best solution at the lowest possible cost.
The use of simulation modelling will be helpful in constructing a model of the production line.
Modifications can be made to the model and the statistical outcome of each proposal can be
identified without interrupting the physical production line.
Quality control charts will be used to identify the “out of control” point within the production line.
These points can be investigated further to determine why Catalyst Manufacturing currently has
so many defects.

24
CHAPTER 4 – ANALYSIS AND
FINDINGS
1. QUALITY CONTROL
1.1 P CHART
A p Chart is used to analyse the number of defects. The word “defects” implies all noodle cakes
that are deformed either by the machinery or by means of material handling by workers 1 to 4.
All data used to develop these quality control charts were taken for Catalysts Manufacturing’s
database. For statistical data used, refer to Appendix B.
The data of March, April and May 2010 were chosen for the quality study. The chosen months
show a relatively stable average with a few fluctuations. These fluctuations will help in
understanding why the average noodle loss is more than the allowed loss of 4%.
Chart series explanation:
• Fraction Defective p: The fraction (cakes defective from total sample size observed) of
defects removed from the line every day.
• p: The average defectives removed from the line during the particular month.
• UCL: Upper control limit.
• LCL: Lower control limit.
• Boundary between lower A and B: Two standard deviations (error) below the centerline.
• Boundary between lower B and C: One standard deviation (error) below the centerline.
• Boundary between upper B and C: One standard deviation (error) above the centerline.
• Boundary between upper A and B: Two standard deviations (error) above the centerline.

25
Figure 7 p Chart for March
According to the March p Chart, two points are above the upper control limit and one point lies
on the boundary of the UCL. According to the criteria for not being in a state of statistical
control, as stated by James C. Benneyan in Table 1, none of the other out-of-control signals
apply to the above chart.
The graph indicates an average defect percentage of 5.32% above the allowable 4%. After
further investigation into the internal sub-division control points located at designated points in
the production line, the following conclusions regarding the three points were made:
• On day 4, a cake and dough loss of 16.95% was recorded. During day 4 Catalyst
Manufacturing had recurring power failures. At every restart point, the dough cutter rolls
(refer to figure 4) need to be realigned. This takes ± 1 minute, causing the noodle cakes
to be deformed and of uneven size.

26
• On day 8, a total loss of 18.2% was recorded. The rubber grips on the rotating bars,
which pushes the cakes on to conveyer 1 (refer to problem 1), were perished. This
resulted in 4 to 5 cakes in each slot on conveyer 1. Due to the narrowed end of the
conveyer, the access noodle cakes in each slot are pressed together which results in
parts of the cakes breaking off.
• On day 24, a cake and dough loss of 19.26% was recorded. During day 24, the wrapper
experienced a vast number of foil jams. The wrapper was stopped in between the
allocated 40 minute intervals (refer to problem 3). The rest of the production line could
not be stopped and still produced 160 noodles per minute. As a result of excessive
material handling by workers 1 to 4 capturing cakes still being produced, the noodle
cakes were deformed.
Figure 8 p Chart for April
According to the April p Chart, four points lie on the boundary of the upper control limit.
According to the criteria for not being in a state of statistical control, as stated by James C.
Benneyan in Table 1, none of the other out-of-control signals apply to the above chart.

27
The graph indicates an average defect percentage of 5.62% above the allowable 4%. After
further investigation into the internal sub-division control points located at designated points in
the production line, the following conclusions regarding the three points were made:
• As a result of the wrapper not performing optimally at points 4 and 10, a total dough and
cake loss of 17.41% and 17.53% respectively was recorded. As a result of excessive
material handling by workers 1 to 4 capturing cakes that were still being produced, the
noodle cakes were deformed.
• On day 22, a total loss of 18.03% was recorded. A rotating bar broke out of the rotating
casing, and as a result, four cakes were aligned in one horizontal slot on conveyer 1.
Due to the narrowed end of the conveyer, the access noodle cakes in each slot were
pressed together, which resulted in parts of the cakes breaking off.
• On day 25, the dough rollers were not synchronized and produced out of shape cakes.
This resulted in a total loss of 18.21%.
Figure 9 p Chart for May

28
According to the May p Chart, one point is above the upper control limit and two points lie on the
boundary of the UCL. According to the criteria for not being in a state of statistical control as
stated by James C. Benneyan in Table 1, none of the other out-of-control signals apply to the
above chart.
The graph indicates an average defect percentage of 5.46% above the allowable 4%. After
further investigation into the internal sub-division control points located at designated points in
the production line, the following conclusions regarding the three points were made:
• Similar to the previous two months, the wrapper experienced problems on day 6 and 22,
creating a total loss of 16.73% and 16.52% respectively.
• On day 10, a total dough and cake loss of 18.9% was recorded. This was a result of
abnormalities occurring in the frying unit.
1.2 STABILISED P CHART
By eliminating the out-of-control points, the number of defects will fall within the allowable
percentage. This can only be done by solving the current problems, such as the wrapper stop
intervals and the amount of material handling. It is clear that the rotating bars that push the
cakes on to conveyer 1 require continuous maintenance to prevent the current number of
defects. For stabilised data, refer to Appendix C.
Examples of a stabilised process of each month:

29
Figure 10 Stabilised p Chart for March
Figure 11 Stabilised p Chart for April

30
Figure 12 Stabilised p Chart for May
1.3 P CHART CONCLUSION
From the above statistical control charts it can be confirmed that the area before the two flow-
wrappers generates the most rework. When the wrappers are idle, the line is still producing 160
noodle cakes per minute. This causes excess material handling in order to capture the cakes.
These noodle cakes have to be placed back on to the line as soon as the wrapper is running
again.
Information from the graph and internal sub-division control points also confirms that the area
between the cooling unit and conveyer 4 and 5 (refer to APPENDIX A) are contributing to the
most defects.
The number of defects can be reduced by continuously maintaining the rotating bars that push
the cakes on to conveyer 1.
The charts also indicate that the dough rollers contribute to the total loss in the production line.
This part of the line falls outside the boundaries of the initial project scope and will be
incorporated in further findings and conclusions.

31
1.4 X-R CHART
In order to investigate the defects between the cooling unit and the wrapping area, an X-R Chart
is used. Random observations were taken from the data provided by Catalyst Manufacturing
during the period from March to May 2010. Catalyst Manufacturing requires a noodle cake
weight of 73 grams. Each set of 6 measurements makes up a subgroup. For statistical data
used, refer to Appendix D.
Figure 13 R Chart

32
Figure 14 X Chart
From these control charts it is evident that 3 point falls outside the out-of-control limits. After
further investigation, it is evident that most noodle cakes become deformed between the cooling
unit and the wrapping area. This deformation can be ascribed to the narrowing end of conveyor
1 and material handling by the workers stationed on the line. The line currently produces an
average noodle weight of 72.91 grams, which is less than the required 73 grams.
1.5 STABILISED X–R CHART
By eliminating the out-of-control points and therefore removing the greatest cause of deformed
cakes, the line would stabilise and produce an average noodle cake weight of 73.06 grams. This
can only be done by solving the problem of the narrow end at conveyor 1 and the amount of
material handling. The next figures will illustrate the stable system if it were possible to eliminate
all the points in question. For stabilised data, refer to Appendix E.

33
Figure 15 Stabilised R Chart
Figure 16 Stabilized X Chart
34
1.6 X-R CHART CONCLUSION
From the above statistical control charts it can be confirmed that the area before the two flow-
wrappers generates the most rework. When the wrappers are idle, the line is still producing 160
noodle cakes per minute. This results in an excess material handling in order to capture the
cakes. These noodle cakes have to be placed back on to the line as soon as the wrapper is
running again.
Information from the graph and internal sub-division control points also confirms that the area
between the cooling unit and conveyer 4 and 5 (refer to APPENDIX A) are contributing to the
most defects.
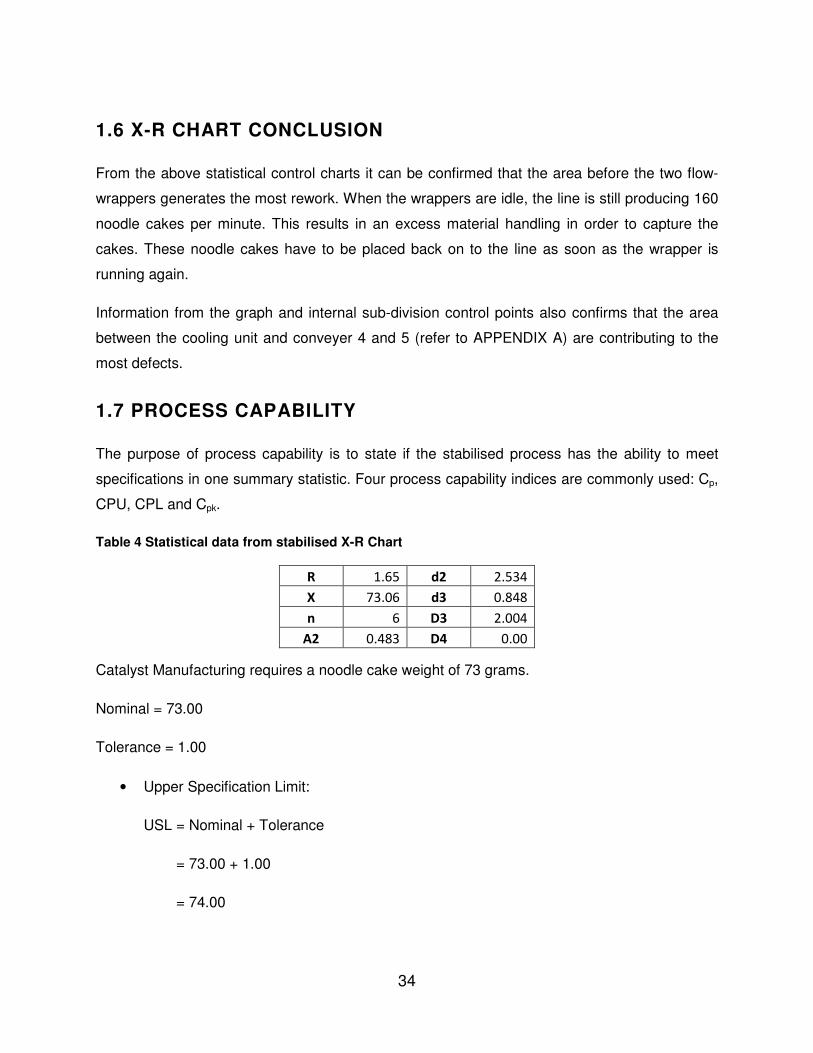
1.7 PROCESS CAPABILITY
The purpose of process capability is to state if the stabilised process has the ability to meet
specifications in one summary statistic. Four process capability indices are commonly used: Cp,
CPU, CPL and Cpk.
Table 4 Statistical data from stabilised X-R Chart
R 1.65 d2 2.534
X 73.06 d3 0.848
n 6 D3 2.004
A2 0.483 D4 0.00
Catalyst Manufacturing requires a noodle cake weight of 73 grams.
Nominal = 73.00
Tolerance = 1.00
• Upper Specification Limit:
USL = Nominal + Tolerance
= 73.00 + 1.00
= 74.00

35
• Lower Specification Limit:
LSL = Nominal – Tolerance
= 73.00 – 1.00
= 72.00
• Mean = 73.06
• Standard Deviation (σ) = R/d2
= 1.65/2.534
= 0.65
• Upper Natural Limit:
UNL = X + 3σ
= 73.06 + 3*0.65
= 75.01
• Lower Natural Limit:
LNL = X - 3σ
= 73.06 – 3*0.65
= 71.11
• The Cp index is used to summarise a process’s ability to meet two-sided specification
limits:
Cp = (USL – LSL)/(UNL – LNL)
= (74.00 – 72.00)/(75.01 – 71.11)
= 0.51

36
• The CPU is used to summarise a process’s ability to meet a one-sided upper
specification limit:
CPU = (X – LSL)/(UNL – X)
= (74.00 – 73.06)/(75.01 – 73.06)
= 0.48
• The CPL is used to summarise a process’s ability to meet a one-sided lower
specification limit:
CPL = (X – LSL)/3σ
= (73.06 – 72.00)/(3*0.65)
= 0.54
• The Cpk is used to summarise a process’s capability to meet two-sided specification
limits when the process is not centered on nominal:
Cpk = (USL – LSL)/3σ
= (74.00 – 72.00)/(3*0.65)
= 1.03

37
1.8 PROCESS CAPABILITY CONCLUSION
Table 5 Process capability conclusion
Capability
Indices
Definition Value Conclusion
Cp The ability of the process
to comply with two-sided
specification limits
0.51 The natural limits are twice as wide
as the specification limits. The
process will generate 86.64% of its
output within specification limits.
Even though the process is already
stabilized, it can still be improved. A
process capability of 1.0 indicates
that a process will generate virtually
all of its output within specification
limits.
CPU The ability of the process
to comply with one-sided
upper specification
0.48 The UNL of the process is greater
than the USL, giving a CPU of less
than one. As UNL minus USL
increases, the fraction of process
output that is out of specification will
increase geometrically.
CPL The ability of the process
to comply with one-sided
lower specification
0.54 The LNL of the process is bigger
than the LSL, giving a CPL less than
one. As LNL minus LSL increases,
the fraction of process outputs that
is out of specification will increase
geometrically.

38
Cpk The ability of the process
to comply with two-sided
specification limits when
the process in not
centered on the nominal
1.03 Catalyst Manufacturing is operating
in defect prevention mode, thus
striving for a Cpk value equal to one
or bigger than one. It can be seen
that if the out-of-control point were
to be eliminated, the process will be
capable.

39
2. COST-BENEFIT ANALYSIS
The cost-benefit analysis method is used to weigh options against one another and so achieve
the most cost-effective solution. The first step is to identify the problem areas that need to be
eliminated or reduced.
From the quality control study conducted, it is clear that the main problem areas on the
production line are at:
• Conveyors 2 and 3, as a result of excess material handling by workers 1 and 2.
• The dough rollers, which contribute to the total loss in the production line. This part of
the line falls outside the boundaries of the initial project scope and will be incorporated in
further findings and conclusions.
The first option is to remove workers 1 and 2 by mechanically redesigning conveyors 1, 2 and 3.
This redesign will control the orientation of the cakes as they move to conveyors 4 and 5, a task
currently done by workers 1 and 2. Workers 1 and 2 are also responsible for removing defective
cakes which are either deformed by the dough cutter or by the rotating bar breakdowns. The
main objective would be to determine if it would be more cost effective to reduce the workers
and only remove the defective cakes at the control point where the noodle cakes have already
been supplied with a flavour sachet and wrapped.
The second option is to stop the whole production line when the wrapper is idle. The number of
defects produced when the dough cutter is restarted will be weighed against the number of
defects due to material handling at conveyors 2 and 3 where workers 1 and 2 have to remove
cakes from the line that are still producing 160 cakes, even when the wrapper is idle.

40
2.1CURRENT SITUATION
Table 6 Current situation: Number of defective cakes per annum
Current situation
Single unit direct production cost
Noodle cake R 0.58
Sachet R 0.20
Wrapping R 0.05
Total R 0.83
Average loss percentage
Average loss (noodle cake and dough) 7.94%
Average loss due to material handling 4.92%
*Other losses 3.02%
Unit production rate current situation
Production hours/day 23
Production minutes/day 1,380
Units produced/minute 160
Maximum capacity – units/day 220,800
Maximum capacity – units/annum 80,592,000
Current loss/annum @ 7.94% of units 6,399,005
Current loss due to material handling 3,965,126
Current loss due to *other losses 2,433,878
Acceptable loss/annum @ 4% of units 3,223,680
Sale price per unit R 1.40
Contribution/unit R 0.57
*Other losses: Defective noodle cake production due to the structure of the current line. These
problem areas exceed the boundaries of the project and will remain constant throughout the
analysis.

41
Table 7 Current situation: Relevant costs and losses
Current situation
Manpower cost to man conveyor belts 2 & 3
Worker 1 (R3 500/month) x 13 R 45,500
Worker 2 (R3 500/month) x 13 R 45,500
Total direct labour cost R 91,000
Production loss
Current loss @ 7.94% R 3,711,423
Current situation total loss R 3,802,423
Currently, Catalyst Manufacturing’s statistics indicate an average noodle loss (noodle cake and
dough) of 7.94% against an allowed loss percentage of 4%. Table 6 provides a breakdown of
the total loss percentage. Excess material handling occurring at conveyers 2 and 3 contributes
to 4.92% of the total loss percentage. Table 6 also provides a single unit production cost
breakdown.
A complete production day consists of 23 hours. One hour is allocated to cleaning and shift
changes. Maximum capacity indicates the amount of noodle cakes that can be produced if no
defects occurred.
Currently, workers 1 and 2 man conveyor belts 2 and 3. Their salaries, including a thirteenth
cheque, contribute to the total variable cost and are therefore incorporated into the cost-benefit
analysis.

42
2.2 OPTION 1
Table 8 Option 1: Number of defective cakes per annum
Option 1
Single unit direct production cost
Noodle cake R 0.58
Sachet R 0.20
Wrapping R 0.05
Total R 0.83
Average loss percentage
Average loss (noodle cake and dough) 5.00%
Average loss due to material handling 1.98%
*Other losses 3.02%
Unit production rate option 1
Production hours/day 23
Production minutes/day 1,380
Units produced/minute 160
Maximum capacity – units/day 220,800
Maximum capacity – units/annum 80,592,000
Estimated loss/annum @ 5% of units 4,029,600
Estimated loss due to material handling 1,595,722
Estimated loss due to *other losses 2,433,878
Acceptable loss/annum @ 4% of units 3,223,680
*Other losses: Defective noodle cake production due to the structure of the current line. These
problem areas exceed the boundaries of the project and will remain constant throughout the
analysis.

43
Table 9 Option 1: Relevant costs and losses
Option 1
Manpower cost to man conveyor belts 2 & 3
Worker 1 (R3 500/month) x 13 R -
Worker 2 (R3 500/month) x 13 R -
Total direct labour cost R -
Additional cost for option 1
Additional cost of directional arms R 5,000
Additional wrapping lost R 201,480
Production loss
Current loss/year @ 5% of units R 2,337,168
Option 1 Total loss R 2,543,648
The first option is to remove workers 1 and 2 by mechanically redesigning the dropdown slide
after the noodle cakes leave conveyor 1. This redesign will control the orientation of the cakes
as they move to conveyors 4 and 5, which is currently done by workers 1 and 2. This will be
done by implementing a directional arm that will ensure that the cakes drop onto conveyor belts
2 and 3 at a 45° angle. An additional cost will be incurred (material cost plus labour cost) if the
rotating arm is to be implemented. By removing and replacing the workers, material handling
defects will decrease to 1.98%. Currently workers 3 and 4 are idle when the wrapper is stopped.
These workers will remove the cakes still being produced when the wrapper is stopped to refoil.
Workers 1 and 2 are also responsible for removing defective cakes which are either deformed
by the dough cutter or by the rotating bar breakdowns. If the workers are removed, the defective
cakes will only be detected at the control point where the noodle cakes have already been
supplied with a flavour sachet and wrapping. The flavour sachet will not be incorporated into the
additional cost, as workers at the control point remove the sachets from defective finished
products. The additional wrapping cost form part of the analysis, as it cannot be reused.

44
2.3 OPTION 2
Table 10 Option 2: Number of defective cakes per annum
Option 2
Average loss percentage
Average loss (noodle cake and dough) 7.94%
Average loss due to material handling 4.92%
*Other losses 3.02%
Single unit direct production cost
Noodle cake R 0.58
Sachet R 0.20
Wrapping R 0.05
Total R 0.83
Unit production rate option 2
Production hours/day 23.00
Production minutes/day 1,380.00
Units produced/minute 160.00
Maximum capacity – units/day 220,800.00
Maximum capacity – units/annum 80,592,000.00
Number of wrapper stoppages per day 34.00
Minutes per stoppage 2.00
Machine down time/day (minutes) 68.00
Units lost during down time/day 10,880.00
Units lost during plastic down time/annum 3,971,200.00
Sale price per unit 1.40
Contribution/unit 0.57
Units lost per restart 16
Units loss per day during restart 544.00
Units lost per annum during restart 198,560.00
Acceptable loss/annum @ 4% of units 3,223,680
*Other losses: Defective noodle cake production due to the structure of the current line. These
problem areas exceed the boundaries of the project and will remain constant throughout the
analysis.

45
Table 11 Option2: Relevant costs and losses
Option 2
Manpower cost to man conveyor belts 2 & 3
Worker 1 (R3 500/month) x 13 R 45,500
Worker 2 (R3 500/month) x 13 R 45,500
Total direct labour cost R 91,000
Lost contribution if stopped during wrapper downtime R -
Reduced losses if stopped during wrapper downtime R 2,303,296
Losses during restart in Rand R -115,165
Option 2 Total loss R 2,279,131
The second option is to stop the whole production line when the wrapper is idle. The wrapper
stops every 40 minutes for ± 2 minutes. If the dough cutter is stopped as well, 320 cakes will not
be produced with each stoppage. This stoppage does not contribute to the total loss as the
cakes will never be produced. Only the total number produced per day will decrease.
Each time the dough cutter is restarted, 16 cakes will be deformed. Workers 1 and 2 will remove
the defective cakes produced with each restart and control the orientation of the cakes as they
move to conveyor belts 4 and 5. Since the workers remain stationed at conveyors 2 and 3, the
same average loss percentage is used as with the current situation.
2.3 COST-BENEFIT ANALYSIS CONCLUSION
From the above analysis it can be seen that option 2 produces fewer defects than the
acceptable loss of 4%. By stopping the entire production line when the wrapper is idle, fewer
units are produced but also less deformed noodle cakes are created through material handling.
Even though the current situation is producing more cakes than option 2, the current situation
has an average loss of 7.94%. By stopping the entire production line, the number of defects
produced in the current situation will break even with the units not produced in option 2.

46
Figure 17 Number of defective cakes per annum
Option 2 indicates the lowest total cost even with workers 1 and 2 instated. It is more profitable
to produce less noodle cakes per annum with a lower defect percentage.
Figure 18 Total cost per annum

47
3. CONCLUSION
Catalyst Manufacturing is currently experiencing major problems within the production line,
resulting in large overhead costs and a vast number of defective products. The area before the
two flow-wrappers generates the most rework. When the wrappers are idle, the line is still
producing 160 noodle cakes per minute. This results in excess material handling in order to
capture the cakes. The area between the cooling unit and conveyer belts 4 and 5 (refer to
APPENDIX A) are contributing to the most defects. The dough rollers contribute to the total loss
in the production line. This part of the line falls outside the boundaries of the initial project scope
and was incorporated into the final analysis.
According to a cost benefit analysis, stopping the entire production line when the wrapper is idle
will result in fewer units produced. Moreover, fewer deformed noodle cakes will be created
through material handling. By stopping the entire production line, the number of defects
produced in the current situation will break even with the units not produced when the stoppage
occurs. It is more profitable to produce less noodle cakes per annum with a lower defect
percentage.
If Catalyst Manufacturing were to implement the cost-benefit approach, it can be seen that
workers 1 and 2 do not have to be removed, as they play an essential role in removing defect
noodle cakes before the deformed cakes are wrapped.
48
REFERENCES
• ALESSANDRO RAIMONDI, 2008. JASSS. Review of Three Books on Simulation
Modelling.
• ANDREW GREASLEY, 2004. The case for the organisational use of simulation.
Volume 15, Number 7, p. 560-566. Emerald Group Publishing Limited.
• A.R. PREST & R. TURVEY, 1965. The Economic Journal. Volume 75, Number
300, p. 683-735.
• BOTHA, W.M. & DU TOIT, P.H. 1999. Guidelines for the preparation of written
assignments. Pretoria: University of Pretoria, Academic Information Service.
• ERWIN M. SANIGA, 1989. Technometrics. Volume 31, Number 3, p. 313-320.
• FELIX T. S. CHAN, BING JIANG, 1999. Simulation-aided design of production
and assembly cells in an automotive company. P. 276-283.
• GITLOW H.S., OPPENHEIM A.J., OPPENHEIM R. & LEVINE D.M., 2005.
Quality management. p. 8. McGraw-Hill, 3rd Edition.
• JAMES C. BENNEYAN, 1998. Use and interpretation of statistical quality control
charts. Volume 10, Number 1, p. 69-73.
• LIBSTAR MANUFACTURING SOLUTIONS. [Sa]. [Online]. Available:
http://www.libstarmanufacturing.com
Accessed 15 March 2010.
• MARC I. KELLNER, RAYMOND J. MADACHY, DAVID M. RAFFO, 1999.
Software process simulation modelling: Why? What? How? P. 91-105.
• STEVEN KLEMAN, 2001. Business ethics: Critical perspectives on business and
management. p. 55.
• UNITED STATES PATENT, Jan. 29, 1991. Instant noodle and method for
manufacturing instant noodle. Patent number: 4,988,528.

49
• UNITED STATES PATENT, Aug. 27, 1991. Apparatus for manufacturing instant
noodles. Patent number: 5,042,369.
• WILLIAM H. WOODALL, 2000. Controversies and Contradictions in Statistical
Process Control. Volume 32, Number 4.
• ZAHIR IRANI, VLATKA HLUPIC, LYNNE P. BALDWIN, PETER E. D. LOVE,
2000. Re-engineering manufacturing processes through simulation modelling.
Volume 13, Number 1, p 7-13. University Press.

50
APPENDICES
APPENDIX A
Figure 19 Flow diagram
Coo
ling
Uni
tC
onve
yer 1
Con
veye
r 2
Con
veye
r 3
Wor
ker 1
Wor
ker 2
Con
veye
r 4
Con
veye
r 5
In F
eed
In F
eed
Sac
het D
ispe
nser
Sac
het D
ispe
nser
Wra
pper
Wra
pper
Pac
kagi
ng
Wor
ker 3
Wor
ker 4
Wor
ker 5
Wor
ker 6

51
APPENDIX B
Table 12 Statistical data - March p Chart

52
Table 13 Statistical data - April p Chart

53
Table 14 Statistical data – May p Chart

54
APPENDIX C
Table 15 Stabilised data – March p Chart

55
Table 16 Stabilised data – April p Chart

56
Table 17 Stabilised data – May p Chart

57
APPENDIX D
Table 18 Statistical data – X-R Chart

58
Table 19 Statistical data – R Chart

59
Table 20 Statistical data – X Chart

60
APPENDIX E
Table 21 Stabilised data – R Chart

61
Table 22 Stabilised data – X Chart


![Untitled-1 [] · CHOCOMILO; Bouillon - MAGGI CUBE, MAGGI CHICKEN, MAGGI CRAYFISH, MAGGI MIX'PY; and table water ... and marketing company](https://img.dokumen.tips/doc/110x75/5aedc9577f8b9a6625906f43/untitled-1-bouillon-maggi-cube-maggi-chicken-maggi-crayfish-maggi-mixpy.jpg)