Embed Size (px)
Citation preview

Catalina Island FerryboatCommuter Study
Los Angeles County MetropolitanTransportation Authority
Metro
Final Report
January 2006
Submitted to:
Los Angeles County Metropolitan Transportation AuthorityOne Gateway PlazaLos Angeles, CA 900 12
Submitted by:
~~APPLIED MANAGEMENT &PLANNING CROUP

Catalina Island Ferry Boat Commuter Study
Table of Contents
ExecutiveSummary ...................................................................
Introduction........................................................................................ 4
Methodology....................................................................................... 6
Findings................................................................................................ 8
The Case for Subsidizing Catalina Express ........................................................8
Operational Comparisons ................................................................................10
SurveyResults ......................................................................................................
TripPurpose .............................................................................................. 13
Trip Frequency and Duration .................................................................... 15
Perceived Value of the Ferry Service ......................................................... 16
Alternative Means of Travel ....................................................................... 16
The Ferryboat Service as a "Life Line" to Catalina Island ......................... 18
Special Populations: Workers and the Elderly .......................................... 18
Profile of Senior Travelers ......................................................................... 19
Profile of Catalina Ferryboat Users ............................................................19
Conclusions....................................................................................... 20
Appendix A: Survey Instrument with Response Frequencies
(All Respondents) ................................................................................................21
Appendix B: Survey Instrument with Response Frequencies
(Island Residents) ................................................................................................25
Appendix C: Interim Data Report .................................................................. 29
Applied Management &Planning Group i
Catalina Island Ferry Boat Commuter
Executive Summary
Background
In January 2004, the Los Angeles County Metropolitan Transportation Authority (Metro)
commissioned the Applied Management &Planning Group (AMPG) to develop a study and final
report that would assist Metro in effectively supporting its request that the Federal
Transportation Administration (FTA) and the administrators of the National Transit Database
(NTD) allow Metro to submit, and receive subsidy for, ferryboat miles subsidized by Metro
between Mainland Los Angeles County and the City of Avalon, also known as Catalina Island.
Over the past 12 years, the Los Angeles Metropolitan Transportation Authority (Metro) has
provided financial assistance to the residents of the City of Avalon, an island community located
approximately twenty-six miles off the coast of mainland Los Angeles County. Through a series
of subsidies, Metro has assisted in rehabilitating landing facilities, increasing dock capacities and
lightening the burden of travel cost for island residents and workers traveling back and forth via
Catalina Express, a local ferryboat service provider.
Based on annual transit activity reports submitted to the National Transportation Department
(NTD), the Federal Transportation Agency offers Urbanized Area Formulation Program (UAFP)
grants to transit agencies throughout the Nation. Urbanized Area Formulation Program (UAFP),
grants are designed to provide assistance to public transit agencies so that they may fund various
capital projects, plan and pay for equipment and facilities improvements and other activities
associated with the operation of mass transportation, public transportation and or transit
operations.
Currently, Metro is not allowed to report the commuter miles between Catalina Island and the
mainland, but has estimated that successful reporting of ferryboat service among the cities of San
Pedro, Long Beach and the City of Avalon will result in approximately $ I.5 million per year in
additional Federal Section 5307 capital funds to the Los Angeles County region.
Methodology
Through an intercept survey, executive interviews and a study of other ferryboat operations
throughout the country, the Applied Management &Planning group conducted a multifaceted
study of the travel patterns and needs of island residents, the legislation governing NTD
reporting and UAFP awards, and the operational characteristics of transit agencies that have
been historically awarded UAFP grant funds. Key findings from the research are presented on
the following page.
Applied Management &Planning Group 1
Catalina Island Ferry Boat Commuter Study
Findings
The NTD reporting manual used to direct the reporting of mileage and define eligible commuter
services offers conflicting indistinct definitions of commuter, commuter service and a commute.
The reporting manual offers two different guidelines for reporting ferryboat service miles that
are based upon commuter rail guidelines which state that:
More than 50 percent of the average daily ridership must travel and return on the same day.
However, the two guidelines presented for ferryboat eligibility state that:
More than 50 percent of the average daily ridership must travel on the service at least three
times a week, and;
More than SO percent o f the average daily ridership must travel on the same day
(no direction or frequency noted).
Based on results of the intercept survey, neither of the above ferryboat patronage guidelines is
met, but Metro seeks to gain recognition and reimbursement ferryboat miles based on other
significant study findings.
Use of the service as a "lifeline"
Survey results show that the service between the mainland and island is a "lifeline" service to
those who work and live on the island. Sixty-two percent of all respondents and forty-six
percent of islanders indicated that they could no longer live/work on the island if the service
were not available. In addition, ninety-three percent of those indicating that they use the service
for work stated that they felt the service was an irreplaceable lifeline, providing the only
affordable, regularly scheduled mode of travel between the island and mainland harbors.
When reviewing the travel patterns of those who use the service for work purposes, 47 percent
reported that their current trip would last more than 24 hours, indicating that there are
commuters who use the service to travel back and forth for work, but plan trips that last over
several days to save time and money.
Observance of all travel periods and clarification of reporting guidelines
The results of this survey are based on data collected during non-peak travel times for the
ferryboat service. However, if the study were expanded to include summer months, it is
estimated that commute percentages would be met based on a modified guideline that states
that more than 50 percent of the average daily ridership must travel on the same day.
Applied Management &Planning Group 2

Catalina Island Ferry Boat Corrcmuter Study
Conclusions
Although Catalina Express does not meet the 50 percent commuter rule required to receive
UAFP funds, there is a basis for exception. Catalina Express is unique in that it provides a lifeline
service to the residents and visitors traveling on and off the island for purposes of work, school,
specialized medical services, and household shopping. Unlike other agencies denied ferryboat
subsidies for failing to meet the 50 percent commuter threshold, Catalina Express offers the only
regular, affordable, weekday transportation service on and off the island.
The purpose of the UAFP grant program is to assist transit agencies in providing public
transportation, particularly to underserved areas and populations. Metro believes that by only
subsidizing services, that meet strict or varying commuter definitions, the program ignores a large
proportion of the public that relies on subsidized transportation for essential travel.
Applied Management &Planning Group 3
Catalina Island Ferry Boat Commuter Study
Introduction
The City of Avalon is the major residential and commercial area of Santa Catalina Island. Located
approximately twenty-six miles off the coast of mainland Los Angeles County, Catalina Island is a
major port of call with a strong draw for vacationers, sport fishers, scuba divers and cruise ship
visitors. With an estimated population of over 3,000 full-time residents and a fluctuating number
of construction workers, business professionals and government officials, there is a critical need
for affordable and reliable means of transportation between the Island and the mainland.
Since 1 993, the Metropolitan Transportation Authority (Metro) has subsidized Catalina Express,
a private ferryboat service providing transportation between Avalon and the communities of
Long Beach, San Pedro, and Dana Point. The Metro subsidy, which began as a $ 160,000
allotment in the early 1990's, has grown to $250,000. The funds are used to assist eligible island
residents with the purchase of commuter ticket books. Additional funding has been allocated for
capacity enhancements, rehabilitation, and maintenance of the ferry system.
The FTA allows transportation agencies to receive subsidies based on the number of commuters
identified in the annual National Transit Database (NTD) report. At present, Metro is not
allowed to include ferryboat miles from Catalina Express operations as a part of its' NTD report.
In January 2004, Metro contracted with the Applied Management &Planning Group (AMPG) to
assist Metro in providing information to the Federal Transportation Administration (FTA) to
support Metro's request to be allowed to report ferryboat miles.
Federal Requirements
Many counties and local transportation agencies are eligible for reimbursement based on the
number of individuals using their various services (ferryboat, train, bus, shuttle) for the purposes
of commuting. The subsidies are funded through the Urbanized Area Formulation Program
(UAFP), a series of federal grants designed to provide assistance to public transit agencies. The
Federal Transit Act defines these transportation operations as those which provide
transportation by bus or rail, or other conveyance, either publicly or privately owned, providing
service on a regular basis. Recipients of UAFP funds can directly operate services or contract for
all or part of the total transit service provided.
Eligibility for UAFP funds is based on guidelines set forth in the NTD annual reporting manual.'
The reporting manual, which is updated each year to reflect changes in legislation and reporting
standards, outlines the eligibility requirements for reporting, who should report, what should be
reported and how new modes of service should approach submitting for recognition.
~ 2004 National Transit Database Reporting Manual Recipients and Beneficiaries of Urbanized Area Formula Program
Grants.
Applied Management &Planning Group 4
Catalina Island Ferry Boat Commuter
According to the 2004 NTD manual, recognition of ferryboat miles and eligibility for UAFP
subsidies are determined by standards set in the commuter rail definition of "commuter
service". However, within the manual there are two disparate definitions of "commuter service"
as applied to ferryboat services and it is unclear which one should be applied when defining
commuters.
In the Basic Information Module of the manual, the rule for ferryboat states that, "Predominantly
commuter services means that for any given trip segment (i.e., distance between any two piers), more
than 50 percent of the average daily ridership travels on the ferryboat on the same day." This
wording is consistent with the commuter rail definition of predominantly commuter service, but
omits the wording "travels back and forth during the same day" which is stated in the commuter
rail definition of a commuter.
In the Glossary section of the manual, the ferryboat definition states that "Predominantly
commuter services means that for any given trip segment (i.e., distance between any two piers), more
than 50 percent of the average daily ridership travels on the ferryboat at least three times a
week. " Although all rules for ferryboat and commuter rail state that "Only the predominantly
commuter service portion of an intercity route is eligible for inclusion when determining
ferryboat (FB) (or commuter rail (CR)) route miles.", it is unclear which rule should be applied
when determining how many times a commuter must use the service. (travel on the same day,
travel back and forth during the same day, or at least three times a week).
It is not clear whether a transit service would qualify for subsidies if it meets one, but not both,
of the above criteria or why commuter rail definitions are used in ferryboat service evaluation.
Applied Management &Planning Group 5

Catalina Island Ferry Boat Commuter Study
Methodology
To identify the travel characteristics of Catalina Express passengers and to assess whether theferryboat system might qualify for UAFP subsidies, Metro contracted with AM PG to conducttwo phases of research. First, to determine the characteristics and travel patterns of ferrypassengers, and the necessity of the service for island residents, AMPG conducted aone-monthintercept survey with ferryboat passengers using the San Pedro, Long Beach and Avalon Islandports. Second, in an effort to understand the guidelines for ferryboat mile reporting and thecharacteristics of agencies currently receiving UAFP funds, AMPG conducted a series oftelephone interviews with NTD and FTA officials, and the directors/managers of ferryboatservices.
The Intercept Survey
AMPG conducted a field survey with passengers riding the Catalina Express between April 19and May 14, 2004. AMPG distributed a 22-question English/Spanish survey to passengersboarding Catalina Express at Long Beach, San Pedro and Catalina Island terminals. Over thefour-week period, AMPG staff distributed I I ,756 surveys, representing over 400 departing tripsbetween the mainland and the island. A total of 4,278 surveys were collected yielding aresponse rate of 36 percent, and an overall margin of error of ± 2 percent. A total of 778
islanders completed the survey, which accurately represents the island population within amargin of error of ± 4 percent. Both error rates exceed industry standards for robust sampling,which is a margin of error of no more than +/-5 percent. For a copy of the survey instrument,see Appendix A.
During the boarding call of each trip, Catalina Express personnel announced their participation inthe passenger survey and requested that patrons take a survey from the AMPG representative asthey boarded the vessel. Patrons were informed that they only needed to fill out the surveyonce, and, as passengers boarded each vessel, surveyors recorded the number of surveysdistributed, the number of refusals, and the number of passengers who had already completedthe survey. A "Return Survey Here" envelope was posted at the first class and coach bar areasof each vessel and passengers were asked to place completed surveys in the envelopes.Surveyors on the receiving side of each trip collected the surveys from the envelopes andcompleted a control sheet that recorded the total number of surveys returned, the numbercompleted and the number incomplete.
In an effort to inform islanders of the survey and promote participation in the study, AMPG used
a variety of outreach methods which included advertisements in the local newspaper, TheCatalina Islander, participation in the island's televised city council meeting, and a public serviceannouncement. As a supplement to the survey data being collected, Avalon's Mayor, the CityManager, and several residents were interviewed and asked to provide their perspectives on theneed for ferryboat service and the activities that require travel to and from the mainland.
Applied Management &Planning Group 6
Catalina Island Ferry Boat Commuter
Executive Interviews and Comparison Operation Reviews
AMPG reviewed the 2003 and 2004 NTD reporting manuals to reference reporting instructions,
eligibility requirements, and terminology specific to ferryboat operations. In addition to
reviewing these publications, AM PG conducted nine interviews with various NTD and FTA
officials responsible for the management of the annual report, and the operations managers from
several agencies currently receiving subsidies for ferryboat miles. Each interview explored the
agencies' operational characteristics including fleet size, reporting periods, fare structure,
ridership statistics, contract based operations, tourist activities and the availability of alternative
means of transportation for those who use the service.
Organization of This Report
The following report presents the findings from the Catalina Express passenger survey, and the
unique operating circumstances and travel needs of islanders which Metro believes qualifies the
Catalina Express ferryboat service for UAFP subsidies. The remainder of this report is organized
as follows:
• Findings, which presents an overview of the case for subsidizing the Catalina Island
ferryboat service.
• Survey Results, which presents detailed survey findings that support the case for
subsidizing the Catalina ferryboat service based on commuter travel patterns and service
needs.
• Conclusions, which presents a summary of findings and,
• Appendices, which includes a copy of the survey instruments with frequencies for
passengers overall and for Catalina residents.
Applied Management &Planning Group 7
Catalina Island Ferry Boat Commuter Study
Findings
The Case for Subsidizing Catalina Express
The purpose of the UAFP grant program is to assist transit agencies in providing public
transportation, particularly to underserved areas and populations. By only subsidizing services
that meet strict commuter definitions, the program ignores a large proportion of the public that
relies on subsidized transportation for essential travel.
As stated earlier, there are three separate criteria outlined for UAFP subsidy
More than 50 percent of the average daily ridership must travel on the service at least
three times a week, and/or;
More than 50 percent of the average daily ridership must travel and return on the same
day, and/or;
More than 50 percent of the average daily ridership must travel on the same day (no
direction or frequency noted).
By applying commuter rail standards (or portions there o~ to ferryboat miles, Metro cannot
meet the criteria for subsidy. Survey findings indicate that only 3 percent of all ferryboat
passengers ride three times a week or more, and 48 percent travel within a 24-hour period.
Although both of these data fall below the 50 percent threshold, Metro believes that the 48
percent figure would be increased to at least 50 percent by including the ridership frequency of
passengers traveling the during summer months.
The Express transports a large number of vacationers during the summer months and various
holiday periods throughout the year, but its primary purpose is to serve as a viable means of
transportation for individuals (mainly island residents and workers) who need to conduct
business between the island and the mainland. Individuals travel to and from the mainland for
work, school, medical appointments, and other necessities. More than one-in-five passengers
surveyed (22 percent) reported that their trip on Catalina Express was related to school, a
medical or dental appointment, or work. Among residents, more than half (53 percent) reported
that they were traveling for these purposes.
Based on the guidelines set forth by the Urbanized Area Formulation Program (UAFP), grants
are designed to provide assistance to public transit agencies so that they may fund various capital
projects, plan and pay for equipment and facilities improvements and other activities associated
with the operation of mass transportation, public transportation and or transit operations.
Applied Management &Planning Group 8
Catalina Island Ferry Boat Commuter Study
The Federal Transit Act defines these transportation operations as those which provide
transportation by bus or rail, or other conveyance, either publicly or privately owned, providing
to the public in general or special service on a regular and continuing basis.
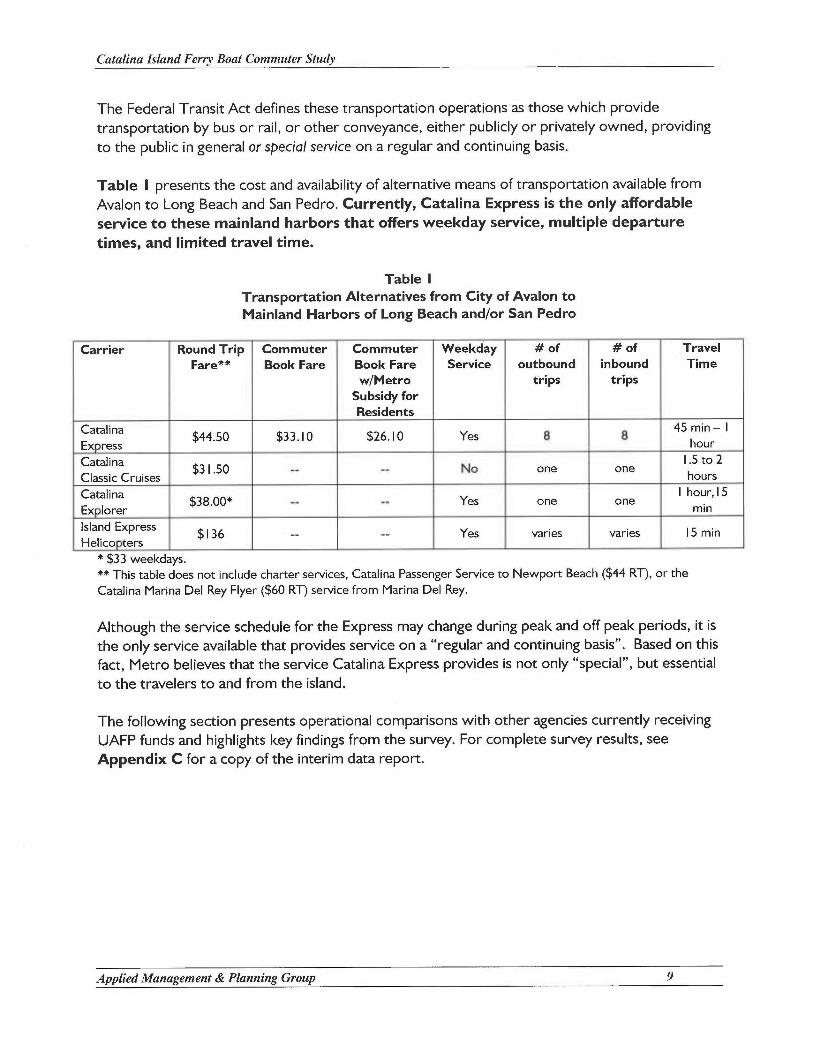
Table I presents the cost and availability of alternative means of transportation available from
Avalon to Long Beach and San Pedro. Currently, Catalina Express is the only affordable
service to these mainland harbors that offers weekday service, multiple departure
times, and limited travel time.
TableTransportation Alternatives from City of Avalon toMainland Harbors of Long Beach and/or San Pedro
Carrier Round Trip Commuter Commuter Weekday # of # of .Travel
Fare~~ Book Fare Book Fare Service outbound inbound Time
w/Metro trips trips
Subsidy forResidents
CatalinaX4.50 $33.10 $26.10 Yes $ 8
45 min —
Ex ress hour
Catalina I.5 to 2
Classic Cruises~3 I.50 -- -- No one one
hours
Catalina$38.00 -- -- Yes one one
I hour,l5
Ex lorer min
Island Express$136 -- -- Yes varies varies 15 min
Helico ters
~ $33 weekdays.~~ This table does not include charter services, Catalina Passenger Service to Newport Beach ($44 R~, or the
Catalina Marina Del Rey Flyer ($60 R~ service from Marina Del Rey.
Although the service schedule for the Express may change during peak and off peak periods, it is
the only service available that provides service on a "regular and continuing basis". Based on this
fact, Metro believes that the service Catalina Express provides is not only "special", but essential
to the travelers to and from the island.
The following section presents operational comparisons with other agencies currently receiving
UAFP funds and highlights key findings from the survey. For complete survey results, see
Appendix C for a copy of the interim data report.
Applied Management &Planning Group 9
Catalina Island Ferry Boat Commuter
Operational Comparisons
According to the annual profile reports published by the NTD over the past two years, there are
approximately fifteen municipalities that consistently report mileage, hours and expenditures
associated with the operation of ferryboat services to the NTD. Of these operations, there
have been between five and seven operations that are allowed to report ferryboat miles to the
NTD for funding under the Urbanized Area Formula Program. Due to the fluctuations in levels
of service provided, changes in operational protocol and the need for exceptions to the
minimum ridership rule due to extenuating circumstances, the number of agencies that are able
to report and receive funding from year to year varies. In an effort to identify a basis for
comparison, AMPG focused its research on the characteristics of the four ferryboat operations
that consistently receive funding from the federal government.
Based on information gathered from the 2003 NTD report, the following agencies reported
ferryboat activities. Not all reporters were eligible for inclusion according to the reporting
guidelines, but as stated earlier, all agencies are encouraged to report in order to help provide a
clear understanding of transportation and transportation needs throughout the U.S. The 2003
reporting agencies were:
• City of Alameda Ferry Services - CA
• City of Vallejo Transportation Program (Vallejo Transit, Baylink) - CA
• Golden Gate Bridge, Highway and Transportation District (GGBHTD) - CA
• Crescent City Connection Division - Louisiana Department of Transportation
(CCCD) -
• Massachusetts Bay Transportation Authority (MBTA) - MA
• Casco Bay Island Transit District (CBITD) ME
• Port Authority Trans-Hudson Corporation (PATH) — NJ
• Metro-North Commuter Railroad Company, dba: Metro Metro-North
Commuter Railroad (Metro-MNCR) — NY
• New York City Department of Transportation (NYCDOT) — NY
• Puerto Rico Ports Authority (PRPA) —Puerto Rico
• Corpus Christi Regional Transportation Authority (The B) — TX
• Transportation District Commission of Hampton Roads, dba: Hampton Roads
Transit (HRH — VA
• Kitsap Transit - WA
• Pierce County Ferry Operations (Pierce County Ferry) — WA
• Washington State Ferries (WSF) — WA
Applied Management &Planning Group 10
Catalina Island Ferry Boat Commuter Study
Of the fifteen agencies that reported in 2003, only four have been regularly awarded grant
monies under UAFP. These are:
• Golden Gate Bridge, Highway and Transportation District (GGBHTD) - CA
• Massachusetts Bay Transportation Authority (MBTA) - MA
• New York City Department of Transportation (NYCDOT) — NY
• Washington State Ferries (WSF) — WA
The following highlights some of the similarities in service and operation of these agencies and
provides an outline of the features of Catalina's ferryboat system that make the Catalina
ferryboat operations unique.
All but one of the subsidized agencies subcontracts their services. With the
exception of Washington State Ferries, which is the largest ferryboat operator of any
U.S. or U.S. territory service, all subsidized agencies contract out their ferryboat
services. The Alameda/Oakland area transportation agency allows vendors to lease
publicly owned vessels, but the operations and upkeep of the vessels are the
responsibility of the contractor. In the case of the Catalina Island ferryboat service, the
boats are owned and operated by a private carrier, Catalina Express. Metro subsidies
are given directly to commuters to off-set the cost of travel or are used to improve the
landings used by the Express.
Patrons of the ferryboat systems in each city reviewed have at least one other
regular, affordable mode of transportation. Inevery case reviewed, the ferryboat
services are by no means the only way to get back and forth between harbors, landings
or piers. Every city reviewed has an established system of bridgeways, subways, trolleys
and/or buses that travelers may choose as an alternate method of transportation to and
from destinations. This is in contrast to Catalina, where there is no other regular,
affordable, transportation alternative to Catalina Express.
• Other agencies received subsidy dollars when the use of alternate means of
travel between docking stations have become unusable. Shortly after the terrorist
attacks of 9/ I I ,one of the local New York ferryboat services was allowed to report and
receive funding from the UAFP funds due to the lack of viable transportation into the
ground zero area. The destruction caused by the fall of the buildings destroyed the
transportation passage ways and prevented the subway systems in the area from
operating properly. The lack of access to an alternate means of transportation created a
situation where the ferryboat system was the only viable means of transportation into
the area. During the time that the subway terminals into the ground zero area were not
operating, the ferryboats altered travel routes and were allowed to report ferryboat
miles based on the number of commuters who chose the ferryboats as their means of
commuting to and from the ground zero area. In the Boston Harbor area, the
Massachusetts Bay Transportation Authority was given a subsidy when construction was
Applied Management &Planning Group Il

Catalina Island Ferry Boat Commuter
being done on a major highway and the ferryboats were used as an alternate means of
transportation.
• Eligible reporting agencies have some routes that are not counted eligible that
they have been working to get included in their NTD report. Although funded for
some ferryboat operations, the New York, San Francisco and Boston area ferryboat
operations have presented routes of their ferryboat services for inclusion but have been
denied acceptance based on an NTD ruling that the ferryboat transportation must be for
"work" purposes.
These case studies suggest that the award of UAFP funds is based primarily on whether or not a
transportation service is a commuter service. As discussed earlier, based on NTD definitions of
a commuter service, Catalina Express is not eligible for federal subsidies. However, in some
cases, exceptions have been made based on limited transportation alternatives. Metro believes
that in the case of Catalina island commuters, there are limited transportation alternatives for
residents and workers and that the frequency of service provided by the Catalina express
provides a "life line" service not available through other service providers.
The following section presents selected findings from the survey effort which demonstrate that
many Catalina Express passengers depend on the ferry service for essential trips including travel
for work, school, medical or dental services, and shopping.
Applied Management &Planning Group l2
Catalina Island Ferry Boat Commuter Study
Survey Results
The sections below outline the data collected during the intercept survey portion of this study.
These data are used to offer a clear understanding of the uses and users of the Catalina Express
ferryboat service.
Trip Purpose
Respondents were asked to identify their reasons for travel on the day they were surveyed and
to identify the three primary reasons they traveled between the island and the mainland. When
asked about their reasons for traveling on the day they were surveyed:
• Twenty-six percent of islanders indicated that they were traveling for school or work.
• Fifty-four percent of residents indicated that they were traveling for medical or dental
appointments or to conduct personal business (27 percent for each category
medical/dental, personal business); and,
• Twenty-four percent indicated that they were shopping for general household or
specialty items.
Information from the total respondent population shows that:
• Thirty-one percent of all travelers surveyed over the study period (resident and non-
resident) indicated that they were traveling for reasons other than pleasure or vacation.
• Twenty-three percent of all travelers (resident and non-resident) indicated that they
were traveling for either work (I 4 percent) or personal business (9 percent).
When asked to identify the three primary reasons for travel to and from the mainland, island
residents indicated that they travel most for:
• Shopping trips (general household/specialty items) (70 percent);
• Medical or dental appointments (57 percent); and
• Personal business (56 percent).
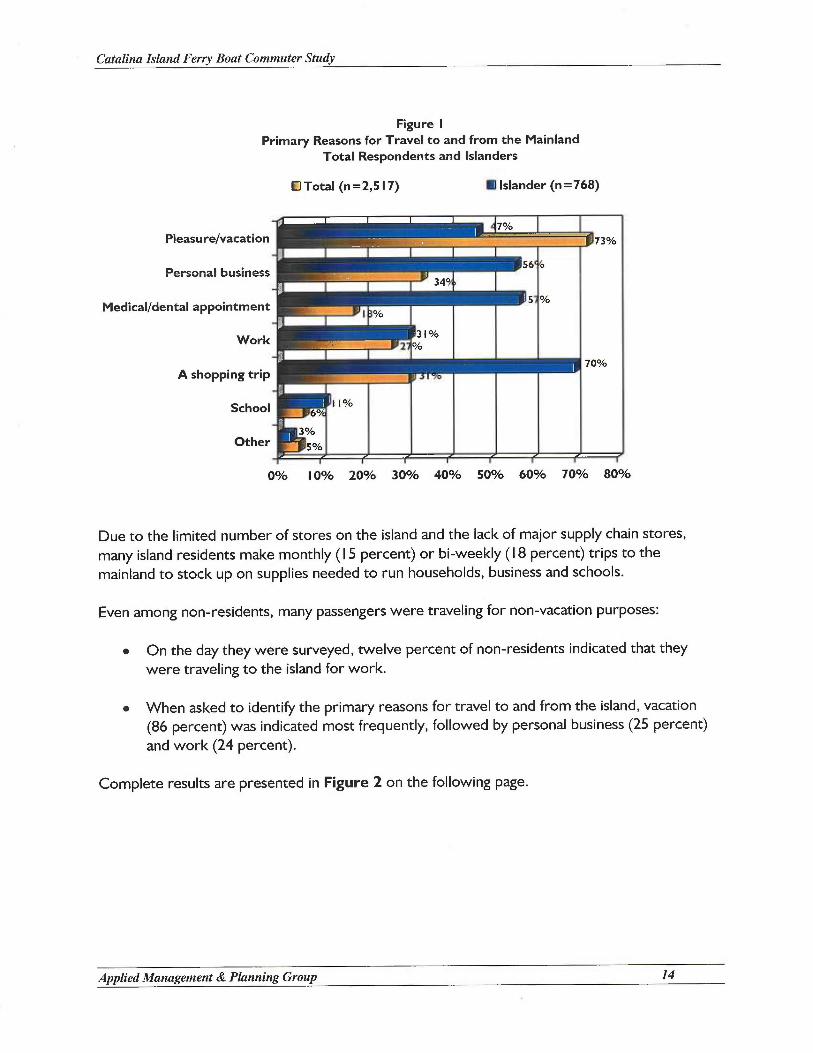
Figure I on the following page shows the primary reasons for travel to and from the mainland
for both total respondents and islanders.
Applied Management &Planning Group l3
Catalina Island Ferry Boat Commuter Study
Figure
Primary Reasons for Travel to and from the Mainland
Total Respondents and Islanders
Total (n=2,517) ~ Islander (n=768)
Pleasure/vacation
Personal business
Medical/dental appointment
Work
A shopping trip
School
Other
a~.~`::,::,. 3
31%2
II%6°/
3%
~5%
70%
0% 10% 20% 30% 40% 50% 60% 70% 80%
Due to the limited number of stores on the island and the lack of major supply chain stores,
many island residents make monthly (I 5 percent) or bi-weekly (I 8 percent) trips to the
mainland to stock up on supplies needed to run households, business and schools.
Even among non-residents, many passengers were traveling for non-vacation purposes:
• On the day they were surveyed, twelve percent of non-residents indicated that they
were traveling to the island for work.
• When asked to identify the primary reasons for travel to and from the island, vacation
(86 percent) was indicated most frequently, followed by personal business (25 percent)
and work (24 percent).
Complete results are presented in Figure 2 on the following page.
Applied Management &Planning Group 14

Catalina Island Ferry Boat Commuter Study
Figure 2Primary Reasons for Travel to and from the Mainland
Total Respondents and Mainland Residents
Total (n=2,517) ~ Mainland Resident (n=1,474)
Pleasure/vacation ~~i~~,;:,:,,,
25 /oPersonal business
3~0
Medical/dental appointment ~ oho
4°Work
2
14°A shopping trip 3 ~ oho
5°School 60
Other ~a
73%
0% 10% 20% 30% 40% 50% 60% 70% 80% 90%
Trip Frequenry and Duration
To address both the frequency of travel and the trip duration definitions outlined in the FTAglossary, passengers were asked questions regarding their frequency of travel and their length of
stay. Findings are presented below.
• Of the 2,45 I respondents to the survey who indicated that they had used the ferryboatservice at least once before, 47 percent said that they used the ferryboat service at leastonce a month.
• Of those who are residents of the island, 93 percent indicated that they used the ferry atleast once a month.
• Fifteen percent of the total respondent population (resident and non-resident) and 28percent of island residents indicated that they use the ferryboat services at least once aweek.
• Of those indicating that they use the ferry service for work purposes, 36 percentindicated that they use the service at least on a weekly basis.
• Thirty-nine percent of residents and 49 percent of those who use the ferryboat serviceto travel for work indicated that they use the service primarily on weekdays.
Applied Ma~zagement &Planning Group IS
Catalina Island Ferry Boat Commuter Study
When asked about the length of their trip on the day they were surveyed:
Forty-eight percent of the total population, and 52 percent of islanders, indicated that
the total time spent on "today's trip" would be 24 hours or less. Of those indicating that
their stay would last more than 24 hours, less than 35 percent of the total respondent
population and less than 30 percent of islanders took trips that lasted more than two to
three days.
Of those indicating that they use the ferry service for work, 47 percent indicated that
their current trip would last more than 24 hours. This indicates that there are
commuters who use the service to travel back and forth for work, but plan trips that last
over several days to save time and money.
• Of those who use the ferryboat service to travel to and from work (mainland or island
side), 23 percent indicated that they use the service at least twice a week.
Perceived Value of the Ferry Service
To identify the importance of the service to both islanders and mainlanders, and to determine
how transportation needs would be met if the service were not available, respondents were
asked to identify: (I) how they would replace the ferryboat service as a mode of transportation;
(2) if they would be able to continue to live/work on the island if the ferryboat service did not
exist; and (3) if they felt the service was an irreplaceable lifeline service between the mainland
and the island. The following sections represent the responses to each of these questions.
Alternatives Means of Travel
Respondents were asked how they would travel to and from the island if the ferry service were
not mailable. Choices included: private vehicle, helicopter, or other charter service.
Of the total population:
• Twenty seven percent indicated that they would use the helicopter service;
• Twenty-one percent indicated that they would use some other type of charter service;
and,
• Forty-two percent indicated that they would not have made the trip at all.
Applied Management &Planning Group l6
Catalina Island Ferry Boat Commuter Study
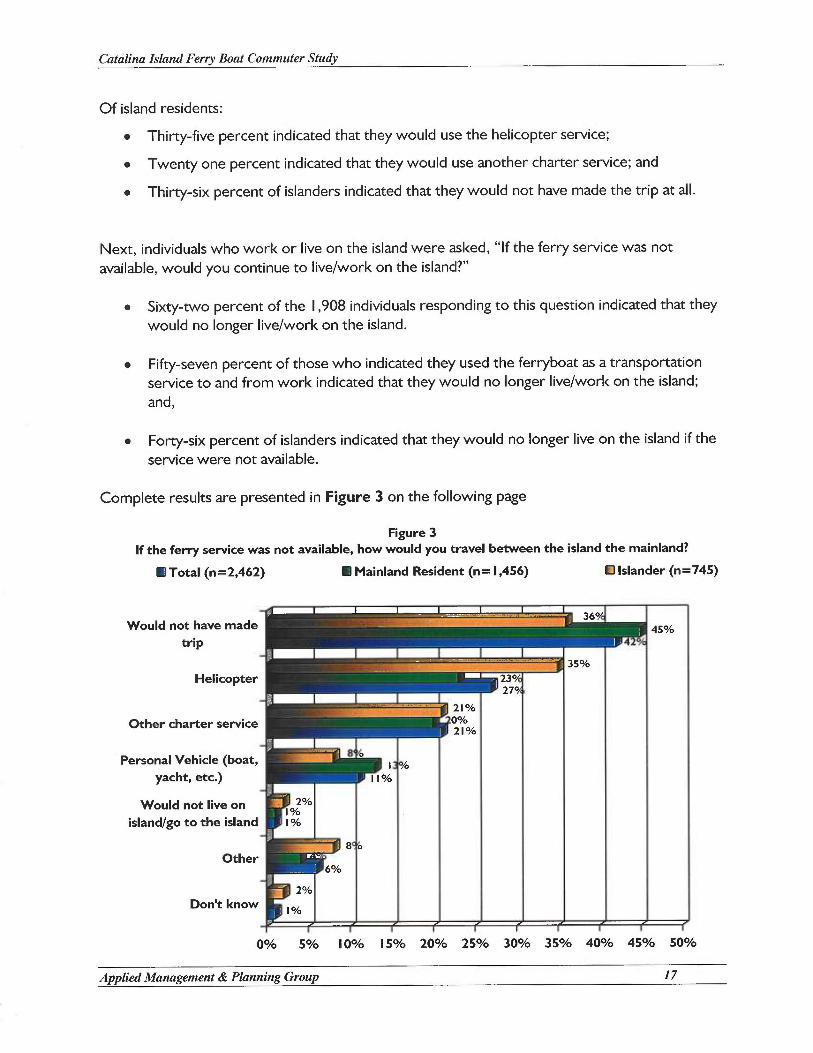
Of island residents:
• Thirty-five percent indicated that they would use the helicopter service;
• Twenty one percent indicated that they would use another charter service; and
• Thirty-six percent of islanders indicated that they would not have made the trip at all.
Next, individuals who work or live on the island were asked, "If the ferry service was not
available, would you continue to live/work on the island?"
• Sixty-two percent of the I ,908 individuals responding to this question indicated that they
would no longer live/work on the island.
• Fifty-seven percent of those who indicated they used the ferryboat as a transportation
service to and from work indicated that they would no longer live/work on the island;
and,
• Forty-six percent of islanders indicated that they would no longer live on the island if the
service were not available.
Complete results are presented in Figure 3 on the following page
Figure 3
If the ferry service was not available, how would you travel between the island the mainland?
■Total (n=2,462) ~ Mainland Resident (n=1,456) D Islander (n=745)
Would not have made
trip
Helicopter
Other charter service
Personal Vehicle (boat,
yacht, etc.)
Would not live on
island/go to the island
Other
Don't know
21%0%21%
8 0
~ /oII%
2%I%I%
80
6%
2%
I%
35%
45%
0% 5% 10% 15% 20% 25% 30% 35% 40% 45% 50%
Applied Managerraent &Planning Group 17
Catalina Island Ferry Boat Commuter Study
The Ferryboat Service as a "Life Line" to Catalina Island
Island residents often travel to the mainland to obtain goods and services not available on
Catalina. According to the Mayor of Avalon, Mayor Morrow, Catalina has limited specialty
medical care, advanced educational instruction and professional services (lawyers, accountants,
etc.). When asked: "Do you feel that the ferry service is an irreplaceable lifeline service between
the mainland and the island?" respondents reported the following:
• Ninety-three percent of the 2,383 individuals responding to this question indicated that
they felt the service was an irreplaceable lifeline service.
• Ninety-three percent of those indicating that they use the service for work indicated that
they felt the service was an irreplaceable lifeline service.
Ninety-four percent of island residents indicated that they felt the service was an
irreplaceable lifeline service.
Special Populations: Workers and the Elderly
Two populations of passengers were examined in more detail, specifically the working
population and the elderly. Key findings for these populations follow:
Profile of Working Population:
• Of those who use the ferryboat service to travel to and from work (mainland or island
side), 23 percent indicated that they use the service at least twice a week.
• Of those who use the ferryboat service to travel to and from work, 41 percent have an
annual household income of less than $50,000.
• Fifty-seven percent of workers using the ferry service to travel to and from work
indicated that they would not be able to live/work on the island without it.
• Forry-nine percent of the individuals who use the ferry as a commuter service to and
from work indicated that they primarily use the service Monday through Friday.
Applied Management &Planning Group l8
Catalina Island Ferry Boat Commuter
Profile of Senior Travelers:
• Eleven percent of individuals indicting that they lived on the island were 65 or older.
Forty-three percent indicated that they were between the ages of 45 and 64.
• Twenty-five percent of seniors indicated that they travel more than twice a month
between the island and the mainland.
• Thirty-nine percent of seniors indicated that they travel at least twice a month between
the island and the mainland.
• Thirty-six percent of respondents age 65 or older reported that they travel to and from
the island for personal business.
Profile of Catalina Ferryboat Users
The majority of ferryboat passengers are Caucasian or Latino, live on the mainland, and are 25
years or older. Of those, approximately I I percent are seniors. Most travelers have moderate
household incomes between $50,000 and $ 100,000. Only 8 percent of passengers reported a
household income $ 150,000 and 30 percent earn less than $50,000 annually.
Applied Management &Planning Group l9
Catalina Island Ferry Boat Commuter Study
Conclusions
Although Catalina Express does not meet the 50 percent commuter rule required to receiveUAFP funds, there is a basis for exception. Catalina Express is unique in that it provides a lifeline
service to the residents and visitors traveling on and off the island for purposes of work, school,specialized medical services, and household shopping. Unlike other agencies denied ferryboatsubsidies for failing to meet the 50 percent commuter threshold, Catalina Express offers the onlyregular, affordable, weekday transportation service on and off the island.
The purpose of the UAFP grant program is to assist transit agencies in providing publictransportation, particularly to underserved areas and populations. Metro believes that by onlysubsidizing services that meet strict or varying commuter definitions, the program ignores a largeproportion of the public that relies on subsidized transportation for essential travel.
Applied Management &Planning Group 20
Catalina Island Ferry Boat Commuter Study
Appendix A
Survey Instrument with Response Frequencies (All respondents)
Applied Management &Planning Group 2l
Catalina Island Ferry Boat Commuter Study
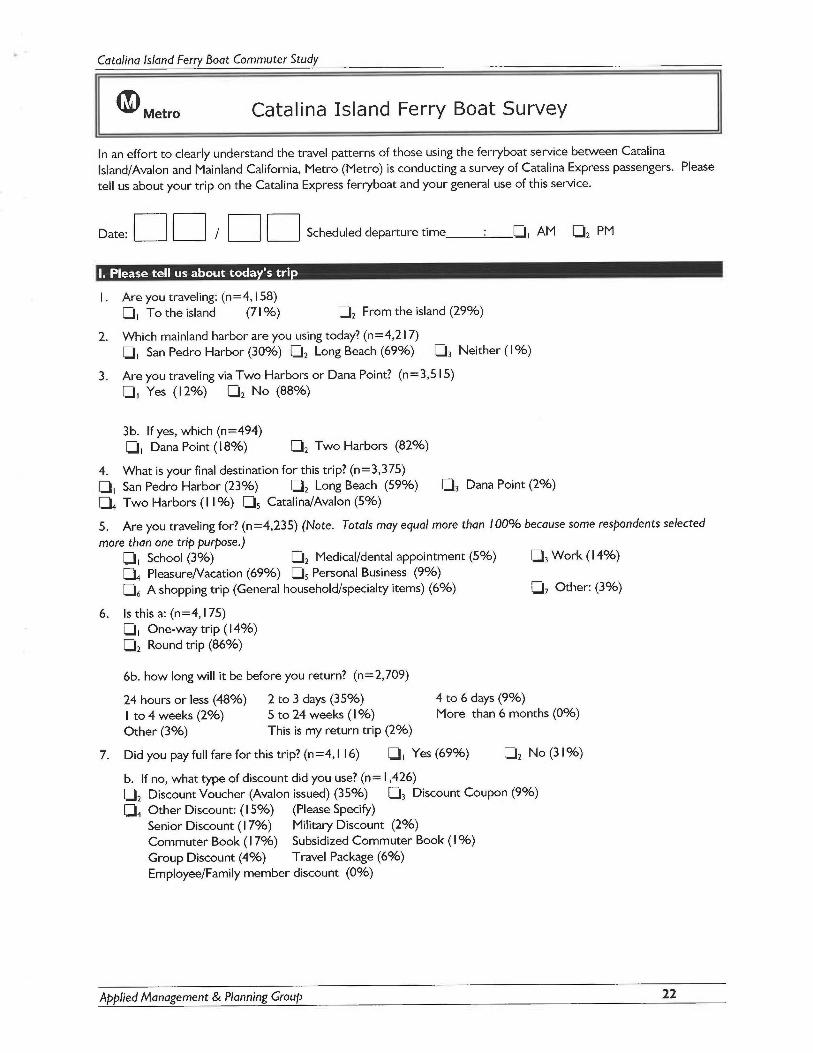
Metro Catalina Island Ferry Boat Survey
In an effort to clearly understand the travel patterns of those using the ferryboat service between Catalina
Island/Avalon and Mainland California, Metro (Metro) is conducting a survey of Catalina Express passengers. Please
tell us about your trip on the Catalina Express ferryboat and your general use of this service.
Date: ~ ~ / ~ ~ Scheduled departure time ❑i AM ❑2 PM
Are you traveling: (n=4,158)
❑i To the island (71 %) ❑2 From the island (29%)
2. Which mainland harbor are you using today? (n=4,21 ~
❑ i San Pedro Harbor (30%) ❑Z Long Beach (69%) ❑3 Neither (I %)
3. Are you traveling via Two Harbors or Dana Point? (n=3,5 15)
❑~ Yes (12%) ❑z No (88%)
3b. If yes, which (n=494)
❑i Dana Point (18%) ❑2 Two Harbors (82%)
4. What is your final destination for this trip? (n=3,375)
❑, San Pedro Harbor (23%) ❑2 Long Beach (59%) ❑3 Dana Point (2%)❑4 Two Harbors (I I%) ❑5 Catalina/Avalon (5%)
5. Are you traveling for? (n=4,235) (Note. Totals may equal more than 100% because some respondents selected
more than one trip purpose.)❑, School (3%) ❑2 Medical/dental appointment (5%) ❑3 Work (14%)❑4 Pleasure/Vacation (69%) ❑5 Personal Business (9%)❑6 A shopping trip (General household/specialty items) (6%) ❑~ Other: (3%)
6. Is this a: (n=4,175)❑ i One-way trip (I 4%)
❑2 Round trip (86%)
6b. how long will it be before you return? (n=2,709)
24 hours or less (48%) 2 to 3 days (35%) 4 to 6 days (9%)
to 4 weeks (2%) 5 to 24 weeks (I %) More than 6 months (0%)
Other (3%) This is my return trip (2%)
7. Did you pay full fare for this trip? (n=4, I 16) ❑i Yes (69%) ❑Z No (3 I %)
b. If no, what type of discount did you use? (n= I ,426)
❑2 Discount Voucher (Avalon issued) (35%) ❑3 Discount Coupon (9%)❑4 Other Discount: (I 5%) (Please Specify)
Senior Discount (17%) Military Discount (2%)
Commuter Book (17%) Subsidized Commuter Book (I %)
Group Discount (4%) Travel Package (6%)
Employee/Family member discount (0%)
Applied Management &Planning Group 22
Catalina Island Ferry Boat Commuter Study
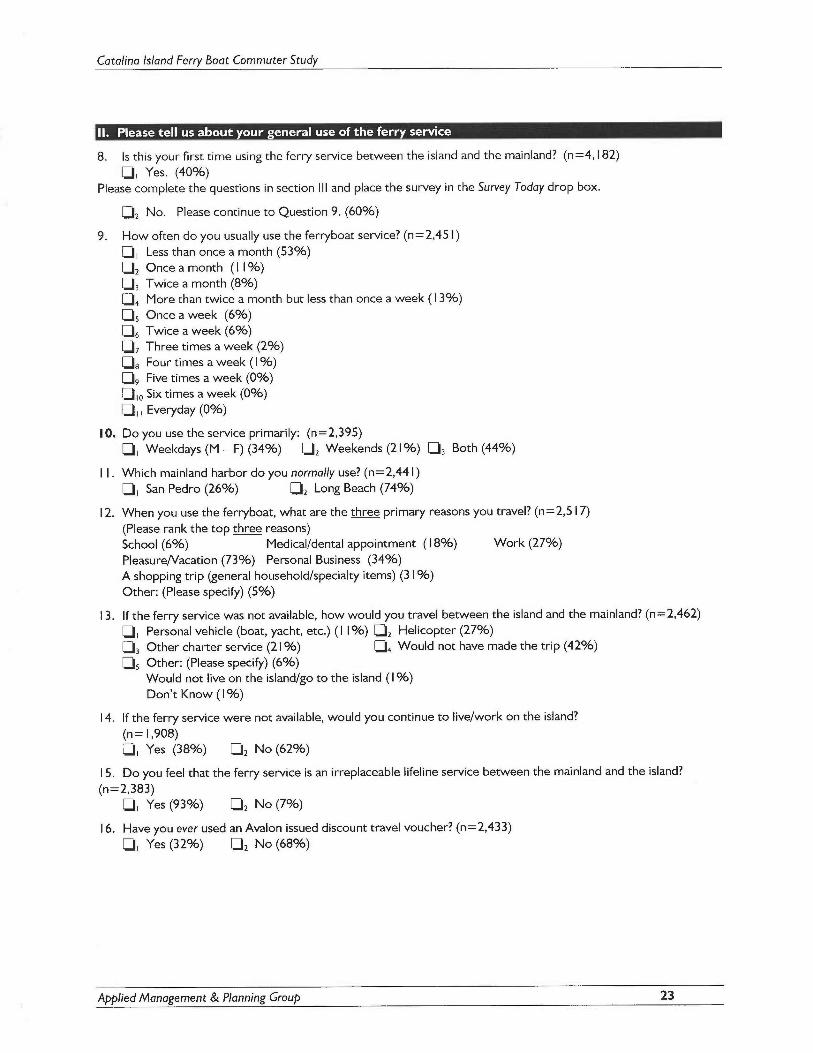
8. Is this your first time using the ferry service between the island and the mainland? (n=4, 182)
❑i Yes. (40%)Please complete the questions in section III and place the survey in the Survey Today drop box.
❑2 No. Please continue to Question 9. (60%)
How often do you usually use the ferryboat service? (n=2,451)
❑i Less than once a month (53%)❑Z Once a month (I I %)❑3 Twice a month (8%)❑4 More than twice a month but less than once a week (I 3%)❑5 Once a week (6%)❑6 Twice a week (6%)❑~ Three times a week (2%)❑e Four times a week (I %)❑9 Five times a week (0%)❑,o Six times a week (0%)❑ii Everyday (0%)
10. Do you use the service primarily: (n=2,395)
❑i Weekdays (M — F) (34%) ❑2 Weekends (21 %) ❑3 Both (44%)
. Which mainland harbor do you normally use? (n=2,441)
❑i San Pedro (26%) ❑z Long Beach (74%)
2. When you use the ferryboat, what are the three primary reasons you travel? (n=2,517)
(Please rank the top three reasons)School (6%) Medical/dental appointment (I 8%) Work (27%)
PleasureNacation (73%) Personal Business (34%)
A shopping trip (general household/specialty items) (3 I %)
Other: (Please specify) (5%)
3. If the ferry service was not available, how would you travel between the island and the mainland? (n=2,462)
❑i Personal vehicle (boat, yacht, etc.) (I I %) ❑2 Helicopter (27%)❑3 Other charter service (21 %) ❑4 Would not have made the trip (42%)❑5 Other: (Please specify) (6%)
Would not live on the island/go to the island (I %)
Don't Know (I %)
14. If the ferry service were not available, would you continue to live/work on the island?
(n = I ,908)❑i Yes (38%) ❑Z No (62%)
5. Do you feel that the ferry service is an irreplaceable lifeline service between the mainland and the island?
(n=2,383)❑, Yes (93%) ❑Z No (7%)
6. Have you ever used an Avalon issued discount travel voucher? (n=2,433)
❑i Yes (32%) ❑Z No (68%)
Applied Management &Planning Group 23
Catalina Island Ferry Boat Commuter Study
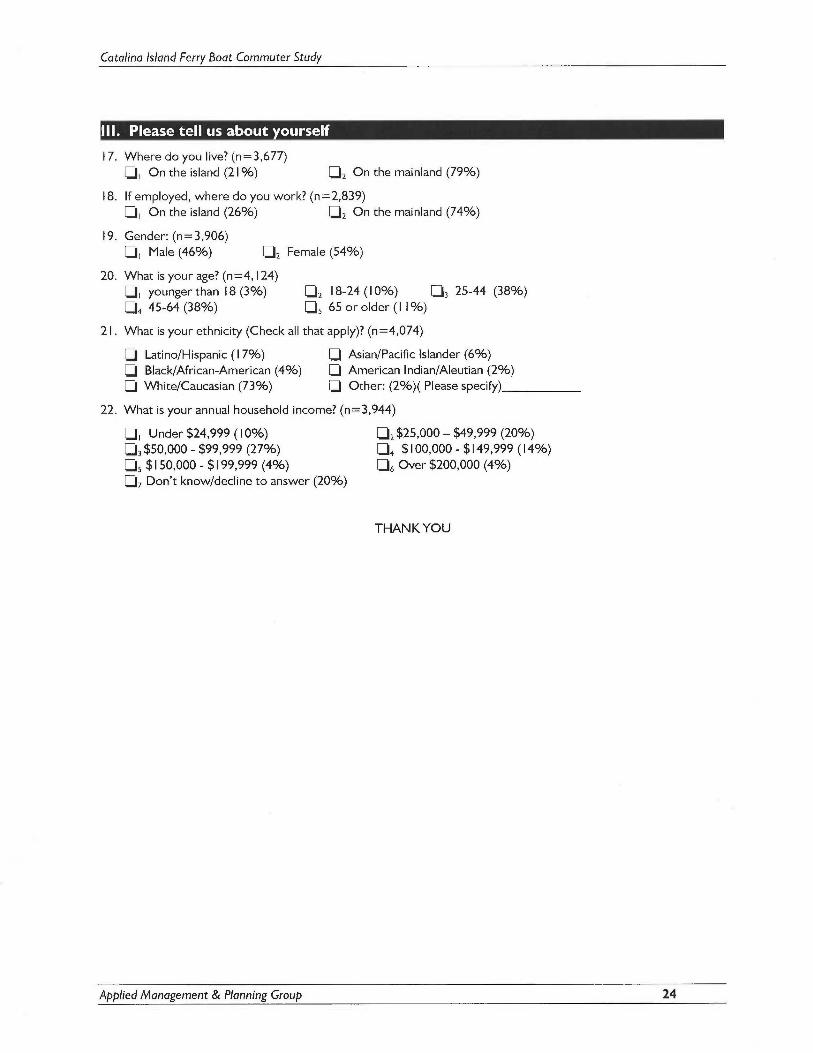
17. Where do you live? (n=3,677)❑i On the island (21 %) ❑z On the mainland (79%)
18. If employed, where do you work? (n=2,839)❑i On the island (26%) ❑z On the mainland (74%)
19. Gender: (n=3,906)❑i Male (46%) ❑z Female (54%)
20. What is your age? (n=4, 124)❑i younger than 18 (3%) ❑z 18-24 (I 0%) ❑3 25-44 (38%)❑4 45-64 (38%) ❑5 65 or older (I I %)
21. What is your ethnicity (Check all that apply)? (n=4,074)
❑ Latino/Hispanic (17%) ❑Asian/Pacific Islander (6%)❑ Black/African-American (4%) ❑American Indian/Aleutian (2%)❑ White/Caucasian (73%) ❑Other: (2%)( Please specify)
22. What is your annual household income? (n=3,944)
❑i Under $24,999 (10%) ❑2 $25,000 — $49,999 (20%)❑3 $50,000 - $99,999 (27%) ❑4 $ 100,000 - $149,999 (14%)❑5 $ 1 50,000 - $ 199,999 (4%) ❑6 Over $200,000 (4%)❑~ Don't know/decline to answer (20%)
THANK YOU
Applied Management &Planning Group 24
Catalina Island Ferry Boat Commuter Study
Metro Catalina Island Ferry Boat Survey
In an effort to clearly understand the travel patterns of those using the ferryboat service between Catalina
Island/Avalon and Mainland California, Metro (Metro) is conducting a survey of Catalina Express passengers. Please
tell us about your trip on the Catalina Express ferryboat and your general use of this service.
Date: ~ ~ ~ L~I ~ Scheduled departure time ❑, AM ❑2 PM
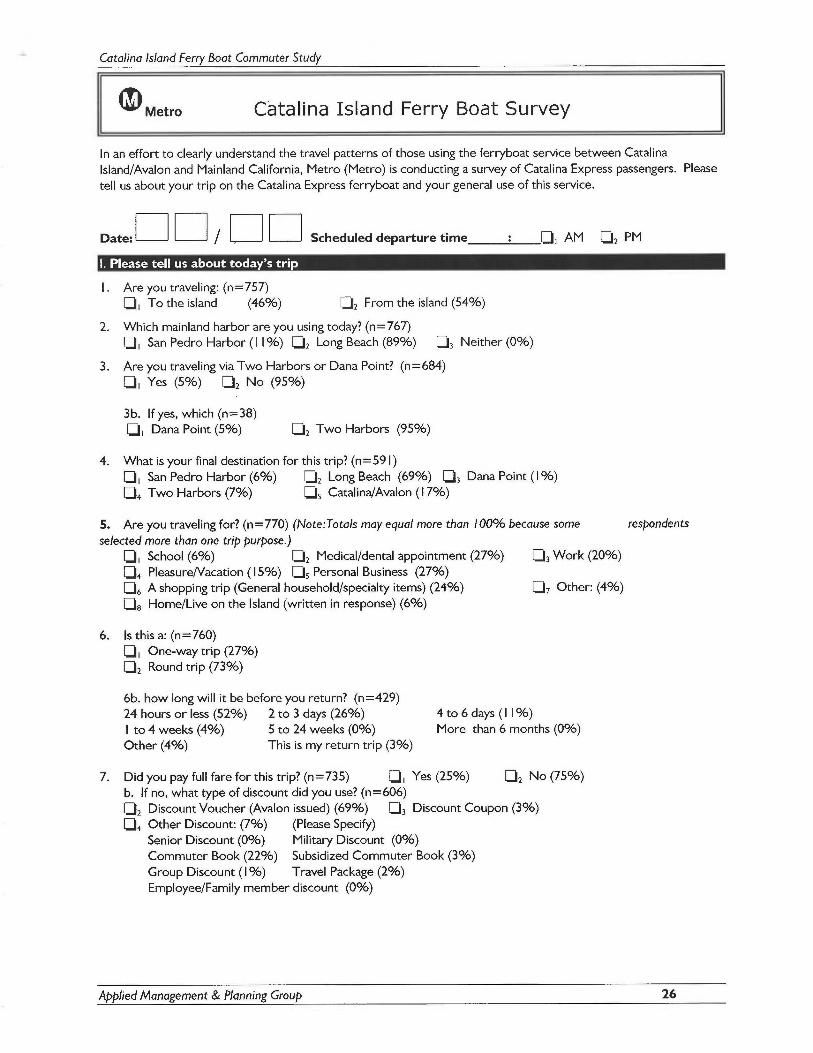
Are you traveling: (n=75~❑i To the island (46%) ❑2 From the island (54%)
2. Which mainland harbor are you using today? (n=76~❑i San Pedro Harbor (I I%) ❑2 Long Beach (89%) ❑3 Neither (0%)
3. Are you traveling via Two Harbors or Dana Point? (n=684)❑i Yes (5%) ❑2 No (95%)
3b. If yes, which (n=38)❑~ Dana Point (5%) ❑z Two Harbors (95%)
4. What is your final destination for this trip? (n=591)
❑, San Pedro Harbor (6%) ❑Z Long Beach (69%) ❑3 Dana Point (I %)❑4 Two Harbors (7%) ❑5 Catalina/Avalon (17%)
5. Are you traveling for? (n=770) (Note:Totals may equal more than 100% because some respondents
selected more than one trig purpose.)❑i School (6%) ❑2 Medical/dental appointment (27%) ❑3 Work (20%)❑4 PleasureNacation (15%) ❑5 Personal Business (27%)❑6 A shopping trip (General household/specialty items) (24%) ❑~ Other: (4%)❑8 Home/Live on the Island (written in response) (6%)
6. Is this a: (n=760)❑i One-way trip (27%)❑2 Round trip (73%)
6b. how long will it be before you return? (n=429)
24 hours or less (52%) 2 to 3 days (26%) 4 to 6 days (I I %)
to 4 weeks (4%) 5 to 24 weeks (0%) More than 6 months (0%)
Other (4%) This is my return trip (3%)
7. Did you pay full fare for this trip? (n=735) ❑i Yes (25%) ❑2 No (75%)b. If no, what type of discount did you use? (n=606)❑2 Discount Voucher (Avalon issued) (69%) ❑3 Discount Coupon (3%)❑4 Other Discount: (7%) (Please Specify)
Senior Discount (0%) Military Discount (0%)Commuter Book (22%) Subsidized Commuter Book (3%)
Group Discount (I%) Travel Package (2%)Employee/Family member discount (0%)
Applied Management &Planning Group 26

Catalina Island Ferry Boat Commuter
17. Where do you live? (n=788)
❑i On the island (100%) ❑z On the mainland (0%)
18. If employed, where do you work? (n=664)
❑i On the island (97%) ❑z On the mainland (3%)
19. Gender: (n=766)❑i Male (47%) ❑Z Female (53%)
20. What is your age? (n=774)
❑i younger than 18 (6%) ❑z 18-24 (10%) ❑3 25-44 (30%)❑4 45-64 (43%) ❑5 65 or older (I I %)
21. What is your ethnicity (Check all that apply)? (n=765)
❑ Latino/Hispanic (24%) ❑Asian/Pacific Islander (3%)❑ Black/African-American (I %) ❑American Indian/Aleutian (2%)❑ White/Caucasian (75%) ❑Other: (I %)( Please specify)
22. What is your annual household income? (n=759)
❑i Under $24,999 (18%) ❑z $25,000 — $49,999 (28%)❑3 $50,000 - $99,999 (23%) ❑4 $ 100,000 - $149,999 (I 0%)❑5 $ 150,000 - $ 199,999 (3%) ❑6 Over $200,000 (2%)❑~ Don't know/decline to answer (I 6%)
THANK YOU
Applied Management &Planning Group 28

Catalina Island Ferryboat CommuterStudy
Los Angeles County MetropolitanTransportation Authority
Metro
Statistical Analysis and Data Collection
Interim Project Report
Submitted to:
Los Angeles County Metropolitan Transportation AuthorityOne Gateway PlazaLos Angeles, CA 900 12
Submitted by:
APPLIES MANAGEMENT 8 PLANNIN(; GROUT'
Catalina Island Ferryboat Commuter Study —Data Analysis
TABLE OF CONTENTS
EXECUTIVE SUMMARY .........................................................................ii
KeyFindings .........................................................................................iii
FerryboatUse ......................................................................................iii
Reasons for Use ...................................................................................iii
Value of the Ferry Service ....................................................................iv
Profile of Senior Ferryboat Users ........................................................v
Profile of Ferryboat Users ...................................................................v
.INTRODUCTION ...............................................................................
The Catalina Island MTA Ferryboat Subsidy Program .....................
II. METHODOLOGY ...............................................................................4
III. FINDINGS ...........................................................................................6
Purposes for Tra~el .........................................................................6
TravelFrequency .............................................................................8
TripDurations ..................................................................................9
PaymentMethod ..............................................................................10
Alternatives Means of Travel ............................................................10
Profile of Working Population ..........................................................12
Profile of Senior Tra~elers ..............................................................12
Respondent Profile - Overall ............................................................13
Respondent Profile - Islanders .........................................................14
IV. CONCLUSIONS ................................................................................15
Acknowledgements..................................................................................16
AppendixA ...............................................................................................17
Survey Instrument with Response Frequencies (All respondents)
AppendixB ...............................................................................................21
Survey Instrument with Response Frequencies (Island Residents)
Applied Management &Planning Group i
Catalina Island Ferryboat Commuter Study —Data Analysis
EXECUTIVE SUMMARY
This report presents findings from the data collection portion of a two-part study
and position advocacy campaign commissioned by the Los Angeles Metropolitan
Transportation Authority (MTA). The purpose of the study is to identify and
report on the commuter transportation activities of individuals using the ferry
services to travel between Mainland Los Angeles County and the City of Avalon,
also known as Catalina Island.
The ferry service that provides transportation to and from Catalina Island is
operated under the authority of the City of Avalon by a private ferryboat
operating company -- the Catalina Express and is the only affordable mode of
travel for the island residents and the communities of the two mainland harbors,
San Pedro and Long Beach. MTA subsidizes the operations of the ferry service
through a user subsidy program and has provided funding for the rehabilitation,
maintenance and upkeep of the ferry terminal.
MTA contracted with the Applied Management &Planning Group (AMPG) to
assist the MTA in developing a final report that will present a strong, statistically
case to the Federal Transit Administration (FTA's) as to why it should approve
the inclusion of the ferry miles of Catalina Express as a part of MTA's National
Transit Database (NTD) report. MTA has estimated that successful reporting of
ferryboat service among the cities of San Pedro, Long Beach and City of Avalon
will result in approximately $1.5 million per year in additional Federal Section
5307 capital funds to the Los Angeles County region.
As a result of the intercept survey data presented in this report and operational and
funding comparisons of data from six other ferryboat operations throughout the
U.S. and U.S. territories that will follow, AMPG will outline the unique
characteristics of the Catalina Island ferryboat service, its users and the
similarities and distinct differences when comparing the Catalina Island service to
other NTD reporters.
A total of 11,756 surveys were distributed to passengers riding the Catalina
Express ferryboat over afour-week period between April 19, and May 14, 2004.
A total of 4,278 surveys were collected, giving a margin of error ~ 2 percent at
the 95 percent confidence level.
This executive summary highlights key findings for each of the sections of the
Final Report.
Applied Management &Planning Group ii

~`My roommate goesto UC Long Beach
ferry two or three
Catalina Island Ferryboat Commuter Study —Data Analysis
Key Findings
Ferryboat Use
• One-third of island residents (32 percent) indicate that they use theferryboat service more than twice a month but less than once a week.
Nearly three-quarters of all respondents (74 percent) reported using theLong Beach terminal as their normal mainland travel point. Ninetypercent of respondents who indicated that they lived on the island reportedthat they use Long Beach harbor as their primary mainland service port.
Reasons for Use
When asked about their current trip, 67 percent of all respondentsindicated that they were traveling for pleasure or vacation. Fourteenpercent said that they were traveling for work, while nine percent said thatthey were traveling for personal business.
• Of those who indicated that they lived on the island, the primary reasonsfor their current trip was to conduct personal business (27 percent), for a
medical or dental appointment (27 percent), to shop for general householdor specialty items (24 percent), or for work (20 percent).
Island residents surveyed reported that they primarily use the ferryboat service for
the following three reasons:
• Shopping for household or specialty items (70 percent);
• Medical and/or dental appointments (57 percent); and,
• To conduct personal business on the mainland (56 percent)
• Among all respondents, the three primary reasons indicated for use of the
ferryboat at any time were for pleasure or vacation (73 percent), to
conduct personal business (34 percent), and shopping (31 percent).
• Twenty-seven percent of all respondents indicated that they travel to andfrom the island for work, while six percent of the total respondentpopulation travels to and from the island for school.
• Eighteen percent of the total population indicated that they used theferryboat service for medical and/or dental appointments.
Applied Management &Planning Group iii
Catalina Island Ferryboat Commuter Study —Data Analysis
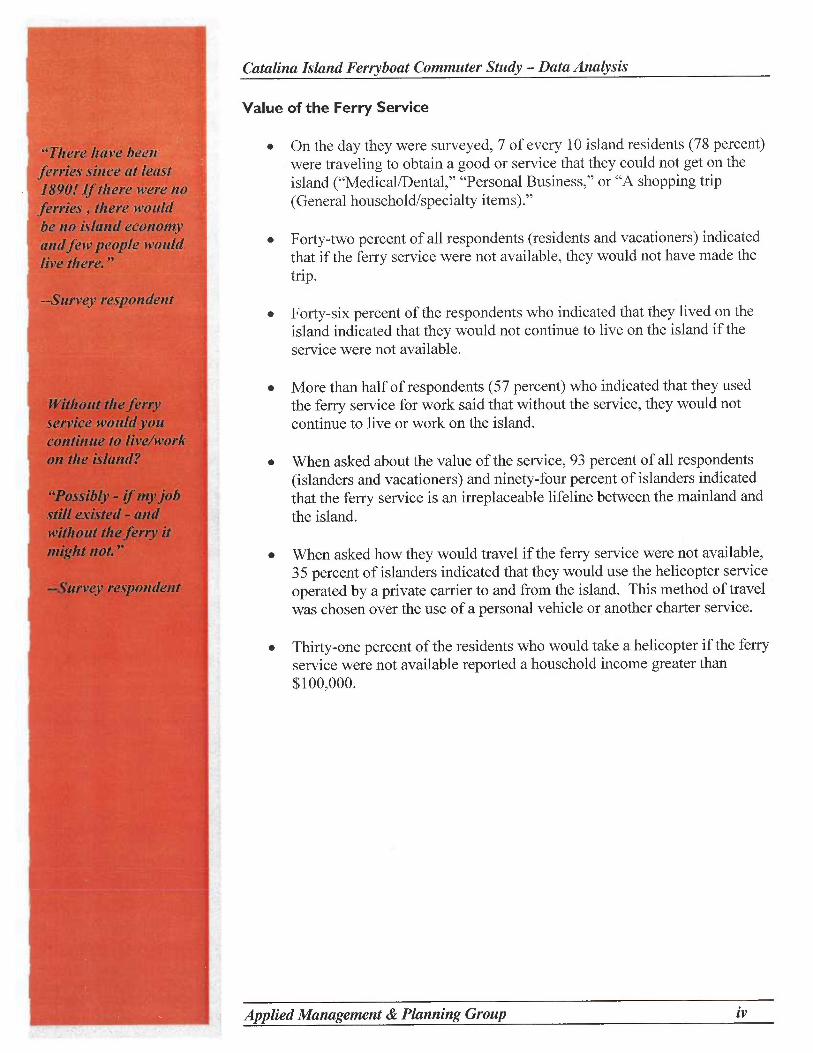
Value of the Ferry Service
"There have been i • On the day they were surveyed, 7 of every 10 island residents (78 percent)
ferries since at least - were traveling to obtain a good or service that they could not get on the
1890! If there were no island ("Medical/Dental," "Personal Business," or "A shopping trip
ferries ,there would (General household/specialty items)."
be no island economyand few people would • Forty-two percent of all respondents (residents and vacationers) indicated
live there. " that if the ferry service were not available, they would not have made the
trip.
--Survey respondent• Forty-six percent of the respondents who indicated that they lived on the
island indicated that they would not continue to live on the island if the
service were not available.
• More than half of respondents (57 percent) who indicated that they usedWithout tlae ferry` ..
'-the ferry service for work said that without the service, they would not
service would you continue to live or work on the island.continue to live/workon the island? • When asked about the value of the service, 93 percent of all respondents
(islanders and vacationers) and ninety-four percent of islanders indicated"Possibly - if my job that the ferry service is an irreplaceable lifeline between the mainland andstill existed - ar~d the island.without the ferry itmight not. " . When asked how they would travel if the ferry service were not available,
35 percent of islanders indicated that they would use the helicopter service--Survey respondent operated by a private carrier to and from the island. This method of travel
was chosen over the use of a personal vehicle or another charter service.
• Thirty-one percent of the residents who would take a helicopter if the ferry
service were not available reported a household income greater than$100,000.
Applied Management &Planning Group iv
Catalina Island Ferryboat Commuter Study —Data Analysis
Profile of Senior Ferryboat Users
• Eleven percent of all island resident respondents indicated that they were
65 or older.
Twelve percent of seniors indicated that they were traveling for medical ordental reasons.
• Over half of all seniors (51 percent) indicated that if the service did notexist, they would no longer be able to live/work on the island.
Profile of Ferryboat Users
• Twenty six percent of respondents who were employed indicated that theywork on the island.
• Seventy-six percent of all respondents (38 percent equally) fell into theage categories of 25-44 or 45-64.
• Seventy-three percent of all respondents identified themselves asWhite/Caucasian while 17% of all respondents identified themselves asLatino/Hispanic. Of the 765 island residents who indicated ethnicity, 75percent identified themselves as White/Caucasian, and 24 percent asLatino/Hispanic. White/Caucasian and Latino/Hispanic are the twolargest ethnically represented group residing on the island.
Additional findings, including detailed frequencies, are provided in the full report.
Applied Management &Planning Group v
individual who liveson the island nine outof twelve calendar ;months.-- Cily ofAvalon
Catalina Island Ferryboat Commuter Study —Data Analysis
1. INTRODUCTION
The City of Avalon is the major residential and commercial area of Santa CatalinaIsland. Located approximately twenty-six miles off the coast of the mainland LosAngeles County, Catalina Island is a major port of call with a strong draw forvacationers, sport fishers, scuba divers and cruise ship visitors. With an estimatedpopulation of 3,300 full-time residents and a fluctuating number of constructionworkers, business professionals and government officials, there is a major needfor a steady, affordable, and reliable means of transportation between the islandand the mainland.
Island access is limited to sea vessels and aircraft and, since the early 1900's, theferry service between the mainland and the island has been the only affordablemode of travel for island residents and the communities of two the mainlandharbors, San Pedro and Long Beach. As a part of county, state, local and federalfunding programs, the Los Angeles County Metropolitan TransportationAuthority (MTA) provides funding for transit needs to Catalina Island. Currently,these funds address the transportation needs in both the incorporated andunincorporated areas of Avalon and are used to subsidize ferry service, roadimprovements and other transportation activities on the island.
The Catalina Island MTA Ferryboat Subsidy Program
As a courtesy to mainlanders and islanders who frequently use the ferryboatservice for travel, Catalina Express offers a commuter book, with ten one-waytickets for a cost of $165.00 per book which equates to a cost of $16.55 fora one-way trip, a 34 percent savings from the normal one-way trip cost of $22.25.Through an annual MTA subsidy of $250,000, the City of Avalon is able to offeran additional discount of $35.00 per commuter book to residents of the island toease the cost of travel for individuals who may need to conduct business on themainland or obtain services that are not readily available on the island.(i.e. doctors' visits, estate planning, personal shopping etc.). The reduced fareprogram allows eligible residents to purchase a ten trip commuter book for$130.50 which equates to $13.05 per trip, a 70 percent savings off of the cost of aregular one-way ticket and a 27 percent discount off of the regular commuterbook price per trip. This $35.00 discount is calculated by adding a $10.00discount given by Catalina Express to the $25.00 discount given by the City ofAvalon through the MTA subsidy. Any member of a commuter's immediatefamily may use the book as long as he/she is identified as a valid traveler on thecommuter book.
Applied Management &Planning Group 1
Catalina Island Ferryboat Commuter Study —Data Analysis
It is important to note that the $10.00 discount from Catalina Express can only begiven to residents who are eligible for the City of Avalon discount. ~
Although the Catalina Express ferryboat service transports a large number ofvacationers during the summer months and various holiday periods throughout theyear, its primary purpose is to serve as a viable means of transportation forindividuals (mainly island residents and workers) needing to conduct businessbetween the island and the mainland. Due to the limited number of readilyavailable services on the island, at times it is imperative for islanders to go to themainland.
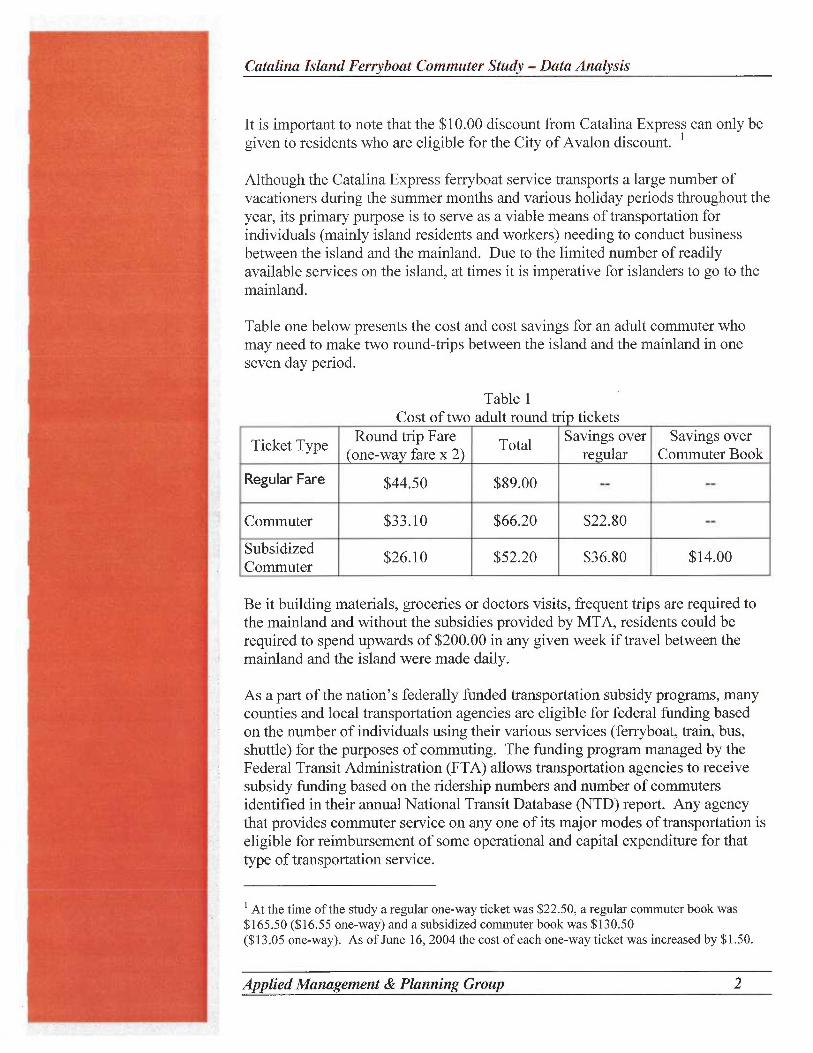
Table one below presents the cost and cost savings for an adult commuter whomay need to make two round-trips between the island and the mainland in oneseven day period.
Table 1Cost of two adult round trip tickets
Ticket TypeRound trip Fare
TotalSavings over Savings over
(one-way fare x 2) regular Commuter Book
Regular Fare $44.50 $89.00 -- --
Commuter $33.10 $66.20 $22.80 --
Subsidized$26.10 $52.20 $36.80 $14.00
Commuter
Be it building materials, groceries or doctors visits, frequent trips are required tothe mainland and without the subsidies provided by MTA, residents could berequired to spend upwards of $200.00 in any given week if travel between themainland and the island were made daily.
As a part of the nation's federally funded transportation subsidy programs, manycounties and local transportation agencies are eligible for federal funding basedon the number of individuals using their various services (ferryboat, train, bus,shuttle) for the purposes of commuting. The funding program managed by theFederal Transit Administration (FTA) allows transportation agencies to receivesubsidy funding based on the ridership numbers and number of commutersidentified in their annual National Transit Database (NTD) report. Any agencythat provides commuter service on any one of its major modes of transportation iseligible for reimbursement of some operational and capital expenditure for thattype of transportation service.
' At the time of the study a regular one-way ticket was $22.50, a regular commuter book was$165.50 ($16.55 one-way) and a subsidized commuter book was $130.50($13.05 one-way). As of June 16, 2004 the cost of each one-way ticket was increased by $1.50.
Applied Management &Planning Group 2
MTA believes that the '~~commuting patternsof many Avalonresidents andemployees aresignificantly differentthan those ofeommuter railpatrons. They are,nonetheless,commuters, with avital need for thetransportationprovided by theCatalina Carrier.:
-- Statement of workfrom MTA's NTDreporting of ferry ~#
Catalina Island Ferryboat Commuter Study —Data Analysis
The FTA's definition of "commuter" varies by the method of transportationprovided. Presently the definition used to identify ferryboat commuters is thesame as the one outlined for commuter rail services.
Fifty percent or more of the daily average ridership must travel on theservice at least three times a week.
In the past, MTA has attempted to gain allowance for the ferryboat miles itsubsidizes on the Catalina Express. Although the ridership does not meet the 50percent or more requirement outlined by the FTA, MTA believes that theindividuals who utilize the ferryboat service for day to day lifeline necessities areyet commuters with a "vital need for the transportation provided by the CatalinaCarrier."
At present there are five major metropolitan areas within the United States thatoperate and include ferryboat miles in their NTD reports. Through research, theApplied Management &Planning Group (AMPG) has been able to identify someunique qualities about Catalina commuters that make their travel patterns andneeds distinctly different from any of these six systems and/or any commuter railpassengers in the nation. Due to the location, population, business climate andservice needs of residents of the island, it is obvious that Catalina Expresscommuters will not meet the 50 percent service rule, but it is the objective of thisstudy to provide the FTA with strong, statistically supported information that willcompel a change in the ferryboat commuter rule or an exception for MTA in thecase of Catalina Island commuter miles.
The data presented in this report represent the first phase of a detailed studygeared toward identifying the differences and similarities in commuters and theservices provided by agencies currently being allowed to report ferryboat miles.By identifying the service needs of Catalina Island commuters and the effects ofthe current ferryboat services on their daily lives, AMPG intends to develop andpresent valid case points to be used in an attempt to convince the FTA to a11owMTA to report the ferryboat miles in its annual NTD report.
Applied Management &Planning Group 3

Catalina Island Ferryboat Commuter Study —Data Analysis
11. METHODOLOGY
Between April 19, 2004 and May 14, 2004, AMPG distributed a 22-questionEnglish/Spanish survey to passengers boarding Catalina Express vessels leavingthe Long Beach, San Pedro and Catalina Island Terminals. Over the four-weekperiod, AMPG staff distributed 11,756 surveys, representing over 400 departingtrips between the mainland and the island. A total of 4,278 surveys werecollected overall yielding a margin of error of f 2 percent.
In an effort to increase islander participation in the study, AMPG used a variety ofoutreach methods. Three advertisements were published in the island newspaper,The Catalina Islander. The first advertisement ran the week before the studybegan informing islanders of the study, the importance of participation and thetime period for the study. The second notice was published mid-way through theproject to remind islanders of the study and to encourage them to visit the docksand complete a survey if they found that they would not be traveling during thesurvey period. Individuals who visited the docks to complete a survey were askedto complete sections two and three only, which asked questions about theirgeneral use of the ferry service and their demographic information. The thirdadvertisement announced the final week of surveying and presented a finalrequest for all islanders to complete a survey either on their trip or at the docks inorder to garner a clear understanding of islander travel patterns and ferryboatservice needs.
In addition to the published advertisements, AMPG participated in a monthly-televised city council meeting and explained the purpose of the study, theimportance of islander participation and the locations where individuals couldcomplete the survey. A public service announcement (PSA) was also developedfrom an interview with the project manager that aired throughout the surveyadministration period. Overall, 778 islanders completed the survey, whichaccurately represents the island population within a margin of error of ~ 4 percent.
In order to inform passengers of the survey, Catalina Express personnelannounced their participation in the passenger survey during the boarding callsand requested that patrons take a survey from the AMPG representative as theyboarded the vessel. Patrons were informed that they only needed to fill out thesurvey once, and, as passengers boarded each vessel, surveyors recorded thenumber of surveys distributed, the number of refusals and the number ofpassengers who had already completed the survey. A "Return Survey Here"envelope was posted at the first class and coach bar areas of each vessel andpassengers were asked to place completed surveys in the envelopes. Surveyors onthe receiving side of each trip collected the surveys from the envelopes andcompleted a control sheet that recorded the total number of surveys returned, thenumber completed and the number incomplete.
Applied Management &Planning Group 4
Residents of tinySanta Catalina Islan _ave ~ tough choice:ake...Tlzey can
ze staged by friendstd neighbors at thetly supermarket inwn, or cYOSS thejean to shop on the
Catalina Island Ferryboat Commuter Study —Data Analysis
As a supplement to the survey data being collected, Avalon's Mayor, the City
Manager, and several residents were interviewed and provided perspective on the
reasons for ferryboat use, the statistical impacts of strikes, work stoppages and
other factors that affect islanders being able to conduct day-to-day activities that
require travel to and from the mainland.
In his interview, the Mayor noted that the major reasons for travel to and from the
island are for purposes of obtaining goods and services not available on the island.
He noted that services and needs that are not available on the island, such as
specialty medical care, advanced educational instruction and professional services
(lawyers, accountants, etc.) often force residents to travel to the mainland two to
three times a week.
Conversations with other city officials and residents highlighted how the recent
grocery strike forced islanders who would not cross the picket lines to take the
ferryboat to the mainland and not only shop for themselves, but fulfill grocery
orders for friends and relatives who were refusing to cross the picket lines on the
island.
Applied Management &Planning Group 5
Catalina Island Ferryboat Commuter Study —Data Analysis
111. FINDINGS
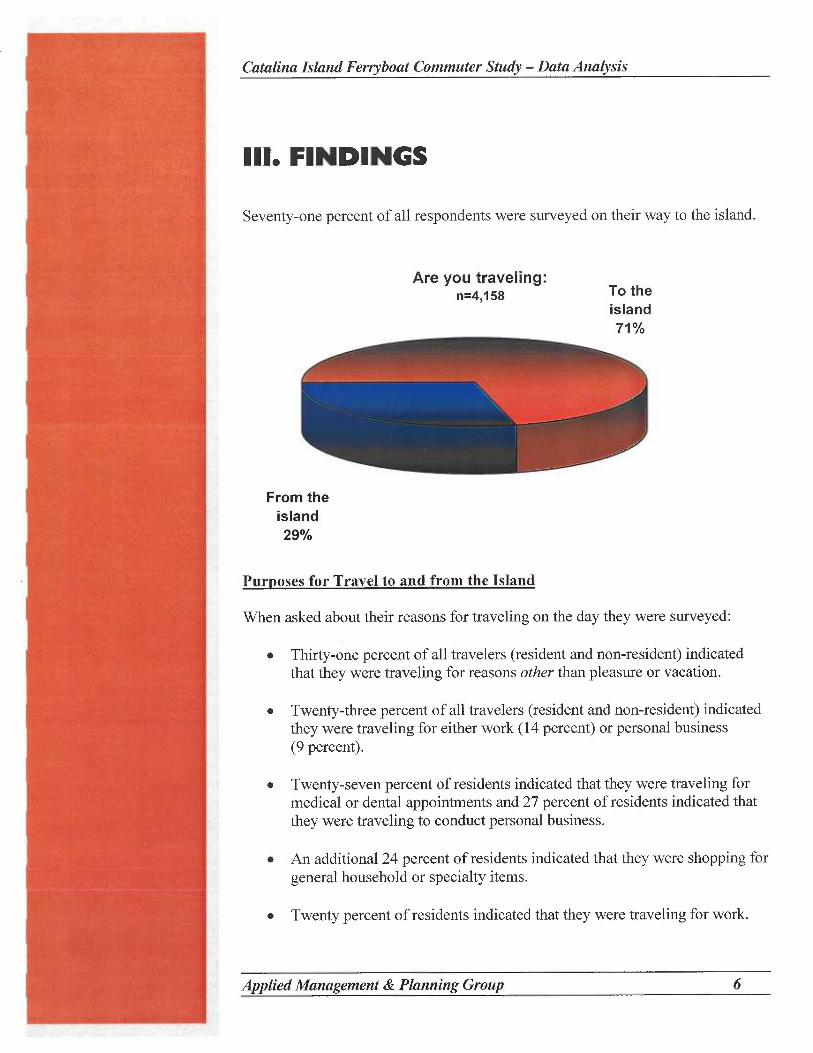
Seventy-one percent of all respondents were surveyed on their way to the island.
Are you traveling:n=4,158 To the
island71%
From theisland29%
Purposes for Travel to and from the Island
When asked about their reasons for traveling on the day they were surveyed:
• Thirty-one percent of all travelers (resident and non-resident) indicatedthat they were traveling for reasons other than pleasure or vacation.
• Twenty-three percent of all travelers (resident and non-resident) indicatedthey were traveling for either work (14 percent) or personal business(9 percent).
• Twenty-seven percent of residents indicated that they were traveling formedical or dental appointments and 27 percent of residents indicated thatthey were traveling to conduct personal business.
• An additiona124 percent of residents indicated that they were shopping forgeneral household or specialty items.
• Twenty percent of residents indicated that they were traveling for work.
Applied Management &Planning Group 6
"Av~rlon se/tools needsubstitute teachersbadly. I commute tohelp them out. "
--Work commcder:
"Shoppers will oftengo to superstores likeCostco and Smart and `final to buy in bulk
'nd ship their goodsever to the island It'se only way many
people can get what t~ev need."
raCpli Morrow,ayor City ofAvalon
Catalina Island Ferryboat Commuter Study —Data Analysis
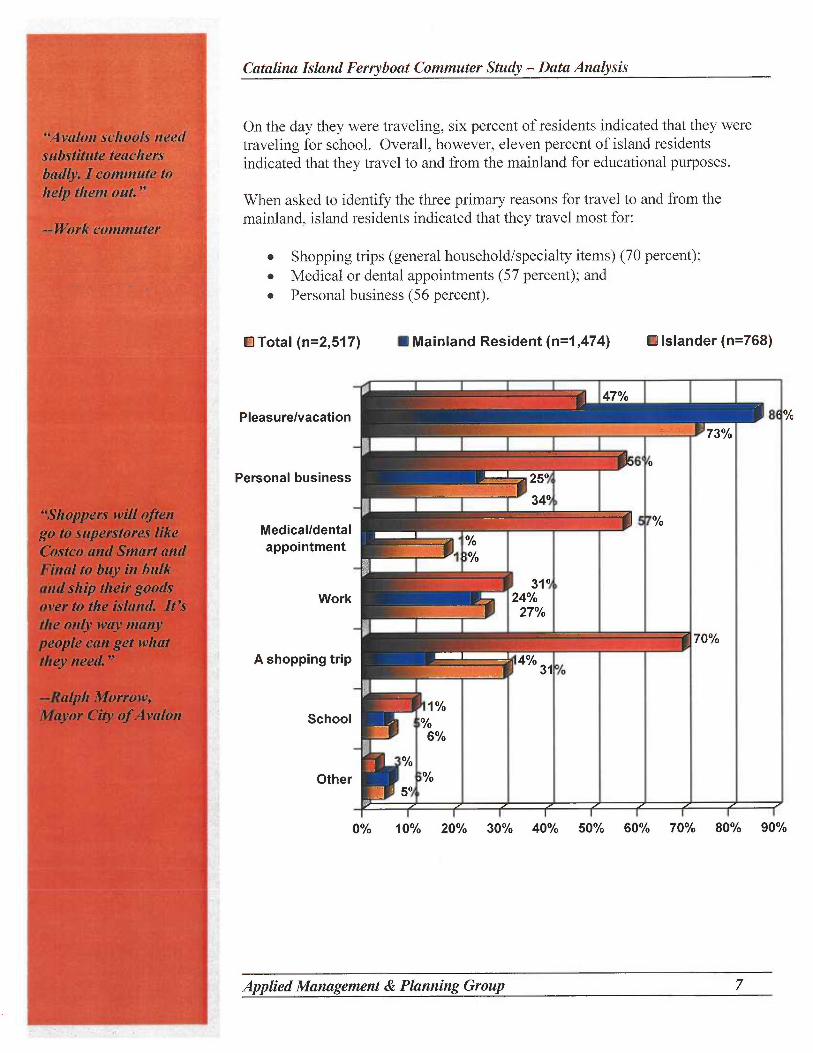
On the day they were traveling, six percent of residents indicated that they were
traveling for school. Overall, however, eleven percent of island residents
indicated that they travel to and from the mainland for educational purposes.
When asked to identify the three primary reasons for travel to and from the
mainland, island residents indicated that they travel most for:
• Shopping trips (general household/specialty items) (70 percent);
• Medical or dental appointments (57 percent); and
• Personal business (56 percent).
Total (n=2,517) ~ Mainland Resident (n=1,474) ~ Islander (n=768)
Pleasure/vacation
Personal business
Medical/dentalappointment
1 °/
Work
A shopping trip
{<`3
1%School oho
'' 6%
Other
~ 3124°/a27%
4% 3
47%
73%
70%
0% 10% 20% 30% 40% 50% 60% 70% 80% 90%
Applied Management &Planning Group 7
'orty-nine percent of
ndicated that theyused the ferry servicefor work live on the.,.,.,.,., i,, ti,r
Catalina Island Ferryboat Commuter Study —Data Analysis
Due to the limited number of stores on the island and the lack of major supplychain stores located on the island, many island residents make monthly(15 percent) or bi-weekly (18 percent) trips to the mainland to stock up onsupplies needed to run households, business and schools.
In speaking with Mayor Morrow, he noted that due to the high volume of touristvisits to the island, an increase in the number of domestic/labor workers and thelimited access to housing on the island, it has become necessary for City ofAvalon residents and business owners to seek employees from a variety ofmainland sources. The services of construction workers, consultants, entertainers,law enforcement personnel, home health care providers, teachers and activitydirectors are all needed on the island but the demand for these types of servicescannot be fulfilled by residents alone.
Travel Frequency
• Overall, 47 percent of respondents (resident and non-resident) reportedthat they use the ferry service at least once a month, while 93 percent ofislanders surveyed use the ferry at least once a month.
Fifteen percent of the total respondent population (resident and non-resident) and 28 percent of island residents indicated that they use theferryboat services at least once a week.
• Of those indicating that they use the ferry service for work purposes, 36percent indicated that they use the service at least once a week.
Applied Management &Planning Group 8

Catalina Island Ferryboat Commuter Study —Data Analysis
Trip Durations
• Fifty-two percent of islanders indicated that the total time spent on"today's trip" would be 24 hours or less. Of those indicating that theirstay would last more than 24 hours, less than 30 percent took trips thatlasted more than two to three days.
n=429
24 hours or less
2to3days
4 to 6 days
1 to 4 weeks
5 to 24 weeks
More thatn 6 months
Other
This is my return trip
52%
0% 10% 20% 30% 40% 50% 60%
• Of those indicating that they use the ferry service for work, 47 percentindicated that their current trip would last more than 24 hours.
• Overall, 48 percent of all respondents (resident and non-resident) indicatedthat the duration of their stay on the island or mainland would be less than24 hours.
Applied Management &Planning Group 9
Catalina Island Ferryboat Commuter Study —Data Analysis
-, :. z .:,_; Payment Method
Have you ever used • Fifty-two percent of all respondents indicated that they used a commuter
an Avalon issued booklet or Avalon issued discount voucher as the payment for their fare,
discount travel while 91 percent of islanders surveyed used either a commuter book or an
voucher? Avalon issued voucher.
"It's cruciaC -but ~~~°~ • When asked if they had ever used an Avalon issued discount travel
hould be cheaper." ..` voucher, 79 percent of island residents and 11 percent of mainlandresidents indicated that they had.
~at traveler ,~• Of those who use the ferry for work purposes, 53 percent reported that the
use Avalon issued travel vouchers. Twenty-nine percent reported thatthey use commuter books; two percent of these respondents were usingunsubsidized books.
Alternatives Means of Travel
Respondents were asked how they would travel to and from the island if the ferry
service were not available. Responses included: Private vehicle, helicopter, orother charter service. Although these may be viable means of transportation, they
are not cost effective, are not provided with any reliability (weather conditionsseverely affect helicopter trips), are not regularly scheduled and are not subsidized
by the MTA. The following are the responses to questions about alternate meansof travel.
• Twenty seven percent indicated that they would use the helicopter service.
• Twenty-one percent indicated that they would use some other type ofcharter service. However, no other high speed, affordable charter servicesto and from the island exist.
• Thirty-six percent of islanders indicated that they would not have made
"Helicopter is too the trip at all.
expensive!" . Of those islanders indicating that they would use the helicopter as their
_-- Ferryboat traveler ~` means of transportation, 63 percent earn more than $50,000 annually.
Applied Management &Planning Group l0
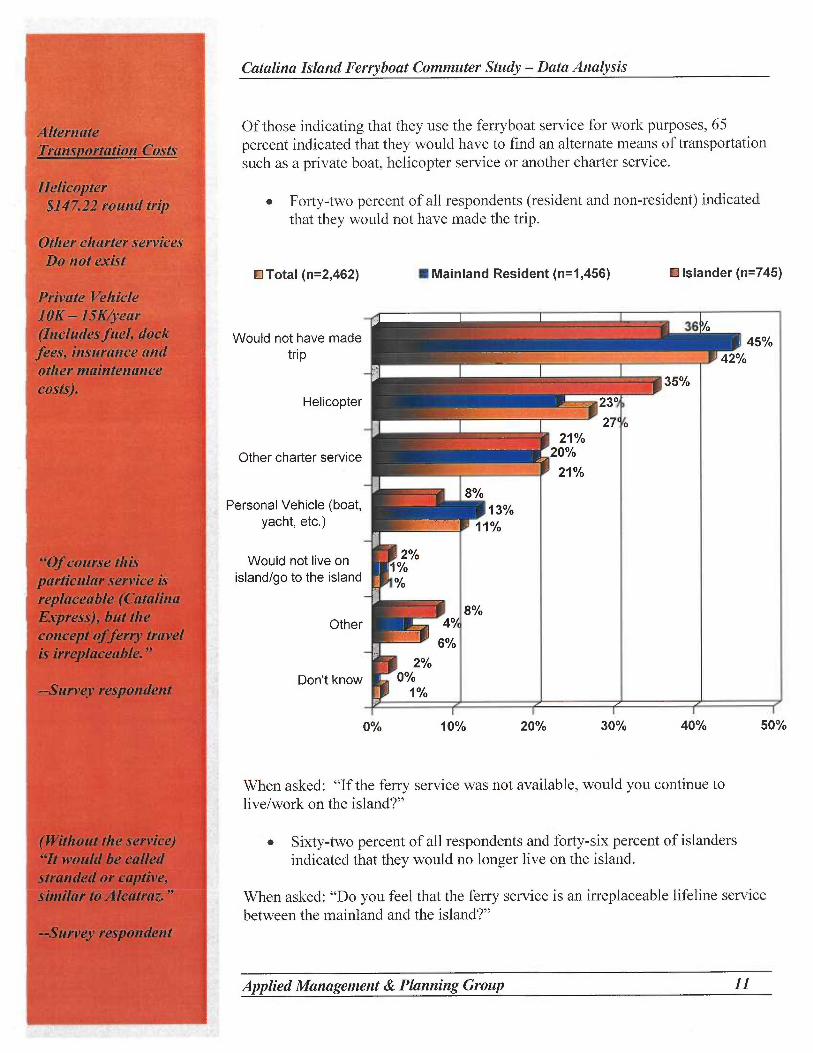
lternate
.:$147.22 round trip
Other charter servic. Do not exist
rivate VehicleIOK —1 SK/year(Includes fueC, clockfees, insurance andother maintenance.costs).
"Of course thisparticular service isreplaceable (Catalinaxpress), but the
concept of ferry travelis irreplaceable. "
--Survey responde,, n~ty
(Without the service)"It would be calledstranded or captive,similar to Alcatraz."
-Survey respondent
Catalina Island Ferryboat Commuter Study —Data Analysis
Of those indicating that they use the ferryboat service for work purposes, 65percent indicated that they would have to find an alternate means of transportationsuch as a private boat, helicopter service or another charter service.
• Forty-two percent of all respondents (resident and non-resident) indicatedthat they would not have made the trip.
D Totai (r=2,462)
Would not have madetrip
Helicopter
Other charter service
Personal Vehicle (boat,yacht, etc.)
Would not live onisland/go to the island
Other
Don't know
~ Mainland Resident (n=1,456) ■Islander (n=745)
45%42%
35%
23°
27 021%20%
21%
8%13%
~` 11
~2%
8%4°/
6%
2°/a0%1%
0% 10% 20% 30% 40% 50%
When asked: "If the ferry service was not available, would you continue tolive/work on the island?"
• Sixty-two percent of all respondents and forty-six percent of islandersindicated that they would no longer live on the island.
When asked: "Do you feel that the ferry service is an irreplaceable lifeline servicebetween the mainland and the island?"
Applied Management &Planning Group 11
Catalina Island Ferryboat Commuter Study —Data Analysis
• Ninety-three percent of those indicating that they use the service for workindicated that they felt the service was an irreplaceable lifeline service.
• Ninety-three percent of all respondents (resident and non-resident)indicated that they felt the service was an irreplaceable lifeline service.
• Ninety-four percent of island residents indicated that they felt the servicewas an irreplaceable lifeline service.
Profile of Working Population
• Of those who use the ferryboat service to travel to and from work(mainland or island side), 23 percent indicated that they use the service atleast twice a week.
• Of those who use the ferryboat service to travel to and from work, 41percent have an annual household income of less than $50,000.
• Fifty-seven percent of workers using the ferry service to travel to and fromwork indicated that they would not be able to live/work on the islandwithout it.
• Forty-nine percent of the individuals who use the ferry as a commuterservice to and from work indicated that they primarily use the serviceMonday thru Friday.
Profile of Senior Travelers
• Ninety-five percent of individuals 65 or older feel that the ferry service isan irreplaceable lifeline service for them.
• Twenty-five percent of seniors indicated that they travel more than twice amonth between the island and the mainland.
• Thirty-nine percent of senior respondents indicated that they travel at leasttwice a month between the island and the mainland.
• Thirty-six percent of respondents age 65 or older indicated that they travelto and from the island for personal business.
Applied Management &Planning Group l2
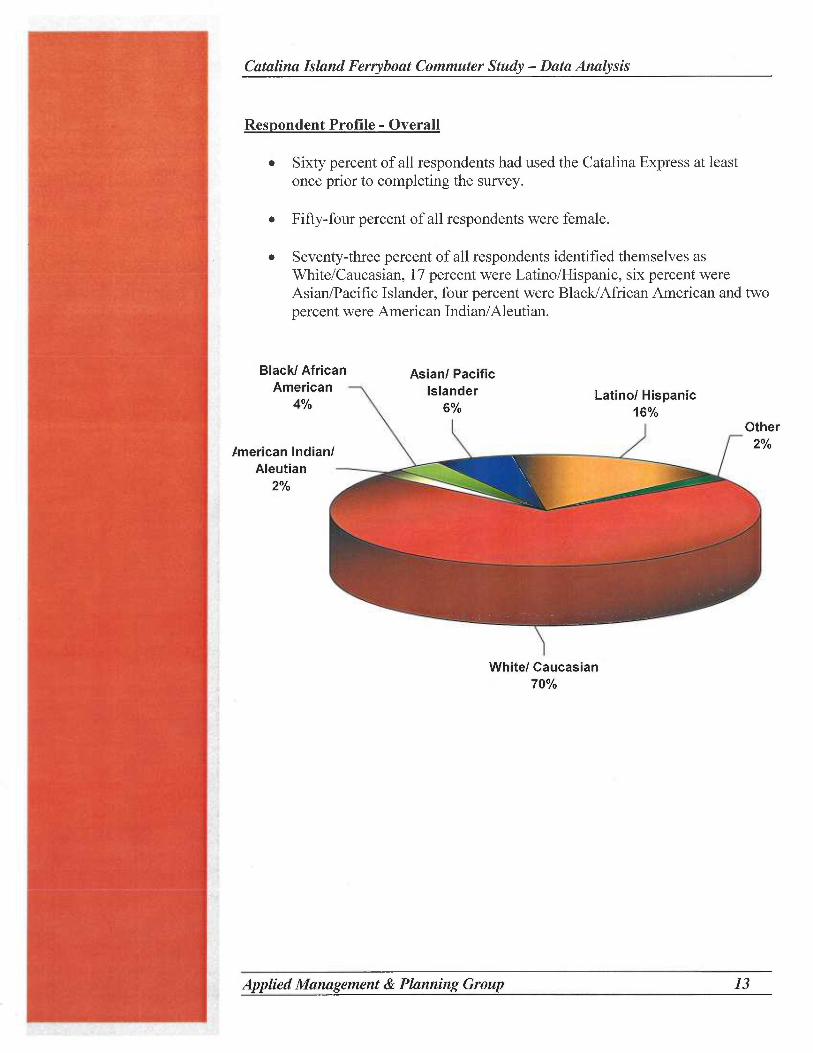
Catalina Island Ferryboat Commuter Study —Data Analysis
Respondent Profile - Overall
• Sixty percent of all respondents had used the Catalina Express at leastonce prior to completing the survey.
• Fifty-four percent of all respondents were female.
• Seventy-three percent of all respondents identified themselves asWhite/Caucasian, 17 percent were Latino/Hispanic, six percent wereAsian/Pacific Islander, four percent were Black/African American and twopercent were American Indian/Aleutian.
Black/ AfricanAmericar4%
American IndianAleutian2%
Asian/ Pacific
White/ Caucasian70%
Applied Management &Planning Group 13
per
'/o
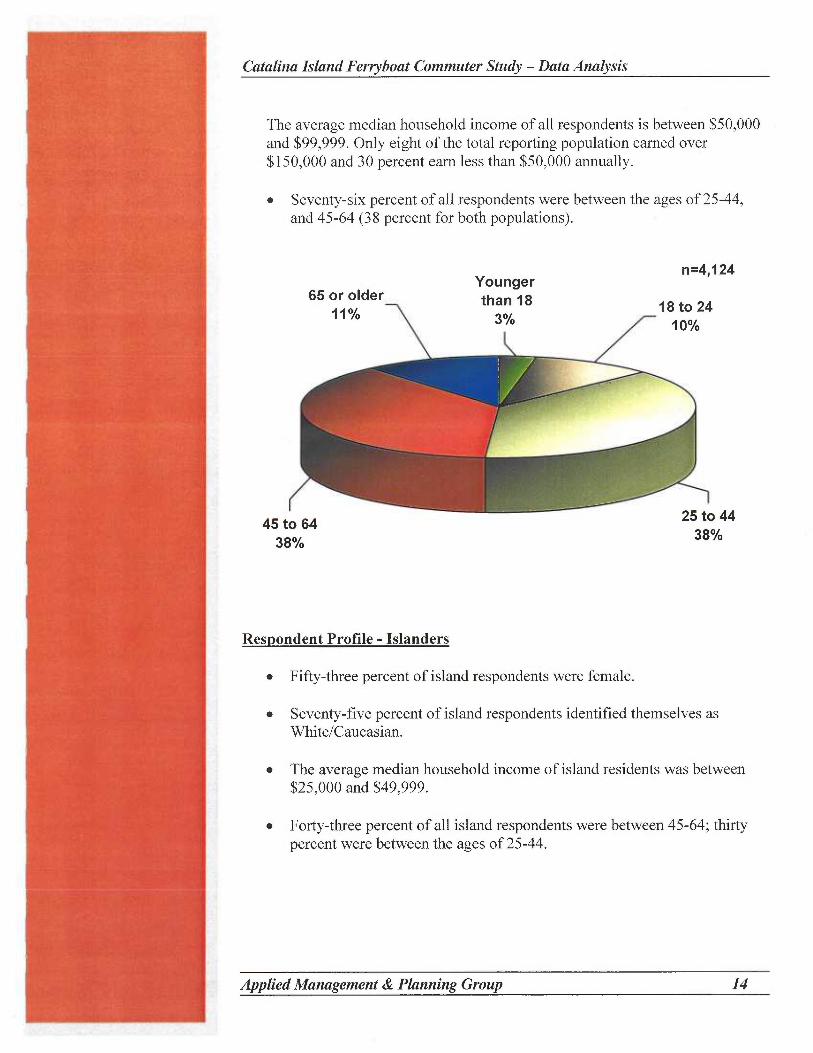
Catalina Island Ferryboat Commuter Study —Data Analysis
The average median household income of all respondents is between $50,000and $99,999. Only eight of the total reporting population earned over$150,000 and 30 percent earn less than $50,000 annually.
• Seventy-six percent of all respondents were between the ages of 25-44,and 45-64 (38 percent for both populations).
Younger65 or older than 1R
n=4,124
. ,.. .. ~
45 to 6438%
Respondent Profile - Islanders
• Fifty-three percent of island respondents were female.
L5 TO 44
38%
• Seventy-five percent of island respondents identified themselves asWhite/Caucasian.
• The average median household income of island residents was between$25,000 and $49,999.
• Forty-three percent of all island respondents were between 45-64; thirtypercent were between the ages of 25-44.
Applied Management &Planning Group f[d

Catalina Island Ferryboat Commuter Study —Data Analysis
~v. coNC~us~oNsIn reviewing the respondent data regarding the frequency of ferryboat use, it isclear that the 50 percent, three times a week commuter rule, is not met. However,there are many factors that may be used to show commuter service to the City ofAvalon. Discussions with FTA personnel indicate that 50 percent, three times aweek is not a hard and fast rule and that other factors may be used to determinecommuter service status. By combining the "human side" of these data (reasonsfor use, alternatives to the service and life line issues) with service comparisonswith other reporters and unique service issues (other commuter areas have morethan one way to travel to and from the islands, such as subway systems orbridges) AMPG believes that it can present a strong case for acceptance ofMTA's ferryboat miles.
The Next Steps
Now that the intercept data have been collected and reviewed, AMPG will spendthe next three to four weeks conducting case studies of data on the five majormetropolitan areas within the United States that operate and include ferryboatmiles in their NTD reports. We will review each city's unique travel options,interview individuals responsible for reporting miles and identify comparison andcontrast points that highlight the Catalina ferry systems unique features.
In addition to reviewing other cities operations, AMPG will expand on theCatalina ferry operations by collecting data from Catalina Express that highlightsthe year-round activities of commuter travel. Data will include:
Off peak commuter book use statistics;Annual commuter book use statistics; and,
~ Off peak daily ridership numbers.
Information garnered from Avalon city officials and commuting residents will beincluded in the final report to emphasize the importance of the service to theisland community and those individuals living on the mainland with specific workand personal interests on the island.
Finally, AMPG will review information from MTA's failed attempt at mileagerecognition to identify areas that may need to be specifically addressed. In aneffort to prepare a complete and convincing appeal to the FTA. If needed AMPG,will prepare a complete and thorough presentation to be presented to both MTAand FTA officials.
Applied Management &Planning Group 15
Catalina Island Ferryboat Commuter Study —Data Analysis
Acknowledgements
The Applied Management &Planning Group would like to thank the followingindividuals for their assistance in making the field data collection portion of thisstudy a success. Without their input, cooperation, information and help the datacollection portion of this project would not have been possible.
Duane J. CappDirector of Passenger ServicesCatalina Express
Kirsm Daluisio - San Pedro Tickets SupervisorCatalina Express
Jay FuhrmanTransportation PlannerMetropolitan Transportation Authority
Rachel Lane -Long Beach ManagerCatalina Express
Ralph MorrowMayor, City of Avalon
Susan RichanTransportation ManagerMetropolitan Transportation Authority
Judy Whitman - Avalon ManagerCatalina Express
The dock staff, boat crews and ticket agents of Catalina Express
Applied Management &Planning Group 16
Catalina Island Ferryboat Commuter Study -Data Analysis
Appendix A
Survey Instrument with ResponseFrequencies (All respondents)
Applied Management &Planning Group 17
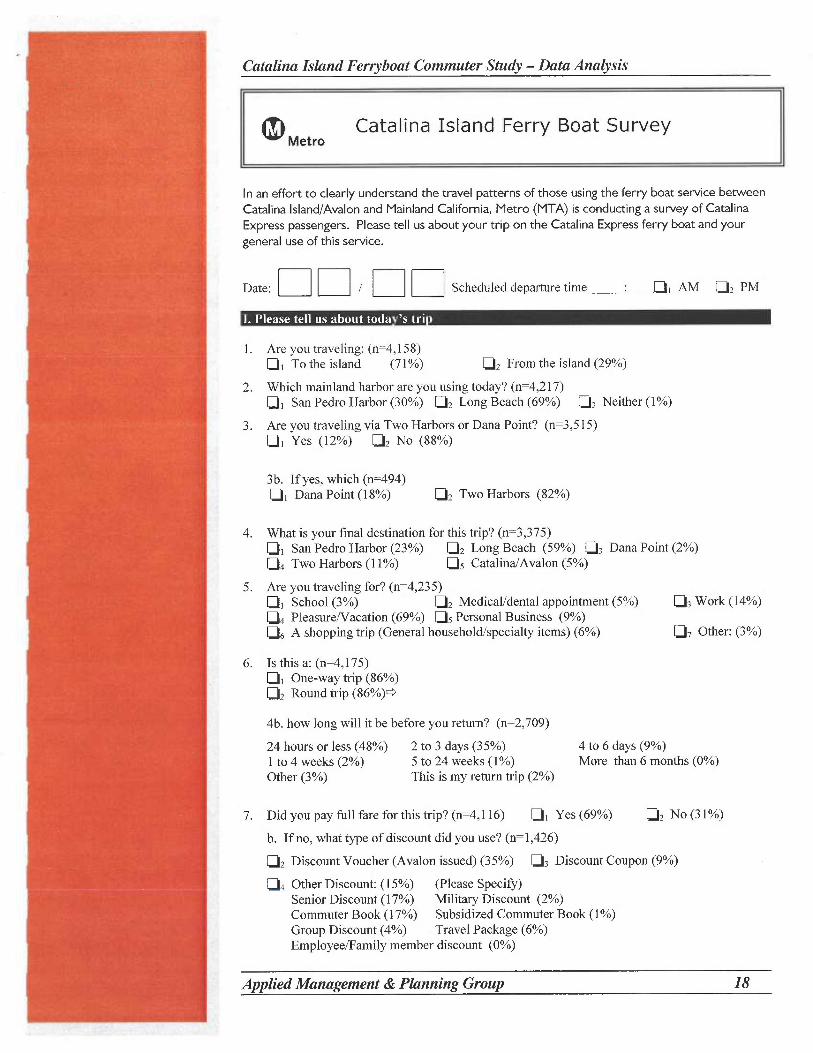
Catalina Island Ferryboat Commuter Shcdy -Data Analysis
Catalina Island Ferry Boat SurveyMetro
In an effort to clearly understand the travel patterns of those using the ferry boat service betweenCatalina Island/Avalon and Mainland California, Metro (MTA) is conducting a survey of CatalinaExpress passengers. Please tell us about your trip on the Catalina Express ferry boat and your
general use of this service.
Date: ~ ~ / ~ ~ Scheduled departure time ❑, AM ❑z PM
1. Are you traveling: (n=4,158)❑, To the island (71%) ❑2 From the island (29%)
2. Which mainland harbor are you using today? (n=4,217)❑~ San Pedro Harbor (30%) ❑Z Long Beach (69%) ❑3 Neither (1%)
3. Are you traveling via Two Harbors or Dana Point? (n=3,515)❑~ Yes (12%) ❑2 No (88%)
3b. If yes, which (n=494)❑~ Dana Point (18%) ❑2 Two Harbors (82%)
4. What is your final destination for this trip? (n=3,375)❑, San Pedro Harbor (23%) ❑2 Long Beach (59%) ❑; Dana Point (2%)❑4 Two Harbors (11%) [~5 Catalina/Avalon (5%)
5. Are you traveling for? (n=4,235)❑~ School (3%) ~z MedicaUdental appointment (5%) ❑3 Work (14%)❑4 Pleasure/Vacation (69%) ❑5 Personal Business (9%)❑6 A shopping trip (General household specialty items) (6%) ❑~ Other: (3%)
6. Is this a: (n=4,175)❑, One-way trip (86%)❑Z Round trip (86%)b
4b. how long will it be before you return? (n=2,709)
24 hours or less (48%) 2 to 3 days (35%) 4 to 6 days (9%)1 to 4 weeks (2%) 5 to 24 weeks (1 %) More than 6 months (0%)Other (3%) This is my return trip (2%)
7. Did you pay full fare for this trip? (n=4, l 16) ❑~ Yes (69%) ❑2 No (31 %)
b. If no, what type of discount did you use? (n=1,426)
❑2 Discount Voucher (Avalon issued) (35%) ❑3 Discount Coupon (9%)
❑4 Other Discount: (15%) (Please Specify)Senior Discount (17%) Military Discount (2%)Commuter Book (17%) Subsidized Commuter Book (1 %)Group Discount (4%) Travel Package (6%)Employee/Family member discount (0%)
Applied Management &Planning Group l8

Catalirur Island Ferryboat Commuter Study -Data Analysis
ii. Please tell us about your eneral use of the ferr service
8. Is this your first time using the ferry service between the island and the mainland? (n=4,182)❑~ Yes. (40%)
Please complete the questions in section III and place the survey in the Survey Today drop box.
❑2 No. Please continue to Question 9. (60%)
9. How often do you usually use the ferry boat service? (n=2,451)❑1 Less than once a month (53%)❑Z Once a month (11 %)❑3 Twice a month (8%)❑4 More than twice a month but less than once a week (13%)❑5 Once a week (6%)❑6 Twice a week (6%)❑~ Three times a week (2%)❑8 Four times a week (1%)❑9 Five times a week (0%)❑~o Six times a week (0%)❑11 Everyday (0%)
10. Do you use the service primarily: (n=2,395)❑~ Weekdays (M — F) (34%) ~]Z Weekends (21%) ❑3 Both (44%)
11. Which mainland harbor do you normally use? (n=2,441)❑, San Pedro (26%) ❑2 Long Beach (74%)
12. When you use the ferry boat, what are the three primary reasons you travel? (n=2,517)(Please rank the top three reasons)School (6%) MedicaUdental appointment (18%) Work (27%)Pleasure/Vacation (73%) Personal Business (34%)A shopping trip (general household/specialty items) (31%)Other: (Please specify) (5%)
13. If the ferry service was not available, how would you travel between the island and themainland? (n=2,462)
❑, Personal vehicle (boat, yacht, etc.) (11%) ❑2 Helicopter (27%)❑3 Other charter service (21%) ❑4 Would not have made the trip (42%)❑5 Other: (Please specify) (6%)
Would not live on the island/go to the island (1%)Don't Know (1 %)
14. If the ferry service were not available, would you continue to live/work on the island?(n=1,908)❑1 Yes (38%) ❑2 No (62%)
15. Do you feel that the ferry service is an irreplaceable lifeline service between the mainland andthe island? (n=2,383)
❑1 Yes (93%) ❑2 No (7%)
16. Have you ever used an Avalon issued discount travel voucher? (n=2,433)❑1 Yes (32%) ❑2 No (68%)
Applied Management &Planning Group 19
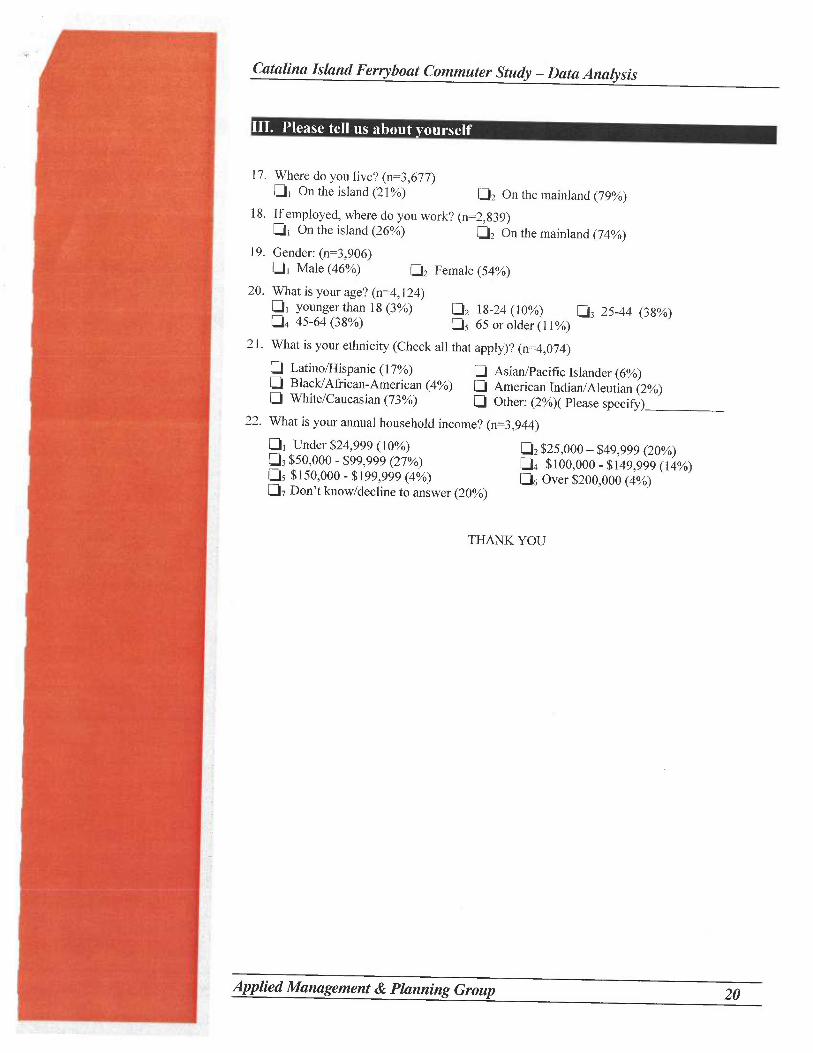
Catalina Island Ferryboat Commuter Study -Data Analysis
17. Where do you live? (n=3,677)❑~ On the island (21%) ❑2 On the mainland (79%)
18. If employed, where do you work? (n=2,839)❑~ On the island (26%) ❑2 On the mainland (74%)
19. Gender: (n=3,906)❑~ Male (46%) ❑2 Female (54%)
20. What is your age? (n=4,124)❑~ younger than 18 (3°/a) ❑z 18-24 (10%) ❑3 25-44 (38%)❑4 45-64 (38%) ~]5 65 or older (11%)
21. What is your ethnicity (Check all that apply)? (n=4,074)
❑ Latino/Hispanic (17%) ❑ Asian/Pacific Islander (6°/a)❑ Black/African-American (4%) ❑American Indian/Aleutian (2%)❑ White/Caucasian (73%) ❑Other: (2%)( Please specify)
22. What is your annual household income? (n=3,944)
❑1 Under $24,999 (10%) ❑2 $25,000 — $49,999 (20%)❑3 $50,000 - $99,999 (27%) ❑4 $100,000 - $149,999 (14%)❑5 $150,000 - $199,999 (4%) ~]6 Over $200,000 (4%)❑~ Don't know/decline to answer (20%)
THANK YOU
Applied Management &Planning Group 20
Catalina Island Ferryboat Commuter Study -Data Analysis
Appendix B
Survey Instrument with ResponseFrequencies (Island Residents)
Applied Management &Planning Group 21

Catalina Island Ferryboat Commuter Study -Data Analysis
Catalina Island Ferry Boat SurveyMetro
In an effort to clearly understand the travel patterns of those using the ferry boat service betweenCatalina Island/Avalon and Mainland California, Metro (MTA) is conducting a survey of CatalinaExpress passengers. Please tell us about your trip on the Catalina Express ferry boat and yourgeneral use of this service.
Date: ~ ~ / ~ ~ Scheduled departure time ❑~ AM ❑z PM
i. Please tell us about toda 's tri
1. Are you traveling: (n=757)❑~ To the island (46%) ❑2 From the island (54%)
2. Which mainland harbor are you using today? (n=767)❑1 San Pedro Harbor (11%) ❑2 Long Beach (89%) ❑3 Neither (0%)
3. Are you traveling via Two Harbors or Dana Point? (n=684)❑i Yes (5%) ❑z No (95%)
3b. If yes, which (n=38)❑~ Dana Point (5%) ❑Z Two Harbors (95%)
4. What is your final destination for this trip? (n=591)❑, San Pedro Harbor (6%) ❑2 Long Beach (69%) ❑3 Dana Point (1%)❑4 Two Harbors (7%) ❑5 Catalina/Avalon (17%)
5. Are you traveling for? (n=770)❑1 School (6%) I]2 MedicaUdental appointment (27%) ❑; Work (20%)❑4 Pleasure/Vacation (15%) ❑5 Personal Business (27%)❑6 A shopping trip (General household/specialty items) (24%) ❑~ Other: (4%)❑8 Home/Live on the Island (written in response) (6%)
6. Is this a: (n=760)❑, One-way trip (27%)❑2 Round trip (73%)b
4b. how long will it be before you return? (n=429)
24 hours or less (52%) 2 to 3 days (26%) 4 to 6 days (11%)1 to 4 weeks (4%) 5 to 24 weeks (0%) More than 6 months (0%)Other (4%) This is my return trip (3°/a)
7. Did you pay full fare for this trip? (n=735) ❑1 Yes (25%) ❑2 No (75%)
b. If no, what type of discount did you use? (n=606)❑2 Discount Voucher (Avalon issued) (69%) ❑3 Discount Coupon (3%)❑4 Other Discount: (7%) (Please Specify)
Senior Discount (07%) Military Discount (0%)Commuter Book (22%) Subsidized Commuter Book (3%)Group Discount (1°/o) Travel Package (2%)Employee/Family member discount (0%)
Applied Management &Planning Group 22
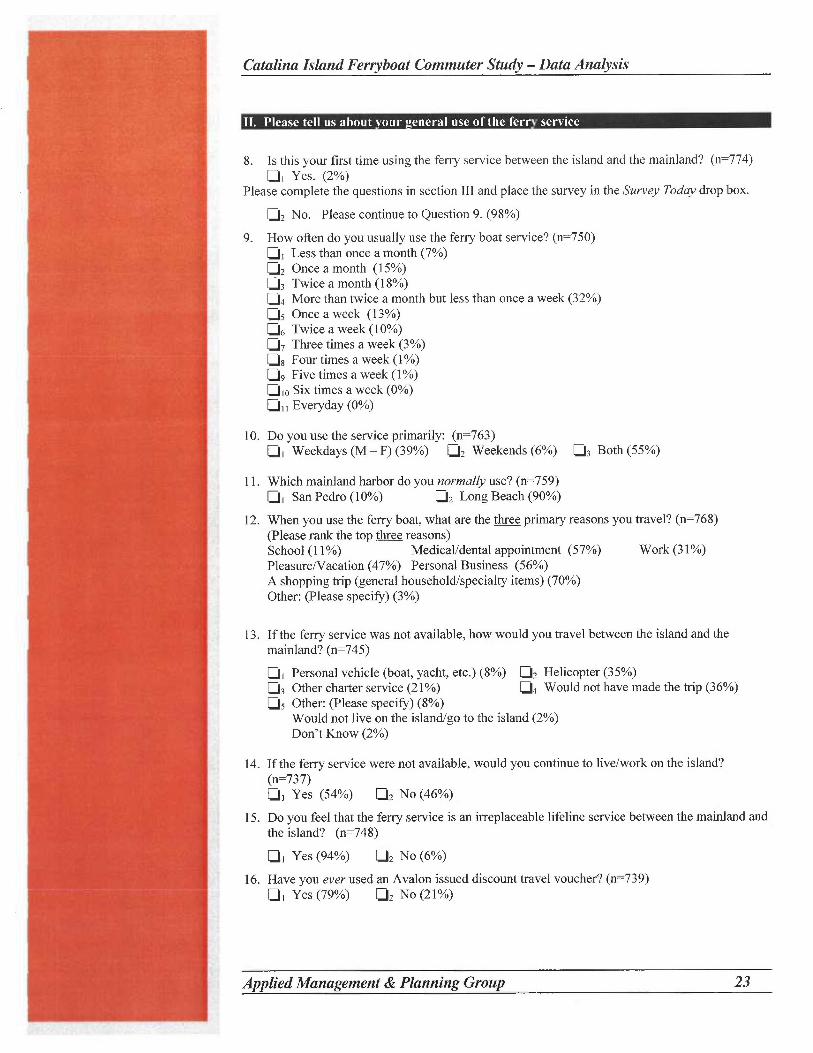
Catalina Island Ferryboat Commuter Study -Data
8. Is this your first time using the ferry service between the island and the mainland? (n=774)❑~ Yes. (2%)
Please complete the questions in section III and place the survey in the Survey Today drop box.
❑2 No. Please continue to Question 9. (98%)
How often do you usually use the ferry boat service? (n=750)❑~ Less than once a month (7%)❑2 Once a month (15%)❑3 Twice a month (18%)❑4 More than twice a month but less than once a week (32%)❑5 Once a week (13%)❑6 Twice a week (10%)❑~ Three times a week (3%)❑8 Four times a week (1%)❑y Five times a week (1%)❑~o Six times a week (0%)❑„ Everyday (0%)
] 0. Do you use the service primarily: (n=763)❑~ Weekdays (M — F) (39%) ❑2 Weekends (6%) ❑3 Both (55%)
11. Which mainland harbor do you normally use? (n=759)❑, San Pedro (10%) ❑2 Long Beach (90%)
12. When you use the ferry boat, what are the three primary reasons you travel? (n=768)(Please rank the top three reasons)School (11%) Medical/dental appointment (57%) Work (31%)Pleasure/Vacation (47%) Personal Business (56%)A shopping trip (general household/specialty items) (70%)Other: (Please specify) (3%)
13. If the ferry service was not available, how would you travel between the island and themainland? (n=745)
❑~ Personal vehicle (boat, yacht, etc.) (8%) ❑Z Helicopter (35%)❑3 Other charter service (21%) ❑4 Would not have made the trip (36%)❑5 Other: (Please specify) (8%)
Would not live on the island/go to the island (2%)Don't Know (2%)
14. If the ferry service were not available, would you continue to live/work on the island?(n=737)❑, Yes (54%) ❑Z No (46%)
15. Do you feel that the ferry service is an irreplaceable lifeline service between the mainland andthe island? (n=748)
❑~ Yes (94%) ❑2 No (6%)
16. Have you ever used an Avalon issued discount travel voucher? (n=739)❑ ~ Yes (79%) ❑Z No (21 %)
Applied Management &Planning Group 23

Catalina Island Ferryboat Commuter Study -Data Analysis
17. Where do you live? (n=788)❑~ On the island (100%) ❑z On the mainland (0%)
18. If employed, where do you work? (n=664)❑~ On the island (97%) ❑2 On the mainland (3%)
19. Gender: (n-766)❑~ Male (47%) ❑Z Female (53%)
20. What is your age? (n=774)❑~ younger than 18 (6%) ❑Z 18-24 (10%) ❑3 25-44 (30%)❑4 45-64 (43%) ❑5 65 or older (11%)
21. What is your ethnicity (Check all that apply)? (n=765)
❑ Latino/Hispanic (24%) ❑ Asian/Pacific Islander (3%)❑ Black/African-American (1%) ❑American Indian/Aleutian (2%)❑ White/Caucasian (75%) ❑Other: (1%)( Please specify)
22. What is your annual household income? (n=759)
❑1 Under $24,999 (18%) ❑2 $25,000 — $49,999 (28%)❑3 $50,000 - $99,999 (23%) ❑4 $100,000 - $149,999 (10%)❑5 $150,000 - $199,999 (3%) ❑6 Over $200,000 (2%)❑~ Don't know/decline to answer (16%)
THANK YOU
Applied Management &Planning Group 24


![Geology and Tectonics of Santa Catalina Island and the California … · 2017. 9. 27. · 3 Santa Catalina Island Field Trip Road Log Day 1 [October 23, 2004] Begin – Catalina Express](https://img.dokumen.tips/doc/110x75/610e92d7eec8805a8129f692/geology-and-tectonics-of-santa-catalina-island-and-the-california-2017-9-27.jpg)