Embed Size (px)
Citation preview
Stephen F. Austin State University Stephen F. Austin State University
SFA ScholarWorks SFA ScholarWorks
Faculty Publications Department of Geology
2008
Castile Evaporite Karst Potential Map of the Gypsum Plain, Eddy Castile Evaporite Karst Potential Map of the Gypsum Plain, Eddy
County, New Mexico and Culberson County, Texas: A GIS County, New Mexico and Culberson County, Texas: A GIS
Methodological Comparison Methodological Comparison
Kevin W. Stafford College of Sciences and Mathematics, Department of Geology, Stephen F. Austin State University, [email protected]
Laura Rosales-Lagarde National Cave and Karst Research Institute, 400 Commerce Drive, Carlsbad, NM
Penelope J. Boston
Follow this and additional works at: https://scholarworks.sfasu.edu/geology
Part of the Geology Commons
Tell us how this article helped you.
Repository Citation Repository Citation Stafford, Kevin W.; Rosales-Lagarde, Laura; and Boston, Penelope J., "Castile Evaporite Karst Potential Map of the Gypsum Plain, Eddy County, New Mexico and Culberson County, Texas: A GIS Methodological Comparison" (2008). Faculty Publications. 13. https://scholarworks.sfasu.edu/geology/13
This Article is brought to you for free and open access by the Department of Geology at SFA ScholarWorks. It has been accepted for inclusion in Faculty Publications by an authorized administrator of SFA ScholarWorks. For more information, please contact [email protected].
CASTILE EVAPORITE KARST POTENTIAL MAP OF THEGYPSUM PLAIN, EDDY COUNTY, NEW MEXICO AND
CULBERSON COUNTY, TEXAS: A GISMETHODOLOGICAL COMPARISON
KEVIN W. STAFFORD1,2, LAURA ROSALES-LAGARDE1,2, AND PENELOPE J. BOSTON1,2
Abstract: Castile Formation gypsum crops out over ,1,800 km2 in the western
Delaware Basin where it forms the majority of the Gypsum Plain. Karst development is
well recognized in the Gypsum Plain (i.e., filled and open sinkholes with associated
caves); however, the spatial occurrence has been poorly known. In order to evaluate the
extent and distribution of karst development within the Castile portion of the Gypsum
Plain, combined field and Geographic Information System (GIS) studies were conducted,which enable a first approximation of regional speleogenesis and delineate karst-related
natural resources for management. Field studies included physical mapping of 50, 1-km2
sites, including identification of karst features (sinkholes, caves, and springs) and
geomorphic mapping. GIS-based studies involved analyses of karst features based on
public data, including Digital Elevation Model (DEM), Digital Raster Graphic, (DRG)
and Digital Orthophoto Quad (DOQ) formats. GIS analyses consistently underestimate
the actual extent and density of karst development, based on karst features identified
during field studies. However, DOQ analyses coupled with field studies appears toproduce accurate models of karst development. As a result, a karst potential map of the
Castile outcrop region was developed which reveals that karst development within the
Castile Formation is highly clustered. Approximately 40% of the region effectively
exhibits no karst development (,1 feature/km2). Two small regions (,3 km2 each)
display intense karst development (.40 features/km2) located within the northern extent
of the Gypsum Plain, while many regions of significant karst development (.15 features/
km2) are distributed more widely. The clustered distribution of karst development
suggests that speleogenesis within the Castile Formation is dominated by hypogenic,transverse processes.
INTRODUCTION
The gypsum facies of the Castile Formation crops out
over an area of ,1800 km2 in Eddy County, New Mexico
and Culberson County, Texas on the western edge of the
Delaware Basin (Fig. 1). The region has traditionally been
referred to as the Gypsum Plain (Hill, 1996), which covers
an area of ,2800 km2 and is composed of outcrops of the
Castile and Rustler Formations (Fig. 2). The region is
located in the semi-arid southwest on the northern edge of
the Chihuahuan Desert, where annual precipitation
averages 26.7 cm with the greatest rainfall occurring as
monsoonal storms in late summer (July – September)
(Sares, 1984). Annual temperature averages 17.3 uC with
an average annual minimum and maximum of 9.2 uC and
25.2 uC, respectively.
Throughout Castile outcrops, surficial karren occurs
extensively in regions of exposed bedrock, including well-
developed rillenkarren, spitzkarren, kamenitzas and tu-
muli. Sinkhole development is widespread, including both
closed and open sinkholes ranging from near-circular
features to laterally extensive, incised arroyo-like features.
Cave development ranges widely, from small epigenic
recharge features to large, complex polygenetic features
(Stafford, 2006). The region hosts the second longest
documented gypsum cave in North America, Parks Ranch
Cave, Eddy County, N.M., with a surveyed length of
6596 m (Stafford, 2006). In addition, many other signifi-
cant gypsum caves have been documented by the Texas
Speleological Survey (TSS) (e.g., Reddell and Fieseler,
1977) and GYPsum KArst Project (GYPKAP) (Eaton,
1987; Belski, 1992; Lee, 1996). However, no systematic
investigation has been conducted within the region with
respect to karst development. Prior to this study, 246 karst
features, primarily caves, were documented within the
Castile outcrop region. The BLM (Bureau of Land
Management) documented 45 of the total reported karst
features (Jon Jasper, 2006, pers. com.); while the TSS
1 Dept of Earth and Environmental Science, New Mexico Institute of Mining and
Technology, Socorro, NM 87801, USA. [email protected], [email protected]
and [email protected] National Cave and Karst Research Institute, Carlsbad, NM, 88220, USA
K. W. Stafford, L. Rosales-Lagarde, and P. J. Boston – Castile evaporite karst potential map of the Gypsum Plain, Eddy County, New
Mexico and Culberson County, Texas: A GIS methodological comparison. Journal of Cave and Karst Studies, v. 70, no. 1, p. 35–46.
Journal of Cave and Karst Studies, April 2008 N 35

documented 201 of the total reported karst features (Jim
Kennedy, 2006, pers. com.).
The rapid solution kinetics and high solubility of
gypsum promotes extensive karst development. Gypsum
solubility (2.53 g L21) is approximately three orders of
magnitude greater than limestone (1.5 mg L21) in pure
water and two orders of magnitude less than halite (360 g
L21) (Klimchouk, 1996). The high solubility and near-
linear solution kinetics of evaporites encourage intense
surface dissolution that often forms large sinkholes, incised
arroyos and caves that are laterally limited with rapid
decreases in passage aperture away from inflows through
epigenic speleogenesis (Klimchouk, 2000a). Additionally,
the high solubilities of evaporites favor the development of
hypogenic transverse speleogenesis driven by mixed con-
vection (forced and free) (Klimchouk, 2000b). Forced
convection is established by regional hydraulic gradients in
confined settings, while free convection is generated where
steep density gradients establish as fresh-waters are
continuously supplied to the dissolution fronts (the upper
levels) through the simultaneous sinking of saturated fluids
by density differences (Anderson and Kirkland, 1980).
Therefore epigenic and hypogenic karstic features likely
both exist in the study area, often superimposed on each
other.
The work we report here focuses on delineating the
extent and distribution of karst development within the
outcrop region of the Castile Formation, in order to
predict regions of intense versus minimal karst develop-
ment, which can be used for karst resource management as
well as a first approximation for understanding regional
speleogenesis. A dual approach involving field and Geo-graphic Information System (GIS) analyses were utilized in
order to define karst variability within the study area,
including field mapping of 50, 1-km2 regions and GIS
analyses, using ESRI ArcGIS 9.2 software, of public data
(i.e., Digital Elevation Model [DEM]; Digital Raster
Graphic [DRG]; and Digital Orthophoto Quad [DOQ])
for the entire region. The combined results were used to
develop a karst potential map of the Castile Formation
outcrop region, while simultaneously evaluating different
GIS-based techniques for karst analyses.
GEOLOGIC SETTING
The Castile Formation was deposited during the latePermian (early Ochoan), subsequent to deposition of the
Guadalupian Capitan Reef, which is well-known for the
caves it hosts in the Guadalupe Mountains (e.g., Hose and
Pisarowicz, 2000). Castile evaporites represent deep-water
deposits within a stratified, brine-filled basin (i.e., Dela-
ware Basin) (Kendall and Harwood, 1989), bounded below
by clastics of the Bell Canyon Formation, on the margins
by Capitan Reef carbonates, and above by additional
evaporitic rocks of the Salado and Rustler Formations
(Fig. 2) (Kelley, 1971). Castile evaporites crop out along
their western dissolution front in the Gypsum Plain
(Fig. 1), dip to the east where they reach a maximum
thickness of 480 m in the subsurface (Hill, 1996), and are
characterized as massive to laminated sulfates (gypsum/
anhydrite) interbedded with halite (Dietrich et al., 1995).
Increased thickness in the east has been attributed to
dissolution of intrastratal halite to the west and increased
deposition to the east in the Ochoa Trough during thePermian (Anderson et al., 1972).
The Castile Formation, including outcrops in the
Gypsum Plain, has experienced minimal tectonic deforma-
tion although located on the eastern edge of major tectonic
events. Triassic and Laramide tectonism produced regional
tilting to the northeast, broad flexures and fracturing with
minimal offset within southeastern New Mexico and west
Texas. The far western edge of the Delaware Basin has
been down-dropped along the far eastern margin of Basin
Figure 1. Location map showing location of Gypsum Plain
including outcrop areas of the Castile Formation (solid
white) and the Rustler Formation (solid black) within the
Delaware Basin (dark gray), Eddy County, NM and
Culberson County, Texas. Location of the Delaware Basinin relation to Texas and New Mexico is illustrated in bottom
left corner, with the enlarged region outlined by the small
black rectangle (adapted from Kelley, 1971, Dietrich et al.,
1995 and Hill, 1996).
CASTILE EVAPORITE KARST POTENTIAL MAP OF THE GYPSUM PLAIN, EDDY COUNTY, NEW MEXICO AND CULBERSON COUNTY, TEXAS: A GIS
METHODOLOGICAL COMPARISON
36 N Journal of Cave and Karst Studies, April 2008

and Range block faulting; however, within the remaining
Delaware Basin, the effects are limited to near-vertical
joints (Horak, 1985). As a result of tectonism, Castile
evaporites currently dip 3 to 5 degrees to the northeast with
abundant conjugate joint sets oriented at , N75uE and
,N15uW. Associated with joint sets along the westerndissolution front, solution subsidence valleys have de-
veloped from subsurface dissolution of halite beds (Hentz
and Henry, 1989).
In addition to tectonic deformation, some sulfate rocks
have been exposed to significant diagenesis. Original
laminated (varved) gypsum often exhibits massive and
nodular fabrics that are likely the result of plastic
deformation associated with anhydrite/gypsum mineral
conversion (Machel and Burton, 1991). Calcitized evapor-ites are common (often referred to as castiles or calcitized
masses), generally forming clusters or linear trends of
biogenic limestone associated with bacterial sulfate re-
duction (Kirkland and Evans, 1976). Selenite is locally
abundant, forming linear features and fracture fillings
(likely associated with mineral conversion), as well as
lenticular masses (probably associated with calcitization
processes). Diagenetic fabric alteration within Castileevaporites probably has exerted significant influence on
establishing preferential flow paths for karst development
within the Gypsum Plain.
FIELD STUDIES
Field mapping was conducted at 50, 1-km2 sites within
the Castile outcrop area (Fig. 3A). Field sites were
randomly selected using ESRI ArcGIS 9.2 software in
order to obtain an accurate representation of karst
development within the Castile outcrop region and
minimize any human biases that might be introduced intosite selection. Ten field mapping sites were shifted up to
two kilometers away from GIS-defined locations, in order
to avoid anthropogenic features (i.e., roads, houses,
quarries), while two sites were shifted up to four kilometers
to avoid regions where land access was not available.
Each field site was defined as a one kilometer square
region. Transect surveys were conducted on 100-meter line
spacing, such that ten, one kilometer long transects were
traversed in each of the 50 field sites. Smaller line-spacing
(40 m) for transect surveys was compared with 100-meter
line spacing through independent surveys by two of theauthors at five field sites, which identified less than 10%
additional karst features (i.e., sinkholes and caves).
Because of the results of sub-sampling and the location
of the study region within the semi-arid southwest, where
vegetation is sparse and does not commonly obscure karst
features, 100-meter spaced traverse surveys were found to
be sufficient to document more than 90% of surficial karst
features. During field mapping, identified feature locationswere recorded with a hand-held GPS (Global Positioning
System) and individual features were characterized based
on size (length, width, depth), geomorphic expression
(closed sink, open sink [i.e., cave], spring) and geologic
occurrence (laminated, massive and nodular gypsum;
gypsite; calcitized evaporite).
Field mapping identified 389 individual karst features,
including 236 open sinkholes with free drains (i.e., caves or
smaller solutional conduits that connect directly to sink-
holes), 147 filled sinkholes, four caves with no associated
sinkhole, and two springs. However, of the 236 opensinkholes, only 39 contained caves that were large enough
to be humanly enterable. Of the 50 field sites, 12 contained
no karst features and 14 sites contained more than 10
features (Fig. 4). Only two sites contained more than 30
features, one with 31 and one with 48.
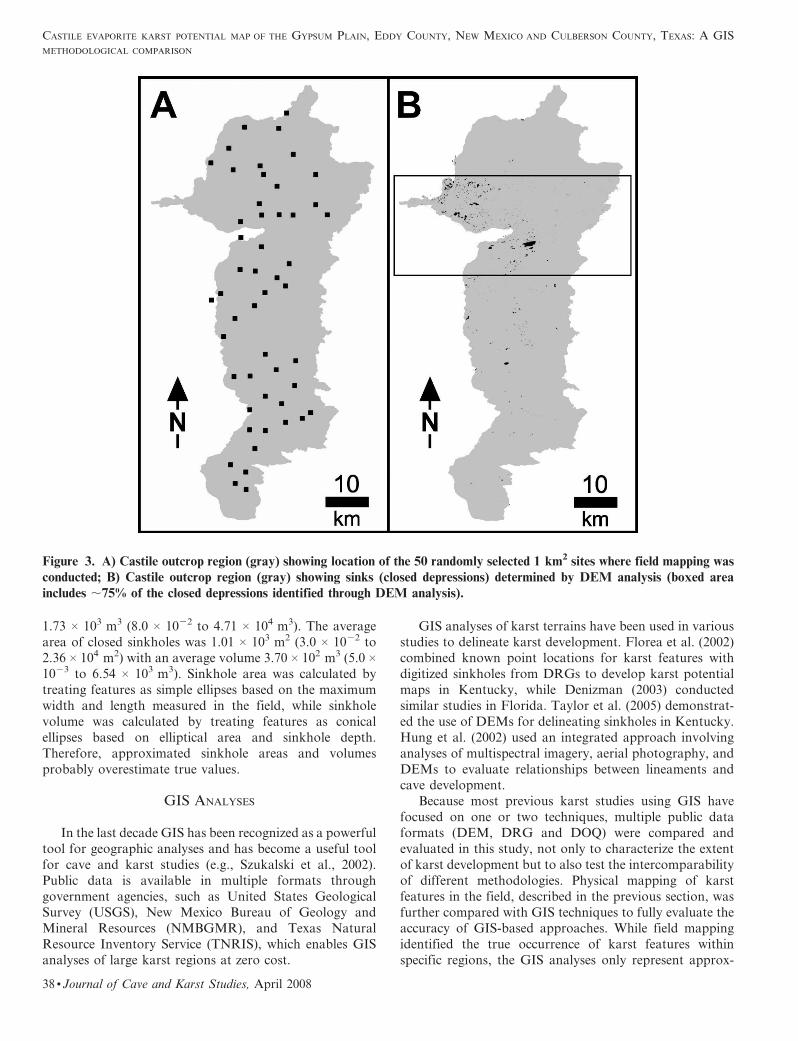
Features were found in a wide range of gypsum fabrics
(Fig. 5). Caves are largely developed in laminated (,43%
of features) (Fig. 5A) and massive fabrics (,26% of
features) (Fig. 5B); however, numerous small surficial
caves form in gypsite (,28% of features) (Fig. 5D). Caves
were occasionally found in selenite (,2% of features)(Fig. 5C) and calcitized masses (,2% of features)
(Fig. 5E). Filled sinkholes were generally found in gypsite
or alluvium; however, this likely only represents surficial
mantling over deeper features in most cases.
Sinkhole area and volume ranged widely within the
surveyed sites. The average open sinkhole area was 1.99 3
103 m2 (0.3 to 4.12 3 104 m2) with an average volume of
Figure 2. Diagrammatic representation of late Permian(Guadalupian and Ochoan) deposits associated with the
Guadalupe Mountains (left) and Delaware Basin (right).
Note that the Castile Formation fills in the basin and marks
the beginning of the Ochoan (dashed white line) (adapted
from Hill, 1996).
K. W. Stafford, L. Rosales-Lagarde, and P. J. Boston
Journal of Cave and Karst Studies, April 2008 N 37
1.73 3 103 m3 (8.0 3 1022 to 4.71 3 104 m3). The average
area of closed sinkholes was 1.01 3 103 m2 (3.0 3 1022 to2.36 3 104 m2) with an average volume 3.70 3 102 m3 (5.0 3
1023 to 6.54 3 103 m3). Sinkhole area was calculated by
treating features as simple ellipses based on the maximum
width and length measured in the field, while sinkhole
volume was calculated by treating features as conical
ellipses based on elliptical area and sinkhole depth.
Therefore, approximated sinkhole areas and volumes
probably overestimate true values.
GIS ANALYSES
In the last decade GIS has been recognized as a powerful
tool for geographic analyses and has become a useful tool
for cave and karst studies (e.g., Szukalski et al., 2002).
Public data is available in multiple formats through
government agencies, such as United States GeologicalSurvey (USGS), New Mexico Bureau of Geology and
Mineral Resources (NMBGMR), and Texas Natural
Resource Inventory Service (TNRIS), which enables GIS
analyses of large karst regions at zero cost.
GIS analyses of karst terrains have been used in various
studies to delineate karst development. Florea et al. (2002)combined known point locations for karst features with
digitized sinkholes from DRGs to develop karst potential
maps in Kentucky, while Denizman (2003) conducted
similar studies in Florida. Taylor et al. (2005) demonstrat-
ed the use of DEMs for delineating sinkholes in Kentucky.
Hung et al. (2002) used an integrated approach involving
analyses of multispectral imagery, aerial photography, and
DEMs to evaluate relationships between lineaments andcave development.
Because most previous karst studies using GIS have
focused on one or two techniques, multiple public data
formats (DEM, DRG and DOQ) were compared and
evaluated in this study, not only to characterize the extent
of karst development but to also test the intercomparability
of different methodologies. Physical mapping of karst
features in the field, described in the previous section, was
further compared with GIS techniques to fully evaluate theaccuracy of GIS-based approaches. While field mapping
identified the true occurrence of karst features within
specific regions, the GIS analyses only represent approx-
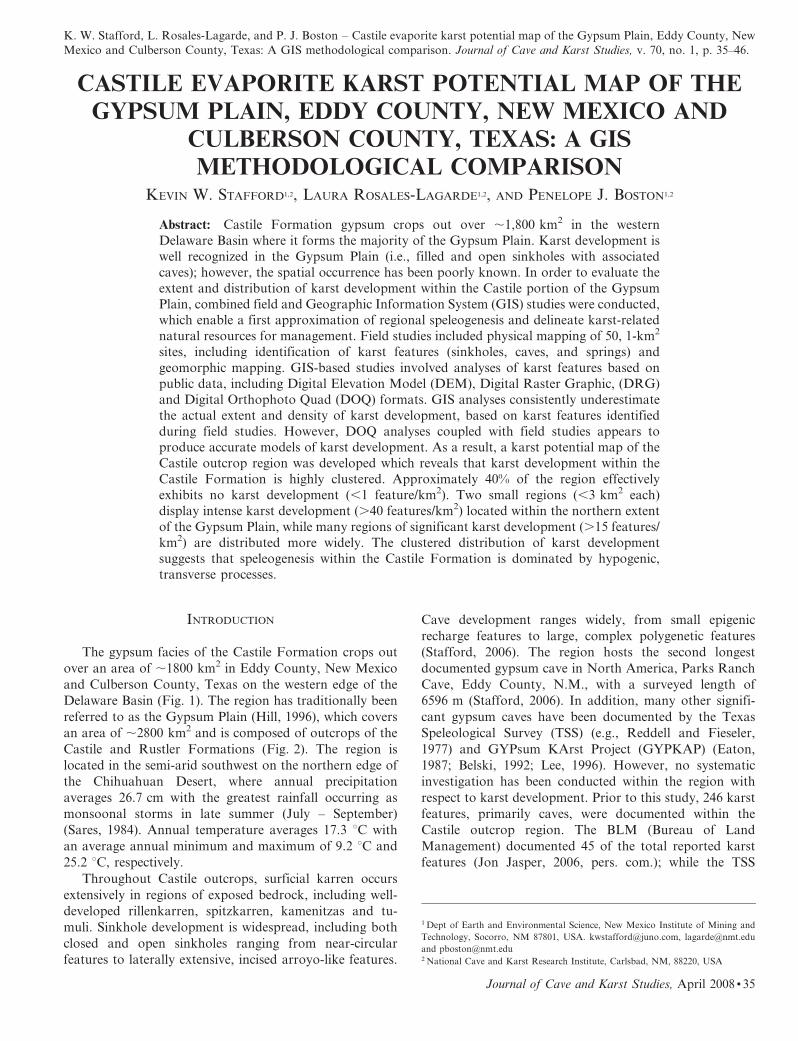
Figure 3. A) Castile outcrop region (gray) showing location of the 50 randomly selected 1 km2 sites where field mapping was
conducted; B) Castile outcrop region (gray) showing sinks (closed depressions) determined by DEM analysis (boxed area
includes ,75% of the closed depressions identified through DEM analysis).
CASTILE EVAPORITE KARST POTENTIAL MAP OF THE GYPSUM PLAIN, EDDY COUNTY, NEW MEXICO AND CULBERSON COUNTY, TEXAS: A GIS
METHODOLOGICAL COMPARISON
38 N Journal of Cave and Karst Studies, April 2008

imations based on the geomorphic expression of karst
features (Fig. 6, 7).
Digital elevation models (DEM) were analyzed to
define closed depressions (i.e., sinks) within the Castileoutcrop region. Closed depressions were identified by
creating a new DEM with filled sinks through GIS
processing, which was compared with the original DEM
to determine the difference between datasets (Fig. 3B, 6B)
(Taylor et al., 2005). The resulting data included 554
individual sinkholes with an average area of 2.57 3 104 m2
(6.0 3 102 to 8.70 3 105 m2); however, approximately 80%
of the identified features occurred within a 26 km (16 mile)wide strip immediately south of the New Mexico–Texas
state line. Less than 5% of the features occurred north of
the strip of abundant closed depressions, while the
remainder was distributed south of the strip (Fig. 6B).
Although all public data used for DEM analyses had 10-
meter postings, the resulting sinkhole map suggests that
there is significant variability in the source material used to
create these DEMs. The region of sinkhole abundanceappears to represent well the actual closed depressions
within the study area, while regions outside this area
appear to significantly underestimate feature abundance.
Digital raster graphics (DRG) of 1:24,000 USGS
topographic maps were analyzed for the study area and
all closed depressions were digitized as indicators of
individual karst features (Fig. 6C, 7B); however, it is likely
that multiple karst features exist within some large, closeddepressions. From DRGs, 552 individual closed depres-
sions were identified (Fig. 7B), with an average area of 1.543 104 m2 (53 m2 to 1.74 3 106 m2), based on GIS spatial
analyses. Because topographic maps of this region are
based on 20 foot (6.1 m) contour intervals, numerous small
sinkholes, including most of the features documented
during field mapping, are not represented. However, most
of the karst features documented by the BLM and TSS are
represented as sinkholes on DRGs because topographicmaps have traditionally been used for locating and
identifying karst features.
Digital orthophoto quads (DOQ) within the studyregion have a resolution of one meter. DOQ analyses were
conducted by visually picking probable karst features
(Fig. 6D) at a resolution of 1:4,000. Features were
identified based on geomorphic expression through com-
parison with known cave and karst features, either
documented by the BLM in New Mexico and the TSS in
Texas or features documented during field mapping. Based
on comparison with known features, 3,237 individualfeatures were identified within the Castile outcrop region
(Fig. 7C).
Spatial analyses of feature densities were performed inorder to delineate karst development within the study area.
Three sets of data were processed separately to evaluate
karst density, including: 1) known caves documented by
the TSS and BLM (Fig. 7D); 2) DRG defined sinks
(Fig. 7E); and 3) features identified through DOQ analyses
(Fig. 7F). Density analyses of features identified from
DEM data was not conducted because of the apparent high
degree of variability in quality of these public data sets. Alldensity analyses indicate intense karst development within
the northwestern portion of the study area and a general
decrease in feature abundance towards the east.
DISCUSSION
Studies conducted to determine the extent and distri-
bution of karst development vary widely (Veni, 2002), but
GIS-based studies have enabled significant advances in
geographic analyses within the last decade. Analyses of
known karst distributions and features identified through
GIS within the Castile outcrop region all show similar
trends for areas of significant karst development. However,
the degree of resolution of various public data used in GISanalyses produces substantial differences in evaluation of
karst development throughout the entire region (Fig. 8),
suggesting that field studies should always be coupled with
any GIS-based studies. Sinkholes identified through DEM
analyses were not used to develop karst density maps
because of the apparent variability within the original data
used to develop the DEMs. However, the DEM variability
illustrates an important point, in that public data must beinterpreted with caution.
Analysis of previously documented cave and karst
features within the Castile outcrop region indicate smallclusters of caves, focused in the northwestern region of the
study area, largely along the dissolutional margin of the
Castile Formation; however, only minor regions of karst
development are observed scattered throughout the rest of
Figure 4. Comparative plot showing karst features identi-fied during field mapping compared with features identified
through DOQ analyses for the 50, 1 km2 field sites. Field
mapping and DOQ analyses are only shown because most
DEM and DRG analyses showed no features in the regions
where field mapping was conducted. Note that DOQ analysis
identified ,35% of features that were located during
field mapping.
K. W. Stafford, L. Rosales-Lagarde, and P. J. Boston
Journal of Cave and Karst Studies, April 2008 N 39
the study area (Fig. 7D). Based on previously documented
features, approximately 95% of the study area effectively
exhibits no karst development (,1 feature/km2). Studies
based on documented karst features inherently create
biased results that may not accurately depict the complete
distribution of karst development. Biases are introduced by
variable access to portions of a karst region, such as
regions where landowner access is not available or regionsthat are remote with poor road access.
Analysis of closed depressions depicted on DRGs
(Fig. 7E) shows similar patterns of karst development as
documented karst distributions (Fig. 7D), but do not show
any regions with densities greater than 10 features/km2.DRG analyses shows greater distributions of karst features
than documented cave analyses, expanding the predicted
boundaries of karst development; however, the majority of
the study area (,90%) still appears to have minimal karst
development (,1 feature/km2). As with analyses of
documented caves, DRGs appear to underestimate the
actual extent of karst development because the contour
interval of DRGs prevents distinguishable representation
of small closed depressions and narrow, incised karst
arroyos.
Analysis of karst features identified on DOQs indicates
a significantly greater degree of karst development density
and distribution (Fig. 7F) as opposed to other GIS-based
analyses. Regions of minimal karst development were
reduced to approximately 50% and several regions with
karst feature densities greater than 15 features/km2 wereidentified. Intense karst development still appears concen-
trated within the northwestern portion of the study area;
however, regions of extensive karst development are
Figure 5. Cave development in the Castile Formation occurs within a wide range of lithologic fabrics. A) Plummet Cave:
laminated gypsum; B) Parks Ranch Cave: massive gypsum; C) Black Widow Hole: selenite; D) Pokey Cave: gypsite, and e)Dead Bunny Hole: biogenic limestone (calcitized evaporite).
CASTILE EVAPORITE KARST POTENTIAL MAP OF THE GYPSUM PLAIN, EDDY COUNTY, NEW MEXICO AND CULBERSON COUNTY, TEXAS: A GIS
METHODOLOGICAL COMPARISON
40 N Journal of Cave and Karst Studies, April 2008

identified throughout the entire western half of the Castile
outcrop area, as well as several smaller regions closer to theeastern margin of the study area. Although DOQ analysis
shows more extensive karst development, it is inherently
biased because features were visually picked based on
comparison with the geomorphic expression of known
features. Comparison of karst features physically docu-mented during field studies with features identified through
DOQ analysis, within the boundaries of field sites mapped,
indicates that DOQ analysis consistently underestimates
Figure 6. Variability in karst identification through various methodologies within a representative 1 km2 field site (each
square region measures 1 km by 1 km). A) filled black circles represent eight karst features documented through physical
mapping of field site; B) original DEM of field site from which no karst features (closed depressions) were identified during
GIS analysis (note darker shading in upper left is the highest elevations); C) DRG of field site showing no closed depressions,
but a blind-terminated, ephemeral stream suggest sink point (arrow); and D) DOQ of field site showing geomorphic variability
and the location of three features (black triangles) which could be resolved through DOQ analysis.
K. W. Stafford, L. Rosales-Lagarde, and P. J. Boston
Journal of Cave and Karst Studies, April 2008 N 41

Figure 7. Comparison of data used for density analyses within the Castile outcrop region (grey). A) point data for individual
karst features previously documented by the TSS and BLM; B) closed depressions digitized from DRGs; C) point data forindividual karst features identified through DOQ analysis; D) karst feature density map based on previously documented karst
features in Fig. 6A; E) karst feature density map based on distribution of individual closed depressions digitized from DRGs
shown in Fig. 6B; and F) karst density map based on features identified through DOQ analysis shown in Fig. 6C. Color shading
in karst density maps represent the number of karst features / km2, where: gray # 1 feature/km2; blue = 125 features/km2;
green = 5210 features/km2; yellow = 10215 features/km2; and red $ 15 features/km2.
CASTILE EVAPORITE KARST POTENTIAL MAP OF THE GYPSUM PLAIN, EDDY COUNTY, NEW MEXICO AND CULBERSON COUNTY, TEXAS: A GIS
METHODOLOGICAL COMPARISON
42 N Journal of Cave and Karst Studies, April 2008
the total number of karst features present (Fig. 4). This
underestimation is likely the result of the 1-meter
resolution of the DOQ public data.
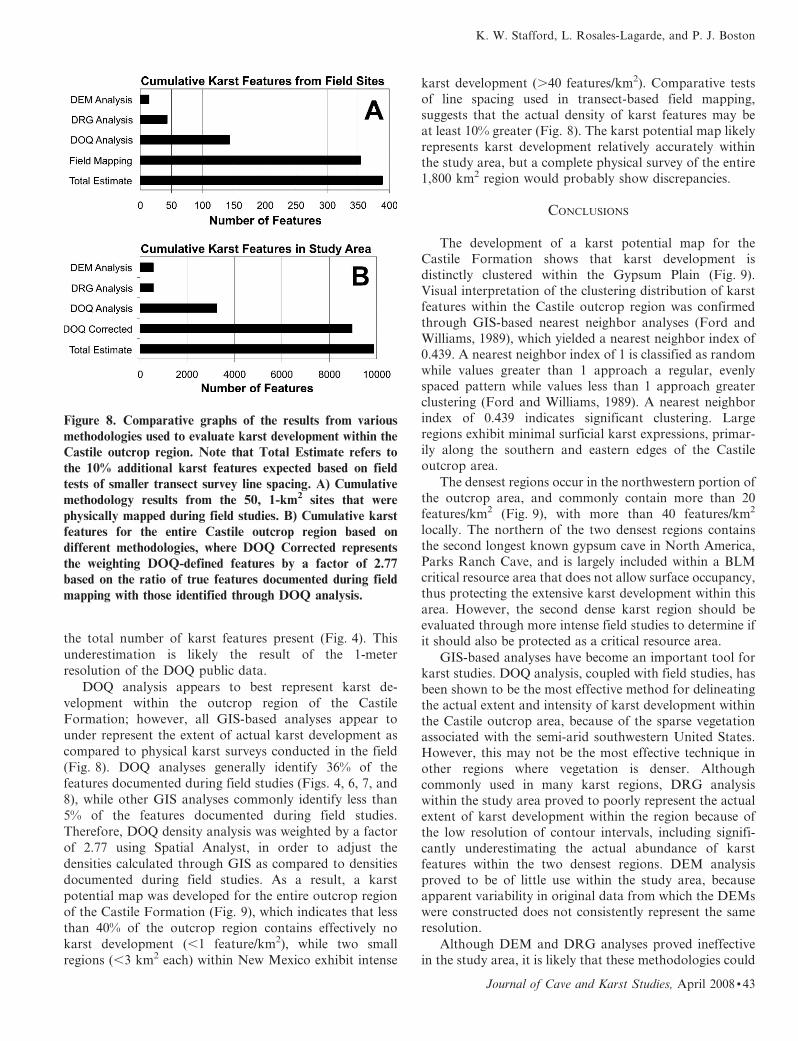
DOQ analysis appears to best represent karst de-
velopment within the outcrop region of the Castile
Formation; however, all GIS-based analyses appear to
under represent the extent of actual karst development as
compared to physical karst surveys conducted in the field
(Fig. 8). DOQ analyses generally identify 36% of the
features documented during field studies (Figs. 4, 6, 7, and
8), while other GIS analyses commonly identify less than
5% of the features documented during field studies.
Therefore, DOQ density analysis was weighted by a factor
of 2.77 using Spatial Analyst, in order to adjust the
densities calculated through GIS as compared to densities
documented during field studies. As a result, a karst
potential map was developed for the entire outcrop region
of the Castile Formation (Fig. 9), which indicates that less
than 40% of the outcrop region contains effectively no
karst development (,1 feature/km2), while two small
regions (,3 km2 each) within New Mexico exhibit intense
karst development (.40 features/km2). Comparative tests
of line spacing used in transect-based field mapping,
suggests that the actual density of karst features may be
at least 10% greater (Fig. 8). The karst potential map likely
represents karst development relatively accurately withinthe study area, but a complete physical survey of the entire
1,800 km2 region would probably show discrepancies.
CONCLUSIONS
The development of a karst potential map for theCastile Formation shows that karst development is
distinctly clustered within the Gypsum Plain (Fig. 9).
Visual interpretation of the clustering distribution of karst
features within the Castile outcrop region was confirmed
through GIS-based nearest neighbor analyses (Ford and
Williams, 1989), which yielded a nearest neighbor index of
0.439. A nearest neighbor index of 1 is classified as random
while values greater than 1 approach a regular, evenlyspaced pattern while values less than 1 approach greater
clustering (Ford and Williams, 1989). A nearest neighbor
index of 0.439 indicates significant clustering. Large
regions exhibit minimal surficial karst expressions, primar-
ily along the southern and eastern edges of the Castile
outcrop area.
The densest regions occur in the northwestern portion of
the outcrop area, and commonly contain more than 20
features/km2 (Fig. 9), with more than 40 features/km2
locally. The northern of the two densest regions contains
the second longest known gypsum cave in North America,Parks Ranch Cave, and is largely included within a BLM
critical resource area that does not allow surface occupancy,
thus protecting the extensive karst development within this
area. However, the second dense karst region should be
evaluated through more intense field studies to determine if
it should also be protected as a critical resource area.
GIS-based analyses have become an important tool for
karst studies. DOQ analysis, coupled with field studies, has
been shown to be the most effective method for delineating
the actual extent and intensity of karst development within
the Castile outcrop area, because of the sparse vegetationassociated with the semi-arid southwestern United States.
However, this may not be the most effective technique in
other regions where vegetation is denser. Although
commonly used in many karst regions, DRG analysis
within the study area proved to poorly represent the actual
extent of karst development within the region because of
the low resolution of contour intervals, including signifi-
cantly underestimating the actual abundance of karstfeatures within the two densest regions. DEM analysis
proved to be of little use within the study area, because
apparent variability in original data from which the DEMs
were constructed does not consistently represent the same
resolution.
Although DEM and DRG analyses proved ineffective
in the study area, it is likely that these methodologies could
Figure 8. Comparative graphs of the results from various
methodologies used to evaluate karst development within theCastile outcrop region. Note that Total Estimate refers to
the 10% additional karst features expected based on field
tests of smaller transect survey line spacing. A) Cumulative
methodology results from the 50, 1-km2 sites that were
physically mapped during field studies. B) Cumulative karst
features for the entire Castile outcrop region based on
different methodologies, where DOQ Corrected represents
the weighting DOQ-defined features by a factor of 2.77based on the ratio of true features documented during field
mapping with those identified through DOQ analysis.
K. W. Stafford, L. Rosales-Lagarde, and P. J. Boston
Journal of Cave and Karst Studies, April 2008 N 43

Figure 9. Karst potential map of the Castile Formation outcrop region defined in this study. Note the two dense areas of karst
development within the northern portion of the study area with densities greater than 40 features/km2.
CASTILE EVAPORITE KARST POTENTIAL MAP OF THE GYPSUM PLAIN, EDDY COUNTY, NEW MEXICO AND CULBERSON COUNTY, TEXAS: A GIS
METHODOLOGICAL COMPARISON
44 N Journal of Cave and Karst Studies, April 2008
be effective for delineating karst development in other
regions where higher resolution DEM or DRG data is
available. Ultimately, the scale of karst features within
regions being evaluated with GIS methodologies must be
compared with the resolution of available GIS data, in
order to determine the effectiveness of GIS-based studies.
Therefore, caution must be taken when conducting GIS-
based karst analyses, which should always be coupled with
field studies for verification, not only in densely karsted
areas, but also in regions that appear to have minimal karst
development.
The distinct clustering pattern of karst provides some
insight into the nature of speleogenesis within the region
(Figs. 7, 9). Klimchouk (2003) and Frumkin and Fisch-
hendler (2005) suggest that hypogenic karst tends to form
in dense clusters separated by regions of minimal karst
development because heterogeneities within soluble strata
promote transverse speleogenesis in regions where rising
fluids become focused along favorable flow paths. In
contrast, epigenic karst is generally expressed as more
widely distributed features where descending meteoric
waters attempt to utilize all available irregularities near
the surface and converge with depth. Because convergence
occurs with depth in epigenic karst, surficial expressions
tend to be less clustered in epigenic dominated karst as
opposed to hypogenic karst where convergence occurs near
the surface.
Current studies of karst development within the Castile
Formation by the authors have found significant morpho-
logical evidence within individual caves that supports the
interpretation of speleogenesis dominated by hypogene
processes. These include the diagnostic suite of hypogenic
features (e.g. risers, channels and cupolas) reported by
Klimchouk (2007), as well as the widespread occurrence of
blanket breccias (Anderson et al., 1978), breccia pipes
(Anderson and Kirkland, 1980), evaporite calcitization
(Kirkland and Evans, 1976) and native sulfur deposits
(Hentz and Henry, 1989) previously reported within the
region. Current research is focusing on interpreting the
speleogenetic evolution of the Castile Formation, including
the diagenetic alteration of calcium sulfate rocks and the
development of cavernous porosity. However, this is
beyond the scope of this manuscript and will be reported
separately in the near-future. While GIS-based analyses
provide insight into the speleogenetic processes of the
region, detailed field studies of specific features will be
required in order to interpret the speleogenetic evolution of
the region.
While the karst potential map of the Castile Formation
outcrop region alone can only provide limited insight into
regional speleogenesis, it can provide an effective tool for
land management within Eddy County, New Mexico and
Culberson County, Texas. Delineation of karst intense
regions can be used in land management planning for road
construction and oilfield well and pipeline placements, in
order to not only avoid regions of potential geohazards
associated with collapse, but also to protect regions of
significant ground-water recharge. Whether Castile karst isprimarily the result of hypogenic or epigenic speleogenesis,
most exposed features currently act as ground-water
recharge features, thus the delineation of dense karst regions
is crucial for the sustained management of sparse water
resources within this portion of the semi-arid southwest.
Ultimately, karst potential maps can be used to delineate
sensitive regions for karst resource management.
ACKNOWLEDGEMENTS
The authors are indebted to Jack Blake, Draper
Brantley, Stanley Jobe, Lane Sumner and Clay Taylor
for their generous access to private ranches in Texas
throughout this study. Tim Hunt provided useful in-
formation and assistance with University Land in Texas.
Jon Jasper and Jim Goodbar provided essential informa-
tion about known gypsum karst development within New
Mexico. Jim Kennedy provided essential informationabout known gypsum karst development within Texas.
The authors are thankful for the useful comments provided
by an anonymous reviewer and Amos Frumkin which
helped to improve this manuscript. This research was
partially funded through grants from the New Mexico
Geological Society and the New Mexico Tech Graduate
Student Association and support from the National Cave
and Karst Research Institute (NCKRI).
REFERENCES
Anderson, R.Y., Dean, W.E., Kirkland, D.W., and Snider, H.I., 1972,Permian Castile varved evaporite sequence, West Texas and NewMexico: Geological Society of America Bulletin, v. 83, p. 59–85.
Anderson, R.Y., Kietzke, K.K., and Rhodes, D.J., 1978, Development ofdissolution breccias, northern Delaware Basin and adjacent areas:New Mexico Bureau of Mines and Mineral Resources Bulletin 159,p. 47–52.
Anderson, R.Y., and Kirkland, D.W., 1980, Dissolution of salt depositsby brine density flow: Geology, v. 8, p. 66–69.
Belski, D., ed., 1992, GYPKAP Report Volume #2: Southwestern Regionof the National Speleological Society, Albuquerque, N.M., 57 p.
Denizman, C., 2003, Morphometric and spatial distribution parameters ofkarstic depressions, lower Suwannee River basin, Florida: Journal ofCave and Karst Studies, v. 65, no. 1, p. 29–35.
Dietrich, J.W., Owen, D.E., Shelby, C.A., and Barnes, V.E., 1995,Geologic atlas of Texas: Van Horn-El Paso Sheet: University of TexasBureau of Economic Geology, Austin, Texas,
Eaton, J., ed., 1987, GYPKAP 1987 Annual Report: Southwestern Regionof the National Speleological Society, Alamogordo, N.M., 35 p.
Florea, L.J., Paylor, R.L., Simpson, L., and Gulley, J., 2002, Karst GISadvances in Kentucky: Journal of Cave and Karst Studies, v. 64,no. 1, p. 58–62.
Ford, D.C., and Williams, P.W., 1989, Karst Geomorphology andHydrology: London, Unwin Hymam, 601 p.
Frumkin, A., and Fischhendler, I., 2005, Morphometry and distributionof isolated caves as a guide for phreatic and confined paleohydrolo-gical conditions: Geomorphology, v. 67, p. 457–471.
Hentz, T.F., and Henry, C.D., 1989, Evaporite-hosted native sulfur inTrans-Pecos Texas: Relation to late-phase Basin and Range de-formation: Geology, v. 17, p. 400–403.
Hill, C.A., 1996, Geology of the Delaware Basin, Guadalupe, Apache andGlass Mountains: New Mexico and West Texas: Permian BasinSection: Midland, Texas, SEPM, 480 p.
K. W. Stafford, L. Rosales-Lagarde, and P. J. Boston
Journal of Cave and Karst Studies, April 2008 N 45

Horak, R.L., 1985, Trans-Pecos tectonism and its affects on the PermianBasin, in Dickerson, P.W., and Muelberger, W.R., eds., Structure andTectonics of Trans-Pecos Texas: Midland, Texas, West Texas Geo-logical Society, p. 81–87.
Hose, L.D., and Pisarowicz, J.A., eds., 2000, The Caves of the GuadalupeMountains: Journal of Cave and Karst Studies, v. 62, no. 2, 157 p.
Hung, L.Q., Dinh, N.Q., Batelaan, O., Tam, V.T., and Lagrou, D., 2002,Remote sensing and GIS-based analysis of cave development in theSuoimuoi Catchment (Son La – NW Vietnam): Journal of Cave andKarst Studies, v. 64, no. 1, p. 23–33.
Kelley, V.C., 1971, Geology of the Pecos Country, Southeastern NewMexico: New Mexico Bureau of Mines and Mineral Resources, 78 p.
Kendall, A.C., and Harwood, G.M., 1989, Shallow-water gypsum in theCastile Formation – significance and implications, in Harris, P.M.,and Grover, G.A., eds., Subsurface and Outcrop Examination of theCapitan Shelf Margin, Northern Delaware Basin: SEPM, CoreWorkshop No. 13, San Antonio, Texas, p. 451–457.
Kirkland, D.W., and Evans, R., 1976, Origin of limestone buttes, GypsumPlain, Culberson County, Texas: American Association of PetroleumGeologists Bulletin, v. 60, p. 2005–2018.
Klimchouk, A., 1996, Dissolution and conversion of gypsum andanhydrite: International Journal of Speleology, v. 25, no. 3–4,p. 263–274.
Klimchouk, A., 2000a, Speleogenesis in gypsum, in Klimchouk, A., Ford,D.C., Palmer, A.N., and Dreybrodt, W., eds., Speleogenesis:Evolution of Karst Aquifers: Huntsville, National SpeleologicalSociety, Inc., p. 261–273.
Klimchouk, A., 2000b, Speleogenesis under deep-seated and confinedconditions, in Klimchouk, A., Ford, D.C., Palmer, A.N., andDreybrodt, W., eds., Speleogenesis: Evolution of Karst Aquifers:Huntsville, National Speleological Society, Inc., p. 244–260.
Klimchouk, A., 2003, Conceptualization of speleogenesis in multi-storyartesian systems: a model of transverse speleogenesis: Speleogenesisand Evolution of Karst Aquifers, v. 1, no. 2, p. 1–18.
Klimchouk, A., 2007, Hypogene Speleogenesis: Hydrogeological andMorphometric Perspective: Carlsbad, National Cave and KarstResearch Institute, Special Paper No. 1, 106 p.
Lee, J., ed., 1996, GYPKAP Report Volume 3: Southwestern Region ofthe National Speleological Society, 69 p.
Machel, H.G., and Burton, E.A., 1991, Burial-diagenetic sabkha-likegypsum and anhydrite nodules: Journal of Sedimentary Petrology,v. 61, no. 3, p. 394–405.
Reddell, J.R., and Fieseler, R.G., 1977, The Caves of Far West Texas:Austin, Texas Speleological Survey, 103 p.
Sares, S.W., 1984, Hydrologic and geomorphic development of a low reliefevaporite karst drainage basin, southeastern New Mexico [M.S.Thesis]: Albuquerque, University of New Mexico, 123 p.
Stafford, K.W., 2006, Gypsum karst of the Chosa Draw area, in Land, L.,Lueth, V.W., Raatz, W., Boston, P., and Love, D., eds., Caves andKarst of Southeastern New Mexico: Socorro, New Mexico GeologicalSociety Fifty-seventh Annual Field Conference, New Mexico Geo-logical Society, p. 82–83.
Szukalski, B.W., Hose, L.D., and Pisarowicz, J.A., eds., 2002, Cave andkarst GIS: Journal of Cave and Karst Studies, v. 64, no. 1, 93 p.
Taylor, C.J., Nelson, H.L., Hileman, G., and Kaiser, W.P., 2005,Hydrogeologic-framework mapping of shallow, conduit-dominatedkarst — components of a regional GIS-based approach, in U.S.Geological Survey Karst Interest Group Proceedings, Rapid City,South Dakota, U.S. Geological Survey Scientific InvestigationsReport 2005–5160, p. 103–113.
Veni, G., 2002, Revising the karst map of the United States: Journal ofCave and Karst Studies, v. 64, no. 1, p. 45–50.
CASTILE EVAPORITE KARST POTENTIAL MAP OF THE GYPSUM PLAIN, EDDY COUNTY, NEW MEXICO AND CULBERSON COUNTY, TEXAS: A GIS
METHODOLOGICAL COMPARISON
46 N Journal of Cave and Karst Studies, April 2008