Embed Size (px)
Citation preview

Half-year consolidated financial report 2018
CASTA DIVA GROUP S.P.A.
CONSOLIDATED MID-TERM FINANCIAL REPORT
UP TO 30TH JUNE 2018
Approval: Board Committee 27th September 2018

Half-year consolidated financial report 2018
Pag. 2
INDEX
CORPORATE GOVERNANCE .............................................................................................................................. 3
MID-TERM MANAGEMENT REPORT ................................................................................................................. 4
CONSOLIDATED FINANCIAL STATEMENT CHARTS UP TO 30TH JUNE 2018 .................................................. 10

Half-year consolidated financial report 2018
Pag. 3
CORPORATE GOVERNANCE
The holding and its subsidiaries are using the so-called “traditional system” for management and control. In
particular, the Shareholders Committee of Blue Note S.p.A. (Casta Diva Group S.p.A. from 5th August) on
20th July 2016 has deliberated, for a three-year period, starting from the merging operation date, as follows:
- The Board has sole responsibility in managing the company;
- The Board of Statutory Auditors will monitor how to proceed according to the law, the Resolution
Board and administration procedures;
- The auditing company.
The Board
Andrea Giovanni Rodolfo De Micheli – Chairman and Board Member
Luca Rodolfo Guido Oddo – CEO and Board Member
Francesco Merone – Board Member (since 30th May 2018)
Gianluigi Rossi – Board Member
Vittorio Giaroli – Independent Advisor
Board of Auditors
Monica Mannino – Chairman
Andrea Pozzolini – Statutory auditor
Davide Mantegazza – Statutory auditor
Mauro Lorini – Substitute Statutory auditor
Gaetano Pignatti – Substitute Statutory auditor
Auditing company
Ernst & Young S.p.A.

Half-year consolidated financial report 2018
Up to the 30th June 2018, based on the companies’ information, the Group share capital was:
- Reload S.r.l 72,27%
- Market 27,19%
Own shares up to the 30th June 2018 are equal to 68.500, 0,54%, equivalent 104.000 Euro.
As listed on AIM Milano, on Friday 29th June 2018, the share closing price of Casta Diva Group S.p.A was equal to 1.62 Euro, equivalent to a capitalisation of over 20 Million
Euro.
Casta Diva Group S.p.A., with its subsidiaries, operates in Italy and abroad in the field of communications for companies and contents creation.
The Group is located in Milan and operates, through 100% controlled companies or controlled by local partners, in Italy, UK, Czech Republic, Turkey, Lebanon, South Africa,
US, China, Dubai (recently established, operating from second semester of 2018) and Argentina.
The Group mainly operates in two areas of Digital & Live Communications:
1. Spots department (and Digital Video Content), that creates spots and adverts, digital and viral videos, web series, branded content and it is managed by the
subsidiaries Casta Diva Pictures, operating worldwide.
2. Events department (or Live & Digital Communication), that creates and manages conventions, web events, road shows, stands, team building, product launches,
press conferences, experiential events as test drive for car makers companies, concerts and festival, all areas of live communications, for companies (B2B) and
consumers (B2C), managed by Casta Diva Events S.r.l., whereas B2B/B2C and Blue Note Milano for in-house live concerts.
The Group has gained clear skills in Digital Communications and is also developing own production projects for Cinema and TV. It operates in all sectors described below.
MANAGEMENT REPORT
Dear Shareholders,
This report has been written according to article 2428 of the civil code; it provides relevant information on the financial status, assets and management of Casta Diva Group
S.p.A. and its group (“CDG Group”).
MAIN FACTS IN 2018
We are going to sum up the main facts that took place from the first semester of 2018. Please check the link below for the press release.
Share capital increase 2018
On the 10th June 2018, the Board of Casta Diva Group during the notary session, in partial operation of the delegation conferred by the extraordinary general meeting on the
18th of July 2016, has declared to increase, divisible and chargeable, the share capital for a maximum amount of 380.000 Euro, of which 285.000,00 Euro through share
premium, through the emission with exclusion of the right of option for the existing members, for the price of Euro 2,00 per share, with a maximum of 190.000,00 new
ordinary shares. The shares will be offered in subscription, in compliance with law. 2441 paragraph 5 of the Civil code for the company administrators, employees and
collaborators (in Italy and abroad) who went the extra mile in reaching the company targets.
http://www.castadivagroup.com/wp-content/uploads/2016/06/2018-01-10-0941pm-CDG-CS-CDA-e-Bracknor.pdf
Job reference Spot in South Africa with our client Alibaba
CDG, on 18th January, announces to have won the bidding, through our branch Casta Diva Cape Town, for the production project of 3 adverts for the Alibaba Group, thanks
to Shanghai Red Horse Advertising Media Co., Ltd., partner of Joint Venture Casta Diva China Co., Ltd. The spots will be produced in South Africa and the total value of the
signed contract is approximately 500.000 Dollars.
http://www.castadivagroup.com/wp-content/uploads/2018/03/2018-01-18-1010pm-CDG-CS.pdf
BLUE NOTE OFF
On 24th June the first part of the program of Blue Note Off has been presented at Sisal Wincity in Piazza Diaz, the new brand of Blue Note Milano (part of Casta Diva Group),
aiming at reaching unconventional venues for jazz music. Blue Note Milano, and its brand Blue Note Off, wants to offer to a bigger audience an opportunity to see international
artists and new talents in different parts of the city.
The Blue Note Off calendar starts from Sisal Wincity in Piazza Diaz and includes 14 concerts from 5th February featuring Ragonese Bros, Naim, “Lands Project” Decorato and
Costantini, Pat Rich, Lady Dillinger and many others.
http://www.castadivagroup.com/wp-content/uploads/2016/06/2018-01-24-1138am-CDG-CS-Blue-Note-Off1.pdf
Cash pooling 2018
In February CDG has signed a cash pooling contract with MPS bank, later with Unicredit. This type of cash pooling is Zero balance system. With the zero balance system, a
single company of the group (CDG/the pooler) manages a centralised bank account (pool account), where the transactions of all other company accounts are paid into. Hence,
the pooler will manage all centralised financial needs and all relations with the creditors. The pooler will deal with the liquidation of interest income and expense, calculated
by adding them up for all companies of the group and will provide the pooling participants with a bank statement.

Half-year consolidated financial report 2018
Pag. 5
This is a daily system and Casta Diva Pictures S.r.l, Casta Diva Events S.r.l. and Blue Note S.r.l. will be using it.
Casta Diva operating in the TV series industry
On the 7th of February, Casta Diva Pictures Lebanon enters the world of Tv series with an investment of 250 thousand dollars. The company will invest without contacting a
bank, thanks to the free cash flow production from 2017. CDP Beirut will take part, with other local investors, in the production of a new TV series with a cost budget of
550.000 dollars and revenue, for 2018, of 1,277 million dollars. CDG indirect commitment (that contributes to Casta Diva Pictures Lebanon share capital with a share of 50,
1%) is about $ 125,000, forecasting revenue for CDG in 2018 over twice this figure. This TV series will be produced in April, May and June and broadcasted in September 2018.
The project is “AWAKE”, a well-structured family-drama, which tells the story of Dana, the main character, a Lebanese girl in her 30s’. She wakes up after being going in a
coma and finds out that her parents got divorced, her sisters grew older, her boyfriend got married to someone else and the Master dissertation project she wrote with one
of her university colleagues became an advertising agency. Soon, the secrets bound to her coma get disclosed; once again, she has to face her past and make difficult decisions
for her future.
http://www.castadivagroup.com/wp-content/uploads/2016/06/2018-02-07-0451pm-CDG-CS-CDP-LIBANO-AWAKE.pdf
Trade Agreement with Class CNBC
CDG, on the 8th of May, announces through Casta Diva Financial Events S.r.l. (CDEF) the trade agreement with CLASS CNBC and a new brand launch, Casta Diva Forums (CDF),
which will broadcast 40 shorts on blockchain and the best ICOs, for a total of 240 replica. The shows are produced at Nasdaq in New York; the conferences are organised by
the company and divided into educational on one side, on blockchain apps and interviews with Casta Diva Forums CEOs clients on the other side. The clients will introduce to
the investors their companies and ICO in preparation.
http://www.castadivagroup.com/wp-content/uploads/2018/05/2018-05-08-0700am-CDG-CS-CDF-Accordo-CNBC.pdf
Governance re-structuring for Casta Diva Group
The Board of Casta Diva Group, on the 30th of May, has nominated Andrea De Micheli as Chairman of the Group, Luca Oddo as CEO and co-opted Francesco Merone onto
the Board, appointing him as Managing Director of the Group.
Andrea De Micheli, in his new role, will be managing all institutional relations and will follow new businesses, mainly in high tech and the movie industries.
Luca Oddo, as the CEO of the Group, will focus on strengthening the international network, especially in China and the Middle East, and will implement new models of
integrated communications to meet the markets needs for the main players in the world of advertising.
The co-optation onto Advisor and Managing Director of Francesco Merone, who still is the Chief Financial Officer, is a great step, which will be beneficial to the whole network.
http://www.castadivagroup.com/wp-content/uploads/2018/05/2018-05-30-0915pm-CDG-Nomine-CDA.pdf
“BREAK THE TABOO”, SPOT PRODUCED BY THE ARGENTINE SOCIETY OF UROLOGY IS AWARDED WITH THE SILVER LION AT CANNES LIONS 2018
On the 20th June, CDG announced that “Break the Taboo”, spot produced by the Argentine Society of Urology won the Silver Lion for the Healthcare category at Cannes
Lions 2018. This prize has been awarded at the International Festival of Creativity 2018, the most important international event in advertising, where professionals in this
field celebrate the best world productions from the previous year.
“Break the Taboo”, produced by the subsidiary Casta Diva Pictures SA, located in Buenos Aires, is an awareness campaign for prostate cancer prevention, directed by Jonathan
Perel, featuring Grey Argentina.
https://www.castadivagroup.com/wp-content/uploads/2018/06/2018-06-20-0508pm-CDG-Premio-Cannes.pdf
Industrial Plan 2018 - 2020
On 21st of June, the Board of Casta Diva Group S.p.A. has approved the Strategic Plan 2018-2020. Its goals could be quickly reached by M&A, which is the main strategic
guideline for all business areas. As per our recent acquisitions, the selection of target companies will take place by integrating supply and creative chains and penetrating new
markets, increasing marginalisation of the Group. In the three-year period 2018-2020, the Group will be focusing on marginality increase more than on the volumes
development, as already implemented and highlighted in the consolidated sheet 2017. The strategic targets include reaching adjusted EBITDA margin of 8% in 2018, then
reaching 10% in 2020. In the previous plan, It was forecasted a revenue of 33,5 Million Euro in 2019, in order to reach adjusted EBITDA of 2,5 Million Euro, equal to 8% of the
production value. After the plan update, the target of marginality is forecasted to be reached in 2018, one year earlier, and overcome the result in 2019. The Net Financial
Position trend forecast, as strategic target in 2020, would be equal to -3,0 Million Euro (positive liquidity), resulting in efficient cash management.

Half-year consolidated financial report 2018
Pag. 6
This is a chart of the most important index for the new industrial plan (Production Value, Ebitda, Ebitda Margin and Net Financial Position):
http://castadivagroup.com/investor-relations/presentazioni/ .
https://www.castadivagroup.com/wp-content/uploads/2018/06/2018-06-21-0341pm-CDG-CS-Piano-2018-2020.pdf
Analysis of economic, capital and financial results
In this section you can find the most important information regarding the capital and financial situation of the companies, for a better understanding of the main factors of
management.
MAIN CONSOLIDATED INDEX OF CASTA DIVA GROUP UP TO 30.06.18 IN COMPARISON TO RESULTS UP TO 30.06.2017
Casta Diva Group - Consolidated
(Amounts in thousand Euro) 30.06.2018 30.06.2017 Variation Var. %
Production value
10.814 12.330 (1.516) -12%
Production costs (11.411) (12.074) 663 -5%
Net operating margin (597) 256 (853) -333%
Ammortisation and depreciation (654) (374) (279) 74,6%
Risk provision 0 (45) 45 -100,0%
Ebitda 56 675 (619) -91,7%
Ebitda Percentage 1% 5%
Extraordinary expenses (747)
- (747) -
Adjusted EBITDA 803 675 128 19%
Adjusted EBITDA percentage 7,4% 5,5%
Interest and financial expenses (133) (78) (55) 70%
Ammortisation and depreciation (654) (374) (279) 75%
Risk provision 0 (45) 45 -100%
Extraordinary expenses (747) 0 (747) -
Taxes (252) (252) -11,9% 0,0%
Net profit (982) (74) (908) 1226%
Net profit of third party 146 445 (299) -67%
Net Profit (of minority) (1.128) (519) (609) 117%
Equity 6.789 5.748 1.040 18%
Adjusted EBITDA has been calculated deducting non-recurring expenses from operational costs in this first semester 2018 (extraordinary and non recurring expenses are no
longer highlighted in the chart from the income statement, section E, in compliance to IV legislation CEE) that refer to:
extraordinary bonus, given to national and international management, as explained in a press release, for a value of approximately 240.000 Euro;
approximately 50.000 euro for extraordinary and non-recurring cost for an employee of Casta Diva Events;
approximately 330.000 euro of total costs (equipment, services costs, advisory services, legal costs, insurance costs and other general expenses) paid by Casta Diva
Events for taking part in a bidding in Public Administration, ended negatively due to a legal case;
approximately 142.000 euro regarding legal and administrative costs due to a legal case ended positively. No other liabilities are expected for the Group.

Half-year consolidated financial report 2018
Pag. 7
The consolidated production value is equal to 10.814 thousand Euro, decreasing by 1.516 thousand in comparison to the six-month consolidated up to 30.06.2017.
Below the distribution of production value generated by the Italian companies in comparison to the branches abroad:
(amounts in thousand Euro)
CDG Group Italy Abroad Total
Production Value
6.114
4.699
10.814
The Italian share is 57% of the total value.
The production value decrease is a consequence of external factors, such as the currency rate of the Turkish Lira and Argentinian Pesos that, over the past months, have lost
up to 50% of their value. This affected negatively the Group figures.
Apart from this loss due to the currency rate, CDP Argentina and CDP Turkey have increased their revenue by more than 20%.
External operational costs percentage is constantly decreasing in comparison to proceeds; also, in the first semester of 2018, we have been focusing on adjusting operational
costs for the market. Trade agrrements have been revised, together with incentive politiciesfixed costs to adjust the costs structure with proceeds.
Thanks to careful trading policies, operational marginality (Adjusted EBITDA) has increased by 18,5%, from approximately 675.000 Euro to more than 800.000. The relation
between Production Value and Adjusted Ebitda has increased by 3% in 2016, up to 5,5% on 30th June 2017 and up to 7,3% in the first semester of 2018, according to the
Industrial Plan 2018/2020.
Ammortisation increased in comparison to the semester 2017 because the company is investing in Information Technology. Also, ammortisation and depreciation increased:
in this case, as mentioned above, the company is carrying on rationalisation activities for the branches in Italy and abroad: this includes reserves distribution, provision risks
and depreciation of some assets.
Consolidated Balance Sheet
The chart below is the balance sheet of the Group up to 30.06.2018, in comparison to the figures up to 30.06.2017
Semestrial consolidated
(amounts in thousand euro) 30.06.2018 31.12.2017 Variation Var. %
Consolidated Balance Sheet
Intagible Fixed assets 4.975 4.527 448 10%
Tangible fixed assets 272 286 (14) -5%
Financial assets 298 153 145 95%
Total fixed asset 5.545 4.966 579 12%
Trade receivables 7.089 6.209 880 14%
(Trade payables) (4.409) (4.397) (11) 0%
Inventory 510 287 223 78%
Other assets 2.337 2.102 234 11%
Other liabilities (2.065) (2.482) 417 -17%
Net working capital 3.461 1.719 1.742 1
Nest invested capital 9.006 6.685 2.322 0
Financial receivables (942) (1.642) 700 -43%
Cash and cash equivalents (649) (2.068) 1.419 -69%
(Financial debts) 3.511 1.874 1.637 87%
Net financial position 1.920 (1.837) 3.757 -205%
Share capital and reserves 7.771 9.204 (1.433) -16%
Profit/loss of the year (982) (1.315) 333 -25%
Equity 6.789 7.889 (1.101) -14%
TFR funds 298 633 (335) -53%
Total sources 9.006 6.685 2.321 35%

Half-year consolidated financial report 2018
Pag. 8
The increase of intangible fixed assets is related to capitalised costs for investments in IT, aimed at improving the Group productivity and security.
The net working capital (trade receivables plus Inventory minus Trade payables) keeps on increasing in comparison to 2017, from 1,179 Million Euro value to 3,699 Million
Euro, as a constant increase of operational activity. The NWC increase has been supported by external finance companies.
Consolidated financial situation
Net financial position is 1.920 thousand Euro.
Consolidated Net Financial Position 30.06.2018 31.12.2017 Variation Var. %
Financial receivables (942) (1.642) 700 -43%
Cash and cash equivalent (649) (2.068) 1.419 -69%
(Financial debts) 3.511 1.874 1.637 87%
Net financial position 1.920 (1.837) 3.757 -205%
This chart highlights cash flows related to half-year consolidated figures in 2018, starting from cash, as stated on the consolidated balance sheet up to 31.12.2017.
The net financial position decrease is a consequence of the increase of NWC, M&A activities and investments mentioned in the Industrial Plan 2018/2020.
STAFF AND WORKING ENVIRONMENT
This chart summerises the number of employees:
Description 30.06.2018 30.06.2017
Managers
2
1
Employes Italy
30
27
Contractors Italy
9
8
Employes Abroad
30
27
Other collaborators
5
1
Total 71 63
Apart from the figures mentioned in the previous chapters, this chart shows that the Group is developing and keeps on investing, also in human resources. The increase of 8
people from 2017 to 2018 shows value of approximately 13%.
MAIN FACTORS AFTER 30.06.2018
LONG TERM INCENTIVE PLANS FOR ADMINISTRATORS, MANAGERS AND EMPLOYEES OF THE GROUP AND ITS SUBSIDIAREIS
On 12th July , the Board of Casta Diva has approved incentive plans for administrators, managers and employes of Casta Diva Group S.p.A. and its Italian subsidiaries, as
appointed by the Board itself. These plans include incentives (in shares for the administrators) measured by achieving and overcoming (+15%) the strategic targets in terms
of consolidated EBITDA. This’s been stated in the “STRATEGIC PLAN 2018-2020”, approved by the Board on the 21st of June, as specific strategic targets in terms of EBITDA
and/or Gross Margin (“GM”), individually for the Group subsidiaries, determined in specific annual budgets for 2018-2020.
Bonuses are in company’s shares, at a price equal to the arithmetic mean of the market prices from the last two months, prior to the approval date of the relevant consolidated
financial statement, however not less than 2,00 Euro, with a lock-up of 12 months. The maximum combined total of new issue shares in the three-year-period 2019-2021
could amount to n. 363.796 shares, based on estimated theoretical prices, equal to 2,8% of the total number of the company’s outstanding shares following the emission of
the shares (total number of outstanding shares 13.079.673).
https://www.castadivagroup.com/wp-content/uploads/2018/07/2018-07-12-0446pm-CDG-Approvazione-piano-di-incentivi.pdf

Half-year consolidated financial report 2018
Pag. 9
CASTA DIVA GROUP ACQUIRES 51% OF G.2 EVENTI SRL, METE TRAVEL AND EVENTS SRL. THE NEW EVENTS BRAND “DISTRICT” HAS BEEN CREATED, WITH OVER 18 MILLION
EURO PRODUCTION VALUE.
On the 27th September, Casta Diva Group announced the acquisition of 51% from G.2 Eventi and 51% of MeTe Travel and Events. These two companies have total production
value of approximately 13 Million Euro, which represents more than 50% of Casta Diva Group consolidated production value in 2017, approximately 23 Million Euro.
CDG together with Matteo Valcelli, founder of G.2 and his partner Ernesto De Pellegrini, will establish a new company called DISTRICT , owned 51% by Casta Diva Group and
49% by a Newco, owned by the G.2 and MeTe partners.
Casta Diva Group SpA will take part in District Srl by providing 100% of the shares of Casta Diva Events Srl. The Newco established by Valcelli and De Pellegrini will take part
in District Srl by providing 100% of the shares of G.2 Eventi and MeTe Srl.
https://www.castadivagroup.com/wp-content/uploads/2018/09/2018-09-27-0707pm-CDG-CS-DISTRICT.pdf
Management evolution forecast
Casta Diva Group S.p.A believes that the Industrial Plan 2018-2020 released in June 2018 will be soon updated, thanks to the results achieved in the half-year financial
report in 2018 and the acquisition mentioned in the previous paragraph.
Milan, 27th September 2018
For the Board
Advisor and Chief Executive Officer
Luca Oddo
Legal representative of the Company declares that this document has been written according to Italian law DPR 445 from 2000.
For the Board
Advisor and Chief Executive Officer
Luca Oddo

Half-year consolidated financial report 2018
Pag. 10
CASTA DIVA GROUP S.P.A.
Located in MILAN - VIA LOMAZZO, 34
Social Capital 6.121.477,50 Euro
Chart of Half-Year Consolidated Financial Report up to 30th June 2018
CONSOLIDATED ACCOUNTS
CDG GROUP CDG GROUP BALANCE SHEET
ASSETS 30/06/2018 31/12/2017
A) SUBSCRIBED CAPITAL, UNPAID
-
-
Total subscribed capital unpaid (A) 0 0
B) FIXED ASSETS
I - Intangible fixed assets
1) Installation and expansion costs 1.396.310 1.536.738
3) Industrial patents and intellectual property rights 0 0
4) Concessions, licences and trademarks 325.132 170.736
5) Goodwill 2.543.932 2.152.371
6) Assets under construction and payments on account 592.328 479.479
7) Others 117.110 187.865
Total intangible fixed assets (I) 4.974.813 4.527.190
II - Tangible fixed assets
2) Plant and machinery 22.618 30.486
3) Industrial and commercial equipment 222.988 207.587
4) Other assets 26.526 47.914
Total tangible fixed assets (II) 272.132 285.987
III - Financial fixed assets
1) Shareholdings
a) Subsidiaries 298.000 150.392
d) Companies under the control of parent companies 0 0
d bis) other companies 251 2.500
2) Receivables
a) From subsidiaries 0 0
b) From associated companies 0 93.964
c) From parent companies 0 0
d) Companies under the control of parent companies 0 0
d bis) From others 0 0
Due in the next financial year 942.190 1.548.371
Due after the next financial year 0 0
Total receivables 0 93.964
Other financial fixed assets 0 0
4) Own shares 0 0
Total financial fixed assets (III) 1.240.441 1.795.227
Total fixed assets (B) 6.487.386 6.608.404
C) CURRENT ASSETS
I - Stock
3) Contract work in progress 491.439 276.666
4) Finished products and goods for sale 18.731 10.135

Half-year consolidated financial report 2018
Pag. 11
Total stock (I) 510.170 286.801
II - Receivables
1) Trade receivables
Due in the next financial year 7.088.705 6.209.201
Total trade receivables (1) 7.088.705 6.209.201
2) From subsidiary companies
Due in the next financial year 0 0
Total receivables from subsidiaries (2) 0 0
5 bis) Tax receivables
Due in the next financial year 683.781 463.414
Total tax receivables (5 bis) 683.781 463.414
5 ter) Prepaid taxes
Due in the next financial year 747.858 752.227
Due after the next financial year 0 0
Total prepaid taxes (4 ter) 747.858 752.227
5 quater) From others
Due in the next financial year 747.970 710.463
Due after the next financial year 0 0
Total receivables from others (5) 747.970 710.463
Due in the next financial year 9.268.314 8.135.305
Due after the next financial year 0 0
Total receivables (II) 9.268.314 8.135.305
III - Financial assets that do not constitute long term investments
Total financial assets which do not constitute long term investments (III) 0 0
IV - Cash and cash equivalents
1) Bank and post office deposits 617.683 2.012.147
3) Cash and cash equivalents in hand 30.998 56.025
Total cash and cash equivalents (IV) 648.681 2.068.173
Total current assets (C) 10.427.165 10.490.278
D) ACCRUALS AND DEFERRALS
Accrued income and prepaid expenses 156.966 176.343
Total accrued income and prepaid expenses (D) 156.966 176.343
TOTAL ASSETS 17.071.518 17.275.025

Half-year consolidated financial report 2018
Pag. 12
LIABILITIES 30.06.2018 31.12.2017
A) NET ASSETS
I - Capital 6.121.478 6.055.796
II - Share premium reserve 4.373.507 4.184.189
III - Revaluation reserves 0 0
IV - Legal reserve 8.000 8.000
V - Statutory reserves 0 0
VI - Other reserves, separately indicated
Share capital reduction reserve 511 511
Reserve for translation differences -200.054 -32.386
Extraordinary reserve 43.759 43.759
Consolidation reserve 804.919 840.978
Merger surplus 186.639 186.639
Total other reserves (VI) 835.774 1.039.501
VIII - Retained earnings (or losses) carried forward -4.072.925 -2.993.788
IX - Profit (loss) for the year
Group interest in profit (loss) for the year -1.128.194 -1.708.571
X - Reserve for own shares held in portfolio -133.994 -30.164
NET MINORITY ASSETS 5.373.646 6.554.962
Profit (loss) from minority interests 145.870 393.160
Net Assets Under Management 1.268.993 940.646
Total equity (A) 6.788.509 7.888.769
B) FUNDS FOR RISKS AND CHARGES 64.264 134.685
Total provisions for risks and charges (B) 64.264 134.685
B) FUNDS FOR RISKS AND CHARGES
2) For taxes 60.397 85.892
3) Other 3.867 48.793
C) TERMINATION OF SUBORDINATE EMPLOYMENT CONTRACTS 298.172 632.974
D) DEBT
3) Payables to shareholders for loans
Due in the next financial year 28.808 3.841
Due after the next financial year 0 0
Total payables to shareholders for loans (3) 28.808 3.841
4) Payables to banks
Due in the next financial year 3.391.810 1.301.172
Due after the next financial year 118.786 572.443
Total amounts due to banks (4) 3.510.596 1.873.615
6) Advances on account
Due in the next financial year 62.288 499.219
Total payments on account (6) 62.288 499.219
7) Payables to suppliers
Due in the next financial year 4.408.776 4.397.329
Total trade payables (7) 4.408.776 4.397.329
9) Payables to subsidiary companies
Due in the next financial year 0 0

Half-year consolidated financial report 2018
Pag. 13
Total payables to subsidiary companies (9) 0 0
12) Tax payables
Due in the next financial year 560.619 440.521
Due after the next financial year 0 0
Total tax payables (12) 560.619 440.521
13) Payables to pension and social security institutions
Due in the next financial year 261.607 251.128
Total payables to pension and social security institutions (13) 261.607 251.128
14) Other payables
Due in the next financial year 577.633 494.322
Total other payables (14) 577.633 494.322
Due in the next financial year 9.291.542 7.387.532
Due after the next financial year 118.786 572.443
Total payables (D) 9.410.328 7.959.975
E) ACCRUALS AND REFERRALS
Accrued liabilities and deferred income 510.246 658.623
Total accrued income and prepaid expenses (E) 510.246 658.623
TOTAL LIABILITIES 17.071.518 17.275.025
Half-year consolidated financial report 2018
Pag. 14
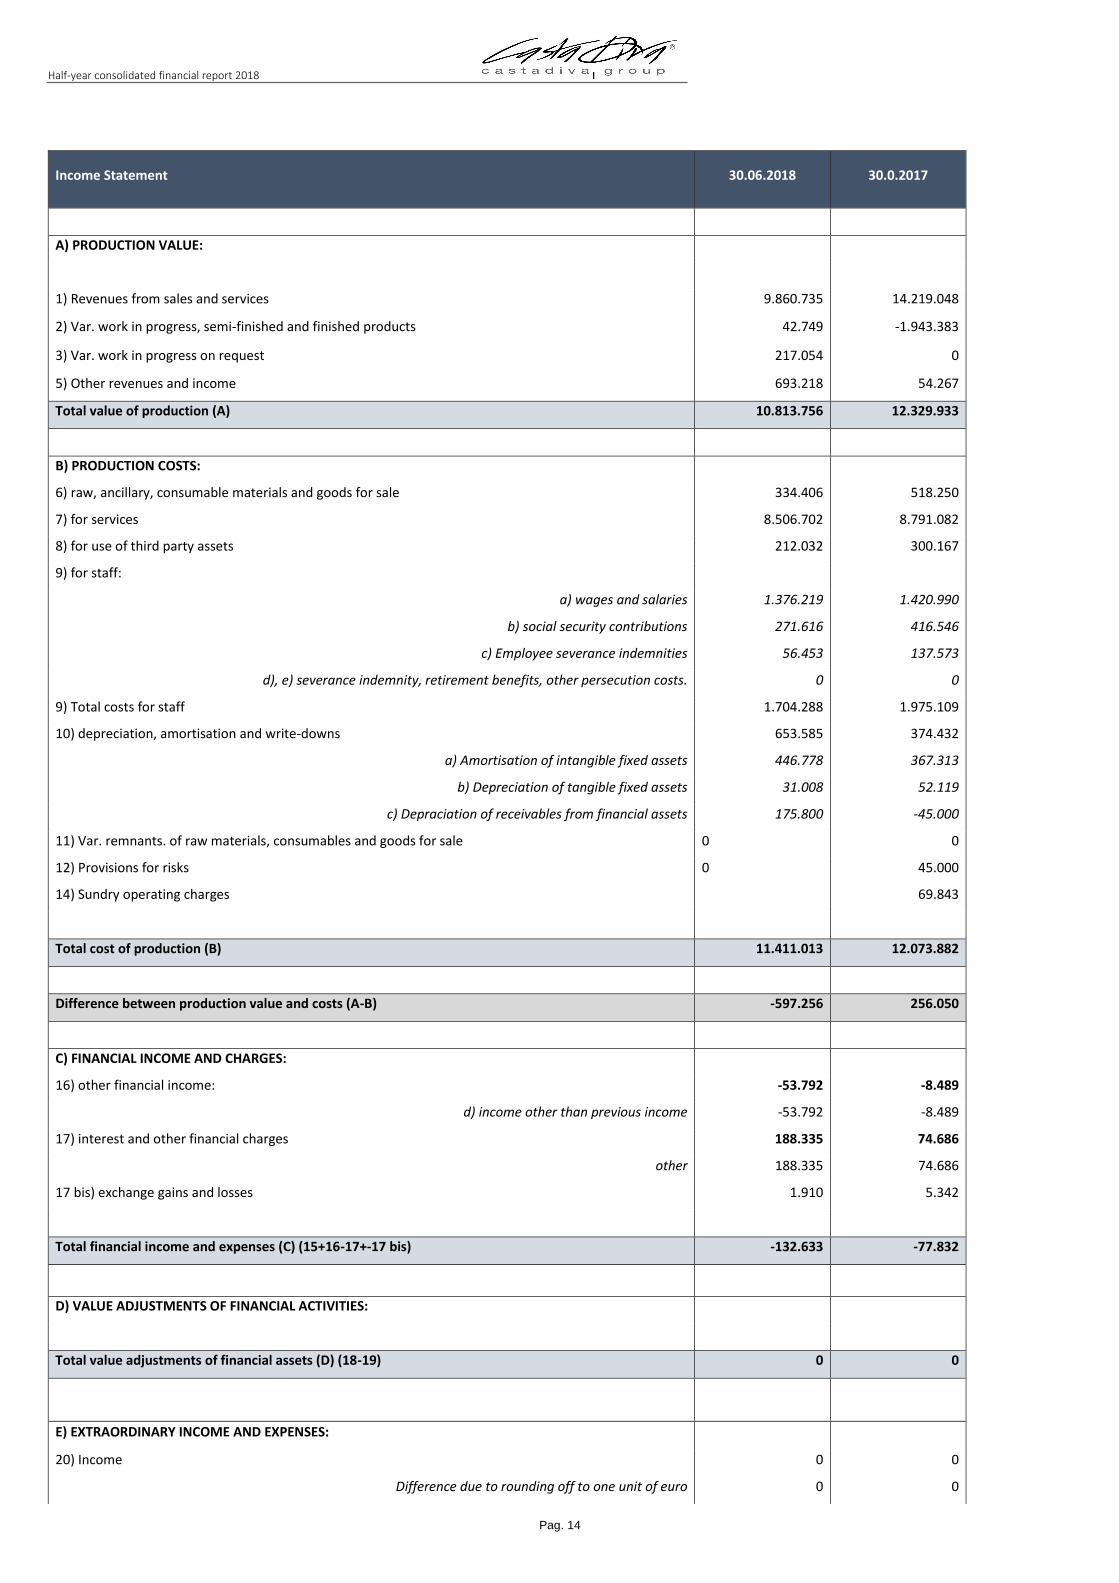
Income Statement 30.06.2018 30.0.2017
A) PRODUCTION VALUE:
1) Revenues from sales and services 9.860.735 14.219.048
2) Var. work in progress, semi-finished and finished products 42.749 -1.943.383
3) Var. work in progress on request 217.054 0
5) Other revenues and income 693.218 54.267
Total value of production (A) 10.813.756 12.329.933
B) PRODUCTION COSTS:
6) raw, ancillary, consumable materials and goods for sale 334.406 518.250
7) for services 8.506.702 8.791.082
8) for use of third party assets 212.032 300.167
9) for staff:
a) wages and salaries 1.376.219 1.420.990
b) social security contributions 271.616 416.546
c) Employee severance indemnities 56.453 137.573
d), e) severance indemnity, retirement benefits, other persecution costs. 0 0
9) Total costs for staff 1.704.288 1.975.109
10) depreciation, amortisation and write-downs 653.585 374.432
a) Amortisation of intangible fixed assets 446.778 367.313
b) Depreciation of tangible fixed assets 31.008 52.119
c) Depraciation of receivables from financial assets 175.800 -45.000
11) Var. remnants. of raw materials, consumables and goods for sale 0 0
12) Provisions for risks 0 45.000
14) Sundry operating charges 69.843
Total cost of production (B) 11.411.013 12.073.882
Difference between production value and costs (A-B) -597.256 256.050
C) FINANCIAL INCOME AND CHARGES:
16) other financial income: -53.792 -8.489
d) income other than previous income -53.792 -8.489
17) interest and other financial charges 188.335 74.686
other 188.335 74.686
17 bis) exchange gains and losses 1.910 5.342
Total financial income and expenses (C) (15+16-17+-17 bis) -132.633 -77.832
D) VALUE ADJUSTMENTS OF FINANCIAL ACTIVITIES:
Total value adjustments of financial assets (D) (18-19) 0 0
E) EXTRAORDINARY INCOME AND EXPENSES:
20) Income 0 0
Difference due to rounding off to one unit of euro 0 0

Half-year consolidated financial report 2018
Pag. 15
Other 0 0
21) Costs 0 0
Other 0 0
Total extraordinary items (E) (20-21) 0 0
Result before taxes (A-B+-C+-D) -729.890 178.218
22) Current, deferred and prepaid income taxes for the year
Current taxes 252.435 252.316
Advance taxes 0 0
Total income taxes for the year (22) 252.435 252.316
23) PROFITS (LOSSES) DURING THE YEAR -982.324 -74.098
USE OF THE THIRD PERDITION PERTINENCE OF THIRD PERSONS 145.870 444.856
USE OF THE GROUP' S EXERCISE PERDITION FOR THE GROUP -1.128.194 -518.954

Half-year consolidated financial report 2018
Pag. 16
Consolidated Cash Flow Statement
(figures in euro)
CDG
GROUP 30/06/2018 30.06.2017
Operating activities
Operating result (1.128.194) (74.097)
Adjustments for
a depreciation of tangible fixed assets
31.008 52.119
b write-downs for impairment losses on tangible fixed assets
175.800
c amortisation of goodwill
187.832 150.093
d amortisation of intangible assets
258.945 217.220
e write-downs of trade receivables
0 (45.000)
f (capital gains) / capital losses from disposals of fixed assets
0 0
g changes in the scope of consolidation
0 0
h provisions / (utilisations) of funds
(405.223) 53.251
Total adjustments 248.362 427.683
Changes in working capital
a (increase) / decrease in stock
(223.369) 1.944.560
b (increase) / decrease in trade and other receivables
(1.118.001) (2.603.916)
c increase (or decrease) in trade payables and other payables
(359.972) (726.049)
Total changes in working capital (1.701.343) (1.385.405)
Cash flow generated by operating activities (2.581.175) (1.031.819)
Income taxes and adjustments to prepaid taxes 4.368 773.009
Interest paid (188.335) 0
Net cash flow from (used in) operating activities (2.765.142) (258.810)
Investment activities
Interest received 0 0
Dividends received 0 0
Proceeds from (purchases )/ sales of financial assets 378.986 0
Disposals of investments in subsidiaries
a part of the consideration received in cash or cash equivalents
0 0
b cash and cash equivalents of the equity investments disposed of
0 0
Total effect of disposals of investments in subsidiaries 0 0
Divestiture of equity investments in other companies 0 0
Purchases of investments in subsidiaries
0 0
a part of the consideration paid in cash or cash equivalents
0 0
b cash and cash equivalents of the equity investments purchased
0 0
Total effect of purchases of equity investments in subsidiaries 0 0

Half-year consolidated financial report 2018
Pag. 17
Purchases of equity investments in other companies 0 0
Tangible and intangible investments (911.553) (109.212)
0 0
Proceeds from the sale of property, plant and equipment and intangible assets 0 0
Net cash flow from (used in) investing activities (532.567) (109.212)
Financial assets
Exchange gains (losses) 167.668 0
Payments for finance leases 0 0
New loans raised 1.237.575 0
Repayment of loans 612708 (213.226)
Shareholder Financing 0 0
Changes in the scope of consolidation (36.059) (2.071)
Other changes in equity 0 396.081
Transactions in own shares 103.830 (4.132)
Share capital increase 255.000 104.000
Other changes (462.505) 178.993
Net cash flow from (used in) financial assets 1.878.217 459.645
0
Increase/ (or decrease) in net cash and cash equivalents (1.419.491) 91.623
Cash and cash equivalents at the beginning of the year 2.068.173 2.261.401
Effect of changes in foreign currency exchange rates 0 0
Cash and cash equivalents at the end of the year 648.682 2.353.024