Embed Size (px)
Citation preview

UNITED STATES INTERNATIONAL TRADE COMMISSION
CAST-IRON COOKING WARE
Report to the President on Investigation No. TA-201-21
Under Section 201 of the Trade Act of 1974
USITC Publication 817 Washington, D. C.
May 1977

UNITED STATES INTERNATIONAL TRADE COMMISSION
COMMISSIONERS
Daniel Minchew, Chairman Joseph 0. Parker, Vice Chairman Will E. Leonard George M. Moore Catherine Bedell Italo H. Ablondi
Kenneth R. Mason, Secretary to the Commission
This report was principally prepared by
William J. Hable, Investigator
assisted by
William Gearhart, Office of the General Counsel Louis DeToro, Office of Economic Research
E. William Fry, Supervisory Investigator
Address all communications to United States International Trade Commission
WashingtO_!l,. D. c. 20436

C 0 N T E N T S
Report to the President----------------------------------------Determination of the Commission--------------------------------Views of Vice Chairman Joseph O. Parker and Commissioner
Italo H. Ablondi----------------------------------------------Views of Commissioners George M. Moore and Catherine Bedell----Views of Chairman Daniel Minchew-------------------------------Information obtained in the investigation:
Introduction-----------------------------------------------Description and uses---------------------------------------U. S. tariff treatment---------------------------------------Products that compete with cast-iron cooking ware----------
Electric cooking ware----------------------------------Ceramic cooking ware-----------------------------------Enamel-on-metal cooking ware---------------------------Aluminum cooking ware----------------------------·------S tainles s steel cooking ware---------------------------Copper cooking ware-------------------------------------
Technology-------------------------------------------------U.S. producers------------------------------------------=-==
General Housewares Corp--------------------------------The Atlanta Stove Works, Inc---------------------------Lodge Manufacturing Co----------------------------------
The question of increased imports---------------------------u. s. imports------------------~-------------------------
u.s. imports from GSP designated beneficiary countries----------------------------------------------
The Taiwanese industry---------------------------------The question of serious i~jury to the domestic industry----
Utilization of productive facilities-------------------Profit-and-loss experience of domestic producers-------
Cast-iron cooking ware operations------------------Overall establishment operations-------------------
Unemployment or underemployment of the domestic work force:
Employment trends----------------------------------Underemployment-------------------------------------Characteristics of the work force------------------
U. S. producers' shipments------------------------------Inventories--------------------------------------------Exports-------------------------------------------------Channels of distribution and marketing considerations--Price trends and comparisons----------------------------Wages-----------------------------------------------~---
Capital expenditures and research and develop-ment costs--------------------------------------------
Ef forts of U.S. producers to compete with imports-----------------------------------------------
1 3
4 9
13
A-1 A-3 A-3 A-5 A-6 A-6 A-6 A-6 A-7 A-7 A-8 A-9 A-9
A-11 A-11 A-11 A-12
A-13 A-13 A-15 A-16 A-17 A-17 A-19
A-20 A-20 A-21 A-21 A-22 A-23 A-23 A-24 A-25
A-25
A-25

ii
CONTENTS
Information obtained in the investigation--Continued The question of substantial cause--~------------------------ A-27
Consumption and market penetration: Cast-iron cooking ware------------------------------ A-27 Nonelectric metal cooking ware---------------------- A-28
Possible causes of serious injury to the domestic industry:
Substitution of other types of cooking ware-------- A-29 Recession------------------------------------------ A-31 Inability of the domestic producers to supply the
U.S. market-------------------------------------- A-31 Marketing failures of the domestic producers------- A-33
Quality---------------------------------------- A-33 Wooden handles--------=------------------~----- A-34 Promotion-------------------------------------- A-34 Merchandising---------------------------------- A-35
Imports-------------------------------------------- A-36 Appendix A. Statistical tables----------=--------------------- A-38 Appendix B. Countries and territories entitled to GSP
benefits----------------------------------------·------------- A-53

iii
TABLES
1. Cast-iron cooking ware: U.S. producers' shipments, imports for consumption, exports of domestic merchandise, and apparent consumption, 1972-76----------- A-39
2. Cast-iron cooking ware: u.s. producers' shipments, imports for consumption, exports of domestic merchan-dise, and apparent consumption, by quarters, 1974-76----- A-40
3. Cast-iron cooking ware: U.S. imports for consumption under TSUSA item 653.9560, by sources and quarters, 1974-76-------------------------------------------------- A-41
4. Cast-iron cooking ware: U.S. imports for consumption from the Republic of China, from all other countries, and total, by months, 1974-76-------------------------------- A-42
5. Cast-iron cooking ware: U.S. imports, by principal ; sources, 1974-76----------------------------------------- A-44
6. Profit-and-loss experience of 3 domestic producers on their cast-iron cooking ware operations, 1972-76--------- A-45
7. Profit-and-loss experience of 3 domestic producers on their overall establishment operations in which cast-iron cooking ware is produced, 1972-76------------------- A-46
8. Selected fi~ancial data for The Atlanta Stove Works, Inc., on its overall operations and its cast-iron cooking ware operations, 1972-76-------------------------------------- A-46
9. Selected financial data for General Housewares Corp. on its overall operations, its cook~ng ware operations, and its cast-iron cooking ware operations, 1972-76------------ A-46
10. Selected financial data for Lodge Manufacturing Co. on its overall operations and its cast-iron cooking ware opera-tions, 1972-76--------~---------------------------------- A-46
11. Cast-iron cooking ware: Ranges and averages of the lowest net selling prices received by U.S. producers and importers from sales of 6-1/2-inch, polished, cast-iron skillets, and average weights of the domestic and imported articles, by quarters, 1972-76------------------ A-47
12. Cast-iron cooking ware: Ranges and averages of lowest net selling prices received by U.S. producers and importers from sales of 8-inch plain cast-iron skillets, and average weights of the domestic and imported articles, by quarters, 1972-76------------------------------------- A-48
13. Cast-iron cooking ware~ Ranges and averages of lowest net selling prices received by U.S. producers and importers from sales of 10-1/2-inch polished cast-iron skillets, and average weights of the domestic and imported articles by quarters, 1972-76---------------------------- A-49

iv
TABLES
14. Cast-iron cooking ware: Ranges and averages of lowest net selling prices received by U.S. producers and importers from sales of 3-pieces skillet sets (which include 6-1/2-inch, 8-inch, and 10-1/2-inch polished skillets), and average weights of the domestic and imported sets, by quarters, 1972-76----------------------------------------- A-50
15. Capital expenditures and research and development expenses incurred by 3 domestic producers in connection with the domestic operations on cast-iron cooking ware, 1972-76---- A-51
16. Nonelectric metal cooking ware (excluding cast-iron cooking ware): U.S. producers' shipments, imports for consumption, exports of domestic merchandise, and apparent consumption 1972-76------------------------------~-------- A-52
Note.--The whole of the Commission's report to the President may not be made public since it contains certain information that would result in the disclosure of the operations of individual con~erns. This published report is the same as the report to the President, except that the above-mentioned information has been omitted. Such omissions are indicated by asterisks.

REPORT TO THE PRESIDENT
United States International Trade Commission May 24, 1977
To the President:
In accordance with section 20l(d)(l) of the Trade Act of 1974
(Trade Act), the United States International Trade Commission herein
reports the results of an investigation relating to cast-iron cooking
ware.
The investigation (Inv. No. TA-201-21) was undertaken to deter-
mine whether cooking ware, wholly or almost wholly of cast iron,
provided for in item 653.95 of the Tariff Schedules of the United
States (TSUS), is being imported into the United States in such
increased quantities as to be a substantial cause of serious injury, or
the threat thereof, to the domestic industry producing an article like
or directly competitive with the imported article.
The Commission instituted the investigation, under the authority
of section 20l(b)(l) of the Trade Act on February 12, 1977, following
receipt, on January 21, 1977, of a petition for import relief under
section 201 of the Trade Act of 1974 (19 U.S.C. 2251) filed by The
Atlanta Stove Works, Inc., General Housewares Corp., and Lodge
Manufacturing Co.
The Commission held a public hearing on this matter in Birmingham,
Ala., on April 12, 1977.
Notice of the institution of the investigation and hearing was
published in the Federal Register of February 22, 1977 (42 F.R. 10347),

2
and notice of the time and place of the hearing was published in
the Federal Register of April 1, 1977 (42 F.R. 17537).
The information for this report was obtained from field work
and interviews by members of the Commission's staff, from other
Federal agencies, from responses to the Commission's questionnaires,
from information presented at the public hearings, from briefs sub-
mitted by interested parties, and from the Commission's files.
A transcript of the hearings and copies of briefs submitted
by interested parties in connection with the investigation are
attached. J_/
J_/ Attached to the original report sent to the President, and available for inspection at the U.S. International Trade Commission, except for material submitted in co~fidence.
3
DETERMINATION OF THE COMMISSION
On the basis of the investigation the Commission determines
(Chairman Minchew dissenting, J./ Commissioner Leonard not partici-
pating) that cooking ware, wholly or almost wholly of cast iron,
provided for in item 653.95 of the TSUS, is not being imported into
the United States in such increased quantities as to be a substantial
cause of serious injury, or the threat thereof, to the domestic
industry producing an article like or directly competitive with the
imported article.
J./ Chairman Minchew determines that cooking ware, wholly or almost wholly of cast-iron, provided for in item 653.95 of the TSUS, is being inported into the United States in such increased quantities as to be a substantial cause of the threat of serious injury to the domestic industry producing articles like or directly competitive with the imported articles.
-4-
Views of Vice Chairman Joseph 0. Parker and Commissioner Italo H. Ablondi
In order to make an affirmative determination in this investigation,
each of the following criteria, set forth in section 20l(b)(l) of the
Trade Act of 1974, must be met: there must be increased imports of the
article in question; the domestic industry producing like or directly
competitive articles must be seriously injured, or threatened with
serious injury; and the serious injury, or threat thereof, must be
substantially caused by the increased imports.
As required by the statute, the Commission examines the impact of
imports of the subject articles on the domestic industry producing like
or directly competitive articles. The imported articles in this
investigation, cooking ware, wholly or almost wholly of cast iron, compete
in the domestic market with other, similar types of cooking ware made of
cast iron, copper, aluminum, stainless steel, and other materials. Such
products also compete with other products used in the preparation of foods
such as electric fry pans and crackpots.
There is no question that imports of cast-iron cooking ware increased
during the .5-year period covered in the Commission's investigation. Such
imports increased from approximately 650,000 pieces in 1972 to
approximately 8.4 million pieces in 1976. Between 1972 and 1976, the
value of U.S. producers' shipments of all nonelectric metal cooking ware
increased steadily from $338 million to $475 million. Imports of cast-
iron cooking ware did not exceed 1 percent of the value of domestic
consumption of all nonelectric metal cooking ware until 1976, when they

-5-
accounted for approximately 1.5 percent. However, the ratio of the value
of imports of cast-iron cooking ware to apparent domestic consumption of
such cooking ware increased from 2 percent in 1972 to 7 percent in 1974
and then to 43 percent in 1976. The ratio of such imports to U.S. producers'
shipments of cast-iron cooking ware, in terms of number of pieces,
increased from 2 percent in 1972 to 70 percent in 1976. The absolute
increase in imports and the increases in the ratios of imports to
consumption and producers' shipments of cast-iron cooking ware are not,
however, of themselves dispositive of the issue of serious injury to the
domestic industry.
The Commission's investigation did not reveal any information on the
profit-and-loss or employment experience of the producers of other types
of nonelectric metal cooking ware. No appearances were entered by such
producers, nor was any information or claim presented which would
indicate that these producers were injured by imports of cast-iron cooking
ware. The only information obtained during the Commission's investigation
establishes that the value of shipments by such producers increased
steadily throughout the period 1972-76.
Examination of the performance of the producers of cast-iron cooking
ware apart from that of producers of other nonelectric metal cooking ware
does not establish evidence of serious injury. The combined profit-and
loss statements of the three domestic producers of cast-iron cooking ware
reveal that in 1976, when imports increased sharply, these firms had higher

-6-
combined net sales and net operating profits than they did in 1972 and
1973, when imports were less than 20 percent of their 1976 level. In
fact, the net sales and net profits achieved in 1976 were higher than for
any other year in the 5-year period except 1974.
An examination of the individual company data also indicates that
while one firm experienced a steady downward trend in profit after 1971,
the other two firms showed an upward trend in prof it in their cast-iron
cooking ware operations in 1972-76. Thus, it would be difficult to
attribute either trend to imports, since in the absence of some specific
circumstances peculiar to a single firm, increased imports would have the
same general impact on all domestic producers.
While there is evidence that the number of persons employed in the
production of cast-iron cooking ware declined during the period 1972-76,
the number of persons employed in estqblishments where cast-iron cooking
ware is produced remained relatively con$tant, as the productive facilities
devoted to cast-iron cooking ware were shifted to the production of other
cast-iron products.
There is no evidence of price depression or price suppression.
In all four of the represen~ative price comparisons made by the Commission,
the average prices of the domestic product approximately doubled between
1972 and 1976, and, in each comparison, prices increased in 1976 over
1975 levels.
In our opinion, the factors set forth above establish that the domestic
industry is not suffering serious injury within the meaning of the statute.
-7-
There is additional evidence in the record of this investigation that
indicates that increased imports have not been a substantial cause of
any problems which the domestic producers of cast-iron cooking ware
may have had.
The imported cast-iron cooking ware is about one-third lighter
than domestically produced cast-iron cooking ware, and, in addition, a
significant percentage of the imports have wooden handles. Both
these features appear to have been factors in gaining consumer acceptance.
To the extent that imported cast-iron cooking ware has gained consumer
acceptance, there is nothing in the record of this investigation to indicate
that such acceptance has been at the expense of domestic producers of
cast-iron cooking ware and not producers of other types of cooking ware.
The promotional campaign which is credited with having spurred sales
and an increase in consumption of cast-iron cooking ware in 1976 appears
to have b~nefited both the imported and domestic products as domestic
producers' sales and shipments both reversed a 4-year downward trend.
In addition, there is evidence that in 1974 and 1975, two of the
three domestic producers of cast-iron cooking ware shifted significant
portions of their facilities from the production of cooking ware to that
of other cast-iron products. As a result of the shift in productive
facilities, these producers turned away business or were unable to
produce all the cast-iron cooking ware they could have sold during this
period, and the entrance of imports into the market was facilitated.
-8-
On the basis of the factors set forth above, we have determined that
cooking ware, wholly or almost wholly of cast iron, is not being imported
in such increased quantities as to be a substantial cause of serious
injury, or the threat thereof, to the domestic industry producing a like
or directly competitive product. l./
.. !/Imported cooking ware, wholly or almost wholly of cast iron, is classified for tariff purposes under item 653.95 of the Tariff Schedules of the United States. The present col. 1 rate is 8.5 percent ad valorem. As a result of Generalized System of Preferences treatment granted under title V of the Trade Act of 1974, approximately 85 percent of imports of cast-iron cooking ware now enter duty free. This undoubtedly has enhanced the competitive position of the imported product.

9
Views of Commissioners ·George M. Moore and Catherine Bedell
On the basis of the evidence obtained during this investigation,
we have determined that cooking ware, wholly or almost wholly of cast
iron, provided for in item 653.95 of the TSUS, is not being imported into
the United States in such increased quantities as to be a substantial
cause of serious injury, or the threat thereof, to the domestic industry
producing articles like or directly competitive with the imported
articles. Specifically, we find, for the reasons stated below, that the
domestic industry, which we define as consisting of the three domestic
producers of cast-iron cooking ware, is not being seriously injured or
threatened with serious injury within the meaning of section 201 of the
Trade Act of 1974.
We believe, however, that the domestic producers of cast-iron cooking
ware are being adversely affected by imports of cast-iron cooking ware
benefiting from the designation of these articles as eligible for duty-
free treatment under the Generalized System of Preferences (GSP). During
1976, 85 percent of U.S. cast-iron cooking ware imports, in terms of -
quantity, entered duty free under GSP. While we find these GSP imports
to be causing injury to the domestic industry, we do not find this
injury to be of the magnitude necessary for an affirmative determination
of serious injury under section 201 of the Trade Act of 1974.
Section 20l(b)(2) of the Trade Act outlines certain guidelines
which the Connnission is to take into account in determining whether
10
serious injury, or the threat thereof, exists. We believe "serious
injury" to be more than a temporary injury. It must be an important,
crippling, or mortal injury, one that if not remedied would have
permanent or lasting consequences. !/ The evidence developed during
this investigation is discussed below as it relates to the statutory
guidelines by which serious injury, or the threat thereof, is
determined pursuant to the Trade Act of 1974.
The evidence does not support a finding that there is significant
idling of productive facilities in the domestic industry. Considering
the variables pointed out in the report, a statistical analysis of
capacity utilization is inconclusive. The figures do seem to suggest,
however, that in 1976 capacity utilization rose above the 1975 level.
In addition, testimony at the public hearing in the investigation
indicated that in at least two cases, members of the industry were
unable or unwilling to fill cast-iron cooking ware orders.
The evidence does not support a finding that a significant number
of firms in the industry are unable to operate at a reasonable level
of profit, nor is there evidence of a downward trend--or any significant
trend--in profit among the three domestic producers. The ratio of net
operating profit to net sales for the three producers on their cast-iron
cooking ware operations was 0.8 percent in 1976, the same as in 1975,
but lower than the ratio of 3.4 percent in 1974 and higher than that of
!/ See views of Commissioner George M. Moore in Bolts, Nuts, and Screws of Iron or Steel: Report to the President on Investigation No. TA-201-2 ..• , USITC Publication_747, 1975, p. 19.

11
0.4 percent in 1973 and the ratio of net operating loss of 1.2 percent
in 1972. One firm, which was formerly quite profitable in this product
area, is now unprofitable, and another firm, which operated at a loss
during the first 4 years of the period 1972-76, operated a~ a profit for
the first time in 1976. The profit ratio for the cast-iron cooking
ware industry as a whole was depressed in each of these years by the
losses of one or another of the domestic producers. The profit ratios
for the other two producers, on the other hand, were generally close
to the profit ratios for all producers of fabricated metal products.
It appears that while one of the three domestic producers had profit
problems in each of the last 5 years, no one producer had such
problems during all 5 years and none of the three producers had such
problems in any 1 year.
While there is evidence that the number of persons employed in
the production of cast-iron cooking ware has declined in recent years,
there is no evidence of plant closings or lengthy layoffs. Total
employment in the establishments in which cast-iron cooking ware is made
was relatively constant during 1972-76. It appears that most of the
workers who are no longer employed in the production of cast-iron
cooking ware have been transferred to other jobs within their establish
ments, which coincides with the emphasis on cast-iron stove production.
Employment in the domestic industry declined by an average of 37 workers
between 1975 and 1976, despite an increase in domestic production.
However, employees' wages and productivity in the domestic industry
have recently trended upward.

12
In view of the above, we have determined that the domestic cast
iron cooking ware industry is not being seriously injured or threatened
with serious injury within the meaning of section 201 of the Trade Act
by increased imports of the articles under investigation, and,
therefore, we have made a negative determination.

13
Views of Chairman Daniel Minchew
On February 12, 1977, the United States International Trade
Commission (Commission) instituted an investigation to determine whether
cooking ware, wholly or almost wholly of cast iron, provided for in item
653.95 of the Tariff Schedules of the United States (TSUS), is being im-
ported into the United States in such increased quantities as to be a sub-
stantial cause of serious injury, or the threat thereof, to the domestic
industry producing an article like or directly competitive with the imported
article.
The investigation was instituted after the Connnission received
a petition filed by the Atlanta Stove Works, Inc., General Housewares
Corporation and Lodge Manufacturing Company.
Before making an affirmative determination under section 201
(b)(l), the Connnission must find that all three of the following criteria
are met:
Determination
(1) That an article is being imported into the United States in increased quantities (the increased imports may be actual or relative to domestic production);
(2) That a domestic industry producing an article like or directly competitive with the imported article is being seriously injured or threatened with serious injury; and
(3) That such increased imports of an article are a substantial cause of the serious injury~ or the threat thereof, to the domestic industry producing an article like or directly competitive with the imported article.
After considering the evidence obtained by the Commission in the

14
investigation, I have determined that cooking ware, wholly.or almost
wholly of cast iron, provided for in item 653.95 of the TSUS, is being
imported into the United States in such increased quantities as to be a
substantial cause of the threat of serious injury to the domestic industry
producing cast-iron cooking ware.
The domestic industry
I have determined that the domestic industry in the_ present
case consists of facilities devoted to the production of cast-iron cooking
ware.
Increased imports
In the terms of the statute, an increase in imports can be
"either actual or relative to domestic production" (section 20l(b)(2)(C)).
Therefore, the Commission can find "increased imports" when the increase
i.s in "actual" or absolute terms, or when the level is declining in actual
terms, but is increasing relative to domestic production. It is my view
that, in the absence of extraordinary circumstances, the Commission should
not look farther.back than the most recent trade concessions to determine };_/
whether or not the increased imports criterion is met.
In determining increased imports, the trend of imports is the
.most critical factor, U. S. imports of cast-iron cooking ware increased from
654,000 pieces in 1972, to 1.5 million pieces in 1973, before registering a
small decline in 1974, to 1.3 million pieces. Such imports then jumped to
2.0 million pieces in 1975, and. 8.4 million pieces in 1976,
1/ See my views in Stainless Steel and Alloy Tool Steel: Report to the President on Investigation No, TA-201-5, • , USITC Publication 756, January, 1976; and Sugar; Report to the President on Investigation No. TA-201-16. , . USITC Publication 807, March, 1977,
15
In addition these imports, measured by weight, and by value,
increased in actual terms over the same period.
U. S. imports of cast iron cooking ware have not only increased
absolutely, but they have also increased relative to domestic production of
this commodity. For example, the ratio of imports to domestic production
rose from about 9 percent in 1972, to 214 percent in 1976, in terms of
pieces of cooking ware.
From this information, it would seem clear that the trend of
imports is upward, and that the criterion of increased imports is met.
Threat of serious injury
Although the Trade Act of 1974 (Trade Act) provides no precise
definition of what constitutes the "threat of serious. injury," some factors
to be considered are listed in section 20l(b)(2)(B) which provides:
with respect to threat of serious injury, a decline in sales, a higher and growing inventory, and a downward trend in production, profits~ wages, or employment (or increasing underempioyment) in the domestic industry concerned,
In addition to the above listed :!;actors, I believe in con-
sidering the question of threat of serious injury it is also necessary to
look at the factors considered in serious injury. Section 20l(b)(2) of
the Trade Act provides the following factors to be considered:
with:respect to serious injury, the significant idling of productive facilities· in the industry~ the inability of a significant number of firms to operate at a reasonable level of profit, and significant unemployment or underemployment within the industry.
(1) Utilization of productive facilities
16
There has been a marked decline in capacity utilization
during the period 1972-76. The ratio of domestic production to capacity
peaked in 1972, at 89 percent and declined steadily to 38 percent in
1975, before increasing slightly to 42 percent in 1976.
(2) Profit-and-loss experience of domestic producers
Net sales of cast-iron cooking ware declined slightly from
$9.3 million, in 1972, to $9.1 million in 1973, and then peaked at $10.1
million in 1974. Net sales then dropped, in 1975, to $8.6 million and
then rebounded slightly to $8.9 million in 1976. Thus, there was a decline
in the dollar value of sales, despite an increase in the value of the
individual piece of cookware.
Net operating profit on cast-iron cooking ware operations rose
from $108,000 loss in 1972, to a $33,000 profit in 1973, and then peaked
at $342,000 in 1974. Net operating profit dropped sharply to $66,000 in
1975, before registering a slight gain, a·dvancing to $71,000 in 1976.
The 1972 ratio of net operating profit to net sales registered a negative
1.2 percent -- a net operating loss. The domestic producers broke even
in 1973, with an operating profit ratio of 0.4 percent, which was followed
in 1974~ by the highest profit ratio -- 3.8 percent -- recorded during the
period 1972-76. In 1975, and 1976, the domestic producers broke roughly
even, with an operating profit ratio of 0.8 percent.
A comparison of the above ratios to· those of all fabricated metal
products manufacturers and all manufacturi_ng corporations shows that the
domestic producers of cast-iron cooking ware made far less profit than all
manufacturers of metal products did during the period 1972-76.

17
(3) Unemployment or underemployment of the domestic work force
The average number of production and related workers in the
cast-iron cooking ware industry declined in every period since 1973, after
having risen slightly from 1972 to 1973. The decline in employment was
slight between 1972-74, but fell sharply in 1975 and 1976. While it
appears that domestic producers shifted personnel from their depressed
cast-iron cooking ware operations to other lines through 1975, it is
appar nt that, in 1976, there was a marked decline in employment both
in facilities devoted to cast-iron cookware and in the overall operations
of domestic producers.
(4) Inventories
IThile inventories of the domestic producers were quite stable
in 1972 and 1973, there was a substantial increase in 1974, due to falling
sales. Lower production levels in 1975 enabled the U. S. producers to
reduce inventories during that year, but these same low levels of production
did not prevent another significant inventory build-up in 1976. The most
severe increase in inventories occurred between 1975 and 1976, when inven
tories increased nearly fourfold, while imports increased threefold.
The overall state of the domestic industry is one of depression,
with increasing shares of the market being taken by imports. It would not
be difficult to conclude that the domestic industry is being seriously
injured in the terms of the statute. However, there is no question in my
mind that the domestic industry is being threatened with serious injury,
and, short of some action by the government, the domestic industry will
have difficulty remaining a viable industry.

18
Substantial cause
Section 20l(b)(4)· of the Trade Act defines "substantial
cause" as a "cause which is important and not less than any other cause."
In addressing the question of substantial cause, the House Ways and Means
Committee Report stated:
stating:
The Committee intends that a dual test be met--imports must constitute an important cause and be not less important than any other single cause. For example, if imports were just one of many factors of equal weight, imports would meet the test of being "not less than any other cause" but it would be unlikely that any of the causes would be deemed an "important" cause. If there were any other cause more important than imports, then the second test of being "not less than any other cause" would not be met. On the other hand, if imports were one of two factors of equal weight and there were no other factors, both tests would be met. 1./
The Senate Finance Committee Report addressed the question by
The Committee recognizes that "weighing" causes in a dynamic economy is not always possible. It is not intended that a mathematical test be ·applied by the Commission. The Commissioners will have to assure themselves that imports represent a substantial cause or threat of injury. It is not intended that the escape clause criteria go from one extreme of excessive rigidity to complete laxity. An industry must be seriously injured or threatened by an absolute increase in imports, and the imports must be deemed to be a substantial cause of the injury before an affirmative determination should be made. ]:_/
1/ U. S. House of Representatives, Trade Reform Act of 1973: · Report of the Committee on Ways and Means .• ,, H. Rept. No. 93-571 (93d Cong,, 1st Sess.), 1973, pp. 46-47.
];_/ U. S. Senate, Trade Reform Act of 1974: Report of the Committee on Finance ... , s. Rept. No. 93-1298 (93d Co.ng., 2d Sess,), 1974, pp. 121-122.

19
In attempting to determine "substantial cause" of a threat
of serious injury, one encounters numerous pitfalls. One must attempt
to predict which factor will be "important" and "not less than any other
cause" of the serious injury which the Commissioner has predicted will
occur. I will follow the advice given in the Senate Finance Committee
Report and not attempt to formulate a "mathematical test."
While it can be argued that factors other than imports were
the substantial cause of any serious injury -- factors such as promo-
tional methods by the importers and the recession -- it is important to
note the rapid increase in market penetration of the imported cooking
ware. With quantity measured in pieces, the ratio of imports to apparent
consumption increased from 9 percent in 1972, to 20 percent in 1974, and
then to 71 percent in 1976. With quantity measured by weight, the ratio
of imports to apparent consumption increased from 2 percent in 1972 to
5 percent in 1974 and then to 57 percent in 1976.
Imports entered the domestic market at prices considerably
below those of the domestic product and this, in my opinion, accounts for
the major part of the difficulties the domestic industry has had. With
imports entering at such low prices, domestic retailers have been able
to promote the'imported article extensively and still enjoy greater
1.1 profits.
From an analysis of the information the Commission has been
able to develop, I believe that imports are the substantial cause of a
threat of serious injury to the domestic industry.
1/ Promotion of the imported product had been argued as one of the chief reasons for the difficulties of the domestic industry.
20
Conclusion
As stated earlier, I have determined that the requirements
of section 20l(b)(l) of the Trade Act have been met, in that cooking
ware, wholly or almost wholly of cast iron, provided for in item 653.95
of the TSUS, is being imported into the United States in such increased
quantities as to be a substantial cause of the threat of serious injury
to the domestic industry.
Additional views of Chairman Minchew with regard to GSP treatment of cast-iron cooking ware
In July 1975, the Commission advised the Special Representative
for Trade Negotiations, in Trade Agreement Digest 60180, that the granting
of duty-free preferences to beneficiary developing countries could well
result in substantial increases in imports of less expensive cooking ware.
However, the decision was made to designate TSUS item 653.95 as eligible
for duty-free GSP treatment, beginning January 1, 1976.
In keeping with the statutory obligations of the Commission,
I feel it is necessary to update information and advice provided on GSP
items as the Commission gains more information about the articles in
question. In the present case, the Commission has now had the benefit
of several months of detailed study, which will make whatever advice
we are required to give much more valuable.
Information obtained by the Commission shows that imported
cast-iron cooking ware from designated beneficiary countries has 7 in
fact, adversely affected the domestic industry producing a like or
directly competitive article. During 1976, 85 percent of U, S. imports

21
of cast-iron cooking ware, in terms of quantity, entered duty-free under
GSP. Further, a major U.S. producer and a leading importer testified
that the elimination of duty made it economically feasible for importers
to stock inventories in the United States, and therefore, to provide
delivery service comparable to that offered by domestic producers. In
addition, it appears that the abnormally high retail markup, resulting
in part from the duty reduction, helped underwrite the promotional campaign
aimed at stimulating the sales of the imported article. The evidence shows
that the institution of GSP contributed to the increase in 1976, of imports
which are adversely affecting the domestic industry.
Should a decision be made to remove the duty-free GSP treatment
from cast-iron cooking ware now entering under this status, the probable
economic effects of this removal would be an appreciable decline in imports.
Assuming that (1) the full duty increase is passed on by the
importer, (2) a -2.1 relative price elasticity exists between imported and
domestic articles and (3) all other factors are held constant, U. S. imports
would probably de~line about 1.2 million pieces during the next 12 months.
The following reasons suggest the existence of a relatively high price
sensitivity for cast-iron cooking ware.
First, major retailers consider price an important factor in
guiding their purchasing decisions of cast-iron cooking ware, Second,
some consumers apparently react to price differences between different brands
of cast-iron cooking ware. Third, in an equation in which the logarithm of
quantity of imports was taken to-be a linear function of the logarithms of· -
relative price and real disposable income, the ordinary-least-square regres
sion estimate of the elasticity of relative price was -2.13 for the period
1974-76.
22
This coefficient was statistically significant at the 95-percent level
of significance.
Even if importers and retailers absorb part or all of this
increased duty, a sizable decline in imports may still result. An
importer which absorbs these costs may have to reduce inventories and,
therefore, increase delivery lead times to customers. A retailer which
absorbs these costs by reducing its markup will probably reduce its
promotional expenditures on the imported article.
From the above analysis it is clear that the removal of duty-
f ree GSP treatment will enhance the competitive position of the domestically
produced article vis-a-vis the imported article. This advantage should
enable the U. S. producers to expand their cast-iron cooking ware opera
tions and retain a larger share of the U. s. market.
INFORMATION OBTAINED IN THE INVESTIGATION
Introduction
On January 21, 1977, The Atlanta Stove Works, Inc., General Housewares Corp., and Lodge Manufacturing Co. filed a petition with the United States International Trade Commission for import relief under section 201 of the Trade Act of 1974.
On February 12, 1977, the Commission instituted an investigation to determine whether cooking ware, wholly or almost wholly of cast iron, provided for in item .653.95 of the Tariff Schedules of the United States (TSUS), is being imported into the United States in such increased quantities as to be a substantial cause of serious injury, or the threat thereof, to the domestic industry producing an article like or directly competitive with the imported article.
The petitioners allege that the domestic producers of cast-iron cooking ware have already suffered serious injury because of increased imports. The petitioners state that the following types of relief are requisite for their adjustment to the new conditions of competition resulting from the increasing quantity of imports:
(1) An increase in duty sufficient to equalize prices of domestic and imported goods;
(2) The removal of duty-free .treatment accorded to the articles imported from beneficiary developing countries under the Generalized System of Preferences;
(3) A quantitative restriction with respect to imports from each country, sufficient to reduce the quantity of imports from each country to that of 1974 and before.
The Commission issued public notices regarding the institution of the investigation on February 16, 1977, and the place and time of the public hearing on March 29, 1977. The notices were posted at the Commission's offices in Washington, D.C., and New York City and were published in the Federal Register on February 22, 1977 (42 F.R. 10347), and April 1, 1977 (42 F.R. 17537), respectively. The public hear-ing, at which all interested parties were given an opportunity to be present, to present evidence, and to be heard, was held on April 12, 1977, in Birmingham, Ala.
The Trade Act of 1974 directs the Commission to complete its investigation under section 201 at the earliest practicable time, but

A-2
not later than 6 months after the date on which the petition is filed. The Commission has expressed its intention to expedite this investigation and to report to the President by May 23, 1977.
The Commission had not conducted an investigation on cast-iron cooking ware prior to investigation No. TA-201-21. The petitioners in this investigation are the same firms that filed a petition on November 18, 1976, with the Trade Policy Staff Committee for removal of cast-iron cooking ware from the Generalized System of Preferences (GSP). The Commission has been advised by the Office of the Special Representative for Trade Negotiations that action on the abovementioned petition is being held in abeyance until the Commission's report on the instant investigation has been received.
The information used in this report was obtained at the public hearing; from written briefs submitted by interested parties; through field visits and interviews with producers, importers, and retailers; from other Federal agencies; from data submitted in response to questionnaires by domestic producers, importers, trade associations, and retailers; and from other sources.
A-3
Description and Uses
The imported cast-iron cooking ware which is the subject of this investigation includes all nonelectric utensils, wholly or almost wholly of cast iron, used for the holding of food during the heating process. This definition includes cast-iron cooking ware with noncast-iron parts, such as wooden handles.
The scope of this investigation does not cover imported cooking ware which is permanently covered or coated with any material or substance; thus, imports of porcelain-enameled cast-iron cooking ware are not included within the scope of the investigation. However, a seasoning or temporary rust preventive is not considered a permanent covering or coating, and imports of cast-iron cooking ware so covered or coated are included within the scope of this investigation.
Cast-iron cooking ware has a very long history; the Chinese apparently first produced cast-iron bowls nearly 3,000 years ago. Closer to home, cooking ware was one of the first cast-iron articles manufactured in colonial America.
Cast-iron cooking ware consists primarily of skillets and also includes saucepans, Dutch ovens, and other specialty items. Because it heats very evenly, it is excellent for browning foods. Cast-iron cooking ware is very durable, and, some say, it imparts a unique taste to the food prepared therein.
U.S. Tariff Treatment
Imported cooking ware wholly or almost wholly of cast iron is classified for tariff purposes under item 653.95 of the TSUS. The most-favored-nation rate of duty currently applicable to cast-iron cooking ware is 8.5 percent ad valorem, reflecting a SO-percent reduction negotiated during the Kennedy round of trade agreements held in Geneva during 1964-67. This rate has been in effect since January 1, 1972. The statutory rate for TSUS item 653.95 is 40 percent ad valorem.
Title V of the Trade Act of 1974 authorizes the establishment of a Generalized System of Preferences for eligible articles imported from beneficiary developing countries. Effective January 1, 1976, imports of cast-iron cooking ware from all designated beneficiary developing countries became eligible for duty-free treatment under the provisions of the GSP.

A-4
Section 504(c) of the Trade Act of 1974 directs that a country shall cease to be a beneficiary developing country when that country has exported (either directly or indirectly) to the United States a quantity of any eligible article equal to or exceeding 50 percent of the appraised value of the total imports of such article into the United States during any calendar year. C~st-iron cooking ware constitutes only a small portion of the articles entering under TSUS item 653.95. Although the Republic of China (Taiwan) accounts for more than 60 percent of U.S. imports of cast-iron cooking ware, Taiwan accounts for only about 25 percent of U.S. imports entering
under the basket provision TSUS item 653.95. For this reason Taiwan is still a beneficiary developing country with respect to all articles entering under TSUS item 653.95, including cast-iron cooking ware. A list of the countries entitled to GSP benefits appears in appendix B.
A-5
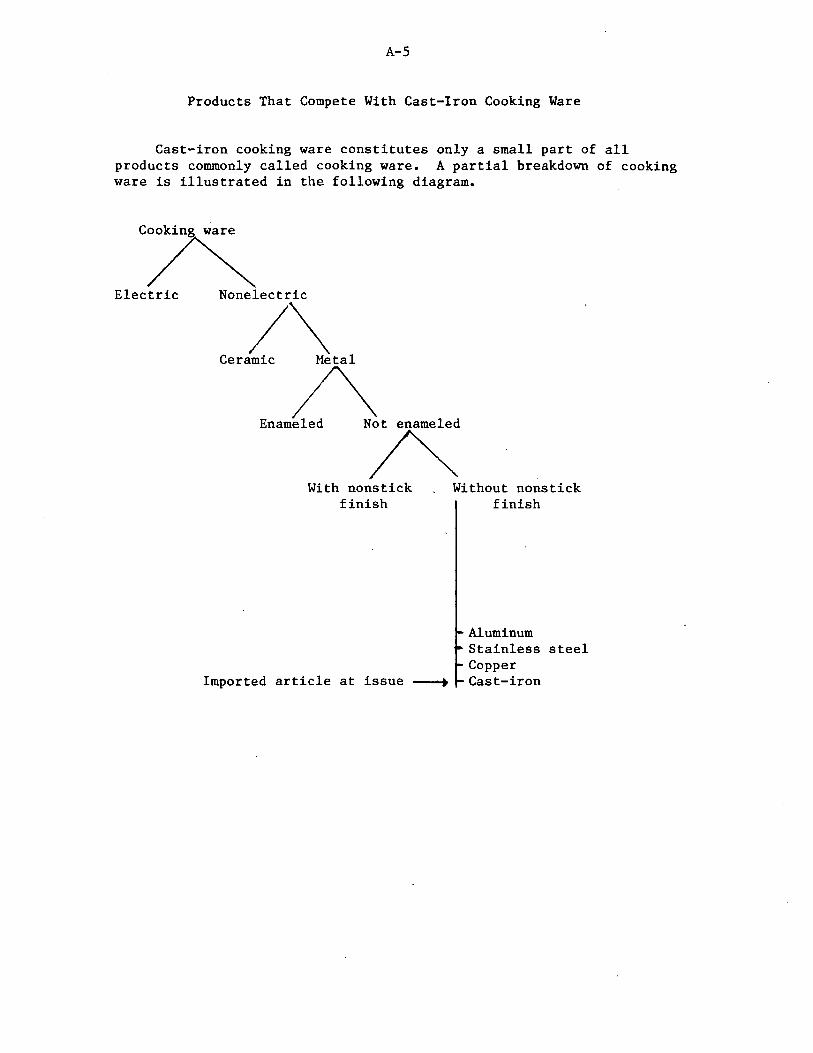
Products That Compete With Cast-Iron Cooking Ware
Cast-iron cooking ware constitutes only a small part of all products commonly called cooking ware. A partial breakdown of cooking ware is illustrated in the following diagram.
CA Electric Nonelectric
/\ Ceramic Metal
/\ Enameled N~
With nonstick finish
Without nonstick finish
Aluminum Stainless steel Copper
Imported article at issue ----. Cast-iron

A-6
Electric cooking ware
Westinghouse introduced the first electric skillet in 1911. The inability to provide positive heat control limited the popularity of such a product for over 40 years. Then, in 1953, Sunbeam Corp. introduced a square, cast-aluminum Automatic Fry Pan, which featured controlled heat. The electric fry pan has since become a very common cooking utensil.
Ceramic cooking ware
Corning Glass Works introduced glass top-of-the-range cooking ware in 1936. Twenty years later this company developed a new family of materials called Pyroceram and marketed its cooking ware made from such material under the name "Corningware." Today this line consists of more than 50 items ranging from Electromatic percolators and skillets to roasters and serving platters. Cooking ware made of this white material can withstand abuse which no other glass or ceramic (and probably few metal) utensils can withstand.
Enamel-on-metal cooking ware
Porcelain enamel is essentially a highly durable glass which, with coloring oxides and other inorganic materials, is fused to metal at extremely high temperatures--two or three times higher than the highest temperatures encountered in cooking or baking. In 1953, John Keating of Club Aluminum Products (now Club Products Co.), perfected the application of porcelain enamel to aluminum cooking ware. In 1969, John Ulam, of Clad Metal, Inc., made an equally significant contribution when he combined stainless clad aluminum with porcelain enamel. Those innovations greatly altered the cooking ware market.
Cast-iron cooking ware may have been the first porcelain-enamel cooking ware, but such ware was not popular until after World War II. Today, as part of the much publicized gourmet trend, these products have come into their own. Aside from the variety of colors and designs available, the chief recommendations for porcelain enamel are its stain and scratch resistance, its immunity to fading and peeling, its chemical resistance, and the fact that it will not pick up food odors.
Aluminum cooking ware
Aluminum cooking ware was sold in the United States during the latter years of the 19th century. Despite its unique appeal aluminum cooking ware met with strong consumer·resistance. Homemakers unaccustomed to lightweight utensils looked upon the new products

A-7
with suspicion. Only after World War I did the demand for aluminum cooking ware take off. In the 1950's, technological advances allowed manufacturers to add porcelain enamel finishes to their products.
Aluminum cooking ware is lightweight and inexpensive. It is also an excellent conductor of heat. Because of this quality, heat spreads quickly and evenly across the bottom, up the sides, and across the cover of the utensil to completely surround the food being cooked. Aluminum cooking ware is made in several different ways, most frequently by stamping and drawing or casting. In the stamping and drawing method, flat sheets or circles of metal rolled to the desired thickness are placed on a press. desired shape. Any appropriate handles
The press then forms the sheet metal into the interior or exterior finishes are applied, and and knobs are attached.
In the casting method, molten aluminum is poured into a mold that forms a utensil of the desired configuration. When the metal cools, the mold is opened and the utensil is removed. It is then finished, and handles are attached.
Stainless steel cooking ware
It was long known that stainless steel might make excellent cooking ware because it was attractive, durable, and resistant to tarnish. However, stainless steel lacked heat conductivity. Eventually this obstacle was overcome, and a new line of cooking ware, called Revere Ware, was brought to market. The product's success after World War II was phenomenal. Apparently, U.S. homemakers liked-high quality cooking ware and were able and willing to pay for it.
With increasing competition, the arrival of imports, the advent of the discount store, and the ending of "fair trade" (legal resale price maintenance), the popularity of Revere Ware fell in the late 1950's. Recently, however, copper-bottom stainless steel utensils have staged a revival with the growing demand for gourmet cooking ware. Various manufacturing processes are used to combine stainless steel with aluminum and carbon steel. The resulting combinations are described as two-ply, three-ply, bottom clad, three-ply/bottom clad, and five-ply/bottom clad.
Copper cooking ware
Copper alone or in an alloyed form has been used in cooking utensils since antiquity. Copper makes a good material for top-of-therange cooking ware because of its uniform heat conductivity. Copper cooking surfaces are usually lined with tin or stainless steel or are coated with a nonstick finish because cooked foods left directly in

A-8
contact with uncoated copper may become discolored. While the discoloration is not necessarily injurious, it is not esthetically pleasing.
A modern manufacturing process bonds or laminates copper to other metals, utilizing copper's superior heat conductivity. Some utensils sandwich a heat-conducting core of copper between two layers of stainless steelo
Technology
Production of cast-iron cooking ware is essentially a casting process that requires a foundry for melting the iron in combination with other raw materials, pouring the molten iron into molds, and finishing the resulting casting. The casting process starts with the melting of appropriate quantities of pig iron, steel scrap, alloy metals, coke, and limestone. This is done mainly in cupolas, which are miniature blast furnaces, although electric furnaces are becoming increasingly popular. The quality and the finish of the casting, or final product, varies largely with the particular combination of raw materials and the degree of sophistication of the patterns and the molds, as well as the quality of the sand used in packing the mold. Another important process in the manufacture of cast-iron cooking ware is the polishing of the interior surface of the utensil. Approximately 60 percent of all U.S.-made cast-iron cooking ware undergoes this labor-intensive process.
Traditionally, the foundry process has been technologically simple and labor intensive, although the foundries surveyed in this investigation employ rather modern equipment, including automatic molding equipment. However, foundry operations also produce pollutants, and the Environmental Protection Agency (EPA) has required extensive and · frequently expensive pollution controls.
Domestic manufacturers of cast-iron cooking ware have reported capital outlays since the beginning of 1974 of $1.3 million to bring their foundries into compliance with EPA's emission-control standards. Standard antipollution devices include gas afterburners and baghouses (dust collectors) to trap and dispose of emissions. Reported expenditures for safety equipment, rewiring, and various structural alterations to working areas to comply with requirements of the Occupational Safety and Health Administration have amounted to over $150,000 since 1974.
Owners of U.S. foundries contend that these expenditures, which add to operating costs, are not required of foreign manufacturers. These owners note that the burden of financing these improvements falls heavily on the domestic firms·and their workers since it makes their products less competitive with imports.
A-9
U.S. Producers
At least SO domestic firms produce nonelectric metal cooking ware. Five or six major producers together account for the predominant share of total shipments, which amounted to $475 million in 1976.
Cast-iron cooking ware is currently produced by three firms in their cast-iron foundries. These facilities cannot be used in the production of other types of cooking ware. The current domestic producers are--
General Housewares Corp. Terre Haute, Ind.
The Atlanta Stove Works, Inc. Atlanta, Ga •.
Lodge Manufacturing Co. South Pittsburg, Tenn.
In addition, the Portland Franklin Stove Foundry, Po~tland, Maine, produced very small amounts of cast-iron cooking ware in 1975. The petitioners, The Atlanta Stove Works, General Housewares Corp., and Lodge Manufacturing Co., currently account for all U.S. production.
General Housewares Corp.
General Housewares Corp. was founded in May 1967 for the express purpose of deveioping a multiproduct housewares manufacturing and marketing organization. A publicly held company, it is now engaged in the manufacture and marketing of cooking ware, gift ware, and leisure furniture. These product groups are operated as separate profit centers subject to policy direction and financial control by the company's corporate management.

A-10
The following table sets forth the net sales of each of the firm's three product groups.
General Housewares Corp.: Net sales by product groups, 1972.-76
(In thousands of dollars)
Year ended Dec. 31--Item
1972 1973 1974 1975 1976
Cooking ware-----------: 26,131 26,937 30,342 32,937 :32,206 Giftware---------------: 15,821 13,869 12,174 10,919 :11,700 Leisure furniture------:~1_4~,_74_7~~1_5~'~3_4_5~~13_....,6_9_1~~1_0_,_3_0_2~:1_0_,_2_4~3
Total--------------: 56,699 56,151 56,207 54,158 :54,149 . . . Source: General Housewares Corp.
In 1975, imported cooking ware, leisure furniture, and gift ware products accounted for approximately 9 percent of total company sales. These imported products include kitchen and candle accessories and porcelainized cast-iron cooking ware principally from Japan, Hong Kong, and Western Europe.
General Housewares Corp.'s Cookware Group is headquartered in Terre Haute, Ind., where all of its administrative, product development, marketing, sales, and.control functions are centralized. Terre Haute is also the plant site for the firms domestic porcelainized steel products. This group utilizes regional warehouses in Sidney, Ohio, and Los Angeles, Calif. ·
The company manufactures and markets cooking ware in a broad range of prices, colors and designs. These products are fabricated out of porcelain steel (enamelware), cast iron, aluminum, and porcelainized cast iron. The firm's colored enamelware is sold under its Columbian, CESCO, Classic, Graniteware, and Gourmet brand names. The company manufactures cast-iron and cast-aluminum cooking ware in its Sidney, Ohio, plant. In i976, cast-iron cooking ware accounted for about * * * percent of the company's total sales of cooking ware. The company markets cast-iron cooking ware under two trade names--Wagner and Griswold. The Griswold line has been sold since 1865.

A-11
The Atlanta Stove Works, Inc.
The Atlanta Stove Works, Inc., a long-established, family-owned business, manufactures and markets a variety of cast-iron consumer products including cooking ware, Franklin fireplaces, and stoves other than Franklin fireplaces. The company casts and fabricates its product in its wholly owned subsidiary, the Birmingham Stove & Range Co. The firm has separate marketing organizations in Birmingham and Atlanta. From 1972 to 1976 the company generated sales of * * * million, * * * million, * * * million, * * * million, and * * * million.
The company has made and marketed cast-iron cooking ware since 1889. In 1976, sales of cast-iron cooking ware accounted for about * * * percent of net sales. The firm markets its cast-iron cooking ware under its Century, Pioneer, and Atlanta brand names.
Lodge Manufacturing Co.
Lodge Manufacturing Co., also a long-established, family-owned company, produces and markets cast-iron consumer products and commercial castings. The firm's administrative offices and foundry are located in South Pittsburg, Tenn., about 30 miles west of Chattanooga. The company registered net sales of * * * million, * * * million, * * * million, * * * million, and * * * million from 1972 to 1976.
The company has manufactured cast-iron cooking ware since 1896 and currently markets these articles under its Lodge label. In 1976, cast-iron cooking ware accounted for approximately * * * percent of net sales.
The Question of Increased Imports
U.S. imports of cast-iron cooking ware enter the United States under Tariff Schedules of the United States Annotated (TSUSA) item 653.9560, which became effective January 1, 1974. This item includes uncoated iron or steel cooking ware other than that made from stainless steel. The petitioners allege that imports under this provision consist in major part of cast-iron cooking ware. To test this claim the Commission conducted an analysis of 140 commercial invoices obtained from the port of New York relating to 1976 import entries under TSUSA item 653.9560. This sampling represented about $834,000, or about 13 percent of the value of all 1976 U.S. imports of articles entered under this item. In terms of value, the Commission found about 83 percent of the sample to be, in fact, cast-iron cooking ware. The remaining 17 percent consisted primarily of stainless steel cooking ware, correctly classified at the five-digit legal heading but misclassified with respect to the statistical annotation. In light of these findings, the petitioners' claim that item 653.9560 consists in major

A-12
part of cast-iron cooking ware seems essentially correct. In any event, the relatively small amount of misclassified merchandise will in no substantial way alter the basic import trends. For this reason the following analysis will use the official statistics of the U.S. Department of Commerce as a close approximation to U.S. imports of cast-iron cooking ware, except as noted.
U.S. imports
In 1976 about 50 percent of all imported cast-iron cooking ware consisted of skillets, many of which had wooden handles and a distinctive polished interior. Most imported articles were sold in sets by the importer directly to the retailer, often a mass merchant or discount house.
U.S. imports increased from 654,000 pieces in 1972 to 1.5 million pieces in 1973 before registering a small decline in 1974 to 1.3
. million pieces (table 1, app. A). U.S. imports then jumped to 2.0 million pieces in 1975 and 8.4 million pieces in 1976. U.S. imports measured in pounds experienced a similar pattern. In the above context a piece is defined by the U.S. Customs Service to be any separable item of cooking ware wholly or almost wholly of cast iron. This means that a cast-iron Dutch oven imported with a cast-iron lid would be recorded as two pieces.
The value of U.S. imports increased every year from 1972 through 1976, rising thirtyfold over the period. Quarterly and monthly import data for the period 1974-76 are found in tables 2 through 4. The following table summarizes the above information on annual U.S. imports.
Cast-iron cooking ware: U.S. imports for consumption, 1972-76
. . . Year ; Quantity (!);Quantity (2); Value
1,000 :1,000 pieces :1,000 pounds: dollars
1972-----------------------------: 1973-----------------------------: 1974-----------------------------: 1975-----------------------------: 1976-----------------------------:
654 1,496 1,257 2,059 8,391
590 1,320 1,293 4,169
20,531
210 648 760
1,496 6,497
Source: Data for 1974-76 compiled from official statistics of the U.S. Department of Commerce and data for 1972 and 1973 from data submitted in response to questionnaires of the U.S. International Trade Commission.

A-13
Taiwan, by far the largest foreign supplier of U.S. imports, accounted for 57 percent, 60 percent, and 74 percent (in terms of quantity measured in pieces) of all U.S. imports in 1974, 1975, and 1976, respectively (table 5). The Republic of Korea, the second largest supplier, accounted for less than l percent in 1974 and for about 8 percent in 1975 and 1976.
U.S. imports have not only increased absolutely, but also relative to domestic production of cast-iron cooking ware. The following table indicates that the ratio of imports to domestic production rose from about 9 percent in 1972 to 214 percent in 1976.
Cast-iron cooking ware: U.S. imports for consumption, and production, 1972-76
Item 1972
Imports------------1,000 pieces--: 654 Production-----------------do----: 7,033 Ratio of imports to produc-
tion------------------percent--: 9
1973
1,496 6,519
23 . .
1974
1,157 5,602
21
1975
2,059 3,557
58
1976
8,391 3,917
214
Source: Imports for 1972 and 1973 and production compiled from data submitted in response to questionnaires of the U.S. International Trade Commission; imports for 1974-76 compiled from official statistics of the U.S. Department of Commerce.
U.S. imports from GSP designated beneficiary countries
Effective January 1, 1976, U.S. imports of cast-iron cooking ware from all designated beneficiary developing countries became eligible for duty-free treatment for purposes of the GSP. Since 1974 these countries, notably Taiwan and Korea, have supplied the bulk of all U.S. imports of this item. U.S. imports by designated beneficiary countries increased from 0.9 million pieces in 1974 to 1.4 million pieces in 1975, and, after the institution of GSP in 1976, jumped to 7.1 million pieces. Table 3 summarizes U.S. imports, by quarters, from designated beneficiary countries for the periods January-March 1974 to OctoberDecember 1976. The table on the following page illustrates the extent to which U.S. imports in 1976 entered duty-free under the GSP.
The Taiwanese industry
The Taiwanese cast-iron cooking ware industry evolved in response to the energy crisis and the recent worldwide economic recession. Declining demand for Taiwanese-made barbecue grills (better known as

Cast-iron cooking ware: U.S. imports for consumption, duty-free and total, by months, 1976
Duty-free imports Total imports Month
Quantity Value Quantity Value
Ratio of duty-free imports to total
Quantity . Value
Pieces Pieces Percent : Percent
January--------------------: 51,176 : $45,844 : 321,093 : $277,223 February-------------------: 357,529 : 278,898 : 438,365 : 341,948 March----------------------: 412,925 : 327,388 : 599,681 : 467,281 April----------------------: 602,384 : 385,562 : 685,162 : 431,555 May------------------------: 576,263 : 423,468 : 605,331 : 469,399 June-----------------------: 436,240 : 393,137 : 482,641 : 449,052 July-----------------------: 624,323 : 619,641 : 661,012 : 685,454 August---------------------: 775,006 : · 474,668 : 942,436 : 616,967 September------------------: 845,691 : 525,979 : 955,954 : 656,936
·October--------------------: 880,088 : 575,045 : 975,103 : 704,832 November-------------------: 807,055 : 525,721 : 900,962 : 625,517 December-------------------: 752,701 : 654,136 : 822,824 : 770,569
Total------------------:7,121,381 :5,229,487 : 8,390,564: 6,496,733
Source: Compiled from official statistics of the U.S. Department of Commerce.
. . 16 : 82 : 69 : 88 : 95 : 90 : 94 : 82 : 88 : 90 : 90 : 91 : 85 :
17 82 70 89 90 88 90 77 80 82 84 85 80
~ t--' .i:--

A-15
hibachis) caused many Taiwanese foundries to diversify into new products such as cast-iron cooking ware. To better understand the relationship between hibachis and cast-iron cooking ware, we will quickly trace the history of the Taiwanese hibachi industry. l/
A few Taiwanese foundries started producing hibachis for export nearly a decade ago. During the early 1970's the sales of these foundries expanded rapidly as Japanese firms stopped producing the hibachis because of increased costs. Annual exports to the United States rose from 1.5 million units in 1971 to 2.3 million units in 1972 and then peaked in 1973 at about 2.5 million units. In quick succession the 1974 energy crisis and the worldwide recession battered the U.S. hibachi market. Being a nonessential item, barbecue grills were especially vulnerable to a cutback in consumer spending. Annual exports dropped to 1.7 million units in 1974 and then to 1.3 million units in 1975. Since the average hibachi contains about 15.4 pounds of cast iron, the Taiwanese foundries had at least 18.5 million pounds of surplus capacity. At its height, the Taiwanese hibachi industry included more than 50 firms specializing in the casting of iron grills. By early 1975, fewer than half were still in business. Because of the heavy competition, Taiwanese manufacturers attempted to diversify into new products such as stoves, trivets, and cast-iron cooking ware (transcript of the hearing, p. 173). Appealing to energy conservation and tight household budgets, these products were well received in the U.S. export market. In 1976, renewed consumer spending in the United States kept many Taiwanese foundries busy as exports of cooking ware soared, and even Taiwanese exports of hibachis recovered somewhat, amounting to about 2.0 million units.
During 1976 at least 30 Taiwanese foundries produced cast-iron cooking ware for export to the United States. Most foundries are small, employing an average of about 20 workers. A factory is considered of medium size if it employs 40 to 60 workers; the largest factory has a work force of about 200.
The Question of Serious Injury to the Domestic Industry
The petitioners alleged, among other things, that the domestic industry is being seriously injured or threatened with serious injury. In determining whether the domestic industry is suffering the requisite injury or threat thereof, the Commission considers all relevant economic factors, including plant utilization, profitability, employment, shipments, inventories, exports, distribution and marketing, prices, wages, capital and R. & D. expenditures, and industry efforts to compete with imports.
ll Much of the following information was obtained from interviews with U.S. importers and from articles of the Business & Industry Taiwan.
A-16
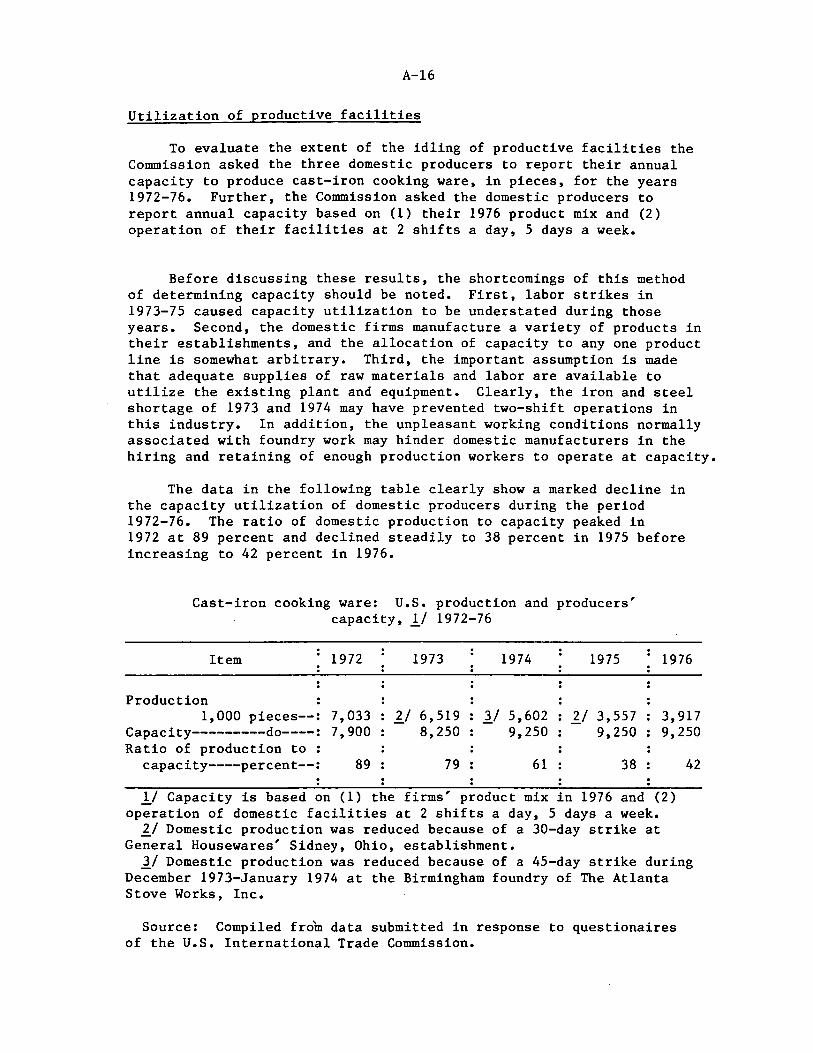
Utilization of productive facilities
To evaluate the extent of the idling of productive facilities the Commission asked the three domestic producers to report their annual capacity to produce cast-iron cooking ware, in pieces, for the years 1972-76. Further, the Commission asked the domestic producers to report annual capacity based on (1) their 1976 product mix and (2) operation of their facilities at 2 shifts a day, 5 days a week.
Before discussing these results, the shortcomings of this method of determining capacity should be noted. First, labor strikes in 1973-75 caused capacity utilization to be understated during those years. Second, the domestic firms manufacture a variety of products in their establishments, and the allocation of capacity to any one product line is somewhat arbitrary. Third, the important assumption is made that adequate supplies of raw materials and labor are available to utilize the existing plant and equipment. Clearly, the iron and steel shortage of 1973 and 1974 may have prevented two-shift operations in this industry. In addition, the unpleasant working conditions normally associated with foundry work may hinder domestic manufacturers in the hiring and retaining of enough production workers to operate at capacity.
The data in the following table clearly show a marked decline in the capacity utilization of domestic producers during the period 1972-76. The ratio of domestic production to capacity peaked in 1972 at 89 percent and declined steadily to 38 percent in 1975 before increasing to 42 percent in 1976.
Cast-iron cooking ware: U.S. production and producers' capacity, lf 1972-76
Item 1972 1973 1974 1975 1976
Production 1,000 pieces--: 7,033 1.1 6,519 lf 5,602 11 3,557 3,917
Capacity---------do----: 7,900 8,250 9,250 9,250 9,250 Ratio of production to . .
capacity----percent--: 89 79 61 38
l/ Capacity is based on (1) the firms' product mix in 1976 and (2) operation of domestic facilities at 2 shifts a day, 5 days a week. lf Domestic production was reduced because of a 30-day strike at
General Housewares' Sidney, Ohio, establishment.
42
lf Domestic production was reduced because of a 45-day strike during December 1973-January 1974 at the Birmingham foundry of The Atlanta Stove Works, Inc.
Source: Compiled from data submitted in response to questionaires of the U.S. International Trade Commission.
A-17
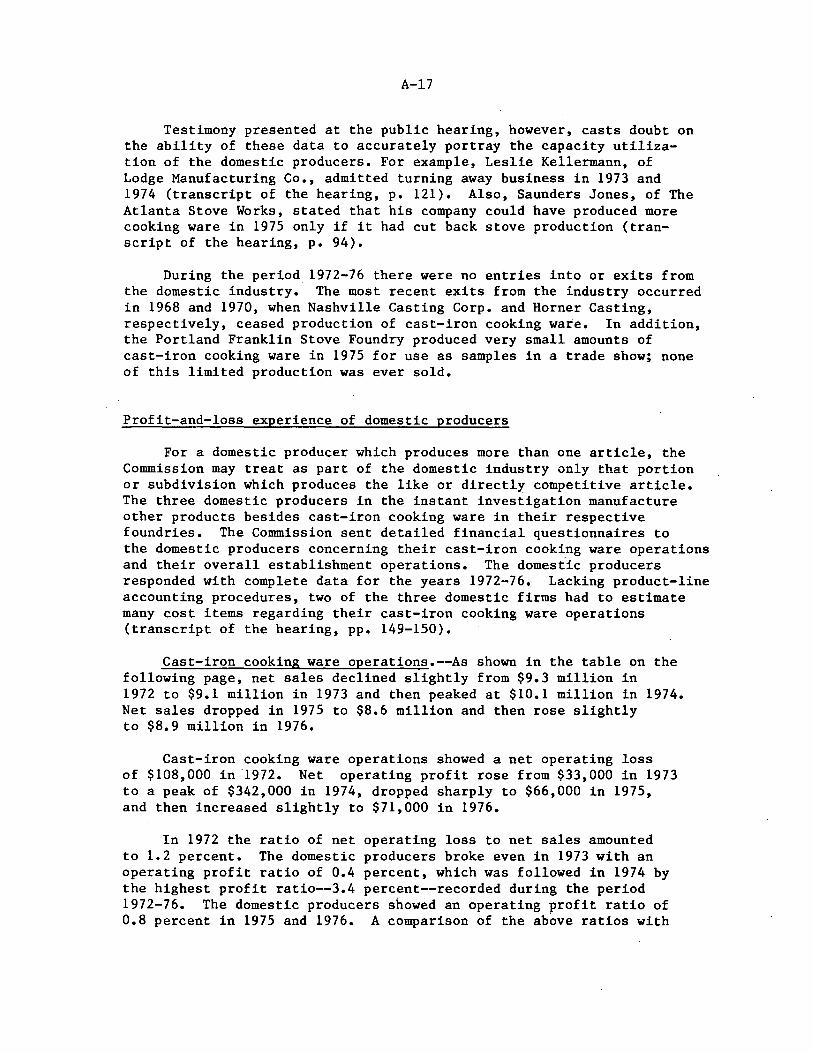
Testimony presented at the public hearing, however, casts doubt on the ability of these data to accurately portray the capacity utilization of the domestic producers. For example, Leslie Kellermann, of Lodge Manufacturing Co., admitted turning away business in 1973 and 1974 (transcript of the hearing, p. 121). Also, Saunders Jones, of The Atlanta Stove Works, stated that his company could have produced more cooking ware in 1975 only if it had cut back stove production (transcript of the hearing, p. 94).
During the period 1972-76 there were no entries into or exits from the domestic industry. The most recent exits from the industry occurred in 1968 and 1970, when Nashville Casting Corp. and Horner Casting, respectively, ceased production of cast-iron cooking ware. In addition, the Portland Franklin Stove Foundry produced very small amounts of cast-iron cooking ware in 1975 for use as samples in a trade show; none of this limited production was ever sold.
Profit-and-loss experience of domestic producers
For a domestic producer which produces more than one article, the Commission may treat as part of the domestic industry only that portion or subdivision which produces the like or directly competitive article. The three domestic producers in the instant investigation manufacture other products besides cast-iron cooking ware in their respective foundries. The Commission sent detailed financial questionnaires to the domestic producers concerning their cast-iron cooking ware operations and their overall establishment operations. The domestic producers responded with complete data for the years 1972-76. Lacking product-line accounting procedures, two of the three domestic firms had to estimate many cost items regarding their cast-iron cooking ware operations (transcript of the hearing, pp. 149-150).
Cast-iron cooking ware operations.--As shown in the table on the following page, net sales declined slightly from $9.3 million in 1972 to $9.l million in 1973 and then peaked at $10.1 million in 1974. Net sales dropped in 1975 to $8.6 million and then rose slightly to $8.9 million in 1976.
Cast-iron cooking ware operations showed a net operating loss of $108,000 in '1972. Net operating profit rose from $33,000 in 1973 to a peak of $342,000 in 1974, dropped sharply to $66,000 in 1975, and then increased slightly to $71,000 in 1976.
In 1972 the ratio of net operating loss to net sales amounted to 1.2 percent. The domestic producers broke even in 1973 with an operating profit ratio of 0.4 percent, which was followed in 1974 by the highest profit ratio--3.4 percent--recorded during the period 1972-76. The domestic producers showed an operating profit ratio of 0.8 percent in 1975 and 1976. A comparison of the above ratios with
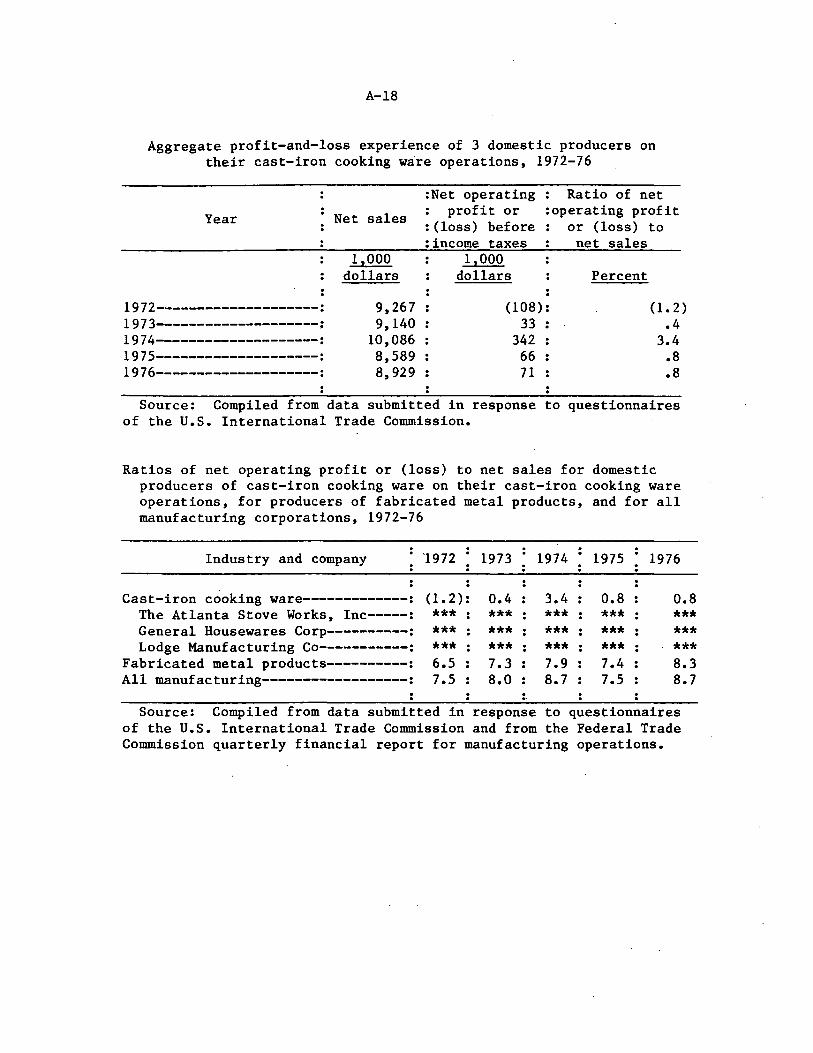
A-18
Aggregate prof it-and-loss experience of 3 domestic producers on their cast-iron cooking ware operations, 1972-76
Year
1972--------------------: 1 9 7 3--------------------.: 1974--------------------: 1975--------------------: 1976--------------------:
Net sales
1,000 dollars
9,267 9,140
10,086 8,589 8,929
:Net operating profit or
: (loss) before :income taxes
1,000 dollars
Ratio of net :operating profit
or (loss) to net sales
Percent
(108): (1. 2) 33 .4
342 3.4 66 .8 71 .8
Source: Compiled from data submitted in response to questionnaires of the U.S. International Trade Commission.
Ratios of net operating profit or (loss) to net sales for domestic producers of cast-iron cooking ware on their cast-iron cooking ware operations, for producers of fabricated metal products, and for all manufacturing corporations, 1972-76
Industry and company 1972 1973 1974 1975 1976
Cast-iron cooking ware-------------: (1.2): 0.4 3.4 0.8 0.8 The Atlanta Stove Works, Inc-----: *** *** *** *** *** General Housewares Corp----------: *** . *** *** *** *** . Lodge Manufacturing Co-----------: *** *** *** *** ***
Fabricated metal products----------: 6.5 7.3 7.9 7.4 8.3 All manufacturing------------------: 7.5 8.0 8.7 7.5 8.7
•. Source: Compiled from data submitted in response to questionnaires
of the U.S. International Trade Commission and from the Federal Trade Commission quarterly financial report for manufacturing operations.

A-19
those for all manufacturers of fabricated metal products and all manufacturing corporations shows that the domestic producers on their cast-iron cooking ware operations were far less profitable than either of the other groups· during the period 1972-76. Operating losses were sustained by at least one domestic producer in every year during the period 1972-76, and two domestic producers posted operating losses in 1973 and 1975. The above information is summarized in the tables on the preceding page and table 6.
Overall establishment operations.--The domestic producers fared_ considerably better on their overall establishment operations than on their cast-iron cooking ware operations (table 7). Notwithstanding, the domestic producers' ratio of net operating profit to net sales still lagged behind the comparable figures for producers of all fabricated metal products and for all manufacturing corporations for every year during the period 1972-76 except 1975 (see the following table). In general, the profit performance of the three domestic producers measured as the ratio of net profit after taxes to the book value of total assets tracks rather closely the movements in the ratio of net operating profit to net.sales for overall establishment operations (tables 8 through 10).
Ratios of net operating profit or (loss) to net sales for domestic producers of cast-iron cooking ware on their overall establishment operations, for producers of fabricated metal products and for all manufacturing corporations, 1972-76
Overall establishment operations---------:
The Atlanta Stove Works, Inc--~------:
General Housewares Corp---------------:
Lodge Manufacturing Co---~-------------:
Fabricated metal products-------------:
All manufacturing------:
1972
5.6
***
***
***
6.5 7.5
1973
3.5
***
***
***
7.3 8.0
1974
6.0
***
***
***
7.9 8.7
1975
11. 7
***
***
***
7.4 7.5
1976
Source: Compiled from data submitted in response to questionnaires of the U.S. International Trade Commission and from the Federal Trade Commission_ quarterly financial report for manufacturing operations.
2.2
***
***
***
8.3 8.7
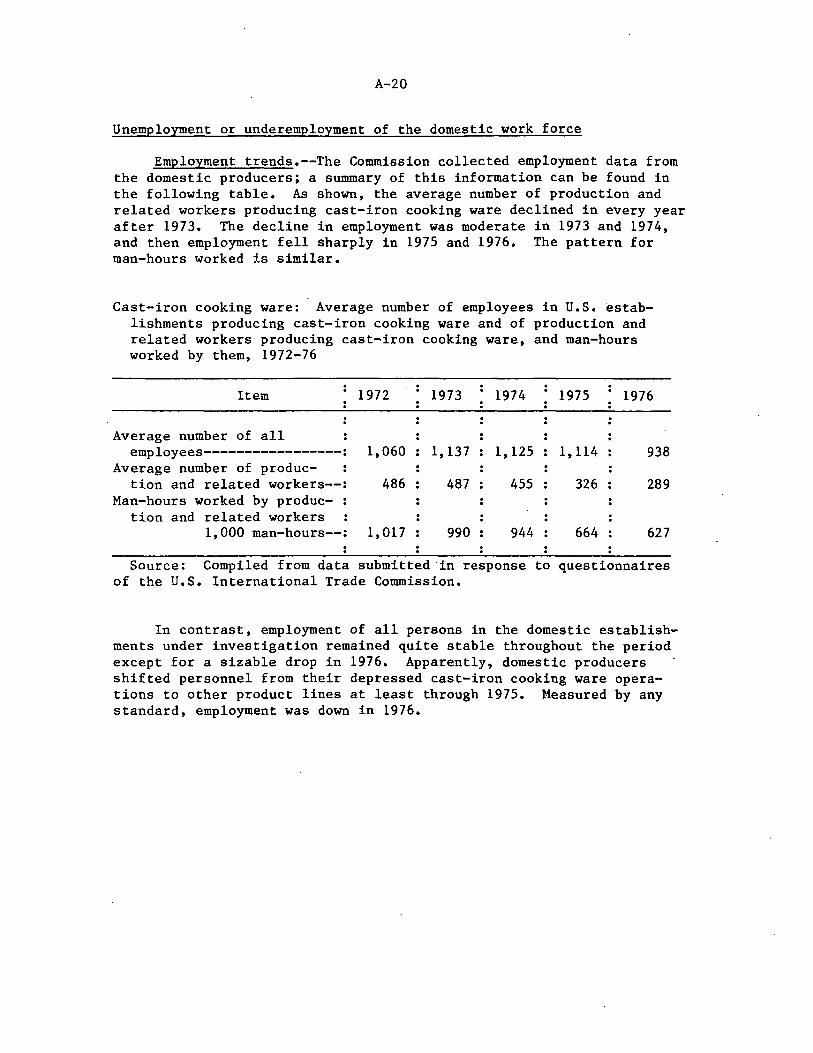
A-20
Unemployment or underemployment of the domestic work force
Employment trends.--The Commission collected employment data from the domestic producers; a summary of this information can be found in the following table. As shown, the average number of production and related workers producing cast-iron cooking ware declined in every year after 1973. The decline in employment was moderate in 1973 and 1974, and then employment fell sharply in 1975 and 1976. The pattern for man-hours worked is similar.
Cast-iron cooking ware: Average number of employees in U.S. establishments producing cast-iron cooking ware and of production and related workers producing cast-iron cooking ware, and man-hours worked by them, 1972-76
Item 1972 1973 1974 1975 1976
Average number of all employees-----------------: 1,060 1,137 1,125 1,114 938
Average number of produc-tion and related workers--: 486 487 455 326 289
Man-hours worked by produc- . . tion and related workers
1,000 man-hours--: 1,017 990 944 664 627
Source: Compiled from data submitted in response to questionnaires of the U.S. International Trade Commission.
In contrast, employment of all persons in the domestic establishments under investigation remained quite stable throughout the period except for a sizable drop in 1976. Apparently, domestic producers shifted personnel from their depressed cast-iron cooking ware operations to other product lines at least through 1975. Measured by any standard, employment was down in 1976.
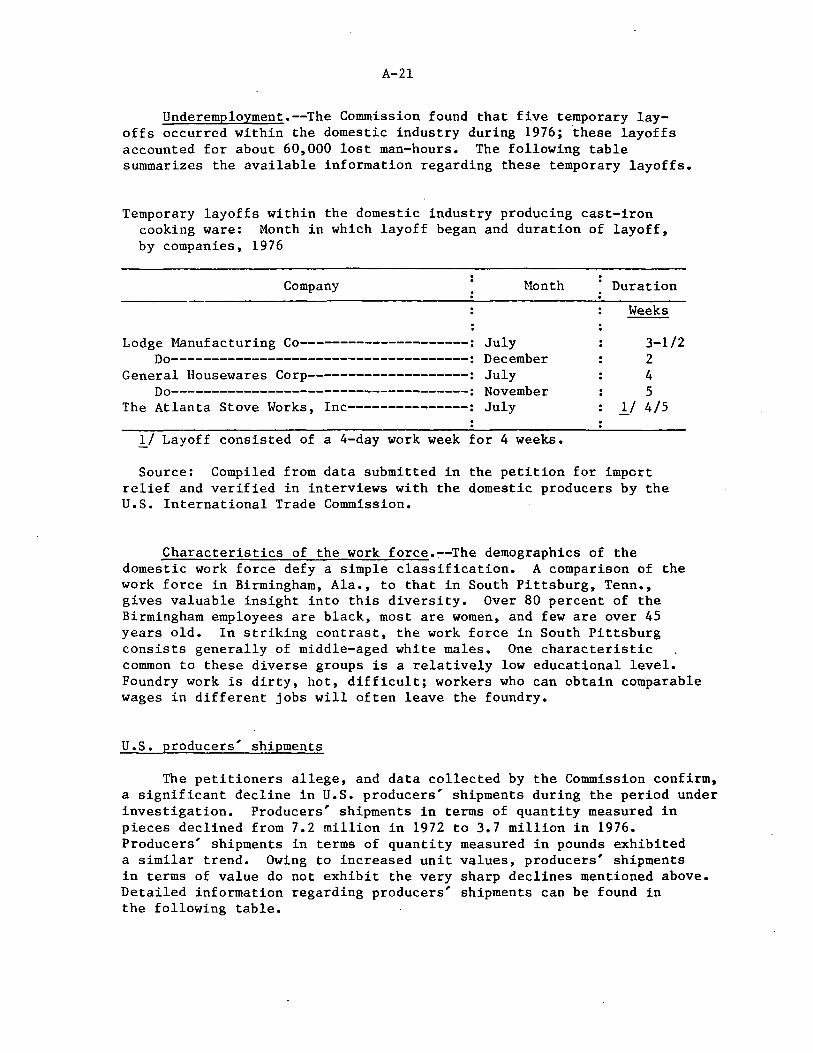
A-21
Underemployment.--The Commission found that five temporary layoffs occurred within the domestic industry during 1976; these layoffs accounted for about 60,000 lost man-hours. The following table summarizes the available information regarding these temporary layoffs.
Temporary layoffs within the domestic industry producing cast-iron cooking ware: Month in which layoff began and duration of layoff, by companies, 1976
Company Month
Lodge Manufacturing Co---------------------: July Do-------------------------------------: December
General Housewares Corp--------------------: July Do-------------------------------------: November
The Atlanta Stove Works, Inc---------------: July
l_/ Layoff consisted of a 4-day work week for 4 weeks.
Duration
Weeks
3-1/2 2 4 5
l/ 4/5
Source: Compiled from data submitted in the petition for import relief and verified in interviews with the domestic producers by the U.S. International Trade Commission.
Characteristics of the work force.~-The demographics of the domestic work force defy a simple classification. A comparison of the work force in Birmingham, Ala., to that in South Pittsburg, Tenn., gives valuable insight into this diversity. Over 80 percent of the Birmingham employees are black, most are women, and few are over 45 years old. In striking contrast, the work force in South Pittsburg consists generally of middle-aged white males. One characteristic common to these diverse groups is a relatively low educational level. Foundry work is dirty, hot, difficult; workers who can obtain comparable wages in different jobs will of ten leave the foundry.
U.S. producers' shipments
The petitioners allege, and data collected by the Commission confirm, a significant decline in U.S. producers' shipments during the period under investigation. Producers' shipments in terms of quantity measured in pieces declined from 7.2 million in 1972 to 3.7 million in 1976. Producers' shipments in terms of quantity measured in pounds exhibited a similar trend. Owing to increased unit values, producers' shipments in terms of value do not exhibit the very sharp declines mentioned above. Detailed information regarding producers' shipments can be found in the following table.

A-22
Cast-iron cooking ware: U.S. producers' shipments, 1972-76
Year Quantity (1) Quantity (2) Value
1,000 pieces 1,000 pounds 1,000
dollars
1972---------------------------: 1973---------------------------: 1974---------------------------: 1975---------------------------: 1976---------------------------:
7,273 6,511 5,456 3,719 3,734
33,336 29,493 24,677 17,061 17,082
9,660 9,421
10,454 8,945 9,245
Source: Compiled from data submitted in response to questionnaires of the U.S. International Trade Commission.
Inventories
U.S. producers and importers provided information regarding their yearend inventories for the years 1972-76. U.S. producers reported that inventories were quite stable in 1972 and 1973 and then increased substantially in 1974 because of falling sales. Lower production levels in 1975 enabled U.S. producers to reduce inventories during that year; however, these same low levels of production did not prevent another significant inventory buildup in 1976. Importers' inventories increased every year throughout the period 1972-76. The most striking rise occurred between 1975 and 1976, when inventories increased nearly fourfold in line with a threefold increase in imports. These data are summarized in the following table.
Cast-iron cooking ware: Inventories held by U.S. producers and importers, Dec. 31 of 1972-76
(In thousands of pieces)
Date Producers' :Importers' l/
Dec. 31, 1972-----------------------------: Dec. 31, 1973-----------------------------: Dec. 31, 1974-----------~-----------------: Dec. 31, 1975-----------------------------: Dec. 31, 1976-----------------------------:
inventories inventories
536 544 690 528 711
124 209 289 432
2,098
l/ Estimated from a survey of importers which accounted for approximately 70 percent, in terms of value, of total U.S. imports in 1975 and 1976.
Source: Compiled from data submitt~d in response to questionnaires of the U.S. International Trade Commission.

A-23
Exports
U.S. exports of cast-iron cooking ware were stable during the period under investigation. In terms of both value and quantity, exports accounted for between 3 and 8 percent of producers' shipments during 1972-76. Changes in the share of producers' shipments accounted for by exports were influenced not so much by changing levels of exports but rather by declining domestic shipments. Detailed information regarding U.S. exports can be found in table 1.
Channels of distribution and marketing considerations
The U.S. market for cast-iron cooking ware has a relatively simple structure. Final consumers purchase cast-iron cooking ware from a wide variety of retailers, including mass merchandisers, discount stores, supermarkets, drug stores, hardware stores, and department stores.
There is a substantial group of middlemen, the so-called rack-j obbers, with a well-defined position in the market. These firms buy from domestic producers and importers for resale to smaller retail outlets such as hardware stores. Only one domestic producer, General Housewares Corp., has distributed foreign-made cast-iron cooking ware, and it discontinued this activity in 1973. At least two major retailers--S. S. Kresge Co. and Gamble-Skogmo--import for their own accounts. The table on the following page shows the distribution of cast-iron cooking ware by types of customers.
Domestic producers enjoy at least two significant advantages over import competition in the distributor market--a close historical relationship with the rack-jobbers and shorter delivery lead times. These advantages, however, diminish in the marketing of cast-iron cooking ware to high-volume retail outlets, where price is the over~ riding consideration.
In view of the lack of significant product differences, evidence suggests that consumers are responsive to price, product design, and merchandising programs. Some importers have introduced wooden handles in an attempt to capitalize on the recent gourmet cookware trend. Some domestic producers and importers have promoted the marketing of complete sets of cookware rather than individual pieces. Finally, some domestic producers and importers hav~ developed marketing promotions which appeal to the recent early American fashions.
The firms in this industry are interdependent; the policies of one producer directly and markedly affect the other two. The intense personal rivalry between the producers may account for the striking similarity of the domestic cookware with respect to size, weight, price, and finish. There seems to_ be no clear price leadersqip by any one firm.

A-24
Cast-iron cooking ware: Percentage distribution of shipments by U.S. producers and importers, in terms of value, by types of customers, 1974 and 1976
Year and type of customer :Ship~ents:Shipments : by u.s. : by v~s. :producers:producers
1974: Wholesalers and jobbers------------------------: 48 . 4 Retail outlets------------------------~-------: 52 96 Consumers--------------------------------------:_,__,__,___;'--'--_,__,_~-=0 0
Total----------------------------------------: 100 100 1976:
Wholesalers and jobbers------------------------: 42 3 Retail outlets------------------------~--------: 58 84 Consumers-----------------------------~-------:_,__,__,_~_,_~_,_~~~ 0 13
Total----------------------------------------:
Source: Compiled from data sub~itted in response of the U.S. International Trade Commission.
Price trends and comparisons
to
100 100
questionnaires
To investigate price trends in the market the Commission sent detailed questionnaires to domestic producers and importers of castiron cooking ware. Questionnaire respond~nts were asked to supply lowest net selling prices and to specify the weights of the particular items being priced, thus enabling the Commission to investigate possible differences between the domestic and imported articles. Results with respect to price and weight are presented in tables 11 through 14.
Domestic prices rose moderately from 1972 to 1973 and then jumped in 1974. Stiff consumer resistan~~ led to lower prices throughout much of 1975, and intense competitive press~res in 1976 kept increases quite moderate despite rapidly increasing operating costs.
The average net selling prices received by importers increased throughout 1972-76, The large price increase in 1975 is difficult to interpret because of a change in product mix that occurred at that time. Information contained in tables 11 through 14 clearly shows an increase of about 20 percent in the weight of the imported articles between April-June 1974 and January-March 1975. In all probability the price increases during this period reflect a combination of increased product quality and price escalation.
The petitioners allege that domestic wholesale prices are generally twice as high as the importers' landed costs. The above allegation may be true, but a more meaningful price analysis compares the lowest

A-25
net selling prices of the domestic and imported article_s sold to the same types of customers. Questionnaire responses on four of five representative items of cast-iron cooking ware permit a comparison of import prices with domestic prices using arithmetic averages. Inadequate import price data on the 5-quart Dutch oven required the deletion of this price series.
During 1972-76 significant price differences existed between three of the four representative items of Taiwanese- and U.S.-made cooking ware. Generally, these differences lessened from January-March 1972 through July-December 1973, probably because of the dollar devaluation occurring at that time. The price differences then grew suddenly in 1974 as inflationary forces drove up domestic prices. After reaching their widest margins in October-December 1974, price differences gradually lessened from January-March 1975 through December 1976.
A few large retailers obtain their cast-iron cooking ware requirements directly from foreign manufacturers and trading companies. These transactions accounted for about 25 percent of all U.S. imports in 1976. In importing directly, these retailers are able to procure their requirements at significantly lower costs.
Wages
Although hourly wage rates for all employees increased throughout the period 1972-76, the trend in total wages paid by domestic producers for direct labor was downward. Total wages paid declined from $1,336,000 in 1972 to $1,249,000 in 1973, $1,215,000 in 1974, and $835,000 in 1975 and then increased to $1,003,000 in 1976. Evidence suggests that total wages paid by domestic producers for indirect labor followed a similar pattern.
Capital expenditures and research and development costs
Total capital expenditures for U.S. facilities in which cast-iron cooking ware is produced decreased from $1,645,000 in 1972 to $791,000 in 1974 before jumping to $2,550,000 in 1975. Such expenditures declined sharply in 1976 to $1,074,000. Research and development expenses were small throughout the period under consideration; for example, in 1976 the ratio of research and development expenses to total domestic shipments was about 2 percent. Detailed information on capital expenditures and research and development costs is found in table 15.
Efforts of U.S. producers to compete with imports
U.S. producers were asked to d_escribe their efforts in re.cent years to compete more effectively in the U.S. market. The firms

A-26
reported that they had done one or more of the following: (1) Expanded their product lines to include specialty items such as crepe pans, breakfast griddles, and wooden-handle cooking ware, (2) employed cost-reduction techniques such as improved sand-mixing and sand-monitor ing techniques, (3) developed merchandising programs that include more attractive catalogs, display units and skillet labels, (4) improved customer service through reduced delivery lead times, and (5)' withheld necessary price increases in an effort to stay competitive with the imported article.
A-27
The Question of Substantial Cause
Petitioners claim that the alleged increased imports are a substantial cause of the serious injury, or the threat thereof. Section 20l(b)(4) of the Trade Act of 1974 defines the term "substantial cause" to be "a cause which is important and not less than any other cause." Section 20l(b)(2) of the Trade Act further states that, in determining whether increased imports are a substantial cause of injury, the Commission should consider all relevant economic factors, including, but not limited to, an increase in imports (either actual or relative to domestic production) and a decline in the proportion of the domestic market supplied by the domestic producers. This section sets forth and analyzes various possible causes of any injury or threat thereof.
Consumption and market penetration
Cast-iron cooking ware.--Apparent consumption declined steadily from 7.7 million pieces in 1972 to 5.5 million pieces in 1975 before rebounding sharply to 11.8 million pieces in 1976 (table l). Apparent consumption measured in pounds reveals a similar pattern. Because of increased unit prices, the value of apparent consumption remained quite constant at about $10 million for the years 1972-75 before climbing to $15 million in 1976.
Apparent consumption does account for changes in U.S. producers' inventories, but not for changes in importers' inventories. This causes some problems in the instant investigation because large buildups in importers' inventories tend to overstate actual consumption, especially in 1976 (see table on p. A-22). The following table compares unadjusted apparent consumption with apparent consumption that is adjusted for changes in importers' inventories.

A-28
Cast-iron cooking ware: Apparent U.So consumption, l/ unadjusted and adjusted for changes in importers' inventories, 1972-76
{In thousands of 2ieces~
Item 1972 1973 1974 1975 1976
Unadjusted---~---------: 7,677 7,635 6,408 5,467 11,849 Adjusted for changes
in importers' inventories----------:1/ 7,650 7,550 6,328 5,324 10,183
ll Shipments plus imports minus exports. J:./ Estimated by the U.S. International Trade Commission.
Source: U.S. producers' shipments, exports, imports for 1972 and ·1973, and importers' inventories compiled from data submitted in response to questionnaires of the U.S. International Trade Commission; imports for 1974-76 compiled from official statistics of the U.S. Department of Connnerce.
The ratio of imports to apparent consumption increased dramatically in terms of both quantity and value during 1972-76. (table 1). The most pronounced increases in the ratio occurred during the last 2 years (table 2). With quantity measured in pieces, the ratio increased from 9 percent in 1972 to 20 percent in 1974 and then to 71 percent in 1976. With quantity measured in pounds, the ratio increased from 2 percent in 1972 to 5 percent in 1974 and then to 57 percent in 1976. In terms of value, the ratio of imports to apparent consumption rose from 2 percent in 1972 to 7 percent in 1974 and then to 43 percent in 1976.
Nonelectric metal cooking ware.--Apparent consumption of nonelectric metal cooking ware (excluding cast-iron cooking ware) increased from $360 million in 1972 to $417 million in 1975 before jumping to $491 million in 1976 (table 16). To a large extent, this increase in apparent consumption reflects higher unit prices rather than higher unit sales. To isolate changes in unit sales, a price deflater was needed to transform the above statistics from current dollars to constant dollars. Ideally, this price deflater should consist of a weighted price index of many items of nonelectric metal cooking ware. Unfortunately, the U.S. Bureau of Labor Statistics collects and publishes wholesale price information on only one item of nonelectric metal cooking ware--an aluminum saucepan. For lack of an alternative method, this price index was used as the deflater for all nonelectric metal cooking ware. The following table compares apparent consumption in current dollars with apparent consumption measured in 1972 constant

A-29
Nonelectric metal cooking ware (excluding cast-iron cooking ware): Apparent U.S. consumption 1./ in current dollars and 1972 constant dollars, 1972-76
(In millions of dollars)
Item 1972 1973 1974 1975 1976
Current dollars-------: 360 392 394 417 1972 constant
dollars-------------: 360 382 331 306 . . . '!/ Shipments plus imports minus exports.
Source: U.S. producers' shipments compiled from data submitted in response to questionnaires of the U.S. International Trade Commission; imports and exports compiled from official statistics of the U.S. Department of Commerce.
491
349
Apparent consumption of nonelectric metal cooking ware (excluding cast-iron cooking ware), measured in 1972 constant dollars, increased slightly from $360 million in 1972 to $382 million in 1973 before dropping significantly to $306 million in 1975. Apparent consumption rebounded markedly in 1976. The import-to-consumption ratio, in terms of value, remained at about 10 percent during the period 1972-76.
Possible causes of serious injury to the domestic industry
Substitution of other types of cooking ware.--Many witnesses at the public hearing testified that cast-iron cooking ware competes to some extent in the marketplace with other types of cooking ware. · Some witnesses alleged that other types of cooking ware have, in fact, displaced cast-iron cooking ware (transcript of the hearing, p. 235). To evaluate these allegations the Commission collected data regarding the apparent consumption of cast-iron cooking ware and other types of nonelectric metal cooking ware. A summary of this information appears on the following page.
Between 1972 and 1975, apparent consumption of cast-iron cooking ware declined about 29 percent. During the same period, apparent consumption of other nonelectric metal cooking ware declined only about 15 percent. Given the fact that the prices of cast-iron cooking ware increased significantly faster than the prices of other types of nonelectric metal cooking ware during most of this period, there is a there is a strong possibility of some substitution. In 1976 apparent consumption of nonelectric metal cooking ware increased about 14
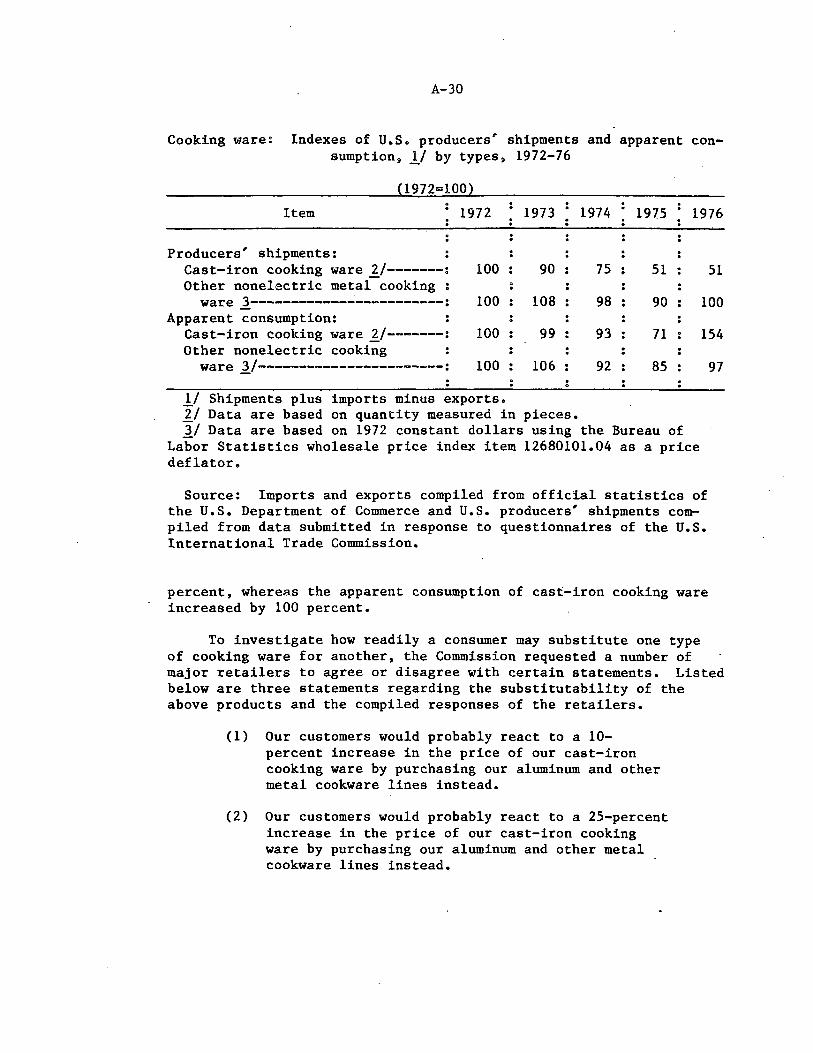
A-30
Cooking ware: Indexes of U.S. producersu shipments and apparent consumption~ l/ by types, 1972-76
(1972=100)
Item 1972 1973 1974 1975 1976
Producers ,
shipments: Cast-iron cooking ware 1:./-------~ 100 90 75 51 51 Other nonelectric metal cooking . .
ware ].------------~-----------: 100 108 98 90 100 Apparent consumption:
Cast-iron cooking ware J:..1-------: 100 99 93 71 154 Other nonelectric cooking
ware ]./-----------------------: 100 106 92 85
1/ Shipments plus imports minus exports. 2/ Data are based on quantity measured in pieces. 3/ Data are based on 1972 constant dollars using the Bureau of
Labor Statistics wholesale price index item 12680101~04 as a price deflator.
Source: Imports and exports compiled from official statistics of the U.S. Department of Commerce and U.S. producers' shipments compiled from data submitted in response to questionnaires of the U.S. International Trade Commission.
percent, whereas the apparent consumption of cast-iron cooking ware increased by 100 percent.
To investigate how readily a consumer may substitute one type
97
of cooking ware for another, the Commission requested a number of major retailers to agree or disagree with certain statements. Listed below are three statements regarding the substitutability of the above products and the compiled responses of the retailers.
(1) Our customers would probably react to a 10-percent increase in the price of our cast-iron cooking ware by purchasing our aluminum and other metal cookware lines instead.
(2) Our customers would probably react to a 25-percent increase in the price of our cast-iron cooking ware by purchasing our aluminum and other metal cookware lines instead.

A-31
(3) Porcelainized cast-iron cooking ware appeals to the same customers who purchase our plain cast-iron cooking ware.
Statement: Agree : Agree but Not sure; :Disagree but:Disagree
. strongly :not strongly: it depends :not strongly: strongly
1---------: 1 1 0 3 4 2---------: 5 2 1 0 1 3---------: 0 0 0 0 9
The above results suggest that only a very significant change in price (25 percent) will induce a consumer to substitute other metal cooking ware for cast-iron cooking ware.
Recession.--The recession in 1974 and 1975 and the resulting cutback in consumer spending were alleged to have adversely affected the market for cast-iron cooking ware and to have been an important cause of injury.
A number of witnesses at the public hearing testified that the market for cast-iron cooking ware is a stable one which grows at a rate of 4 to 7 percent a year (transcript of the hearing, pp. 53 and 172). Presumably, this stability has been related to the steady growth in the number of U.S. households in that 70 percent of those households own at least one piece of cast-iron cooking ware and there is virtually no replacement market (transcript of the hearing, p. 163). According to the U.S. Department of Commerce, the number of net annual household formations in the United States was 1,608,000 in 1974 and 1,261,000 in 1975. Despite these large increases in household formations, apparent consumption of nonelectric metal cooking ware declined nearly 20 percent from 1973 to 1975. Apparent consumption of cast-iron cooking ware declined 28 percent during the same period. The divergent trends between household formations and cooking-ware consumption suggests that the U.S. recession had a sizable adverse effect on the market for all cooking ware during the years 1974 and 1975.
Inability of the domestic producers to supply the U.S. market.--The two witnesses who appeared in opposition to the petition alleged that the domestic producers were unable to supply the U.S. market (transcript of the hearing, PP• 234 and 286). Certain evidence collected by
A-32
the Commission suggests that during 1974 and 1975 the domestic producers did, indeed, experience difficulty in this regard.
Leslie Kellermann, of Lodge Manufacturing Co., stated at the hearing that his firm had turned away business as recently as 2 years ago. He attributed his production difficulties to EPA emission-control standards (transcript of the hearing, p. 120). Saunders Jones, of The Atlanta Stove Works, stated that technical difficulties resulting from the installation of new foundry equipment severely disrupted production in 1974. Mr. Jones also stated that booming stove production in 1975 had limited his company's ability to produce more cooking ware. The 1975 10-K statement of the General Housewares Corp. stated,
The Company is seeking relief from strict enforcement of certain Ohio air pollution laws and regulations on the grounds of reasonableness. An adverse final decision may cause the Company to shut down its iron cupolas at its Sidney, Ohio facility with the result of its discontinuing the manufacture of cast-iron cookware there.
To investigate this issue more fully, the Commission requested the domestic producers to report, in weeks, their. average delivery lead times for the period 1974-76. The following table shows the results of this inquiry. Mr. Ryan, of General Housewares Corp., stated at the hearing that 2-week delivery service on orders was "good" service (transcript of the hearing, p. 204). ·rt is evident from the table that a manufacturer could not provide "good" service in 1974 and two manufacturers could·not provide "good" service in portions of 1975. Clearly, no domestic producer had difficulty providing timely service in 1976.
,-

A-33
Cast-iron cooking ware: Average delivery lead times for 3 domestic producers, by quarters, 1974-76
(In weeks)
Period Atlanta Lodge General
Stove Works :Manufacturing: Housewares Average
1974: Jan.-Mar--------: Apr.-June-------: July-Sept-------: Oct.-Dec--------:
1975: Jan.-Mar--------: Apr.-June-------: July-Sept-------: Oct.-Dec--------:
1976: Jan.-Mar--------: Apr.-June-------: July-Sept-------~
Oct.-Dec--------:
*** *** *** ***
*** *** *** ***
*** *** *** ***
*** *** *** ***
*** *** *** ***
*** *** *** ***
Source: Compiled from data submitted in response naires of the U.S. International Trade Commission.
to
*** *** *** ***
*** *** *** ***
*** *** *** ***
question-
6 6 6 3
3 2 2 4
2 2 2 2
Marketing failures of the domestic producers.--The two witnesses who testifi~d at the hearing in opposition to the petition alleged that the domestic producers had injured themselves through a number of marketing errors. The following sections will explore those allegat~ons made regarding quality, wooden handles, promotion, and merchandising.
Quality.--Mr. Schwartz, of G & S Metal Products Co., Inc., alleged that the imported article here at issue compares with its domestic counterpart in the same way a Ford compares with a Cadillac (transcript of the hearing, p. 287). Information collected by the Commission shows that the average weight of the domestic article is generally 20 to 30 percent heavier than that of the imported article (tables 11 through 14). Domestic producers have replied that technological restraints and consumer safety considerations prevent them from making and marketing such light utensils (transcript of the hearing, pp. 108, 119, and 141).
The general quality of the foreign-made product appears to have improved considerably during the past 5 years; however, the imported article still lacks the uniform quality of the domestic produ~t (transcript of the hearing, pp. 139, 293, and 321). Throughout the

A..:...34
hearing the petitioners seriously questioned the ability of the average consumer to discern these quality differences. To explore how well consumers can, in fact, tell quality differences between products, the Commission asked a number of major retailers to agree or disagree with the following statement:
Our customers cannot tell quality differences between brands of cast-iron cooking ware.
The replies to this question were as follows:
Agree strongly
2
Agree but not strongly
2
Not sure; it depends
3
Disagree but not strongly
2
Disagree strongly
0
Although the above results are not clear cut, they suggest that consumers find it difficult to distinguish small quality differences between different brands of cast-iron cooking ware.
Wooden handles.--Taiwan began exporting cast-iron utensils with wooden handles to the United States in 1975. Despite some production many years ago, no domestic firm had recently_ marketed such articles until 1977. In 1976 about 30 percent of all U.S. imports had wooden handles. Presumably, the wooden handle appeals to certain retail outlets which are searching for a fashion look. To evaluate the retail impact of the wooden handle the 'Commission asked some large retailers to agree or disagree with the following statement:
Specialty items and special features, such as wooden handles, have really boosted our sales of cast-iron cooking ware.
The results of this inquiry are as follows:
Agree strongly
1
Agree but not strongly
4
Not sure; it depends
1
Disagree but not strongly
3
Disagree strongly
0
While the above results are not clear cut, they show that at least some retailers feel that specialty items and special features, such as wooden handles, do tend to increase final sales.
Promotion.--Many witnesses, both domestic producers and importers, attributed the 1976 surge in apparent consumption to the unusually large promotion of the imported articles (transcript of the hearing, pp. 122, 127, 170, 174, and 274). Further testimony
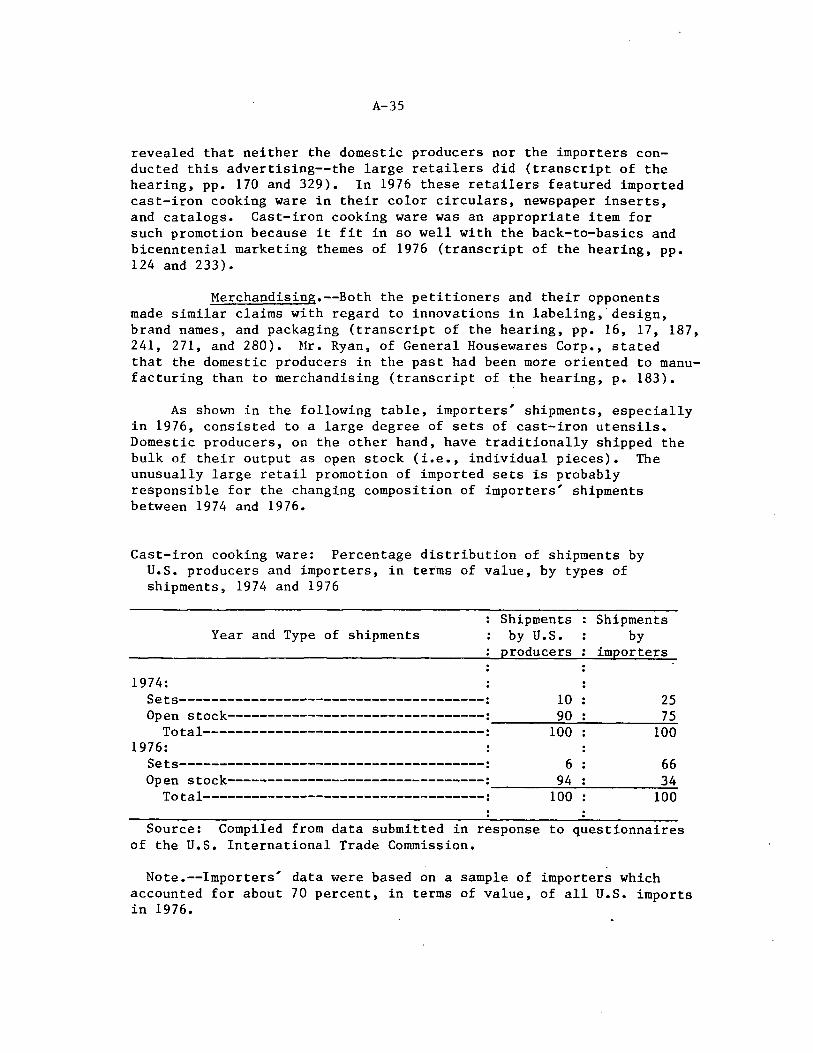
A-35
revealed that neither the domestic producers nor the importers conducted this advertising--the large retailers did (transcript of the hearing, pp. 170 and 329). In 1976 these retailers featured imported cast-iron cooking ware in their color circulars, newspaper inserts, and catalogs. Cast-iron cooking ware was an appropriate item for such promotion because it fit in so well with the back-to-basics and bicenntenial marketing themes of 1976 (transcript of the hearing, pp. 124 and 233).
Merchandising.--Both the petitioners and their opponents made similar claims with regard to innovations in labeling, design, brand names, and packaging (transcript of the hearing, pp. 16, 17, 187, 241, 271, and 280). Mr. Ryan, of General Housewares Corp., stated that the domestic producers in the past had been more oriented to manufacturing than to merchandising (transcript of the hearing, p. 183).
As shown in the following table, importers' shipments, especially in 1976, consisted to a large degree of sets of cast-iron utensils. Domestic producers, on the other hand, have traditionally shipped the bulk of their output as open stock (i.e., individual pieces). The unusually large retail promotion of imported sets is probably responsible for the changing composition of importers' shipments between 1974 and 1976.
Cast-iron cooking ware: Percentage distribution of shipments by U.S. producers and importers, in terms of value, by types of shipments, 1974 and 1976
Year and Type of shipments
1974: Sets--------------------------------------:
Shipments by U.S.
producers
10
Shipments by
importers
25 Open stock--------------------------------:
--~~~~~~~~~~~
90 75 Total-----------------------------------: 100 100
1976: Sets--------------------------------------: 6 66 Open stock--------------------------------:
--~~~_;:;_.;...._;;.__~~~~..::.....;.. 94 34
Total-----------------------------------:
Source: Compiled from data submitted in response of the U.S. International Trade Commission.
100
to
100
questionnaires
Note.--Importers' data were based on a sample of importers which accounted for about 70 percent, in terms of value, of all U.S. imports in 1976.

A-36
Mr. Schwartz testified that certain domestic producers were unable or unwilling to provide cooking ware to major retailers at the offered price point. He stated that price points were an important merchandising device in the promotion of cast-iron cooking ware (transcript of the hearing, pp. 274 and 278).
Imports.--The domestic producers allege that increased imports are the most important cause of the serious injury they now suffer. Information gathered by the Commission clearly shows that imports took a much larger share of the U.S. market during the past 5 years (tables 1 and 2). The domestic producers claim that the wide price differences between imported and domestic articles have caused this market penetration. Information collected by the Commission shows that during the period 1972-75 significant price differences did exist between the Taiwanese- and U.S.-made utensils for three of four representative items (tables 11 through 14).
To investigate the relative importance of various factors to retailers' purchasing decisions concerning cast-iron cooking ware; the Commission asked a number of large retailers to rank the following factors in numerical order (1 being most important, 2 being next most important, and so forth).
___ price ___ quality ___ availability ___ historical source ___ alternate source ___ packaging
lead time
--- special features (such as wooden handles) special design (i.e., specialty items) "Buy American" policy.
Price was listed as the most important factor by five of the nine respondents. Two respondents considered price the second most important factor, and two others considered price the third most important factor. Three respondents listed quality as the most important factor, and one respondent listed special features as the most important factor.
To examine how sensitive consumers are to the price of cast-iron cooking ware, the Commission asked the above retailers to agree or disagree with the following statements:
(1) Cast-iron cooking ware is a highly price-sensitive item with our customers.
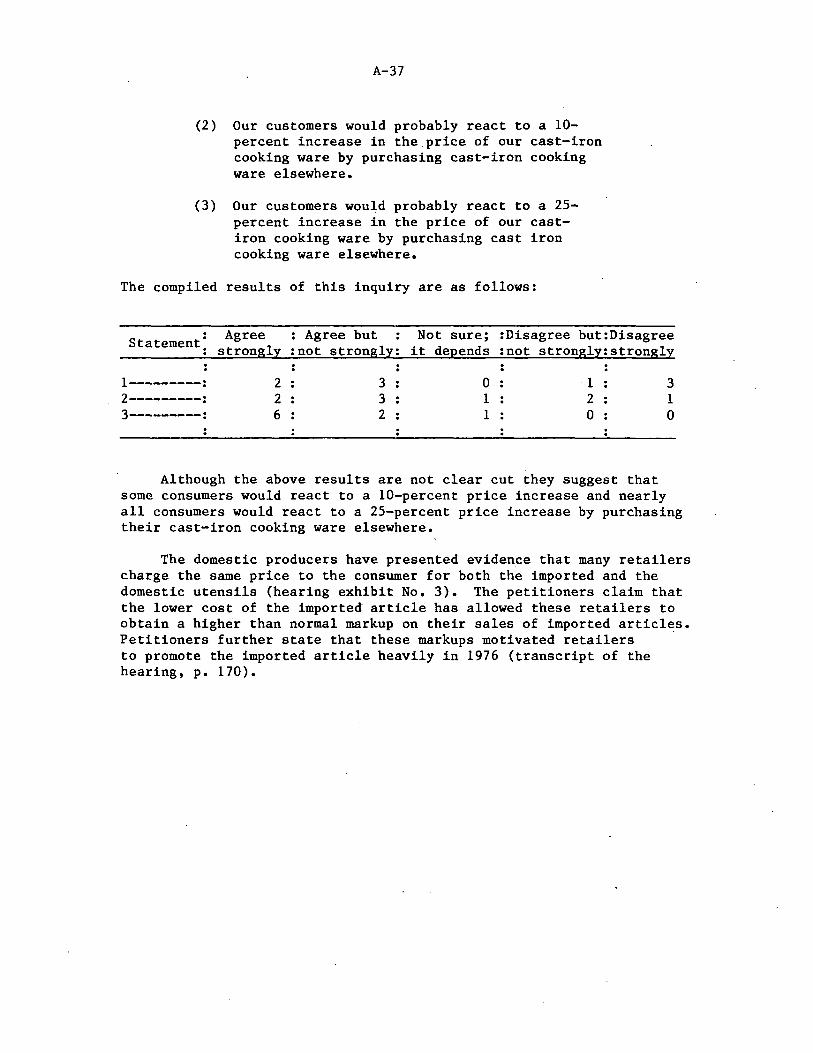
A-37
(2) Our customers would probably react to a 10-percent increase in the price of our cast-iron cooking ware by purchasing cast-iron cooking ware elsewhere.
(3) Our customers would probably react to a 25-percent increase in the price of our castiron cooking ware by purchasing cast iron cooking ware elsewhere.
The compiled results of this inquiry are as follows:
• Agree : Agree but Not sure; :Disagree but:Disagree Statement: strongly :not strongly: it depends :not strongly:strongly
1---------: 2 3 0 ·1 3 2---------: 2 3 1 2 1 3---------: 6 2 1 0 0
Although the above results are not clear cut they suggest that some consumers would react to a 10-percent price increase and nearly all consumers would react to a 25-percent price increase by purchasing their cast-iron cooking ware elsewhere.
The domestic producers have presented evidence that many retailers charge the same price to the consumer for both the imported and the domestic utensils (hearing exhibit No. 3). The petitioners claim that the lower cost of the imported article has allowed these retailers to obtain a higher than normal markup on their sales of imported articl~s. Petitioners further state that these markups motivated retailers to promote the imported article heavily in 1976 (transcript of the hearing, p. 170).
A-38
APPENDIX A
STATISTICAL TABLES

A-39
Table 1.--Cast-iron cooking ware: U.S. producers' shipments, imports for consumption, exports of domestic merchandise, and apparent consumption, 1972-76
(Quantity (1) in thousands of pieces; quantity (2) in thousands of pounds; value in thousands of dollars)
Ratio (percent) . . Apparent of imports to--
Year :Producers': Imports : shipments :
Exports consump- :Apparent tion :Shipments:consump
tion
Quantity (1)
1972------: 7,273 1/ 654 250 7,677 9 9 1973------: 6,511 =!/-1,496 372 7,635 23 20 1974------: 5,456 1,257 305 6,408 23 20 1975------: 3,719 2,059 311 5,467 55 38 1976------=~~3~·~7~3~4~~=8~,3~9~1'"-'-~~=2~76;:__,;c~~l~l~·~8~4=9-'-~~2_2_5_;_~~__:_=:.71
Quantity (2)
1972------: 33,336 1/ 590 1,187 32,739 2 2 1973------: 29,493 :1/-1,320 1,767 29,046 4 4 1974------: 24,677 :I_/ 1,293 1,448 24,522 5 5 1975------: 17,061 4,169 1,477 19,753 24 21 1976------:~_1_7~·~0_8_2~~2_0~·~5~31::_~_::;,lL,3~1~1:........;.~~3~6~,~3~0=2~~~~12~0;:._:~~--=5~7
1972------: 1973------: 1974------: 1975------: 1976------:
9,660 9,421
10,454 8,945 9,245
1/ 210 I/ 648
760 1,496 6,497
Value
366 623 685 743 704
9,504 9,446
10,531 9,700
15,037
2 7 7
17 70
2 7 7
15 43
1./ Compiled from data submitted in response to questionnaires of t.he U.S. Internatjonal Trade Connnission.
Jj Revised.
Source: U.S. producers' shipments and exports compiled from data submitted in response to questionnaires of the U.S. International Trade Commission; imports compiled from official stetistics of the U.S. Department of Commerce, except as noted.

A-40
Table 2.--Cast-iron cooking ware: U.S. producers' shipments, imports for consumption, exports of domestic merchandise, and apparent consumption, by quarters, 1974-76
in thousands of pieces; value in thousands of dollars) :Ratio percent of
Pro- : Apparent : imEorts to--Period : ducers' Imports Exports: consump-: Apparent
ship- ti on Ship- cons ump-men ts men ts tion
Quantity
1974: Jan.-Mar--------: 1,527 1/ 137 100 1,564 9 9 Apr.-June-------: 1,380 280 71 1,589 20 18 July-Sept-------: 1,326 413 74 1,665 31 25 Oct.-Dec--------: 1,223 427 60 1.590 35 27
1975: Jan.-Mar--------: 850 282 68 1,064 33 27 Apr.-June-------: 805 392 66 1,131 49 35 July-Sept-------: 1,020 634 80 1,574 62 40 Oct.-Dec--------: 1,044 751 98 1,697 72 44
1976: :
Jan.-Mar--------: 955 1,359 77 2,237 142 61 Apr.-June-------: 876 1, 773 64 2,585 202 69 July-Sept-------: 936 2,559 71 3,424 273 75 Oct.-Dec--------: 967 2,699 64 32602 279 _ _]2_
Value
1974: Jan.-Mar--------: 2,071 107 140 2,038 5 5 Apr.-June-------: 2,921 179 211 2,889 6 6 July-Sept-------: 2,761 282 180 2,863 10 10 Oct.-Dec--------: 2,701 192 152 : 2,741 7 7
·---· 1975:
Jan.-Mar--------: 2,159 151 173 2,137 7 7 Apr.-June-------: 2,014 317 160 2,171 16 15 July-Sept-------: 2,358 485 170 2,673 21 18 Oct.-Dec--------: 2,414 543 238 2, 719 22 20
1976: Jan.-Mar--------: 2,597 1,086 199 3,484 42 31 Apr.-June-------: 2,227 1,350 165 3,412 61 40
July-Sept-------: 2,326 1,959 182 4,103 84 48
Oct.-Dec--------: 2,095. 2,101 158 4,038 100 52 ..
1/ Revised.
Source: U.S. producers' shipments and exports compiled from data submitted in response to questionnaires of the U.S. International Trade Commission; imports compiled from official statistics of the U.S. Department of Commerce, except as noted.

Table 3.--Cast-iron coo~ing ware: U.S. imports for consumption under TSUSA item 653.9560, by sources and by quarters, 1974-76
GSP designated beneficiary countries: Other countries Total
Period Quantity Quantity Quantity Value Value
Units Pounds Units Pounds Units Pounds
1974: January-March-------: '80,603 : 1/ 162,441 : S55,390 : 56,069 : 51,455 $51,692 : 136,672 : y 213,896 : April-June----------: 126,145 : 140,582 : 61,143 : 153,870 : 119,626 118,164 : 280,015 : 260,208 : July-September-------: 276, 745 : 278,118 : 143,440 : 136,358 : 129,862 138,156 : 413,103 : 407,980 : October-December-----: 382,826 : 342,012 : 140,369 : 43,941 : 68,684 --, _ . . _ . -· i;? 111 . li?F. 7F.7 ' 410,696 :
Total-------------: 866,319: 923,153: 400,342: 390,238: 369,627 -- --- - --- ---JbU,.Ll::> : .L,l::>b,))/ : 1,292,780: 1975: : : :
January-March-------: 206,570 : 260,858 : 81,598 : 75,460 : 69,893 69,160 : 282,030 : 330,751 : April-June----------: 242,456 : 511,217 : 142,144 : 149,910 : 237,141 174,918 : 392,366 : 748,358 : July-September-------: 408,921 : 1,110,201 : 309,772 : 224,583 : 171,090 174,965 : 633,504 : 1,281,291 : October-December-----: 583,654 : 1,466,296 : 417,848 : 167,520 : 171,323 ___ , __ . ·--,-·. 1 ?'> ">Rli. , 7'>1 -176. ' 1 2637,619 :
Value
$107 ,082 179,307 281,596 192 2482 760,467
150,758 317 ,062 484,737 5432432
Total=-=.-:---:-------: 1,441,601 :_ .3,348,572 : 951,362 : 617,473 : 649,447 · · -- --- --· ~44,bl/ : Z,U::>~,U/4 : 4,169,089 : __ 1,4.91,.~8~ 1976: : : : : :
January-March-------: 820,172 : 2,348,512 : 650,776 : 538,967 : 976,642 April-June----------: 1,614,513 : 4,219,035 : 1,202,167 : 158,247 : 228,298 July-September-------: 2,245,020 : 5,641,308 : 1,620,288 : 314,382 : 357,474
435,676 : 147,839 : 339,069 : 16.6.016 : October-December----~: 2,439,844 : 6,309,513 : 1,754,902 : 259,045 : 444,973 _ .-,---
1,359,139 : 3,326,069 : 1,773,134 : 4,447,333: 2,559,402 : 6,003,384 : 'L698.889 ' 6,754,486 :
Total-------------: 7,119,549 : 18,518,368 : 5,228,133 : 1,270,641 : 2,007,387 -- --1,268,bUU : 8,J~U,'.>b4 : 20,531,272 :
-" l! Revised.
Source: Compiled from official statistics of the U.S. Department of Commerce, except as noted.
1,086,452 1,350,006 1,959,357 2,100,918 6,496,733
> I
.I>-......
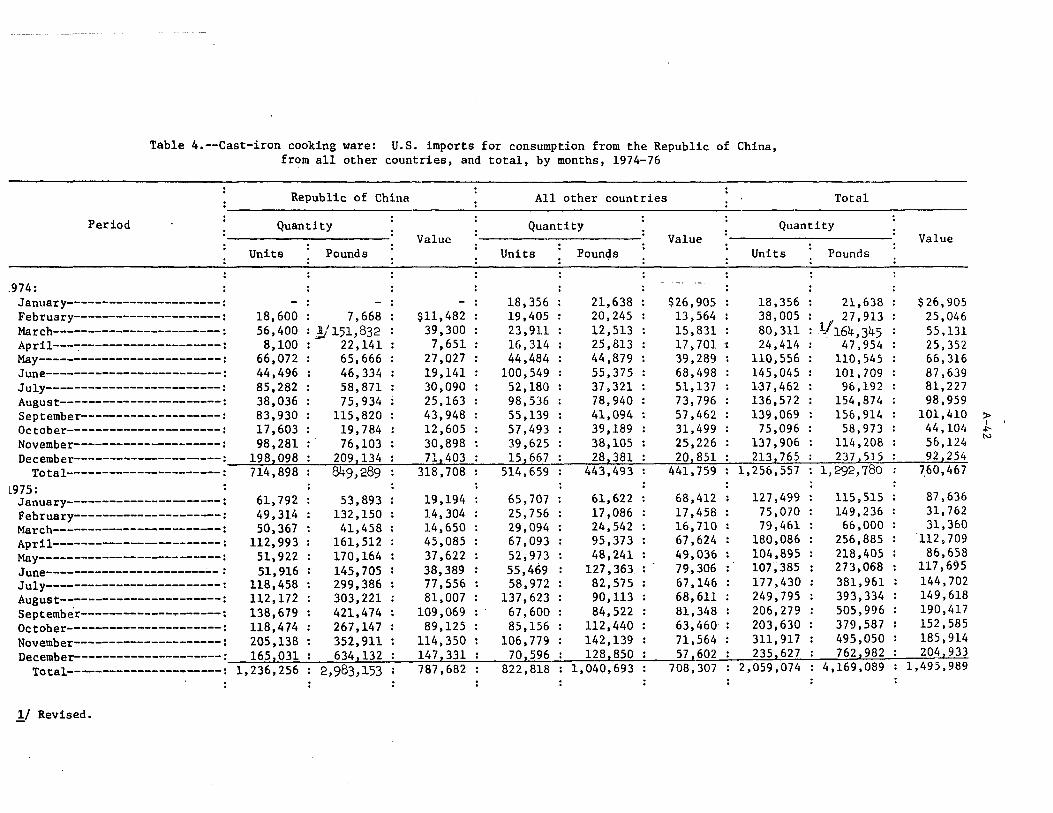
Table 4.--Cast-iron cooking ware: U.S. imports for consumption from the Republic of China, from all other countries, and total, by months, 1974-76
Republic of China All other countries Total --
Period Quantity : : Quantity : :
Quantity Value Value
Units :
Pounds : : : : : :
Units Pounds Units Pounds : :
- -· ·-: .974: January----------------------: 18,3S6 : 21,638 : $26,90S : 18,356 : 21,638 :
18,600 : 7,668 : $11,482 : 19,40S : 20,245 : 13,564 : 38,00S : 27,913 : 56,400 :,!J151,832 : 39,300 : 23,911 : 12,S13 : lS,831 : 80,311 : l./164,345 :
8,100 : 22,141 : 7,651 : 16,314 : 2S,813 : 17,701 l 24,414 : 47,954 :
February---------------------: March------------------------: April------------------------: May--------------------------: 66,072 : 6S,666 : 27,027 : 44,484 : 44,879 : 39,289 : 110,556 : 110,545 : June-------------------------: 44,496 : 46,334 : 19,141 : 100,549 : 55,375 : 68,498 : 145,045 : 101,709 : July-------------------------: 85,282 : 58,871 : 30,090 : 52,180 : 37 ,321 : 51,137 : 1-37. 462 : 96,192 : August-----------------------: 38,036 : 75,934 : 25,163 : 98,536 : 78,940 : 73, 796 : 136,572 : 154,874 : September--------------------: 83,930 : 115,820 : 43,948 : 55,139 : 41,094 : 57,462 : 139,069 : 156,914 : October----------------------: 17,603 : 19,784 : 12,605 : 57,493 : 39,189 : 31,499 : 75,096 : 58,973 : November---------------------: 98,281 : 76,103 : 30,898 : 39,625 : 38,105 : 25,226 : 137,906 : 114,208 :
1981098 : 2091134 : 711403 : lS,667 : 28,381 : 2018Sl : 213,765 : 237 2 515 : 714,898 : 849, 289 : 318,708 : 514,659 : 443,493 : 441,759 : 1,256,557 : 1,292,780 ;
December---------------------: Total----------------------:
: : : : : : :
61,792 : 53,893 : 19,194 : 65,707 : 61,622 : 68,412 : 127,499 : 115,515 : 49,314 : 132,150 : 14,304 : 2S,7S6 : 17,086 : 17,4S8 : 75,070 : 149,236 : 50,367 : 41,458 : 14,650 : 29,094 : 24,S42 : 16,710 : 79,461 : 66,000 :
112, 993 : 161,512 : 45,08S : 67,093 : 95,373 : 67,624 : 180,086 : 256,885 : 51,922 : 170,164 : 37,622 : 52,973 : 48,241 : 49,036 : 104,895 : 218,405 : 51,916 : 145,705 : 38,389 : 55,469 : 127,363 : 79,306 : 10?;385 : 273,068 :
118,458 : 299,386 : 77. 5S6 : 58,972 : 82,575 : 67,146 : 177,430 : 381,961 : 112, 172 : 303,221 : 81,007 : 137,623 : 90,113 : 68,611 : 249,795 : 393,334 : 138,679 : 421,474 : 109,069 : 67,600 : 84,S22 : 81,348 : 206,279 : 505,996 : 118,474 : 267,147 : 89,125 : 85,156 : 112,440 : 63,460· : 203,630 : 379,587 :
L975: January----------------------: February---------------------: March------------------------: April------------------------: May--------------------------: June-------------------------: July-------------------------: August-----------------------: September--------------------: October----------------------: November---------------------: 205,138 : 352,911 : 114,3SO : 106,779 : 142,139 : 71,564 : 311, 917 : 495,050 : December---------------------: 1281850 : 571602 : 2351627 : 762,982 :
Value
$ 26, 905 2S,046 SS, 131 2S,352 66,316 87,639 81,227 98,959
101,410 44, 104 56,124 921254
7,60,467
87,636 31,762 31,360
112,709 86,658
117,695 144,702 149,618 190,417 1S2,585 185,914 204,933 1651031 : 6341132 : 147 1 331 : 701596 :
1,236,256 : 2,983,153 : 787,682 : 822,818 : 1,040,693 : 708,307 : 2,059,074 : 4,169,089 : 1,495,989 Total----------------------:
1/ Revised.
~ I
-I'-N

Table 4.--Cast-iron cooking ware: U.S. imports for consumption from the Republic of China, from all other countries, and total, by months, 1974-76--Continued
Republic of China All other countries Total
Period Quantity Quantity Quantity Value Value
Units Pounds Units Pounds Units Pounds
1976: January----------------------: 202,493 : 580,867 : $159,144 : 118,600 : 260,289 : $118,079 : 321,093 : 841,156 : February---------------------: 367,177 : 1,086,785 : 288, 721 : 71,188 : 43,658 : 53,227 : 438,365 : 1,130,443 : March------------------------: 384,360 : 1,038,882 : 283,692 : 215,321 : 315,588 : 183,589 : 599,681 : 1,354,470 : April------------------------: 485,001 : 1,360,571 : 297,582 : 200,161 : 218, 411 : 133,973 : 685,162 : 1,578,982 : May--------------------------: 497,837 : 1,197,806 : 375,759 : 107,494 : 230,969 : 93,640 : 605,331 : 1,428,775 : June-------------------------: 386,525 : 1,182,018 : 342,998 : 96,116 : 257,558 : 106,054 : 482,641 : 1,439,576 : July------~------------------: 524,926 : 1,771,999 : 488,203 : 136,086 : 398,627 : 197,251 : 661,012 : 2,170,626 :
. August-----------------------: 702,269 : 1,550,420 : 416,256 : 240,167 : 286,872 : 200, 711 : 942,436 : 1,837,292 : September--------------------: 719,394 : 1,656,102 : 469,081 : 236,560 : 339,364 : 187,855 : 955,954 : 1,995,466 : October----------------------: 721,044 : 1,928,450 : 486,868 : 254,059 : 520,633 : 217' 964 : 975,103 : 2,449,083 : November---------------------: 622,130 : 1,594,174 : 464,854 : 278,832 : 156,766 : 160,663 : 900,962 : 1,750,940 : December--------------------~: 598,520 : 1,914,062 : 224,304 : 640,401 : 640,401 : 265!487 : 822 1 824 : 2 1 554 1 463 :
Value
$277 '223 341,948 467,281 431,555 469,399 449,052 685,4~4
616,967 656,936 704,832 625,517 770,569
Total----------------------: 6,211,676 :16,862,136 : 4,578,240 : 2,178,888 : 3,669,136 : 1,918,493 : 8,390,564 :20,531,272 : 6,496,733
Source: Compiled from official statistics of the U.S. Department of Conunerce, except as noted.
> l-.....,
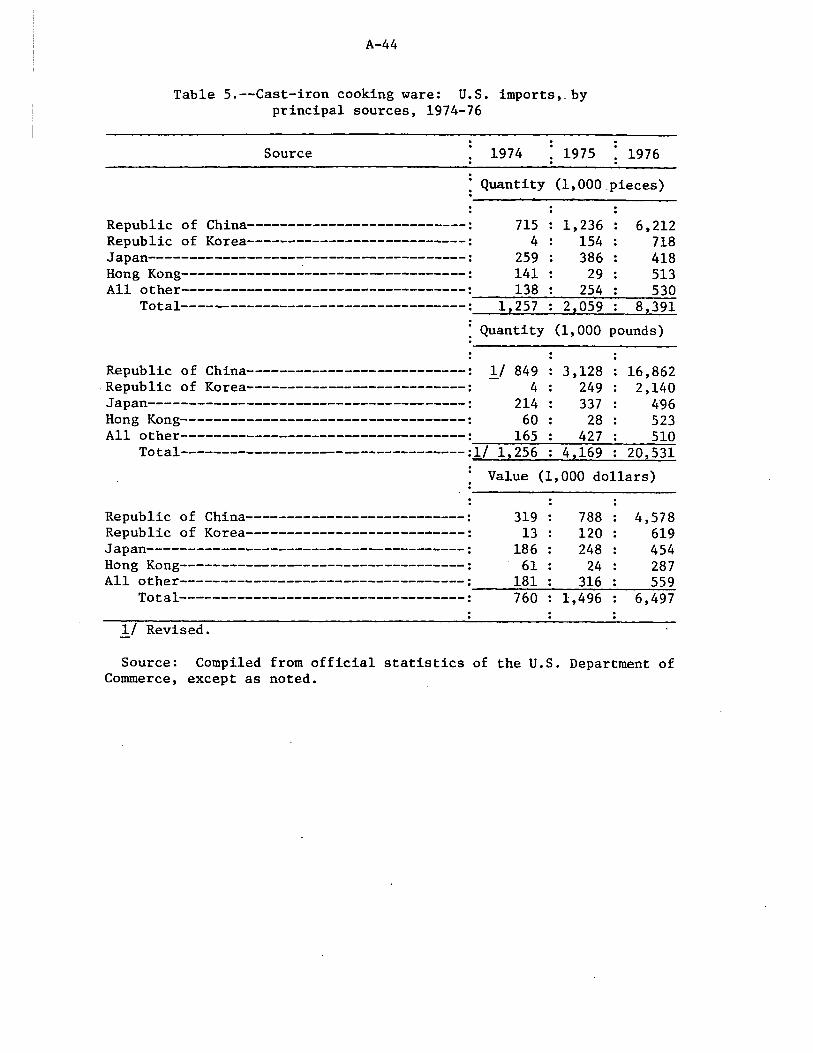
A-44
Table 5.--Cast-iron cooking ware: U.S. imports,. by principal sources, 1974-76
Source 1974 1975 1976
Quantity (1,000.pieces)
Republic of China---------------------------: 715 1,236 6,212 Republic of Korea---------------------------: 4 154 718 Japan------------------~--------------------: 259 386 418 Hong Kong-----------------------------------: 141 29 513 All other-----------------------------------: 138 254 530
~--.,...-,-~~~--~~~-c..-
T o ta l - - - - - - - - - - - - - - - - - - - - - - - - - - - - - - - - - - - :~~l~,_25_7~~2~,~o_5~9~~-8~,3_9~1
Quantity (1,000 pounds)
Republic of China---------------------------: !/ 849 3,128 16,862 .Republic of Korea---------------------------: 4 249 2,140 Japan---------------------------------------: 214 337 ~6 Hong Kong-----------------------------------: 60 28 523 All other-----------------------------------:
--:~~~~~~~~~~-
Tot al - - - - - - - - - - - - - - - - - --- - - - - - - - - - - - - - - - : 1 / 165 427 510
1,256 42169 202531
Value (1,000 dollars)
Republic of China------------------~--------: 319 788 4,578 Republic of Korea---------------------------: 13 120 619 Japan---------------------------------------: 186 248 454 Hong Kong-----------------------------------: 61 24 287 All other-----------------------------------: 181 316 559
~~~.....;;....~~.::;....;;.~~~..;.:..:;..~
Total-----------------------------------: 760 1,496 6,497
1./ Revised.
Source: Compiled from official statistics of the U.S. Department of Commerce, except as noted.

A-45
Table 6.--Profit-and-loss experience of 3 domestic producers on their cast-iron cooking ware operations, 1972-76
Item
Net sales-------------1,000 dollars--: Cost of goods sold-------------do----: Gross profit-------------------do----: Selling and administrative expenses
1,000 dollars--: Net operating profit or (loss)-do----: Other income or (expense)------do----: Net profit or (loss) before income
taxes---------------1,000 dollars--: Ratio of net operating profit or
1972
9,267 7,662 1,605
1, 712 (107):
65 :
(42):
(loss) to net sales-------percent--: (1.2):
1973 1974
9,140 :10,086 7,442 7,792 1,698 2,294
1,665 33
(83):
(SO):
0.3 :
1,932 342
(101):
241
3.4
1975
8,589 6,797 1,792
1, 726 . 66
(103):
(36):
0.8 :
1976
8,929 7,043 1,886
1,815 71 40
111
0.8
Source: Compiled from data submitted in response to questionnaires of the U.S. International Trade Commission.

A-46
Table 7 .--Profit-and-loss experience of 3 domestic producers on their overall establishment operations in which cast-iron cooking ware is produced, 1972-76
Item 1972 1973 1974 1975 1976
Net sales---1,000 dollars--: 23,987 26,130 31,824 35,917 32,567 Cost of goods sold---do----: 17,953 : . 20, 165 24,421 25,704 25,548 Gross profit---------do----: 6,032 5,964 7,402 10,214 7,020 Selling and administrative :
expenses--1,000 dollars--: 4,718 5,038 5,486 5,991 6,300 Net operating profit--do----: 1,314 926 1,917 4,222 720 Other income or (expense) .. .
1,000 dollars--: 48 (70): (25): (260): (376) Net profit before taxes
1,000 dollars--: 1,363 856 1,891 3,963 343 Ratio of net operating
profit to net sales percent--: 5.6 3.5 6.0 11. 7 2.2
Source: Compiled from data submitted in response to questionnaires of the U.S. International Trade Connnission.
Note.--Tables 8, 9, and 10 have been deleted because they
contain information received by the U.S. International Trade Commis-
sion in confidence, the disclosure of which would reveal certain
operations of the individual firms.

Table 11.--Cast-iron cooking ware: Ranges and averages of the lowest net selling prices rer.eived by U.S. producers and importers from s·ales of 6-1/2-inch polished cast-iron skillets, and average wei.ghu of the domestic and imported articles, by quarters, 1972-76
Domestic cooking war.e Imported cooking ware l/ • Ratio of ----------: a.verage import
Period
1972:
Price rang~
January-March----------: $0. 62-$0 •. 6 7 April-June-------------: .62- .67 July-September---------: .62- .67 October-December-------: .62- .67
1973: January-March----------: April-June-------------: July-September---------: October-December-------:
1974: January-March----------: April-June-------------: July-September---------: October-December-------:
1975:
.68- .73
.71- .73
.71- .73
.72- .79
.74- .79
.87- 1.17 1.04- 1. 23 ] .18- 1. 35
January-March----------: 1.18- 1.32 April-June-------------: 1.18- 1.19 July-September---------: 1.18- 1.27 October-December-------: 1.19- 1.27
1976: January-March----------: 1.26- 1.27 April-June-------------: 1.27- 1.34 July-September---------: 1.27- 1.34 October-December-------: 1.26- 1.27
Average price
$0.65 .64 .65 .65
• 71 • 72 • 72 .74
• 77 1.03 1.15 1.25
1.26 1.23 1.17 1.24
1.27 1.29 1.29 1.27
:Average: : weight:
Pr:i.ce range
:Pounds
2.04 2.04 2.04 2.04
2.04 2.04 2.04 2.04
2.04 2.04 2.04 2.04
2.04 2.04 2.04 2.04
2.04 2.04 2.04 2.04
:$0.37-$0.50 .37- .50 .37- .55 .37- .55
• 40- .60 ·.45- .60 .50- .60 . 50- . 60
.so
.so
.58-
.52-
.60
.60
.60
.67
.52- .90
.49- .90
.44- .90
.59- .90
.59- 1.50
.59- 1. 50
.59- 1.50
.59-· 1. 50
. .
Average price
$0.44 .44 .46 .46
.48
.52
.53
.53
.55
.55
.59
.59
.79
.79 • 77 • 72
.74 • 77 .88 .98
price to :Average: average : weight: domesti.c prfce
: Pounds :
1.0 l.O 1.0 1.0
1.05 1.05 1.05 1.05
1.05 1.05 1.05 1.18
1.55 1.62 1.62 1.41
1.41 .1.41 1.52 1.63
Percent
68 69 71 71
68 72 74 72
71 53 51 47
63 64 66 58
58 60 68 77
!/ 1 importer reported the lowest net selling price of a 6-inch skillet, 1 importer reported the lowest net selling price of a plain 6-1/2-inch skillet, and 2 importers reported their lowest net selling prices of skillets with wooden handles.
SouJce: Compiled from data submitted by 3 producers and 14 importers in response to questionnaires of the U.S. International Trade Commission.
> ,... ~ .......
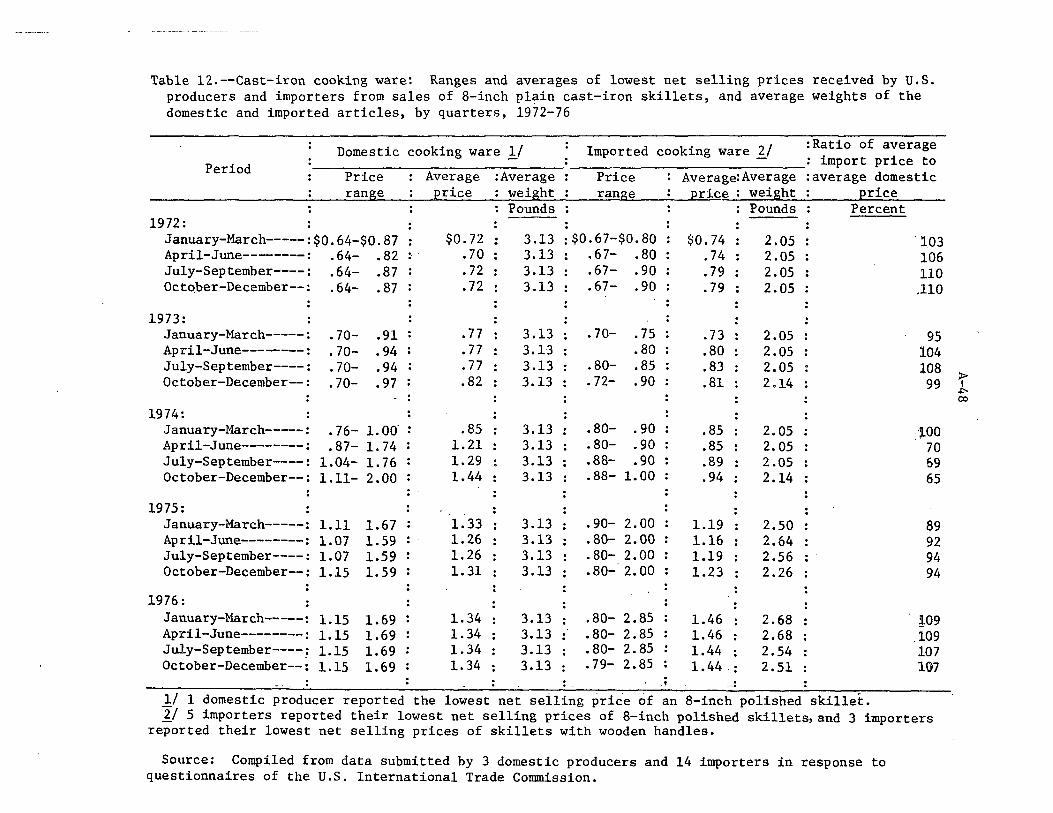
Table 12.--Cast-iron cooking ware: Ranges and averages of lowest net selling prices received by U.S. producers and importers from sales of 8-inch plain cast-iron skillets, and average weights of the domestic and imported articles, by quarters, 1972-76
Period Domestic cooking ware 1/ · Imported cooking ware 2/ :Raitio of average
_____________ -____ : - : mport price to Price : Average :Average : Price : Average: Aver age : average domestic range : price : weight : range : price : weight : price
1972: January-March-----:$0.64-$0.87 April-June--------: .64- .82 : · July-September----: .64~ .87 Octo.ber-December--: . 64- . 87
1973: January-March-----: April-June--------: July-September----: October-December--:
1974:
.70-
. 70-
.70-
.70-
.91 • 94 .94 .97
January-March-----: April-June--------: July-September----: October-December--:
• 76- 1. Off .87- 1. 74
1.04- 1.76 1.11- 2 .00
1975: January-March-----: 1.11 April-June--------: 1.07 July-September----: 1.07 October-December--: 1.15
1976: January-March-----: 1.15 April-June--------: 1.15 July-September----~ 1.15 October-December--: 1.15
1.67 1.59 : . 1.59 1.59
1.69 1.69 1.69 1.69
$0. 72 .70 • 72 • 72
.77 • 77 • 77 .82
.85 1.21 1.29 1.44
1.33 1.26 1.26 1.31
1.34 1.34 1.34 1.34
Pounds : : : Pounds : Percent
3.13 3.13 3.13 3.13
:$0.67-$0.80 • 6 7- • 80 .67- .90 .67- .90
3.13 3.13 3.13 3.13
3.13 3.13 3.13 3.13 :
3.13 3.13 3.13 3.13
3.13 3.13 3.13 3.13
.70-
.80-. 72-
.80-
.80-
.88-
. 88-
.75
.80
.85
.90
.90
.90
.90 1.00
.90- 2.00
.80- 2.00
.80- 2.00
.so-· 2.00
.80- 2.85
.80- 2.85
.80- 2.85
.79- 2.85
·'
$0.74 .74 .79 .79
. 73
.80
.83
.81
.85
.85
.89
.94
1.19 1.16 1.19 1.23
1.46 1.46 1.44 1.44 . :
2.05 2.05 2.05 2.05
2.05 2.05 2.05 2.14
2.05 2.05 2.05 2.14
2.50 2.64 2.56 2.26
2.68 2.68 2.54 2.51
'103 106 110 .110
95 104 108 99
.·:i.oo 70 69 65
89 92 94 94
!09 .109 107 107
1/ 1 domestic producer reported the lowest net selling price '6f an 8-inch polished skillet. I./ 5 importers reported their lowest net selling prices of 8-inch polished skillets, and 3 importers
reported their lowest net selling prices of skillets with wooden handles.
Source: Compiled from data submitted by 3 domestic producers and 14 importers in response to questionnaires of the U.S. International Trade Commission.
~ .Ceo
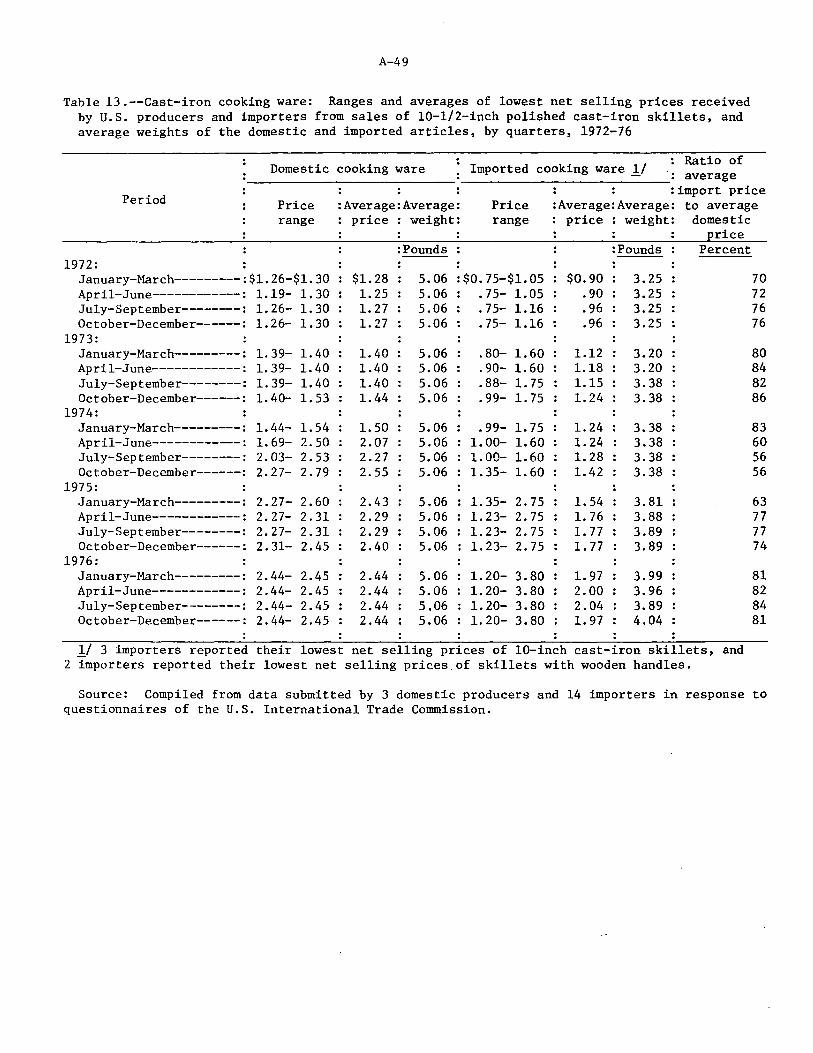
A-49
Table 13.--Cast-iron cooking ware: Ranges and averages of lowest net selling prices received by U.S. producers and importers from sales of 10-1/2-inch polished cast-iron skillets, and average weights of the domestic and imported articles, by quarters, 1972-76
Domestic cooking ware Imported cooking ware !/ : Ratio of : average
Period :import price
Price :Average:Average: Price :Average: Average: to average range price : weight: range price : weight: domestic
rice :Pounds :Pounds Percent
1972: January-March---------:$1.26-$1.30 $1.28 5.06 :$0. 75-$1.05 $0.90 3.25 April-June------------: 1.19- 1.30 1. 25 5.06 • 75- 1.05 .90 3.25 July-September--------: 1.26- 1. 30 1. 27 5.06 .75- 1.16 .96 3.25 October-December------: 1.26- 1.30 1. 27 5.06 .75- 1.16 .96 3.25
1973: January-March---------: 1. 39- 1.40 1. 40 5.06 .80- 1.60 1.12 3.20 April-June------------: 1. 39- 1.40 1.40 5.06 .90- 1.60 1.18 3.20 July-September--------: 1.39- 1.40 1.40 5.06 .88- 1. 75 1.15 3.38 October-December------: 1. 40- 1. 53 1.44 5.06 .99- 1. 75 1. 24 3.38
1974: January-March---------: 1.44- 1.54 1.50 5.06 .99- 1. 75 1.24 3.38 April-June------------: 1. 69- 2.50 2.07 5.06 1.00- 1.60 1. 24 3.38 July-September--------: 2.03- 2.53 2.27 5.06 1.00- 1.60 1. 28 3.38 October-December------: 2.27- 2.79 2.55 5.06 1.35- 1.60 1.42 3.38
1975: January-March---------: 2.27- 2.60 2.43 5.06 1.35- 2.75 1.54 3.81 April-June------------: 2.27- 2.31 2.29 5.06 1.23- 2.75 1. 76 3.88 July-September--------: 2. 27- 2.31 2.29 5.06 1.23- 2.75 1. 77 3.89 October-December------: 2.31- 2.45 2.40 5.06 1.23- 2.75 1. 77 3.89
1976: January-March---------: 2.44- 2.45 2.44 5.06 1. 20- 3.80 1. 97 3.99 April-June------------: 2.44- 2.45 2.44 5.06 1.20- 3.80 2.00 3.96 July-September--------: 2.44- 2.45 2.44 5,06 1.20- 3.80 2.04 3.89 October-December------: 2.44- 2.45 2.44 5.06 1.20- 3.80 1. 97 4.04
!/ 3 importers reported their lowest net selling prices of 10-inch cast-iron skillets, and 2 importers reported their lowest net selling prices of skillets with wooden handles.
70 72 76 76
80 84 82 86
83 60 56 56
63 77 77 74
81 82 84 81
Source: Compiled from data submitted by 3 domestic producers and 14 importers in response to questionnaires of the U.S. International Trade Commission.

A-50
Table 14.--Cast-iron cooking ware: Ranges and averages of lowest net selling prices received by U.S. producers and importers from sales of 3-piece skillet sets (which include 6-1/2-inch, 8-inch, and 10-1/2-inch polished skillets), and average weights of the.domestic and imported sets, by quarters, 1972-76
Domestic cooking ware l/ Imported cooking ware ]:_/ Ratio of
: average
Period :import price
Price :Average:Average: Price :Average:Average: to average range price : weight: range price :weight domestic
rice :Pounds :Pounds Percent
1972: January-March--------:$2.28-$2.89 $2.50 11.1 :$1. 72-$2.00 $1.86 7.10 74 April-June---~--~---: 2.28- 2.89 2.50 11.1 1. 72- 2.00 1.86 7.10 74 July-September--------: 2.28- 2.89 2.50 11.1 1.87- 2.40 2.09 1.01 84 October-December-...--: 2.34- 2.89 2.64 11.1 1.87- 2.40 2.09 1.01 79
1973: January-March-------~: 2.56- 3.14 2.86 11.1 1. 87- 3. 60 2.44 6.70 85 April-June-----------: 2.56- 3.14 2.17 11.1 2.10- 3.60 2.69 6.70 97 July-September-------: 2.56- 3.14 2.11 11.1 2.17- 3.60 2.88 6.66 104 October-December------: 2.81- 3.14 2.95 11.1 2.40- 3,60 3.06 6.53 104
1974: .. : .
January-March---------: 2. 81- 3.45 3.09 11.1 2.64- 3.90 3.13 6.20 101 April-June------------: 3.74- 4.23 3.92 11.1 2.85- 3.90 3.13 6.20 80 July-September--------: 4.01- 4.56 4.33 11.1 2.97- 3.90 3.29 6.93 76 October-December-----: 4.22- 5.30 4.68 11.1 2.97- 3.90 3.29 6.93 70
1975: January-March---------: 4.53- 5.30 4.83 11.1 2.97- 4.14 3.48 7.78 72 April-June------------: 3.79- 5,30 4.55 11.1 2.80- 4.14 3.00 7.63 66 July-September--------: 3.79- 5.30 4.65 11.1 2.70- 4.14 3.39 7.83 73 October-December------: 3.79- 5. 72 4.68 11.1 2.70- 4.14 3.02 7.41 65
1976: January-March---------: 3. 79- 5. 72 4.75 11.1 2.10- 5.25 3.60 7.90 76 April-June----~-----: 3. 72- 5. 72 4.94 11.1 2.70- 5.25 3.67 8.06 74 July-September--------: 4.26- 5. 72 5.04 11.1 2.80- 6.36 3.94 7.96 78 October-December------: 4.26- 5.72 5.20 11.1 2.80- 6.36 3.95 7.96 76
·J_/ 1 domestic producer reported the lowest net selling price of a 3-piece set which included plain skillets.
1:./ 2 importers reported their lowest net selling prices of 3-piece sets of plain skillets, and 3 importers reported their lowest net selling prices of 3-piece sets of skillets with wooden handles.
Source: Compiled from data submitted by 3 domestic producers and 14 importers .in response to questionnaires of the U.S. International Trade Commission.

A-51
Table 15.--Capital expenditures and research and development expenses incurred by 3 domestic producers in connection with their domestic operations on cast-iron cooking ware, 1972-76
(In thousands of dollars)
Item 1972 1973 1974 1975 1976
Capital expenditures: Land and land improve-
men ts-----·------------: 10 19 14 4 Buildings and leasehold
improvements-----------: 469 329 24 19 Machinery and equipment: :
6
20
New---·----------------: 1,025 1,021 579 746 719 Used---------------: 8 0 0 8 2
Other-----------------: 133 193 174 1, 773 327 Total------------------: 1,645 1,562 791 2,550 1,074
Research and development expenses-----------------: 20 45 87 14 77
Source: Compiled from data submitted in response to questionnaires of the U.S. International Trade Commission • •

Table 16.--Nonelectric metal cooking ware (excluding cast-iron cooking ware): U.S. producers' shipments, imports for consumption, exports of domestic merchandise, and apparent consumption, 1972-76
Ratio of imports p d ': : : Apparent : to--
Year ro ucers : Apparent : : hi t : Imports : Exports : consump-s pmen s . · • · tion : Shipments : consump-
ti on 1 2000 : 1 2000 . 1 2000 . 1 2 000 . .
dollars : dollars : dollars : dollars : Percent : Percent : :
1972---~----------------------: 338,700 : 35,900 : 14,400 : 360,200 : 11 : 10 1973--------------------------: 375,000 : 35,400 : 18,500 : 392,000 : 9 : 9 1974--------------------------: 395,000 : 30,100 : 30,700 : 394,400 : 8 : 8 1975--------------------------: 413,000 : 37,000 : 33,300 : 416,600 : 9 : 9 1976--------------------------: 475,000 : 53,600 : 37,500 : 491,000 : 11 : 11
Source: U.S. producers' shipments compiled from data submitted in response to questionnaires of the U.S. International Trade Commission; ~.S. imports and exports compiled from official statistics of the U.S. Department of Commerce.
~ \J1 N

A-53
APPENDIX B.~COUNTRIES AND TERRITORIES ENTITLED TO GSP BENEFITS

A-54
The following countries and territories ~re designated beneficiary
developing countries for purposes of the GSP, provided for in title V
of the Trade Act of 1974:
Independent Countries
Afghanistan Angola Argentina Bahamas Bahrain Bangladesh Barbados Benin Bhutan Bolivia Botswana Brazil Burma Burundi Cameroon Cape Verde Central African
Republic Chad Chile Colombia Congo (Brazzaville) Costa Rica Cyprus Dominican Republic Egypt El Salvador Equatorial Guinea Ethiopia Fiji Gambia Ghana Grenada Guatemala
Guinea Guinea Bissau Guyana Haiti Honduras India Israel Ivory Coast Jamaica Jordan Kenya Korea, Republic of Lebanon Lesotho Liberia Malagasy Republic Malawi Malaysia Maldive Islands Mali Malta Mauritania Mauritius Mexico Morocco Mozambique Nauru Nepal Nicaragua Niger Oman Pakistan Panama
Papua New Guinea Paraguay Peru Philippines Portugal Republic of China Romania Rwanda Sao Tome and Principe Senegal Sierra Leone Singapore Somalia Sri Lank.a Sudan Surinam Swaziland Syria Tanzania Thailand
.Togo Tonga Trinidad and Tobago . Tunisia Turkey Upper Volta Uruguay Western Samoa Yemen Arab Republic Yugoslavia Zaire Zambia
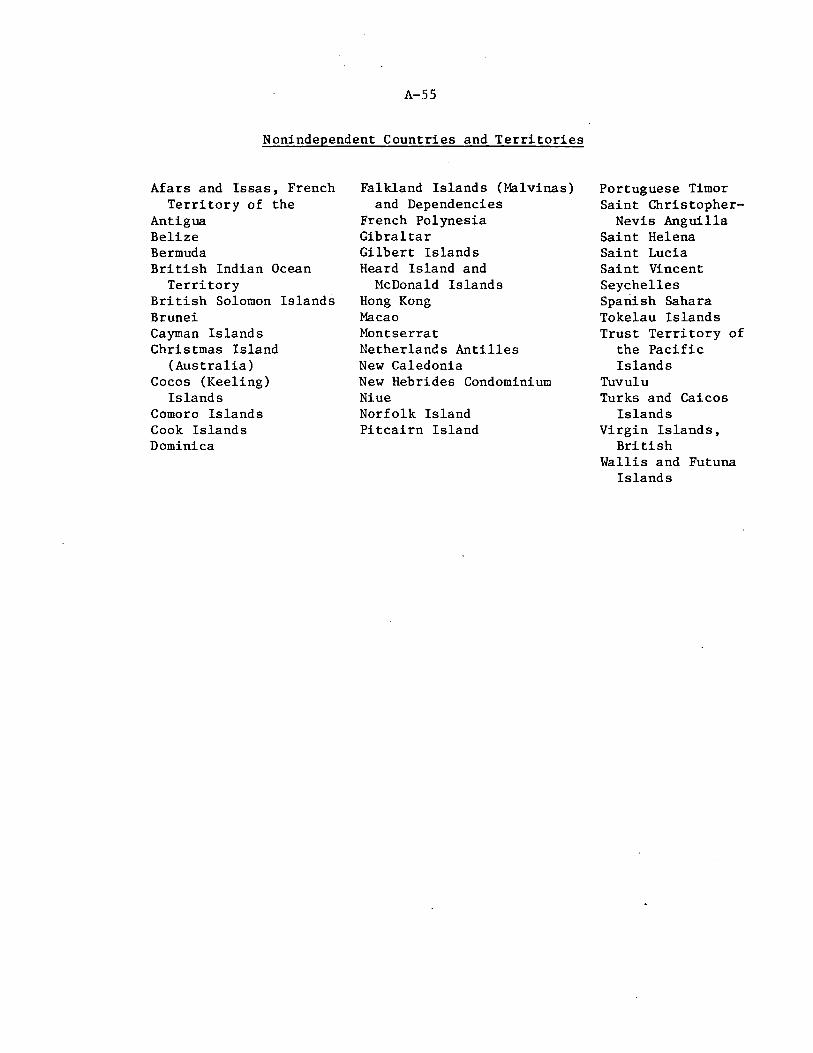
A-55
Nonindependent Countries and Territories
Afars and Issas, French Territory of the
Antigua Belize Bermuda British Indian Ocean
Territory British Solomon Islands Brunei Cayman Islands Christmas Island
(Australia) Cocos (Keeling)
Islands Comoro Islands Cook Islands Dominica
Falkland Islands (Halvinas) and Dependencies
French Polynesia Gibraltar Gilbert Islands Heard Island and
McDonald Islands Hong Kong Macao Montserrat Netherlands Antilles New Caledonia New Hebrides Condominium Niue Norfolk Island Pitcairn Island
Portuguese Timor Saint Christopher-
Nevis Anguilla Saint Helena Saint Lucia Saint Vincent Seychelles Spanish Sahara Tokelau Islands Trust Territory of
the Pacific Islands
Tuvulu Turks and Caicos
Islands Virgin Islands,
British Wallis and Futuna
Islands

Library Cataloging Data
U.S. International Trade Commission. Cast-iron cooking ware. Report to the
President on investigation no, TA-201-21 under section 201 of the Trade act of 1974, Washington, 1977.
22 p. A-55 illus. 27 cm. (USITC Publication 817)
1. Kitchen utensils. 2. Cast iron. I. Title
UNITED STATES
INTERNATIONAL TRADE COMMISSION WASHINGTON, D.C. 20436
OFFICIAL BUSINESS
ADDRESS CORRECTION REQUESTED
ADDRESS CHANGE D Remove from List O Change as Shown
Please detach address label and mail to address shown above.
PENALTY FOR PRIVATE USE TO AVOIO PAYMENT
OF POSTAGE, $300 ~ u.&.MAIL