Embed Size (px)
Citation preview

S2Biom Project Grant Agreement n°608622
Case study on supplying large scale Biofuel
production plants in North-East Germany and North
West Poland with lignocellulosic feedstock from the
region
June 2016
Delivery of sustainable supply of non-food biomass to support a
“resource-efficient” Bioeconomy in Europe

D 9.6
1
About S2Biom project
The S2Biom project - Delivery of sustainable supply of non-food biomass to support a
“resource-efficient” Bioeconomy in Europe - supports the sustainable delivery of non-
food biomass feedstock at local, regional and pan European level through developing
strategies, and roadmaps that will be informed by a “computerized and easy to use”
toolset (and respective databases) with updated harmonized datasets at local,
regional, national and pan European level for EU28, Western Balkans, Moldova,
Turkey and Ukraine. Further information about the project and the partners involved
are available under www.s2biom.eu.
Project coordinator
Scientific coordinator
Project partners

D 9.6
2
About this document
This report corresponds to (number and name of deliverable) of S2Biom. It has been
prepared by:
Due date of deliverable: 30.6.2016
Actual submission date: 20.6.2016
Start date of project: 2013-01-09
Duration: 36 months
Work package 9.6
Task 9.3.1/2
Lead contractor for this deliverable
IUNG/SYNCOM
Editor Magdalena Borzecka-Walker, Klaus Lenz
Authors Simon Kühner, Magdalena Borzecka-Walker
Quality reviewer Bert Annevelink
Dissemination Level
PU Public PU
PP Restricted to other programme participants (including the Commission Services)
RE Restricted to a group specified by the consortium (including the Commission Services):
CO Confidential, only for members of the consortium (including the Commission Services)
Version Date Author(s) Reason for modification Status
0.1
0.2
This project is co-funded by the European Union within the 7th Frame Programme. Grant Agreement n°608622. The sole responsibility of this publication lies with the author. The European Union is not responsible for any use that may be made of the information contained therein.

D 9.6
3
Executive summary
The S2Biom1 project investigates sustainable feedstock supply for bioenergy and bio based
products throughout the European Union, their Eastern Neighbors as well as the South
Eastern Balkan States.
The results obtained in a case study aiming at throughout investigation of the value chain of
synthetic Biofuel production from wood and agricultural residues in Northern Germany and
Eastern Poland will be presented. The biomass potential of the regions has been determined
and the data are used to feed a value chain model developed earlier within a previous EU
project2. The study focuses on regionally split production pathways with regional rather small
to medium scale pretreatment plant producing an intermediate energy carrier which can be
easily transported to new or existing facilities for upgrading to transportation fuel. This
approach is studied on economic and logistic, properties, including fuel production cost and
distribution of added value.
The optimization model will provide information on capacity and location of new built plants
for pretreatment and conversion, takes into account existing refinery capacity and models
fuel amount and cost. Conclusion will be drawn on the feasibility of biofuel production in the
studied regions.
1 S2Biom GA 608622 www.s2Biom.eu
2 BioBoost GA 282873, www.bioboost.eu

D 9.6
4
Table of contents
About S2Biom project .............................................................................................. 1
About this document ................................................................................................ 2
Executive summary .................................................................................................. 3
1. Geographic coverage: North-East Germany and North-West Poland .......... 9
2. Determination of feedstock potential ............................................................ 10
2.1. Feedstock potentials in Case study area .................................................. 10
3. Feedstock types .............................................................................................. 13
3.1. Straw ........................................................................................................ 13
3.2. Forestry residues ..................................................................................... 18
4. Rational of the biofuel chains......................................................................... 21
4.1. Straw - fast pyrolysis - gasification - synthetic transportation fuel ............ 23
Forestry residues - catalytic fast pyrolysis - transportation fuels ........................... 27
5. Description of the optimisation approach ..................................................... 32
6. Optimisation of fuel production in NE Germany and NW Poland ............... 37
6.1. Biofuel production with the Catalytic Pyrolysis value chain ...................... 37
6.2. Biofuel production with the Fast Pyrolysis value chain ............................. 49
6.3. Discussion of results of value chain optimisation ..................................... 57
7. The case study conclusions ........................................................................... 60
List of Figures ......................................................................................................... 61
List of Tables .......................................................................................................... 64

D 9.6
5
Strategic Case Studies
Terms of Reference
Work Package
WP9
Task T9.3.1/2
Deliverable N.
D9.6
Author Magdalena Borzecka-Walker, Simon Kühner, Rafal Pudelko, Klaus Lenz
Date 1.10.2015 duration 9 Months
Status finished
These Terms of Reference provide a short
description of the methodology, scope and
expected results of each Advanced/ Strategic
Case Study implemented in the framework of
S2BIOM, Tasks 9.3.1 & 9.3.2, and are thus an
integral part of the Deliverable D9.6
“Compilation of all reports on the performance
and outcome of each SCS”.
D 9.6
6
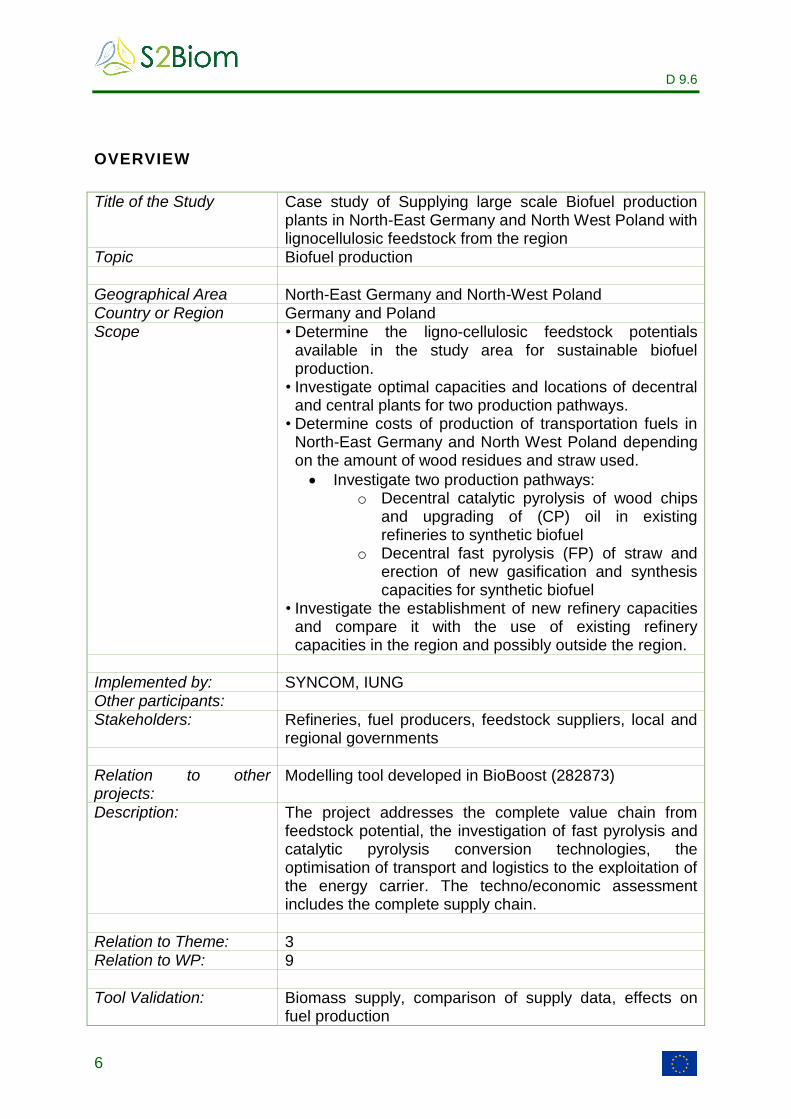
OVERVIEW
Title of the Study Case study of Supplying large scale Biofuel production plants in North-East Germany and North West Poland with lignocellulosic feedstock from the region
Topic Biofuel production Geographical Area North-East Germany and North-West Poland Country or Region Germany and Poland Scope • Determine the ligno-cellulosic feedstock potentials
available in the study area for sustainable biofuel production.
• Investigate optimal capacities and locations of decentral and central plants for two production pathways.
• Determine costs of production of transportation fuels in North-East Germany and North West Poland depending on the amount of wood residues and straw used.
Investigate two production pathways: o Decentral catalytic pyrolysis of wood chips
and upgrading of (CP) oil in existing refineries to synthetic biofuel
o Decentral fast pyrolysis (FP) of straw and erection of new gasification and synthesis capacities for synthetic biofuel
• Investigate the establishment of new refinery capacities and compare it with the use of existing refinery capacities in the region and possibly outside the region.
Implemented by: SYNCOM, IUNG Other participants: Stakeholders: Refineries, fuel producers, feedstock suppliers, local and
regional governments Relation to other projects:
Modelling tool developed in BioBoost (282873)
Description: The project addresses the complete value chain from feedstock potential, the investigation of fast pyrolysis and catalytic pyrolysis conversion technologies, the optimisation of transport and logistics to the exploitation of the energy carrier. The techno/economic assessment includes the complete supply chain.
Relation to Theme: 3 Relation to WP: 9 Tool Validation: Biomass supply, comparison of supply data, effects on
fuel production

D 9.6
7
DESCRIPTION OF THE STUDY
Outline
Value chain
The S2Biom project investigates sustainable feedstock supply for bioenergy and bio
based products throughout the European Unions, their Eastern Neighbours as well
as the South Eastern Balkan States.
Within the project a number of advanced case studies are prepared to demonstrate
relevance of the conducted research activities.
The value chains considered in this study aim at the thermochemical production of
drop-in synthetic biofuels from wood chips and straw via catalytic and fast pyrolysis
pretreatment. The process chains are split or staged chains, meaning that first an
intermediate bioenergy carrier is produced in a region which is then transported to an
existing or new built facility for fuel production. The study focuses on regionally split
production pathways with a regional rather small to medium scale pretreatment plant
producing an intermediate energy carrier which can be easily transported to new or
existing fuel production facilities. This approach generally referred to as the decentral
vs a central approach is studied on economic and logistic properties, including fuel
production cost and added value wealth. The geographic scope will be North-East
Germany and North-West Poland. The geographic resolution will be on NUTS 3 level.
The chains considered are:
Catalytic pyrolysis (CP) of forestry residues produces a pyrolysis oil with low oxygen content which is transported to a refinery for integrated production of transportation fuels.
Fast pyrolysis (FP) of straw yields a biosyncrude transported for gasification followed by chemical synthesis to transportation fuel.
This Case study is performed by the INSTYTUT UPRAWY NAWOZENIA I
GLEBOZNAWSTWA (IUNG) at Pulawy in Poland and the consultancy SYNCOM
Forschungs- und Entwicklungsberatung GmbH in Ganderkesee, Germany.
IUNG determines the biomass potential of the regions in the study area. The data are
used by SYNCOM to feed a value chain model developed by the Fachhochschule
Oberösterreich within a previous EU project3. The optimization model will provide
information on capacity and location of new built plants for pretreatment and
conversion, takes into account existing refinery capacity and models fuel amount and
cost. The feasibility of biofuel production is investigated.
3 BioBoost GA 282873
D 9.6
8
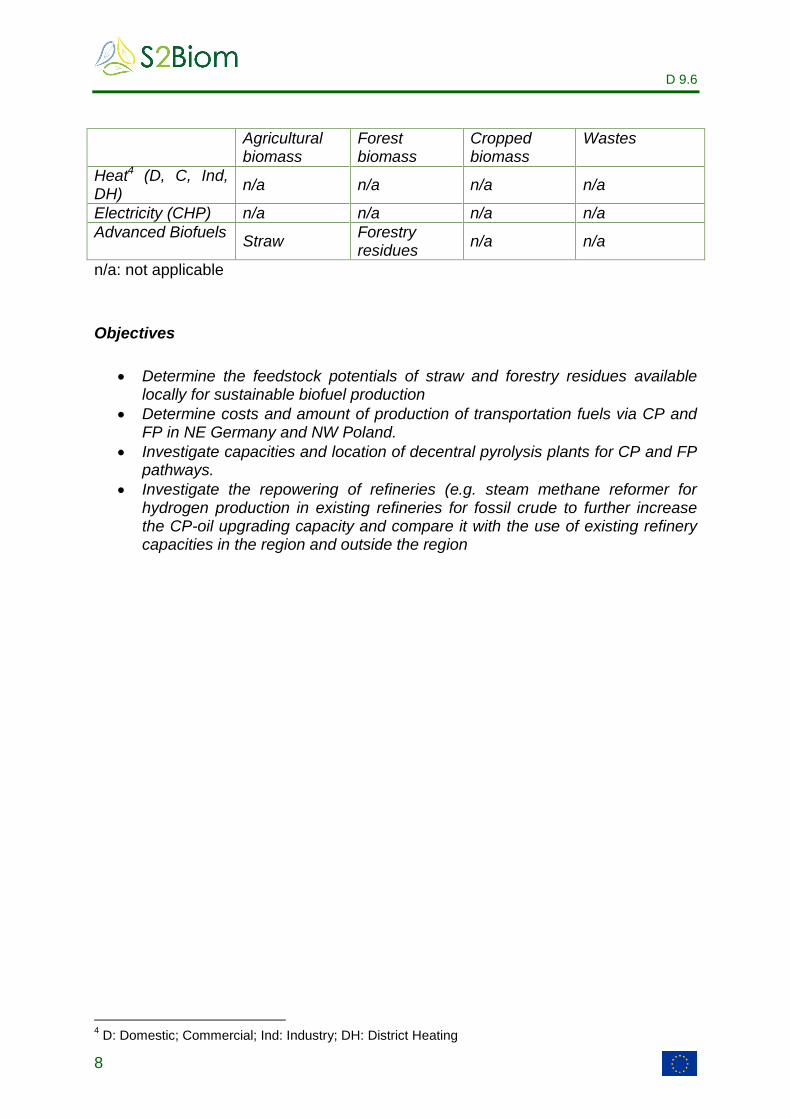
Agricultural biomass
Forest biomass
Cropped biomass
Wastes
Heat4 (D, C, Ind, DH)
n/a n/a n/a n/a
Electricity (CHP) n/a n/a n/a n/a
Advanced Biofuels Straw
Forestry residues
n/a n/a
n/a: not applicable
Objectives
Determine the feedstock potentials of straw and forestry residues available locally for sustainable biofuel production
Determine costs and amount of production of transportation fuels via CP and FP in NE Germany and NW Poland.
Investigate capacities and location of decentral pyrolysis plants for CP and FP pathways.
Investigate the repowering of refineries (e.g. steam methane reformer for hydrogen production in existing refineries for fossil crude to further increase the CP-oil upgrading capacity and compare it with the use of existing refinery capacities in the region and outside the region
4 D: Domestic; Commercial; Ind: Industry; DH: District Heating

D 9.6
9
1. Geographic coverage: North-East Germany and North-West
Poland
The area of interest for the case study on large-scale fuel production covers north-
eastern Germany and north-western Poland. The area includes four large crude oil
refineries located in Gdansk (PL), Plock (PL), Schwedt (DE) and Leuna (DE). The
area and the refineries are highlighted in the figure below and its entities are listed in
the table below.
Figure 1 Location of the case study area (highlighted) in Germany and Poland. Large NUTS 3 regions were split up to areas of less than 7500 km² (thin straight lines) to increase the performance of the optimisation model. Locations of refineries relevant for the study area are indicated by red dots.
Table 1: Name and NUTS of the entities in the study area. Plock was added due to its importance for the study area.
Name NUTS Name NUTS
Sachsen DED Wielkopolskie PL41
Sachsen-Anhalt DEE Zachodniopomorskie PL42
Thüringen DEG Lubuskie PL43
Berlin DE3 Dolnośląskie PL51
Brandenburg DE4 Kujawsko-Pomorskie PL61
Mecklenburg-Vorpommern DE8 Pomorskie PL63

D 9.6
10
2. Determination of feedstock potential
The analysis of feedstock potential is based on the work done in BioBoost project as
potentials from S2Biom were not available. Estimates were made for spatial unit's
NUTS-3, which are small regions with geocode standard for referencing the
subdivisions of countries for statistical purposes. Estimates were made for the
following types of biomass:
• agricultural (straw, orchard's pruning, hay) and animal residues (manure
surplus),
• forestry residues,
• natural conservation matter (management of urban green areas, hay and
shrubs),
• roadside vegetation,
• urban and industrial waste (biodegradable municipal waste, selected waste
from the food, and wood industry).
2.1. Feedstock potentials in Case study area
The case study focuses on straw residues and forestry residues. The analysis was
done for the area of North-East Germany and North-West Poland. The case study
covers an area of 231,164 km2 with an utilised agricultural area of 114,614 km2. From
the 93,877 km2 arable land, cereals are cultivated on 58,691 km2. The total
agricultural area has slightly decreased in 2013 compared to data from 2005. In
Germany the agricultural area has decreased by 0.9%, while in Poland an increase of
1% was noticed. These bigger changes on the Polish part of case study area are
linked to transformations due to the introduction of new instruments of the Common
Agricultural Policy (CAP). This is in agreement to similar experiences made earlier in
the old Member States, where introduction of the CAP instruments let to profound
land use changes, too.

D 9.6
11
Figure 2. Utilised agricultural area (sources: Eurostat)
Figure 3. Arable land (sources: Eurostat)

D 9.6
12
The farm structure in the case study area varies between the countries and the
regions. In Eastern Germany most farms are over 100 hectare while in Poland there
is a very wide variation (Figure 4). In Zachodniopomorskie 54% of farms are bigger
than 100 ha, while in Wielkopolskie 41 % of farms is smaller than 20 ha.
Figure 4 Farm structure (sources: Eurostat)
D 9.6
13
3. Feedstock types
3.1. Straw
Straw is one of the most common agricultural residues which can be used for energy
purposes. Collection of straw depends on the cereal type and weather pattern.
Cereals are typically harvested when the grain dried to the desired moisture content.
Straw should not be baled until it has dried to at least 15% water content, which is
sufficient for baling and storage. The straw is stored by the farmers or suppliers in
field side stacks or under roof and transported continuously to the plant (here: FP).
Typically, the conversion plants have storage capacity for only a few days.
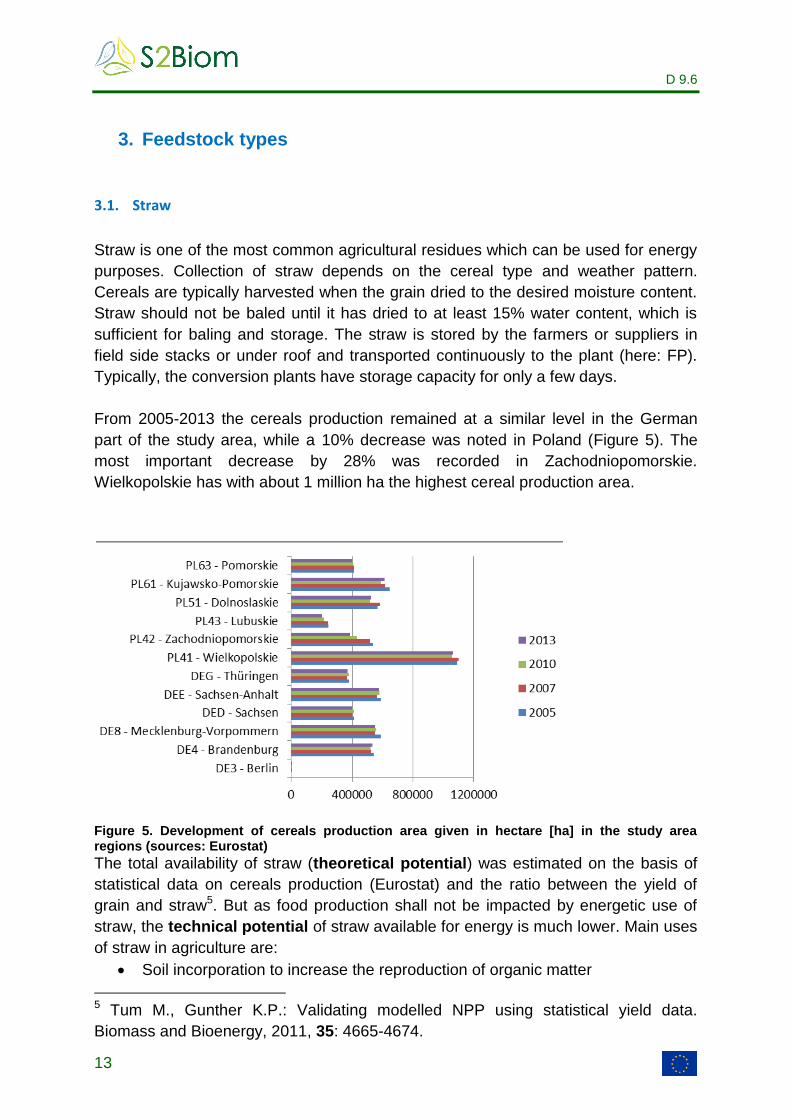
From 2005-2013 the cereals production remained at a similar level in the German
part of the study area, while a 10% decrease was noted in Poland (Figure 5). The
most important decrease by 28% was recorded in Zachodniopomorskie.
Wielkopolskie has with about 1 million ha the highest cereal production area.
Figure 5. Development of cereals production area given in hectare [ha] in the study area regions (sources: Eurostat)
The total availability of straw (theoretical potential) was estimated on the basis of
statistical data on cereals production (Eurostat) and the ratio between the yield of
grain and straw5. But as food production shall not be impacted by energetic use of
straw, the technical potential of straw available for energy is much lower. Main uses
of straw in agriculture are:
Soil incorporation to increase the reproduction of organic matter
5 Tum M., Gunther K.P.: Validating modelled NPP using statistical yield data.
Biomass and Bioenergy, 2011, 35: 4665-4674.

D 9.6
14
Animal feed and bedding
Mulch covering of soil as crop protection against weeds (e.g. in strawberries) or frost (e.g. vegetables, flower bulbs)
The amount of straw for animal production depends on the abundance and share of
production systems in the regions. The use of surplus straw for energy generation,
construction or fibre may lead to some competition with agricultural use but initially
application of more effective equipment is expected to reduce the straw costs.
Further details on the methodology of straw potential calculation can be found in
Deliverable 1.2 The feedstock potential assessment for EU-27 + Switzerland in
NUTS-3 http://bioboost.eu/results/public_results.php
The following part explains the relation of theoretic potential competing applications
and the technically available, sustainable straw potential, the amounts of which are
given in table 2.
Figure 6. Theoretical potential of straw.
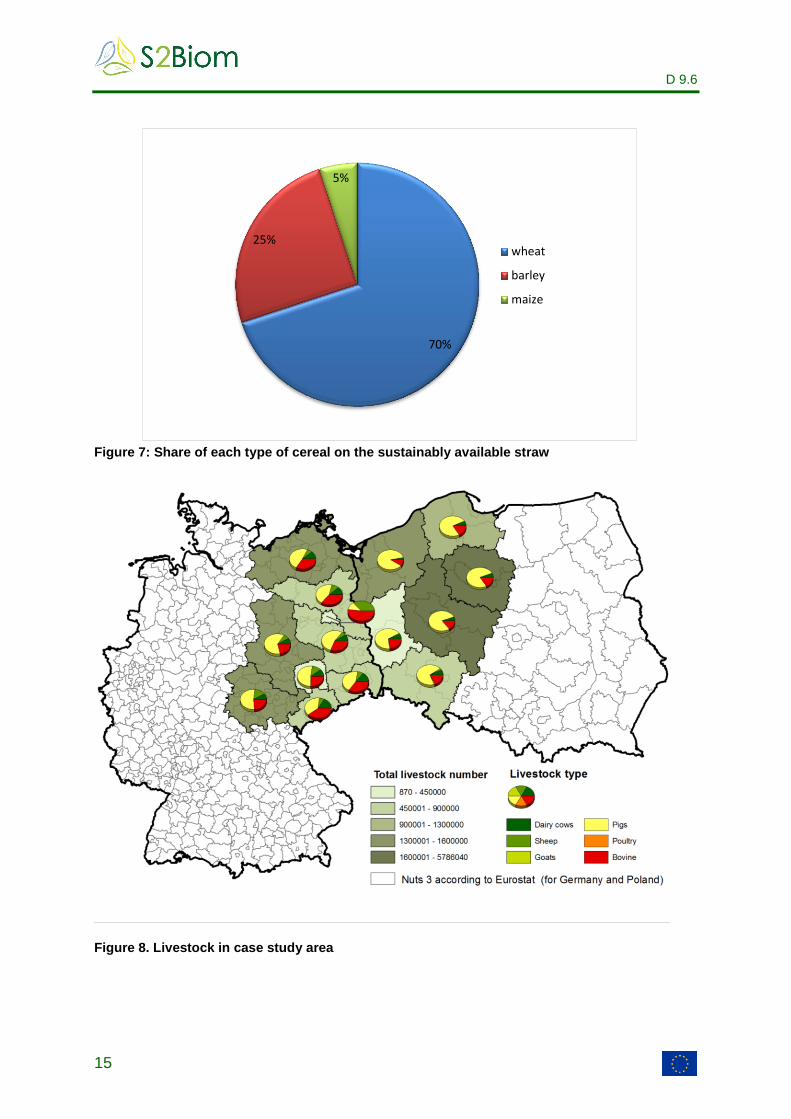
The relative share of the different cereal straws available in the area is presented in
Figure 7. For the calculation of straw potential, the demand for animal rearing is very
important (Figure 8).
D 9.6
15
Figure 7: Share of each type of cereal on the sustainably available straw
Figure 8. Livestock in case study area
70%
25%
5%
wheat
barley
maize

D 9.6
16
Figure 9. Technical potential of straw.
Figure 10. Technical potential of wheat straw.

D 9.6
17
Figure 11. Technical potential of barley straw.
Figure 12. Technical potential of maize straw.

D 9.6
18
3.2. Forestry residues
Forestry residues are the next important biomass resource in terms of quantity and
availability, which can be used as feedstock for energy purposes. As results on the
forest residue potential were not available in the S2Biom project, the results
presented below were determined on base of definitions and methodology proposed
within EU-FP7 project BEE- Biomass Energy www.eu-bee.eu. Calculations were
downscaled from country level to NUTS-3 for the case-study region.
The theoretical potential of primary forestry residues in each unit was calculated as a
theoretical potential of logging residues and theoretical potential of stumps. The
technical potential was assessed assuming the restrictions listed below:
• 50 % recovery rate of above ground forest residues; The recovery rates have
been selected in line with the level chosen by European Environmental
Agency and Asikainen et al.6 but simplified to 0.5 per country
• 20 % as a recovery rate for stumps; Recovery rates for stumps have been
chosen slightly lower compared to Asikainen et al. and a very coarse
differentiation between countries was made with reference to silvicultural and
harvesting practises and species distribution
• 30 % of the surplus complementary fellings are reserved for material use of
wood
• 5 % of the current net annual increment is reserved for an increase of standing
volume to facilitate an increased carbon storage and for biodiversity purposes
including an increase of the dead wood component and to increase the share
of mature forests especially in protected areas
• 5% unrecorded harvests from industrial roundwood in the current harvesting
statistic were considered (thereby attributing more wood from the entire
harvesting potential for material use).
The assessment is based on data from 2003 to 2007. In order to convert the
modelled biomass into energy, an average moisture content of 35% was assumed,
which is equivalent to 10.06 GJ/t. At harvesting the typical water content is around
45% (9 GJ/t). At 15% (air-dry) it is 15.48 GJ/t and 19 GJ/t for oven-dry matter.
With the approach chosen, the country and species-specific values of wood density
were considered. On average, when recalculating the energy content per solid m³ for
6 Asikainen A., Liiri H., Peltola S., Karjalainen T., Laitila J.: Forest energy potential in
Europe (EU27). Working papers of the Finnish Forest Research Institute 69., 2008, http://www.metla.fi/julkaisut/workingpapers/2008/mwp069.htm.

D 9.6
19
the technical potential at EU level, this results in 7.25 GJ/m³ or 0.173 toe/m³. This
conversion value is close to the 7.2 GJ/m³ that have been utilised in the EU-Wood
study (BEE report “Executive Summary, Evaluation and Recommendations”, 2010).
Spatial explicit method for NUTS-3. The yield was estimated for forest areas
determined on base of Corine Land Cover (CLC) geo-data. From this map,
deciduous, coniferous and mixed forests were extracted. For each NUTS-3 region,
the average Net Primary Productivity (NPP) per class was determined based on the
World Data Center for Remote Sensing of the Atmosphere (WDC-RSAT) data. The
relative differences of net primary productivity have been used (as weighting factors)
to redistribute the theoretical and technical values of potentials from country-level to
the raster map.
Further details on the methodology of forestry potential calculation can be found in
Deliverable 1.2 The feedstock potential assessment for EU-27 + Switzerland in
NUTS-3:
http://bioboost.eu/results/public_results.php
Figure 13.Theoretical forestry residues potentials

D 9.6
20
Figure 14. Technically available forestry residue potential
The table below gives an overview on the total technical potentials of straw and
forestry residues in the NUTS2 regions of the case study area.
Table 2 Technical potential of straw and forestry residues in case study area
Region Straw Forest residues
kt PJ kt PJ
DE3 - Berlin 0.75 0.01 25.73 0.26
DE4 - Brandenburg 1,772.94 23.05 1,625.75 16.26
DE8 - Mecklenburg-Vorpommern 2,480.04 32.24 706.42 7.06
DED - Sachsen 1,737.24 22.58 752.61 7.53
DEE - Sachsen-Anhalt 2,234.40 29.05 735.22 7.35
DEG - Thüringen 1,521.64 19.78 942.03 9.42
PL21 - Malopolskie 204.68 2.66 134.38 1.34
PL41 - Wielkopolskie 1,426.56 18.55 791.76 7.92
PL42 - Zachodniopomorskie 1,140.54 14.83 876.31 8.76
PL43 - Lubuskie 453.87 5.90 792.02 7.92
PL51 - Dolnoslaskie 1,587.68 20.64 691.34 6.91
PL61 - Kujawsko-Pomorskie 976.22 12.69 390.93 3.91
PL63 - Pomorskie 799.31 10.39 592.64 5.93
total DE 9,747.01 126.71 4,787.76 47.88
total PL 6,588.87 85.66 4,269.37 42.69
Total 16,335.89 212.37 9,057.13 90.57
D 9.6
21
4. Rational of the biofuel chains
The thermochemical biofuel pathways studied in this case study were developed in
the FP7-project ‘Biomass based energy intermediates boosting biofuel production’
(BioBoost www.bioboost.eu). They are characterised by a two-step conversion
process with concentration of bioenergy in decentral plants and upgrading to
transportation fuel as usable bioenergy commodity in large, central plants. This
requires also a two-step logistic chain of biomass feedstock transport from field side
or forestry road to decentral plant and transport of the produced bioenergy carriers to
the central upgrading plant. The rationale of this approach is:
to keep the logistic effort low and have more added value in rural areas than with large, single-site plants
to lower production costs per unit compared to small single-site plants due to scaling effects
The feedstock demand of the envisaged decentral catalytic- and fast-pyrolysis plants
is in the order of several 100,000 tonnes per year. The produced intermediate
bioenergy carriers biosyncrude (Fast Pyrolysis) and biooil (Catalytic Fast Pyrolysis)
are characterised by an increased energy concentration (up to 300%) and improved
handling performance (e.g. pumpable) as compared to the biomass, enabling
efficient long distance railway transport to central upgrading plants. These may have
GW-size or are integrated in refineries and profit of scale-of-unit-effects (production
costs reduction per unit with increasing capacity) or synergies.
Concerning biomass feedstock, technically available and sustainable potentials are
taken into account after the deduction of the demand of the primary sector
(production of food, feed, pulp, …). The commodities cereal straw and forest fuels
(logging residues, thinning wood, stumps) are studied in detail as feedstock of the
reference pathways. Other studied biomasses included land management matter,
waste wood and various residues of the alimentary industry.
The high feedstock demand of the decentral plants requires the utilisation of the most
efficient technologies for feedstock procurement typically operated by dedicated
subcontractors. These were identified in some advanced countries: The supply of
forest fuel was developed and industrialized in Finland and Sweden. Forest
management, residue forwarding, chipping, truck payload and forest fuel use are
optimized and broadly implemented. For straw reference countries are Denmark,
Great Britain and Spain with efficient agriculture, high density large square balers,
automatic bale chasers and large straw consumers. Today, these systems are not
necessarily operated in every country of the EC. This will change with the demand.
For the determination of feedstock costs these most efficient technologies and

D 9.6
22
procurement strategies were used. For details on feedstock costs free field side or
forestry road refer to BioBoost deliverable 1.1 ‘Feedstock costs’, prepared by S.
Kühner, SYNCOM, retrievable under:
http://www.bioboost.eu/uploads/files/bioboost_d1.1-syncom_feedstock_cost-
vers_1.0-final.pdf
For the logistic system and associated costs from field side/forestry road to the plant
refer to BioBoost deliverable 1.4 ‘Biomass logistics’ prepared by S. Rotter and C.
Rohrhofer, Fachhochschule Oberösterreich retrievable under:
http://www.bioboost.eu/uploads/files/bioboost_d1.4_fho_biomasslogistics_vers2.0-
final.pdf
The assessment of economic and environmental effects in this case study is based
on BioBoost deliverable 6.4 ‘Energy carrier chain assessment’ prepared by I.
Hernandez Mireles, A. van Horssen, T. van Harmelen and E. Hagen, TNO,
retrievable at:
http://www.bioboost.eu/uploads/files/bioboost_d6.4_sustainability_assessment_v1.2-
final.pdf

D 9.6
23
4.1. Straw - fast pyrolysis - gasification - synthetic transportation fuel
This pathway is based on the bioliq-technology developed by the KIT (Karlsruhe
Institute for Technology). Detailed information is available under www.bioliq.de
Feedstock: Strawy biomass
Straw is a residue from the harvest of cereals as e.g. wheat, barley or rye. Depending
on the soil demand for organic carbon and other agricultural uses, the surplus straw
can be used as feedstock for bioenergy generation. Other options are herbaceous
energy crops (like Miscanthus, Switch grass), dried land management matter (hay in
the broader sense) and several dry waste materials. An efficient supply chain is
based on large square bales of high density, collected in field-side stacks for truck
transport. These bales have a density of about 200 kg/m3 and enable to use the full
payload of 120 m³-large volume trucks.
First conversion step -fast pyrolysis
For fast pyrolysis (FP) straw is milled and pyrolysed at about 500°C in the absence of
oxygen. The biomass vapours formed are cooled down rapidly and mixed with the
milled char to a pump- and transportable ‘biosyncrude’, the energy carrier. The non-
condensable gases are used to fire the pyrolysis reactor. 1,500 kg straw is converted
to 1,000 kg biosyncrude, which contains 85% of the straw energy. The FP plants are
expected to have a capacity of 200,000 to 660,000 tonnes straw per year which
relates to 28 to 82 truck loads per day. In regions of good straw availability transport
distances would be between 50 and 100 km. Biomass from landscape management,
lignocellulosic energy crops (e.g. Miscanthus, Switchgrass) or waste wood are
alternative feedstocks for this process. Use of these biomasses as co-feedstock
would shorten the average transport distance. The decentralised FP plant produces
between 145,000 and 435,000 tonnes biosyncrude per year. The energy carrier has
a heating value of 18 to 20 GJ/t.
Biosyncrude energy carrier transport
With regard to transportability, a truck load of 24 tonnes of straw in large square
bales has a volume of 120 m³ and would be converted to about 15 m³ of a pumpable
energy carrier. A freight train of 40 railway tank wagons with a payload of 65 tonnes
each could transport the energy carrier produced from 170 truck loads straw. This is
a very cost- and environmental efficient transport mean to bring the bioenergy from
several rural areas to a central, industrial site for upgrading. The transportation
vessels require corrosion resistant properties.
Upgrading to transportation fuel

D 9.6
24
The good transportability of the biosyncrude enables long distance railway transport
of the output of 5 to 10 straw pyrolysis plants to a large synfuel plant. These are
expected to have a feedstock demand between 1.3 and 4 million tonnes of
biosyncrude, which relates to a thermal fuel capacity between 800 MW to 2.5 GW.
The energy carrier is gasified at high pressure and temperatures of higher than
1,200°C to hydrogen and carbon monoxide for the production of transportation fuels
via Methanol-to-Gasoline- or Fischer-Tropsch-synthesis. Both fuels purely consist of
hydrocarbons, which guarantee drop-in blending. The fuels are fully engine
compatible and do not require changes in the distribution infrastructure, two points
very important for consumer acceptance. Renewable power is a co-product, there are
2.5 MWh produced per tonne of transportation fuel which is after deduction of the
internal consumption about 12 % by energy. The transport fuels have a GHG-
avoidance potential of 81 % compared to fossil fuels.
Maturity of the pathway
The feedstock procurement is commercial, the conversion steps are established on
demo-scale (TRL 7), the synthesis (Fischer-Tropsch or Methanol to Gasoline) are
commercial available. At the developer KIT, the fast pyrolysis unit has 2 MW, the
biosyncrude gasifier has 5 MW and the gasoline synthesis has 2MW.
Figure 15: The bioliq pilot plant at the KIT in Karlsruhe, Germany, has a straw pyrolysis unit of 500 kg/h (2 MW) with bioslurry preparation, an high pressure, entrained flow gasifier with a capacity of 1 t/h bioslurry (5 MW) with hot gas cleaning and fuel synthesis unit operating at 55 bar. Copyright: Karlsruhe Institute of Technology
The figures below show the fast pyrolysis reference pathway from straw to synfuel in
terms of energy flows (Sankey-diagram) and logistic flows. It is compatible to
herbaceous energy crops (like Miscanthus, Switch grass) and dried land
management matter (hay in the broader sense). The data items were translated to
the S2Biom-format in the following table.

D 9.6
25
Figure 16 Sankey-diagram on energy flows of a design-size (100 MW) catalytic fast pyrolysis plant and respective upgrading capacity in a refinery (67.7 MW instead of design size 260 MW). Numbers indicate the energy flow in MW. Transport efforts are given for reference case. Colour code: Green-biomass; blue-FP-biosyncrude; red-transport fuel; orange-power (S. Kühner, SYNCOM)
Power togrid, 8.4
Fieldsidestack, 117
Fast pyrolysis, 117
Transport fuel 40.4
Straw
Biosyncrude, 100
Biooil upgradingrefinery, 100
117
EnergyInput - Output
40.4
5.4
Power fromgrid, 2.8
80 km, fuelconsumption 0.65
180 km, power demand 0.22

D 9.6
26
Figure 17 The Fast Pyrolysis reference pathway as studied in the BioBoost-project. (S. Rotter, FHOÖ) Table 3 The biomass value chain for Fast pyrolysis (BioBoost reference pathway).
What? How? Where?
Starts with: Straw in swath on a cereal field
Straw baling High density large square baler, 90x120x240 dim.
field
Bale collection and stacking
Bale chaser at roadside landing
Storage pile un/covered at roadside landing
Handling - loading Telehandler at roadside landing
transportation platform, drawbar truck from roadside landing to decentral conversion plant
handling - unloading Gantry crane at decentral conversion plant
storage covered in warehouse at decentral conversion plant
handling Gantry crane at decentral conversion plant
decentral conversion process
Fast pyrolysis at decentral conversion plant
Handling - loading pumping at decentral conversion plant
transport pyrolysis oil tank wagon (railway transportation)
from decentral conversion plant to central conversion plant
handling - unloading pumping at central conversion plant
central conversion process Gasification/synfuel at central conversion plant
* transports by farm tractor
** transports by truck
*** transports by rail1 Rail transport costs depend on transport relation (east/west) and distance classes (from 200 km to 2000 km); costs range from 11 to 60 EUR/t
Feedstocksource
Decentral
conversion plant
Intermediatedepot
Pile at field
Transport**
Cultivation Harvest Press Consolidation
Storage
1.99 EUR/tDM
Handling
3.53 EUR/tDM
Transport*
0.28 EUR/tDMkm
0.15 EUR/tDMkk Handling
1.63 EUR/tDM*
1.32 EUR/tDM**
Handling
1.32 EUR/tDM
**
Transport**
0.15 EUR/tDMkm
Handling
0.89 EUR/tDM*
Centralconversion plant
Storage
0.63 EUR/tDM
Handling
0.65 EUR/tDM
Storage
10.05 EUR/tDM
Handling0.68
EUR/tDM
Bio
ma
ss L
og
isti
csEn
erg
y C
arr
ier
Log
isti
cs
Transport***
Handling
Conversion Process
11 EUR/t
4.22 EUR/t
FAST PYROLYSIS
Front-end loader Pile at field
Farm tractor & platform trailer
Truck and drawbar trailer
Telecopic handler
Intermediate depot
Telecopic handler
Truck and drawbar trailer
Gantry craneFP plantGantry crane
Block train (tank waggon)
Decanting
Telecopic handler
Sq
ua
re b
ale
sB
iosyn
crud
e
x
x
˅

D 9.6
27
Forestry residues - catalytic fast pyrolysis - transportation fuels
This pathway is based on CatOil-technology developed by the CERTH (Centre for
Research and Technology Hellas), Royal DSM and Neste. Detailed information is
available under:
http://www.bioboost.eu/results/public_results.php
Feedstock: Forest residues
Forest residues are co-products of forest cultivation and wood harvest: Thinning
wood occurs as whole tree or delimbed stems in the thinning of young stands. Final
felling yields logs for the production of timber, wood pulp or boards; co-products are
tree-tops, branches and off-spec logs (bent or rotten). In some countries stump
excavation is allowed to prepare the ground for tree planting. Depending on the site
conditions, soil fertility and eventual ash return a certain share of forest residues can
be taken from the forest without threatening its productivity. This sustainable amount
is collected and stored at the forest road for chipping into trucks or transport in whole
for chipping at the plant. Depending on site and duration of storage, the water
content of forestry residues is between 30 and 50 %. In 2015 the maximum allowable
weight of forest trucks was between 40 and 76 tonnes in European countries.
Optional feedstocks are other wood commodities (timber processing residues, waste
wood, short rotation coppice) and other ligno-cellulosic residues.
First conversion step: Catalytic fast pyrolysis
The catalytic fast pyrolysis (CFP) starts with the drying and milling of forestry
residues (e.g. thinning wood, tree-tops, branches). The biomass is pyrolysed at about
500°C in absence of oxygen in contact to a catalytic material. The catalyst splits off a
high share of the oxygen which is contained in the biomass molecules (about 45 %
by weight) as carbon dioxide, carbon monoxide or water. The pyrolysis vapours are
rapidly cooled. The condensed biooil contains 50 % of the liquid biomass energy, is
low in oxygen content (15 to 20 %) and has a heating value of about 30 GJ/t. CFP
off-gases and the catalyst coke are combusted to supply the reaction heat for
pyrolysis and produce power (0.83 MWh per tonne of biooil). Another co-product is
crude acetic acid of which about 50 kg are produced per tonne of energy carrier. The
decentralised CFP plants are erected in areas of high feedstock availability: They are
expected to have a capacity of 160,000 to 520,000 tonnes forest residues per year
which relates to 28 to 92 truck loads per day. In regions of good availability transport

D 9.6
28
distances would be between 60 and 120 km. Straw, lignocellulosic energy crops (e.g.
Miscanthus, Switchgrass) or waste wood are alternative feedstocks for this process.
Use of these biomasses as co-feedstock would shorten the average transport
distance. The decentral CFP plant produces between 45,000 and 147,000 tonnes
biooil per year.
Biooil energy carrier transport
With regard to transportability, a truck load of 25 tonnes forest residue chips (14 to 17
tonnes wood dry matter, rest is water) is converted to 4 to 5 m³ of a pumpable energy
carrier. A freight train of 40 railway tank wagons with a payload of 65 tonnes each
could transport the energy carrier produced from 570 truck loads forest residues. This
is a very cost- and environmental efficient transport mean to bring the bioenergy from
several rural areas to a central refinery for upgrading by co-processing with crude oil.
The energy carrier is moderately corrosive and compatible to standard crude oil
transport and storage vessels.
Upgrading to transportation fuels
The good transportability of the energy carrier enables long distance railway transport
for upgrading in refineries with capacities between 200,000 and 850,000 tonnes of
biooil in European countries. The energy carrier is stabilized in two hydrotreatment
steps consuming about 70 kg hydrogen per tonne of transport fuel. One co-product
are light gases (180 kg per tonne fuel) another might be phenol(-ics) which have a
higher market value for the chemical industry than for biofuel production. Due to
changes in the European refining sector it is expected that the CP biooil may replace
2 % of fossil crude. This enables use of existing capacity for steam methane
reforming and hydrotreatment for the deoxygenation of the biooil. The product is co-
processed with the fossil streams and distilled to the conventional transportation fuels
gasoline/kerosene/diesel according to the production slate of the refinery. All fuels
purely consist of hydrocarbons which guarantee drop-in blending. The fuels are fully
engine compatible and do not require changes in the distribution infrastructure, two
points very important for consumer acceptance. The fuels have a GHG-avoidance
potential of 81 % compared to fossil fuels.
The figures below show the catalytic fast pyrolysis reference pathway in terms of
energy flows (Sankey-diagram) and logistic flows; its steps were translated to the
S2Biom biomass value chain format in the following table.

D 9.6
29
Figure 18: Sankey-diagram on energy flows of a design-size (100 MW) catalytic fast pyrolysis plant and respective upgrading capacity in a refinery (67.7 MW instead of design size 260 MW). Numbers indicate the energy flow in MW. Transport efforts are given for reference case. Colour code: Green-biomass; blue-FP-biosyncrude; red-transport fuel; orange-power, pink-natural/combustible gas (S. Kühner, SYNCOM)
Ambient heat (airdrying in pile, 4)
Power to/from grid
Steamreformer
Roadsidepile, 82
Forest residuecollection, 78
Catalyticpyrolysis, 104
Feedstock drying, 22
Natural gas, 7.9
Light gases recycling, 11.1
Hydrogen 14.4
Transport fuel 51.2
3.3
2.2
Forestresidues
Biooil, 47.9
4.8
Biooil upgradingrefinery, 67.7
78
EnergyInput - Output
7.9
51
2.4
Fuel 0.67
220 km88 km
0.2

D 9.6
30
Figure 19. The description of a biomass value chain (reference pathway) for catalytic fast pyrolysis in the BioBoost-project (S. Rotter, FHOÖ).
* transports by farm tractor
** transports by trucks
*** transports by rail 1 Rail transport costs depend on transport relation (east/west) and distance classes (from 200 km to 2000 km); costs range from 11 to 60 EUR/t
Feedstock source
Decentral
conversion plant
Intermediate depot
Slash pile
at roadside landing
Cultivation Felling Forwarding Consolidation
Transport**
Storage
1.99 EUR/tDM
Handling
-EUR/tDM
Transport*
1.11 EUR/tDMkm
0.29 EUR/tDMkm
** Handling0.31
EUR/tDM*
0.27 EUR/tDM**
Handling
2.20 EUR/tDM**
Transport
0.11 EUR/tDMkm
**
Handling
0.08 EUR/tDM*
Centralconversion plant
Storage
0.56 EUR/tDM
Handling
1.13 EUR/tDM
Storage6.23
EUR/tDM
Handling1.13
EUR/tDM
Bio
ma
ss L
og
isti
csEn
erg
y C
arr
ier
Log
isti
cs
Transport***
Handling
11 EUR/t
4.22 EUR/t
CATALYTIC
PYROLYSIS
Conversion Process
Wo
od
chip
sC
atalytic oil
Loggin
g resid
ue
s
Mobile chipper Slahs pile
Farm tractor & hook lift trailer
Truck and drawbar/hook lift trailer
Handling roll-off container
Intermediate depot
Telecopic handler
Telecopic handler
Truck and drawbar trailer
Telescopic handler
Tipping
CP plant
x
x
˅
0.27 EUR/tDM**
Rroll-off container

D 9.6
31
Table 4 The biomass value chain catalytic fast pyrolysis. Shaded in grey is an optional intermediate storage in a biomass center.
What? How? Where?
Starts with: Thinning wood or logging residues in forest
Forest residue forwarding Forwarder Forest
storage logging residues pile un/covered at roadside landing
chipping truck-mounted chipper at roadside landing
transportation Hook-lift containers, truck from roadside landing to intermediate depot
handling - unloading tipping at intermediate depot
handling telescopic handler at intermediate depot
storage covered in warehouse at intermediate depot
Handling - loading telescopic handler at intermediate depot
transportation truck and drawbar trailer from intermediate depot to decentral conversion plant
handling tipping at decentral conversion plant
storage covered in warehouse at decentral conversion plant
handling telescopic handler and screw conveyor
at decentral conversion plant
decentral conversion process
catalytic fast pyrolysis at decentral conversion plant
Handling - loading pumping at decentral conversion plant
transport pyrolysis oil tank wagon (railway transportation)
from decentral conversion plant to central conversion plant
handling - unloading pumping at central conversion plant
central conversion process
Deoxygenation/transp.fuel at central conversion plant
This procurement chain is compatible to forest residues from thinning and logging as
well as for woody biomass from land management and roadside clearing.

D 9.6
32
5. Description of the optimisation approach
A holistic logistic approach employing a multi-stage supply network was developed
by the University of Applied Science Upper Austria (FHOÖ) in the BioBoost project. It
is used to model and optimise de-central energy carrier production and central
processing in trans-regional (up to EU-wide) supply chains as shown in the figure
below.
Figure 20. General description of the BioBoost process with depots, decentral conversion and central conversion (Erik Pitzer, Gabriel Kronberger, FHOÖ, 2013).
7
Simulation-based optimization was used to construct an optimisation scenario for
feedstock usage, plant location selection, and transport route selection. It is based on
a detailed description of the conversion and transport processes and on
sophisticated evolutionary algorithms for assigning values to the free variables of this
simulation model, which are feedstock sourcing area, feedstock sourcing ratio, plant
location, plant capacity and energy carrier supply. These scenarios are evaluated
using the holistic simulation model. Using the simulation result as input to
evolutionary algorithms, optimized scenarios can be constructed.
Here, a mixed-integer optimization problem is being solved for finding optimal
biomass networks with respect to both economic as well as ecologic objectives.
Discrete variables describe placement decisions or routing strategies, while
continuous variables are needed for modelling numerical values such as biomass
utilizations and plant capacities. The whole process of simulating a given logistic
scenario gives a set of regional values, most importantly total cost including
feedstock, handling, storage, transportation, conversion, waste disposal, construction
and various estimates concerning environmental aspects for final life-cycle
assessment. These final figures are then combined into a single quality value that
describes the overall desirability of a specific scenario.
7 Sources: Bioboost, 2013; Pitzer & Rotter, 2012; Kronberger, G. & E. Pitzer, 2015; Rotter &
Rohrhofer, 2012 & 2014;

D 9.6
33
The program has been developed based on the open-source software HeuristicLab,
which also provides a user-friendly GUI. Through specifically designed interfaces for
defining input data, such as feedstock availabilities, feedstock cost, the simulator
yields information such as total transport cost and emissions, or plant construction
cost.
Different types of evolutionary algorithms were used for solving this optimization
problem. Evolutionary algorithms are a kind of meta-heuristic algorithm which can be
applied to a large variety of different optimization problems. Meta-heuristic algorithms
can be used for optimization problems when it is not necessary to solve the problem
exactly and it is sufficient to find a good solution as is here the case. Of the many
available types of evolutionary algorithms Evolution Strategies and Genetic
Algorithms were adapted to the requirements of the BioBoost simulation model.
Evolutionary algorithms start from a set of initial configurations of the problem
(usually these are initialized randomly) and then iteratively generate new
configurations by combining elements from a set of active configurations. The
process is designed in a way to improve the quality of solutions over time. This is
accomplished in evolutionary algorithms by exerting selection pressure on the
configurations. Either, better configurations are selected from the active set with a
higher probability (GA), or a surplus of new configurations is generated and only the
best of them are kept (ES). First, the algorithm implemented in HeuristicLab produces
solution candidates for the simulation model; then the simulation yields a total cost
that is fed back to the optimizer. The optimizer then uses this information to generate
improved configurations. Over time the quality of the solutions improves and the
process continues until an acceptable solution is finally found.
Transport distance matrix
The geographical fundament of the scenario is the feedstock potentials in the NUTS
3 regions and a transport distance matrix pre-calculated for the whole network. For
the determination of transport costs, the distances between feedstock source (e.g.
field) and de-central conversion plant is required. Average route lengths were
estimated on base of the European road network using Open Street Map data. If
feedstock and conversion plant are in the same region, an average route length was
estimated by calculating routes from 20 random points in the region to the centroid,
where the conversion plant was assumed to be. If transport was from one region to
another, route lengths between 20 random selected points in each region were
calculated and averaged. The large difference in the size of the NUTS 3 regions led
to a distorted matrix as intra-regional transport was in some cases several 100 km
long, which impacted the optimisation. This problem was solved by splitting large
NUTS regions to sub-regions of maximum 7500 km². The feedstock potential was
assumed to be evenly distributed in these cases.

D 9.6
34
Biomass feedstock price
The optimisation model operates with feedstock prices, which depend on the degree
of utilization (sourcing ratio) as the price of a commodity depends on offer and
demand in a free market. Facilities with a feedstock demand in the range of tens to
hundreds of thousand tonnes biomass are expected to change established
offer/demand ratios (and thus the price) considerably. For feedstock sourcing
between 0 and 50 % (x-axis) a single price (y-axis) is assumed, which increases with
higher utilization rates as shown in the figure below for the European average.
It has to be underlined that the feedstock amount at 100% sourcing is the sustainable
amount of ready available residue biomass. The demand of e.g. straw for agricultural
applications (fodder, bedding,…) or timber in the forestry sector (saw logs, pulp mills,
board production) was deducted from the theoretical potential to exclude competition.
Feedstock-competing sectors are expected to profit initially from an increased
demand due to establishment of more efficient procurement technology until prices
generally increase at higher sourcing ratios as observed on the Swedish forest fuel
market.
Figure 21: The feedstock prices (y-axis) depend on degree of utilization (x-axis). Increasing prices were assumed, if more than 50% of the available residue and waste feedstock is marketed.
Overview on scenario parameters
Feedstock utilisation
[%]

D 9.6
35
The parameters for the calculation of the scenarios were collected in the BioBoost-
consortium and harmonized for techno-economic assessment by TNO. The
production costs per unit drop with increasing capacity, as e.g. less steel is required
per m³ of reactor volume or the loan of a worker does not depend on the size of the
operated wheel-loader. For sake of simplicity, this scale of unit-effect was restricted
to construction costs. The table below gives an overview on cost items, the range of
plant size. The scale of unit-effect of production cost are shown in the following
figure.
Table 5: Overview on technical parameters of the plants of the two conversion pathways
Catalytic Pyrolysis Refinery upgrading Fast Pyrolysis Synfuel plant
Design capacity [t/a feedstock] 179,856 249,690 219,123 1,345,493
Conversion efficiency [t product/t feedstock] 0.26 0.69 0.68 0.16
Construction costs [EUR/t*20a] 12,243,937 30,858,231 11,003,716 139,037,373
Operation costs [EUR/a] 9,545,962 38,295,258 7,278,442 107,841,770
Construction scaling exponent 0.7 0.7 0.7 0.7
Operation scaling exponent 1 1 1 1
Utilisation factor 0.91 0.91 0.91 0.91
Storage costs [EUR/t] 2.55 2.60
Catalyst costs [EUR/t] 4.13
Exemplary feedstock costs [EUR/t] 70 750 60 220
Electricity costs [EUR/t feedstock] 37 8.6
Hydrogen costs [EUR/t feedstock] 93
Waste water costs [EUR/t feedstock] 0.04 0.15
Cooling water costs [EUR/t feedstock] 0.01
Electricity revenues [EUR/t feedstock] 18.4 33.9
Light gases revenues [EUR/t feedstock] 44.8
Linear production costs [EUR/t product] 429 1,491 155 1,663
Scalable production costs [EUR/t product] 262 179 74 645

D 9.6
36
Figure 22: Range of plant capacity in terms of tonnes feedstock conversion capacity per year and respective dependence of production costs per unit of product.
0
500
1000
1500
2000
2500
3000
3500
0 1000000 2000000 3000000 4000000 5000000
Pro
du
ctio
n c
ost
s [E
UR
/t p
rod
uct
]
Plant capacity [t feedstock /a]
Catalytic pyrolysis plant
Upgrading in refinery
Fast Pyrolysis plant
Synfuel plant

D 9.6
37
6. Optimisation of fuel production in NE Germany and NW
Poland
6.1. Biofuel production with the Catalytic Pyrolysis value chain
The study area has a total sustainably available potential of about 9 million tonnes
forestry residues which may be converted to a total of 2.3 million tonnes of CP-biooil
per year. This amount could be upgraded to 1.6 million tonnes transportation fuel.
However, the concepts of the CP-pathway foresees upgrading in existing refineries,
which reduce investments to new units to the minimum and saves costs by using
existing structures and skilled personnel. It was assumed that 2% of the crude oil
processing capacity could be substituted with CP-biooil with the established
infrastructure. The conversion of larger amounts would either require a stand-alone
plant or further investments in e.g. hydrogen production capacity. Four refineries are
situated in the study area. According to published crude oil processing capacities
these were assumed to have a biooil upgrading capacity of Plock – 252,000 t/a;
Leuna – 207,000 t/a; Gdansk and Schwedt – both 192,000 t/a. Using the total biooil
upgrading capacity of 843 kilotonnes per year would yield about 531 kilotonnes of
transportation fuel. In the optimisations the 4 refineries produce about this amount of
fuel which means that about 36% of the forest residues in the study area are
converted to transportation fuel. The production costs in the plants vary in the 6
replicate optimisation runs between 1626 and 1743 EUR/t transportation fuel. The
average production costs are 1661 EUR/t over the 4 plants in the best run, which is
shown in the figures below and described in the following.
The integration of the CP-fuel in the local transport fuel market is straight forward:
The upgrading in the refinery leads to a biocrude which is further processed together
with fossil crude in the refinery. So the product of the CP-pathway is a drop-in biofuel
which does not require separate pumps at the filling stations nor new fuel standards.
The customer does not experience impacts on engine performance or increased
consumption as with other biofuels. Concerning market shares, the population of
about 29 million in the study area has a transport fuel demand of about 15.7 million
tonnes oil equivalent, calculated on base of the national average consumption of
0.626 and 0.429 tonnes per person for Germany and Poland. Assuming that the
produced 531,000 tonnes CP-fuel would be used in the study area gives a share of
3.4% in the transport fuel market. For the year 2020, the European Fuel Quality
Directive (FQD, 2009/30/EC) sets a target of 6 % green house gas reduction by
substitution of fossil transport fuel with biofuel. The CP-based fuel is expected to
D 9.6
38
have a GHG-avoidance exceeding 80 %. Assuming 85 % avoidance the 3.5 % CP-
fuel blend would have a GHG-avoidance of 3% in the study area. So halve of the
FQD target could be achieved with regionally produced biofuel from locally harvested
forest residues on the Catalytic Pyrolysis pathway.
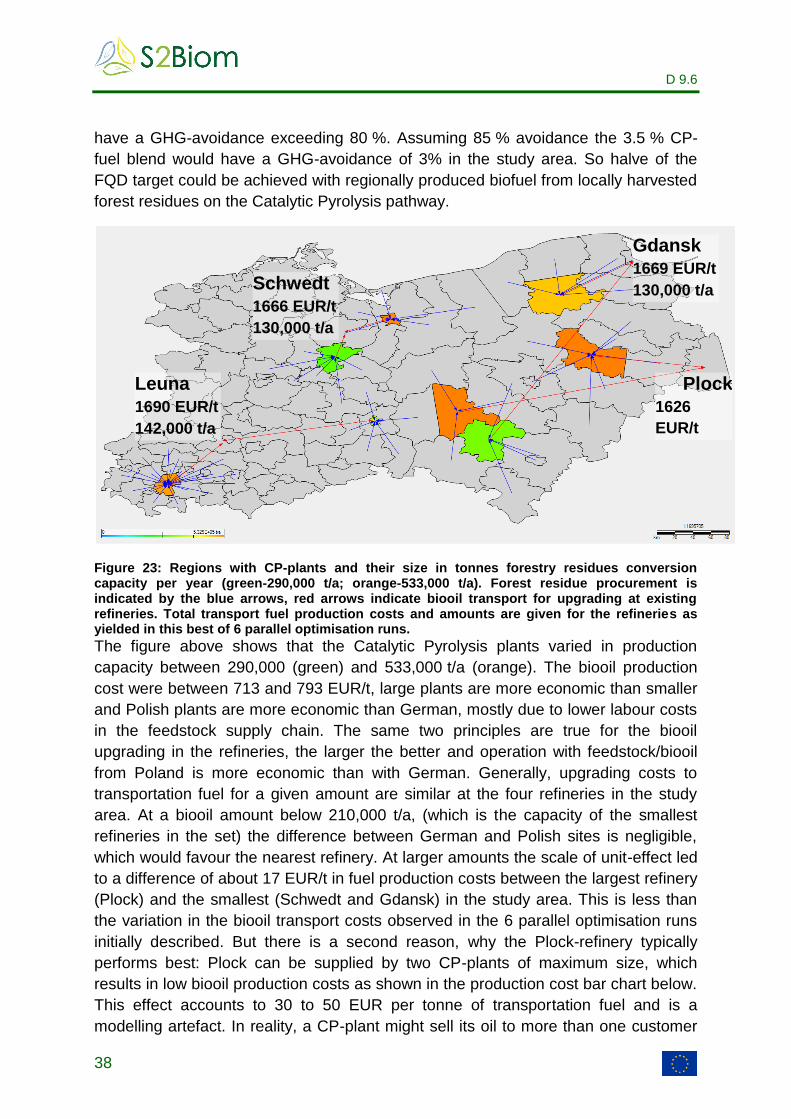
Figure 23: Regions with CP-plants and their size in tonnes forestry residues conversion capacity per year (green-290,000 t/a; orange-533,000 t/a). Forest residue procurement is indicated by the blue arrows, red arrows indicate biooil transport for upgrading at existing refineries. Total transport fuel production costs and amounts are given for the refineries as yielded in this best of 6 parallel optimisation runs.
The figure above shows that the Catalytic Pyrolysis plants varied in production
capacity between 290,000 (green) and 533,000 t/a (orange). The biooil production
cost were between 713 and 793 EUR/t, large plants are more economic than smaller
and Polish plants are more economic than German, mostly due to lower labour costs
in the feedstock supply chain. The same two principles are true for the biooil
upgrading in the refineries, the larger the better and operation with feedstock/biooil
from Poland is more economic than with German. Generally, upgrading costs to
transportation fuel for a given amount are similar at the four refineries in the study
area. At a biooil amount below 210,000 t/a, (which is the capacity of the smallest
refineries in the set) the difference between German and Polish sites is negligible,
which would favour the nearest refinery. At larger amounts the scale of unit-effect led
to a difference of about 17 EUR/t in fuel production costs between the largest refinery
(Plock) and the smallest (Schwedt and Gdansk) in the study area. This is less than
the variation in the biooil transport costs observed in the 6 parallel optimisation runs
initially described. But there is a second reason, why the Plock-refinery typically
performs best: Plock can be supplied by two CP-plants of maximum size, which
results in low biooil production costs as shown in the production cost bar chart below.
This effect accounts to 30 to 50 EUR per tonne of transportation fuel and is a
modelling artefact. In reality, a CP-plant might sell its oil to more than one customer
Leuna
1690 EUR/t
142,000 t/a
Schwedt
1666 EUR/t
130,000 t/a
Plock
1626
EUR/t
174000 t/a
Gdansk
1669 EUR/t
130,000 t/a

D 9.6
39
but implementation of this feature in the model would have cost too much calculation
time.
In the best run, the ratio of forest residue utilisation was 36 % as described above.
However, in the catchment areas of the CP-plants, it was typically between 45 and
60 %, while it was 0 in the rest of the area, as shown in the figure below. The
average transport distance of forest residues to catalytic pyrolysis plants was 88 km,
the logistic costs varied between 20 and 23 EUR/t.
Figure 24: Regional forest residue utilisation in best run. Blue shading: 5-20%; green: 40-60%, red: 100% utilisation; blue arrows: forest residue transport to CP-plant; red arrow: biooil transport to refinery.
Figure 25: Composition of fuel production costs and amount of Catalytic Pyrolysis-based transport fuel in the four refineries of the case study area.
289
279
264
266
130
118
116
114
680
685
663
690
21
11
26
23
569
574
558
576
142605
133206
174111
128489
0 20000 40000 60000 80000 100000 120000 140000 160000 180000 200000
0 200 400 600 800 1000 1200 1400 1600 1800
Leuna
Schwedt
Plock
Gdansk
CP-pathway
Feedstock (EUR/tTF) Feedstock logistic (EUR/tTF) Catalytic pyrolysis (EUR/tTF)
Biooil logistic (EUR/tTF) Upgrading to TF (EUR/tTF) TF amount (t/a)

D 9.6
40
The figure on value added in the regions due to the implementation of the CP-value
chain shown below has basically 3 categories: The regions where the feedstock is
sourced profit by up to 9 million EUR per year, depending on size and forest residue
availability (shaded in blue). At the sites of decentral CP-plants between 40 and 60
million EUR per year are generated, while refinery regions receive an additional 80 to
110 million EUR/a. The total added value in the study area amounts to 960 million
EUR per year.
Figure 26: Added value in the regions of the study area. Blue shading: Up to 11 MEUR/a; green: 40 to 60 MEUR/a; yellow: 80 – 90 MEUR/a; red: 110 MEUR/a
Sensitivity analysis: Direct feedstock supply to CP at refinery
The above described indirect value chain foresees biomass conversion at regional
CP plants and biooil transport for upgrading at a central refinery. An often studied
alternative is the direct supply of forest residues to a stand-alone plant or in case of
this value chain a CP plant at the refinery. This doubles the feedstock transport costs
to 64 EUR/t as shown in the figure below. The forest residue truck transport amounts
to 552 million t*km. This is an average transport distance of 178 km per tonne of
forestry residues or -referred to final product- 1052 t*km per tonne transport fuel
doubled as compared to the staged value chain. The biooil transport by train from the
CP-plant in the feedstock rich areas to the refinery requires 320 km per tonne
transport fuel but total efforts in the staged decentral/central-approach are 22%
lower. The total fuel production costs increase by about 100 EUR/t to 1743 to 1789
EUR/t. The biooil transport costs are saved (20 EUR/t TF with decentral CP) but the
feedstock transport costs increase to an average of 228 EUR per tonne of transport
fuel, which is 100 EUR more than in case of the regional biomass conversion .

D 9.6
41
Table 6: Comparison of parameters of the staged process with biooil transport to the sensitivity study of Catalytic Pyrolysis on-site of the refinery.
Item Remote CP, biooil
transport
CP at refinery
Forest residue transport distance [km]
88 178
Biooil transport distance [km] 220 0
Total logistic costs [EUR/t transport fuel]
140 228
Total production costs [EUR/t] 1661 1761
Figure 27: Forest residue transport costs in a comparable ‘stand alone’-concept. Forest residues are supplied to CPs located at the refinery sites. The maximum transport cost (red) is at 64 EUR/t forest residues, minimum is 5 to 10 EUR/t.

D 9.6
42
Figure 28: Composition of production costs in a scenario of catalytic pyrolysis on site of the refinery.
Market implementation of the CP-biofuel pathway
The first catalytic pyrolysis plant(s) of the pathway would be built where the
production costs are lowest. These are determined by the plant size (scale of unit-
effect) and the feedstock costs. The latter are composed of the price of forest
residues free forest road and the transport costs to the CP-plant, which depend on
the amount of biomass per area, the road network and the transport costs per tkm
(tonnes x km). The forest residue densities are comparable, Poland has lower labour
costs and corresponding price of forestry residues and transport costs, Germany the
better road network. Altogether, the biooil production costs in large CP-plants
(540,000 t/a feedstock) are with 645 EUR/t about 40 to 50 EUR/t lower in Poland
than in Germany. In contrast, a small plant of 90,000 t/a forest residue conversion
capacity would have 110 to 120 EUR/t higher biooil production costs due to the scale
of unit-effect (see fig. 22).
276
291
293
268
238
198
230
246
690
685
680
663
0
0
0
0
585
574
569
566
111762
132615
143590
151293
0 20000 40000 60000 80000 100000 120000 140000 160000
0 200 400 600 800 1000 1200 1400 1600 1800
Gdansk
Schwedt
Leuna
Plock
Direct FR supply to CP at refinery
Feedstock (EUR/tTF) Feedstock logistic (EUR/tTF) EC production (EUR/tTF)
EC logistic (EUR/tTF) Upgrading to TF (EUR/tTF) TF amount (t/a)

D 9.6
43
The figure below shows where the first plants of the Catalytic Pyrolysis-pathway
would be situated in the study area. There are three Catalytic Pyrolysis plants of
about 535,000 t/a feedstock capacity (maximum size), the two Eastern supply the
Plock-refinery, the Western Schwedt. The forestry residue density in the eastern
sourcing areas are in average 0.32 and 0.24 t/km²*a for the Slupski and Wloclawski
plant. This is relatively low compared to the 0.57 t/km²*a in the catchment area of the
Gorzowski-plant, which seems to propose shorter transport distance from forest to
plant. However, average transport distances are with 92 km only slightly better than
the 95 km of the Slupski-plant, which means the transport network is there far better
than in the Gorzowski-region. The Wloclawski plant has 111 km average transport
distance. Concerning the feedstock transport costs there are 19 and 21.6 EUR/t for
the eastern plants and 19.5 for the Gorzowski-plant. Costs for conversion of forest
residues to biooil are 714, 719 and 725 EUR/t for the plants in Slupski, Gorzowski
and Wloclawski-region. The costs for railway transport to the Plock-refinery are 12
and 16 EUR/t biooil for the Wloclawski and Slupski-plants. Biooil transport costs from
the Gorzowski-plant to the Schwedt refinery are 13.5 EUR/t but would be around 25
EUR/t for the transport to Plock. Would the Slupski-biooil be supplied to the Gdansk-
refinery, transport costs were just 9.4 EUR/t. Concerning the biooil costs free Plock-
refinery, the closer-by Wloclawski-plant outcompetes the Gorzowski-plant, which has
lower production costs. The CP-based transportation fuel production costs were
calculated to be 1,621 EUR per tonne in Plock and 1,663 EUR/t in Schwedt. If the
biooil would be provided to the nearest refinery, the chain Slupski-CP for upgrading in
Gdansk had with 1,650 EUR/t the lowest production costs. In the figure shown below
upgrading at the Plock-refinery performs best because this largest refinery in the
study area has the highest upgrading-capacity and has reasonable biooil transport
costs. The expected greenhouse gas avoidance of all pathways is about 80% as
compared to fossil fuel.

D 9.6
44
Figure 29: CP-plants in Slupski and Poznan and biooil upgrading in the Plock-refinery is the most cost-effective implementation of the Catalytic Pyrolysis to transport fuel-pathway in the study area. An even better site for a CP-plant is in the Gorzowski area, upgrading of its oil would be most cost-effective in the Schwedt-refinery near-by. Green shading: 40-60% forestry residue utilisation; Blue arrows: forest residue transport to CP-plant; Red arrow: biooil transport to refinery.
In comparison to other regions in Europe, the catalytic pyrolysis in the study area is
relatively competitive. Running all refineries in the study area at full upgrading
capacity would consume only about 1/3 of the available forest residue potential in the
most profitable areas. If there is a demand for more CP-fuel either dedicated facilities
might be constructed in the area or CP-biooil might be supplied to refineries
elsewhere. These might be located in Rotterdam, the Netherlands, which are a
centre of the European refining industry, offering an upgrading capacity of over
800,000 t/a biooil. It can’t be fuelled from local sources as Dutch forest residues are
far too low in amount and scattered: Some 70,000 t/a biooil would be produced for
1,014 EUR/t, which would result in transport fuel production costs of 2,133 EUR/t,
which would not be competitive.
However, inclusion of the Rotterdam-refineries with the intention to upgrade surplus
amounts of biooil changes the modelling outcome in an unexpected way: In the 6
parallel runs, forestry residue are sourced as expected from the whole study area
and the average utilization increases from 37 to 50-60 %. The CP-plants are larger
and mostly at maximum capacity (shown in the figure below). Unexpected was that
over 60 % of the biooil is supplied to Rotterdam leaving Plock and often Schwedt as
the only remaining regional refineries, supplied by close-by CP-plants. The total
transport fuel production exceeds 800,000 t/a. Some results of the best run are
shown in the figure below. Logistic costs for biooil supply from the 7 catalytic
pyrolysis-plants to Rotterdam amounts to 42.4 EUR/t in average, 14 EUR/t for Plock
and 9 EUR/t to the Schwedt-refinery. Fuel production is most economic in Plock
(1624 EUR/t), Schwedt produces at 1,653 and Rotterdam at 1,670 EUR/t. Rotterdam
CP-
Wloclawski
111 km
725 EUR/t
Ref-
Plock
1621
EUR/t
175,000
t/a
CP-
Slupski
95 km
714 EUR/t
CP-
Gorzowski
92 km
719 EUR/t
Ref-
Schwedt
1663 EUR/t
88,000 t/a

D 9.6
45
has the 4-fold production capacity of the Schwedt-refinery leading to savings of 150
EUR per tonne transport fuel in upgrading costs compared to higher logistic costs in
the order of 25 to 45 EUR/t transport fuel. In this optimisation Rotterdam is supplied
by the more expensive German CP-plants while Schwedt receives its biooil from
Polish CP-plants with only two smaller deliveries of German forest residues to the
CP-plant in Szczecin. If Schwedt would be supplied e.g. from the relative expensive
CP-plants in Potsdam and Prignitz (North Western plants) and Rotterdam from Polish
plants, production costs in Schwedt would be 1,738 EUR/t and 1,635 EUR/t in
Rotterdam.
Figure 30: Increase of transport fuel production from Catalytic Pyrolysis by supply of biooil for upgrading to Rotterdam. Regions with CP-plants are coloured according to biooil production costs (yellow-714 EUR/t; red-807 EUR/t). Forest residue procurement is indicated by the blue arrows, red arrows indicate biooil transport for upgrading at existing refineries. Total transport fuel production costs and amounts are given for the refineries as yielded in this best of 6 parallel optimisation runs.
Figure 31: Composition of production costs and amount of Catalytic Pyrolysis-based transport fuel in a scenario foreseeing increase of fuel production by biooil export to Rotterdam.
287
266
267
139
115
104
678
664
689
61
20
13
505
558
579
508973
172272
121877
0 100000 200000 300000 400000 500000 600000
0 200 400 600 800 1000 1200 1400 1600 1800
Rotterdam
Plock
Schwedt
CP-study area + Rotterdam
Feedstock (EUR/tTF) Feedstock logistic (EUR/tTF) Catalytic pyrolysis (EUR/tTF)
Biooil logistic (EUR/tTF) Upgrading to TF (EUR/tTF) TF amount (t/a)
Ref-
Schwedt
1653 EUR/t
122,000 t/a Ref-
Rotterdam
1670 EUR/t
509,000 t/a
Ref-
Plock
1624
EUR/t
172,000
t/a
D 9.6
46
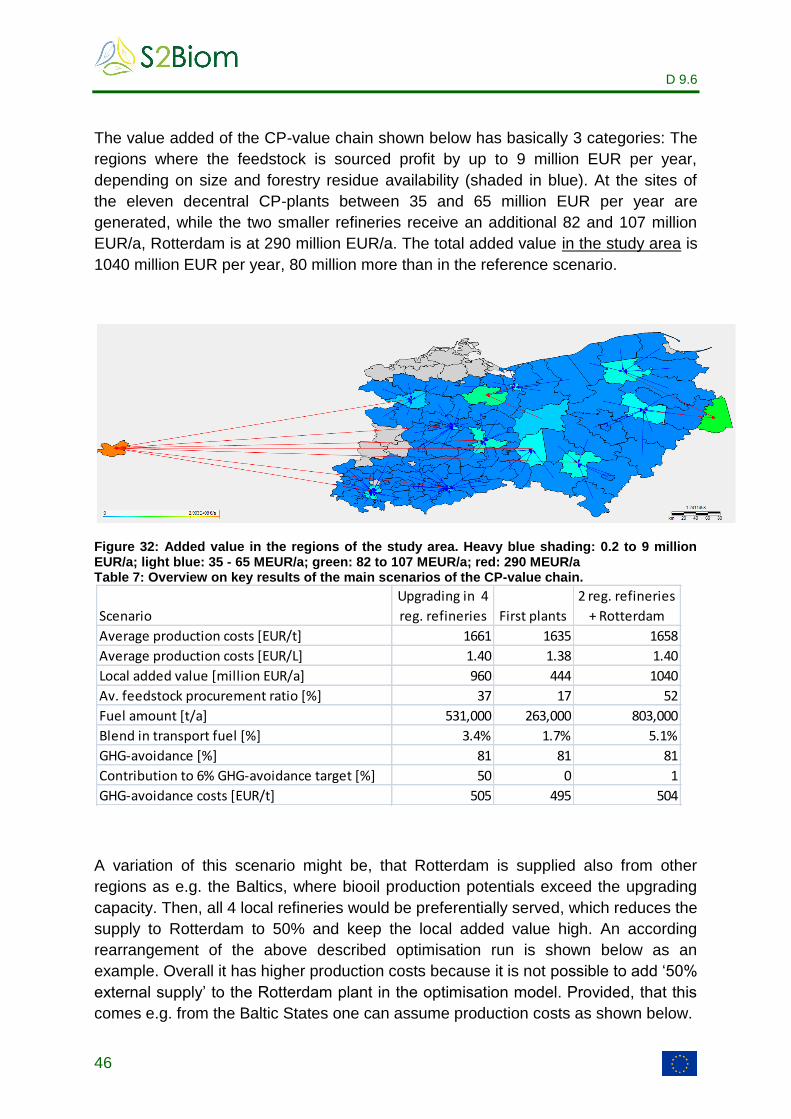
The value added of the CP-value chain shown below has basically 3 categories: The
regions where the feedstock is sourced profit by up to 9 million EUR per year,
depending on size and forestry residue availability (shaded in blue). At the sites of
the eleven decentral CP-plants between 35 and 65 million EUR per year are
generated, while the two smaller refineries receive an additional 82 and 107 million
EUR/a, Rotterdam is at 290 million EUR/a. The total added value in the study area is
1040 million EUR per year, 80 million more than in the reference scenario.
Figure 32: Added value in the regions of the study area. Heavy blue shading: 0.2 to 9 million EUR/a; light blue: 35 - 65 MEUR/a; green: 82 to 107 MEUR/a; red: 290 MEUR/a Table 7: Overview on key results of the main scenarios of the CP-value chain.
A variation of this scenario might be, that Rotterdam is supplied also from other
regions as e.g. the Baltics, where biooil production potentials exceed the upgrading
capacity. Then, all 4 local refineries would be preferentially served, which reduces the
supply to Rotterdam to 50% and keep the local added value high. An according
rearrangement of the above described optimisation run is shown below as an
example. Overall it has higher production costs because it is not possible to add ‘50%
external supply’ to the Rotterdam plant in the optimisation model. Provided, that this
comes e.g. from the Baltic States one can assume production costs as shown below.
Scenario
Upgrading in 4
reg. refineries First plants
2 reg. refineries
+ Rotterdam
Average production costs [EUR/t] 1661 1635 1658
Average production costs [EUR/L] 1.40 1.38 1.40
Local added value [million EUR/a] 960 444 1040
Av. feedstock procurement ratio [%] 37 17 52
Fuel amount [t/a] 531,000 263,000 803,000
Blend in transport fuel [%] 3.4% 1.7% 5.1%
GHG-avoidance [%] 81 81 81
Contribution to 6% GHG-avoidance target [%] 50 0 1
GHG-avoidance costs [EUR/t] 505 495 504

D 9.6
47
Figure 33: Fuel production from Catalytic Pyrolysis and supply of surplus biooil for upgrading to Rotterdam. Regions with CP-plants are coloured according to biooil production costs (yellow-714 EUR/t; red-807 EUR/t). Forest residue procurement is indicated by the blue arrows, red arrows indicate biooil transport for upgrading at existing refineries. Total transport fuel production costs and amounts are given for the refineries.
Figure 34: Composition of production costs and amount of Catalytic Pyrolysis-based transport fuel in a scenario foreseeing increase of fuel production by export of surplus biooil to Rotterdam.
286
268
295
263
281
139
119
144
99
130
665
666
679
690
700
62
27
17
20
25
537
560
569
580
583
254751
167914
144036
120826
115594
0 50000 100000 150000 200000 250000 300000
0 200 400 600 800 1000 1200 1400 1600 1800
Rotterdam
Plock
Leuna
Gdansk
Schwedt
CP-study area+Rotterdam v.2
Feedstock (EUR/tTF) Feedstock logistic (EUR/tTF) EC production (EUR/tTF)
EC logistic (EUR/tTF) Upgrading to TF (EUR/tTF) TF amount (t/a)
Ref-
Rotterdam
1670 EUR/t
255,000 t/a
Ref-
Leuna
1704
EUR/t
144,000 t/a
Ref-
Plock
1640
EUR/t
168,000
t/a
Ref-
Schwedt
1718 EUR/t
116,000 t/a
Ref-
Gdansk
1651 EUR/t
120,000 t/a

D 9.6
48
Figure 35: Added value in the regions of the study area. Heavy blue shading: 1 to 10 million EUR/a; cyan: 35 MEUR/a; green: 60 to 110 MEUR/a; orange: 153 MEUR/a
The value added of this more study-area focused increase of CP transport fuel
production shown above has basically 3 categories: The regions where the feedstock
is sourced profit by up to 9 million EUR per year, depending on size and forestry
residue availability (shaded in blue). At the sites of the eleven decentral CP-plants
between 35 and 65 million EUR per year are generated, while the four smaller
refineries receive an additional 80 and 105 million EUR/a, Rotterdam is at 150 million
EUR/a. The total added value in the study area amounts to 1200 million EUR per
year, which is about 250 million more than in the reference case.

D 9.6
49
6.2. Biofuel production with the Fast Pyrolysis value chain
In contrast to the CP-value chain which profits of existing infrastructure for upgrading
in refineries, the plants of the Fast Pyrolysis pathway are stand-alone. Biosyncrude is
produced in Fast Pyrolysis plants situated in feedstock-rich areas and transported by
rail to central synfuel plants. These tend to be at logistic nodes for reason of low
transport costs, with the side effect of short supply distance to the consumer.
Compared to the CP-process described above, the capacity of the central synfuel
plant is with a design size of 1 GW four times higher. The figure below shows an
optimised network of FP- and synfuel-plants in the study area. Straw transport to FP-
plants is indicated with blue arrows, the produced biosyncrude is transported to
synfuel plants at regions indicated by red arrows. The shading shows the relative
density of available straw (technical potential after deduction of agricultural
demands), expressed in tonnes straw per hectare of total land surface and year (not
field surface!). Straw density peaks in the Börde-region in the south-west of the study
area with nearly 2 t/ha*a (red), followed by 1.6 t/ha in Mecklenburg in the north-west
(yellow). Highest density in the Polish part is around 1 t/ha in Lower Silesia (green).
Many of the 16 decentral plants are situated in these areas of high straw availability.
Figure 36: Straw transport (blue arrow) to Fast Pyrolysis plants and biosyncrude transport (red arrow) to central synfuel plants in the study area. The shading shows the straw density in tonnes per hectare total surface area and year. Red shading: 2 t/ha*a; yellow: 1.5 t/ha*a; bright green: 1 t/ha*a; light blue: 0.3 t/ha*a.
The straw price free field side stack varies with the amount of straw per hectare and
the field size, labour costs play a minor role. In the German part of the study area the

D 9.6
50
large field size (sometimes exceeding 100 ha per field, estimated averages between
15 and 35 ha) and high straw amounts per hectare field size (4.3 to 5.3 t/ha) lead to
straw prices around 46 EUR/t. In the Polish part fields are smaller (averages between
1.1 and 4.3 ha) and less productive (3.1 to 4 t/ha field size) leading to straw prices
between 47 and 49 EUR/t at sourcing ratios up to 50% of the available amount. In
the best of 10 runs the price free FP-plant varied between 60 and 68 EUR/t (shown
below), which is relatively little. It is influenced by the sourcing ratio-dependent straw
price, transport distance and costs per tonne-km. The average transport distance
from field side stack to the FP-plant is 80 km. The maximum distance is 183 km, the
distance for transport to a FP-plant in the same region is 7 to 53 km (shown below).
The average straw sourcing ratio is 60%, 9.7 of the available 16.2 million tonnes are
transported to the FP-plants.
Figure 37: Straw price free FP-plant. Beige: 60 EUR/t; heavy orange: 68 EUR/t.

D 9.6
51
Figure 38: Distance of straw transport (blue arrow). Red: 183 km; yellow: 140 km; green: 100 km; blue: 35 km.
The Fast Pyrolysis plants in this best optimisation run are all relatively large (shown
below). With 510,000 to 660,000 t/a feedstock conversion capacity, they are 2.3 to 3
times larger than the design size. Accordingly, the biosyncrude production costs are
with 221 to 235 EUR/t quite similar. The 16 FP-plants supply the biosyncrude (red
arrows) to two central gasification plants which produce the synfuel. The average
biosyncrude transport distance is about 180 km.
Figure 39: FP-plant straw conversion capacity. Yellow shading: 550,000 t/a; red: 660,000 t/a.
The central synfuel plants are situated in Potsdam and in the Wloclawski-region as
shown in the figure below. The Potsdam facility is with 3.67 Mt/a somewhat larger
and converts the syncrude of the German FP-plants to 550,000 t/a synfuel at a price

D 9.6
52
of 2362 EUR/t. The plant in the Polish Wloclawski-region has a capacity of 2.87 Mt/a
and produces 420,000 t/a synfuel at 2407 EUR/t.
Figure 40: Biosyncrude conversion capacity of the central synfuel plants. Yellow: 2.87 million tonnes per year; red: 3.67 million tonnes per year.
The regional added value can be differentiated in 3 classes: The regions with the
synfuel plant (Potsdam and Wloclawski) have with 526 to 587 million EUR/a the
highest added value. In the next class are the 15 regions with a biosyncrude plant,
receiving 47 to 74 million EUR/a. Regions supplying straw are in the third category of
up to 19 million EUR/a added value, the average is 5.1 MEUR/a, as shown in the
figure below.

D 9.6
53
Figure 41: Local added value generated on the FP-synfuel value chain. Red: Potsdam synfuel plant, 587 MEUR/a; orange: Wloclawski FP and synfuel plant, 526 MEUR/a; light blue: FP-plants 47 to 74 MEUR/a; heavy blue: straw supplying regions, up to 19 MEUR/a
The total production costs of the straw – fast pyrolysis – synfuel value chain are
calculated to be around 2400 EUR/t for the two plants of the study area. The
contribution of the individual cost items to the total costs is specified in the figure
below. While the feedstock sourcing costs are 37 EUR/t transport fuel lower in the
Potsdam-plant, the straw transport costs are 28 EUR/t higher compared to the plant
in the Wloclawski-region. Due to the similar production capacity the costs for
decentral conversion of straw to biosyncrude are very similar as are the transport
costs to the central synfuel plant. Gasification of biosyncrude for production of
synthetic transportation fuel is a process with a strong scaling effect. Therefore, the
larger plant in Potsdam has 44 EUR/t lower conversion costs.

D 9.6
54
Figure 42: Composition of production cost of straw - Fast Pyrolysis-based synthetic transportation fuel in the study area.
The two synfuel plants in Wloclawski and Poland produce a total of 970,000 t
transport fuel per year with a greenhouse gas avoidance potential of 80%. If used
exclusively for fuel blending in the study area it would have a share of 6.4% by mass
and contribute 85% to achieving the GHG-avoidance target of 6%.
Market implementation of the FP-process in the study area
The first plant of the Fast Pyrolysis process for production of synthetic transport fuels
from straw would be build where the production costs are lowest. In the Polish part of
the study area the straw prices are higher due to lower amounts per area and smaller
field sizes but the lower loans reduce transport costs. The following figure shows
regions with similarly low biosyncrude production costs between 221 and 223 EUR/t,
making them candidates for the first plants of the Fast Pyrolysis value chain. These
plants all have a straw converter capacity of 660,000 t/a, which is the largest size
foreseen in the optimisation model. The transport distances vary between 58 and 91
km, with an average of 70 km over all six sites. The plant for the upgrading of
biosyncrude to synfuel is stand alone and it would be most economic to construct it at
the site of the first straw converter, saving costs for transport of the about 410,000 t/a
biosyncrude. However, this amount is below the minimum capacity of the gasification
plant foreseen in the optimisation model. As these plants have a strong scaling effect
(see figure 22), this low size increases the production costs significantly: The first
synthetic transportation fuel production at one of these regions would have costs
between 2699 and 2733 EUR/t. The composition of total synfuel production costs is
shown below.
484
521
150
122
787
789
84
70
857
901
550009
419951
0 100000 200000 300000 400000 500000 600000
0 500 1000 1500 2000 2500 3000
Potsdam
Wloclawski
Fast Pyrolysis-pathway
Feedstock (EUR/tTF) Feedstock logistic (EUR/tTF) EC production (EUR/tTF)
EC logistic (EUR/tTF) Upgrading to TF (EUR/tTF) TF amount (t/a)

D 9.6
55
Figure 43: Regions of comparable competitiveness for the first plants of the Fast Pyrolysis value chain from straw to synfuel. Blue arrows indicate straw transport, shading indicates biosyncrude production costs between 221 and 223 EUR/t.
Figure 44 Composition of synfuel production cost of straw - fast pyrolysis - synthetic transportation fuel value chain in the study area.
460
466
474
466
474
489
132
144
106
139
139
107
778
780
780
780
780
780
17
17
17
17
17
17
1317
1321
1321
1322
1322
1322
66240
65362
65257
65163
65112
65088
0 10000 20000 30000 40000 50000 60000 70000
0 500 1000 1500 2000 2500 3000
DE809
DEE0B
PL424
DEE03
DED53
PL514
FP-first sites
Feedstock (EUR/tTF) Feedstock logistic (EUR/tTF) EC production (EUR/tTF)
EC logistic (EUR/tTF) Upgrading to TF (EUR/tTF) TF amount (t/a)

D 9.6
56
Sensitivity analysis: Direct supply of straw, pyrolysis and gasification plant at
same site
The rationale behind the fast pyrolysis straw pretreatment and the rail-transport from
several decentral plants to a central synfuel plant is to profit of scale-effects in
upgrading and reduce the transport efforts at the same time. The chapter above on
first FP/synfuel plants has shown that total fuel production costs are relatively high
(+300 EUR/t) if the upgrading capacity is restricted to one maximum size straw
converter. In the following the effects of direct supply of straw to the region of a full
size central plant is shown. It is assumed that the maximum size FP-plants with a
straw conversion capacity of 660,000 t/a can’t be build bigger and that up to 9 max-
size FP-plants are constructed at the site of the central upgrading unit. In that case
about 10 million tonnes straw would be transported in the optimisation shown below
to two regions, Szczecin and Halle. The average transport distance would be 209 km,
the maximum distance is 450 km. The following figure shows the transported
amounts of straw. In the total synfuel production costs the straw transport costs
would roughly double from 120 to 150 EUR/t to about 265 EUR/t fuel compared to
the reference case. In contrast the biosyncrude transport costs would not arise,
saving 60 EUR/t synfuel. The total production costs would increase from about 2380
EUR/t to 2450 EUR/t. So the staged approach with regional pretreatment of straw
and efficient rail transport of pyrolysis oil to a central synfuel plant comes with
relatively short straw transport distance, lower total production costs and a better
regional distribution of added value and employment.
Figure 45: Straw amounts transported from the regions to the central pyrolysis and upgrading plants in sensitivity study. Blue: up to 75,000 t/a; green: 75,000 to 200,000 t/a; yellow: 200,000 to 300,000 t/a; red: 340,000 t/a.
Further results for these pathways in EU-28 can be retrieved under www.bioboost.eu.
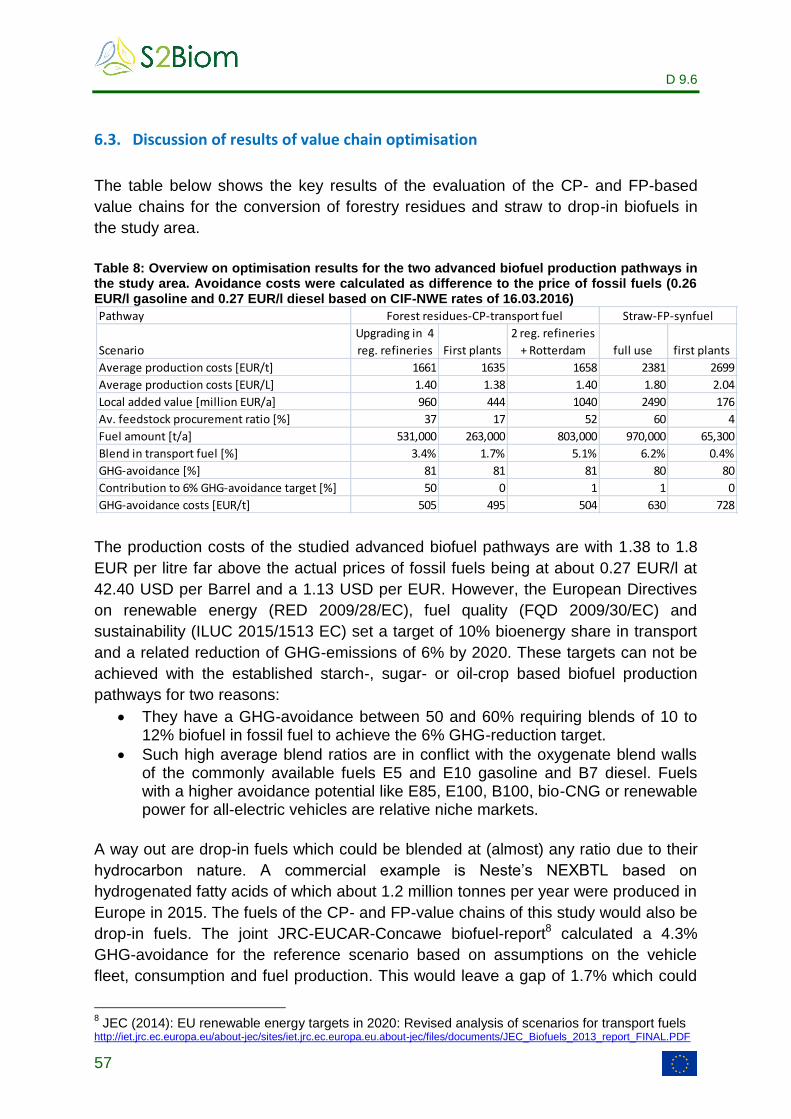
D 9.6
57
6.3. Discussion of results of value chain optimisation
The table below shows the key results of the evaluation of the CP- and FP-based
value chains for the conversion of forestry residues and straw to drop-in biofuels in
the study area.
Table 8: Overview on optimisation results for the two advanced biofuel production pathways in the study area. Avoidance costs were calculated as difference to the price of fossil fuels (0.26 EUR/l gasoline and 0.27 EUR/l diesel based on CIF-NWE rates of 16.03.2016)
The production costs of the studied advanced biofuel pathways are with 1.38 to 1.8
EUR per litre far above the actual prices of fossil fuels being at about 0.27 EUR/l at
42.40 USD per Barrel and a 1.13 USD per EUR. However, the European Directives
on renewable energy (RED 2009/28/EC), fuel quality (FQD 2009/30/EC) and
sustainability (ILUC 2015/1513 EC) set a target of 10% bioenergy share in transport
and a related reduction of GHG-emissions of 6% by 2020. These targets can not be
achieved with the established starch-, sugar- or oil-crop based biofuel production
pathways for two reasons:
They have a GHG-avoidance between 50 and 60% requiring blends of 10 to 12% biofuel in fossil fuel to achieve the 6% GHG-reduction target.
Such high average blend ratios are in conflict with the oxygenate blend walls of the commonly available fuels E5 and E10 gasoline and B7 diesel. Fuels with a higher avoidance potential like E85, E100, B100, bio-CNG or renewable power for all-electric vehicles are relative niche markets.
A way out are drop-in fuels which could be blended at (almost) any ratio due to their
hydrocarbon nature. A commercial example is Neste’s NEXBTL based on
hydrogenated fatty acids of which about 1.2 million tonnes per year were produced in
Europe in 2015. The fuels of the CP- and FP-value chains of this study would also be
drop-in fuels. The joint JRC-EUCAR-Concawe biofuel-report8 calculated a 4.3%
GHG-avoidance for the reference scenario based on assumptions on the vehicle
fleet, consumption and fuel production. This would leave a gap of 1.7% which could
8 JEC (2014): EU renewable energy targets in 2020: Revised analysis of scenarios for transport fuels
http://iet.jrc.ec.europa.eu/about-jec/sites/iet.jrc.ec.europa.eu.about-jec/files/documents/JEC_Biofuels_2013_report_FINAL.PDF
Pathway
Scenario
Upgrading in 4
reg. refineries First plants
2 reg. refineries
+ Rotterdam full use first plants
Average production costs [EUR/t] 1661 1635 1658 2381 2699
Average production costs [EUR/L] 1.40 1.38 1.40 1.80 2.04
Local added value [million EUR/a] 960 444 1040 2490 176
Av. feedstock procurement ratio [%] 37 17 52 60 4
Fuel amount [t/a] 531,000 263,000 803,000 970,000 65,300
Blend in transport fuel [%] 3.4% 1.7% 5.1% 6.2% 0.4%
GHG-avoidance [%] 81 81 81 80 80
Contribution to 6% GHG-avoidance target [%] 50 0 1 1 0
GHG-avoidance costs [EUR/t] 505 495 504 630 728
Forest residues-CP-transport fuel Straw-FP-synfuel
D 9.6
58
support market introduction of CP- and FP-biofuel. With regard to the 15.7 million
tonnes fuel consumption in the study area an amount of 330,000 t fuel with a GHG-
avoidance of about 80% would fill the gap. The optimisation model calculates the fuel
production costs of the CP-value chain to about 1.25 EUR/L gasoline and 1.4 EUR/l
diesel according to the production slate of the refinery and about 1.8 EUR/L gasoline
from the FP-value chain.
The following wholesale prices and legal conditions were observed in March 2016 in
Germany, which has implemented a GHG-emission reduction target of 3.5%:
A price of 0.26 EUR/L fossil fuel at a rate of 1.12 USD/EUR
465 EUR/m³ for RED Ethanol T2 fob Rotterdam
665 EUR/m³ for FAME biodiesel free German producer9
An energy tax of 450.3 EUR/m³ diesel and 655 EUR/m³ gasoline
VAT of 19%
A penalty of 470 EUR for every tonne CO2-emission, which exceeds the GHG-reduction target
Adjustment for energy content (e.g. E10 only 96% compared to pure fossil)
Exclusion of costs for logistic to filling station, marketing and profit (about 0.1 to 0.15 EUR/l)
Using these conditions but a GHG-emission reduction target of 6%, CP-diesel would
cost 0.95 EUR/l which is somewhat above the costs of 0.91 EUR/L for B7-diesel. For
comparison a purely fossil diesel would cost 1.18 EUR/l due to a CO2-penalty of 44.8
EUR/m³. The gasoline prices would be 1.16 EUR/L for E10-gasoline, which is slightly
below the 1.17 for CP-gasoline and the 1.22 for FP-gasoline. The CO2-penalty for
purely fossil gasoline would be 76.8 EUR/m³ leading to a retail price of 1.18 EUR/l.
Altogether, the first generation biofuels compensate the somewhat lower GHG-
avoidance by lower purchase costs but the CP-fuel is more economic than paying the
CO2-penalty. FP-gasoline is at the currently low price for the fossil base fuel not
competitive. The break even is calculated to be at about 0.75 EUR/L gasoline or 110
USD per barrel Brent crude, a price exceeded sometimes in the past. To be
competitive to the CO2-penalty it would have to cost 1.31 EUR per litre.
Two issues which influence the production costs were remarked in the preparation of
this study:
1. The operation costs of the decentral and central plants have no scaling exponent. It was estimated that such an exponent would reduce the production costs by about one quarter.
2. Both pathways are net-producers of renewable electricity. The EC-Renewable Energy Directive foresees to take this side product into account but the calculation carried out in the BioBoost project (Del 6.4) has 100% of the GHG-
9 http://www.cmegroup.com/trading/energy/, http://www.ufop.de/biodiesel-und-co/biodiesel-preis/

D 9.6
59
emissions on the biofuel production. If 5.71 g CO2-equivalents are credited per MJ of net excess power (RED default value for a straw fired power plant) the GHG-intensity of e.g. the FP-pathway drops by 0.76 g/MJ or 5%.
Although the biofuel production costs are high, it has to be remarked that a high
share is paid in the study area as loan to workers and as income to farmers and
forest owners for the biomass. Another high share (FP-35%; CP-30%) is depreciation
for the equipment supposedly sourced from countries of the European Community.
Disregarding the construction costs 55% of the added value of the FP-pathway
occurs at the rural areas supplying the straw, 21% in regions with FP-plants and 24%
in regions with the central fuel production plants. For the CP-pathway, 50% of the
added value goes to rural areas supplying forest residues, and each 25% to regions
hosting the CP-plants and the refineries. In contrast, the product price of the fossil
fuel (before consumer taxes) is composed to about 75% of fees and royalties to the
crude oil supplying countries.
However, the pathways described in this case study are not yet commercially
available. The FP-value chain is demonstrated at the Karlsruhe Institute of
Technology on a level of 2 to 5 MW (TRL 7), the CP-value chain is at small pilot scale
(TRL4-5) at CERTH (Centre for Research and Technology Hellas), Royal DSM (The
Netherlands) and Neste (Finland). Further efforts for development and
precommercial demonstration have to be spent in order to bring these technologies
to the market.

D 9.6
60
7. The case study conclusions
1. In the study area the available and sustainable exploitable potential of straw and forest residues amounts to 300 PJ or 7.1 million tonnes oil equivalent per year.
2. Fully implemented the CP- and FP-biofuel value chains converts about 50% of the available straw and forest residue biomass to 1.5 million tonnes of transport fuel.
3. The synthetic gasoline of the FP-value chain and the CP-biofuel are drop-in fuels and can be blended in high shares with fossil fuel without impacting engine performance or consumption.
4. The CP- and FP-biofuel potential covers about 10% of the annual transport fuel demand in the study area.
5. At a GHG-avoidance of about 80% and assuming local consumption of the CP- and FP-biofuels the CO2-emissions of the transport sector would be reduced by 7.7 %. This is 25% more than required by the present regulations.
6. At today’s price levels, blends in line with the GHG-reduction target for 2020 would costs 0.01 to 0.06 EUR/L more that respective RME- or ethanol-blends. Today such a B10 (RME) or E11(Ethanol 1. Gen.) fuel is not in line with the fuel specifications.
7. The total turnover amounts to 3.500 million EUR per year. About 1/3 is depreciation for the decentral and central plants, 1/3 is for operation of the conversion plants and 1/3 goes to the rural areas supplying the straw and forest residue feedstock.
8. The investment required for full implementation of the CP- and FP-value chains in the study area amounts to about 23 billion EUR. Specific measures to support and back these investments would be needed.
9. The conversion technology of both, the CP- and FP-value chain is currently not commercial available. Further efforts for development and demonstration of these technologies are needed prior to commercialisation.

D 9.6
61
List of Figures
Figure 1 Location of the case study area (highlighted) in Germany and Poland. Large
NUTS 3 regions were split up to areas of less than 7500 km² (thin
straight lines) to increase the performance of the optimisation model.
Locations of refineries relevant for the study area are indicated by red
dots. ......................................................................................................... 9
Figure 2. Utilised agricultural area (sources: Eurostat) ............................................. 11
Figure 3. Arable land (sources: Eurostat) ................................................................. 11
Figure 4 Farm structure (sources: Eurostat) ............................................................. 12
Figure 5. Development of cereals production area given in hectare [ha] in the study
area regions (sources: Eurostat) ........................................................... 13
Figure 6. Theoretical potential of straw. .................................................................... 14
Figure 7: Share of each type of cereal on the sustainably available straw ............... 15
Figure 8. Livestock in case study area ..................................................................... 15
Figure 9. Technical potential of straw. ...................................................................... 16
Figure 10. Technical potential of wheat straw. .......................................................... 16
Figure 11. Technical potential of barley straw. ......................................................... 17
Figure 12. Technical potential of maize straw. .......................................................... 17
Figure 13.Theoretical forestry residues potentials .................................................... 19
Figure 14. Technically available forestry residue potential ....................................... 20
Figure 15: The bioliq pilot plant at the KIT in Karlsruhe, Germany, has a straw
pyrolysis unit of 500 kg/h (2 MW) with bioslurry preparation, an high
pressure, entrained flow gasifier with a capacity of 1 t/h bioslurry (5 MW)
with hot gas cleaning and fuel synthesis unit operating at 55 bar.
Copyright: Karlsruhe Institute of Technology ......................................... 24
Figure 16 Sankey-diagram on energy flows of a design-size (100 MW) catalytic fast
pyrolysis plant and respective upgrading capacity in a refinery (67.7 MW
instead of design size 260 MW). Numbers indicate the energy flow in
MW. Transport efforts are given for reference case. Colour code: Green-
biomass; blue-FP-biosyncrude; red-transport fuel; orange-power (S.
Kühner, SYNCOM) ................................................................................ 25
Figure 17 The Fast Pyrolysis reference pathway as studied in the BioBoost-project.
(S. Rotter, FHOÖ) .................................................................................. 26
Figure 18: Sankey-diagram on energy flows of a design-size (100 MW) catalytic fast
pyrolysis plant and respective upgrading capacity in a refinery (67.7 MW
instead of design size 260 MW). Numbers indicate the energy flow in
MW. Transport efforts are given for reference case. Colour code: Green-
biomass; blue-FP-biosyncrude; red-transport fuel; orange-power, pink-
natural/combustible gas (S. Kühner, SYNCOM) .................................... 29
Figure 19. The description of a biomass value chain (reference pathway) for catalytic
fast pyrolysis in the BioBoost-project (S. Rotter, FHOÖ). ...................... 30
D 9.6
62
Figure 20. General description of the BioBoost process with depots, decentral
conversion and central conversion (Erik Pitzer, Gabriel Kronberger,
FHOÖ, 2013). ........................................................................................ 32
Figure 21: The feedstock prices (y-axis) depend on degree of utilization (x-axis).
Increasing prices were assumed, if more than 50% of the available
residue and waste feedstock is marketed. ............................................. 34
Figure 22: Range of plant capacity in terms of tonnes feedstock conversion capacity
per year and respective dependence of production costs per unit of
product. .................................................................................................. 36
Figure 23: Regions with CP-plants and their size in tonnes forestry residues
conversion capacity per year (green-290,000 t/a; orange-533,000 t/a).
Forest residue procurement is indicated by the blue arrows, red arrows
indicate biooil transport for upgrading at existing refineries. Total
transport fuel production costs and amounts are given for the refineries
as yielded in this best of 6 parallel optimisation runs. ............................ 38
Figure 24: Regional forest residue utilisation in best run. Blue shading: 5-20%; green:
40-60%, red: 100% utilisation; blue arrows: forest residue transport to
CP-plant; red arrow: biooil transport to refinery. .................................... 39
Figure 25: Composition of fuel production costs and amount of Catalytic Pyrolysis-
based transport fuel in the four refineries of the case study area. ......... 39
Figure 26: Added value in the regions of the study area. Blue shading: Up to 11
MEUR/a; green: 40 to 60 MEUR/a; yellow: 80 – 90 MEUR/a; red: 110
MEUR/a ................................................................................................. 40
Figure 27: Forest residue transport costs in a comparable ‘stand alone’-concept.
Forest residues are supplied to CPs located at the refinery sites. The
maximum transport cost (red) is at 64 EUR/t forest residues, minimum is
5 to 10 EUR/t. ........................................................................................ 41
Figure 28: Composition of production costs in a scenario of catalytic pyrolysis on site
of the refinery. ........................................................................................ 42
Figure 29: CP-plants in Slupski and Poznan and biooil upgrading in the Plock-refinery
is the most cost-effective implementation of the Catalytic Pyrolysis to
transport fuel-pathway in the study area. An even better site for a CP-
plant is in the Gorzowski area, upgrading of its oil would be most cost-
effective in the Schwedt-refinery near-by. Green shading: 40-60%
forestry residue utilisation; Blue arrows: forest residue transport to CP-
plant; Red arrow: biooil transport to refinery. ......................................... 44
Figure 30: Increase of transport fuel production from Catalytic Pyrolysis by supply of
biooil for upgrading to Rotterdam. Regions with CP-plants are coloured
according to biooil production costs (yellow-714 EUR/t; red-807 EUR/t).
Forest residue procurement is indicated by the blue arrows, red arrows
indicate biooil transport for upgrading at existing refineries. Total
transport fuel production costs and amounts are given for the refineries
as yielded in this best of 6 parallel optimisation runs. ............................ 45

D 9.6
63
Figure 31: Composition of production costs and amount of Catalytic Pyrolysis-based
transport fuel in a scenario foreseeing increase of fuel production by
biooil export to Rotterdam. ..................................................................... 45
Figure 32: Added value in the regions of the study area. Heavy blue shading: 0.2 to 9
million EUR/a; light blue: 35 - 65 MEUR/a; green: 82 to 107 MEUR/a;
red: 290 MEUR/a ................................................................................... 46
Figure 33: Fuel production from Catalytic Pyrolysis and supply of surplus biooil for
upgrading to Rotterdam. Regions with CP-plants are coloured according
to biooil production costs (yellow-714 EUR/t; red-807 EUR/t). Forest
residue procurement is indicated by the blue arrows, red arrows indicate
biooil transport for upgrading at existing refineries. Total transport fuel
production costs and amounts are given for the refineries. ................... 47
Figure 34: Composition of production costs and amount of Catalytic Pyrolysis-based
transport fuel in a scenario foreseeing increase of fuel production by
export of surplus biooil to Rotterdam. .................................................... 47
Figure 35: Added value in the regions of the study area. Heavy blue shading: 1 to 10
million EUR/a; cyan: 35 MEUR/a; green: 60 to 110 MEUR/a; orange: 153
MEUR/a ................................................................................................. 48
Figure 36: Straw transport (blue arrow) to Fast Pyrolysis plants and biosyncrude
transport (red arrow) to central synfuel plants in the study area. The
shading shows the straw density in tonnes per hectare total surface area
and year. Red shading: 2 t/ha*a; yellow: 1.5 t/ha*a; bright green: 1 t/ha*a;
light blue: 0.3 t/ha*a. .............................................................................. 49
Figure 37: Straw price free FP-plant. Beige: 60 EUR/t; heavy orange: 68 EUR/t. .... 50
Figure 38: Distance of straw transport (blue arrow). Red: 183 km; yellow: 140 km;
green: 100 km; blue: 35 km. .................................................................. 51
Figure 39: FP-plant straw conversion capacity. Yellow shading: 550,000 t/a; red:
660,000 t/a. ............................................................................................ 51
Figure 40: Biosyncrude conversion capacity of the central synfuel plants. Yellow: 2.87
million tonnes per year; red: 3.67 million tonnes per year...................... 52
Figure 41: Local added value generated on the FP-synfuel value chain. Red:
Potsdam synfuel plant, 587 MEUR/a; orange: Wloclawski FP and synfuel
plant, 526 MEUR/a; light blue: FP-plants 47 to 74 MEUR/a; heavy blue:
straw supplying regions, up to 19 MEUR/a ............................................ 53
Figure 42: Composition of production cost of straw - Fast Pyrolysis-based synthetic
transportation fuel in the study area. ..................................................... 54
Figure 43: Regions of comparable competitiveness for the first plants of the Fast
Pyrolysis value chain from straw to synfuel. Blue arrows indicate straw
transport, shading indicates biosyncrude production costs between 221
and 223 EUR/t. ...................................................................................... 55
Figure 44 Composition of synfuel production cost of straw - fast pyrolysis - synthetic
transportation fuel value chain in the study area. .................................. 55

D 9.6
64
Figure 45: Straw amounts transported from the regions to the central pyrolysis and
upgrading plants in sensitivity study. Blue: up to 75,000 t/a; green:
75,000 to 200,000 t/a; yellow: 200,000 to 300,000 t/a; red: 340,000 t/a. 56
List of Tables
Table 1: Name and NUTS of the entities in the study area. Plock was added due to
its importance for the study area. ................................................................ 9
Table 2 Technical potential of straw and forestry residues in case study area ......... 20
Table 3 The biomass value chain for Fast pyrolysis (BioBoost reference pathway).
.................................................................................................................. 26
Table 4 The biomass value chain catalytic fast pyrolysis. Shaded in grey is an
optional intermediate storage in a biomass center. ................................... 31
Table 5: Overview on technical parameters of the plants of the two conversion
pathways ................................................................................................... 35
Table 6: Comparison of parameters of the staged process with biooil transport to the
sensitivity study of Catalytic Pyrolysis on-site of the refinery. .................... 41
Table 7: Overview on key results of the main scenarios of the CP-value chain. ....... 46
Table 8: Overview on optimisation results for the two advanced biofuel production
pathways in the study area. Avoidance costs were calculated as difference
to the price of fossil fuels (0.26 EUR/l gasoline and 0.27 EUR/l diesel based
on CIF-NWE rates of 16.03.2016) ............................................................. 57

D 9.6
65
Contact:
Institute of Soil Science and Plant Cultivation (IUNG)
Dept.of Bioeconomy and Systems Analysis
Czartoryskich 8 Str.,
24-100 Pulawy,
Poland
Magdalena Borzecka-Walker
+488814786761
SYNCOM Forschungs und Entwicklungsberatung GmbH
Am Steinacker 16
27777 Ganderkesee
Germany
Dr. Simon Kühner
+49 4222 947988-3
Acknowledgement:
The authors like to gratefully acknowledge the support of The University of Applied Science Upper Austria, Erik Pitzer and Gabriel Kronberger in programming support of the BioBoost plugin as well as the financial support of the European Commission within the S2Biom Project.