Embed Size (px)
Citation preview

1
CASE STUDY: CUSTOMER EVALUATIONS OF INTERIOR DESIGN ELEMENTS AND MARKETING FEATURES IN AN UPSCALE WOMEN’S APPAREL BOUTIQUE
By
LAUREN N. ANDERSON
A THESIS PRESENTED TO THE GRADUATE SCHOOL OF THE UNIVERSITY OF FLORIDA IN PARTIAL FULFILLMENT
OF THE REQUIREMENTS FOR THE DEGREE OF MASTER OF INTERIOR DESIGN
UNIVERSITY OF FLORIDA
2007

2
© 2007 Lauren N. Anderson

3
To my mother, Susan M. Beauchamp, for teaching me strength, wisdom, passion, leadership, and, most importantly - to love unconditionally

4
ACKNOWLEDGMENTS
I would like to thank Dr. Bart Weitz for participating on my committee and taking an
interest in this study. I am fascinated by the compelling influences marketing has on business
success and how these can be further augmented by the in-store experience. Dr. Weitz’s
statistical methods knowledge and retail management expertise were instrumental in developing
the foundation of this study. Additionally, his business insight enabled me to bridge the gap
between a marketing undergraduate degree and the interior design focus of my current degree.
I would also like to thank Karly Childers for playing a very important role in the
completion of this study—the permission to carry out the entire study in her boutique. Karly
contributed a significant amount of money and time to this cause, not to mention her trust. I am
most appreciative to have been given such an unbelievable opportunity!
And, David, my saving grace, I am absolutely certain I could not have done this without
him—dog-duty, countless ‘thesis’ weekends, presentation run-throughs, retail fact queries, and,
of course, continual encouragement, support, laughter, and love.
Finally, I would like to thank Dr. Debra Harris. As my committee chair person, Dr. Harris
demonstrated commitment, knowledge, interest, patience, and most of all—support. She was
always accessible; frequently, choosing to put her own priorities on hold in order to help me out.
I am so thankful to have had her as a professor and mentor, but even more so, as a friend.

5
TABLE OF CONTENTS page
ACKNOWLEDGMENTS ...............................................................................................................4
LIST OF TABLES...........................................................................................................................7
LIST OF FIGURES .........................................................................................................................8
ABSTRACT.....................................................................................................................................9
CHAPTER
1 INTRODUCTION AND LITERATURE REVIEW ..............................................................11
Background.............................................................................................................................11 Purpose & Significance of the Study......................................................................................12 Literature Review ...................................................................................................................14
Female Apparel Boutique Retailers/Shoppers.................................................................15 Total Store Environment .................................................................................................16 Shopping Experience.......................................................................................................20 Consumer Behavior .........................................................................................................21 Theory and Methods........................................................................................................22
2 METHODOLOGY .................................................................................................................27
Case Study Research...............................................................................................................27 Variables of Interest ........................................................................................................27 Observation......................................................................................................................28 Experimental Study. ........................................................................................................30 Data Collection Tool .......................................................................................................35
Likert-Scales ...........................................................................................................................36 Participant Sampling...............................................................................................................36 Summary.................................................................................................................................37
3 STATISTICAL ANALYSIS AND RESULTS ......................................................................38
Descriptive Statistics ..............................................................................................................38 Descriptive Characteristics of the Sample.......................................................................38 Evaluation of Store Environment ....................................................................................41 Correlation.......................................................................................................................47 Analysis of Variance .......................................................................................................48
4 DISCUSSION.........................................................................................................................51
Evaluation of Design Elements ..............................................................................................51 Atmosphere......................................................................................................................52

6
Style/Design. ...................................................................................................................54 Color Scheme. .................................................................................................................54 Lighting. ..........................................................................................................................55
Evaluation of Non-Design Elements ......................................................................................56 Mood................................................................................................................................57 Location...........................................................................................................................57 Product Variety................................................................................................................58 Customer Service.............................................................................................................58
Evaluation of Extraneous Variables .......................................................................................58 Demographics .........................................................................................................................59
5 CONCLUSION.......................................................................................................................61
Findings ..................................................................................................................................61 Limitations of the Research ....................................................................................................62 Implications for Research Findings ........................................................................................64 Directions for Further Research..............................................................................................65
Importance of Design Elements ......................................................................................65 Customer Preference of Boutique Design .......................................................................66
Conclusions.............................................................................................................................67
APPENDIX
A FOOTPRINT OF ORIGINAL BOUTIQUE LAYOUT.........................................................69
B PHOTOGRAPHS OF THE EXISTING BOUTIQUE’S INTERIOR ENVIRONMENT......70
C PHOTOGRAPHS OF THE BOUTIQUE’S DESIGN MODIFICATIONS ...........................74
D DATA COLLECTION TOOL ...............................................................................................79
E INFORMED CONSENT DOCUMENT ................................................................................80
F INTSTITUTIONAL REVIEW BOARD................................................................................82
LIST OF REFERENCES...............................................................................................................83
BIOGRAPHICAL SKETCH .........................................................................................................88

7
LIST OF TABLES
Table page 3-1 Demographics - Age ..........................................................................................................39
3-3 Demographics – Preferred Time of Day to Shop...............................................................40
3-4 Demographics – Social Influences.....................................................................................40
3-5 Customer Loyalty Composite ............................................................................................41
3-6 Shopper Mood Evaluation .................................................................................................42
3-7 Store Location Evaluation..................................................................................................42
3-8 Store Atmosphere Evaluation ............................................................................................42
3-9 Store Design Evaluation ....................................................................................................43
3-10 Color Scheme Evaluation ..................................................................................................43
3-11 General Store Lighting Evaluation ....................................................................................43
3-12 Fitting Room Lighting Evaluation .....................................................................................44
3-13 Product Variety Evaluation................................................................................................44
3-14 Customer Service Evaluation.............................................................................................44
3-15 Shopping Experience Evaluation.......................................................................................45
3-16 Propensity to Buy Environmentally Sensitive Clothing ....................................................45
3-17 Shopping Frequency at the Boutique.................................................................................46
3-18 Purchase Volume of Discounted Product ..........................................................................46
3-19 Boutique Recommendation to Friends...............................................................................47
3-20 Correlations – Store Attributes and Customer Loyalty Composite ...................................47
3-21 ANOVA – Respondents’ Shopping Intentions Effect on Customer Loyalty ....................48
3-22 ANOVA – Preferred Time of Day to Shop Effect on Customer Loyalty..........................49
3-23 ANOVA – Social Influences Effect on Customer Loyalty................................................49
3-24 ANOVA – Age Effect on Customer Loyalty.....................................................................49

8
LIST OF FIGURES
Figure page B-1 Existing Store Entry Right Side.........................................................................................70
B-2 Existing Store Entry Left Side ...........................................................................................70
B-3 Existing Store Cash Wrap..................................................................................................71
B-4 Existing Store Line-of-Sight ..............................................................................................71
B-5 Existing Store Denim Area ................................................................................................72
B-6 Existing Store Jewelry Display..........................................................................................72
B-7 Existing Store Displays......................................................................................................73
B-8 Existing Store-Displays .....................................................................................................73
C-1 Modified Store, Entry Right Side ......................................................................................74
C-2 Modified Store, Entry Left Side.........................................................................................74
C-3 Modified Store, Cash Wrap ...............................................................................................75
C-4 Modified Store, Line-of-Sight ...........................................................................................75
C-5 Modified Store, Denim Area..............................................................................................76
C-6 Modified Store, Jewelry Display .......................................................................................76
C-7 Modified Store, Displays ...................................................................................................77
C-8 Modified Store, Displays ...................................................................................................77
C-9 Modified Store, Alternate View.........................................................................................78
C-10 Modified Store, Alternate View.........................................................................................78
9
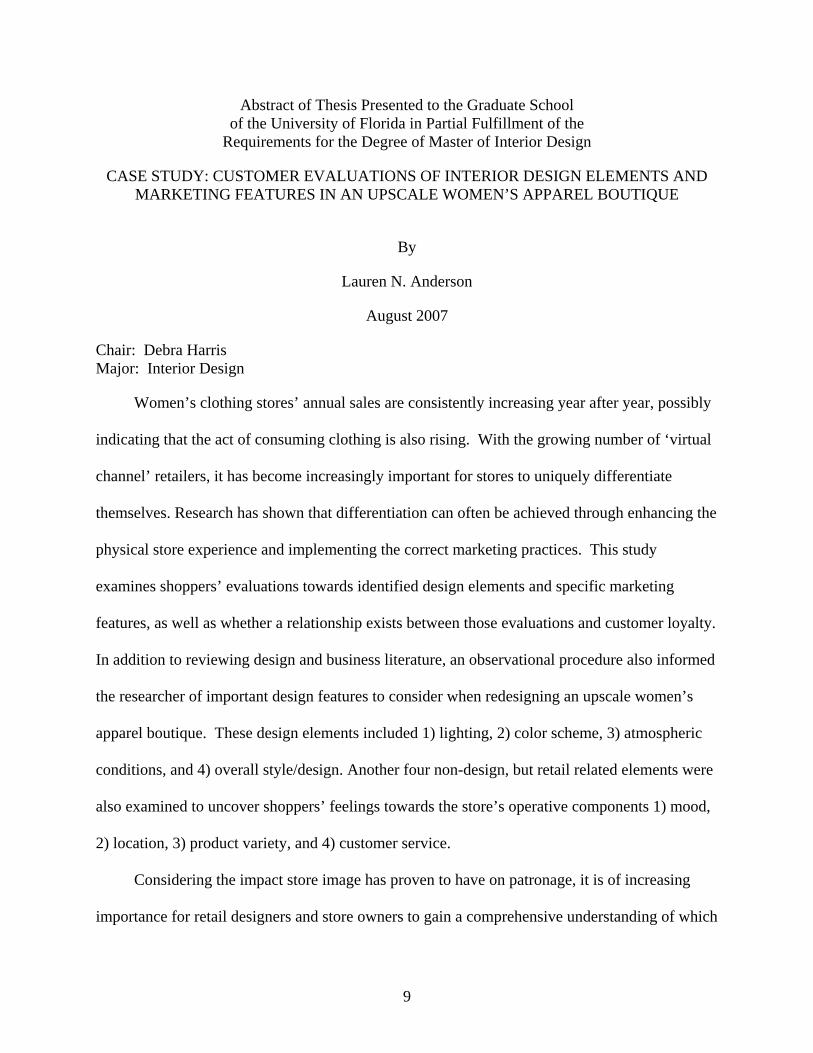
Abstract of Thesis Presented to the Graduate School of the University of Florida in Partial Fulfillment of the
Requirements for the Degree of Master of Interior Design
CASE STUDY: CUSTOMER EVALUATIONS OF INTERIOR DESIGN ELEMENTS AND MARKETING FEATURES IN AN UPSCALE WOMEN’S APPAREL BOUTIQUE
By
Lauren N. Anderson
August 2007
Chair: Debra Harris Major: Interior Design
Women’s clothing stores’ annual sales are consistently increasing year after year, possibly
indicating that the act of consuming clothing is also rising. With the growing number of ‘virtual
channel’ retailers, it has become increasingly important for stores to uniquely differentiate
themselves. Research has shown that differentiation can often be achieved through enhancing the
physical store experience and implementing the correct marketing practices. This study
examines shoppers’ evaluations towards identified design elements and specific marketing
features, as well as whether a relationship exists between those evaluations and customer loyalty.
In addition to reviewing design and business literature, an observational procedure also informed
the researcher of important design features to consider when redesigning an upscale women’s
apparel boutique. These design elements included 1) lighting, 2) color scheme, 3) atmospheric
conditions, and 4) overall style/design. Another four non-design, but retail related elements were
also examined to uncover shoppers’ feelings towards the store’s operative components 1) mood,
2) location, 3) product variety, and 4) customer service.
Considering the impact store image has proven to have on patronage, it is of increasing
importance for retail designers and store owners to gain a comprehensive understanding of which

10
factors influence consumers’ store selections, buying decisions, and loyalty considerations.
Knowledge of which factors can positively influence a store’s physical environment and what
variations of these features encourage pleasurable reactions amongst shoppers will enable
designers and retailers to have a more powerful repository of evidence-based design solutions.
The three sectors that stand to benefit from this research are 1) the retail industry; 2) retail
consumers, and specifically, boutique consumers; and 3) retail design professionals. The
implications of specific design styles and merchandising techniques on shoppers’ perceptions of
total store environment can assist designers when specifying the appropriate features for a
upscale, women’s apparel boutique. Additionally, the shoppers’ positive evaluations of
alternative merchandising scenarios and unique product display techniques offer design
alternatives to store planners and retail storeowners.
Apparel boutique shoppers were asked to evaluate store design and other various business
operatives on a questionnaire. After the data was collected, descriptive statistics, correlations,
and an ANOVA analysis were run. Positive evaluations were reported across all elements, but
were not shown to be statistically significant, due to a small sample size and a lack of variation
across the data. This skewed data was likely a result of a pre-existing, high-loyalty rating
amongst all the participants, as they were to have visited the store prior to this experience in
order to qualify to participate. As a result, it is postulated that these shoppers already had an
affinity to the store because they came back. Despite the lack of variance, participants reported
shopping mainly for leisurely intents and preferred shopping between the hours of 2–4pm.
Additionally, it was found that those aged 31–40 were the most loyal customers in this case.
Interestingly though, the vast majority of participants were aged 18–22.

11
CHAPTER 1 INTRODUCTION AND LITERATURE REVIEW
Background
The history of a typical American retail store dates back as far as the late 1700s (Jones,
1936). This classic retail store was commonly referred to as a general store that offered a variety
of non-departmentalized goods, ranging from glassware and hardware to groceries and dry goods
(Jones, 1936). As the U.S. population grew and the country became wealthier, a desire to
improve the American home and lifestyle emerged. In response, American retailers began to
specialize in certain products and services, enabling shop owners to offer consumers a more
diversified selection of goods and services within a specific domain (Jones, 1936). Apparel
retailers were no strangers to this growing market segment and followed suit when they began
forming specialty shops in the 1850s with an emphasis on ready-to-wear clothing (Jones, 1936).
One researcher (Jones, 1936) defined specialty shops as “retail stores that handle only one type
of merchandise” (pg.134). Women’s contemporary clothing sold in an upscale boutique is an
example of this form of specialty shop.
The U.S. Census Bureau’s 2005 Retail Trade Survey indicated that women’s clothing
stores’ annual sales have increased 24% since 1998 (U.S. Census Bureau, 2005). This statistic
inherently supports the notion that the act of consuming clothing has also risen. In today’s
techno-savvy world, the shopping environment can entail more than a physical place making it
increasingly difficult for retailers to differentiate solely on the basis of merchandise (Baker,
Levy, & Grewal, 1992; Paulins & Geistfeld, 2003). Retailers and marketers are progressively
exposing themselves to consumers through methods of Internet sites, television infomercials,
telemarketing calls, and direct mails (Ng, 2002; Paulins & Geistfeld, 2003). Consequently, the
convenience and variety offered through these ‘virtual channels’ might present a challenge to

12
storefront retailers who sell their goods solely through a physical location (Paulins & Geistfeld,
2003). Furthermore, it is likely these storefront retailers endure large overhead costs, as well as
product selection limitations due to space and budget constraints. As a result, various
researchers (Baker et al.., 1992; Ng, 2002, Paulins & Geistfeld, 2003) postulate that by
enhancing the physical store experience, storefront retailers can set themselves apart from their
virtual competitors, as well as their physical store counterparts.
Several consumer behaviorists (Kunkel & Berry, 1968; Lindquist, 1974–5) regard the
phenomenological concept of store image to play an influential role on customer patronage.
Store image, as described by one researcher (Kunkel & Berry, 1968), is “the total conceptualized
or expected reinforcement that a person associates with shopping at a particular store” (p. 22).
Thus, it may be of increasing importance for storefront retailers to establish and maintain
favorable total store image, and quite possibly, this positive reinforcement can begin with the
design of the interior space.
Purpose & Significance of the Study
The purpose of this research was to test the impact of the physical environment on shopper
perceptions, preferences, and behaviors. Also examined was the boutique’s current marketing
strategy. Throughout history, the complex nature of store image and its affects on consumer
behavior has churned much question; causing researchers to closely dissect and further examine
the topic (Boulding, 1956; Donovan, Rossiter, Marcoolyn & Nesdlae, 1994; Lindquist, 1974–5).
As technology continues to grow and store image becomes even more challenging (i.e., retailers
extending themselves to the World Wide Web), it has become increasingly important for
physical stores to place a greater emphasis on the in-store experience in order to capture
adequate market share (Howell, 2002). An example supporting this principle was revealed in a
study that found consumers’ viewpoints regarding the physical appeal of a store had a greater

13
connection to patronage decisions than did the actual merchandise, price points, and product
variety (Darden, Erdem & Darden, 1983).
Apparel industry specialists have often regarded fashion, specifically clothing, as a means
of self-expression (Women’s Wear Daily, 2006). Moreover, consumer behaviorists and research
professionals have long suggested that a social meaning is associated with the clothing
consumption process (O’ Cass & Julian, 2001; Deeter-Schmelz, Moore & Goebel, 2000), and
particularly so with women (Dowling, 1993). One researcher described consumption as
“activities surrounding the purchase and use of commodities central to the lives of women and
the constitution of femininity” (Dowling, pg. 295,1993). Demographic reports of two Florida
Counties - Alachua and Hillsborough - revealed that the largest percentage of consumer apparel
expenditures was applied towards women’s clothing (Experian/Applied Geographic Solutions,
2005). This statistic lends support to the notion that if informed design is implemented in a
women’s clothing boutique or other types of female based retail stores, it is probable that
increased revenues can be earned.
A number of marketers and social scientists have emphasized that consumption often goes
beyond merely acquiring commodities, but rather defines shopping as a means of expression and
a tool for seeking pleasure (Fiske, 1989; Mort, 1989; Dowling, 1993). Previous studies
(Dowling, 1993; Deeter-Schmelz et al., 2000) have stressed the importance of the creation of
place in which the goods are consumed or acquired. Ultimately, a social connotation becomes
assigned to the place where merchandise is sold (Dowling, 1993). In essence, the store
environment plays a critical role in defining the social meaning the shopper will likely attribute
to their shopping experience in a given place. The creation of the store environment and its
14
ability to ascribe cultural meaning to the shopper’s contextual interpretation may very well sculpt
the retailers overall reputation and store image.
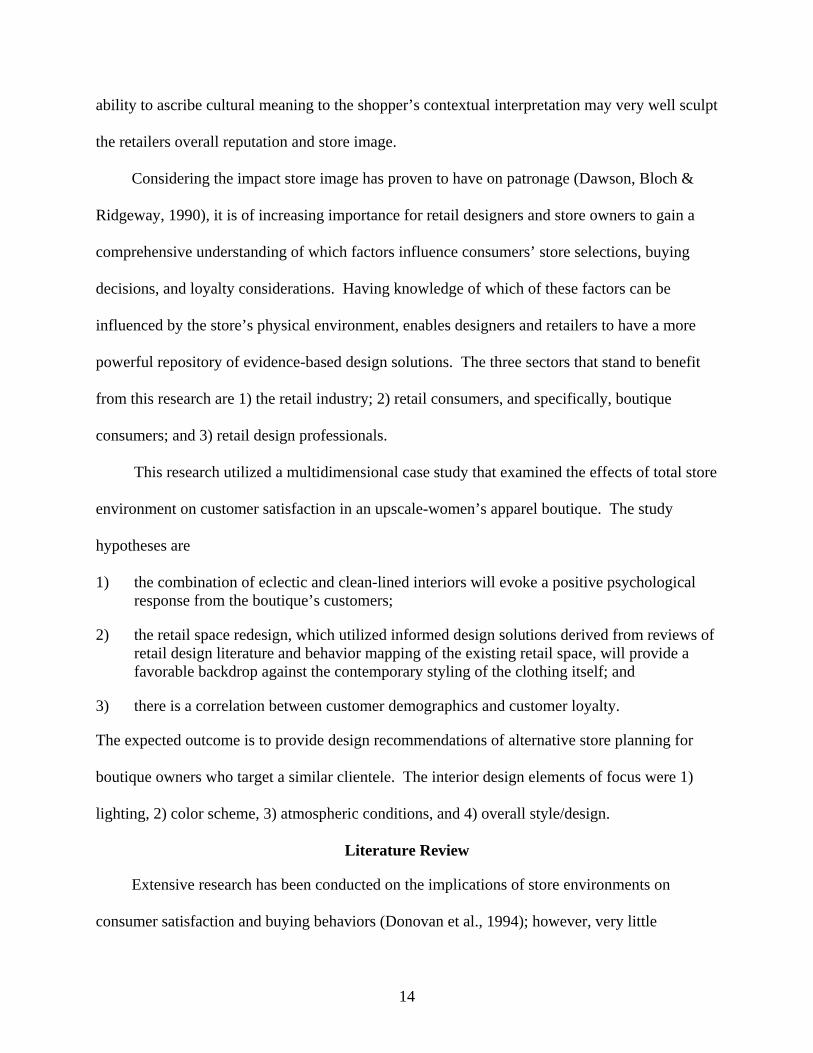
Considering the impact store image has proven to have on patronage (Dawson, Bloch &
Ridgeway, 1990), it is of increasing importance for retail designers and store owners to gain a
comprehensive understanding of which factors influence consumers’ store selections, buying
decisions, and loyalty considerations. Having knowledge of which of these factors can be
influenced by the store’s physical environment, enables designers and retailers to have a more
powerful repository of evidence-based design solutions. The three sectors that stand to benefit
from this research are 1) the retail industry; 2) retail consumers, and specifically, boutique
consumers; and 3) retail design professionals.
This research utilized a multidimensional case study that examined the effects of total store
environment on customer satisfaction in an upscale-women’s apparel boutique. The study
hypotheses are
1) the combination of eclectic and clean-lined interiors will evoke a positive psychological response from the boutique’s customers;
2) the retail space redesign, which utilized informed design solutions derived from reviews of retail design literature and behavior mapping of the existing retail space, will provide a favorable backdrop against the contemporary styling of the clothing itself; and
3) there is a correlation between customer demographics and customer loyalty.
The expected outcome is to provide design recommendations of alternative store planning for
boutique owners who target a similar clientele. The interior design elements of focus were 1)
lighting, 2) color scheme, 3) atmospheric conditions, and 4) overall style/design.
Literature Review
Extensive research has been conducted on the implications of store environments on
consumer satisfaction and buying behaviors (Donovan et al., 1994); however, very little

15
literature exists on the impact upscale-boutiques’ total store environments may have on
customers’ emotional responses and their prospective buying and loyalty decisions. The review
of literature is broken down into five main parts relevant to consumers’ evaluations of upscale
store environments 1) female apparel boutique retailers/shoppers; 2) total store environment; 3)
shopping experience; 4) consumer behavior; and 5) methodological practices.
Female Apparel Boutique Retailers/Shoppers
A boutique, or specialty shop, is typically an independently owned store with an emphasis
on product uniqueness and exceptional service (Bucklin, 1963). As an owner of a female apparel
boutique, the current study’s researcher describes the boutique philosophy as a retail business
that targets a niche market of women who shop for recreational and pleasure-seeking purposes.
The target audience of boutique retailers typically has a significant discretionary income and
often associates a social meaning to the places in which they shop (Kincade and Moye, 2003).
Additionally, the specialty shop customer generally desires a more sophisticated store
environment than that of the mall or discount store shopper and prefers clothing that is current
and fashionable (Kincade and Moye, 2003).
A study that examined store patronage and attitudes towards retail store environments
among female apparel consumers revealed that clientele of this retail segment were considered to
be more oriented with the community and were described as “more gregarious, likeable, and
active participants of society” (Kincade and Moye, pg. 61, 2003). The study also found that
customers falling under this niche-shopping category tended to be “competitive, venturesome
and self-confident” (Kincade and Moye, pg. 61, 2003).
Kincade and Moye (2003) proposed that boutique customers are typically recreational
shoppers who prefer a pleasurable store atmosphere with a vast selection of high-quality
merchandise. In addition, this type of shopper is likely to consume less time pondering over

16
purchases; make impulse purchases based on desire versus need; and spend more time shopping
even after purchases had been made (Kincade and Moye, 2003).
Total Store Environment
The total store environment is multifaceted, entailing a large number of factors that include
sensory cues (Ng, 2002), service quality, product variety, pricing, and image/social context
(Baker, Parasuraman, Grewal & Voss, 2002). In fact, in one study a researcher de-emphasized
the individual components of a store setting and reiterated the importance of the overall design
(Kotler, 1973). Marketing professionals and researchers have long employed the marketing mix
approach (product, place, promotion, and price) when developing and promoting product, brand,
or store images (Kotler, 1973; Engel, Blackwell & Miniard, 1995). This technique has proven
invaluable throughout history, but requires extensive amounts of time and exhaustive research
practices. Due to the limited timeframe and narrow scope, the study will focus primarily on the
‘place’ aspect of the marketing mix theory.
Store image. Several definitions exist on the topic of store image. In 1974, The Journal
of Retailing published a study by marketing professor, Jay Lindquist, entitled “Meaning of
Image”. The study examined the variety of store image descriptions that have been recorded by
several notable researchers (Lindquist, 1974–75). One researcher defined store image as “…the
way in which the store is defined in the shopper’s mind, partly by its functional qualities and
partly by an aura of psychological attributes” (Martineau, p.47, 1958). Martineau’s definition
suggests that consumers formulate an image of a retail store through functional properties (i.e.,
layout, merchandising techniques, prices, and other operational features), as well as
psychological properties (Lindquist, 1974–5). For example, does the space promote feelings of
friendliness, excitement, and comfort (Lindquist, 1974–75); or does it possibly even delineate a
social class distinction?

17
Another researcher who studied the correlation between television viewing and the
perception of store image and shopping frequency defined store image as, “…a complex of
meanings and relationships serving to characterize the store for people” (Arons, pg.1, 1961).
This assertion parallels consumer behaviorist, Kenneth Boulding’s (1956), claim that the nature
of humans is to assign symbolic interpretations to the vast complexity of values and meanings
(Arons, 1961). In these descriptions, meanings are outlined as the attributes or dimensions,
while relationships unify the various attributes together (Lindquist, 1974–5). In other words, an
upscale boutique may want its individual attributes of store design, merchandise, service
personnel, and pricing to collectively convey a store that represents sophistication, quality,
exclusiveness, and high-social class. This relationship between separate components and their
affect on the consumer’s perceived value of store image will likely impact the shopper’s
evaluation of the total store environment.
A different study that examined behaviors and their relationships to store image found that
image development occurs over time through the reinforcement of consumers’ pre-determined
criterion (Kunkel & Berry, 1968). Researchers, Kunkel and Berry, (1968) contended that
“...retail store image is the total conceptualized or expected reinforcement that a person
associates with shopping at a particular store” (pg. 22). While the development of a product or
brand requires reinforcement and constancy (Kunkel & Berry, 1968), the creation of positive
store image may also require the use of repetitive encouraging signals. It is then probable that
the use of applied design solutions that have been implemented in successful high fashion retail
settings may generate positive reinforcement signals and, consequently, facilitate a favorable
boutique store image in the eyes of consumers.

18
The perplexing nature of store image and its phenomenological properties are so rigorous
that the scope of the current study is far too limited to fully analyze the highly complicated topic.
Effectively, several researchers have agreed that store image is the combination of environmental
cues (functional attributes) and social cues (psychological attributes) that create consumer
perceptions and beliefs about a particular store. These consumer viewpoints are created over
time (Kincade and Moye, 2003); thus, they are often considered learned or conditioned
responses.
Store design. One very significant aspect of the creation of store image is the interior
design of the physical space (Baker et al., 1992). Sensory conditions, such as lighting, color,
temperature, noise, accessibility, layout, and overall style/mood, have a substantial influence on
the way a customer evaluates their experience and classifies the store image (Dowling, 1993).
Environmental stimuli are said to have a profound influence on consumers’ emotional states
affecting their evaluation and acceptance of a particular retail setting (Baker et al., 1992).
Several studies have examined individual atmospheric elements and the affects they have
on shoppers’ moods and behaviors. For instance, one group of researchers (Bellizzi, Crowley &
Hasty, 1983) studied the effects of color in store design. They found that certain colors attracted
people to retail displays and point-of-purchase stands (Bellizzi et al., 1983). Because of the
belief that color is exceptionally influential on humans’ moods and actions, the Blackfair Bridge
in England was repainted bright green from its original black in order to reduce the number of
suicides that have been attempted from the bridge (Hattwick, 1950).
Areni and Kim (1994) examined the impact of lighting on purchase behavior. In their field
experiment the researchers found that consumers were more likely to approach the merchandise
when the in-store lighting was bright versus when it was soft (Areni and Kim, 1994).

19
Order and complexity are interior design elements that may impact shoppers’ emotions and
purchase intentions (Gilboa and Rafaeli, 2003). Environmental complexity often involves visual
richness, ornamentation, assortment, and variety in an environment (Nasar, 2000). Complexity
results when there are more variables and an increased amount of richness is present within the
space (Nasar, 2000). Examples of complexity may include the implementation of an overall
eclectic design style; a variation of scales and proportions; a combination of freestanding
furniture and manufactured merchandise displays; or even a mixed use of materials.
Alternatively, the order of an environment is represented by coherence, organization,
appropriateness, and clarity (Nasar, 2000). Order within the retail environment may refer to the
layout, aisle widths; merchandise displays, signage and the ability to navigate easily. Order is
unique in that it has been shown to influence the human mind beyond that of complexity. For
example, if a space is perceived as overwhelmingly complex, but has significant order, the
overall evaluation is often positive (Berlyne, 1970). Whereas, a complex environment with little
order typically results in a negative evaluation (Berlyne, 1970).
Another very important feature of retail design is the fixtures that display the merchandise
(Kerfoot, Davies & Ward, 2003). A study that examined the creation of discernible retail brands
through visual merchandising found that although displays may not necessarily guarantee
purchase, they do make it four times as likely that a purchase will take place (Kerfoot et al.,
2003). An additional case study, which examined records from Woodwards, a century old
department store in Vancouver, found that visitors preferred simple and less elaborate fixtures
(Dowling, 1993). Dowling (1993) uncovered that this highly successful department store
“facilitated the creation of a clean, uncluttered, spacious and streamlined environment” (pg. 307).

20
The retailer intentionally manipulated the layout and merchandise placement in order to facilitate
a certain mode of shopping (Dowling, 1993).
Architectural design is important to today’s fashion savvy customer. Once famously
quoted by the renowned fashion designer, Coco Chanel, “Architecture is fashion – it’s a matter
of proportions.” Designs that are regarded as ‘architecturally rich’ typically contain a mixed use
of sophisticated materials; lavish furnishings; sculpted spatial features; and a variety of
pleasurable sensory cues (Donovan & Rossiter, 1982). Therefore, when environments,
particularly those involved in high fashion, are architecturally rich the retailer further conveys
their commitment to beauty and originality to the consumer.
As the United States moved past the Edwardian society principles of opulence and
grandeur, we shifted our expectations of beauty to something that reflected simplicity and
functionality. In the 1930s, cleanliness became a very significant motif (Dowling, 1993); and
unsurprisingly, this design feature still holds true in most retail stores today. Cleanliness lent
itself to minimalism and eventually the architecture and furniture of the Mid-Century Modern era
became a commercial space staple. This design era is most famously noted for its incredible
blend of form, function, and the use of ordinary materials to make extraordinary things. A
federal law during the early 1940s limited construction costs to two hundred dollars per year
prompting designers to create modular products that offered users great flexibility (Whiton &
Ambercrombie, 2002). Smooth surfaces, hard materials, neutral color palettes, unadorned
furnishings, and spacious layouts are some examples of mid-century design features; many of
which are frequently used in chic hotels and high-fashion retail stores today.
Shopping Experience.
Over the past several decades, retail environments have become responsible for not only
articulating the retailer’s image philosophy, but now, must also present a value proposition to the

21
consumer (Baker, Parasuraman, Grewal & Voss, 2002). Due to the variety of retailers
consumers can now choose from, the importance of conveying value and reason as to why they
should choose one store over another has escalated (Baker et al., 2002). Failure to implement
these important steps may result in severe consequences for the retailer, such as lost business or
inferior brand perception.
Many retailers are differentiating themselves by enhancing the in-store experience
(Donovan and Rossiter, 1982; Howell, 2002). For years, psychologists have agreed that
individuals have emotional responses to their physical environment (Ergolu, Machleit & Davis,
2001). Thus, the shopping environment directly affects the experience a consumer realizes in a
particular store setting. Additionally, the shopping environment may profoundly influence
consumers’ feelings and emotional reactions towards a store, clearly impacting the patronage and
loyalty decisions consumers may make (Ergolu et al., 2001).
Consumers engage in shopping activities for several reasons (Jones, 1936; Kincade and
Moye, 2003). These reasons range from simply obtaining household commodities, such as food
and cleaning supplies, to a more sophisticated process of acquiring luxury items not necessary to
the fundamentals of life (Jones, 1936). Research has shown that quite often luxury driven
purchases are facilitated through retail shops that evoke positive consumer emotions and include
a desirable social class connotation (Bucklin, 1963; Kincade and Moye, 2003).
Consumer Behavior
Researcher, Kenneth Boulding (1956), proposed that humans digest highly complicated
ideas by reducing them into manageable portions. Thus, a customer’s perceived store image of a
particular boutique is likely to elicit certain behavioral responses. This is an example of the
Mehrabian-Russell model used in a retail context (Donovan and Rossiter, 1982). Effectively, a
shopper interprets the store’s environmental stimuli (physical features), develops emotional

22
states (pleasure or arousal) from these cues, and then translates their emotions into
approach/avoidance behaviors, such as the willingness to buy (Donovan and Rossiter, 1982).
Pleasure induced by the store environment has been proven to have a positive correlation
with consumer satisfaction (Donovan and Rossiter, 1982). Favorable responses may include
positive word-of-mouth, repeat visits, and an increased amount of time spent in the store, which
research has shown often results in a greater likelihood to buy (Donovan and Rossiter, 1982).
Unfavorable responses may consist of negative word-of-mouth, lack of customer loyalty, and
reduced amount of time spent in the store.
Donovan and Rossiter’s (1982) study was fundamental to the retail environment’s body of
knowledge as it established validity in the connection between physical retail settings, emotional
states, and behavioral intentions (Baker et al., 1992). However, their study didn’t provide
retailers with what specific environmental factors influence general levels of satisfaction or
specific types of behaviors (Baker et al., 1992).
Theory and Methods
A multi-method case study was used to examine the effects of an eclectic store design on
customer satisfaction in an upscale-women’s apparel boutique. There are several studies that
have used the case study research design to examine the multitude of variables that impact
consumers while shopping in the store environment. A variety of data collection tools were
employed in these studies, including observations, prototypes/field experiments, surveys, and
content analyses.
Observation is a widely used systematic application when dissecting a phenomenological
incident and is often used by researchers who study organizations they are affiliated with
(Sommer & Sommer, 2002). One example of a case study that used observational data
collection is Douglas’s (1949) examination, which determined that the general retail market of a

23
community is largely dependent upon the citizens of that society. Douglas (1949) attempted to
reduce confounding variables by using a multi-method approach, which involved the review of
several documents including merchant records to track customer addresses, merchant bank
deposits from a week of business, and the city’s population distribution. Additionally, the
researcher observed traffic flow of passengers and applied Reilly’s law of retail gravitation
(Douglas, 1949). Consequently, the researcher was able to ascertain that similar and dissimilar
stores within a specific geographical area tend to have comparable target audiences indicating
that consumers have a tendency to follow patterns which reflect socially determined behavior
(Douglas, 1949). In other words, humans will likely gravitate towards the ‘ideal’ or socially
approved town centers, malls, and supermarkets.
Store design decisions are formulated using a variety of different methods. The store
prototype or field experiment is often used, although it can be very expensive and quite time
intensive (Baker et al., 1992). Large retail corporations, such as The Limited or The Gap, utilize
this type of research tool for testing customers’ responses towards a new store design before
rolling it out throughout all their subsidiaries (Baker et al., 1992). It makes sense that this type
of implementation occurs in geographies that can be generalized across the store’s national target
audience. The current study included the development of a store prototype that could be used as
a model for other boutiques that sell contemporary women’s apparel to fashion conscious
shoppers in mid-sized communities.
An atypical example of a retail prototype is BigHorn Center – Phase III. This retail
building in Silverthorne, Colorado is one of the United States’ first examples of a retail building
that accurately integrated natural ventilation cooling systems and daylighting in a retail space
(Hayter and Torcellini, 2000). The center’s design team used environmental simulation tactics to

24
ensure energy optimization would be achieved before actually constructing the building. This
tactic is especially beneficial when accuracy and precision is important, but time is not an issue
(Groat & Wang, 2002). A combination of architects, engineers, and designers developed a
simulated environment which incorporated the criterion necessary for meeting ASHRAE energy
optimization standards, as well as the environmental sensitivities of the project owners,
themselves (Hayter and Torcellini, 2000). At the conclusion of the project, Hayter and Torcellini
(2000) closely examined the effects of the building and found that its lighting loads decreased
79% from the original two buildings (Phase I and II). Additionally, the researchers estimated
that the anticipated energy cost savings would be close to 62%, exceeding the original project
goal of 60% (Hayter & Torcellini, 2000). It is assumed that the success of this building will act
as a benchmark for other design teams aiming to achieve similar results.
O’Cass and Julian (2001) studied the effects of materialistic values and self image on
fashion clothing consumption. The researchers developed and distributed through the postal
system a self-administered survey in which 450 questionnaires were returned. The survey was
analyzed using modified measures that had been used by previous researchers, as well as a
measure that was developed specifically for their study (O’Cass & Julian, 2001). By creating a
tailor made measurement tool the researchers were able to find a correlation between two
variables that, until this study, no previously developed measure had identified (O’Cass & Julian,
2001). O’Cass and Julian (2001) also found that high fashion customers have historically held
significance for fashion marketers and researchers because “they are seen as drivers, influentials,
and legitimists of the fashion adoption process” (O’Cass & Julian, pg. 3, 2001).
In another study that investigated consumer preference of retail stores as it pertains to
consumer perception, the researchers established a linkage between consumers’ emotional

25
responses and physical aspects of their environment (Thang and Tan, 2003). Thang and Tan
(2003) administered a questionnaire and found that certain store attributes will influence the
proclivity of consumers for certain stores over others (Thang and Tan, 2003). A five-point
Likert Scale was used to evaluate the composite measures of store image attributes
merchandising, store atmosphere, in-store service, accessibility, reputation, promotion, facilities,
and post-transaction service (Thang and Tan, 2003). The Likert Scale has a proven record for
accurately measuring attitudes (Sommer & Sommer, 2002). The Likert Scale was also used in a
study that investigated the effect of consumer perceptions of store attributes on apparel store
preference (Paulins & Geistfeld, 2003). Paulins and Geistfeld’s (2003) methodologies and
findings are most relevant to the current study. The investigators surveyed research from the
past 25 years to develop a list of store attributes applicable to apparel retailers (Paulins &
Geistfeld, 2003). They found that attributes of importance differ across types of stores, as well as
customer characteristics (Paulins & Geistfeld, 2003). For this reason, it is not relevant to
examine all aspects of the store environment if they do not pertain to the store’s target market or
type. Additionally, customer demographics, such as age, income brackets, levels of education,
and reasons for shopping affected store choice and the amount of time spent shopping (Paulins &
Geistfeld, 2003). Paulins and Geistfeld (2003) studied 13 stores (7 of which were specialty
shops/boutiques) in a midwestern city that is home to a medium-sized university. A
questionnaire was developed using a five-point Likert Scale to evaluate specific store attributes
the researchers had chosen from previous store attribute studies (Paulins & Geistfeld, 2003).
Similar to the current study, Paulins & Geistfeld (2003) handpicked those attributes that were
most significant to that of the store types they were evaluating. Some of these attributes included
advertising, appeal of clothing, displays, dressing rooms, location, service, hours of operation,

26
and prices/promotions. Comparable to the current study nearly half of the respondents were
between the ages of 18–23 (Paulins & Geistfeld, 2003). This may indicate that young women
make up a large part of apparel retail revenue when the store is located in a college town.
Results of the study revealed that consumers are most critical of department store attributes and
amenities and feel that appealing merchandise is the key to being a desirable place to shop
(Paulins & Geistfeld, 2003). Furthermore, the findings showed that as customers’ educational
levels increase so does their standards of store attributes (Paulins & Geistfeld, 2003).

27
CHAPTER 2 METHODOLOGY
Case Study Research
This research study is an example of a multi-method case study. A case study is a
thorough analysis of a social phenomenon pertaining to one individual condition (Kumar, 2005).
Such a method has been employed by various environmental psychologists to help explain why
certain effects result in particular built-environments (Kincade & Moye, 2003; Hayter &
Torcellini, 2000). In general, a case study is a thoroughly examined scenario that allows
researchers to make generalizations towards other similar types of situations (Kumar, 2005).
Due to the multifarious nature of determining the effects of store environment, the case
study design enables retailers and marketers to take a holistic approach towards the research
(Kumar, 2005). There are several advantages to using the case study method in behavioral
sciences; some of which are listed below (Sommer & Sommer, 2002):
• Greater depth within a particular topic. • The ability to capture readers’ interest. • Often regarded as enjoyable and entertaining reads. • Enhanced sense of recall through vivid details.
Limitations of the case study include the inability to support or reject a hypothesis, as well
as compromised generalizability due to the individualized basis in which each case is built upon.
However, if multiple cases within a specific domain are combined than the external validity is
believed to increase (Sommer & Sommer, 2002).
Variables of Interest
This research study will evaluate shoppers’ penchant for the total store environment of a
women’s apparel boutique. Additionally, the study will take into account how customer
demographics of shopping intentions, preferred time of day to shop, social influences, and age

28
correlate with overall customer loyalty. Research has shown that the combination of a store’s
physical features and non-design factors significantly contribute to shoppers’ assessments of
total store environment and should be considered when determining consumers’ overall image of
the business (Moore & Fairhurst, 2003). Because of the changing nature of apparel and footwear,
researchers and marketing strategists have long encouraged fashion retailers to grow their
businesses by subscribing to marketing practices that appropriately target the ‘trendy’ customer
(Moore & Fairhurst, 2003). For that reason, this research project, which initially planned to
examine only physical design features, extended its analysis to include non-design retail business
components. The research will focus on four physical design elements 1) lighting, 2) color
scheme, 3) atmospheric conditions, and 4) overall style/design, as well as four non-design
elements 1) mood of shopper, 2) location of store, 3) merchandise variety, and 4) service quality.
Observation
Observation is a method used for collecting data and is considered to be very effective
when attempting to ascertain how people interact with their physical environment (Kumar,
2005). There are two forms of observation: participatory and non-participatory. The former of
which the researcher participates in the activities with the group being observed and the latter is
when the researcher draws conclusions through passive observation (Kumar, 2005). Observation
enables the researcher to gather natural reactions from a population that may otherwise be
construed if participants are directly asked questions (Kumar, 2005). On the other hand, if the
population becomes aware that they are being observed they may alter their behavior to suit the
situation, known as the Hawthorne Effect (Kumar, 2005). Additionally, observer bias can
sometimes occur which causes data inaccuracy to be reported (Kumar, 2005).
Behavior mapping is a form of observation that records people’s behavior in a physical
environment (Sommer & Sommer, 2002). Two types of behavior mapping are commonly used

29
when determining how humans interact with their surroundings – place-centered and person-
centered (Sommer & Sommer, 2002). Place-centered maps reveal how people position
themselves within a space, whereas person-centered maps concentrate on people’s movement
and behavior over a period of time (Sommer & Sommer, 2002). Continuous observations record
activities over time in a given location and can often reveal problems that occur in that particular
setting (Sommer & Sommer, 2002). Furthermore, this form of observation can reveal social and
psychological behaviors, as well as provide insight to the relationship between participants and
the environment (Zeisel, 1981). Limitations of behavior mapping include a need for additional
forms of data collection in order to support the observed findings and, if there is more than one
observer, data collection consistency can be compromised (Sommer & Sommer, 2002).
Behavior mapping was used in order to gain a comprehensive understanding of how
shoppers reacted to the boutique’s existing design, and specifically the layout. A footprint
drawing of the original layout (Appendix A) was created using AutoCAD 2004, a widely
accepted computer aided design program used by most design professionals. The map was
structured similar to a zone-blocking diagram in that it listed different areas of merchandise by
purchasing nature. In general, retail merchandisers and strategists encourage product placement
to correspond with shoppers’ intentions to buy. Consequently, impulse purchases are typically
located near the front of the store and close to the point-of-purchase stations, while demand
products are positioned towards the back of the store. This product placement methodology is
believed to draw the customer through the entire store while encouraging them to pass by
convenience goods that have been placed in the center section of the space. The boutique’s
present merchandising style employed this type of strategy; therefore, by using the behavior
mapping technique the researcher was able to investigate if the store’s current merchandising
30
tactics were effective, as well as whether or not this type of shopper responds positively to the
industry’s ‘suggested’ merchandising approach.
Additionally, there was an area on the mapping tool allotted for recording and describing
shoppers’ behaviors at different increments of time. Each behavior was assigned a number that
was plotted on the footprint to show where the shopper was positioned at the time they carried
out the activity. Arrows were also used to track the sequential movement of the shopper. The
observation form noted if the shopper purchased anything and if so, the dollar amount and
number of items that were bought.
Findings from the behavior-mapping tool informed the researcher of layout and
merchandising techniques that were currently effective, as well as the strategies that were not so
effective. This information was then used for determining appropriate design solutions for the
boutique’s redesign experiment.
Experimental Study.
Another behavioral research approach that has proven effective in retail environments is
the experimental study which implements a change then studies how that change effects its
population (Kumar, 2005). Experiments can be conducted in a ‘controlled’ or ‘natural’
environment (Kumar, 2005). In a controlled environment, the study population is in a restricted
environment, such as a room where all subjects are analyzed under the same conditions (Sommer
& Sommer, 2002). Alternatively, the ‘natural’ environment allows the respondents to be
exposed to an intervention in its natural environment (Kumar, 2005).
A natural environment was chosen whereby a redesign of a boutique’s interiors occurred in
the shop’s actual space. A solid repository of store redesign ideas was built using the
information gathered during the observational procedure, as well as design solutions that extant
literature revealed as being successful in other upscale retail environments. Based on the

31
combination of this data, the designer/researcher chose to make several changes to the existing
space (Appendix B).
Existing merchandising strategies that remained constant were the utilization of wall space
for displaying items; the recognized product placement strategy of impulse-convenience-demand
goods; and the location of the service areas, including the fitting rooms and the point-of-purchase
zone. Furthermore, the raised elevation of the window display was maintained, however the
materials used in this location were modified. Space planning began by field verifying the
dimensions of the entire selling area - approximately 1200 sq/ft. AutoCAD drawings were
constructed reflecting the existing floor plan and elevations of four walls. After determining the
amount of linear feet that were needed to appropriately display the shop’s fluctuating inventory,
the trips to flea markets and home improvement stores began. The boutique’s new style was to
be eclectic – a marriage of urban industrialism and feminine finesse.
The designer was tasked with creating a new store image and an effective working
environment using $5000 and one week to complete the project. All the materials and
furnishings were purchased over a one-month period prior to the actual construction. Before the
process began, the merchandise was removed from the store and placed in a twenty-foot moving
van for temporary storage. Outdated adjustable shelves, fixture brackets, and waterfall hooks
were dismantled from the black-laminated slatwalls. This conventional display equipment was
donated to the Salvation Army for use in their local retail outposts. A departure from standard
merchandising techniques and department-store features went underway. A shelf that sat at eight
feet high and ran along the store’s entire perimeter was also dismantled. This shelf contributed
little to the space by imposing an interruption on the wall plane and as a result, caused the ceiling
to feel as though it was low and intrusive. The odd obstruction also cast shadows over most of

32
the items that sat on the walls and provided no effective use because it was too high to be utilized
for merchandising purposes. Soiled carpet was pulled up and tack strips were removed exposing
the concrete slab foundation. Applications of Spackle and sandpaper repaired the wall surfaces
where deconstruction had occurred. Fixture heads were dismantled from the track lighting strips
and tape was applied to all exposed electrical fittings. Windows were tapped off and the walls
were prepped for the painting process that was to occur the following day. Industrial Kraft paper
was rolled out over the entire floor so as to protect the raw surface from paint and debris.
The ceiling and walls were coated with an ultra-white paint, enhancing the size and
brightness of the interior space. A flat finish was chosen in order to disguise any small
imperfections on the surface. Galvanized pipe assemblies were used for the wall fixtures that
hang clothing. The fabrication of customized shelves also took place using one-inch thick, two-
by-four boards that had been cut to various lengths and then stained to a deep walnut finish. A
clear, lacquer was applied over the double-coated stain in order to make the surface more
resilient to wear, as well as easier to clean. The track head lighting which underwent an easy, yet
effective transformation was reinstalled. By simply repainting the vanilla cans with a vibrant
white lacquer spray, the fixtures looked as if they were brand new. A damask vinyl wall
covering was hung on the back wall. This decorative feature not only tied in the green and gold
color scheme while adding a dose of femininity, but also drew the shopper to the rear of the
store. It enabled what was otherwise a very open, austere space to have a sense of enclosure and
a feeling of hominess. When the time came to seal the floors, a thick, viscous solvent was rolled
out to create a smoother surface that would be impervious to imbedded dirt, as well as offer a
shiny, more reflective finish.
33
Eventually the merchandise was returned to the store, and, in addition to receiving a fresh,
new look for her boutique, the owner was given a unique opportunity to conduct a systematic
and exceedingly thorough physical inventory check. As each item was taken off the truck, it was
entered into the computer and verified as on-hand inventory. Although tedious and time-
consuming, this process was invaluable to the business operator by enabling every article to
become accounted for that may have otherwise been overlooked if conducted in a fully stocked
store. A physical inventory assessment is necessary in all retail environments due to the
unavoidable nature of stolen goods and mislabeled units. It is typically performed on a quarterly
and year-end basis.
Rugs were strategically laid to designate certain zones and furnishings were placed to
denote dwelling areas. Demarcation of these zones was carefully considered during the
conceptual phases of design. The designer was fully aware that these areas must have a logical
orientation for both the user and the service providers. Additionally, these designated zones
should integrate seamlessly across one another and read as one whole unit – in this case, a
sophisticated-fashion house. The intent was to create an environment that had meaning or an
emotional significance to its users. Incorporating a sitting area made up of furniture commonly
seen in residential environments supported this notion. A Victorian tufted sofa upholstered in a
golden-green silk damask fabric offset two occasional chairs. A once shabby table was
refinished to resemble an Art Deco period piece and was placed in the middle of the furniture
pieces adding further sophistication and grandeur to this newly assigned social zone. Other
freestanding furnishings were placed around the space with the intention of deliberately guiding
shoppers through various parts of the store in an unobtrusive and natural manner. The new
layout was designed to be open and spacious while still effectively promoting fashion and style

34
ideas. For example, two antique birdcage stands were used as mannequin stands displaying full
outfits hung on body forms. As with most of the new furniture/display elements, these stands
can be repositioned in the store at anytime offering a more versatile and flexible approach to
merchandising. The cash wrap or the purchasing area was devised using a small dining table.
Two dining chairs that were reupholstered in a vinyl fabric (for durability purposes) sat on either
side of the desk – one for the cashier and the other for the shopper or guest. This intimate
arrangement was chosen to encourage the shopper to feel like a friend of the boutique, not
merely a paying customer.
Curtains with small chains looped through grommeted panels of triple-ply white,
polyester-crepe were hung in front of the fitting rooms. The chains extended 10” below the door
header as to allow natural light to filter in above the enclosure. Moreover, the snow-white color
of the fabric transmitted ancillary light into the fitting room space, while the three layers of
fabric provided the shoppers with necessary privacy. The curtain panels were cut extra long in
order to create a billowing effect on the floor. This technique juxtaposed the delicacy of the
curtains against the raw, edginess of the concrete floor reemphasizing the intended feminine-
industrial design scheme. The window display was created using two traditional cloth covered
body forms hung from the ceiling with s-hooks and heavy-gauge chains. Several rows of
wooden discs sporadically knotted on natural twine were suspended from the dropped ceiling
that surrounds the window stage. This beaded curtain backdrop enables outside viewers to
articulate the window presentation as a composition, while never compromising their ability to
view the rest of the store. It also allows natural light to flood into the main portion of the interior
space, whereas a solid backdrop may limit daylighting accessibility. Plants, candles, fashion
35
magazines and other decorative features were placed throughout the store and the boutique was
ready to make its official debut (Appendix C).
Data Collection Tool
The data collection tool for this study was a questionnaire divided into three parts
(Appendix D). The first section asked questions involving reasons for shopping, preferred time
of day to shop, social influences, and age. The shopping intentions category is divided into five
parts being leisure, special occasion, having a sale, general clothing needs, and other.
Respondents preferred time of day to shop is broken down into five, two-hour segments. Four
two-hour modules consist of the store’s eight-hour business day beginning at 10:00am and
ending at 6:00pm. The fifth option is ‘other’ enabling the respondent to express business hours
beyond that of the boutique’s current operating hours. It is possible that if enough respondents
shop at times other than those presently offered it might be a sensible business decision to
modify or extend current operating hours. Social influences are defined in this context as
methods in which the shoppers learned of the boutique. These mediums included friend/relative,
The Gainesville Sun - a local newspaper, radio advertisement, magazine, and other. The age
category was also classified into five groupings 1) under 18, 2) 18–22, 3) 23–30, 4) 31–40, and
5) over 40.
The remaining fourteen questions focused on the respondents’ opinions towards the
boutique’s various environmental elements. In the first grouping respondents were asked to
record the extent of their attitudes to nine statements on a five-point Likert-Scale. The rating
scale ranged from Very Bad to Very Good in which a check was placed in the box that most
appropriately matched her feeling for each statement. The remaining five statements asked
respondents to record their extent of agreement on a Likert-Scale that ranged from Strongly
Agree to Strongly Disagree. Again, the participant was to check the area that most appropriately

36
matched her belief. Both groupings of statements encompassed design and non-design related
factors, including the shopper’s mood at the time of the survey administration, her attitude
towards the overall shopping experience, and her willingness to purchase environmentally
sensitive clothing. In the same way green practices have become a near standard within the
construction and design arena, they are also gaining momentum in the apparel industry as
witnessed by such labels as Edun, Loomstate, and American Apparel. Although the latter is not
entirely relevant to the current study, it is of personal interest to the researcher to examine the
study population’s general opinion towards environmentally safe clothing.
Likert-Scales
The Likert Scale is a valid tool for accurately measuring attitudes (Sommer & Sommer,
2002). A collection of various ideas and beliefs on a certain topic are collected. After
eliminating all viewpoints that don’t have a distinctively favorable or distinctively unfavorable
estimation, the statements are then positioned on a survey next to a degree of agreement
continuum (Sommer & Sommer, 2002). The respondents record their level of concurrence by
marking the category (Strongly Agree, Agree, Undecided, Disagree, Strongly Disagree) that
most appropriately fits their opinion (Sommer & Sommer, 2002). It is important that the
statements distinguish between a positive and negative perspective in order to analyze the results
accurately.
Participant Sampling
The study population was gathered by approaching female shoppers as they came into the
boutique. Before requesting that the shopper participate in the study, she was asked if she had
visited the store in the past. Because some survey questions assumed the respondent had made
previous visits to the boutique, only those shoppers that had been to the store before were
eligible to participate. Qualified participants were then informed of the study’s intent to examine

37
shopper’s evaluation of the total shopping environment. A total of 40 shoppers participated in
the study. Each participant was requested to read and sign an informed consent document
(Appendix E). The consent form was collected by the researcher and placed in a box separate
from that of the survey so as to further ensure confidentiality of respondent’s answers. Each
participant was also given a copy of the consent form for her personal records. All participants
were ensured that their answers would remain strictly confidential. The Institutional Review
Board of the University of Florida has determined that this study posed no more than minimal
risk to participants (Appendix F). In accordance with the shop owner’s permission, a 20%
discount coupon was given to each respondent for participating in the study.
Summary
In summary this research is an example of a multi-method case study. Information that
had been gathered from observational procedures was used to inform a field experiment. The
experiment was then tested by a convenience sample’s response through a survey. The intent
was to examine shoppers’ evaluations of a newly designed apparel boutique, as well as their
overall level of customer loyalty.

38
CHAPTER 3 STATISTICAL ANALYSIS AND RESULTS
In this chapter, the quantitative results describing the customers’ perceptions and reactions
to the store are discussed. First, the procedure used to collect the data and characteristics of the
respondents are examined, followed by a review of the methods used to analyze the data.
Finally, the results of the analysis are explained.
During the time period between February 1, 2006 and March 31, 2006, a random selection
of the boutique’s customers was asked to complete a questionnaire (Appendix D). The
questionnaire assessed the demographic information about the respondents and their attitudes
toward the store. The responses to the survey were entered into an Excel spread sheet and
exported to SPSS, a statistical analysis software package, for analysis.
Descriptive Statistics
Descriptive statistics were run on the raw data collected from the sample. This type of data
classification is used in order to summarize the quantitative figures into manageable portions
(Sommer & Sommer, 2002). It is a way of assigning numerical descriptions to a sample and is
typically performed against categorical and interval measures (Sommer & Sommer, 2002).
Categorical measures contain variables that are discrete. A question that asks a respondent to
explain his/her hair color and then offers blond, brown, red, or gray as options is an example of a
categorical measure. Interval measures involve variables that have a variety of levels along a
continuum. A question containing a degree of agreement scale generates interval data.
Descriptive Characteristics of the Sample
A greater part of the sample (67.5%) fell into the age category of 18–22. This statistic did
not come as any surprise due to the typical demographics of a large state-university based town.

39
There were no participants under the age of 18 years. Seven of the participants were between 23
and 30, while six shoppers fell into the 31–40 age category.
Table 3-1. Demographics - Age
Frequency Percent Cumulative
Percent Valid 18–22 27 67.5 67.5 23–30 7 17.5 85.0 31–40 6 15.0 100.0 Total 40 100.0
The largest majority of the participants (57.5%) stated they shopped for leisurely
purposes, while another 30% said they shopped with leisurely intents combined with general
clothing needs, special occasions, and/or ‘other’ reasons. This did not come as surprise as it has
been shown that young consumers are more likely to have a greater tendency to shop for
recreational purposes (Boedecker, 1997). Both, special occasion and the ‘other’ category were
2.5% of total respondents’ reasons for shopping. Alternatively, special occasion was listed
32.5% of the time when combined with leisure, general clothing needs, and/or ‘other’. Five-
percent of the participants declared general clothing needs were their main motive for shopping
whereas 20% of shoppers included general clothing needs as one of several reasons for shopping.
Table 3-2. Demographics – Shopping Intentions
Frequency Percent Cumulative
Percent Valid Leisure (1) 23 57.5 57.5 Special occasion (2) 1 2.5 60.0 General clothing
needs (3) 2 5.0 65.0
Other (4) 1 2.5 67.5 1,2,3,4 7 17.5 85.0 1,2 2 5.0 90.0 2,4 1 2.5 92.5 1,2,3 1 2.5 95.0 1,2,4 2 5.0 100.0 Total 40 100.0

40
Seventeen of the forty participants preferred shopping between 2–4pm; eleven between
4–6pm; six between 12pm–2pm; one between 10am–12pm; one in the ‘other’ category; two
between 12pm–4pm; one between 2pm–6pm and one respondent did not answer the question.
Table 3-3. Demographics – Preferred Time of Day to Shop
Frequency Percent Cumulative Percent Valid 10am–12pm 1 2.6 2.6 12pm–2pm 6 15.4 17.9 2pm–4pm 17 43.6 61.5 4pm–6pm 11 28.2 89.7 other 1 2.6 92.3 2,3 2 5.1 97.4 3,4 1 2.6 100.0 Total 39 100.0 Missing System 1 Total 40
Almost 80% of the respondents had heard of the boutique through a friend or a relative.
This statistic may imply that a majority of these customers were driven through word-of-mouth,
providing useful insight to a boutique storeowner for selecting various forms of advertising
mediums. Another 18% chose ‘other’ as to how they were informed of the boutique, including
two ‘drive by’ responses and five responses that involved familiarity with neighboring
businesses and/or the plaza in which the boutique is located. Only one individual stated—The
Gainesville Sun—a local newspaper, while one respondent did not answer the question at all.
Table 3-4. Demographics – Social Influences
Frequency Percent Cumulative Percent Valid Friend/
Relative 31 79.5 79.5
Gainesville Sun 1 2.6 82.1
Other 7 17.9 100.0 Total 39 100.0 Missing System 1 Total 40

41
To examine how the perceived characteristics of the store affected shoppers’ overall
attitudes toward the store, a composition measure of overall attitude to the store was formed by
averaging the responses to the questions assessing satisfaction, shopping frequency, and
recommendations to a friend. This composite measure is typically used by market research firms
to measure the overall loyalty of customers based on the contention that devoted customers shop
in the store frequently, are satisfied with their shopping experience, and recommend the store to
friends. The mean for this measure among the sample of customers was 4.18.
Table 3-5. Customer Loyalty Composite
Frequency Percent Cumulative
Percent Valid 1.00 3 7.5 7.5 1.33 10 25.0 32.5 1.67 13 32.5 65.0 2.00 4 10.0 75.0 2.33 4 10.0 85.0 2.67 3 7.5 92.5 3.00 2 5.0 97.5 3.33 1 2.5 100.0 Total 40 100.0
Evaluation of Store Environment
Contingency tables for each measure pertaining to store attributes were formed. For every
question, the table’s cells contained the frequencies of occurrence, indicating how many times
each option was preferred by the respondents. Using this information, the mean was computed
giving the average response for each category. This average is known as a measure of central
tendency. Central tendency is a number that most appropriately distinguishes the sample
population as a whole (Sommer & Sommer, 2002).
Majority of the shoppers or 48.7% rated their mood as good with 33.3% having been in a
neutral mood and 17.9% in a very good mood. One individual did not answer the question.

42
Using a rating of 5 as being very good, respondents’ evaluations of their mood on the day they
participated in the study had a mean of 3.85.
Table 3-6. Shopper Mood Evaluation
Frequency Percent Cumulative
Percent Valid Very Good 7 17.9 17.9 Good 19 48.7 66.7 Neutral 13 33.3 100.0 Total 39 100.0 Missing System 1 Total 40
Over half of the participants felt the location of the store was good, while one participant
felt it was bad. Fifteen-percent considered the location to be very good and another 27.5%
believed it to be neutral or just okay. Using a rating of 5 as being very good, respondents’
evaluations of the boutique’s location had a mean of 3.82.
Table 3-7. Store Location Evaluation
Frequency Percent Cumulative
Percent Valid Very Good 6 15.0 15.0 Good 22 55.0 70.0 Neutral 11 27.5 97.5 Bad 1 2.5 100.0 Total 40 100.0
A generous 72.5% of shoppers rated the store atmosphere as very good, while the
remaining 27.5% considered it to be good. With a score of 5 measured as very good, the store
atmosphere mean was 4.72.
Table 3-8. Store Atmosphere Evaluation
Frequency Percent Cumulative
Percent Valid Very Good 29 72.5 72.5 Good 11 27.5 100.0 Total 40 100.0

43
Twenty-six participants evaluated the store design as very good, while another twelve
individuals deemed it as good. One respondent felt the design was somewhere between very
good and good, whereas another considered it to be neutral. Using a rating of 5 as being very
good, respondents’ assessment of the boutique’s design had a mean of 4.64.
Table 3-9. Store Design Evaluation
Frequency Percent Cumulative
Percent Valid Very Good 26 65.0 65.0 Between good
and very good 1 2.5 67.5
Good 12 30.0 97.5 Neutral 1 2.5 100.0 Total 40 100.0
A majority of the shoppers regarded the color scheme to be very good, while another 30%
rated the color selections as good. Only one respondent felt the assortment of colors was neutral.
The mean across opinions was 4.65, having used 5 as a rating for very good.
Table 3-10. Color Scheme Evaluation
Frequency Percent Cumulative
Percent Valid Very Good 27 67.5 67.5 Good 12 30.0 97.5 Neutral 1 2.5 100.0 Total 40 100.0
Thirty-one of the forty respondents evaluated the lighting in the main shopping area to be
very good, while the other nine respondents assessed it to be good. Using a rating of 5 as being
very good, the general store lighting had a mean of 4.77.
Table 3-11. General Store Lighting Evaluation
Frequency Percent Cumulative
Percent Valid Very
Good 31 77.5 77.5
Good 9 22.5 100.0 Total 40 100.0

44
Eighty percent of shoppers felt the lighting within the fitting rooms was very good. Seven
participants determined that the fitting room lighting was good and only one assessed it as
neutral. The mean across evaluations was 4.77, using a rating of 5 as being very good.
Table 3-12. Fitting Room Lighting Evaluation
Frequency Percent Cumulative
Percent Valid Very
Good 32 80.0 80.0
Good 7 17.5 97.5 Neutral 1 2.5 100.0 Total 40 100.0
The variety of product was considered by 52.5% of participants to be ‘good’, while another
37.5% rated the merchandise assortment to be ‘very good’. Four individuals assessed the
collection as neutral. The combination of all the participants’ product variety evaluations
resulted in a mean rating of 4.27, using a ‘very good’ rating of 5.
Table 3-13. Product Variety Evaluation
Frequency Percent Cumulative
Percent Valid Very
Good 15 37.5 37.5
Good 21 52.5 90.0 Neutral 4 10.0 100.0 Total 40 100.0
Thirty-five respondents reported that customer service was ‘very good’, while another four
felt it was ‘good’. Only one woman rated the customer service as ‘neutral’. Using a rating of 5
as being very good, the overall customer service evaluation was a mean of 4.77.
Table 3-14. Customer Service Evaluation
Frequency Percent Cumulative
Percent Valid Very
Good 35 87.5 87.5
Good 4 10.0 97.5 Neutral 1 2.5 100.0 Total 40 100.0

45
The last section of the survey asked participants to rate their opinions toward five
statements on a 5-point Likert-Scale. If given a rating of a five, the statement was strongly
agreed with, while given a rating of one, the statement was strongly disagreed with. When asked
whether respondents were satisfied with their shopping experience, 55% ‘strongly agreed’,
42.5% ‘agreed’, and just one individual (or 2.5%) had a ‘neutral’ opinion. Using a rating of 5
as being strongly agree, the overall mean of shopping experience satisfaction was 4.52.
Table 3-15. Shopping Experience Evaluation
Frequency Percent Cumulative
Percent Valid Strongly
Agree 22 55.0 55.0
Agree 17 42.5 97.5 Neutral 1 2.5 100.0 Total 40 100.0
Fourteen participants marked ‘agree’ as to whether or not they would purchase
environmentally sensitive clothing, with thirteen each reporting ‘strongly agree’ and ‘neutral’ as
their clothing type propensity. The mean across responses was 4.00, with a rating of 5 as
‘strongly agree’.
Table 3-16. Propensity to Buy Environmentally Sensitive Clothing
Frequency Percent Cumulative
Percent Valid Strongly
Agree 13 32.5 32.5
Agree 14 35.0 67.5 Neutral 13 32.5 100.0 Total 40 100.0
The majority (or 37.5%) of respondents ‘agreed’ that their shopping was frequent at the
boutique, whereas another 30% believed their shopping frequency to be ‘neutral’. Another five
respondents (or 12.5%) ‘strongly agreed’ that they shopped frequently at this particular boutique.

46
The combination of all the participants’ levels of shopping frequency opinions resulted in a mean
rating of 3.35, using a ‘strongly agree’ rating of 5.
Table 3-17. Shopping Frequency at the Boutique
Frequency Percent Cumulative
Percent Valid Strongly Agree 5 12.5 12.5 Agree 15 37.5 50.0 Neutral 12 30.0 80.0 Disagree 5 12.5 92.5 Strongly
Disagree 3 7.5 100.0
Total 40 100.0
Interestingly, five respondents reported a disagreement when asked if they purchased more
clothing when items were discounted - one ‘strongly disagreed’, while four others ‘disagreed’.
Another twelve respondents were neutral towards the question. Fifteen ‘agreed’ that they buy
more when products are discounted and just five ‘strongly agreed’ with the discount notion. A
mean of 3.82 resulted, using a 5 rating as ‘strongly agree’.
Table 3-18. Purchase Volume of Discounted Product
Frequency Percent Cumulative
Percent Valid Strongly Agree 12 30.0 30.0 Agree 15 37.5 67.5 Neutral 8 20.0 87.5 Disagree 4 10.0 97.5 Strongly
Disagree 1 2.5 100.0
Total 40 100.0
Twenty-nine respondents reported that they ‘strongly agree’ with the statement that asks
whether they recommend the boutique to friends. Another nine selected ‘agree’, with the two
remaining respondents indicating that they were ‘neutral’ to the question. Using a rating of 5 as
being ‘strongly agree’, the overall customer service evaluation had a mean of 4.67.

47
Table 3-19. Boutique Recommendation to Friends
Frequency Percent Cumulative
Percent Valid Strongly Agree 29 72.5 72.5 Agree 9 22.5 95.0 Neutral 2 5.0 100.0 Total 40 100.0
Correlation
Correlations between the independent variables of customer attitudes towards store
attributes and the dependent variable of overall customer loyalty were determined in order to
measure the impact of each factor on overall customer loyalty. A table detailing these results is
listed below.
Table 3-20. Correlations – Store Attributes and Customer Loyalty Composite
Customer Loyalty
Evaluation Store Attributes Mood .153 Location .183 Store Atmosphere .-0.064 Store Design .083 Store Colors .460 General Lighting .242 Fitting Rooms Lighting .029 Product Variety .045 Customer Service .183
The statistical analysis revealed that none of the store attributes had a significant effect on
overall customer loyalty other than the color scheme. It is postulated that the lack of significance
may have occurred due to the small sample size and an overall pre-existing high loyalty rating
amongst the participating shoppers. Basically, because the respondents were to have previously
visited the store in order to qualify for the study, it is likely that the data is skewed towards an
existing high loyalty towards the store regardless of the environmental changes that occurred.
This dynamic created a ceiling effect, whereby there was no variation in the data.

48
Analysis of Variance
Analysis of Variance (ANOVA) enables researchers to compare more then two means and
is often used to understand how the dependent variable is affected by the independent variables
(Sommer & Sommer, 2002). By averaging the satisfaction of current shopping experience,
boutique shopping frequency, and recommendation of the boutique to friends, the dependent
variable of overall customer loyalty was formed. This overall evaluation was then compared
against each of the individual categorical means in questions one through four in order to
determine whether a relationship exists between overall customer loyalty and 1) shopping
intentions, 2) preferred times of day to shop, 3) social influences, and 4) age. The ANOVA test
revealed whether the respondents’ characteristics affected overall customer loyalty. It is
important for business owners to uncover these relationships because it can inform them of their
current market’s demographical characteristics and personality traits. Understanding these
factors not only enables retailers to better accommodate their existing clientele, but also allows
them to analyze their current marketing strategy.
Table 3-21. ANOVA – Respondents’ Shopping Intentions Effect on Customer Loyalty
N Mean leisure 23 1.8261special occasion 1 3.0000general clothing needs 2 1.8333other 1 2.00001,2,3,4 7 1.76191,2 2 1.66672,4 1 2.33331,2,3 1 1.00001,2,4 2 1.5000Total 40 1.8167
Sum of Squares df Mean Square F Sig.
Between Groups 2.637 8 .330 .977 .472Within Groups 10.463 31 .338 Total 13.100 39

49
Table 3-22. ANOVA – Preferred Time of Day to Shop Effect on Customer Loyalty
N Mean 10am–12pm 1 1.6667 12pm–2pm 6 1.5556 2pm–4pm 17 2.0196 4pm–6pm 11 1.7273 other 1 1.6667 2,3 2 1.6667 3,4 1 1.6667 Total 39 1.8205
Sum of Squares df
Mean Square F Sig.
Between Groups 1.309 6 .218 .593 .733
Within Groups 11.768 32 .368 Total 13.077 38
Table 3-23. ANOVA – Social Influences Effect on Customer Loyalty
N Mean Friend/Relative 31 1.8387 Gainesville Sun 1 2.3333 Other 7 1.5714 Total 39 1.8034
Sum of Squares df
Mean Square F Sig.
Between Groups .696 2 .348 1.033 .366 Within Groups 12.130 36 .337 Total 12.826 38
Table 3-24. ANOVA – Age Effect on Customer Loyalty
N Mean 18–22 27 1.7901 23–30 7 1.7143 31–40 6 2.0556 Total 40 1.8167
Sum of Squares df
Mean Square F Sig.
Between Groups .435 2 .217 .635 .536
Within Groups 12.665 37 .342 Total 13.100 39

50
The results of the ANOVA analysis revealed that the most loyal customers appear to shop
from 2–4pm (Table 3-22) and are 31–40 years old (Table 3-24). Additionally, these loyal
shoppers selected special occasion (Table 3-21) as their main motivator for shopping; however,
none of the results qualify as statistically significant due to the marginal differences in the means
of the customer loyalty composite measures for shopping time of day, customer age, and source
of information about the store. This was the result of the lack of variation across a small sample
size

51
CHAPTER 4 DISCUSSION
Though, the analyses performed on the collected data produced statistically insignificant
results, it is improbable to assume that the experimental store environment had no effect at all on
its customers. Effectively, the lack of variation across respondents’ scores created a ceiling
effect, skewing the data and concluding that it could not be considered statistically relevant. On
the other hand, the exceedingly high number of positive evaluations may suggest that the
business owner is, indeed, appropriately hitting her target market. Very often, people who
possess similar demographics also tend to hold comparable social values and associate
comparable meanings with personal belongings and environmental surroundings (Luomala,
2003; Lindquist, 1974–75). Although the sample in this case was statistically too alike, it may
be reasonable to consider that these respondents may be indicative of ‘typical’ apparel boutique
shoppers in large university towns. Consequently, this sample’s partiality towards specific
boutique design features may parallel those of specialty store shoppers in other college towns.
Despite the statistical results, the study proposes multiple design solutions and various
marketing techniques that may prove instrumental to designers within the retail arena. These
professionals are presented an opportunity to implement similar strategies and are encouraged to
further build upon the ideas presented here. This chapter will review and discuss each of the
design and non-design elements that were examined, as well as report some noteworthy
demographical relationships.
Evaluation of Design Elements
Based on the major design changes that were made, the space was broken down into four
design evaluation categories 1) atmosphere; 2) style/design; 3) color scheme; and 4) lighting.
Atmosphere included smell, temperature, sound, and touch. Style and design described the

52
overall theme of the space (i.e., contemporary vs. traditional; open layout vs. controlled, etc.),
while the color scheme consisted of the color palette and material selections. Lastly, lighting
pertained to the general shopping area and within the fitting rooms. Shoppers were asked to
evaluate their individual perceptions of the store’s specific features, and then record their
feelings on a 5-point Likert Scale.
Atmosphere
Atmosphere generally pertains to the arousal of sensory cues within an environment. The
designer/researcher incorporated atmospheric components that were believed to connect with the
target market’s lifestyle. A clean, pleasant smell was easily maintained through frequent
cleaning and the use of fresh scented plug-in deodorizers. Achieving suitable temperature
conditions was far more challenging. The dated building had inadequate insulation, which
frequently caused temperature extremes to occur. In efforts to improve such conditions, quick
fix-its that conveyed a more pleasurable setting were implemented. For example, during the
cooler winter months, candles were lit and hot beverages were often served in order to promote
warmth and coziness. In temperate conditions, propping the front door open allowed oxygen-
filled air and outdoor breezes to enter, while in the hotter seasons, it is suggested the front door
remain shut with oscillating fans placed around the space and the thermostat set at a moderate
position. Shoppers may feel a sense of coolness just by experiencing the hum of fans and the
movement of air.
After the renovation, the store encompassed more hard surfaces and an increase in spatial
volume. The sound absorption capacity of the space was reduced through the extinction of
fiberboard slat-walls along the periphery, and the removal of merchandising floor fixtures.
Although intended, these renovations, as well as the newly exposed concrete flooring condition
reverberated sound greater than before. The new acoustic characteristics of the space were

53
reminiscent of an old factory warehouse, reinforcing the urban-industrial theme. A well-
composed sound quality was achieved through the placement of rugs, furniture, and other soft
goods. The merchandise also significantly contributed to overall noise control by increasing the
space’s absorption capabilities.
A shopper’s ability to see merchandise may possibly be the most important sensory cue to
consider when designing a fashion boutique. A business that survives on selling unique and
often expensive items must be able to adequately showcase product in a visibly sensible manner.
Moving most of the merchandise to the outer perminter of the space created an open layout and
enabled the center of the store to be used for socio-petal arrangements. Such arrangements are
recommended by behavior psychologists to facilitate conversation and a sense of community
within a public space (Bechtel and Churchman, 2002). This newly designed sitting area not only
gave the eye a break from sensory overload, but also presented shoppers with a panoramic view
of the shop as they immediately entered the space. Wall fixtures were hung at 4’–6” with
shelves placed at 5’–0”. These heights were selected according to industry professionals’
recommendations to hang fixtures between 3’–6” and 5’–6”. Lighting was adjusted to achieve
desirable brightness and accurate color rendering.
Another key element to an apparel store’s sensory stimulation is touch. A tactile-rich
environment was presented using a mixed material palette comprised of soft/hard, shiny/matte,
and textured/smooth surfaces. Additionally, the extreme juxtaposition of opposing materials
imparts the business’s easygoing disposition and artistic nature. The mean evaluation rating for
atmosphere was 4.72 out of a possible 5. In fact, all forty respondents felt that the new store
atmosphere was either good or very good. These results indicate that the sample is satisfied with
the various atmospheric components that were selected for the space.
54
Style/Design
By the very nature of a retail store, there are several constituents that will tell the story of
one entire space. As explained by Rengel (2003), order in a space is achieved when several
functions come together to form a cohesive understanding of the space’s intention. These groups
include harmonious arrangements amongst physical features, organizational methods that
facilitate natural progression, and interpretation of a space as one single unit (Rengel, 2003).
The shelving units and plumbing assemblies that made up a majority of the new merchandising
displays were designed to provide functionality, but also to establish a sense of order and balance
within the space. Equilibrium was accomplished through placement of several pipes hung
consecutively in a row down the two main walls. Shelves that hung above every two pipe
groupings unified the composition, while furthering the functionality and overall visual
complexity. It was crucial that all the fixtures were reinforced by load bearing construction or
wall studs because of the merchandise weight that would be supported by these key components.
A marriage of opposites, the store encompassed everything from old and new to rough and
smooth resulting in a style that is often typified as eclectic. The general feel is urban and citified,
embracing the familiar theme of ‘less is more’. Minimalism and clean lines were stressed though
the use of simplistic fixtures; an open layout; a soft color scheme with a white back drop; and the
repetition of elements. All, but one participant regarded the style/design as good or very good,
resulting in a mean of 4.64. This assessment lends credibility to the consideration of eclectic
style with an urban focus when designing a high-fashion women’s boutique that caters to a
trendier audience.
Color Scheme
Color of a space can be defined through several mediums. Commonly, paint and fabric
selections come to mind first, however innovative material usage can also have a tremendous

55
effect on a space’s color impact. A predominantly neutral color palette with touches of pistachio
green and golden yellow was selected for this project. Using a neutral backdrop of fresh, white
walls symbolizes perfection and purity (Digital River GmbH, 2005). The colorless background
suggests simplicity, lightness, and is regularly associated with lower-fat/healthy entities (Digital
River GmbH, 2005). For contemporary clothing stores, where the target audience is between
sizes 0-12 and often strives to maintain a healthy lifestyle, this subconscious ‘health’ impression
could have positive psychological effects. Research also suggests that green often symbolizes
growth, freshness, and harmony, while yellow indicates joy, energy, and honor (Digital River
GmbH, 2005). Success and money is synonymous with green, establishing an association with
business ’richness’ (Digital River GmbH, 2005). Green is believed to be the most restful color to
the human eye becoming an ideal balance for energy stimulating yellow. With an ability to
evoke pleasant and cheerful feelings, yellow is often used for product promotion and is
commonly aligned with items pertaining to leisure (Digital River GmbH, 2005). The
combination of respondents’ color scheme evaluations yielded a 4.65 mean. Once again, thirty-
nine of the forty respondents felt the colors of the store were good or very good, signifying that
the neutral backdrop with hints of soft greens and yellows was a favorable palette for this
particular audience.
Lighting
Compact florescent bulbs substituted the once energy-robbing, incandescent bulbs in order
to extend the life cycle of the lamps and improve efficiency, but not compromise the color
rendering qualities of the space. The model and brand selected was a Sylvania “Energy Star”
lamp which was designed to cast a warm, gentle glow, rather than the harsh brightness that
fluorescents are typically known for. Ideally, the lighting system would have undergone a major
overhaul, however budget and time limitations prohibited this. Instead, the new lighting scheme

56
was primarily designed to serve as ambient illumination for general tasks and orientation. In
designated areas, track heads were pointed directly on special displays to provide accent
illumination or key light. This type of lighting feature is often used in retail environments for
dramatizing key items and was completed only after the displays were put into place and the
merchandise was returned to the store. One hundred percent of respondents felt the general store
lighting was at least good, with 77.5% scoring it as very good. Having knowledge of the lighting
complaints customers had delivered in the previous space, this favorable result was slightly
unexpected. As mentioned, few technical modifications had been implemented; therefore, it may
be reasonable to assume that the overall positive evaluation was the result of several constituents
coming together to create one cohesive design. The combination of lighting (artificial and
natural), color, and material choices shed new light on the revamped space.
Although the fitting rooms’ pre-existing small chandeliers emitted minimal light, the
owner wished for them to stay. The brightness was increased slightly by removing the beaded
shades and increasing the bulb wattage, but the real impact came from the natural light that was
able to cross over the dropped curtain panel. Evaluations of the fitting rooms had the same
overall mean of 4.77 as the general lighting assessments did, revealing that it is possible to
achieve satisfactory lighting conditions by manipulating related design components beyond that
of the fixtures themselves.
Evaluation of Non-Design Elements
Four non-design, but retail related elements were examined to uncover shoppers’ feelings
towards the store’s operative components 1) mood, 2) location, 3) product variety, and 4)
customer service. Although mood is not an actual business element, it is believed to have a
noteworthy impact on people’s perceptions of their surroundings. Any combination of these
elements can play into the overall effect that store environments have on shoppers; thus, it may

57
be of considerable importance to convey this information to various retail professionals for
further use.
Mood
Mood has a profound effect on evaluation outcomes. Often, we perceive things as
wonderful and pleasurable when we are personally feeling positive and happy and, vice-versa.
The survey asked respondents to indicate their mood so that, if relevant, correlations between
mood and various elements could be made. Due to the results of the study, the need to further
isolate a variable and correlate with mood was unnecessary. A mean of 3.85 indicated that the
sample’s overall mood was neither extraordinarily high nor low, providing reasonable assurance
that the shoppers’ perceptions of the store were not notably impacted by the moods they
experienced at the time of the study.
Location
Location was an element that could not undergo any physical alterations. However, by
including this component on the survey, the owner was provided with a quantitative assessment
of how her customers perceive the store’s location. This information is very helpful to a retail
business owner. Although a majority of the respondents evaluated the location as good, eleven
specified it was neutral and one even felt it was bad. Another six respondents reported the
location was very good resulting in a range of opinions. This may imply that the location is
currently acceptable, but could possibly work better if moved elsewhere. Relocation would only
be a consideration if the owner felt that the potential of higher profits outweighs the cost of
moving. This is an extensive examination, requiring awareness of economic growth patterns and
access to future local development projects.
58
Product Variety
The merchandise, which was unchanged during the renovation process, was another non-
design element that customers were asked to critique. A mean of 4.27 implied that, in general,
the sample was pleased with the product offerings currently in the shop. Alternatively, it is
difficult to ascertain whether or not the merchandise rating was based solely on the product or if
the new display techniques and/or the modified store environment affected the shoppers’
perceptions.
Customer Service
Overall the response to customer service was very positive. Over 87% of respondents
rated it as very good. This result implies that the majority of customers felt that customer service
was above expected; yet in business there is always room for improvement. The owner may
elect to administer another survey that asks open-ended questions pertaining to ‘how’ the shop
can improve customer service and ‘what’ specialized assistance is desired by the customer base.
Evaluation of Extraneous Variables
The evaluation of two variables that contributed little to the study itself, but offered
valuable insight to the apparel industry, as well as the business owner were 1) the propensity to
purchase environmentally sensitive clothing, and 2) the likelihood of buying more when products
are discounted. Opinions regarding the former were non-extreme with a near even breakdown
across neutral, agree, and strongly agree. It is realistic to suppose that awareness of these types
of product offerings was minimal at the time of the study, however as the clothing industry
continues to educate consumers on the growing concern of environmentally responsible
manufacturing and design, this overall evaluation is likely to change. Recently, and specifically
in the last year, there has been a major shift in the efforts made by designers and manufacturers
to encourage vertically integrated earth-friendly practices. Organic cotton (pesticide free), the

59
use of bamboo fibers and abaca plants, and non-toxic vegetable dyes are all examples of eco-safe
apparel components being sold in the market today.
The results of whether shoppers are prone to buying more when products are discounted
were interesting. Although most respondents agreed that they buy more volume when items are
discounted, several did not. In fact, five disagreed, giving reason to believe these shoppers buy
what they like regardless of price. It may be advantageous to call this type of customer when
new merchandise arrives, while those that prefer discounted items can be notified when sales
occur. Understanding these customer characteristics may improve profits, as well as enhance
overall customer service perceptions.
Demographics
Nearly 70% of the sample was between the ages of 18–22, while the remaining 30% was
split almost evenly among those aged 23–30 and 31–40. Leisurely intent was the most
commonly reported reason for shopping, possibly indicating that these individuals are likely to
shop at stores that offer a pleasurable environment and/or a unique experience. Additionally,
most of the participants had heard of the boutique through a friend or relative. The sample also
chose the period between 2–4pm as the most preferred time of day to shop.
After the customer loyalty composite was compared against the participants’ mean
demographical characteristics, it was found that those within the age bracket of 31–40 and those
whom shop between 2–4pm tended to be the most loyal. Interestingly, the ANOVA analysis
found ‘special occasion’ to be the favored shopping intention amongst the most loyal customers,
which differs from the sample majority who chose ‘leisure’ as the most popular reason for
shopping.
The statistical analyses revealed interesting results, but could certainly be expanded upon
in future research studies. Possibilities for augmenting the information discovered here are

60
discussed in the following chapter, as is the consideration of specific modifications in order to
create a more statistically sound research project.

61
CHAPTER 5 CONCLUSION
In America and around the world, the specialty apparel industry is expanding at a rapidly
growing rate (Moore & Fairchild, 2003). Each month, dozens of high-fashion boutiques are
popping-up making it increasingly important for shop owners to uniquely differentiate
themselves (Moore & Fairchild, 2003). According to several retail analysts and researchers
(Moore & Fairchild, 2003; Paulins & Geistfield, 2003), store image and other marketing
competencies of a small business are integral to achieving customer loyalty and profitability. In
the fashion marketplace where product life cycles are short and aesthetics are celebrated, it is
often store image that helps frame shoppers’ opinions of the overall shop characterization (i.e.,
the quality of merchandise, the type of people that shop there, etc.). In fact, some argue
(Martineau, 1958; Arons, 1961; Kunkel & Berry, 1968) that store image may be the single most
important way for retailers to distinguish themselves from others. It involves several complex
layers with the physical aspect consisting of branding, packaging, and store design. Most retail
environment studies have focused on the physical components of large department stores or
national specialty stores with little focus on independently owned boutiques. This study is an
example of consumers’ evaluations of specific design elements and various marketing techniques
within an independently owned women’s apparel boutique.
Findings
The study found adequate indication that customers regarded the identified store features
as pleasurable and business appropriate; however, it did not produce definitive results about the
relationship between specific elements and their effect on customer satisfaction of total store
environment. All of the physical design elements 1) lighting, 2) color scheme, 3) atmospheric
conditions, and 4) overall style/design, and all of the non-design elements 1) mood of shopper, 2)

62
location of store, 3) merchandise variety, and 4) service quality were shown to have highly
favorable ratings amongst the pooled clientele. All of the respondents were female with the
majority falling between the ages of 18–22. The highest number of participants preferred to shop
between 2–4pm and were made aware of the shop predominantly through word-of-mouth. These
women reported shopping mostly for leisurely purposes and were not strongly influenced by
sales and markdowns. Results of the study show that an eclectically stylized fashion boutique,
which encompassed both urban and feminine features was appropriate for an apparel boutique
targeting trendy, college-aged/young professional women. An open layout that promoted social
interaction by incorporating home-like furniture arrangements was also well received. The use
of a mostly neutral color scheme with soft green and gold accents was positively evaluated, as
was the utilization of the perimeter wall space for a majority of the merchandise display
techniques.
The ANOVA analysis found that the most loyal of customers reported shopping between
2–4pm and fell between the ages of 31–40 years. It was also suggested that among the most
loyal were those who shop predominantly for special occasions, meaning they select this
boutique first when they are looking to buy something for an important occasion. Despite these
findings, customer demographics of shopping intentions, preferred time of day to shop, social
influences, and age were not shown to share a statistically significant relationship with overall
customer loyalty, due to the limited sample size.
Limitations of the Research
When understanding the results of the study, it is important to consider the limitations.
First, the sample population was gathered in a non-random fashion from the boutique’s existing
customer base resulting in a positive response bias. These customers had previously patronized
the store and by revisiting the shop, it is postulated that these individuals already hold favorable
63
tendencies towards the store environment. The purposive sampling technique generated a
repository of unique perspectives from actual users of the space; however, the use of this type of
sampling method greatly reduces generalization beyond that of the examined population.
A second limitation is the actual number of respondents that participated in the study.
Typically a sample size of forty participants would be sufficient for examining a specialized
niche market, but, because several analyses across groups were performed, a larger diversity
among the various classifications was needed.
A third limitation was the use of an after-only study design. The observational procedure
took place prior to the shop’s December redesign and involved shoppers who were unaware they
were being studied. This segment of the study then informed the experimental portion of the
study, where respondents completed store evaluation surveys two months after the redesign.
While the design features of the newly designed store were positively evaluated, it is difficult to
measure the redesign success, due to the lack of documented assessments of the original space.
Although the goal of this study was to determine if shop customers positively received the new
design, another study of interest may be to test customer perception of improvement by
performing a before-and-after study. In this case, it may be helpful to use the same sample group
for both experimental studies.
Lastly, had a pre-test of the questionnaire been conducted prior to executing the study, it is
possible that additional questions may have been incorporated, while others may have been
removed. For example, mood had no strong relevancy to other aspects of the questionnaire; thus,
it could have been eliminated. On the other hand, an open-ended question that asked customers
what they like or dislike about the store may have resulted in a stronger statistical analysis.

64
Implications for Research Findings
Interior designers are consistently charged with creating spaces that are both aesthetically
appealing, yet intuitively functional. In fashion retail spaces, other than merchandise, the
physical design elements ultimately dictate a certain style making it important to understand the
feelings customers have towards specific design features. It may also be of significance for
designers to be aware of how customer characteristics, such as age and reasons for shopping,
influence attitudes towards design features. This is especially beneficial when retailers are
targeting a specific market because designers can then tailor the store design to reflect those
preferences of the intended customer base.
Although specific to one particular apparel boutique, these findings may be useful to other
designers and retailers when determining what attributes effect consumers’ overall store
evaluations. Due to the nature of the experimental method, particular design features were
selected and then actually implemented in a real environment, lending credibility to the accuracy
of the evaluations. In essence, participants were truly experiencing an interaction with the
environment, rather than just presuming what their reactions might be through photos or mock-
ups. Additionally, the results may offer potential solutions for designers to consider when
designing high-fashion retail environments.
Comfort level with the store environment plays an influential role on shoppers’ length of
stay, as well as their likelihood to return. As previous research has shown (Donovan and
Rossiter, 1982), the more time shoppers spend in a given store, the more likely they are to make
a purchase. As a result, designers have the potential of significantly increasing a business’s
bottom line if they incorporate design techniques that hold patrons in a shop for an extended
period of time. The design knowledge and business information presented here offers both
retailers and designers a mixed use of solutions to consider when developing women’s apparel

65
boutiques. Understanding how these solutions evoke positive feelings within this specific
domain could help to cultivate similar responses if repeated in other related environments.
Directions for Further Research
The phenomenological concept of store image is continuously researched along with the
effects of store environment on customer satisfaction and buying intentions. Much of this
research has focused on large department stores and nationwide clothing chains with few of the
studies involving specialty shops. This study is an example of one particular clothing boutique’s
store environment, suggesting a foundation in which to further supplement with other specialty
shop research. It is recommended that comparable studies examine what store features and/or
design elements have the most impact on customer satisfaction. In turn, this information could
help guide conservative business owners as to which improvements are financially worthwhile to
undertake, while also proposing alternative solutions to the retail and design communities.
Researchers might also consider performing a similar case study to this one, but instead,
structure it as a before-and-after study design.
Importance of Design Elements
It would be instrumental to the retail industry and design professionals to further research
the level of importance boutique customers place on particular store design elements. In this
study, it was revealed how customers reacted to each identified feature as it had been
implemented in the boutique, while previous studies mainly involved large department stores
whose shoppers typically hold different store expectations than boutique shoppers. It may be
useful to understand how shoppers rank these various features and why. For example, color
scheme may play a large importance for one particular group; thus, it may make sense to
investigate what color properties are most appealing to that audience and of those colors, which
generate(s) a style that supports the desired store image.

66
Another study may find that customers at a specific store classify style as the most
important design feature. This might be approached in different ways, two of which are 1) to
develop a new measure for testing this type of procedure; or 2) to leverage existing preference
rating methods to use in conjunction with simulation or mock-up visuals for determining which
style is most preferred by the intended audience. Use of these visualization techniques will allow
the researcher to provide the sample with more illustrative options without having to physically
construct anything. By testing a specific feature’s various alternatives, it is possible that a
broader range of variation may occur and, as a result, produce more statistically significant
results.
Likewise, it may be interesting to investigate the ways in which small stores space plan or
demarcate their space. Perfumeries, apothecaries, social areas, and ‘salons’ are all becoming
desirable constituents located within independently owned boutiques. In essence, they are
‘boutiques within boutiques’. However, with most of these shops being relatively small (most
under 1200sq/ft), it would be interesting to examine if boutiques are actually embracing this
departmentalized concept, and if so, what techniques are they utilizing for layouts and general
spatial considerations. What other solutions can interior designers propose to retailers? Can
designers discover new solutions using other research practices? If so, what are these forms of
research and how can they contribute to the greater body of design knowledge.
Customer Preference of Boutique Design
Due to the ever-changing industry that fashion intuitively represents, apparel retailers must
often consider updating their store’s physical environment in order to portray a current image of
status and style. By testing customer perception of space improvement variations, designers and
researchers will be able to build a repository of cases that can be referenced if boutique retailers
desire multiple store environment examples. Pursuing this study type will also generate multiple

67
prototype examples, enabling designers to explore various scenarios in true environments. Are
physical environment improvements encouraging for existing shoppers? How willingly does this
audience embrace change? Do they interpret the modifications as positive or negative? How
frequently should a cutting-edge retailer alter interior environments? Is it more frequent than
classic stores, such as Talbots or Brooks Brothers?
Further, it may be beneficial to investigate if boutique customers really prefer a store
design that reflects the merchandise style. Does mirroring the two styles actually improve store
profitability? Will potential customers then typecast the store and elect to shop elsewhere if an
extreme style is dictated? Having answers to many of these questions could enhance designer
credibility amongst the retail industry and, even possibly, expand the creative design possibilities
for retail environments.
Conclusions
By definition, interior designers strive to enhance the human component of built
environments. These professionals study how physical surroundings affect the human
experience; therefore, presenting designers with supplementary solutions for retail environments
would augment a sector of this body of knowledge. Shown here, are positive customer reactions
to the identified retail design elements of atmosphere, style, color, and lighting in an upscale
women’s apparel boutique. Additionally, it is revealed how customers evaluated a boutique’s
business components of store location, product variety, and services. These findings reveal that
the implemented design selections were not only well received by existing shoppers, but also
considered pleasurable and desirable. Shoppers’ moods were also tested to see if it had an effect
on their evaluations; however, in this case, mood was not seen to have a noteworthy impact. The
results also uncovered the basic demographics of the boutique’s existing clientele, as well as
what age group is the most loyal and when these customers prefer to shop. It is postulated that
68
future boutique design research would considerably impact this growing market segment of
independently owned apparel specialty shops.

69
APPENDIX A FOOTPRINT OF ORIGINAL BOUTIQUE LAYOUT
Below is the form used for the behavior mapping exercise. The footprint is of the
boutique’s existing floor plan. It is not to scale, however it is proportionately representative of
the spatial relations and product placement methodologies.

70
APPENDIX B PHOTOGRAPHS OF THE EXISTING BOUTIQUE’S INTERIOR ENVIRONMENT
The following are photographs of the experimental boutique’s pre-existing style, layout,
and other design features.
Figure B-1. Existing Store Entry Right Side
Figure B-2. Existing Store Entry Left Side

71
Figure B-3. Existing Store Cash Wrap
Figure B-4. Existing Store Line-of-Sight

72
Figure B-5. Existing Store Denim Area
Figure B-6. Existing Store Jewelry Display
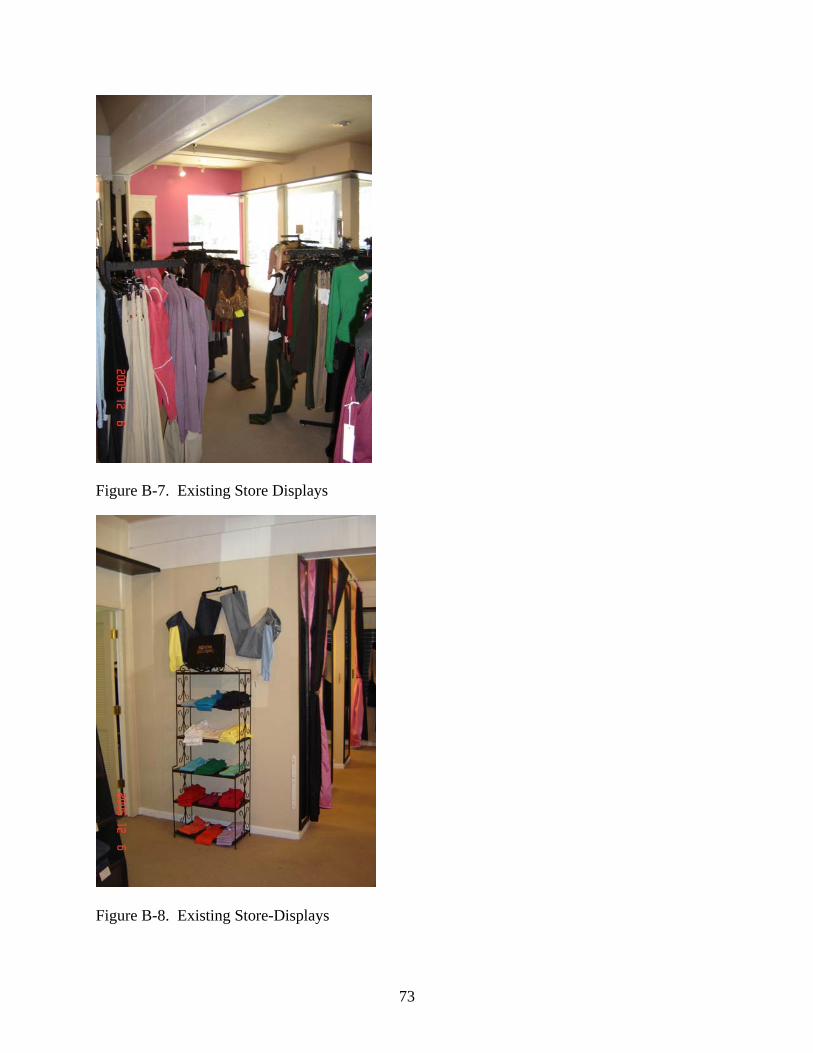
73
Figure B-7. Existing Store Displays
Figure B-8. Existing Store-Displays

74
APPENDIX C PHOTOGRAPHS OF THE BOUTIQUE’S DESIGN MODIFICATIONS
The following are photographs of the boutique after the design modifications had been
implemented.
Figure C-1. Modified Store, Entry Right Side
Figure C-2. Modified Store, Entry Left Side

75
Figure C-3. Modified Store, Cash Wrap
Figure C-4. Modified Store, Line-of-Sight

76
Figure C-5. Modified Store, Denim Area
Figure C-6. Modified Store, Jewelry Display

77
Figure C-7. Modified Store, Displays
Figure C-8. Modified Store, Displays

78
Figure C-9. Modified Store, Alternate View
Figure C-10. Modified Store, Alternate View

79
APPENDIX D DATA COLLECTION TOOL

80
APPENDIX E INFORMED CONSENT DOCUMENT
81

82
APPENDIX F INTSTITUTIONAL REVIEW BOARD

83
LIST OF REFERENCES
Areni, C. and Kim, D. (1994). The influence of in-store lighting on consumers’ examination of merchandise in a wine store. International Journal of Research Marketing, 11, 117-125.
Arons, L. (1961). Does television viewing influence store image and shopping frequency? Journal of Retailing, 37, 1.
Babin, B. and Attaway, J. (2000). Atmospheric affect as a tool for creating value and gaining share of customer. Journal of Business Research, 49, 91–99.
Baker, J., Levy, M. and Grewal, D. (1992). An experimental approach to making store environmental decisions. Journal of Retailing, 68, 4, 445–459.
Baker, J., Parasuraman, A., Grewal, D., and Voss, G. (2002). The influence of multiple store environment cues on perceived merchandise value and patronage decisions. Journal of Marketing, 66, 2, 120–141).
Bechtel, R. and Churchman, A. (2002). Handbook of Environmental Psychology. New York, NY: John Wiley and Sons, Inc.
Bellizzi, J. Crowley, A. and Hasty, R. (1983). The effects of color in store design. Journal of Retailing, 59, 21–45.
Berlyne, D. (1970). Novelty, complexity, and hedonic value. Perception and Psychophysics, 8, 279–286.
Boedeker, M. (1997) Recreational Shopping: The role of the basic emotional dimensions of personality. Turku, Finland: Publications of the Turku School of Economics and Business Administration, Series A-7.
Boulding, K. (1956). The Image. Ann Arbor, MI: The University of Michigan Press.
Bucklin, L. (1963). Retail strategy and the classification of consumer goods. Journal of Marketing, 27, 1, 50–55.
Digital River GmbH (2005). Color Wheel Pro: Color Meaning. Retrieved November 27, 2005, from Web site: http://www.color-wheel-pro.com/color-meaning.html.
Cuttle, C. (2004). Brightness, lightness, and providing ‘a preconceived appearance to the
interior’, Lighting Research & Technology, 36, 3 201–216.
Darden, W., Erdem, O., and Darden, K. (1983). Patronage Behavior and Retail Management, New York, NY: North-Holland.
Dawson, S., Bloch, P. and Ridgeway, N. (1990). Shopping motives, emotional states, and retail outcomes. Journal of Retailing, 66, 408–427.

84
Deeter-Schmelz, D., Moore, J. and Goebel, D. (2000). Prestige clothing shopping by consumers: a confirmatory assessment and refinement of the Precon Scale with managerial implications. Journal of Marketing Theory and Practice, Fall, 43–58.
DiNardo, A. (2005). Forthe & Towne. Visual Merchandising and Store Design, 137, 12, 24–29.
Donovan, R. and Rossiter, J. (1982). Store atmosphere: an environmental psychology approach. Journal of Retailing, 58, 1, 34–57.
Donovan, R., Rossiter, J., Marcoolyn, G. and Nesdlae, A. (1994). Store atmosphere and purchasing behavior. Journal of Retailing, 70, 3, 198–199.
Douglas, E. (1949). Measuring the general retail trading area – a case study. Journal of Marketing, 13, 4, 481– 497.
Dowling, R. (1993). Femininity, place and commodities: A retail case study. Antipode, 25, 4, 295–319.
Engel, J., Blackwell, R., and Miniard, P. (1995). Consumer Behavior, (8th ed.). Fort Worth: Dryden Press.
Eroglu, S., Machleit, K. and Davis, L. (2001). Atmospheric qualities of online retailing: A conceptual model and implications. Journal of Business Research, 24, 2, 177–184.
Experian/Applied Geographic Solutions. (2005). Apparel Detail Summary Report. Alachua County, FL.
Experian/Applied Geographic Solutions. (2005). Apparel Detail Summary Report. Hillsborough County, FL.
Fiske, J. (1989). Reading the Popular. Boston: Unwin Hyman.
Gardner. M. and Scott, J. (1990). Product type: A neglected moderator of mood. In M. Goldberg, G. Gorn, and R. Pollay (Eds.), Advances in Consumer Research (Vol. 17, 585–589). Provo, UT: Association for Consumer Research.
Gilboa, S. and Rafaeli, A. (2003). Store environment, emotions and approach behaviour: applying environmental aesthetics to retailing. International Review of Retail, Distribution and Consumer Research, 13, 2, 195–211.
Gordon, G. (2003). Interior Lighting. (4th ed.). Hoboken: John Wiley & Sons.
Gould, S. (1997). An interpretive study of purposeful, mood self-regulating consumption: The consumption and mood framework. Psychology & Marketing, 14, 4, 395–426.
Greenland, S. and McGoldrick, P. (1994). Atmospherics, attitudes, and behavior: modeling the impact of designed space. International Review of Retail, Distribution, and Consumer Research, 4, 1, 1–16.

85
Grout, L. & Wang, D. (2002). Architectural Research Methods. New York, NY: John Wiley and Sons.
Hattwick, M. (1950). How to use Psychology for Better Advertising. Englewood Cliffs, NJ: Prentice Hall, Inc.
Hayter, S. and Torcellini, P. (2000). A case study of the energy design process used for a retail application. Presented at the American Solar Energy Society (ASES) Conference – Madison, WI.
Howell, D. (2002) Kmart: Improve the in-store experience–give the consumer a reason to return. DSN Retailing Today, 41, 5, 30;51.
Jay, P. (2002). Review: Subjective criteria for lighting design. Lighting Research & Technology, 34, 2, 87–99.
Jones, F. (1936). Retail Stores in the United States. Journal of Marketing, 1, 2, 134–142).
Jones, M. (1999). Entertaining shopping experiences: An exploratory investigation. Journal of Retailing and Consumer Services, 6, 129–139.
Kelly, R. (1967). The semantic differential: an information source for designing retail patronage appeals. Journal of Marketing, 31, 4, 43–47.
Kerfoot, S., Davies, B., and Ward, P. (2003). Visual merchandising and the creation of discernible retail brands. International Journal of Retail & Distribution Management, 31, 3, 143–152.
Kincade, D. and Moye, L. (2003). Shopping orientation segments: exploring differences in store patronage and attitudes toward retail store environments among female apparel consumers. International Journal of Consumer Studies, 27, 1, 58–71.
Kotler, P. (1973). Atmospherics as a marketing tool. Journal of Retailing, 49,4 48–64.
Kumar, R. (2005). Research Methodology. (2nd ed.). Thousand Oaks: Sage Publications.
Kunkel, J. and Berry, L. (1968). A behavioral concept of retail images. Journal of Marketing, 32, 22.
Lindquist, J. (1974–5). Meaning of Image. Journal of Retailing, 50, 4, 29–38.
Luomala, H. (2003). Understanding how retail environments are perceived: a conceptualization and pilot study. International Review of Retail, Distribution and Consumer Research, 13, 3, 279–300.
Luomala, H. and Laaksonen, M. (2000). Contributions from mood research. Psychology & Marketing, 17, 3, 195–233.

86
Machleit, K. and Eroglu, S. (2000). Describing and measuring emotional response to shopping experience. Journal of Business Research, 44, 101–111.
Markin, R., Lillis, C., and Narayana, C. (1976). Social-psychological significance of store space. Journal of Retailing, 52, 1, 43–54; 94.
Martineau, P. (1958). The personality of the retail store. Harvard Business Review, 36, 47.
McDougall, G. and Fry, J. (1975). Combining two methods of image measurement: semantic differential and open-end technique. Journal of Retailing, 50, 4, 53–61.
Mehrabian, A. and Russell, J. (1974). An Approach to Environmental Psychology. Cambridge, MA:MIT Press.
Moore, M. and Fairhurst, A. (2003). Marketing capabilities and firm performance in fashion retailing. Journal of Fashion Marketing and Management, 7, 4, 386–397.
Mort, F. (1989). New Times: The Changing Face of Politics in the 1990s. The politics of consumption. London: Lawrence and Wishart, 160–172.
Nasar, J. (2000). Adult viewers preferences in residential settings. Environment and Behavior, 15, 5, 589–614.
Ng, C. (2002). Satisfying shoppers’ psychological needs: From public market to cyber-mall. Journal of Environmental Psychology, 23, 439–455).
O’ Cass, A. and Julian, C. (2001). Fashion clothing consumption: Studying the effects of materialistic values, self-image/product-image congruency relationships, gender and age on fashion clothing involvement study. Retrieved June 1, 2006, from Griffith University Gold Website: http://smib.vuw.ac.nz:8081/WWW/ANZMAC2001/anzmac/AUTHORS/pdfs/O'Cass2.pdf
Paulins, V. & Geistfeld, L. (2003). The effect of consumer perceptions of store attributes on apparel store preference. Journal of Fashion Marketing and Management, 7, 4, 371–385.
Pathak, D., Crissy,W., and Sweitzer. R. (1974). Customer image versus the retailer’s anticipated image. Journal of Retailing, 50, 4, 21–28; 116.
Rengel, R. (2003). Shaping Interior Space. New York: Fairchild Publications.
Ritterfeld, U. and Cupchick, G. (1996). Perceptions of interior spaces. Journal of Environmental Psychology, 16, 4, 349–360.
Ruling class: Today’s fashion ascribes to the rule of self-expression. Cotton Incorporated Lifestyle Monitor tracking research (2006). Women’s Wear Daily, p. 1.
Russell, J. and Pratt, G. (1981). A description of the affective quality attributed to environments. Journal of Personality and Social Psychology, 38, 2, 311–322.

87
Sherman, E., Mathur, A., and Smith, R. (1997). Store environment and consumer purchase behavior: Mediating role of consumer emotions. Psychology & Marketing, 14, 4, 361–378.
Sommer, R. and Sommer, B. (2002). Behavioral Research - Tools and Techniques. (5th ed.). New York: Oxford Press.
Summers, T. and Hebert, P. (2001). Shedding some light on store atmospherics – Influence of illumination on consumer behavior. Journal of Business Research, 54, 2, 145–150.
Tatzel, M. (1982). Skill and motivation in clothes shopping: fashion conscious, independent, anxious, and apathetic consumers. Journal of Retailing, 58, 2, 64–86.
Thang, D. and Tan, B. (2003). Linking consumer perception to preferences of retail stores: an empirical assessment of the multi-attributes of store image. Journal of Retailing and Consumer Services, 10, 193–200.
Thayer, R., Newman, J., and McCain T. (1994). Self-regulation of mood: Strategies for changing a bad mood, raising energy, and reducing tension. Journal of Personality and Social Psychology, 67, 910–925.
U.S. Department of Commerce (2005). Annual Benchmark Report for Retail Trade and Food Services: January 1992 through February 2005. U.S. Census Bereau.
Wilhide, E. (2001). Materials: A Directory for Home Design, Rockport Publishers, Inc., Gloucester, MA.
Whiton, S. and Abecrombie, S. (2002). Interior Design and Decoration. (5th ed). Upper Saddle, NJ: Prentice Hall.
Zeisel, J. (1981). Inquire by Design: Tools for Environment Behavior Research. (5th ed). Monterey, CA: Brooks/Cole.

88
BIOGRAPHICAL SKETCH
In March of 1977, Lauren was born in Chicago, Illinois. As the second daughter of Gary
and Susan Anderson, she was often known for talking excessively, taking risks, and being
creative. Throughout her adolescent years, Lauren frequently moved around, having taken up
residencies in Georgia, Michigan, and California, until she finally graduated from Lake Mary
High School in Orlando, Florida.
After receiving a fully paid scholarship, Lauren attended the University of Florida, where
she pursued a Bachelor of Science in business administration. While attending undergraduate
college and working part-time at a restaurant, the marketing major became involved in
community activities and held several sorority leadership positions. Following graduation in
May of 1999, Lauren went to Boston to pursue a Field Marketing position for a Software
Development firm. After two years of extensive travel and extended work hours, Lauren’s
creative side reemerged and she began taking night classes at the New England School of Art
and Design.
Before returning to University of Florida to pursue a Master of Interior Design, Lauren
took a quick hiatus to San Francisco, where she managed a friend’s contemporary women’s
boutique and explored the beautiful west coast. Having worked in retail since 16 years of age,
Lauren had a strong interest in fashion and was beguiled by the phenomenological concept of
store image. She was particularly interested in how store environment impacts the consumer.
Throughout attending the Interior Design graduate program, Lauren worked at an upscale
women’s apparel boutique, which ultimately was the impetus for this topic of study.
Today, Lauren owns and operates her own contemporary women’s boutique in Tampa,
Florida, where she has successfully implemented several of the marketing practices and design
recommendations mentioned in this study.