Embed Size (px)
Citation preview
i
Forest Resources Assessment Working Paper 162
CASE STUDIES ON MEASURING AND ASSESSING
FOREST DEGRADATION
MONITORING DEGRADATION IN THE SCOPE OF REDD
THOMAS BALDAUF
DANIEL PLUGGE
AZIZA RQIBATE
MICHAEL KÖHL
December, 2009

ii
Sustainably managed forests have multiple environmental and socio-economic functions which are important at the global, national and local scales, and they play a vital part in sustainable development. Reliable and up-to-date information on the state of forest resources - not only on area and area change, but also on such variables as growing stock, wood and non-wood products, carbon, protected areas, use of forests for recreation and other services, biological diversity and forests’ contribution to national economies - is crucial to support decision-making for policies and programmes in forestry and sustainable development at all levels.
Under the umbrella of the Global Forest Resources Assessment 2010 (FRA 2010) and together with members of the Collaborative Partnership on Forests (CPF) and other partners, FAO has initiated a special study to identify the elements of forest degradation and the best practices for assessing them. The objectives of the initiative are to help strengthen the capacity of countries to assess, monitor and report on forest degradation by: � Identifying specific elements and indicators of forest degradation and degraded forests; � Classifying elements and harmonizing definitions; � Identifying and describing existing and promising assessment methodologies; � Developing assessment tools and guidelines
Expected outcomes and benefits of the initiative include: � Better understanding of the concept and components of forest degradation; � An analysis of definitions of forest degradation and associated terms; � Guidelines and effective, cost-efficient tools and techniques to help assess and monitor forest
degradation; and � Enhanced ability to meet current and future reporting requirements on forest degradation.
The Global Forest Resources Assessment programme is coordinated by the Forestry Department at FAO headquarters in Rome. The contact person is: Mette Løyche Wilkie Senior Forestry Officer FAO Forestry Department Viale delle Terme di Caracalla Rome 00153, Italy E-mail: [email protected]
Readers can also use the following e-mail address: [email protected] More information on the Global Forest Resources Assessment programme can be found at: www.fao.org/forestry/fra
The coordinators of this work would like to acknowledge the financial contributions made by the Governments of Finland and Norway and by FAO, the GEF BIP programme and ITTO.
DISCLAIMER
The Forest Resources Assessment (FRA) Working Paper Series is designed to reflect the activities and progress of the FRA Programme of FAO. Working Papers are not authoritative information sources – they do not reflect the official position of FAO and should not be used for official purposes. Please refer to the FAO forestry website (www.fao.org/forestry ) for access to official information.
The FRA Working Paper Series provides an important forum for the rapid release of information related to the FRA programme. Should users find any errors in the documents or would like to provide comments for improving their quality they should contact [email protected].

iii
�Forestry Department Food and Agriculture Organization of the United Nations
Forest Resources Assessment Working Paper
Case Studies on Measuring and Assessing
Forest Degradation
Monitoring degradation in the scope of REDD
Thomas Baldauf Daniel Plugge Aziza Rqibate Michael Köhl
December 2009
___________________________________________________________ Forest Resources Assessment Programme Working Paper 162 Rome, Italy, 2009

iv

v
Abstract
Deforestation and forest degradation are major sources of greenhouse gas emissions (GHG). Reducing emissions from deforestation and forest degradation (REDD) as a likely component of a global post-Kyoto regime, i.e. after 2012, implies operational and cost efficient monitoring methodologies for providing reliable estimates of the respective forest biomass and carbon pools.
Presently, methodologies to observe biomass and carbon stock change in the world’s forest area are studied. To be cost effective, integrated methods, utilizing terrestrial surveys and remote sensing data, are widely applied. Suitable methods providing tolerable information on forest biomass change are available for assessing deforestation, which can be defined as the complete removal of a forest area. However, for detecting degradation, which in the context of REDD applies to the partial loss of biomass, even the adoption of existing methods encounters severe constraints.
Here we present a comprehensive methodology, which is intended to provide figures on both deforestation and forest degradation in the scope of REDD. The conceptual work for this methodology will be the main focus for this presentation.
Key words: REDD, degradation, integrated inventory, human impact

vi

1
1. Introduction
As one of the major anthropogenic Carbon dioxide (CO2) sources, deforestation and forest degradation are accountable for about 20 percent of the annual worldwide CO2 release (see IPCC, 2003). Reducing emissions from deforestation and forest degradation (REDD) as a likely component of a post-Kyoto regime implies an operative monitoring methodology for providing high quality data on forest biomass and its changes.
Presently, methodologies are evaluated to observe biomass stock and change in the world’s forests. Mostly integrated methods, like terrestrial surveys in combination with remote sensing data, are applied. Results show that for the assessment of deforestation suitable methods for quantifying forest biomass change already exist or existing methods can be adapted. However, the situation of forest degradation is different and renders the development of new approaches necessary.
In cooperation with local research institutions the Johann Heinrich von Thünen-Institute conducts research to develop:
1. A sound, reliable and operational method for measuring and monitoring the current state and changes over time of carbon stocks, and
2. An assessment of the driving factors of deforestation and forest degradation in order to provide guidance for policy makers concerning the effective allocation of possible REDD incentives.
Pilot projects are being carried out in Madagascar (started in 2007), Vietnam (started in 2008) and Brazil (started in 2009), in order to develop and test efficient methods for the quantitative determination of forest degradation and its dynamics. These projects are funded by the Federal Ministry for Food, Agriculture and Consumer Protection (BMELV).
2. Materials and methods
The assessment of deforestation and forest degradation renders a holistic methodology necessary. On the one side, this methodology combines terrestrial forest biomass assessment with a multilayered remote sensing approach. The terrestrial assessment provides local data on current biomass/carbon stocks. Their extrapolation through remote sensing forms the basis for figures on further aggregation levels. On the other side, the methodology includes the investigation of the relative importance of human impact on forests, differentiated in economic motivation and cultural background. The combination of these two aspects facilitates the development of political instruments for efficient benefit transfer, thus providing good starting points for measures to reduce deforestation and degradation.
One key issue of the developed methodology is the assessment of carbon stock by the means of an integrated inventory focussing on the two processes deforestation and forest degradation.

2
Figure 1: Overview of the integrated inventory methodology. RBS = Randomized Branch Sampling (Baldauf et al., 2009).
As field surveys are time consuming and expensive especially in remote and difficult to assess areas, they are not conducted as full tallies but realised by statistical sampling approaches (Köhl et al., 2006). The proposed assessment method for monitoring current state and changes of forest carbon stock in a REDD regime utilizes the potential of remote sensing imagery to assess spatially explicit data on large forest areas in combination with sample based field surveys to capture sensitive changes in forest biomass stock by an integrated remote sensing/ in-situ assessment. A full coverage of the inventory area (wall-to-wall map) is obtained by remote sensing imagery. Within the wall-to-wall map thematic classes (e.g. non-forest and forest areas, explicit forest formations within the forest areas) are obtained by classifying the remote sensing imagery data. The thematic classes are considered to be homogeneous groups or strata. Within each stratum sample based field surveys are conducted, which aim at the assessment of the growing woody biomass. The sampling design associated with this approach is stratified (random) sampling (Cochran, 1977, Köhl et al., 2006).
The second key issue is the development of an assessment methodology of human impact on forests. Here a framework is required to assess the complex causes of deforestation and forest degradation (DD) including macroeconomic variables and numerous socio-economic parameters which interact with each other. Angelsen and Kaimowitz (1999) proposed the following framework for the analysis of the causes of DD (see Figure 2).
Thereby the needs of the forest users, i.e. the local population which satisfies their timber demands through DD, can be analysed. The investigation includes several steps which allow understanding to what kind of needs the forest corresponds by providing goods and services. Each individual demand is the object of a detailed analysis.

3
Figure 2: Underlying and direct causes influence the choice of the agent of DD. (According to Angelsen and Kaimowitz (1999))
Basic needs of the forest users, e.g. the use of fuel wood for cooking or respecting cultural traditions by collecting special wood for ceremonies, are a driving factor for DD. An overview on the analysis process is illustrated in Figure 3.
NEEDS ANALYSIS
Causes of deforestation and degradation
Explanatory variables
Input for the baseline and requirements for the development of adapted incentives
Data collection: Indirect procedure
Data collection: Direct procedure
Statistic tools
Input: Output:
Figure 3: Needs analysis process.
This approach takes into account the interactions between the elements which are involved in the processes of DD (e.g. actors, tenure and tradition). Furthermore, an analysis of the functions of these processes, which allow satisfying the needs of the users, is a major focus and is used to clearly characterize complex situations.
3. Results and Discussion
The term degradation itself is ambiguous, not yet defined and far from being globally agreed. Nevertheless, REDD has thrown a new spotlight on degradation, however only referring to carbon stock. Hence, to derive figures on deforestation and forest degradation, an initial step was the definition of these processes for the case study in Madagascar.
Figure 4 illustrates the findings and considers recent publications, such as IPCC (2003), DeFries et al. (2006), FAO (2007) and Olander (2008).

4
re-moved
Deforestation
Deforestation
Degradation
Degradation
Degradation
Degradation
Degradation
Degradation
Degradation
Degradation
time
forest open forest
Sta
tus undis-
turbed disturbed
no forest
Deforestation
to be
defined
to
be
defined
to be
defined
LCC
Fig
ure
4: T
his
figu
re il
lust
rate
s th
e di
ffer
entia
tion
of th
e pr
oces
ses
of d
efor
esta
tion
and
fore
st d
egra
datio
n. I
n th
e le
ft-m
ost c
olum
n th
e IP
CC
de
fini
tions
(fo
rest
, ope
n fo
rest
and
no
fore
st)
are
used
as
land
-cov
er (
LC
) cl
asse
s. I
n th
e ri
ght c
olum
n th
e St
atus
is f
urth
er c
lass
ifie
d in
to
undi
stur
bed,
dis
turb
ed a
nd r
emov
ed. T
he g
raph
on
the
righ
t sho
ws
vari
ous
proc
esse
s of
def
ores
tati
on, i
.e. c
hang
e fr
om fo
rest
to n
o fo
rest
, and
of
degr
adat
ion,
i.e.
fore
st to
fore
st/o
pen
fore
st o
ver
time.

5
Deforestation can be identified as a change of forest area into other land cover classes. Quantifying forest degradation was found to be technically more challenging (see Figure 5).
Figure 5: This figure shows a falsecolor (RGB: near-infrared/blue/green) satellite image of SPOT5 with a spatial resolution of 5m. (Blue/green areas = currently deforested, intense light red spots = former deforested).
Remote sensing provides spatially explicit data on forest areas and by multi-temporal approaches on forest area changes. However, optical remote sensing sensors fall short when it comes to the assessment of sensitive changes in standing woody biomass (Köhl and Kushwaha, 1994). Especially in natural forests in the tropics and subtropics, which are characterised by heterogenic vertical stand structures and contiguous canopy covers, degradation can only be detected in a rather late state of degradation, when the formerly closed canopy cover is dissolved (Figure 6).
Figure 6: Different stati of forest degradation and potential of detection by optical remote sensing techniques. (left = undisturbed, middle = stealthy degradation, right = detectable degradation).

6
The human impact study in Madagascar was conducted in order to identify the causes of DD by the assessment of explanatory variables, and provide input for the development of a baseline and the identification of adapted incentive schemes (see Figure 7).
Figure 7: Methodology for the assessment of human impact on forests (Rqibate et al., 2009).
Within the “Good Practice Guidance for Land Use, Land-Use Change and Forestry” IPCC (2003) stratification rules for forest formations related to aboveground biomass stocks are presented, which can be applied worldwide.
The implementation of these rules provided the possibility to identify assessment areas, which ought to be representative for these strata. Due to time restrictions a further aggregation of the categories proposed by IPCC to only three categories was realized and resulted in the following regionalisation of the country and identification of assessment areas (see Figure 8).
Figure 8: Regionalisation of country's land area based on aggregated IPCC categories; black boxes show the identified assessment areas.
7
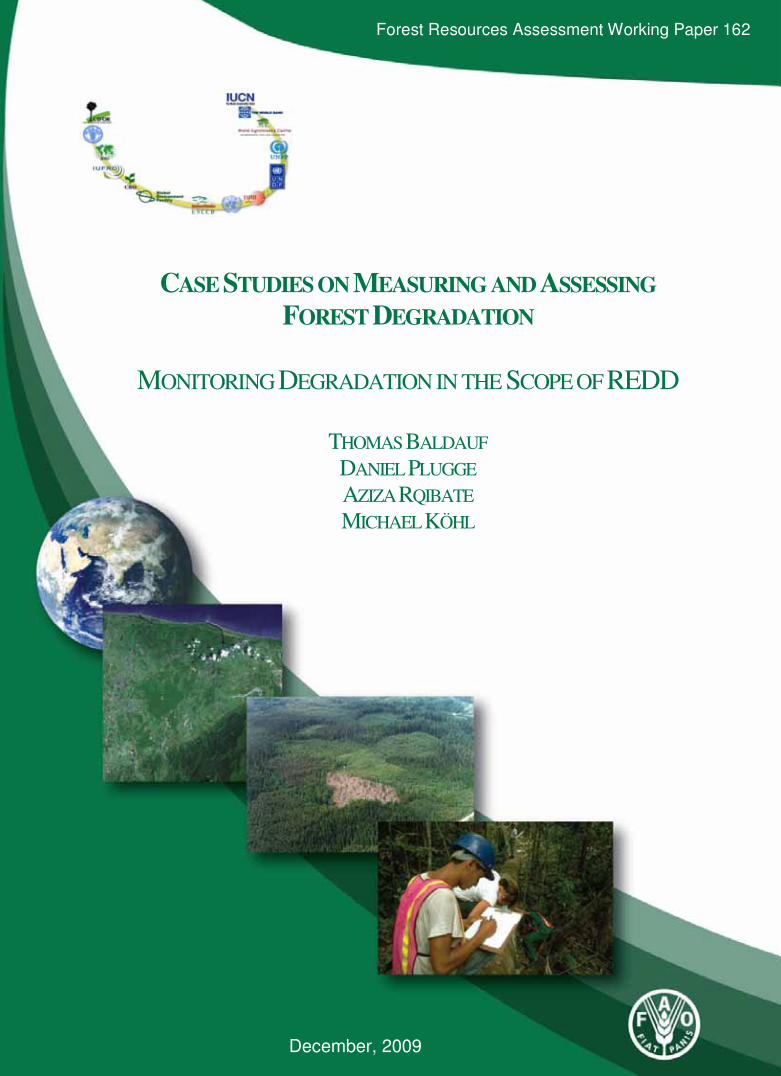
The method was implemented in all three assessment areas, however in the following the focus is set on the area of “Manompana”, located in the north-east of Madagascar and representing tropical wet forest. The total area of this site is 46095ha. In Manompana there are 2410 households1.
The human impact study discovered that every household is forest dependent.
Figure 9: Distribution of incomes of the local population, which are directly linked to deforestation and degradation.
The three classes of income Cash crops (10.2 percent) and “tavy” (51.4 percent) i.e. slash and burn, and logging (38.4 percent) could be quantified. The products issued from slash and burn, are used in 90 percent of the cases for self consumption. The traditional practice of “tavy” is also a way to get access to the property. Thereby the farmer can assure the subsistence of the family and spread their cultivated area. In Manompana, a household converts each year 0.6 ha of forest into cultivated area for having a source of income and subsistence. This results in a forest area change of about 1446 ha/year or about 435.181 t/year of above ground biomass, respectively. Additionally, it could be identified that about 82 percent of the local population extract wood for construction purposes, accounting for 11.173 t/year of above ground biomass.
����������� ������������������������������� �������

8
The in-situ assessment identified four domains in the respective area (Manompana) (see Figure 10).
Figure 10: Area fractions of the domains identified by the in-situ assessment
To distinguish between the domains the canopy cover (forest vs. open forest) as well as the land use (open forest vs. agriculture, non forest) were considered. In some areas of the open forest domain human impact leading to degradation could be deduced, while the agroforestry and non forested areas are a clear result of human impact (slash and burn activities).
Table 1 shows the percentage of biomass that is left in the domains open forest and agroforestry in comparison to forest (100 percent).
�
Table 1: Mean AGB per domain and Percentage of mean AGB compared to AGBforest (AGB = Aboveground biomass)
Domain mean AGB Percentage of mean AGBforest
forest 293 t/ha 100%open forest 184 t/ha 63%agroforestry 118 t/ha 40%
�
The percentage of aboveground biomass that is left in the domains of open forest and agroforestry is still high compared with the forest domain. It tends to be lower when other test-sites are considered with even higher pressure on the forest or broader utilization of resources.
9
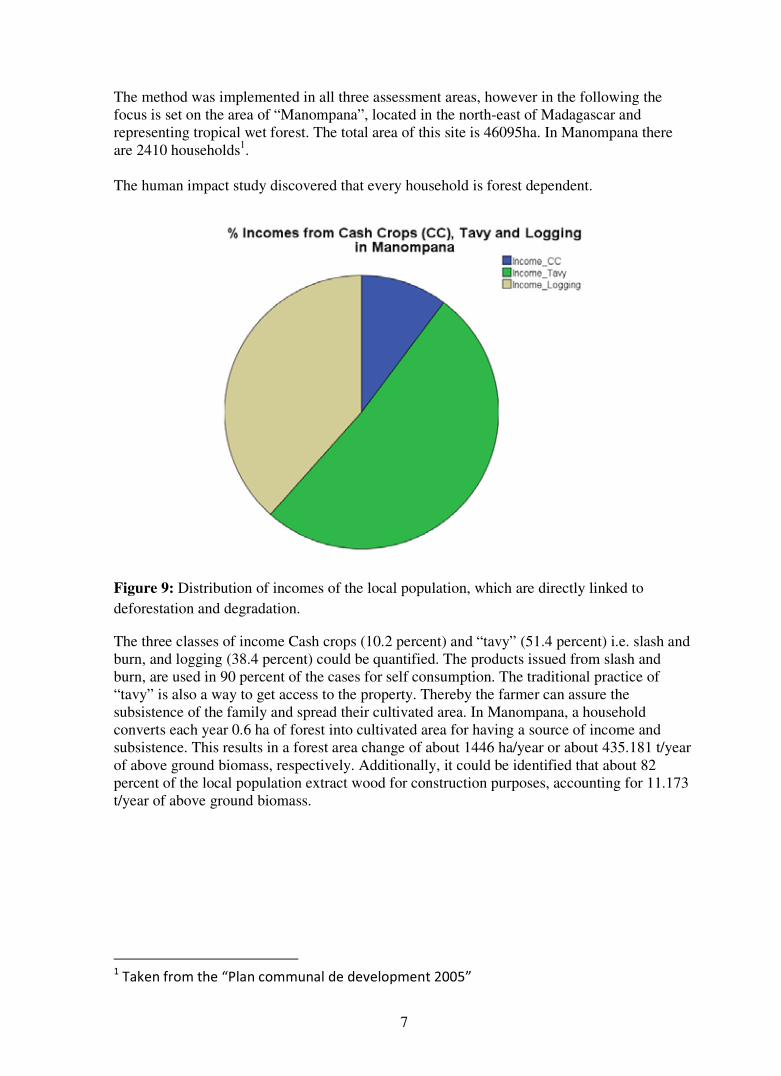
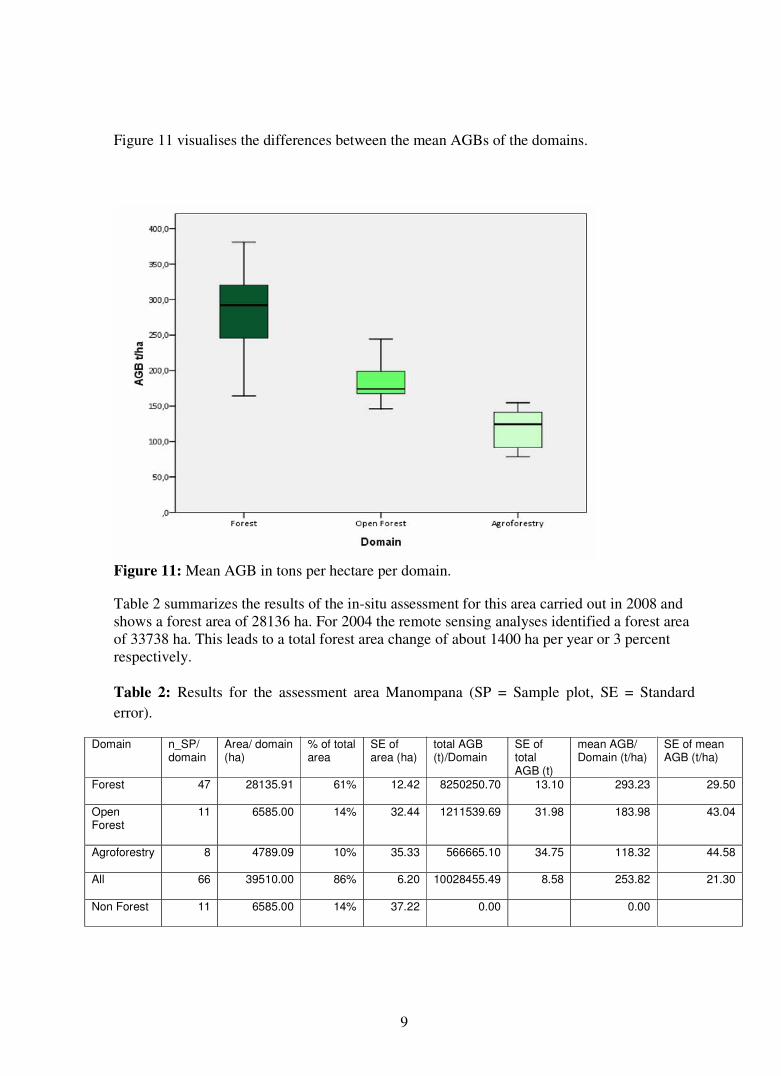
Figure 11 visualises the differences between the mean AGBs of the domains.
Figure 11: Mean AGB in tons per hectare per domain.
Table 2 summarizes the results of the in-situ assessment for this area carried out in 2008 and shows a forest area of 28136 ha. For 2004 the remote sensing analyses identified a forest area of 33738 ha. This leads to a total forest area change of about 1400 ha per year or 3 percent respectively.
Table 2: Results for the assessment area Manompana (SP = Sample plot, SE = Standard error).
Domain n_SP/ domain
Area/ domain (ha)
% of total area
SE of area (ha)
total AGB (t)/Domain
SE of total AGB (t)
mean AGB/ Domain (t/ha)
SE of mean AGB (t/ha)
Forest 47 28135.91 61% 12.42 8250250.70 13.10 293.23 29.50
Open Forest
11 6585.00 14% 32.44 1211539.69 31.98 183.98 43.04
Agroforestry 8 4789.09 10% 35.33 566665.10 34.75 118.32 44.58
All 66 39510.00 86% 6.20 10028455.49 8.58 253.82 21.30
Non Forest 11 6585.00 14% 37.22 0.00 0.00

10
4. Conclusions
In forest dependent communities’ self-consumption is the major driver for DD. Therefore approaches to avoid DD need to address the demands of the local population, in order to avoid incoherence to the Millennium Goals.
The cross validation of the results of the human impact study with the combined inventory method identifies a difference of about 46ha per year or 3 percent. This reflects the shortcomings of the performed remote sensing procedures.
Assessing stealthy degradation (see Figure 6) can only be detected by field surveys. To guarantee cost efficiency sampling should be intensified in areas under change. This intensification can be guided by additional stratification utilizing remote sensing data prior to the in-situ phase, resulting in the identification of e.g. forest boundaries or zones near to infrastructure facilities. These areas are more likely to be influenced by DD.
While optical sensors record reflections rather of the objects surface, the X- and C- Band of RADAR is sensitive to small twigs and leaves, and the L-Band with its long wavelength is reflected by larger structures (see Figure 12). This circumstance allows radar-data to show even remote sensed information about the structures beneath the forest canopy.
Figure 12: Conceptual differences in the depth to which various sensors can penetrate into the forest canopy; Adapted from Wulder and Franklin (2003).

11
Shortcomings of radar-imagery in the past, e.g. only limited spatial resolution, have been identified and changed in recent sensor techniques, e.g. TerraSAR-X data.
Acknowledgements
We would like to thank our colleagues with whom we could cooperate in Madagascar in the REDD-FORECA project, GTZ, IC and ESSA Forêts. Special thanks go to Dr Thomas Riedel and Dr Aljoscha Requardt, Institute for World Forestry, Hamburg. Furthermore, we would like to thank Matthias Schwörer and Dr. Eckhard Heuer, Federal Ministry of Food, Agriculture and Consumer Protection (BMELV), Bonn, Germany, and Reinhard Wolf, Deutsche Gesellschaft für Technische Zusammenarbeit (GTZ), Eschborn, Germany, for numerous, rewarding discussions and helpful comments.

12
References
Angelsen, A., Kaimowitz, D. 1999. Rethinking the causes of deforestation: lessons from economic models. The World Bank Research Observer 14, 73-98.
Baldauf, Thomas; Plugge, Daniel; Rakoto Ratsimba, Harifidy; Rajoelison, Gabrielle; Köhl, Michael (2009): Biomass Survey in the REDD-FORECA project in Madagascar. Presentation held at REDD-FORECA project meeting at 29th May 2009, Ministry of Food, Agriculture and Consumer Protection (BMELV), Bonn.
Cochran, W. G. 1977. Sampling Techniques. New York: Wiley.
FAO (2007): Definitional issues related to reducing emissions from deforestation in developing countries. By Dieter Schoene, Wulf Killmann, Heiner von Lüpke and Mette Loyche Wilkie. Rome: FAO (Forests and Climate Change Working Paper 5).
DeFries, Ruth; Achard, Frédéric; Brown, Sandra; Herold, Martin; Murdiyarso, Daniel; Schlamadinger, Bernhard; Souza, Carlos de, JR. (2006): Reducing Greenhouse Gas Emissions from Deforestation in Developing Countries: Considerations for Monitoring and Measuring. Report of the Global Terrestrial Observing System (GTOS) number 46. GOFC-GOLD report 26. Rome.
IPCC 2003: Definitions and Methodological Options to Inventory Emissions from Direct Human-induced Degradation of Forests and Devegetation of Other Vegetation Types. Hayama, Kanagawa.
Köhl, M., Kushwaha, S.P.S. 1994: A Four-Phase Sampling Method for Assessing Standing Volume Using Landsat-TM-Data, Aerial Photography and Field Assessments, Commonwealth Forestry Review, 73(1): 35-42
Köhl, Michael; Magnussen, S.; Marchetti, Marco 2006 Sampling methods, remote sensing and GIS : multiresource forest inventory. Heidelberg: Springer.
Olander, Lydia P.; Gibbs, Holly K.; Steininger, Marc; Swenson, Jennifer J.; Murray, Brian C. (2008): Reference scenarios for deforestation and forest degradation in support of REDD: a review of data and methods. In: Environmental Research Letters, Jg. 3, H. 2, S. 25011.
Rqibate, Aziza; Rabefarihy, Tahiry; Rabemananjara, Zo; Ramamonjisoa, Bruno; Köhl, Michael (2009): Socio-Economic Survey in the REDD-FORECA project in Madagascar. Presentation held at REDD-FORECA project meeting at 29th May 2009, Ministry of Food, Agriculture and Consumer Protection (BMELV), Bonn.
Wulder, Michael A.; Franklin, Steven E. 2003: Remote sensing of forest environments. Concepts and case studies. Boston: Kluwer Acad. Publishers.

13