Embed Size (px)
Citation preview

Case studies on managing quality, assuring safety and reducing post-harvest losses in fruit and vegetable supply chains in South Asian Countries


FOOD AND AGRICULTURE ORGANIZATION OF THE UNITED NATIONSRome, 2018
Prepared byElda B. Esguerra, Lead Post-harvest Consultant
Post-harvest Horticulture Training and Research CenterCrop Science Cluster, College of Agriculture
University of the Philippines Los Baños College, The Philippines
Technically Edited by Rosa S. Rolle, Ph.D
Senior Food Systems OfficerNutrition and Food Systems Division
Food and Agriculture Organization of the United Nations
TCP\RAS\3502Reduction of Post-harvest Losses in Horticultural Chains
in South Asian Association for Regional Cooperation Countries
Case studies on managing quality, assuring safety and reducing post-harvest losses in fruit and vegetable supply chains
in South Asian Countries

The designations employed and the presentation of material in this information product do not imply the expression of any opinion whatsoever on the part of the Food and Agriculture Organization of the United Nations (FAO) concerning the legal or development status of any country, territory, city or area or of its authorities, or concerning the delimitation of its frontiers or boundaries. The mention of specific companies or products of manufacturers, whether or not these have been patented, does not imply that these have been endorsed or recommended by FAO in preference to others of a similar nature that are not mentioned.
The views expressed in this information product are those of the author(s) and do not necessarily reflect the views or policies of FAO.
ISBN 978-92-5-130345-0
© FAO 2018
FAO encourages the use, reproduction and dissemination of material in this information product. Except where otherwise indicated, material may be copied, downloaded and printed for private study, research and teaching purposes, or for use in non-commercial products or services, provided that appropriate acknowledgement of FAO as the source and copyright holder is given and that FAO’s endorsement of users’ views, products or services is not implied in any way. All requests for translation and adaptation rights, and for resale and other commercial use rights should be made via www.fao.org/contact-us/licence-request or addressed to [email protected]. FAO information products are available on the FAO website (www.fao.org/publications) and can be purchased through [email protected].
Cover photograph©FAO/Chris Steele-Perkins/Magnum Ph
Recommended citationFAO. 2018. Case studies on managing quality, assuring safety and reducing post-harvest losses in fruit and vegetable supply chains in South Asian Countries by Rolle S. R., Esguerra E.B. Rome.

iii
Contents
Foreword vii
Abbreviations and acronyms viii
Introduction 1
Chapter 1Case study of bananas in Sri Lanka 3
1.1 Overview of the Banana Supply Chain 31.2 Technical innovations and practices introduced for bananas 51.3 Banana: Analysis of Results 61.4 Response of stakeholders in the banana supply chain 101.5 Bananas: conclusions and recommendations 10
Chapter 2Case study of cauliflower in Nepal 11
2.1 Overview of the cauliflower supply chain 112.2 Technical innovations and practices introduced for cauliflower 122.3 Cauliflower: analysis of results 142.4 Response of stakeholders in the califlower supply chain 172.5 Cauliflower: conclusions and recommendations 18
Chapter 3Case study of mandarin in Nepal 19
3.1 Overview of the mandarin supply chain 193.2 Technical innovations and practices introduced for mandarin 203.3 Mandarin: analysis of results 223.4 Response of stakeholders in the mandarin supply chain 243.5 Mandarin: conclusions and recommendations 24
Chapter 4Case study of mango in Bangladesh 27
4.1 Overview of the mango supply chain 274.2 Technical innovations and practices introduced for mango 284.3 Mango: analysis of results 314.4 response of Stakeholders in the mango supply chain 344.5 Mango: conclusions and recommendations 36
Chapter 5Case study of snap beans in Sri Lanka 37
5.1 Overview of the snap bean supply chain 375.2 Technical innovations and practices introduced for snap beans 405.3 Snap beans: analysis of results 405.4 Response of stakeholders in the snap beans supply chain 425.5 Snap bean: conclusion and recommendation 42

iv
Chapter 6Case study of winter tomato in Bangladesh 45
6.1 Overview of the winter tomato supply chain 456.2 Technical innovations and practices introduced for winter tomato 476.3 Winter tomato: analysis of results 486.4 Response of stakeholders in the winer tomato supply chain 526.5 Winter tomato: conclusions and recommendations 52
References 53
TABLES1 Traditional and improved banana post-harvest operations 62 Losses in the traditional and improved banana supply chains 83 Farmer: benefits of dehanding and using plastic crates for bulk packaging and
transportation 94 Wholesaler: benefits of dehanding and using plastic crates for bulk packaging and
transportation 95 Retailer: benefits of dehanding and using plastic crates for bulk packaging and
transportation 96 Cauliflower: traditional and improved post-harvest operations 147 Cauliflower: summary of losses in traditional and improved post-harvest practices. 158 Farmer: benefits of trimming 169 Wholesaler: benefits of trimming 1610 Retailer: benefits of trimming 1711 Wholesaler: benefits of using plastic crates for bulk packaging of produce for
transportation 1712 Retailer: benefits of wrapping cauliflower curds with plastic film 1813 Mandarin: traditional and improved post-harvest operations 2214 Mandarin: losses in traditional and improved supply chain 2315 Wholesaler: benefits of harvesting mandarins at correct maturity 2416 Retailer: benefits of harvesting mandarins at correct stage of maturity 2417 Traditional and improved post-harvest handling operations and technologies
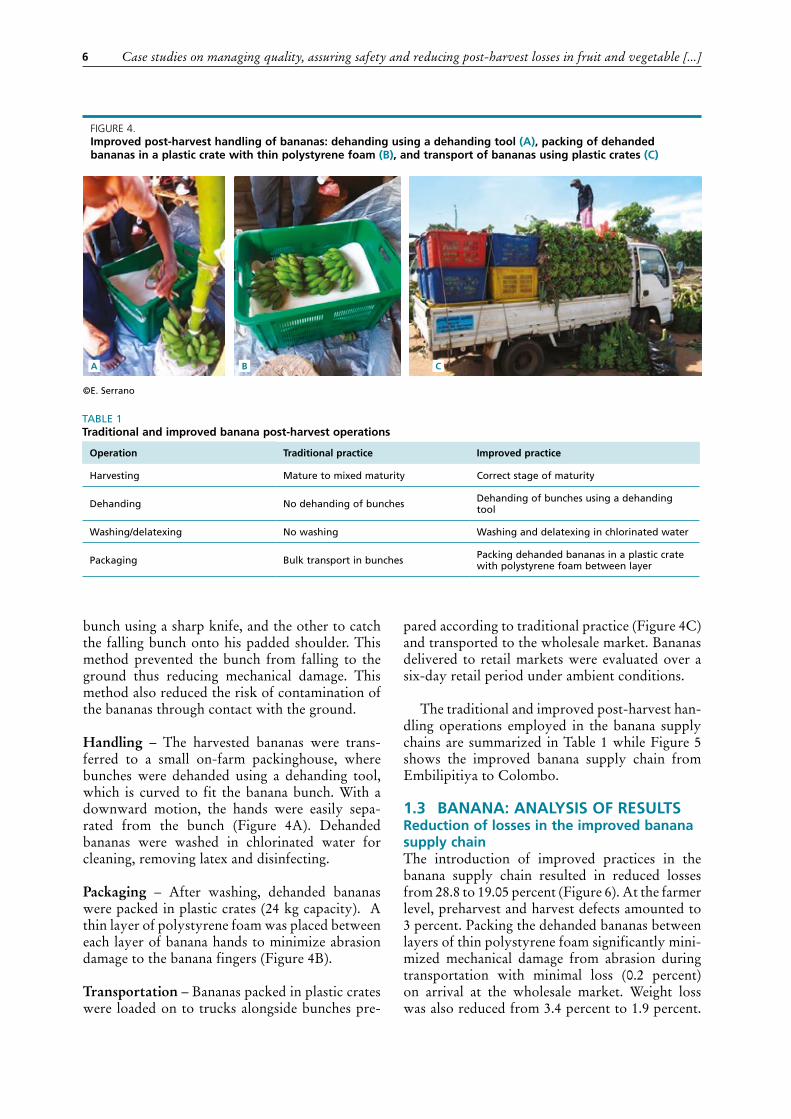
during the pilot demonstration in the mango supply chain 3018 Losses in the traditional and improved mango supply chain. (Source: field data) 3319 Summary of gross returns obtained with improved practice of HWT versus
the traditional practice of no HWT during the five-day retail period 3520 Retailer: benefits on day three after applying HWT improved practice 3521 Retailer: benefit on day five after applying HWT improved 3522 Snap beans: traditional and improved post-harvest operations 4023 Snap beans: losses in the traditional and improved supply chain 4124 Farmer: benefits of using plastic crates for bulk packaging and transportation 4325 Wholesaler: benefits of using plastic crates for bulk packaging and transportation 4326 Retailer: benefits of using plastic crates for bulk packaging and transportation 4327 Winter tomato: traditional and improved post-harvest operations 4828 Winter tomato: losses in the traditional and improved supply chains 5029 Wholesaler: benefits of using plastic crates for bulk packaging and transportation 5130 Retailer: benefits of using plastic crates for bulk packaging and transportation 51

v
FIGURES1 Schematic of traditional banana supply chain from Embilipitiya to Colombo 32 Traditional handling practices for bananas: bunches are carried on
the shoulder (A) or a three-wheel cart is used (B); bunches of bananas at the collection centre (C); and retail display of bananas (D) 4
3 Key stakeholders in the banana supply chain and losses incurred during the traditional practices of handling and marketing 5
4. Improved post-harvest handling of bananas: dehanding using a dehanding tool (A), packing of dehanded bananas in a plastic crate with thin polystyrene foam (B), and transport of bananas using plastic crates (C) 6
5 Improved banana supply chain from Embilipitiya to Colombo 76 Key stakeholders in banana supply chains and losses incurred using improved
handling and marketing practices 87 Traditional handling practices for cauliflower: harvesting leaving long stems
and leaves attached (A); field packing in large bamboo baskets referred to as ‘doko’ (B); and packaging in 50 kg plastic sacks (C) for transport to the wholesale market 11
8 Traditional cauliflower supply chain from Dhading district to Kalimati wholesale market in Kathmandu 12
9 Key stakeholders in the cauliflower supply chain and losses incurred using traditional practices for handling and marketing 13
10 Improved cauliflower supply chain from Dhading district to Kalimati wholesale market 1311 Improved practices in the cauliflower supply chain: trimming of leaves and stem (A);
packing in plastic crate with plastic liner between layers of curds (B); and individual cauliflower curds wrapped in plastic film(C) 14
12 Key stakeholders in the cauliflower supply chain and losses incurred using improved practices for handling and marketing 15
13 Mandarin: traditional supply chain from Kavre district to Kalimati wholesale market in Kathmandu 20
14 Major stakeholders in the mandarin supply chain and losses incurred using traditional practices for handling and marketing 21
15 Improved mandarin supply chain from Kavre district to Kathmandu 2116 Improved post-harvest practices introduced into the mandarin supply chain: use of
harvesting tool with scissors and bag at the end (A); sorting based on maturity and freedom from defects (B); coating with a mixture of vegetable oil and detergent (C); and packing in plastic crate with plastic sheets at the bottom (D) 22
17 Major stakeholders in the mandarin supply chain and losses incurred employing improved handling and marketing practices 23
18 Packaging in the traditional mango supply chain: harvesting using the pick-throw-catch method (A); harvested mangoes directly in contact with the ground (B); use of rice straw as cushion in bamboo baskets (C); field-packed mangoes for delivery to collection centre (D); and packaging materials for transporting mangoes (E) 28
19 Traditional mango supply chain from Chapi Nawabganj to Gazipur 2920 Major stakeholders in mango supply chain and losses incurred using
traditional practices for handling and marketing 2921 Improved mango supply chain from Chapai Nawabganj to Gazipur 3022 Operations and improved practices in the mango supply chain: improved BARI
picking tool (A); field sorting and packing in plastic crates (B); trimming of long stem and delatexing in trays (C); hot water treatment (D); and packing in plastic crates as transport containers (E) 31
23 Major stakeholders in the mango supply chain and losses incurred using the improved practices for handling and marketing 32

vi
24 Traditional snap bean supply chain from Walimada/Naula to Colombo 3825 Traditional handling practices for snap beans: poly-sack as harvest
or field container (A); sacks of snap beans carried on shoulder at the collection centre (B); and 50 kg capacity poly-sacks of snap beans in the wholesale market (C) 38
26 Major stakeholders in the snap bean supply chain and losses incurred using traditional practices for handling and marketing 39
27 Operations and improved practices in the snap bean supply chain: harvesting pods at the correct stage of maturity (A); sorting based on external appearance (B); and bulk packing in 15 kg capacity plastic crates (C) 39
28 Improved snap bean supply chain from Walimada/Naula to Colombo 4029 Major stakeholders in the snap beans supply chain and losses incurred using
improved practices for handling and marketing 4130 Operations in the traditional winter tomato supply chain: manual harvesting
and use of bamboo collecting basket (A); packing in red mesh sacks after sorting (B); and tomatoes packed in 50 kg red plastic mesh sack (C) 46
31 Traditional winter tomatoes supply chain from Bogra to Gazipur 4632 Major stakeholders in winter tomato supply chain and losses incurred using
the traditional practices for handling and marketing 4733 Operations and improved practices in the winter tomato supply chain:
harvested tomatoes in plastic pail and in field plastic crates (A); trimming of long stem (B); washing in chlorinate water (C); and bulk packaging
in 25 kg plastic crates (D) 4834 Improved winter tomato supply chain from Bogra to Gazipur 4935 Major stakeholders in the winter tomato supply chain and losses incurred using
the improved practices of handling and marketing 50

vii
Foreword
Fresh fruits and vegetables contribute significantly to food and nutrition security, poverty reduction and to economic development in the countries belonging to the South Asian Association for Regional Cooperation (SAARC). Smallholders who make little use of post-harvest technologies produce most of the fresh fruits and vegetables supplied to mass markets in the Region. The high qualitative and quantita-tive post-harvest losses sustained in these traditional fruit and vegetable supply chains negatively impact all stakeholders in the supply chain, with farmers and retailers being the most affected.
Mechanical damage and decay resulting from poor bulk packaging and transportation practices and rough handling along the supply chain are the main cause of qualitative and quantitative loss between harvest and market. High levels of weight loss, particularly at the retail level, also contribute significantly to losses. Underlying causes include the lack of knowledge and awareness about good post-harvest management practices as well as the limited availability of simple post-harvest technologies.
To address these issues, technical innovations and good practices were introduced through pilot demonstrations and training in six fresh produce supply chains in three South Asian countries: The Peo-ple’s Republic of Bangladesh, The Federal Democratic Republic of Nepal and The Democratic Socialist Republic of Sri Lanka. These demonstrations resulted in the dramatic reduction of qualitative and quantitative losses during transportation, and improved produce quality for wholesale and retail, where produce shelf-life was also improved. Cost and returns analysis revealed the technologies introduced into the supply chains provided financial benefits to users and stakeholders.
The findings documented in this publication provide an evidence base for the cost-effective manage-ment of the quality of fresh produce and the reduction of quantitative loss in fresh horticultural supply chains in SAARC countries.
Rosa S. RolleLead Technical Officer
TCP\RAS\35

viii
Abbreviations and acronyms
BARI Bangladesh Agricultural Research Institute
DAE Department of Agricultural Extension (Bangladesh)
FAO Food and Agriculture Organization of the United Nations
GMP Good Manufacturing Practices
HRC Bangladesh
HWT Hot water treatment
IPHT Institute of Post-harvest Technology
RHRS Post-harvest Technology Section and the Regional Horticultural
Research Station (Bangladesh)
SAARC South Asian Association for Regional Cooperation
TCP Technical Cooperation Programme
Currencies mentioned in the case studies (ISO codes)
Bangladesh Taka Currency code BDT. Conversion: US$1 = BDT81 9498 (April 2017)
Nepalese Rupee Currency code NPR. Conversion: US$1 = 103 288 (April 2017)
Sri Lankan Rupee Currency code LKR. Conversion US$1 = 152 140 (April 2017)

1
Introduction
Fruits and vegetables contribute significantly to nutrition, poverty reduction and to generating eco-nomic development in the countries belonging to the South Asian Association for Regional Cooperation (SAARC). Poor quality, questionable safety and high levels of post-harvest losses are major bottlenecks faced in traditional fruit and vegetable supply chains that feed the mass markets in the SAARC region (Rolle, 2014). Farmers and retailers are the most adversely affected stakeholders in the supply chain.
Improper preharvest handling, unsuitable and inappropriate harvesting, post-harvest handling, pack-aging and transportation practices coupled with poor logistical operations in the chains negatively impact on the quality of fresh produce. These incorrect and inadequate practices limit market opportunities and result in reduced incomes for small-scale farmers and other stakeholders in the supply chain.
Fresh produce safety is compromised by preharvest practice, production and post-harvest practices and by poor hygienic management in the supply chain. Chemical and microbiological hazards can pose a safety threat to human health with immediate and long-term effects. It is, therefore, imperative that stakeholders in traditional fruit and vegetable supply chains focus on improving post-harvest handling to enhance the quality and safety of fruits and vegetables.
Stakeholder capacity-development is warranted to address the above-mentioned safety issues and losses in traditional fresh produce supply chains. Training would encourage the application of good prac-tices in harvesting and in post-harvest systems management in order to maintain quality, ensure safety and reduce the levels of post-harvest losses. Appropriate levels of cost effective post-harvest technologies must also be introduced, which will effectively contribute to quality management.
Quality deterioration and quantitative loss results in reduced income for all stakeholders in the chain, particularly farmers who often bear the cost of losses at the wholesale and retail levels in terms of low farmgate pricing. Losses, likewise, increase the risks for traders and result in high prices to consumers. Moreover, the deterioration of quality negatively impacts on the edibility of produce as well as consumer acceptance.
This publication documents case studies on quantifying the levels of post-harvest loss in fresh produce supply chains in three countries: the People’s Republic of Bangladesh, the Federal Democratic Republic of Nepal and the Democratic Socialist Republic of Sri Lanka and on piloting the implementation of good post-harvest management practices in harvesting, handling and in bulk packaging for improved quality, safety and shelf-life. The data collected through the pilot demonstrations generated an evidence base for reducing post-harvest losses in countries across the region.
POST-HARVEST LOSS
Post-harvest loss refers to the decrease in quantity or quality of produce between harvest and the market.
Post-harvest losses in fruits and vegetables result from their inherent perishability, which is aggravated by environmental conditions such as high temperature and relative humidity that enhance deteriorative changes in the produce.
Rough handling, poor, inappropriate and inadequate packaging and lack of infrastructure and logistical sup-port contributes to post-harvest losses in fresh fruit and supply chains.


3
FIGURE 1Schematic of traditional banana supply chain from Embilipitiya to Colombo
Sources: field data.
1.1 OVERVIEW OF THE BANANA SUPPLY CHAIN
Banana (Musa sapientum) is one of most important fruit crops produced and consumed in Sri Lanka. Though the crop can be grown across the country, commercial cultivation is limited to a few areas such as Embilipitiya and Thambuttegama. While two main banana varieties are grown, the Embul variety is preferably cultivated by farmers because of its comparably high level of disease resistance and high demand in local markets.
Ripe bananas are mainly consumed fresh as a dessert fruit. Immature, green bananas are processed
into chips or into ketchup. Nutritionally, bananas are a rich source of vitamins and minerals such as potassium, phosphorus, calcium and magnesium.
Bananas are perishable and are highly suscepti-ble to abrasion and compression damage because of their thin fruit wall. Rough handling, particularly during transport and market distribution, leads to unsightly damage on the fruit, which detracts from its consumer appeal. More importantly, once dam-aged, the fruit undergoes rapid decay as a result of the enhancement of biological and physical processes such as ripening and senescence, which results in water loss and decay.
Chapter 1
Case study of bananas in Sri Lanka
Harvesting: manual using knifeMaturity of bunch: correct maturityHarvest container: bulk packing as bunches
Supermarkets
Hotels,Restaurants
Hotels,Restaurants
Retail Markets
ManualHauling/Vehicle21 km
Packing: bulk packing in bunchesCushioning material: dry/fresh banana leavesLoading into lorry or truck
Transportationby truck176 km,good road
CONSUMERS
Wholesale Market
Collection center/areanear the farm or house
Production Farms

Case studies on managing quality, assuring safety and reducing post-harvest losses in fruit and vegetable [...] 4
FIGURE 2Traditional handling practices for bananas: bunches are carried on the shoulder (A) or a three-wheel cart is used (B); bunches of bananas at the collection centre (C); and retail display of bananas (D)
©E. Serrano
Good practices from harvest to market dis-tribution must be employed to maintain qual-ity, extend shelf-life and assure safety of the fruit offered to consumers.
The traditional banana supply chain A schematic of the traditional banana supply chain for those produced in Embilipitiya, and transported to Colombo, Sri Lanka is shown in Figure 1. Farmers generally harvest the fruit, however, when fruit supply is low and demand is high, immature fruit is harvested by smallholders. Harvest method – Bananas are manually har-vested using a knife. Two people are employed in harvesting, one to cut the pseudostem and the other to catch the bunch to prevent it from falling to the ground. Field handling – Banana bunches are carried on the shoulder (two bunches at a time) to the col-lection centre (Figure 2A) if the collection centre
is near the farm. If further away, the bunches are loaded onto trucks or on to three-wheeled carts (Figure 2B). Most often, the collection centres are not protected from sun or rain (Figure 2C).Transportation – Bunches of bananas are loaded on trucks or vans for transport to the wholesale market in Colombo, which is 176 km away from the collection centre. Some collectors or transport-ers use fresh or dried banana leaves as cushioning between bunches of bananas to reduce mechanical damage. Poor ventilation in the vehicles during transportation results in heat building-up within the piles of banana bunches.Wholesale – At the wholesale market, banana bunches are unloaded, piled vertically and dis-played in stalls. Buyers including retailers in wet markets, supermarkets and institutional buyers such as from hotels and restaurants, purchase and transport bananas in bunches. Bananas are dehanded in retail markets and are displayed either
A
C
B
D

Chapter 1 – Case study of bananas in Sri Lanka 5
on shelves or by hanging in front of retail stores (Figure 1.2D).
Bananas sold to supermarkets are dehanded at collection centres and are packed in plastic crates and transported.
Losses in the traditional banana supply chainLosses in the traditional banana supply chain in Sri Lanka average around 28.8 percent distributed among the farmer (9 percent), wholesaler (5.4 per-cent) and retailer (14.41 percent) (Figure 3). Losses amounting to 8 percent were incurred at the farm largely as a result of insect damage. Defects caused by improper harvesting were relatively low at 1 percent. At the wholesale level, losses amounted to 5.4 percent attributed to mechanical damage (2 percent) during transportation of bunches. Weight loss was high at 3.4 percent and was made worse by the high temperatures during transport because of the absence of ventilation.
Although bananas are harvested at the green stage, their external appearance in retail markets was poor because of excessive mechanical dam-age, which became increasingly apparent as the fruit ripened. At the retail markets, bananas were dehanded and displayed on shelves or by hanging
in hands. Losses from deteriorative changes dur-ing the six-day retail period amounted to 5.4 per-cent. A weight loss of 9.02 percent was recorded because of the high ambient temperature.
At the farm gate, bananas were priced in Sri Lankan rupees (LKR) at 65/kg. At the wholesale level, the price increased to LKR 80/kg owing to transportation and handling cost and the losses incurred during transport. Retailers incurred the highest levels of loss at 14.4 percent, and, there-fore, sold their bananas at the comparably higher price of LKR 100 per kg to the consumers. In effect, it is the consumer who pays for the losses and is the one who loses. It is the same for the farmer as the low buying price compensates for the loss incurred during transportation and in wholesale.
1.2 TECHNICAL INNOVATIONS AND PRACTICES INTRODUCED FOR BANANAS
Harvest maturity – Bananas exhibiting fullness of fingers – an indication of correct status of matu-rity – were harvested from a farm in Embilipitiya.
Harvesting method – The correct method of harvesting involved two people, one to cut the
FIGURE 3Key stakeholders in the banana supply chain and losses incurred during the traditional practices of handling and marketing
Source: field data.
COLLECTOR
LOCALMARKET
RETAILERS
WHOLESALER RETAILERFARMER
Institutional Buyer
SLR 65/kg SLR 80/kg SLR 100/kg
Loss = 14.41% Loss = 5.4% Loss = 9%
Pre-harvest loss: 8%Harvest defects: 1%
Mechanical damage: 2%Weight loss: 3.4%
Weight loss: 9.02%Deterioration loss after 6 days: 5.39%
Total Loss = 28.81%
CONSUMERS
Case studies on managing quality, assuring safety and reducing post-harvest losses in fruit and vegetable [...] 6
FIGURE 4. Improved post-harvest handling of bananas: dehanding using a dehanding tool (A), packing of dehanded bananas in a plastic crate with thin polystyrene foam (B), and transport of bananas using plastic crates (C)
©E. Serrano
bunch using a sharp knife, and the other to catch the falling bunch onto his padded shoulder. This method prevented the bunch from falling to the ground thus reducing mechanical damage. This method also reduced the risk of contamination of the bananas through contact with the ground.
Handling – The harvested bananas were trans-ferred to a small on-farm packinghouse, where bunches were dehanded using a dehanding tool, which is curved to fit the banana bunch. With a downward motion, the hands were easily sepa-rated from the bunch (Figure 4A). Dehanded bananas were washed in chlorinated water for cleaning, removing latex and disinfecting.
Packaging – After washing, dehanded bananas were packed in plastic crates (24 kg capacity). A thin layer of polystyrene foam was placed between each layer of banana hands to minimize abrasion damage to the banana fingers (Figure 4B).
Transportation – Bananas packed in plastic crates were loaded on to trucks alongside bunches pre-
pared according to traditional practice (Figure 4C) and transported to the wholesale market. Bananas delivered to retail markets were evaluated over a six-day retail period under ambient conditions.
The traditional and improved post-harvest han-dling operations employed in the banana supply chains are summarized in Table 1 while Figure 5 shows the improved banana supply chain from Embilipitiya to Colombo.
1.3 BANANA: ANALYSIS OF RESULTSReduction of losses in the improved banana supply chainThe introduction of improved practices in the banana supply chain resulted in reduced losses from 28.8 to 19.05 percent (Figure 6). At the farmer level, preharvest and harvest defects amounted to 3 percent. Packing the dehanded bananas between layers of thin polystyrene foam significantly mini-mized mechanical damage from abrasion during transportation with minimal loss (0.2 percent) on arrival at the wholesale market. Weight loss was also reduced from 3.4 percent to 1.9 percent.
TABLE 1Traditional and improved banana post-harvest operations
Operation Traditional practice Improved practice
Harvesting Mature to mixed maturity Correct stage of maturity
Dehanding No dehanding of bunches Dehanding of bunches using a dehanding tool
Washing/delatexing No washing Washing and delatexing in chlorinated water
Packaging Bulk transport in bunches Packing dehanded bananas in a plastic crate with polystyrene foam between layer
A B C

Chapter 1 – Case study of bananas in Sri Lanka 7
The total loss on arrival at the wholesale market was 2.10 percent using the improved practices as against a 5.4 percent loss using traditional practices. Reduced loss at the wholesale level resulting from improved packaging was 61 percent (Table 2).
At the retailer level, weight loss during the six-day retail period was high at 11.95 percent because the cut portion of the dehanded bananas caused a comparably high level of moisture loss as compared to when bananas were transported in bunches (Table 2). At the retail level, there was an overall 17 percent reduction in weight loss, equivalent to loss in marketable weight (Table 2). Packing of dehanded bananas between thin layers of polystyrene foam resulted in zero loss from mechanical deterioration during retail.
The overall reduction in losses and improved quality and shelf-life of bananas benefitted all stakeholders in the supply chain. The wholesaler can buy larger quantities and pay a higher price to the farmer for better quality, while the retailer can sell more bananas because of their improved quality and longer shelf-life. The retailer can also demand a higher price for better quality bananas. These benefits trickle down to the farmer if he/she makes use of plastic crates during handling and transportation of the dehanded bananas to the wholesaler or retailer.
Shelf-lifeThe recovery of marketable bananas handled using the traditional practice was 94.6 percent during the six-day retail period. Losses in the traditionally handled bananas arose from deterioration caused by severe abrasion and compression damage that resulted in poor appearance; accelerated ripening and senescence of fruits because of wounding, resulting in reduced shelf-life.
With improved handling practice, deteriorative changes did not occur during retail hence the fruits were 100 percent marketable. Likewise, because of the absence of mechanical damage, ripening and senescence were retarded thus extending the shelf-life of the fruit.
Produce safetyCare was taken in the method of harvesting bananas so that bunches did not touch the ground, which prevented microbial and chemical con-tamination from contact with the soil. Washing in chlorinated water after dehanding the bananas reduced, if not totally eliminated, any spoilage and pathogenic micro-organisms and dirt adher-ing to the fruit thus further ensuring fruit safety. Packing in clean plastic crates using layers of thin polystyrene foam between layers provided added protection from mechanical damage such as abra-
FIGURE 5Improved banana supply chain from Embilipitiya to Colombo
Source: field data.
Dehanding: with sharp knifeManual harvesting Maturity: correct maturity
Supermarkets
Retail MarketsRetail
Markets
Hotels,Restaurants
ManualHauling21 km
Loading on lorry or truck.Cushioning material: Styrofoam sheetsPackaging: 24 kg plastic crateManual sorting on covered ground
Transportationby lorry/truck176 km
CONSUMERS
Wholesale Market - Colombo
Collection center/areanear the farm or house
Production FarmsEmbilipitiya

Case studies on managing quality, assuring safety and reducing post-harvest losses in fruit and vegetable [...] 8
sion, cuts and punctures that could serve as entry points for micro-organisms.
Economic benefits derived from improved practicesFarmers who adopted the improved practices benefitted from dehanding the bananas and bulk packaging and transportation in plastic crates, as they were able to sell greater actual weights of bananas as a result of the removal of the stalk, which is equivalent to 2 kg per bunch (Table 3). Moreover, banana quality was improved because of the low incidence of mechanical damage during hauling and transportation. The use of improved practices in the supply chains resulted in a net return of LKR 64.33/kg compared with only LKR
56.80/kg with the traditional practice. Overall, farmers will realize higher profits when selling directly to the wholesaler who will pay a higher price for good quality. Further, the long utility life (10 years) of plastic crates provides for added benefit to the user over the long term.
The wholesaler and retailer benefitted from dehanding of the banana bunches as well as from the use of plastic crates for bulk transportation as the number of unmarketable bananas (because of mechanical damage) was substantially reduced upon arrival at the wholesale market. With the improved practice the wholesaler had a net return of LKR 82.61/kg, while with the traditional prac-tice, the return was only LKR 72.68/kg (Table 4). These benefits trickle down to the farmer through
FIGURE 6Key stakeholders in banana supply chains and losses incurred using improved handling and marketing practices
Source: field data.
TABLE 2Losses in the traditional and improved banana supply chains
Supply chain Losses (%)/Handling practice Reduction in loss
level Traditional Improved (%)
Farmer 9.00 3.00 67
Wholesaler 5.40 2.10 61
Retailer 14.4 11.95 17
Total Loss 28.81 19.05 34
Source: field data.
COLLECTOR
LOCALMARKET
RETAILERS
WHOLESALER RETAILERFARMER
Institutional Buyer
SLR 70/kg SLR 90/kg SLR 120/kg
Loss = 11,95% Loss = 2.1% Loss = 3%
Pre-harvest loss& harvest defects: 3%
Transport/packaging-relateddamage: 0.2%Weight loss: 1.9%
Weight loss: 11.95%Deterioration loss after 6 days: 0%
Total Loss = 17.05%
CONSUMERS

Chapter 1 – Case study of bananas in Sri Lanka 9
increased selling price for less damaged produce of good quality if farmers make use of plastic crates during handling and transportation of their produce to the wholesaler.
At the retail level, bananas do not incur loss from deterioration, and thus have a longer shelf-life. The retailer obtains a net return of LKR 100.06/kg for bananas handled using the improved
TABLE 3Farmer: benefits of dehanding and using plastic crates for bulk packaging and transportation
Item Traditional Improved
Gross returns (volume sold – losses x selling price
(100 kg – 8 kg/bunch) x LKR 65.00/kg LKR 5 980.00
(100 kg) x LKR 70.00/kg LKR 7 000.00
Costs
Depreciation cost of plastic crates 0 14.78
Interest on capital (plastic crate) 0 2.30
Transport cost 300.00 550.00
Subtotal 300.00 567.00
Net returns (Gross returns – Costs) LKR 5 680.00 LKR 6 433.00
LKR 56.80/kg LKR 64.33/kg
Source: field data.
TABLE 4Wholesaler: benefits of dehanding and using plastic crates for bulk packaging and transportation
Item Traditional Improved
Gross returns (volume sold – losses x selling price)
(100 kg – 5.4kg) x LKR 80.00/kg LKR 7 568.00 LKR 8 811.00
(100 kg – 2.1 kg) x LKR 90.00/kg
Costs
Transport cost 300.00 550.00
Net returns (Gross returns – Costs) LKR 7 268 LKR 8 261.00
LKR 72.68/kg LKR 82.61/kg
Source: field data.
TABLE 5Retailer: benefits of dehanding and using plastic crates for bulk packaging and transportation
Item Traditional Improved
Gross returns (volume sold – losses x selling price
(100 kg – 14.41kg) x LKR 100.00/kg LKR 7 759.00 LKR 10 556.00
(100 kg – 11.94 kg) x LKR 120.00/kg
Costs
Transport cost 300.00 550.00
Net returns (Gross returns – Costs) LKR 7 459.00 LKR 10 006.00
LKR 74.59/kg LKR 100.06/kg
Source: field data.

Case studies on managing quality, assuring safety and reducing post-harvest losses in fruit and vegetable [...] 10
practice and only LKR 74.59/kg for bananas handled using traditional practices (Table 5).
1.4 RESPONSE OF STAKEHOLDERS IN THE BANANA SUPPLY CHAIN
On the basis of the evidence documented through the pilot demonstrations, stakeholders in the sup-ply chain were convinced that good handling practices such as dehanding and bulk packaging in plastic crates greatly reduced losses during trans-portation, and maintained the quality of bananas from harvest to market. They also acknowledged the simplicity, ease of use and adoption of the improved post-harvest management practices. In some cases, however, farmers were apprehensive about the use of plastic crates because of the high initial investment for the purchase price.
The participation of representatives from supermarkets during the pilot demonstration of improved practices facilitated the adoption of the introduced improved practices. Farmers were encouraged by the supermarket manager to adopt the improved practices and to supply qual-ity bananas to the supermarkets using the plastic crates supplied by the supermarket. Farmers who began to supply bananas to the supermarket through these direct links benefitted accordingly, and increased their incomes by 20 to 40 percent.
Moreover, the stakeholders’ initial apprehen-sion regarding the use of plastic crates as transport containers to one of the largest government-managed markets (Dambulla Market), which did not encourage the use of plastic crates as transport containers for fresh produce has been resolved. The Director for the project’s national counter-part, the Institute of Post-harvest Technology
(IPHT), presented evidence generated by the pro-ject, to the Ministry of Agriculture, which resulted in permission being granted to use plastic crates at the wholesale market.
1.5 BANANAS: CONCLUSIONS AND RECOMMENDATIONS
Significant levels of post-harvest loss are incurred when bananas are transported in bunches to the wholesale market. Losses at the wholesale market resulted primarily from abrasion and compression damage because of detached fingers when bananas were transported in bunches. Evidence collected through the pilot demonstrations highlighted the considerably reduced losses when bananas were dehanded and packed in plastic crates during transport to the wholesale market. With their improved appearance, bananas fetched a higher price both at the wholesale and retail levels. Dete-rioration related to poor appearance was absent at the retail level with the improved practice thus extending the saleable shelf-life of the bananas. The improved practices likewise reduced the risk of contamination thus contributing to the safety of the produce.
The adoption of the improved practices by smallholders was greatly facilitated by links with supermarkets, which resulted in the creation of an enabling environment for the employment of improved practices. Plastic crates were provided to smallholders to be used together with apply-ing the improved practices learned to ensure the supply of better-quality bananas. Increasing consumer awareness of quality and safety will facilitate adoption of these simple and low-cost techniques.

11
2.1 OVERVIEW OF THE CAULIFLOWER SUPPLY CHAIN
Cauliflower is one of the most important vegetable crops grown in Nepal. It is produced on small and scattered farms in hilly areas and accounts for about 16 percent of the total vegetable production, with Dhading district alone contributing 1.35 percent of cauliflower production in the country. Cauliflower is popularly consumed in both rural and urban areas.
The quality attributes of cauliflower desired by retailers and by consumers are: good curd size, cleanliness and compactness of the curds, white to creamy-white curd colour, few leaves, short stem, and freedom from physical injury. Stakeholders in the supply chain are aware of the factors that contribute to the safety of cauliflower including proper use of pesticides, strict adherence to the recommended preharvest interval and no-pesticide use after curd emergence.
The traditional cauliflower supply chainHarvesting – Farmers in Dhading district manu-ally harvest cauliflower at mixed stages of matu-rity using scythes or knives. The cauliflower is harvested with a long stem and retains about 5 to 7 leaves attached to the curd (Figure 7A), as the leaves serve as cushioning materials during bulk packaging and transportation.
Handling – Following harvest, cauliflower is transferred to large bamboo baskets referred to as ‘doko’, which are used as field containers (Figure 7B). The filled baskets are manually hauled to the collection centre, which is located some 50 to 100 m from the farm. At the collection centre, the cauliflower is sorted on covered ground.
Packaging and transportation – Cauliflower curds along with the leaves are packed into 50 kg capacity mesh, jute or plastic sacks (Figure 7C). The bulk packaged cauliflower is subsequently
Chapter 2
Case study of cauliflower in Nepal
A B C
FIGURE 7Traditional handling practices for cauliflower: harvesting leaving long stems and leaves attached (A); field packing in large bamboo baskets referred to as ‘doko’ (B); and packaging in 50 kg plastic sacks (C) for transport to the wholesale market
©E. Serrano

Case studies on managing quality, assuring safety and reducing post-harvest losses in fruit and vegetable [...] 12
loaded onto trucks for transport to the Kalimati Fruit and Vegetable Wholesale market in Kath-mandu, about 85 km from Dhading district.
Marketing – At the wholesale market, buyers from supermarkets, hotels and restaurants or wet market retailers purchase cauliflower. Retailers display cauliflower in the wet market in open stalls and those that are not purchased within the day are temporarily stored in the retail stalls. Steps in the traditional cauliflower supply chain from Dhading district to Kalimati wholesale market in Kathmandu are summarized in Figure 8.
Losses in the traditional cauliflower supply chainThe traditional practice of leaving 5 to 7 leaves attached to the long stem, results in 28 to 30 percent loss at the farm level (Figure 9). The leaves account for 25 percent of the weight of cauliflower sold. Bulk packaging of cauliflower with leaves and long stems in either 50 kg plastic sacks or plastic bags results in 6 percent loss from damage related to transport and packaging (abrasion and compression) and 5 percent weight loss at the level of the wholesaler.
Considerable losses occur in retail, since the cauliflower remains in retail stalls for more than
three days during which deterioration becomes evident. After the fourth day in retail, dete-rioration and weight loss were high at 20 and 21 percent, respectively (Figure 9). Weight loss was largely because of moisture loss from the high surface area of the leaves, which wilted. Curd deterioration was evident in the form of discolora-tion resulting from mechanical damage.
Total loss in the traditional supply chain amount-ed to 52 percent distributed as follows: farmer level 28 to 30 percent; transportation and wholesale 11 percent, and retail 41 percent (Figure 8). Because of the high levels of losses at the retail level, the retail price was high at Nepalese rupee (NPR) 40/kg while the farm price was low at NPR 22/kg. At the wholesale level, the price was also low at NPR 25/kg very likely because of the relatively lower level of loss at that level of the supply chain when compared with the losses at the retail level.
2.2 TECHNICAL INNOVATIONS AND PRACTICES INTRODUCED FOR CAULIFLOWER
The pilot demonstration was conducted in Dhad-ing district and cauliflower was transported to the Kalimati wholesale market and to retail markets in Kathmandu. Innovations introduced included harvesting at the correct stage of maturity, trim-
FIGURE 8Traditional cauliflower supply chain from Dhading district to Kalimati wholesale market in Kathmandu
Source: field data.
Manual harvesting using scythe or knife Maturity of curds: mixedHarvest container: bamboo basket
Hotels,Restaurants
SupermarketsSupermarkets
Retail Markets
ManualHauling50-100 m
Manual sorting on covered groundTrimming of leaves: not done; or partial trimming Packaging: 50 kg mesh sack or jute sack or plastic sackLoading into lorry or truck
Transportationby lorry/truck85 km,good road
CONSUMERS
Kalimati Wholesale Market
Collection center/areanear the farm or house
Production Farms(Dhading District)

Chapter 2 – Case study of cauliflower in Nepal 13
FIGURE 9Key stakeholders in the cauliflower supply chain and losses incurred using traditional practices for handling and marketing
Source: field data.
FIGURE 10Improved cauliflower supply chain from Dhading district to Kalimati wholesale market
Source: field data.
COLLECTORTransport Service
Provider
LOCALMARKET
RETAILERS
WHOLESALER RETAILERFARMER
Institutional Buyer
NRp 22/kg NRp 25/kg NRp 40/kg
Loss = 41% Loss = 11%Loss = 28-30%
Pre-harvest loss: <5%Weight of leaves attached:25% of total weight sold
Transport/packaging-relateddamage: 6%Weight loss: 5%
Weight loss: 21%Deterioration loss after 4 days: 20%
Total Loss = 52%
CONSUMERS
Manual harvesting: using scythe or knife Maturity of curds: correct maturityHarvest container: bamboo basket or doko
Hotels,Restaurants
SupermarketsSupermarkets
Retail Markets
ManualHauling50 -100 m
Loading into lorry or truck.Manner of packing: layering of curds between plastic liners Packaging: 15 kg plastic crateTrimming of leaves: well-trimmedManual sorting on covered ground
Transportationby lorry/truck85 km,good road
CONSUMERS
Kalimati Wholesale Market
Collection center/areanear the farm or house
Production Farms(Dhading District)
Plastic film wrapping

Case studies on managing quality, assuring safety and reducing post-harvest losses in fruit and vegetable [...] 14
ming of leaves and stems, culling of insect- and disease-damaged curds, bulk packing in plastic crates for transportation and film wrapping of the curd at the retail market (Figure 11).
Harvesting and field preparation – Fully mature and compact curds were harvested using a scythe, they were then trimmed, leaving only four wrap-per leaves intact (Figure 11A). Cauliflower stems were also trimmed short. Curds exhibiting ‘rici-ness’ (an indication of over-maturity) and damage from insects or disease were culled.
Packaging and transportation – Good quality curds were packed in plastic crates (15 kg capac-ity), layered between sheets of plastic to minimize abrasion (Figure 11B) damage. The crates were subsequently hauled to the collection centre in Dhading and then transported to the wholesale market. For retail display, curds were wrapped with low-density polyethylene film to minimize weight loss and other deteriorative changes (Figure 11C).
A summary of the traditional and improved post-harvest practices during the pilot demonstra-tions is presented in Table 6.
2.3 CAULIFLOWER: ANALYSIS OF RESULTS
Loss reduction in the improved cauliflower supply chainPreharvest defects in cauliflower attributed to insect, rat and disease damage remained the same at 5 percent.
At the wholesale level, the incidence of mechanical damage was reduced from 6 percent to 3.4 percent with the use of plastic crates for bulk packaging (Figure 12) and weight loss was reduced from 5 to 1.1 percent. With improved practices in the chain, the loss incurred was substantially reduced. Losses arising from deteriorative changes such as curd discoloration and decay were reduced from 20 to 10 percent while weight loss was reduced from 20.1 to 3.8 percent. Cauliflower dis-played in open stalls in high temperatures during retail, resulted in rapid water loss and eventually curd discoloration. With individual film wrap-ping, water loss was reduced as the film provided a physical barrier to water loss. One disadvantage of wrapping each cauliflower with film led to a high incidence of decay in the curd because of high temperature and high humidity.
TABLE 6Cauliflower: traditional and improved post-harvest operations
Operation Traditional practice Improved practice
Harvesting Mixed maturity Correct stage of maturity
Trimming No trimming of leaves and stem Leaves and stems were trimmed
Packaging Bulk packing in 50 kg plastic sack or plastic bag
Bulk packing in 15 kg plastic crates with plastic liners between layers of curds
Retail display No film wrapping of curd Wrapping of single curds in low density polyethylene film
Source: field data
FIGURE 11Improved practices in the cauliflower supply chain: trimming of leaves and stem (A); packing in plastic crate with plastic liner between layers of curds (B); and individual cauliflower curds wrapped in plastic film(C)
©E. Serrano
A B C

Chapter 2 – Case study of cauliflower in Nepal 15
Losses incurred in the traditional and improved supply chains are summarized in Table 7. At the farmer level, the reduction in loss amounted to 83 percent with the good practice of trimming. On the other hand, the decrease in loss from 11 to 4.5 percent at the wholesale level translated to a 59.1 percent reduction in loss because of the reduced incidence of mechanical damage as plastic crates were used in transportation and weight loss was reduced as a result of trimming. Retailers also benefitted from the improved practice with a 66.3 percent reduction in losses at this level. Losses in the supply chain were reduced from 52 percent with the traditional practice, to 18.3 percent with the improved practice.
Shelf-lifeThe five to seven leaves left attached to the curd using the traditional practice resulted in heightened water loss manifested as wilting of the leaves and eventually curd discoloration, which detracted from consumer appeal. Curds handled using traditional practice, therefore, remained marketable for only 2 to 3 days. When the leaves were trimmed and the curds were individually film-wrapped for retail, weight loss was minimize, which substantially increased the shelf-life of cauliflower to 6 days.
Produce safetyLeaves potentially harbour spoilage and patho-genic micro-organisms that can contaminate the
FIGURE 12Key stakeholders in the cauliflower supply chain and losses incurred using improved practices for handling and marketing
Source: field data.
TABLE 7Cauliflower: summary of losses in traditional and improved post-harvest practices.
Supply chain Losses (%) Reduction in
level Traditional Improved loss (%)
Farmer 30.0 5.0 83.3
Wholesaler 11.0 4.5 59.1
Retailer 41.0 13.8 66.3
Total loss 52.0 18.3 64.8
Source: field data
COLLECTORTransport Service
Provider
LOCALMARKET
RETAILERS
WHOLESALER RETAILERFARMER
Institutional Buyer
NRp 22/kg NRp 25/kg NRp 40/kg
Loss = 13.8 % Loss = 4.5% Loss = <5%
Pre-harvest loss: <5% Transport/packaging-related damage: 3.4%Weight loss: 1.1%
Weight loss: 3.8%Deterioration loss after 4 days: 10%
Total Loss= 18.3%
CONSUMERS

Case studies on managing quality, assuring safety and reducing post-harvest losses in fruit and vegetable [...] 16
curd since the leaves are used to cover the curd and serve as a cushion. The source of contamination is eliminated when the leaves are trimmed.
Individual film wrapping of the curd also pre-vented cross-contamination since the film served as a physical barrier between the environment and the curd. It also eliminated contamination of the curd by consumers who handle and press the curds to test for compactness.
Economic benefit derived from the introduction of improved practicesTrimming the stem to about 1 to 2 cm in length and leaving only 4 small wrapper leaves attached to the curd benefits the farmer, the wholesaler and particularly the retailer (Tables 8 to 10). The farmer sells a larger volume at a higher price to the wholesaler; the wholesaler sells the trimmed curd at a higher price to the retailer while the retailer has the greatest benefit of the trimming intervention because of better quality, which can
be sold to consumers at a higher price with sub-stantial reduction in weight loss. With the benefits spreading across the three sectors, in the end, the consumer also benefits as well in terms of getting the best quality.
The wholesaler benefits from the use of plastic crates for bulk packaging as the number of unmar-ketable curds resulting from mechanical damage was substantially lowered upon arrival at the wholesale market (Table 11). The farmer benefits from the higher price paid by the wholesaler, for the better quality cauliflower when plastic crates and films are used for bulk packaging and trans-portation of produce directly to the wholesaler.
With the current system of marketing cau-liflower grown in Dhading district, farmers do not, however, deliver their produce directly to the wholesaler. Instead, they sell to a collector who provides logistic services and packaging containers (plastic crates) to the wholesaler. The wholesaler pays the collector for transport services that also
TABLE 8Farmer: benefits of trimming
Item No Trimming Trimming
Gross returns (Volume sold – losses) x selling price
(100 kg – 26 kg opportunity loss) x NPR22.00/kg
(100 kg – 0 kg) x NPR25.00/kg
NPR1 628.00 NPR2 500.00
Costs
Depreciation cost of trimming knife (NPR150/pc)
(useful life = 3 yr x 60 use/yr)0 0.83
Labour cost for trimming @NPR 2/curd or kg 0 200.00
Subtotal 0 200.83
Net returns (Gross returns – total cost) 1 628.00 2 299.17
Net returns per kg sold NPR 16.28 NPR 22.99
Source: field data
TABLE 9Wholesaler: benefits of trimming
Item No Trimming Trimming
Gross returns (Volume Sold – losses) x selling price
(100 kg – 11 kg) x NPR 26/kg, Untrimmed
(100 kg – 4.5 kg) x NPR 30/kg, Trimmed
NPR 2 225.00 NPR 2 865.00
Costs
Cost of cauliflower = NPR 22/kg, Untrimmed
Cost of cauliflower = NPR 25/kg, Trimmed2 200.00 2 500.00
Gross Returns –Total cost 25.00 365.00
Net return (NPR/kg sold) NPR 0.25 NPR 3.65
Source: field data

Chapter 2 – Case study of cauliflower in Nepal 17
TABLE 10Retailer: benefits of trimming
Item No Trimming Trimming
Gross returns (Volume sold – losses) x selling price
(100 kg – 21 kg weight loss) x NPR 40 kg, untrimmed
(100 kg – 3.8 kg weight loss) x NPR 60/kg, trimmed
NPR 3 160.00 NPR 5 772.00
Costs
Cost of cauliflower = NPR 25/kg, Untrimmed
Cost of cauliflower = NPR 30/kg, Trimmed
2 500.00 3 000.00
Gross returns – total cost 660.00 2 772.00
Net return (NPR/kg sold) NPR 6.00 NPR 27.20
Source: field data
TABLE 11Wholesaler: benefits of using plastic crates for bulk packaging of produce for transportation
Item Plastic sack,no trimming
Plastic crate, trimming
Gross returns (Volume sold – losses) x selling price
(100 kg – 11 kg) x NPR 25 kg, Plastic bag
(100 kg – 4.5 kg) x NPR 30/kg, Plastic crate
NPR 2 225.00 NPR 2 865.00
Costs
Depreciation cost of packaging material
Interest on capital
40.00
10.00
4.00
2.40
Subtotal 50.00 6.40
Gross returns – total cost 2 175.00 2 858.40
Net return (NPR/kg sold) NPR 21.75 NPR 28.58
Source: field data
include ‘renting’ the use of the plastic crate. If farmers owned the plastic crates, they would ben-efit from using them to sell produce directly to the wholesale market as they could add the benefit of using the plastic crate in terms of reduced weight loss and fewer unmarketable curds, and would retain the cost of the packaging material/transport container, which is paid by the wholesaler to the collector. Further, the long utility life (10 years) of plastic crates would be an added benefit to the farmer in the long run.
The retailer benefits greatly from wrapping the curd during retail as weight loss is substantially minimized and the shelf-life of the cauliflower curd is extended by three days, as compared to unwrapped curds. The retailer would have net returns of NPR22.32/kg of wrapped cauliflower sold versus NPR6.00/kg of unwrapped curd (Table 12).
2.4 RESPONSE OF STAKEHOLDERS IN THE CALIFLOWER SUPPLY CHAIN
Feedback and impressions from the stakeholders were obtained during the pilot demonstrations and training of stakeholders in the supply chain, when the results of the pilot demonstration were presented. One participant stated that whether or not the cauliflower was trimmed, it would be purchased at the same price. However, this was not the case when wholesalers were interviewed. Wholesalers stated their willingness to purchase trimmed curds at a higher price as they would no longer need to trim cauliflowers at the Kalimati market. Moreover they stated customers paid a higher price for trimmed curds.
There was no negative impression concerning the use of plastic crates. This was perhaps because the cost benefit analysis highlighted the long-term benefit of the use of crates, especially if coopera-tives would sell their produce directly at the Kali-

Case studies on managing quality, assuring safety and reducing post-harvest losses in fruit and vegetable [...] 18
mati market. The Chair of the cooperative stated the cooperative has a designated selling area at the Kalimati market and that several trials would be initiated and conducted following the improved post-harvest practices to persuade cooperative members of the benefits of the improved system as compared to traditional methods of handling and marketing produce.
2.5 CAULIFLOWER: CONCLUSIONS AND RECOMMENDATIONS
The good post-harvest practices introduced under the project were as follows: harvesting at the correct stage of maturity late in the morning to prevent leaf breakage, trimming of the stem and leaves; bulk packaging in plastic crates for transportation; use of low density plastic film to wrap the curd during retail marketing. These innovations in the supply chain reduced total loss (farm to retail) from 52 percent (incurred using traditional handling practices) to 18.3 percent with improved practices.
Trimming of the cauliflower leaves and stems benefitted the farmer, wholesaler and retailer. The wholesaler benefits the most from the use of plas-tic crates for bulk packaging as the proportion of unmarketable curds (physically damaged) was
substantially reduced upon arrival at the whole-sale market. If farmers own the plastic crates, they would benefit from their use by being able to sell directly to the wholesale market. Further, the long utility life (10 years) of the plastic crate would provide added benefits to the farmer over the long term.
The retailer benefits substantially from wrap-ping the curd during retail as weight loss is reduced. There is a resulting increase in the shelf-life of the cauliflower curds up to 3 days or more as compared to unwrapped curds.
The benefits enjoyed by the farmer, wholesaler and retailer from the improved practices would also benefit the consumer who would receive the best value for their money when buying good quality produce that is available in greater volume.
The traditional marketing system in retail mar-kets for cauliflower does not reward quality with premium price. However, with the rise of modern markets that require quality and safe produce and with buyers wanting a shorter supply chain, stake-holders can take advantage of this development. If the stakeholders become organized, they can link directly to institutional buyers that require consistent volumes of quality produce and who would be willing to pay a premium price.
TABLE 12Retailer: benefits of wrapping cauliflower curds with plastic film
Item No Wrapping Wrapping
Gross returns (Volume sold – losses) x selling price
(100 kg – 21 kg weight loss) x NPR40 kg, Untrimmed
(100 kg – 3.8 kg weight loss) x NPR60/kg, Trimmed
NPR 3 160.00 NPR 5 ,772.00
Costs
Cost of cauliflower = NPR 25/kg, Untrimmed
Cost of cauliflower = NPR 30/kg, Trimmed
Cost of plastic film, NPR 170/50 ft (51.8/15.24 m); one curd needs
one foot (30.48 cm) for wrapping
Labour cost for wrapping
2 ,500.00
0
0
3 ,000.00
340.00
200.00
3,540.00
Subtotal 2 500.00
Gross returns – total cost 660.00 2 232.00
Net return (NPR/kg sold) NPR 6.00 NPR 22.32
Source: field data

19
3.1 OVERVIEW OF THE MANDARIN SUPPLY CHAIN
Mandarins include a diverse group of citrus fruits characterized by brightly coloured peel and pulp, excellent flavour, easy-to-peel rind, and segments that separate easily. The mandarin orange is the most important fruit crop produced in the mid hills of Nepal. It covers 72 percent of the total area under citrus cultivation contributing 68 percent to citrus production.
Mandarins are valued for their vitamin C con-tent. The quality attributes of mandarins desired by consumers include: freshness, large size, smooth peel (absence of injury and decay), full peel colour, good taste, juicy and thin, loose skin. In Kavre, however, thick-skinned mandarins are grown.
As to safety requirements, consumers are par-ticular about pesticide residues on the manda-rins. Farmers and preharvest contractors similarly identified pesticide contamination as a safety risk factor together with insect and bird infestation. Stakeholders in the supply chain are aware of these desired quality and safety attributes.
One of the marketing practices in Kavre that seriously impacts mandarin quality is the preva-lence of preharvest contractors who set the harvest date and the price. In situations where mandarins are harvested during the peak season when the price is low, harvesting is delayed, resulting in over maturation of the fruit.
The traditional mandarin supply chainMandarins are produced on small farms in the uplands of Kavre with each farmer producing an average of 5.7 tonnes per season. The peak harvest season is January to February. Farmers are respon-sible for taking care of the trees until fruiting.
Harvesting – Mandarins are harvested at different stages of maturity depending on market destina-tion and market demand. Therefore, the buyer will often find mixed maturity fruit. Preharvest
contractors provide the labour for harvesting. Low hanging fruit is generally harvested manually by pulling the fruit resulting in the rind tearing. High hanging fruit are harvested by shaking the trees or by hitting the fruit with a stick. The fruit falls to the ground and is collected.
Field preparation – Preharvest contractors sort mandarins primarily on the basis of size, for example: large, medium and small. Fruit is sorted on the ground on a tarpaulin sheet or underlay. Sorted mandarins are packed into 20 kg capacity plastic crates. Preharvest contractors and collec-tors state the crates minimize post-harvest losses and facilitates handling and stacking for transport.
Transportation – Depending on the distance to the market, different types of vehicles are used to transport mandarins but trucks are most common. From the production areas in Kavre, the truck travels over approximately 52 km on good road to the Kalimati wholesale market in Kathmandu, where the mandarins are distributed to the wet market or to buyers from supermarkets. The traditional supply chain for mandarins produced in Kavre district and marketed in Kathmandu is shown in Figure 13.
Losses in the traditional mandarin supply chainAt the farm level, preharvest loss amounted to 5 percent. The main cause of farm level rejec-tion was fallen fruit and damage by birds and insects. At the wholesale level, losses amounted to 7.25 percent distributed as follows: transport and packaging-related damage 4.35 percent; poor quality 2.20 percent and weight loss 0.70 percent (Figure 14). While the distance between Kavre and the wholesale market was relatively short, only 52 km from the collection centre to the wholesale market, losses resulting from poor packaging were high. Damage from compression (resulting from
Chapter 3
Case study of mandarin in Nepal

Case studies on managing quality, assuring safety and reducing post-harvest losses in fruit and vegetable [...] 20
over packing) and abrasion resulted in poor qual-ity fruit.
Mandarins have a relatively long shelf-life and can be stored under ambient conditions for almost 11 days. The highest loss was incurred at the retail level amounting to 13.04 percent distributed almost equally between weight loss (6.84 percent) and loss from deterioration (6.20 percent) after 11 days (Figure 14).
At the level of the wholesaler and retailer, the total post-harvest loss was 20.29 percent. As noted in Figure 14 there was a significant difference between the retail price and farmgate price. The retail price for mandarin was NPR90/kg, which was almost double the farm gate price of NPR45/kg. This difference in price is always attributed to losses incurred during retail. In effect, both the farmer and the consumer lose with farmers obtain-ing a low price for their produce and consumers paying a high price.
3.2 TECHNICAL INNOVATIONS AND PRACTICES INTRODUCED FOR MANDARIN
Mechanical damage and the onset of decay result-ing from faulty harvesting were the major causes of loss after harvest. Improved post-harvest prac-tices introduced through pilot demonstrations
included: use of harvesting tools with a bag attached at the end; harvesting fruits at the correct stage of maturity; sorting and grading; coating with vegetable oil in combination with detergent; and proper bulk packaging in plastic crates (Figure 15 and Table13).
Harvesting – Mandarins were harvested using a harvesting device equipped with holding scissors and a bag (Figure 16A) to minimize injury during harvesting. The holding scissor at the end of the bag greatly reduced injury at the point of fruit detachment. Fruit was sorted and graded on the ground covered by a tarpaulin (Figure 16B). Fruits damaged by insects and birds and over-mature fruit were culled.
To enhance the external appearance of the fruit, mandarins were coated with a mixture of vegetable oil and detergent (Figure 16C). The vegetable oil was intended to reduce weight loss and enhance the glossy appearance of the fruit.
Packaging and transportation – During pack-ing, a plastic sheet was placed between layers of mandarins (Figure 16D) to minimize abrasion damage. The bulk-packaged mandarins in plastic crates were then hauled to the collection centre for transport to the wholesale market in Kathmandu.
FIGURE 13Mandarin: traditional supply chain from Kavre district to Kalimati wholesale market in Kathmandu
Source: field data.
Harvesting: manual using handHarvest container: plastic crate
Retail Markets
SupermarketsSupermarkets
Manual Hauling/Vehicle50 -100 m
Manual sorting on tarpaulin sheetPackaging: 20 kg plastic cratesLoading on lorry or truck
Transportationby lorry/truck60 km,good road
CONSUMERS
Wholesale Market
Collection center/areanear the farm or house
Production Farms(Kavre District)

Chapter 3 – Case study of mandarin in Nepal 21
FIGURE 14Major stakeholders in the mandarin supply chain and losses incurred using traditional practices for handling and marketing
Source: field data.
FIGURE 15Improved mandarin supply chain from Kavre district to Kathmandu
Source: field data.
COLLECTORTransport Service
Provider
LOCALMARKET
RETAILERS
WHOLESALER RETAILERFARMER
Institutional Buyer
NRp 45/kg NRp 60/kg NRp 90/kg
Loss = 13% Loss = 7.3%
Pre-harvest loss: <5% Transport/packaging-relateddamage: 4.4 %Poor quality: 2.2 %Weight loss: 5%
Weight loss: 21%Deterioration loss after 4 days: 20%
Total Loss= 20.3%
CONSUMERS
Harvesting: manual using clipperHarvest container: plastic crateMaturity: correct stage of maturity
Retail Markets
SupermarketsSupermarkets
ManualHauling/Vehicle50 -100 m
Manual sorting on tarpaulin Cushioning: plastic liner betweenlayer of mandarinsPackaging: 20 kg plastic cratesLoading on lorry or truck
Transportationby lorry/truck60 km,good road
CONSUMERS
Wholesale Market
Collection center/areanear the farm or house
Production Farms(Kavre District)

Case studies on managing quality, assuring safety and reducing post-harvest losses in fruit and vegetable [...] 22
3.3 MANDARIN: ANALYSIS OF RESULTSReduced losses with innovations introduced into the mandarin supply chainPreharvest losses remained at 5 percent and were not included in the calculation of total loss. Improved packing of the mandarins using plastic sheets between the layers during bulk packag-ing, reduced transport and packaging-related losses and the recovery of poor quality fruits was reduced to 4.1 percent with the improved practice, as compared to 7.25 percent loss with the tradi-
FIGURE 16Improved post-harvest practices introduced into the mandarin supply chain: use of harvesting tool with scissors and bag at the end (A); sorting based on maturity and freedom from defects (B); coating with a mixture of vegetable oil and detergent (C); and packing in plastic crate with plastic sheets at the bottom (D)
©E. Serrano
tional practice (Figure 17 and Table 14). Weight loss was low at 0.7 percent and was the same for both traditional and improved practice.
At the retail level, loss as a result of deterioration was absent. Weight loss on the eleventh day at the retail level was 6.8 percent for mandarins handled using the improved practice of waxing. Treatment with vegetable oil coating in combination with detergent retarded weight loss and other deteriora-tive changes in mandarins during the eleven-day holding in retail under ambient conditions.
TABLE 13Mandarin: traditional and improved post-harvest operations
Operation Traditional practice Improved practice
Harvesting Mixed maturity, generally over mature Correct stage of maturity
Waxing No waxing Waxing with vegetable oil with detergent
Packaging Plastic crate, no liner Plastic crate with plastic sheet/liner between layers of mandarin
A
C
B
D

Chapter 3 – Case study of mandarin in Nepal 23
At the wholesale level, there was a 43.4 percent reduction in loss with improved practices (Table 14). Loss reduction was highest at the retailer level at 64.6 percent.
Shelf-lifeExcessive moisture loss causing shrivelling is a major cause of losses in retail. Hence, retail-ers purchase mandarins from wholesalers that are adequate for the 11-day period. With the improved practices of waxing and layering of plastic sheets between layers of fruit, abrasion damage was reduced and retailers could extend the shelf-life of mandarins beyond the 11-day period and sell a reasonable volume of good quality fruit.
The applied wax or coating also provided a barrier to moisture loss hence shrivelling was retarded.
Produce safetyThe coating material applied protected the fruit from invasion of spoilage and pathogenic micro-organisms thus contributing to the safety of the mandarin.
Economic benefits from improved post-harvest practicesA cost-benefit analysis was completed to assess the effect of fruit maturity on returns to the wholesaler and the retailer. The benefit to the wholesaler was relatively small if mandarins were
FIGURE 17Major stakeholders in the mandarin supply chain and losses incurred employing improved handling and marketing practices
Source: field data.
TABLE 14Mandarin: losses in traditional and improved supply chain
Supply chain Losses (%) Reduction in
level Traditional Improved loss (%)
Farmer >5.0 <5.0 -
Wholesaler 7.25 4.10 43.4
Retailer 13.0 4.6 64.6
Total loss 20.2 8.7 56.9
COLLECTORTransport Service
Provider
LOCALMARKET
RETAILERS
WHOLESALER RETAILERFARMER
Institutional Buyer
NRp 45/kg NRp 60/kg NRp 90/kg
Loss = 4.6% Loss = 4.1%
Pre-harvest loss: <5% Transport/packaging-relateddamage: 2.4 %Poor quality: 1%Weight loss: 0.8%
Weight loss: 4.6%Deterioration loss after 11 days: 0%
Total Loss= 8.7%
CONSUMERS
TABLE 13Mandarin: traditional and improved post-harvest operations
Operation Traditional practice Improved practice
Harvesting Mixed maturity, generally over mature Correct stage of maturity
Waxing No waxing Waxing with vegetable oil with detergent
Packaging Plastic crate, no liner Plastic crate with plastic sheet/liner between layers of mandarin

Case studies on managing quality, assuring safety and reducing post-harvest losses in fruit and vegetable [...] 24
harvested at the correct stage of maturity. The wholesaler received only NPR 53.54/kg of manda-rins for harvesting at the correct stage of maturity and NPR 51.65/kg for over mature mandarins. It should be noted there was no difference in the selling price (NPR 60/kg) of mandarins regardless of fruit maturity (Table 15).
The retailer, however, benefited from improved returns by selling mandarins harvested at the correct stage of maturity, rather than over-ripe mandarins (Table 16), owing to the improved shelf-life. As in the case of the wholesaler, there was no difference in the selling price (NPR 90/kg) of mandarins regardless of stage of maturity. If there was a price premium for mandarins har-vested at the correct stage of maturity, the benefit to the retailer would be increased.
3.4 RESPONSE OF STAKEHOLDERS IN THE MANDARIN SUPPLY CHAIN
During the feedback session after the pilot dem-onstration, the stakeholders were impressed with the harvesting tool with scissors and harvesting bag, which reduced fruit damage. The stakehold-ers further realized the benefits of harvesting mandarins at the correct stage of maturity in terms of reduced weight loss and delayed deterioration during retail. The stakeholders asserted that in the coming harvest season, the fruit will only be harvested at the correct stage of maturity using the improved harvesting tool.
3.5 MANDARIN: CONCLUSIONS AND RECOMMENDATIONS
The simple innovations introduced in the sup-ply chain particularly when using the harvesting
TABLE 15Wholesaler: benefits of harvesting mandarins at correct maturity
Item Correct maturity Over mature
Gross returns (Volume sold – losses) x selling price
(100 kg – 7.25 kg)x NPR 60/kg, over mature
(100 kg – 4.1 kg)x NPR 60/kg, correct maturity
NPR 5 754.00 NPR 5 565.00
Costs
Cost for market preparation (0.5 working-day)
Cost for transportation (100 kg x NPR 2/kg)
200.00
200.00
200.00
200.00
Subtotal 400.00 400.00
Gross returns –Total cost 5 354.00 5 165.00
Net return (NPR/kg sold) NPR 53.54 NPR 51.65
Source: field data
TABLE 16Retailer: benefits of harvesting mandarins at correct stage of maturity
Item Correct maturity Over mature
Gross returns (Volume sold – losses) x selling price
(100 kg – 13 kg weight loss) x NPR 90/kg, over mature.
(100 kg – 4.6 kg weight loss) x NPR 90/kg, correct maturity
NPR 8 586.00 NPR 5 565.00
Costs
Cost of transportation (100 kg x NPR 2/kg)
Cost of market preparation (lump sum)
200.00
400.00
200.00
400.00
Subtotal 600.00 600.00
Gross returns –Total cost 7 986.00 7 230.00
Net return (NPR/kg sold) NPR 79.86 NPR 72.30
Source: field data

Chapter 3 – Case study of mandarin in Nepal 25
tool with scissors and bag attached; harvesting at correct stage of maturity; sorting and grading; coating with vegetable oil; and use of plastic sheet liners between layers of mandarins in plastic crates reduced total losses from 20.2 to 8.7 percent. The greatest reduction in losses occurred at the retail level because of the increased shelf-life where mandarins are held for 11 days under ambient condition. During that period, quality deteriora-tion was more apparent in the form of decay and mechanical damage when fruit was handled using the traditional practice. Moreover, since manda-rins were sold by weight, the reduction in weight loss brought about by waxing resulted in higher recovery of marketable fruit and extended shelf-life.
Lack of knowledge about good handling prac-tice is a key contributor to losses. Relevant institu-
tions should give priority to capacity-building of stakeholders through training and provision of technical assistance in the implementation of good practice in harvesting and handling.
It is highly recommended that the prevail-ing practice of preharvest contractors dictating harvesting schedules should be discouraged. Stakeholders who are preharvest contractors in the supply chain should be made aware of the implications of their practice. They must also be trained in good harvest and post-harvest practices. Another strategy for minimizing the influence of the preharvest contractors is by having an organ-ized group of farmers who are able to forge market links with buyers. Being better organized, farmers can improve their bargaining power because, they would be able to supply the same quantities to buyers through cooperative marketing.


27
4.1 OVERVIEW OF THE MANGO SUPPLY CHAIN
Mango (Mangifera indica L.) is one of the most important and popularly grown fruits in Bangla-desh. In 2013, mangoes were produced on 30.80 thousand ha with an average yield of 31.07 tonnes (BBS, 2013 as cited by Miah et al., 2015). The introduction of improved varieties, production techniques and greater market demand have led to an increase in the area and volume of mango production by 1.5 and 5.3 percent, respectively over the last few years.
Mangoes are harvested from mid-May until mid-August with different varieties harvested each season. The varieties that can be harvested in mid-May until mid-June, referred to as the early varieties, are Gopalbhog, Himsagor, Khirsapat, Brindabhani, and BARI Aam-1. The mid-season or peak season varieties harvested in mid to late June are Langra, Krisanbhog, Daseri, Lakhanbhog, and BARI Aam-2-3. The late varieties harvested in July until mid-August are Fazli, Ashina, Chausa and BARI Aam-4.
Mangoes are mainly sold on the domestic market in Bangladesh. Mangoes are supplied by wholesalers to institutional buyers such as super-markets and processors. Since 2015, small quanti-ties of mangoes have been exported to Europe, in particular to the United Kingdom and Italy.
The traditional mango supply chainFarmers in Chapai Nawabganj have been produc-ing a range of mango varieties for over 30 years. The main insect pests associated with mango production are the leafhopper, weevil, fruit fly, stem borer, and mango defoliator. The main dis-eases are dieback, gummosis, gall, anthracnose, and powdery mildew. Because of these insect and disease problems, pesticides are sprayed from 16 to 20 times per cropping season, application starts with flowering through to fruiting. Some 27 types of pesticides are frequently applied causing a major
safety concern. According to the growers, the reason for this practice is to render the mangoes disease free. Growers believe that if mangoes are disease free, then the fruit is safe to eat. Plant growth regulators are generally applied from flow-ering until fruit development and maturation to increase the size of the fruit.
Harvesting – Maturity indices followed are change in peel colour, flattening of the shoulder, and fall-ing of fruit to the ground. Mangoes are harvested either by hand followed by throwing the harvested fruit to another person holding a jute sack to catch the fruit (Figure 18A and B) or using a traditional picking tool equipped with a net at the end to catch the fruit. Using this traditional tool, however, a long stem is left, which may cause puncture dam-age to the fruit. The time of the day for harvesting is not a concern for farmers except mangoes are not harvested when it rains.
Field handling – Field sorting is done immediately after harvest. Mangoes with prominent damage caused by insects and diseases (like scab) or are deformed are culled. Sorted mangoes are packed in bamboo baskets with newspaper or rice straw cushioning (Figure 18C and 18D) for delivery to the collection centres in Volarhat, Chapai Nawab-ganj.
Packaging and transportation – At the collec-tion centre, mangoes in bamboo baskets are bulk packaged in 20 kg capacity plastic crates lined with newspaper at the bottom, on all sides and on top. Recycled fibreboard cartons are also used (Figure 18E). Traditional bamboo baskets with rice straw linings are still used for local markets.
Chapter 4
Case study of mango in Bangladesh

Case studies on managing quality, assuring safety and reducing post-harvest losses in fruit and vegetable [...] 28
Different types of vehicles are used to transport mangoes to the market depending on the destina-tion. Bicycles, rickshaws and carts are used to transport mangoes from the farm to the collec-tion centre. Trucks transport the fruit to distant wholesale markets. The major wholesale markets for mangoes produced in Chapai Nawabganj are Gazipur and Dhaka, which are located approxi-mately 450 km from the collection centre.
At the wholesale market, mangoes are distrib-uted to retailers and to other buyers that supply institutional markets such as supermarkets. The traditional supply chain for mangoes from Vol-arhat, Chapai Nawabganj to Gazipur wholesale market is shown in Figure 19.
Losses in the traditional mango supply chainWith the traditional method of harvesting, which employs the ‘pick and throw’ method, harvest defects include cracking (when uncaught fruit falls to the ground) were high at 16.6 percent (Figure 20). At the wholesale level, loss was low at 1.9 percent, mainly from weight loss. No losses were evident from mechanical damage during trans-
portation as plastic crates are traditionally used as transport containers.
Loss at the retail level was high wherein weight loss was 10.9 percent and loss from decay dur-ing the five-day retail period was 25.1 percent (Figure 20) with a high incidence of stem-end rot as compared with anthracnose. Stem-end rot and anthracnose are the major post-harvest mango diseases. Anthracnose is a latent infection and symptoms become apparent only as the fruit ripens. Post-harvest loss in mango from decay was high, particularly when fruit was harvested during the rainy season from May to July.
The retailer’s high losses are one of the reasons for the big difference between the retail price in Bangladesh Taka (BDT) 60/kg and farm gate price (BDT 35/kg) for mangoes.
4.2 TECHNICAL INNOVATIONS AND PRACTICES INTRODUCED FOR MANGO
On the basis of the results of loss measurements in the traditional supply chain, key steps targeted for improvement in the supply chain were: harvest-
FIGURE 18Packaging in the traditional mango supply chain: harvesting using the pick-throw-catch method (A); harvested mangoes directly in contact with the ground (B); use of rice straw as cushion in bamboo baskets (C); field-packed mangoes for delivery to collection centre (D); and packaging materials for transporting mangoes (E)
©E. Esguerra
A B C
D E

Chapter 4 – Case study of mango in Bangladesh 29
FIGURE 19Traditional mango supply chain from Chapi Nawabganj to Gazipur
Source: field data.
FIGURE 20Major stakeholders in mango supply chain and losses incurred using traditional practices for handling and marketing
Source: field data.
Harvesting: manual (pick and throw; traditional picking poleHarvest container: jute sack (for pick and throw); bamboo basket for picking pole
SupermarketsSupermarkets Manual Hauling: cart, bicycles, mini-truck100 m to 1 km
Packaging: 20 kg plastic cratesCushioning material: newspaper liningLoading in truck
Transportationby truck450 km
CONSUMERS
Wholesale Market
Collection center near the farm
Production Farms(Chapai Nawabganj)
Retail Markets
COLLECTORTransport Service
Provider
LOCALMARKET
RETAILERS
WHOLESALER RETAILERFARMER
Institutional Buyer
Tk 35/kg Tk 50/kg Tk 60/kg
Loss = 36% Loss = 1.9% Loss = 16.6%
Pre-harvest loss: 15.8%Harvest defects: 16.6% (fruit cracks)
Mechanical damage: 0%Weight loss: 1.9%
Weight loss: 10.9%Decay after 5 days: 25.1%
Total Loss = 54.5%
CONSUMERS

Case studies on managing quality, assuring safety and reducing post-harvest losses in fruit and vegetable [...] 30
ing using an improved harvesting tool; sorting using plastic crates as field containers; delatexing, and disease control with hot water treatment (Figure 21 and Table 17). Packaging innovation was unnecessary as plastic crates are widely used by traders as bulk packaging.
Harvesting – A modified harvesting tool designed by the Bangladesh Agricultural Research Institute (BARI) was introduced during pilot demonstra-tions. The harvesting tool includes an aluminium pole with a blade attached at the end (Figure 22A) such that when mangoes are harvested, a short stem is left on the fruit thus reducing latex stain-
TABLE 17Traditional and improved post-harvest handling operations and technologies during the pilot demonstration in the mango supply chain
Operation Traditional practice Improved practice
Harvesting Farmer’s picking pole BARI improved picking pole
Field packing Bamboo basket Plastic crate
Trimming of stem Hand pulling of stem Trimming with scissors. The person doing the trimming wears gloves
Delatexing No delatexing Use of a delatexing tray with trimmed fruit placed stem end down
Disease control No hot water treatmentHot water treatment (53 oC, 5 minute dip) followed by 5 minutes hydrocooling in tap water
Packaging for transport Plastic crate Plastic crate
Source: field data.
FIGURE 21Improved mango supply chain from Chapai Nawabganj to Gazipur
Source: field data.
Field sorting and packing: 30 kg plastic crateHarvesting: BARI picking toolHarvest container: bamboo basket
SupermarketsSupermarkets Manual Hauling: cart, bicycles, mini-truck100 m to 1 km
Loading in truckPackaging: 30 kg plastic cratesCushioning material: newspaperlined on all sides of the crateHot water treatment: 53°C for 3 mincooling and dryingTrimming of long stemDelatexing
Transportationby truck450 km
CONSUMERS
Wholesale Market
Collection center near the farm
Production Farms(Chapai Nawabganj)
Retail Markets

Chapter 4 – Case study of mango in Bangladesh 31
ing. Two types of harvesting tools were fabricated by BARI, one for mangoes on high branches (tall trees), and the other for mangoes within easy reach. Once detached, mangoes were transferred to the collection basket, which was then lowered to the ground. Field level handling – Mangoes were sorted on the basis of their external appearance (free of mechanical injury and insect damage), and were transferred to plastic crates as field containers (Figure 22B).
The crated mangoes were transported to the collection centre where the long stem was trimmed using scissors, the mangoes were then delatexed, the fruit is placed stem end down for approxi-mately 10 minutes on the delatexing tray (fabri-cated by BARI), to allow the latex to drain (Figure 22C). The delatexed mangoes were transferred to plastic crates for the hot water treatment (HWT) for 5 minutes at 53oC (Figure 22D). Langra variety mangoes are thin skinned, hence the choice of this protocol to prevent fruit damage. Following the hot water treatment, the crated mangoes were transferred to another tank containing tap water under ambient conditions and allowed to hydro-
cool for five minutes, they were then air dried on a stainless steel sorting table.
Mangoes were bulk packed in plastic crates (Figure 22E) having a 30 kg capacity with newspa-per liner at the bottom and between the layers of fruit. Mangoes were transported in the evening of the same day together with a commercial load in a 12-tonne truck and reached Gazipur wholesale market the following evening. The distance from Volarhat to Gazipur is 450 km.
4.3 MANGO: ANALYSIS OF RESULTSWhen the improved BARI harvester was used, no harvest defects such as fruit cracks occurred. This is due to the fact that the harvester is equipped with a net attached at the end to catch the harvested fruit, it also has a collecting basket that is lowered to the ground when half-filled with harvested mangoes. Moreover, the improved BARI harvesting tool reduced the length of the stem left on the fruit, and as a result, hand cutting of the stem was not required. This further reduced injury to the fruit.
At the wholesale level, there was no incidence of mechanically damaged mangoes as the plastic crates lined with newspaper on all sides are effec-
FIGURE 22Operations and improved practices in the mango supply chain: improved BARI picking tool (A); field sorting and packing in plastic crates (B); trimming of long stem and delatexing in trays (C); hot water treatment (D); and packing in plastic crates as transport containers (E)
©E. Esguerra
A B C
D E

Case studies on managing quality, assuring safety and reducing post-harvest losses in fruit and vegetable [...] 32
tive as field and transport containers. The only loss at the wholesale level was in weight, which was minimal at 1.6 percent (Figure 23).
During the five-day retail period under ambient conditions, weight loss was high at 9.8 percent with the mangoes exhibiting slight shrivelling. The predominant form of decay during retail of Langra mangoes was stem-end rot, which developed both in unripe and ripe fruit.
With the traditional practice, where there is no HWT, stem-end rot was apparent even on the first day of retail and was almost negligible in mangoes treated using the improved practice of HWT. The incidence of stem-end rot progressively increased with extended holding in retail. On the fifth day, the proportion of fruit with stem-end rot was 7 percent (Figure 23) for fruit handled using the improved practice, while 25 percent of fruit were infected when traditional practices were employed. These fruit were already unmarketable and thus represented a total loss.
Unlike the case for stem-end rot, anthracnose infections developed only as the mangoes ripened, coinciding with the time when mangoes are in retail or with the consumers. As in the case of
stem-end rot, HWT dramatically retarded the onset of anthracnose and reduced the incidence to a very low level and also reduced the severity of infection. Mangoes exhibiting slight anthracnose infection were still marketable although the price was low.
Another benefit of the improved practice of HWT was the rapid and uniform ripening of the mangoes since heat accelerates physiological processes such as ripening. Moreover, the Langra variety does not undergo colour change during ripening but with HWT, peel colour change from green to light yellow was observed. The change in peel colour can therefore be used as an index of ripeness, thus preventing damage to the fruit when consumers touch it to determine ripeness.
Another secondary benefit of HWT is that the visual appeal of the fruit is enhanced when fresh latex has been washed off.
Unmarketable mangoes include fruit that exhibit moderate to severe anthracnose and stem-end rot infection. On the third day, when mangoes were almost ripe, unmarketable fruit amounted to 11.4 percent of those handled using traditional practices as compared to only 3.4 percent for
FIGURE 23Major stakeholders in the mango supply chain and losses incurred using the improved practices for handling and marketing
Source: field data.
COLLECTORTransport Service
Provider
LOCALMARKET
RETAILERS
WHOLESALER RETAILERFARMER
Institutional Buyer
Tk 35/kg Tk 50/kg Tk 60/kg
Loss = 16.3% Loss = 1.6% Loss = 0%
Harvest defects due to: fruit cracks: 0%
Mechanical damage: 0%Weight loss: 1.6%
Weight. loss: 9.3%Decay after 5 days: 7%
Total Loss = 18.4%
CONSUMERS

Chapter 4 – Case study of mango in Bangladesh 33
HWT mangoes. Extending the retail period to five days resulted in a very high percentage of unmar-ketable mangoes (25.1 percent) for the traditional practice as compared to only 7 percent for the improved practice. These unmarketable mangoes were considered as post-harvest loss.
Because of the simple interventions introduced in the supply chain, losses in mangoes were greatly reduced. The simple intervention of using an improved harvesting tool reduced losses related to fruit cracks at harvest by 100 percent (Table 18). At the wholesale level, loss was very low because of the absence of mechanical damage related to the use of plastic crates as transport containers. Moreover, wholesalers retained mangoes for one to two days.
The HWT provided a low cost treatment as a means to reducing losses, amounting to only BDT 0.63/kg of mangoes. This physical method of controlling decay reduced stem-end rot and anthracnose infection from 25.1 percent employ-ing the traditional practice to 7 percent with the improved practice, equivalent to a 72.1percent reduction in decay and ultimately loss (Table 18).
With the application of improved practice, better quality mangoes obtained commanded a comparably high retail price of BDT 80/kg. Man-goes with slight shrivelling but no anthracnose infection, commanded a retail price of BDT 60/kg.
Shelf-lifeDecay in mangoes limits the potential shelf-life of the fruit. Stem-end rot is a devastating post-harvest disease that develops both in unripe and ripe fruit. Moreover, even with slight stem-end rot infection, the fruit is rendered unmarketable and inedible. Anthracnose disease on the other hand, develops only as the fruit ripens and this usually manifests at the retail level. Because of these two diseases,
traditionally handled mangoes have a shelf-life of one to three days in retail, with a lower price for marketable mangoes on the third day. With the improved practice, in particularly HWT, the onset of decay was delayed, the incidence of decay was reduced and the severity of infection was only slight, resulting in an extended shelf-life in retail of two to three additional days or more. Beyond the five-day retail period mangoes were already overripe but still edible.
Shelf-life was also extended because of the effect of HWT in enhancing peel colour change thus consumers were less likely to touch the fruit to determine ripeness. With constant finger pres-sure on the fruit, stress is induced, which leads to an enhanced rate of fruit ripening; fruit becomes overripe on the third day thus reducing market-able life.
Produce safetyHot water treatment is a physical method and no chemicals are added thus it is a safe method of con-trolling decay. If adopted on a wider scale, especially for the mass market, HWT will eliminate consumers concern regarding the safety of mangoes because of reports that chemicals such as formalin and even fungicides are used after harvest to control decay. Fungicides, especially the systemic, have a long preharvest interval. Considering that mangoes ripen within 3 to 5 days after harvest, high levels of chemi-cal residue in the fruit becomes a problem.
The improved harvesting tool, and the method of harvesting, prevented fruit from falling to the ground, thus reducing the risk of contamination. Fruit that falls to the ground, without cracks, are included in packing and if not thoroughly cleaned can pose a health risk.
TABLE 18Losses in the traditional and improved mango supply chain. (Source: field data)
Supply chain level Losses (%)/Handling practice Reduction in loss
Traditional Improved (%)
Farmer (16.6) (0) (100)
Wholesaler 1.9 1.6 15.8
Retailer36.0
(25.1 % decay)
16.8
(7.0 % decay)
53.3
(72.1)
Total loss37.9
(Excluding harvest loss)18.4 66.2
Source: field data.

Case studies on managing quality, assuring safety and reducing post-harvest losses in fruit and vegetable [...] 34
Economic benefits from improved practiceWith HWT, mango traders and exporters can minimize if not totally control decay depending on the growing season (dry or rainy). Hot water treatment results in increased returns or income resulting from the increased volume of mangoes of marketable quality or higher-priced produce. Costs are also reduced as a result of labour savings for sorting decayed mangoes.
Since the onset of decay occurs at the trader level particularly during retail when mangoes begin to ripen, the economic benefits were com-puted at the retail level on two occasions: on day three when mangoes were almost ripe and of good quality, and on day five, simulating extended holding in retail especially during the peak month of June.
Gross returns – An 11.4 percent loss with the traditional practice (No HWT) on day 3, was equivalent to 114 kg of unmarketable mangoes. At the retail price of BDT 80/kg, the estimated gross returns would be BDT 70 880/week. With the improved practice (HWT), the loss was only 3.4 percent hence the estimated gross returns would be BDT 77 280/week. The additional weekly gross income as a result of the improved practice (HWT) would be BDT 6 400/week.
On day 5 representing an extended retail peri-od, some mangoes exhibited shrivelling and were almost overripe. For mangoes handled using the improved practice (HWT), decay was absent and fruit were of better quality than those handled using the traditional practice (No HWT) hence the retail price was BDT 60/kg. With fruit handled using the traditional practice, slight anthracnose infection was apparent in some fruit and the retail price was lower at BDT 50/kg. On day 5, losses
related to decay increased to 25.1 percent for fruit handled using the traditional practice equivalent to 251 kg of unmarketable mangoes. The esti-mated gross income then would be BDT 37 450. With the improved practice, losses amounted to only 7 percent equivalent to 70 kg of unmarket-able mangoes. At a retail price of BDT 60/kg, the estimated gross income would be BDT 55 800. The additional gross income per week with the improved practice would be BDT 18 350.
The summary of added gross returns using the improved practice particularly HWT that would be obtained on days 3 and 5 of retail is shown in Table 19.
Added cost – With the improved practice of HWT, additional costs incurred, include the depreciation cost of the HWT tank and the cool-ing tank, use of electricity and water, labour cost during HWT and the opportunity cost of capital. The total added cost with HWT is BDT 0.63/kg of mangoes.
The retailer would benefit from the improved practice of HWT (Tables 20 and 21). On the third day of retail, the net returns are however lower than on day five, when a higher volume of man-goes would be sold because of the low incidence of decay and therefore higher recovery of marketable mangoes.
4.4 RESPONSE OF STAKEHOLDERS IN THE MANGO SUPPLY CHAIN
The pilot demonstration was conducted in a major mango production area. Moreover, the building of the Mango Foundation where the HWT dem-onstration was conducted, is located in the central collection centre in Volarhat. Thus, both members of the Mango Foundation and a range of other stake-
Assumptions:Volume of mangoes handled during the 5-day retail period: 1 000 kg
Retail price of mango on day 3: BDT 80/kg1
Retail price of mango on day 5
For HWT mangoes with slight shrivelling,
some overripe but no decay:BDT 60/kg
For non-HWT-treated mangoes with slight
shrivelling, slight anthracnose, overripe:BDT 50/kg
Labour cost for sorting decayed mangoes: BDT 500/day2
1 Mangoes were of good quality on day 3 for both the IP-HWT and TP – No HWT2 Based on data received from BARI on 23 August 2016
Chapter 4 – Case study of mango in Bangladesh 35
holders participated in the demonstration of HWT. The discussions with the stakeholders and the dem-onstrations of the effects of the good post-harvest practices such as the use of an improved harvesting
tool, and delatexing to reduce latex stains on the fruit enhanced the awareness of the stakeholders that fruit rejection, if not losses, can be reduced with the application of these simple techniques.
TABLE 19Summary of gross returns obtained with improved practice of HWT versus the traditional practice of no HWT during the five-day retail period
Parameter Day 3 Day 5
Traditional Improved Traditional Improved
Loss (%) 11.4 3.4 25.1 7.0
Unmarketable volume (kg) 114 34 251 70
Marketable volume (kg) 886 966 749 930
Gross income (BDT) 70 880.00 77 280.00 37 450.00 55 800.00
Additional gross income (BDT) 6 400.00 18 350.00
Source: field data.
TABLE 20Retailer: benefits on day three after applying HWT improved practice
Item TraditionalNo HWT
ImprovedWith HWT
Gross returns (Volume sold – losses) x selling price
(1 000 kg – 114 kg) x BDT 80/kg; No HWT
(1 000 kg – 34 kg) x BDT 80/kg; With HWT
BDT 70 880.00 BDT 77 280.00
Costs
Cost of HWT (BDT 0.63/kg of mangoes)
Cost of sorting during retail
0
500.00
630.00
0
Subtotal 500.00 630.00
Gross returns –Total cost 70 380.00 76 650.00
Net returns (BDT/kg) 70.38 76.65
Source: field data
TABLE 21Retailer: benefit on day five after applying HWT improved
Item TraditionalNo HWT
ImprovedWith HWT
Gross returns (Volume sold – losses) x selling price
(1 000 kg – 251 kg) x BDT 50/kg; No HWT
(1 000 kg – 70 kg) x BDT 60/kg; With HWT
BDT 37 450.00 BDT 55 800.00
Costs
Cost of HWT (BDT 0.63/kg of mangoes)
Cost of sorting during retail
0
500.00
630
0
Subtotal 500.00 530.00
Gross returns –Total cost 36 950.00 55 170.00
Net returns (BDT/kg) 36.95 55.17
Source: field data

Case studies on managing quality, assuring safety and reducing post-harvest losses in fruit and vegetable [...] 36
During the training of stakeholders in the supply chain, the results of the pilot demon-stration were presented. The benefits derived from reducing the incidence of decay (both stem-end rot and anthracnose) through HWT, which included reduced losses, enhanced ripening and peel colour change (for the Langra variety that does not change colour), reduced latex staining, and enhanced marketable life of the mango fruit, created interest among the members of the Mango Foundation as well as the stakeholders from the districts of Kansat and Chapai Sardar. Some of the stakeholders present during the pilot demonstra-tion and training, particularly those engaged in mango trading, expressed an interest in adopting the improved practices to supply mangoes to institutional buyers such as supermarkets or as suppliers to exporters based in Dhaka.
4.5 MANGO: CONCLUSIONS AND RECOMMENDATIONS
Innovations introduced during the project which demonstrated their beneficial effects in terms of reducing losses from decay, enhancing peel colour, reducing latex stains on the peel, which detracts from consumer appeal would be most useful if adopted by organized groups of stakeholders. A price premium for mangoes subjected to improved practices can be earned, by organized groups that link to the market. These groups might further add value through branding of their produce.
The mango industry in Bangladesh is a flour-ishing industry where the area under production is expanding to meet high domestic demand. Moreover, the rise of modern markets such as supermarkets, hotels and other institutional buy-ers as well as the increasing volume of exports necessitates that emphasis is placed on quality and safety management along the supply chain.
Several varieties of mangoes flower and fruit in different seasons from May until mid-August, which is also the rainy season. As such, mangoes are prone to decay since the warm and humid conditions during flowering until fruit matura-tion are conducive to infection. The incidence of decay after harvest, particularly stem-end rot and anthracnose, has been identified as a major con-
tributing factor to high post-harvest losses, which was verified in the loss assessment study and in the pilot demonstration.
The following are further recommendations to ensure sustained interest and adoption of the improved post-harvest practices:
� BARI through the Post-harvest Technol-ogy Section and the Regional Horticultural Research Station (RHRS) and the Depart-ment of Agricultural Extension should pur-sue a vigorous information campaign on the benefits of improved post-harvest practices through seminars and production of infor-mation materials. The Mango Foundation in Volarhat is strategically located in the central mango collection centre and buying stations. Posters illustrating the improved practices and the technical and economic benefits can be printed and posted in the collection centre and outside the Foundation building.
� Since the members of the Mango Foundation who are engaged in the mango business are interested in forging market links with insti-tutional buyers such as supermarkets and in supplying the exporters, where they will make use of the facilities provided by FAO, BARI should provide technical assistance to the Foundation. A packinghouse facility that adopts good manufacturing practices (GMP) needs to be established particularly if the locality will be a major supplier of mangoes for export and modern markets. The Mango Foundation should assume responsibility for the management and operation of the facili-ties provided by FAO. Non-members of the Mango Foundation, who are interested in adopting the improved practices, can use the facilities provided by FAO on condition they pay a service fee.
� BARI through the Post-harvest Technol-ogy Section should conduct studies on the optimization of HWT protocol for different varieties of mango grown during the early, peak and late seasons. The optimized proto-col should provide a high degree of disease control without affecting fruit quality.

37
5.1 OVERVIEW OF THE SNAP BEAN SUPPLY CHAIN
The snap bean (Phaseolus vulgaris) ranks as the sixth most consumed vegetable in Sri Lanka. Snap beans are high in protein and soluble fibre and are low in calories. They are also an excel-lent source of vitamins, minerals, omega-3 fatty acids and contain valuable quantities of silicon in an absorbable form. Although snap beans can be grown throughout the country, commercial cultivation is limited to two districts Badulla and Matale. Snap bean is, however, produced mostly on small farms.
Being an immature legume, the skin of the snap bean is thin and very sensitive to even slight physical pressure, which results in mechanical damage such as bruising and cuts. Damaged portions of the pod serve as entry points for disease-causing organisms as well as an avenue for water loss that eventually results in shrivel-ling and pod toughening. The respiration rate of snap beans at harvest is also high as the pods are harvested at a relatively immature stage with seeds that are still underdeveloped. Because of these characteristics snap beans undergo rapid deterioration post-harvest.
The traditional snap bean supply chainAn overview of activities within the traditional supply chain for snap beans in Sri Lanka is shown in Figure 24.
Harvesting – Snap beans are mainly harvested when traders or collectors are ready to collect the crop. Harvested pods are partially mature, elongated and filled and undergo toughening 2 to 3 days after harvest. Pods are harvested at this stage of maturity because of the high yield per harvest. Traders or collectors visit culti-vated areas twice per week and harvest over-mature pods. Beans are generally harvested in the morning.
Field level handling – Field sorting is done while harvesting the beans. The harvesters discard pods (in the field) that are damaged by insects or diseases and that exhibit other defects. Harvest-ed pods are tightly packed into woven poly-sack bags (Figure 25A), weighing approximately 50 kg each. The filled sacks are transported to col-lection centres using two-wheeled tractors, three wheelers, motorbikes or are carried by men on their backs (Figure 25B). Sometimes, beans are again sorted at the collection centre where the level of handling is increased.
Packaging and transportation – The sorted beans are bulk packed in 50 kg capacity poly-sacks (Fig-ure 25C). Snap beans are marketed in two major wholesale markets: Dambulla and Colombo. They are transported to the wholesale markets (172 km of good road from the collection centre to Colombo) mainly by open trucks and are covered with either a tarpaulin or polyethylene sheet dur-ing transportation. They are often transported immediately after mid-day under hot sun, most trucks do not have a roof to protect the produce from sunlight during transportation.
Losses in the traditional supply chainAt the farm, preharvest loss amounted to 8.05 percent attributed to pod immaturity or over-maturity, small pod size, insect and disease damage and pod breakage. Packing of snap beans in 50 kg poly-sacks and piling the sacks on a truck, resulted in a high level of mechani-cally damaged (14 percent) pods at the wholesale level. Even with the short duration of holding at the wholesale level, weight loss of 3.90 percent occurred. This high level of weight loss was likely the result of heat build-up within the pile of poly-sacks of beans owing to the high respira-tion rate of the pods since they were harvested at a relatively immature stage. At the wholesale level, total loss was 17.90 percent.
Chapter 5
Case study of snap beans in Sri Lanka

Case studies on managing quality, assuring safety and reducing post-harvest losses in fruit and vegetable [...] 38
FIGURE 24Traditional snap bean supply chain from Walimada/Naula to Colombo
Source: field data.
FIGURE 25Traditional handling practices for snap beans: poly-sack as harvest or field container (A); sacks of snap beans carried on shoulder at the collection centre (B); and 50 kg capacity poly-sacks of snap beans in the wholesale market (C)
©E. Serrano
A
B C
Harvesting: manual hand pickingMaturity of pod: mixedHarvest container: poly sack, plastic bag
Supermarkets
Hotels,Restaurants
Hotels,Restaurants
Retail Markets
ManualHauling/Vehicle100 m to 2.5 km
Packaging: 50 kg capacity mesh or plastic sackLoading: into van or truck
Transportationby truck172 km,good road
CONSUMERS
Wholesale Market
Collection center/areanear the farm or house
Production Farms

Chapter 5 – Case study of snap beans in Sri Lanka 39
Poly-sacks are used for transporting snap beans from wholesale to retail. During retail, snap beans are displayed loose on tables with-out any retail packaging. Thus, during the six-day holding in retail, weight loss was 11.74 percent and deterioration loss was 14 percent resulting in a total loss of 35.74 percent at the
retail level (Figure 26). Deterioration loss was in the form of pod toughening and yellow-ing brought about by high weight loss, and discoloration of the pods because of abrasion damage. Total loss from the farm up to six-days in retail using the traditional handling practice was 51.69 percent.
FIGURE 26Major stakeholders in the snap bean supply chain and losses incurred using traditional practices for handling and marketing
Source: field data.
FIGURE 27Operations and improved practices in the snap bean supply chain: harvesting pods at the correct stage of maturity (A); sorting based on external appearance (B); and bulk packing in 15 kg capacity plastic crates (C)
©E. Serrano
A B C
COLLECTOR
LOCALMARKET
RETAILERS
WHOLESALER RETAILERFARMER
Institutional Buyer
SLR 100/kg SLR 120/kg SLR 200/kg
Loss = 25.74% Loss = 17.9% Loss = 8.05%
Pre-harvest loss: 8.05% Mechanical damages: 14%Weight loss: 3.9%
Weight loss: 11.74%Deterioration loss after 4 days: 14%
Total Loss = 51.69%
CONSUMERS

Case studies on managing quality, assuring safety and reducing post-harvest losses in fruit and vegetable [...] 40
5.2 TECHNICAL INNOVATIONS AND PRACTICES INTRODUCED FOR SNAP BEANS
Harvesting – During the pilot demonstration only pods at the correct stage of maturity were manually harvested (Figure 27A). The harvested pods were transferred to poly-sacks because they are easy to carry along the rows of snap beans.
Field level handling – After field packing, the sacks were manually hauled to the collection centre located about 50 to 100 m from the farm. At the collection centre, the beans were sorted based on external appearance such as freedom from defects and damage, maturity (Figure 27B).
Packaging and transportation – Sorted beans were packed in plastic crates having a 15 kg capacity (Figure 27C), loaded in trucks and transported to the wholesale market in Colombo where they were purchased by retailers and institutional buyers.The improved handling practices in the supply chain and the operations during the pilot demon-stration are shown in Figure 28 and Table 22.
5.3 SNAP BEANS: ANALYSIS OF RESULTS
Reduced losses in the improved supply chainPreharvest loss resulting from insect and pest damage remained at 8.05 percent at the farm level. At the wholesale level, transport and packaging-related damage amounted to 4.40 percent with the
FIGURE 28Improved snap bean supply chain from Walimada/Naula to Colombo
Source: field data.
TABLE 22Snap beans: traditional and improved post-harvest operations
Operation Traditional practice Improved practice
Harvesting Mixed maturities Correct stage of maturity
Sorting Field sorting while harvesting Sorting at the collection centre
Bulk packaging 50 kg poly-sacks 15 kg capacity plastic crates
Source: field data
Manual harvestingMaturity: correct maturity Harvest container: PP bag
Supermarkets
Retail Markets Retail
Markets
Hotels,Restaurants
ManualHauling50-100 m
Loading into van or truckPackaging: 15 kg capacity plastic crateManual sorting: on covered ground
Transportationby van/truck176 km,good road
CONSUMERS
Wholesale Market - Colombo
Collection center/areanear the farm or house
Production FarmsWalimada

Chapter 5 – Case study of snap beans in Sri Lanka 41
use of plastic crates (Figure 29). In the traditional packaging practice of using 50 kg poly-sacks as the transport container, mechanical damage to the snap beans was high at 14.40 percent. Weight loss was reduced from 3.90 percent in the traditional practice to 2.90 percent in the improved practice. Total loss at the wholesale level was 7.30 percent.
At the retail level, weight loss was 7.31 percent during the four-day retail period. During retail, the beans were displayed in a loose format under ambient conditions resulting in a high level of weight loss. Loss from deterioration was also high at 13.30 percent (Figure 29) with only very slight reduction from 14 percent deterioration loss in the
improved practice. At the retail level, total loss was 20.61 percent during the four-day retail period. At this level, weight loss and loss from deterioration was still high because of the manner of retail display that results in moisture loss from snap beans, which eventually leads to discoloration and shrivelling of pods. Retail packaging of snap beans into convenient sizes (250 gr to 1 kg pack) in mesh or plastic bags of suitable thickness with small perforations/holes to allow for transpiration of moisture and gas, would reduce the rate of weight loss and associated deteriorative changes.
Table 23 shows the reduction in losses when employing improved practices in the supply chain.
FIGURE 29Major stakeholders in the snap beans supply chain and losses incurred using improved practices for handling and marketing
Source: field data.
TABLE 23Snap beans: losses in the traditional and improved supply chain
Supply chain Losses (%)/Handling practice Reduction in loss
level Traditional Improved (%)
Farmer 8.05 8.05 0
Wholesaler 17.90 7.30 59.2
Retailer 25.74 20.61 19.9
Total loss 51.69 35.96 30.4
Source: field data
COLLECTOR
LOCALMARKET
RETAILERS
WHOLESALER RETAILERFARMER
Institutional Buyer
SLR 100/kg SLR 120/kg SLR 200/kg
Loss = 20.61% Loss = 7.3% Loss = 8.05%
Pre-harvest lossand harvest defects: 8.05%
Transport/packaging-related damage: 4.4%Weight loss: 2.9%
Weight loss: 7.31%Deterioration loss after 4 days: 13.3%
Total Loss = 35.96%
CONSUMERS

Case studies on managing quality, assuring safety and reducing post-harvest losses in fruit and vegetable [...] 42
The greatest loss reduction was obtained at the wholesale level at 59.2 percent as a result of the reduction in mechanical damage when 15 kg capacity plastic crates are used for bulk packaging and transportation. At the retail level, reduced loss during the four-day retail period was only 19.9 percent and largely because of how the pro-duce was displayed, which resulted in moisture loss. In the traditional practice, the total loss was 51.69 percent, which was reduced to 35.96 percent when improved practices were employed resulting in 30.4 percent reduction in total losses.
Shelf-lifeAs previously highlighted, snap beans are imma-ture vegetables with a thin skin that is highly susceptible even to slight physical damage. Snap beans generally remain highly marketable for two days in retail owing to their rapid rate of deterio-ration. With the improved practice of using 15 kg capacity plastic crates, the rate of deterioration of snap beans was retarded because of the reduction or prevention of damage. Pods that are not dam-aged have a longer shelf-life (more than three to four days) on retail shelves than have damaged pods. Moreover, a longer shelf-life will be attained if snap beans are sold in retail packs than when they are sold loose.
Produce safetyImproper sorting during the traditional practice rendered the snap beans totally unmarketable. Moreover, damage incurred with the rough han-dling provided avenues for the entry of patho-genic and spoilage micro-organisms that may pose health risks. With improved packaging, pods were susceptible to minimal damage, resulting in reduced infection.
Economic benefits from applying improved practiceFarmers would benefit from the use of plastic crates for bulk packaging, as they would be able to sell larger quantities of beans because of the reduced damage or physical losses during harvest. With the use of plastic crates, farmers would have net returns of LKR 113.74/kg compared with only LKR 95.40 when using poly-sacks as transport containers (Table 24). A greater level of profit is realized if the farmer sells directly to the wholesaler as the wholesaler would purchase the beans at a higher price because of the good quality. Further, the long utility life (10 years) of plastic crates provides added benefit to the user over the long term.
The wholesaler and retailer benefitted from the use of plastic crates as the proportion of unmar-ketable pods, resulting from physical damage, was substantially reduced on arrival at the wholesale market. The wholesaler obtained a net return of LKR 111.06/kg with the improved practice and LKR 93.80/kg with the traditional practice (Table 25). At the retailer’s end, the pods incurred less decay and reduced weight loss. Thus, the retailer’s net returns were LKR 158.00/kg with the improved practice and only LKR 143.92/kg with the traditional practice (Table 26). These benefits will trickle down to the farmer through an increase in the buying price paid by the whole-saler for good quality produce if the farmer uses plastic crates for bulk packaging and transporting produce to the wholesaler.
5.4 RESPONSE OF STAKEHOLDERS IN THE SNAP BEANS SUPPLY CHAIN
The stakeholders realized the benefits of using plastic crates for the bulk packaging of snap beans to reduce damage during transportation. Moreover, the pilot demonstration and training in harvesting at the correct stage of pod maturity and proper sorting increased stakeholder confidence in applying good post-harvest principles and practice in the supply chain.
A significant accomplishment of the pilot dem-onstration and training was the forging of a market link between the operations manager of the packinghouse/collection centre that supplies snap beans to two major supermarket chains in Sri Lanka.
5.5 SNAP BEAN: CONCLUSION AND RECOMMENDATION
The traditional method of handling snap beans in Sri Lanka results in 51.69 percent loss spread among the farmer (8.05 percent), the wholesaler (18 percent) and the retailer (25.74 percent). The retailer incurs the highest losses because beans have to be sold at a high price (LKR 200-240/kg) to consumers. In effect, it is the consumer who pays for the losses and is the one who loses out. With improved supply chain management, includ-ing the use of plastic crates, the levels of loss were substantially reduced (36.46 percent). Losses at the wholesale level were reduced to 7.3 percent, and at the retail level were reduced to 20.6 percent. The retailer can reduce the selling price because larger quantities of snap beans can be sold as the shelf-life has been improved. With lower losses and better quality beans, the wholesaler can buy

Chapter 5 – Case study of snap beans in Sri Lanka 43
a larger quantity from the farmer at a higher buying price. Therefore, the farmer benefits the most from using plastic crates at harvesting and transportation through to the wholesaler.
In general, the farmer, the wholesaler and the retailer benefit from the use of plastic crates as a bulk-packaging container. With the improved practices the consumer will also benefit from
TABLE 24Farmer: benefits of using plastic crates for bulk packaging and transportation
Item Plastic sack Plastic crate
Gross returns (Volume sold x selling price)
100 kg x LKR 100.00/kg LKR 10 000.00
(100 kg + 8.5) x LKR 105.00/kg LKR 11 392.00
Costs
Depreciation cost of packaging material
Interest on capital of packaging material
400.00
60.00
14.79
2.30
Subtotal 460.00 17.08
Net returns (Gross returns – costs) 9 540.00
LKR 95.40/kg
11 374.92
LKR 113.74/ kg
Source: field data
TABLE 25Wholesaler: benefits of using plastic crates for bulk packaging and transportation
Item Plastic sack Plastic crate
Gross returns (Volume sold – losses) x selling price)
(100 kg – 18 kg) x LKR 120.00/kg LKR 9 840.00
(100 kg – 7.3 kg) x LKR 120.00/kg LKR 11 124.00
Costs
Depreciation cost of packaging material
Interest on capital of packaging material
400.00
60.00
14.78
2.30
Subtotal 460.00 17.08
Net returns (Gross returns – costs) 9 380.00
LKR 93.80/kg
11,106.92
LKR 111.06/kg
Source: field data
TABLE 26Retailer: benefits of using plastic crates for bulk packaging and transportation
Item Plastic sack Plastic crate
Gross returns (Volume sold – losses) x selling price)
(100 kg – 25.74 kg) x LKR 200.00/kg LKR 14 852.00
(100 kg – 20.61 kg ) x LKR 200.00/kg LKR 15 878.00
Costs
Depreciation cost of packaging material
Interest on capital of packaging material
400.00
60.00
14.79
2.30
Subtotal 460.00 17.08
Net returns (Gross returns – costs) 14 392.00
LKR 143.92/kg
15 860.92
LKR 158.60/kg
Source: field data

Case studies on managing quality, assuring safety and reducing post-harvest losses in fruit and vegetable [...] 44
receiving the best value for money as they can buy higher quality produce at the lower price offered by the retailer.
Losses at the retail level would further be reduced if the beans were sold in retail packs to reduce weight loss that eventually leads to pod discoloration, shrivelling and toughening.During training, some stakeholders suggested the following:
� People involved in the handling of produce in the collection centres and packinghouses should also be trained in good post-harvest practices.
� Farmers should also be trained in good agri-cultural practices, particularly pest manage-ment so production costs can be lowered and the safety of snap beans ensured.
� As marketing is still a problem, the Ministry of Agriculture could make market linking or market matching one of its top priorities.

45
6.1 OVERVIEW OF THE WINTER TOMATO SUPPLY CHAIN
Tomatoes (Lycopersicon esculentum Mill.) are popularly vegetables consumed in Bangladesh. They are a rich source of vitamins A and C and are an excellent source of lycopene (a powerful antioxidant). Over the past three years, tomato production in Bangladesh has increased as a result of the introduction of improved varieties and pro-duction techniques as well as because of increased market demand and growth of modern market outlets, in particular supermarkets, hotels and res-taurants. Quality attributes desired by consumers in a tomato are: attractive colour, mature status, clean and fresh, firm, large, and free of ripening chemicals.
Tomato production in Bangladesh is, however, beset with many pre and post-harvest problems such as the indiscriminate use of pesticides and the use of various ripening agents that pose health risks to humans. Moreover, after harvest, losses are high because of the inherently perishable nature of tomatoes, which is increased by rough handling practices and unfavourable environmental condi-tions that enhance produce deterioration.
The traditional winter tomato supply chainBogra is a major production area for winter tomato and is a preferred source for the fruit. The Sulop variety, which is grown in the region, meets the quality attributes desired by consumers. Increasing tomato production and the practice of monoculture has resulted in pest and disease infestation in production. To address these prob-lems, farmers apply 29 types of pesticides in one cropping season beginning with flowering and ending with harvesting. Considering that tomatoes are harvested two to three times a week, pesticide residues on tomatoes pose major safety risks.
Harvesting – Tomatoes are harvested at different stages of maturity or ripeness depending on the
intended use or market. Tomatoes are harvested at the mature green stage if intended for use in curry dishes, at turning, more green than pink or orange peel colour, or at 50 percent ripe stage when intended for nearby markets. The fruit is manually harvested and the harvested fruit placed in bamboo collecting baskets (Figure 30A).
Field level handling – The filled collecting baskets are manually hauled or are loaded in three-wheeled carts and transported to collection centres for sort-ing. Tomatoes are poured onto the ground that has been covered by a canvass underlay. After sorting, tomatoes are bulk packaged in 50 kg red plastic mesh sacks (Figure 30B and C).
Transportation – Bulk packaged tomatoes are transported to wholesale markets in Gazipur and Dhaka, which is about 173 km from Bogra, in the evening. Tomatoes are loaded onto trucks together with other commodities. On arrival at the whole-sale market, tomatoes are distributed to retailers or are purchased by supermarkets and institutional buyers.
Figure 31 shows the traditional supply chain for winter tomato from Bogra to Gazipur wholesale market.
Losses in the traditional supply chainPreharvest losses in winter tomato were esti-mated at about 5 percent because of bird and insect damage and deformation. However, these defects occurred during production and are therefore not considered part of post-harvest loss.
Even with a relatively shorter distance and duration of transport, losses at the wholesale level reached 16.7 percent mainly attributed to mechani-cal damage (Figure 32). The red plastic mesh sacks used for the bulk packaging of tomatoes did not provide adequate protection during transporta-tion. Given their advanced stages of ripeness,
Chapter 6
Case study of winter tomato in Bangladesh

Case studies on managing quality, assuring safety and reducing post-harvest losses in fruit and vegetable [...] 46
FIGURE 30Operations in the traditional winter tomato supply chain: manual harvesting and use of bamboo collecting basket (A); packing in red mesh sacks after sorting (B); and tomatoes packed in 50 kg red plastic mesh sack (C)
©E. Esguerra
A
B
C
FIGURE 31Traditional winter tomatoes supply chain from Bogra to Gazipur
Source: field data.
Harvesting: manual (hand picking)Harvest container: bamboo basket; no liner
SupermarketsSupermarkets Manual Hauling or in cart200 m to 300 m
Loading in truck: mixed loadPackaging: 50 kg red plastic mesh sack
Transportationby truck173 km;good road
CONSUMERS
Wholesale Market
Production Farms(Bogra)
Retail Markets
Collection center/areanear the farm

Chapter 6 – Case study of winter tomato in Bangladesh 47
tomatoes are highly susceptible to mechanical damage during transport. All forms of mechanical damage such as abrasion, bruising, compression and cracks were evident. Abrasion damage was particularly observed on fruits that were in direct contact with the rough red mesh sack. Hence, upon arrival at the wholesale market, tomatoes at the bottom of the pack suffered the greatest degree of damage with some fruits already exhibiting cracks (non-marketable) and severe deformation. Deformed tomatoes were still marketable but at a low price.
At the retail level, deteriorative changes became more apparent with the ripening of the tomatoes. Losses amounted to 29.3 percent because of severe mechanical damage (Figure 32). Tomatoes with cracks were also observed in the retail mar-ket. Moreover, fruit with cracks and punctures developed fungal growth and eventually decayed. Because of the high level of loss at the retail level, the price of tomato was relatively high at BDT 15.00 to BDT 20/kg to compensate for the losses incurred. On the other hand, the farm gate price was low at BDT 5/kg. It is therefore apparent that the farmer and the consumer bear the cost of the losses incurred both by the wholesaler and retailer.
6.2 TECHNICAL INNOVATIONS AND PRACTICES INTRODUCED FOR WINTER TOMATO
Tomatoes produced during the winter season are grown under protected cultivation in raised beds with the use of nets to protect fruits from birds.
Harvesting – Tomatoes were harvested at an advanced stage of maturity for nearby wholesale markets such as Dhaka and Gazipur, that is, they had turned 30 percent pink to half-ripe 50 percent.
Handling – For the improved practice, harvested tomatoes were placed in plastic pails and when half-filled, the harvested fruit was emptied into the plastic field crates (Figure 33A). The plastic crates used for field collection were loaded into three-wheeled carts and taken to the collection centre. Plastic crates were easily stacked on the carts for transportation, while bamboo baskets could not be stacked properly or placed one on top of the other.
At the collection centre, the tomatoes were sorted on the ground, which was covered by a canvas liner under a pitched tent to protect har-vested fruit from exposure to the sun. Rejected
FIGURE 32Major stakeholders in winter tomato supply chain and losses incurred using the traditional practices for handling and marketing
Source: field data.
LOCALMARKET
RETAILERS
WHOLESALER RETAILERFARMER
Institutional Buyer
Tk 5/kg Tk 10/kg Tk 15-20/kg
Loss = 29.3% Loss = 16.7%
Pre-harvest loss: 5.0% Mechanical damage: 16.7% Mechanical damage: 29.3%
Total Loss = 46%
CONSUMERS
COLLECTORTransport Service
Provider

Case studies on managing quality, assuring safety and reducing post-harvest losses in fruit and vegetable [...] 48
FIGURE 33Operations and improved practices in the winter tomato supply chain: harvested tomatoes in plastic pail and in field plastic crates (A); trimming of long stem (B); washing in chlorinate water (C); and bulk packaging in 25 kg plastic crates (D)
©E. Esguerra
tomatoes included those at the green to breaker stage, fully ripe, and those with pre-harvest dam-age such as growth cracks and deformation. The long stems attached to the fruit were trimmed with scissors close to the shoulder keeping the calyx intact (Figure 33B). Tomatoes were then washed in chlorinated water (150 ppm) and air-dried prior to packing (Figure 33C).
Bulk packaging – Sorted tomatoes were bulk packaged in 25 kg capacity stackable plastic crates lined with double layers of newspaper at the bottom and on all sides. Once filled, the crates were covered with two layers of news-paper (Figure 33D). Tomatoes were then trans-ported from the collection centre to the main road for loading on to the truck in the evening.
Crated tomatoes were transported to Konabari vegetable wholesale market in Gazipur in the evening and arrived at the market the following morning. Tomatoes were then distributed to the retailers and supermarket buyers. Operations in the improved winter tomato supply chain are shown in Figure 34 while the traditional and improved operations in the chain are shown in Table 27.
6.3 WINTER TOMATO: ANALYSIS OF RESULTS
Losses at the farm level remained at 5 percent, this was attributed to bird and insect damage and deformation. In view of the fact that these defects were incurred during production they were not considered as post-harvest loss.
TABLE 27Winter tomato: traditional and improved post-harvest operations
Operation Traditional practice Improved practice
Harvesting Bamboo basket as harvesting containerPlastic pail or bucket as harvesting container and plastic crates as field containers
Trimming of stem No trimming Trimming using scissors
Washing No washing Washing in chlorinated water
Packaging 50 kg red plastic mesh sack 25 kg plastic crate
Source: field data.
A
B C
D

Chapter 6 – Case study of winter tomato in Bangladesh 49
The use of plastic crates as field containers and as bulk packaging containers for transport, dramatically reduced the incidence of mechani-cal damage since no damage was observed at the wholesale level translating to 100 percent marketable fruit (Figure 35). This was in contrast to 16.7 percent mechanically damaged tomatoes when red mesh sacks were used as traditional packaging containers.
During the three-day retail period, loss from mechanical damage was only 2.6 percent (Figure 35) for tomatoes transported in plastic crates. Tomatoes that were bulk packaged in plastic crates also suffered mechanical damage in the form of compression. As the incidence of damage was low, the proportion of total marketable tomatoes that were bulk packaged in plastic crates remained high and fetched a comparably higher price (BDT 20/kg) than tomatoes that exhibited slight dam-age (BDT 15/kg). Puncture damage was evident in tomatoes that were not trimmed (traditional practice) but was absent with trimmed fruit. Thus, the improved practice of trimming contributed to the reduction in losses.
Table 28 shows the extent of reduction in losses brought about by improved post-harvest practic-
es. The greatest reduction in losses amounting to 100 percent occurred at the wholesale level where there was no mechanical damage as tomatoes were bulk packaged in plastic crates for transportation. At the retail level, losses were reduced by 91.1 per-cent, which was also attributed to the use of plastic crates. With the traditional practice, total loss was 46.3 percent, this high level of loss was reduced to 2.6 percent in the improved practice.
Shelf-lifeMechanical damage in the forms of abrasion, bruising and compression are stress factors that enhance biological and physical processes such as ripening, senescence, and moisture loss, ultimately leading to decay and reduced shelf-life. This was observed in tomatoes handled using the traditional practice of bulk packaging and transportation using red mesh sacks.
On the other hand, with the use of plastic crates as bulk packaging tomatoes were protected from damage during transportation hence even during the three-day retail period, the proportion of marketable fruits remained high and the shelf-life in retail increased by more than three days. The Sulop tomato variety does not readily soften even
FIGURE 34Improved winter tomato supply chain from Bogra to Gazipur
Source: field data.
Field sorting and packing: 20 kg plastic crateHarvesting: manual hand pickingHarvest container: plastic crate
SupermarketsSupermarkets Manual Hauling or in cart200 m to 300 m
Loading in truck: mixed loadPackaging: 20 kg plastic crateCushioning material: newspaper liningWashing in chlorinated waterTrimming of long stem
Transportationby truck173 km;good road
CONSUMERS
Wholesale Market
Collection center/areanear the farm
Production Farms(Bogra)
Retail Markets

Case studies on managing quality, assuring safety and reducing post-harvest losses in fruit and vegetable [...] 50
at the ripe stage and remains marketable for a comparably longer period as compared to soften-ing varieties.
Wounds such as punctures created by long stems (left on the fruit that eventually dry out and harden) serve as entry points for decay-causing organisms and also as avenues for water loss and eventually deteriorative changes that shorten shelf-life. With trimming, puncturing is avoided and quality maintained, resulting in an extended shelf-life.
Produce safetyThe use of collecting containers such as plastic
pails and plastic crates in the field prevented injury to, which can serve as entry points for spoilage and pathogenic micro-organisms. In contrast, the rough edges and pointed ends of the collecting bamboo baskets tend to injure the fruits resulting in decay.
Plastic crates lined with double layers of news-paper minimize the risk of cross-contamination during transport in mixed loads of commodities, unlike the red plastic mesh sack where tomatoes may easily become contaminated.
FIGURE 35Major stakeholders in the winter tomato supply chain and losses incurred using the improved practices of handling and marketing
Source: field data.
TABLE 28
Winter tomato: losses in the traditional and improved supply chains
Supply chain Losses (%)/Handling practice Reduction in Loss
level Traditional Improved (%)
Farmer (preharvest) (5.0) (5.0) -
Wholesaler 16.7 0 100
Retailer 29.3 2.6 91.1
Total Loss 46.0 2.6 94.3
Source: field data.
LOCALMARKET
RETAILERS
WHOLESALER RETAILERFARMER
Institutional Buyer
Tk 5/kg Tk 10/kg Tk 15-20/kg
Loss = 2.6% Loss = 0%
Pre-harvest loss: 5.0% Mechanical damage: 0% Mechanical damage: 2.6%
Total Loss = 2.6%
CONSUMERS
COLLECTORTransport Service
Provider

Chapter 6 – Case study of winter tomato in Bangladesh 51
Washing in chlorinated water removed or reduced chemical residues on the peel of the fruit and also disinfected the fruit.
Economic benefits from improved practicesAssuming the wholesaler handled 1 000 kg of win-ter tomato per week and the tomatoes were bulk packaged in red mesh sacks, since the Gazipur wholesale market is relatively close to Bogra (about 173 km): On the basis of the results of the pilot demonstration, loss resulting from mechani-cal damage in the form of cracks amounted to 16.7 percent, which is equivalent to 167 kg of non-marketable tomatoes per week. However, with the use of plastic crates for bulk packaging there was no damage and therefore the loss was equivalent to 0 percent.
� Added returns: At a wholesale price of BDT 10/kg of tomatoes, the estimated gross income using red mesh sacks would be:
� 1 000 kg – 167 kg = 833 kg x BDT 10/kg = BDT 8 330.00 per week.
� Using plastic crates, the loss was 0, hence the estimated gross income would be:
� 1 000 – 0 = 1 000 x BDT 10 = BDT 10 000 per week. The additional weekly gross income, as a result of using plastic crates for bulk packaging, (with 100 percent reduction in loss) would amount to: BDT 10 000 – BDT 8 330.00 = BDT 1 670.00.
� Added cost: Use of plastic crates entails a depreciation cost of plastic crates and oppor-tunity cost of capital invested in purchasing plastic crates. Forty plastic crates are needed
TABLE 29Wholesaler: benefits of using plastic crates for bulk packaging and transportation
Item Red mesh sack Plastic crate
Gross returns (Volume sold – loss) x selling price
(1 000 kg – 167 kg) x BDT 10/kg BDT 8 330.00
(1 000 kg – 0 kg) x BDT 10/kg 10 000.00
Costs
Depreciation cost of plastic crate 0 24.62
Opportunity cost of capital 0 23.38
Labour for sorting 250.00 0
Subtotal 250.00 48.00
Gross returns – costs 8 080.00 9 952.00
BDT 8.08 per kg BDT 9.95/kg
Source: field data.
TABLE 30
Retailer: benefits of using plastic crates for bulk packaging and transportation
Item Red mesh sack Plastic crate
Gross returns (Volume sold – loss) x selling price
(1 000 kg – 293 kg) x BDT 20/kg BDT 14 140.00
(1 000 kg – 26 kg) x BDT 20/kg 19 480.00
Costs
Depreciation cost of plastic crate 0 24.62
Opportunity cost of capital 0 23.38
Labour for sorting 250.00 0
Subtotal 250.00 48.00
Gross returns – costs 13 890.00 19 432.00
BDT 13.89/kg BDT 19.43/kg
Source: field data.

Case studies on managing quality, assuring safety and reducing post-harvest losses in fruit and vegetable [...] 52
to pack 1 000 kg of tomatoes; at BDT 320 (US$4) per crate, total cost is BDT 12 800. Plastic crates normally last for 10 years, at 10 percent depreciation per year; depreciation cost is BDT 1 200/year or BDT 24.62 per week (BDT 1 280 per year/52 weeks per year). Salvage value is 0.
With the improved practice of using plastic crates, the wholesaler will have a net return of BDT 9.95 per kg and only BDT 8.08 employing the tradi-tional practice (Table 29).
The retailer on the other hand will receive a higher return than the wholesaler when plastic crates are used. The net return employing the improved practice is BDT 19.43/kg and only 13.89/kg with the traditional practice (Table 30).
6.4 RESPONSE OF STAKEHOLDERS IN THE WINER TOMATO SUPPLY CHAIN
At the outset, although the farmers and collectors realized the benefits of using plastic crates, they were reluctant to use plastic crates during the winter season. According to them, the low farm gate price (BDT 3 to 5/kg) for tomatoes would not offset the cost of the plastic crates, which is about BDT 320/crate. Moreover, according to the collectors, only 10 tonnes of tomatoes could be packed into plastic crates and loaded onto a truck, while with traditional containers such as bamboo baskets and red mesh sacks, up to 13 tonnes could be loaded, resulting in lower transport cost than with the use of crates. When it was explained that the low farm price was because of the poor quality of the fruit and the large quantities of unmarket-able fruit arriving at the wholesale and retail levels because of mechanical damage caused by poor packaging, they began reconsidering the adoption of plastic crates for bulk packaging. Stakeholders reported having seen an increasing use of plastic crates at the wholesale markets, which were an indication of their benefits. Accordingly, they requested FAO’s assistance in providing them with plastic crates for their use.
Regarding the comparably higher transport cost using plastic crates, it was reiterated that sound fruit resulted from improved bulk packaging, which could be sold at a higher price and with 100 per-cent reduction in loss at the wholesale level; the increased income obtained would offset the high transport cost. Moreover, it was also stressed that while the initial investment cost of the plastic crate was high, with proper care and maintenance, it could be used for approximately 10 years.
6.5 WINTER TOMATO: CONCLUSIONS AND RECOMMENDATIONS
The improved practices of using plastic buckets as collecting containers, plastic crates as field and transport containers, trimming of long stems left on the fruit and washing in chlorinated water dra-matically reduced the levels of losses in the supply chain. The greatest reduction occurred during transport, and at the wholesale level when there was no loss. This is in contrast to 16.7 percent loss employing the traditional practice of packing in a red plastic mesh sack.
From the results of the pilot demonstration and the training of stakeholders in the supply chain, the following are recommended:
� HRC-BARI in collaboration with the Depart-ment of Agricultural Extension (DAE) could propose a project nationwide, in different districts, to train stakeholders not only for tomato but also for other commodities where post-harvest losses are high. Other stake-holders such as buyers from institutional markets should be invited to the training so they become aware of post-harvest losses and how losses can be reduced with simple post-harvest practices. Having the private group as participants in the training could serve as a venue for a market linkage.
� HRC-BARI in collaboration with the farm-ers’ association should prepare a proposal for external funding such as from FAO Bangla-desh in post-harvest systems improvement with the establishment of a packing house facility as one of the components.

53
Ahmad, M.S. & Haque, AHMM. 2013. Needs assessment of post-harvest handling and storage for selected vegetable crops in Bangladesh (Unpublished consultant report prepared for AVRDC – The World Vegetable Center).
Esguerra, E.B. 2016. Pilot demonstration and training of stakeholders in the supply chain of winter tomato. 25 January to 5 February 2016. Mission Report. FAO TCP/RAS/3502 – Reduction of post-harvest losses in horticultural chains in SAARC countries.
Esguerra, E.B. 2016. Pilot demonstration and training of stakeholders in the supply chain of mango. 13 to 30 June 2016. Mission Report. FAO TCP/RAS/3502 – Reduction of post-harvest losses in horticultural chains in SAARC countries.
Giri, H. 2015. Loss assessment report of cauliflower. FAO TCP RAS 3502 – Reduction of post-harvest losses in horticultural chains in SAARC countries.
Giri, H. 2016. Stakeholders training and pilot demonstration of improved supply chain management of mandarins in Kavre district, Nepal. 17 to 18 March 2016. Mission Report. FAO TCP/RAS/3502 – Reduction of post-harvest losses in horticultural chains in SAARC countries.
Khatun, M., Karim, M.R, Khandoker, S., Hossain, T.M.B. & Hossain, S. 2014. Post-harvestloss assessment of tomato in some selected areas in Bangladesh. International Journal of Business, Social and
Scientific Research, 1(3): 209-218.
Miah, M.A., Md. S Hoq, Md. Abdul Matin, Saha, M.G. 2016. A baseline survey on mango supply chain in selected areas of Bangladesh. May 2016. FAO TCP/RAS/3502 – Reduction of post-harvest losses in horticultural chains in SAARC countries.
Miah, M.A, Md. S Hoq, Md. Abdul Matin, Saha, M.G. 2016. A baseline survey on winter tomato supply chain in selected areas of Bangladesh. May 2016. FAO TCP/RAS/3502 – Reduction of post-harvest losses in horticultural chains in SAARC countries.
Pandey, S. 2015. Knowledge, attitude and practices survey on post-harvest handling of fresh fruits and vegetables in Nepal: A case study of mandarin and cauliflower. FAO TCP/RAS/3502 – Reduction of post-harvest losses in horticultural chains in SAARC countries.
Pant, K.P. 2015. Market study of fresh fruits and vegetables in Nepal: A case study of mandarin and cauliflower. FAO TCP/RAS/3502 – Reduction of post-harvest losses in horticultural chains in SAARC countries.
Rahman A. 2015. Loss assessment report in mango. FAO TCP/RAS/3502 – Reduction of post-harvest losses in horticultural chains in SAARC countries.
References

Case studies on managing quality, assuring safety and reducing post-harvest losses in fruit and vegetable [...] 54
Rapusas, R.S. & Rolle, R.S. 2009. Management of reusable plastic crates in fresh produce supply chains: A technical guide. Food and Agriculture Organization, Regional Office for Asia and the Pacific.
Rolle, R.S. 2014. FAO TCP/RAS/3502 Reduction of post-harvest losses in horticultural chains in SAARC countries. Project Document. Food and Agriculture Organization, Regional Office for Asia and the Pacific.
Sarananda, K.H. Loss assessment of snap beans. Mission Report. FAO TCP/RAS/3502 – Reduction of post-harvest losses in horticultural chains in SAARC countries.
Sarananda, K.H. Loss assessment of banana. Mission Report. FAO TCP/RAS/3502 – Reduction of post-harvest losses in horticultural chains in SAARC countries.
Serrano, E.P. 2016. Pilot demonstration of improved supply chain management of cauliflower in Dhading district, Nepal. 26 Januaryto 3 February 2016. Mission Report. FAO TCP/RAS/3502 – Reduction of post-harvest losses in horticultural chains in SAARC countries.
Serrano, E.P. 2016. Training of stakeholders and pilot demonstration of improved supply chain management of snap beans in Sri Lanka. 20 June to 1 July 2016. Mission Report. FAO TCP/RAS/3502 – Reduction of post-harvest losses in horticultural chains in SAARC countries.
Serrano, E.P. 2016. Training of stakeholders and pilot demonstration of improved supply chain management of banana in Sri Lanka. 16 to 20 August 2016. Mission Report. FAO TCP/RAS/3502 – Reduction of post-harvest losses in horticultural chains in SAARC countries.


Food and Agriculture Organization of the United Nations (FAO)Viale delle Terme di Caracalla, 00153 Rome, Italywww.fao.org
I8616EN/1/02.18
ISBN 978-92-5-130345-0
9 7 8 9 2 5 1 3 0 3 4 5 0