Embed Size (px)
Citation preview
fnhum-14-569973 October 19, 2020 Time: 19:18 # 1
CLINICAL TRIALpublished: 23 October 2020
doi: 10.3389/fnhum.2020.569973
Edited by:Michael S. Okun,
University of Florida Health,United States
Reviewed by:Sameer A. Sheth,
Baylor College of Medicine,United StatesLudvic Zrinzo,
University College London,United Kingdom
*Correspondence:Sarah T. Olsen
†These authors share seniorauthorship
Specialty section:This article was submitted to
Brain Imaging and Stimulation,a section of the journal
Frontiers in Human Neuroscience
Received: 05 June 2020Accepted: 15 September 2020
Published: 23 October 2020
Citation:Olsen ST, Basu I, Bilge MT,
Kanabar A, Boggess MJ, Rockhill AP,Gosai AK, Hahn E, Peled N, Ennis M,
Shiff I, Fairbank-Haynes K, Salvi JD,Cusin C, Deckersbach T, Williams Z,
Baker JT, Dougherty DD andWidge AS (2020) Case Reportof Dual-Site Neurostimulation
and Chronic Recordingof Cortico-Striatal Circuitry in a PatientWith Treatment Refractory Obsessive
Compulsive Disorder.Front. Hum. Neurosci. 14:569973.doi: 10.3389/fnhum.2020.569973
Case Report of Dual-SiteNeurostimulation and ChronicRecording of Cortico-StriatalCircuitry in a Patient With TreatmentRefractory Obsessive CompulsiveDisorderSarah T. Olsen1* , Ishita Basu2,3, Mustafa Taha Bilge2,3, Anish Kanabar2,3,Matthew J. Boggess2,3, Alexander P. Rockhill2,3, Aishwarya K. Gosai2,3, Emily Hahn2,3,Noam Peled2, Michaela Ennis4, Ilana Shiff4, Katherine Fairbank-Haynes4,Joshua D. Salvi4, Cristina Cusin3, Thilo Deckersbach2,3, Ziv Williams5, Justin T. Baker4,Darin D. Dougherty2,3† and Alik S. Widge1†
1 Department of Psychiatry, Medical School, University of Minnesota Twin Cities, Minneapolis, MN, United States, 2 AthinoulaA. Martinos Center for Biomedical Imaging, Massachusetts General Hospital, Charlestown, MA, United States, 3 Departmentof Psychiatry, Massachusetts General Hospital and Harvard Medical School, Charlestown, MA, United States, 4 McLeanInstitute for Technology in Psychiatry and Harvard Medical School, Belmont, MA, United States, 5 Departmentof Neurosurgery, Massachusetts General Hospital, Boston, MA, United States
Psychiatric disorders are increasingly understood as dysfunctions of hyper- orhypoconnectivity in distributed brain circuits. A prototypical example is obsessivecompulsive disorder (OCD), which has been repeatedly linked to hyper-connectivity ofcortico-striatal-thalamo-cortical (CSTC) loops. Deep brain stimulation (DBS) and lesionsof CSTC structures have shown promise for treating both OCD and related disordersinvolving over-expression of automatic/habitual behaviors. Physiologically, we proposethat this CSTC hyper-connectivity may be reflected in high synchrony of neural firingbetween loop structures, which could be measured as coherent oscillations in the localfield potential (LFP). Here we report the results from the pilot patient in an Early Feasibilitystudy (https://clinicaltrials.gov/ct2/show/NCT03184454) in which we use the MedtronicActiva PC+ S device to simultaneously record and stimulate in the supplementarymotor area (SMA) and ventral capsule/ventral striatum (VC/VS). We hypothesized thatfrequency-mismatched stimulation should disrupt coherence and reduce compulsivesymptoms. The patient reported subjective improvement in OCD symptoms andshowed evidence of improved cognitive control with the addition of cortical stimulation,but these changes were not reflected in primary rating scales specific to OCD anddepression, or during blinded cortical stimulation. This subjective improvement was
Frontiers in Human Neuroscience | www.frontiersin.org 1 October 2020 | Volume 14 | Article 569973
fnhum-14-569973 October 19, 2020 Time: 19:18 # 2
Olsen et al. Targeted Network Disruption in OCD
correlated with increased SMA and VC/VS coherence in the alpha, beta, and gammabands, signals which persisted after correcting for stimulation artifacts. We discussthe implications of this research, and propose future directions for research in networkmodulation in OCD and more broadly across psychiatric disorders.
Keywords: neurostimulation, cortico-striatal circuitry, obsessive compulsive disorder, ventral capsule/ventralstriatum, supplementary motor area, neural oscillations, synchrony, local field potential
INTRODUCTION
Obsessive compulsive disorder (OCD) is a chronic and severepsychiatric condition characterized by recurrent and intrusivethoughts, images, or fears which produce marked distress oranxiety (obsessions), and the performance of repetitive mentalor physical rituals in response to that anxiety (compulsions).Individuals with OCD experience frequent and significantsocial impairments (Koran et al., 1996). Roughly 40% ofindividuals living with OCD report being unable to work(Mancebo et al., 2008). Standard treatments include exposureand response prevention therapy (ERP; e.g., Foa et al., 2005),and pharmacological interventions (e.g., Fineberg and Gale,2005). Unfortunately, 30–60% of individuals will fail to respondadequately to treatment. Even those who do respond to treatmentare often left with some level of residual symptoms (Pallanti et al.,2002; Foa et al., 2005; Dougherty et al., 2018).
For those treatment refractory individuals, neurostimulation,and in particular deep brain stimulation (DBS), is an option.Current neurostimulation therapies arose from the success ofpsychiatric neurosurgery procedures in which areas of theinternal capsule were lesioned, with modern versions of thosesurgeries having open-label response rates as high as 80% (Brownet al., 2016; Dougherty et al., 2018; Rasmussen et al., 2018; Spatolaet al., 2018). Given the irreversible nature of lesion surgeries,neurostimulation was proposed as a reversible option, which hasgreater customizability than the one-size-fits-all lesion surgeries(Nuttin et al., 1999). Early approaches in the internal capsuleevolved into the current ventral capsule/ventral striatum target(VC/VS; Greenberg et al., 2010; Karas et al., 2019; for reportsusing different names for a similar target see: Luyten et al.,2016; Raymaekers et al., 2017). The VC/VS target is located ata putative junction of the anterior commissure, internal capsule,and striatum (Greenberg et al., 2010). Positive outcomes seenin early open label studies (Greenberg et al., 2010) led theVC/VS target to receive Humanitarian Device Exemption (HDE)approval for OCD in 2009 (approval H050003).
Response and symptom improvement rates with VC/VSDBS are promising, but there is much room for improvement.Reported (Luyten et al., 2016) and non-reported (NCT00640133)randomized controlled trials, as well as open-label trials(Menchón et al., 2019) have shown response rates of around67% (response is considered a 35% drop in Yale-Brown ObsessiveCompulsive Scale – YBOCS). This means that over 30% ofindividuals did not respond. These studies also found medianimprovement in YBOCS of 40–60 percent, with a median score of20 with active stimulation. Critically, a YBOCS of 20 represents alevel of symptom severity that often prevents the individual from
working (Mancebo et al., 2008). In a qualitative survey of patientperspectives on VC/VS DBS, the majority of patients (86%)cited incomplete or unreliable symptom relief as their primarydissatisfaction with VC/VS DBS (Klein et al., 2016). Therefore,there is a need to advance neurostimulation to produce a moreconsistent response, and a higher level of effectiveness.
Improving Neurostimulation for OCD:Potential for Targeted NetworkDisruption Through Dual-Site StimulationObsessive compulsive disorder is thought to be a networkdisorder. There is some consensus that dysfunction of the cortico-striatal-thalamo-cortical loops (CSTC loops; e.g., Alexander et al.,1986; Parent and Hazrati, 1995), of which VC/VS (and thestriatum, more generally) is a hub (Alexander et al., 1986; Obesoet al., 2008; Krack et al., 2010; Lapidus et al., 2013; Doughertyet al., 2018), is involved in the etiology of OCD (see Doughertyet al., 2018; Robbins et al., 2019 for reviews). Structures outsidethese loops (e.g., amygdala) also likely play key roles in OCDin at least some patients (Milad and Rauch, 2012; Gürsel et al.,2018; Hazari et al., 2019; Robbins et al., 2019). That said, CSTCloop dysfunction almost certainly plays at least a partial role inOCD. Further, individuals with OCD show deficits in cognitivedomains (e.g., cognitive flexibility; Robbins et al., 2012; Shin et al.,2014; Voon et al., 2015; Vaghi et al., 2017) that are thought toinvolve CSTC loop function (Haber, 2003; Robbins et al., 2012,2019; Vaghi et al., 2017).
The dominant narrative of CSTC dysfunction in OCDemphasizes CSTC hyper-connectivity (e.g., Dougherty et al.,2018; Calzà et al., 2019). There are many functional neuroimagingstudies showing heightened connectivity between regions withinCSTC loops (Graybiel and Rauch, 2000; Maia et al., 2008; Miladand Rauch, 2012; Brennan and Rauch, 2017; Dougherty et al.,2018). These have been considered to be further supportedby robust results showing striatal hyper-activations in OCD(Robbins et al., 2019), but it is important to recognize that activityand connectivity are entirely separate constructs. A given regionmay have radically disrupted connectivity without any change inits overall level of activity. In that vein, some studies have linkedOCD pathology to hypo- rather than hyper-connectivity withinCSTC loop components (Göttlich et al., 2014; Posner et al., 2014;Vaghi et al., 2017). A recent meta-analysis concluded that there isevidence of general aberrant activity in CSTC loops, but that thatdisconnectivity was not in any specific direction- hypo or hyper(Gürsel et al., 2018). Hyper- versus hypoconnectivity seems tobe, in part, a function of which functionally distinct CSTC loopthe regions are in Harrison et al. (2009); Göttlich et al. (2014),
Frontiers in Human Neuroscience | www.frontiersin.org 2 October 2020 | Volume 14 | Article 569973
fnhum-14-569973 October 19, 2020 Time: 19:18 # 3
Olsen et al. Targeted Network Disruption in OCD
Posner et al. (2014), and Vaghi et al. (2017), as well as the specificsof the experiment and patient population (Göttlich et al., 2014;Robbins et al., 2019). Despite differences, one common threadthrough the literature is the presence of a complex pattern ofaberrant brain network communication in individuals with OCD.VC/VS DBS is believed to alter this pathological CSTC circuitfunction. For example, it alters cerebral glucose use in individualswith OCD (Rauch et al., 2006; Dougherty et al., 2016), and thosealterations correlate with depressive (but not OCD) symptoms(Dougherty et al., 2016). Other groups have reported changes incortico-striatal connectivity on functional MRI (Figee et al., 2013)or improvement in CSTC-related cognitive function after VC/VSDBS (Widge et al., 2019).
Thus, it may be possible to make VC/VS DBS more effectiveby identifying ways of more strongly disrupting targeted CSTCloops. Physiologically, this may mean disruption of abnormaloscillatory synchrony in the local field potential (LFP). LFPoscillations are argued to underlie many processes, includingworking memory, and even cognition in general (e.g., Milleret al., 2018). Oscillatory activity can be synchronous, or coherent,between brain regions, and this synchrony has been proposed tobe a primary means by which regions in a circuit communicate(Fries, 2005, 2015). If this model holds and oscillatory synchronyis an index of communication between brain regions, then theremay be CSTC hypersynchrony in individuals with OCD. Hightheta and beta subthalamic nucleus (STN) to cortical coherencehas been reported in an individual with OCD (Wojtecki et al.,2017; using cortical MEG), but the synchrony theory has notbeen investigated within CSTC circuitry. In this way, establishingwhether CSTC hypersynchrony exists in OCD may be a criticalnext step in understanding the disorder, improving treatments,and identifying useful biomarkers.
Similarly, disruption of oscillatory synchrony may be amechanism of clinical DBS (Widge and Miller, 2019). Forinstance, in Parkinson’s disease, there is increased beta bandactivity in the STN, that beta power decreases with active DBS(Wingeier et al., 2006; Bronte-Stewart et al., 2009), and thisdecrease is in turn correlated with symptom improvement (Kühnet al., 2006, 2008; Ray et al., 2008). DBS in Parkinson’s specificallyalters network-level LFP synchrony. For example, De Hemptinneet al. (2015) found a reduction in phase-amplitude coupling in thecortex with STN DBS in Parkinson’s patients, while Oswal et al.(2016) reported a reduction in cortico-STN coherence. In animalmodels, optogenetic neurostimulation increased oscillatorysynchrony between brain regions, which was in turn causallylinked to both changes in behavior and neurotransmission(Padilla-Coreano et al., 2019). To the degree that CSTC hyper-connectivity is reflected in hyper-synchrony, new stimulationmethods to disrupt that synchrony may significantly improve theeffectiveness of DBS (Widge and Miller, 2019).
Therefore, we proposed that delivering frequency mismatchedstimulation to multiple areas within a CSTC circuit woulddisrupt OCD-related hypersynchrony/hyperconnectivity moreeffectively than single site simulation. Stimulation resets thephase of neural oscillations (e.g., Rosanova et al., 2018).Stimulating two regions at mismatched frequencies should thusdisrupt synchrony, by preventing the phase of the oscillations
in the two regions from aligning. The supplementary motorarea (SMA) is a particularly promising second target for thismismatched stimulation. While traditionally associated with themotor CSTC loop (e.g., Nakano et al., 2000; Obeso et al.,2008), the SMA (and medial prefrontal cortex, more generally)also participates in decision-making linked to limbic/associativeCSTC loops (Milad and Rauch, 2012; Dougherty et al., 2018).Further, transcranial magnetic stimulation (TMS) of the SMAis an effective treatment for individuals with severe OCD(Mantovani et al., 2010; Gomes et al., 2012; Carmi et al.,2018, 2019), implicating this area in the neuropathology ofthe disorder. Given the CSTC hyperconnectivity hypothesis,we hypothesized that OCD symptoms would be reflected inheightened coherence between these two regions. Further, wehypothesized that mismatched stimulation would break thishyper-coherence between VC/VS and SMA.
Here, we report the first patient in an early feasibility study1
combining VC/VS DBS with frequency mismatched stimulationof SMA in an effort to disrupt CSTC synchrony in treatmentrefractory OCD. The patient first received open-label VC/VS onlystimulation, followed by a blinded phase of combined corticaland VC/VS stimulation, and finally an open-label combinedstimulation phase. During the course of the study, daily LFPrecordings from VC/VS and SMA were taken, allowing for thefirst known chronic recording of a cortico-striatal circuit inhuman. Using these recordings, we tested the hypersynchronyhypothesis, as well as the hypothesis that frequency mismatchedstimulation could disrupt that hypersynchrony. These resultsare an important proof-of-principle toward understanding themechanism of action for OCD neurostimulation, identifyingbiomarkers, and improving treatment.
Patient History: Diagnoses, Symptoms,and Previous TreatmentThe patient was a male in his 20s, who had previously receivedVC/VS DBS for treatment refractory OCD. Prior to the initialDBS surgery, the patient’s YBOCS was 29. He reported onsetof OCD symptoms at approximately age 12–13, primarily of amental ritualizing/obsessional type. Obsessions have included hissymptoms themselves, counting, and symmetries. The patienthad a past history of object-touching/rearranging compulsions,but at the time of his first course of DBS, he reported onlymental rituals. Further, his OCD symptoms had sometimesbeen body-focused in ways that raised questions of bodydysmorphic disorder (BDD).
Prior to beginning the first course of DBS, the patientwas also diagnosed with treatment-resistant depression, witha baseline Montgomery-Åsberg Depression Rating Scale(MADRS) of 36. He reported substantial low mood andanhedonia, for the prior several years, combined with substantialanxiety. Symptoms also included difficulty concentratingwhen not using stimulants, low energy, some psychomotorslowing, and profound emotional numbing. The patientdenied frank suicidality but had frequent thoughts/wishesof being dead. He had also previously carried the diagnosis
1https://clinicaltrials.gov/ct2/show/NCT03184454
Frontiers in Human Neuroscience | www.frontiersin.org 3 October 2020 | Volume 14 | Article 569973

fnhum-14-569973 October 19, 2020 Time: 19:18 # 4
Olsen et al. Targeted Network Disruption in OCD
of bipolar disorder, with past clinicians stating there werebrief periods of hypomania. However, clinicians at thetime of his first DBS surgery felt that symptoms previouslylabeled as hypomania were more correctly attributable toOCD/anxiety related racing thoughts. There were no identifiabledistinct episodes of impulsivity, goal-directed activity, ordecreased need for sleep.
The patient had been receiving weekly or biweekly cognitivebehavioral therapy (CBT) and exposure with response prevention(ERP) for five years prior to the onset of his first course of DBS,conducted in a private practice. At the time of surgery, the patientcontinued that therapy with the same clinician, and was able todisplay numerous mindfulness and distress tolerance techniques.
The patient had also tried numerous serotonergic anddopaminergic medications: Paroxetine (four weeks), citalopram(2 weeks), mirtazapine (unknown time frame), fluoxetine(several weeks), lorazepam (unknown time frame), clomipramine(unknown time frame) were all trialed and discontinued dueto intolerability of side effects. At the time of surgery thepatient’s medications included: Fluvoxamine (400 mg), lithium(900 mg), amphetamine salt (20 mg), levomefolic acid (22.5 mg),lamotrigine (300 mg), olanzapine (27.5 mg) and levothyroxine(150 mcg). Additionally, the patient had undergone a courseof rTMS for depression that he had not found helpful. At thetime of his first DBS surgery, the patient had been undergoingbi-weekly maintenance electroconvulsive therapy (ECT) fordepression, and had received around 50 sessions over thecourse of 2 years. The patient had found ECT to give him aslight mood lift. Despite these treatments, the patient continuedto experience significant functional impairment, unable toattend community college, maintain significant employment, orlive independently.
Roughly 3 years prior to enrollment in the presentstudy the patient began his first course of bilateral VC/VSDBS treatment for OCD and depression. He showed initialimprovement reaching his lowest YBOCS, 14, about 6 monthsafter implantation. The patient’s MADRS dropped significantlyas well, with his lowest score of 18 recorded over 2 yearsafter surgery. However, this improvement was not sustained.Generally, his YBOCS was in the mid-to-high 20 s, and hisMADRS in the high 20 s, to low 30 s. By the time of enrollmentin the present study, his YBOCS and MADRS were backto baseline levels (27 and 37, respectively). Given that thepatient was still experiencing significant functional impairment,a multidisciplinary review committee (Widge and Dougherty,2015) felt that the patient met criteria for inclusion in thepresent study (full criteria are at https://clinicaltrials.gov/ct2/show/NCT03184454).
MATERIALS AND METHODS
All study procedures described below were reviewed andapproved by the Institutional Review Board at MassachusettsGeneral Hospital. The study was conducted under anInvestigational Device Exemption from the US Food & DrugAdministration (FDA).
Surgery and Electrode PlacementThe patient was implanted with bilateral electrodes targetingthe VC/VS and SMA. VC/VS electrodes were implanted first,followed by SMA electrodes through the same burr hole. ForVC/VS, the patient’s previously implanted leads (Medtronicmodel 3387 lead) were first removed, as we sought to uselarger contacts to more efficiently activate capsular white matterand reach fibers running in the dorsal capsule. Using standardstereotactic surgery procedures, and coregistration of MRIand CT images, Medtronic model 3391 leads were implantedbilaterally targeting VC/VS. We sought to place contact 0 withinthe gray matter of the ventral striatum, 2 mm anterior to theposterior border of the anterior commissure. The lead trajectorywas aligned with the internal capsule, so that contact 3 would bein the capsular white matter immediately adjacent to the caudatenucleus. Before securing the lead, we tested bipolar stimulationat up to 6 V (130 Hz, 150 µs pulse width) between all pairsof contacts, without adverse effects. There was no intraoperativehedonic or mirthful response.
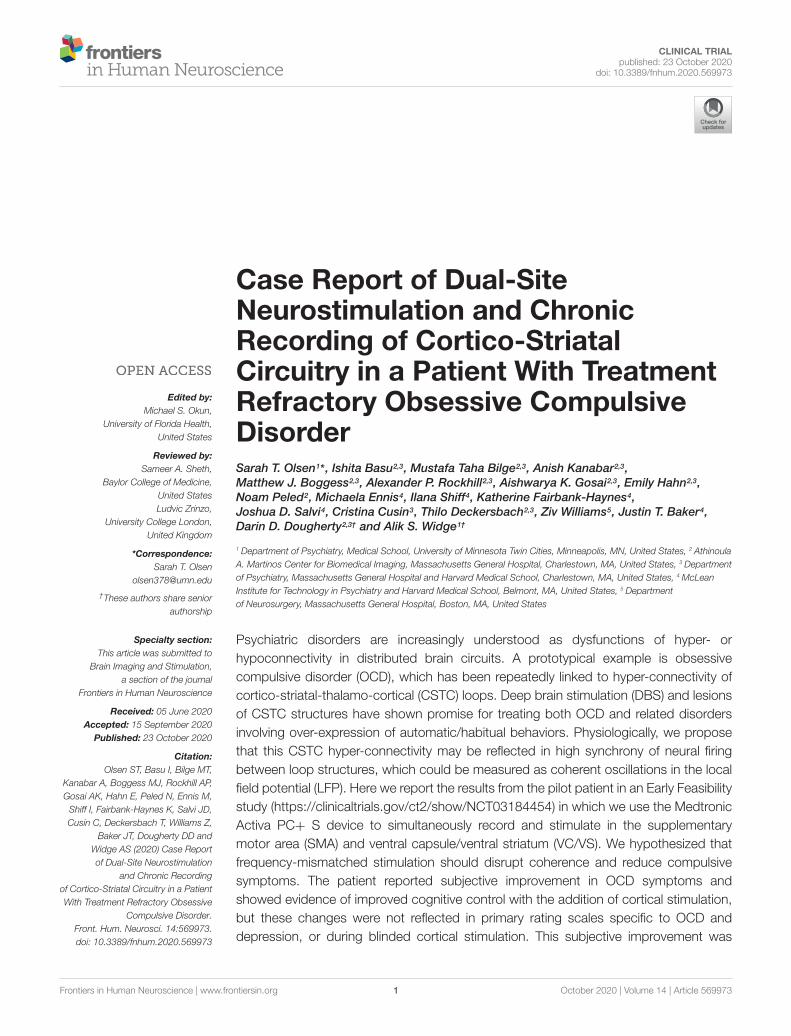
Cortical paddles (Medtronic model 3986, Resume 4-contactpaddle lead) were placed under direct visualization through theburr holes used to place the VC/VS electrodes. The surgeon (ZW)retracted the underlying cortex inferiorly and placed the paddleson the dorsal surface of the superior frontal gyrus (SFG). Inthis first patient, cortical lead placement was purely empirical,targeting the SFG just anterior to the motor strip, guided by thecortical landmarks visible to the surgeon. As with the deep leads,we performed test stimulations (50 and 130 Hz, 150 µs) at up to4V through the cortical electrode to verify lack of adverse events.Before securing the electrodes, we recorded local field potentials(LFP) from both the deep and surface leads in each hemispherethrough the intraoperative monitoring system (NeuroOmega,Alpha-Omega Systems, Nazareth, Israel; see Data Collectionsection below for more details). DBS and paddle electrodes werethen secured using sutures on the dural edge, and burr holeswere sealed with cranioplasty material. Final lead placement wasconfirmed by intraoperative x-ray, and post-operative CT scan.See Figure 1 for final lead locations.
In a subsequent surgery on the following day, twoinfraclavicular pulse generators (IPG; Medtronic ActivaPC + S) were implanted bilaterally in the patient’s chest. ThePC + S system was selected for it’s sensing/recording capabilities(discussed below). Given that the IPGs were only able to deliverpulses at one frequency to leads attached to the same device, thetwo VC/VS electrodes were attached to one device, and corticalelectrodes were attached to the second device.
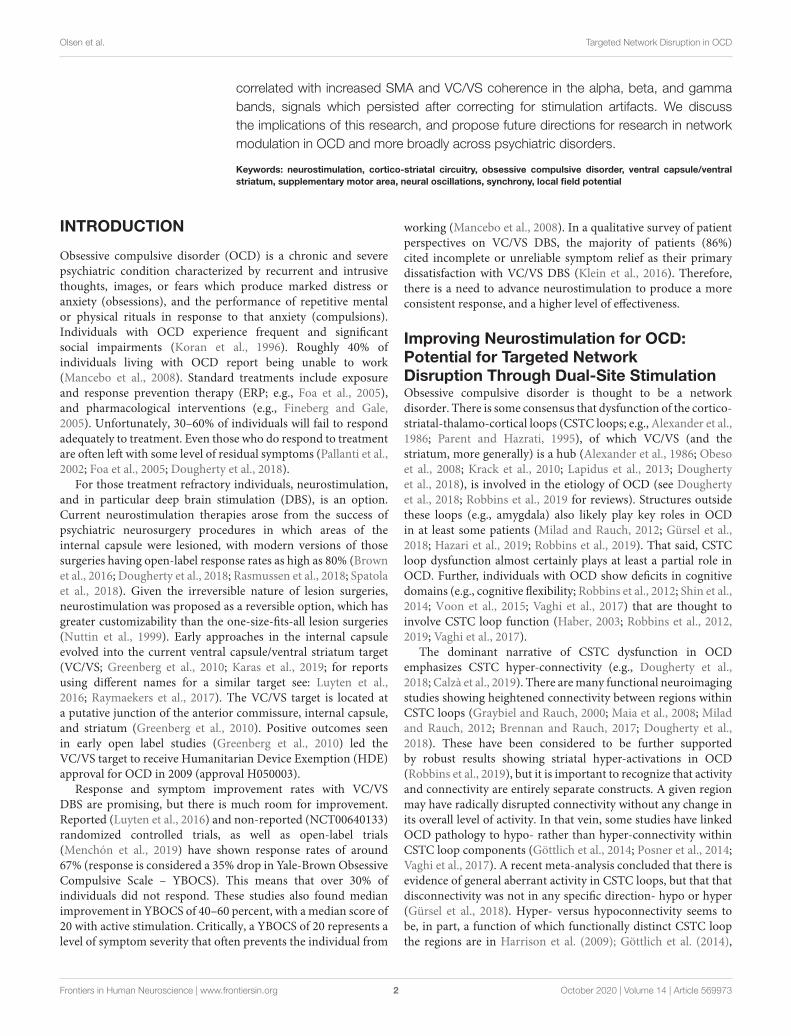
Study Phases and StimulationParametersOver the course of almost 2 years, the patient progressed throughseveral phases of a single-blind randomized cross-over study(see Figure 2 for timing of each study phase). In the VC/VSoptimization phase (study days 0 to 172, as measured by thedays since operation), he only received VC/VS stimulation. Weidentified the initial most effective contact and titrated VC/VSstimulation voltage according to the algorithm in Widge and
Frontiers in Human Neuroscience | www.frontiersin.org 4 October 2020 | Volume 14 | Article 569973
fnhum-14-569973 October 19, 2020 Time: 19:18 # 5
Olsen et al. Targeted Network Disruption in OCD
FIGURE 1 | Images of the DBS and paddle leads rendered with the Multi-Modality Visualization Tool (Felsenstein and Peled, 2017; Felsenstein et al., 2019). Positionof left (red) and right (blue) SMA leads, and left (green) and right (yellow) VC/VS leads. Brodmann Area 6 is colored in turquoise. (A) coronal slice showing position ofVC/VS leads (subcortical regions not colored). (B) Angled view with cortical coronal slice. Caudate nucleus colored in green, nucleus accumbens (Nacc) in blue, andputamen in pink. (C) Superior view (left on top) showing cortical lead positions. Note: the right VC/VS lead is in the caudate nucleus and NAcc whereas the leftVC/VS lead is more laterally placed in the putamen. No adverse effects of lead placement were observed with the patient.
FIGURE 2 | Figure depicts the timeline of study phases, changes in stimulation or recording parameters, and collection of clinical measures and LFP recordings. Thex-axis values are days since the operation, and the ticks/labels denote days of clinical programming sessions. Note that there was no chronic cortical stimulationuntil day 235.
Dougherty (2015). This also served as a baseline period inwhich cortical-striatal synchrony was measured in the absenceof combined, mismatched stimulation. The original protocolcalled for a 2-week baseline phase after IPG implant, andpreceding the VC/VS optimization phase, in which the patternof LFP oscillations in the absence of stimulation could beestablished. However, on the day after the IPG was implanted,while recovering in the hospital, the patient reported depressionand suicidality. He stated that this was due to withdrawal ofhis prior DBS therapy, that he was certain it would not betolerable, and that he could not maintain his personal safetyfor any period of time. Consistent with the study protocol’sdirectives that suicidality was a reason to escape a patient fromany given phase/procedure, his VC/VS leads were thus activated
early. Thereafter, the patient declined to permit deactivation ofVC/VS stimulation, even if only for a few moments, makingstimulation-off recordings impossible to obtain.
In the blinded cortical crossover phase (days 172–270)the patient had biweekly clinical visits with the unblindedprogrammer (DDD). During one of these sessions (day 235),cortical stimulation was activated, unknown to the patient orto the researchers obtaining rating scales. At the onset of thisphase (day 172), we performed an acute cortical optimizationin which we identified cortical stimulation parameters. Duringthe cortical optimization, the VC/VS electrodes remained on,using the same contact as previously programmed for clinicaltherapy, but set to a frequency of 135, 55, or 15 Hz. For each ofthose VC/VS frequencies, we programmed the ipsilateral cortical
Frontiers in Human Neuroscience | www.frontiersin.org 5 October 2020 | Volume 14 | Article 569973

fnhum-14-569973 October 19, 2020 Time: 19:18 # 6
Olsen et al. Targeted Network Disruption in OCD
stimulation to a corresponding (slightly mismatched) frequencyof 130, 50, or 10 Hz, respectively. The 5 Hz difference betweenfrequencies was selected because this was the only spacing thatcould be achieved consistently at all three frequency bands giventhe limits of the pulse generator (at higher frequencies, only stepsof 5 Hz were possible).
We then tested each contact of the cortical electrode, ina monopolar configuration, at 2, 4, and (if tolerated) 6 V.At each setting, the patient rated the change in his mood,anxiety, and overall energy level on a 1–10 scale. The settingsproducing the best clinical effect were retained, but the corticalelectrodes/IPG remained inactive until the actual crossoverat day 235. During the cortical optimization procedure, noevidence of seizure activity was detected by clinicians. Thisis unsurprising, as chronic epicortical stimulation has beentrialed in psychiatric patients in multiple studies withoutepileptic complications (Kopell et al., 2011; Williams et al.,2016). In the open label, unblinded cortical phase (days 270–606) the blind was broken on the cortical stimulation whilethe patient continued to receive combined stimulation. Thefull course of the study ranged from day 0, or the day ofsurgery, to day 606, at which point the battery for the VC/VSIPG reached the cut-off for minimum battery life required totake recordings.
VC/VS stimulation parameters can be seen in Figure 2. Thepatient received constant unipolar stimulation at contact 0(left hemisphere) and contact 2 (right hemisphere). VC/VSstimulation frequency was 135 Hz. VC/VS stimulationpulsewidth was 150 and 90 µs for left and right hemispheres,respectively. VC/VS stimulation voltage was gradually increasedto 2.5 and 4.5 V for left and right hemispheres, respectively,during the VC/VS optimization phase.
Cortical stimulation parameters can be seen in Figure 2.From day 235 until day 403, the patient received constantunipolar stimulation at contact 1 (left hemisphere) and contact2 (right hemisphere) of the cortical paddles. Cortical stimulationfrequency was 130 Hz during the blinded cortical phase, untilapproximately 2 weeks after the patient was unblinded (fromday 235 to 291). Due to patient complaints of what he describedas “overstimulation,” the stimulation frequency was reduced to100 Hz at day 291, where it remained for the remainder ofthe study. Complaints of “overstimulation” also resulted in thepatient beginning day-night cycling of his cortical stimulation(turning it off at night) at day 403. See section “Clinical outcomeswith deep brain and combined stimulation” for a more detaileddescription of the patient’s feelings of overstimulation. Corticalstimulation pulsewidth was 90 µs. Voltage ranged from 4 to5.1 V for the left hemisphere, and from 2 to 3.1 V for theleft hemisphere, limited in both cases by anxious distress athigher voltages.
Impedances were measured during clinical visits, and werewithin normal ranges. Mean (SD) impedance was 777.46 (18.54)� for the left VC/VS lead, 761.12 (42.89) � for right VC/VS,757.64 (22.25) � for left cortical, and 1144.46 (79.22) � for theleft cortical lead. There were no dramatic shifts in impedancethroughout the study, and changes in impedance did notcorrespond to changes in power spectra.
Data CollectionClinical Outcome MeasuresClinical sessions occurred approximately every 2 weeks (seeFigure 2). Stimulation settings were adjusted only duringthese sessions. The primary outcome variable was the YBOCS(Goodman et al., 1989). Key secondary outcomes were MADRS(Montgomery and Åsberg, 1979) and patient global impression ofimprovement (PGI-I; Yalcin and Bump, 2003). All were collectedduring the biweekly clinical sessions.
Ecological Momentary Assessment (EMA)Midway through the present study, the patient enrolled in aseparate study. The purpose of that study was to use data fromthe patient’s smartphone to obtain a more continuous measureof functioning than the sporadic clinical ratings. Among othermeasures, this study collected ecological momentary assessments(EMAs; Shiffman et al., 2008). Data collection for the EMA studybegan 151 days following surgery, with the first EMA collected235 days following surgery. The EMA contained eight questionsregarding the patient’s motivation and ability to perform tasks(e.g., “In the past 24 h; it was difficult for me to get anything done,”or “It was difficult for me to complete my morning routine”).These prompts were derived from the patient’s report of hisprimary symptoms. Questions were scored on a scale from 0to 4, with 0 indicating the highest level of functioning (e.g.,“extremely easy”) and 4 indicating the lowest level of functioning(e.g., “extremely difficult”). The scores for the eight questionswere averaged to create a summary EMA score. The patient wasprompted to take the EMA at least once a day but could choosenot to participate.
Multi-Source Interference Task (MSIT)During several clinical sessions (on days 13, 104, 216, 335,and 448, see Figure 2) the patient performed the Multi-SourceInterference Task (MSIT; Bush et al., 2003; Bush and Shin,2006). Considered to measure cognitive control, the MSITproduces robust subject-level behavioral and neural effects (Bushet al., 2003, preprint; Bush and Shin, 2006; González-Villar andCarrillo-de-la-Peña, 2017; Widge et al., 2019), which can bemodulated through DBS of CSTC circuitry (Basu et al., preprint;Widge et al., 2019).
During an MSIT trial three numbers (between 0 and 3)were presented on the screen. Two of these numbers had thesame value, and the other was different (e.g., 020 or 233). Thepatient’s task was to identify, via button press, the identity ofthe number that was unique, not its position. Trials were eithercongruent or incongruent. In congruent trials (e.g., 020), theunique number was in the same position as it’s correspondingkeyboard position, and the other numbers were always ‘0’, whichwas never a valid response. In incongruent trials (e.g., 233) theunique number was in a different position than its correspondingposition, and the non-unique numbers were always one of theother valid responses, such that incongruent trials containedmultiple types of interference (position and response). Congruentand incongruent trials were presented together in a pseudo-randomized fashion, such that no more than two trials in a rowever shared the same condition or correct response finger. The
Frontiers in Human Neuroscience | www.frontiersin.org 6 October 2020 | Volume 14 | Article 569973

fnhum-14-569973 October 19, 2020 Time: 19:18 # 7
Olsen et al. Targeted Network Disruption in OCD
patient performed 8 blocks of 48 trials each, for a total of 384 trialsper run of the MSIT. The task was run using the PsychophysicsToolbox (Kleiner et al., 2007).
We analyzed MSIT response time (RT), as task accuracy is veryhigh, and previous effects of DBS on MSIT performance havebeen shown in response time data. We grouped MSIT runs basedon the stimulation phase/condition: VC/VS only stimulation withnon-optimized settings (non-optimized VC/VS), VC/VS onlystimulation after settings had been optimized (optimized VC/VS),and combined VC/VS and cortical stimulation (combined). Notethat we only have MSIT runs during 100 Hz cortical stimulation.Trials were removed from analysis based on the criteria usedin Widge et al. (2019). Namely, error and post-error (i.e., trialsfollowing an incorrect response) trials, as well as trials with RTswith a likelihood of less than 0.005 based on a fitted gammadistribution. We excluded 130 trials (0.07% of total trials), leaving1790 trials in the analysis. Following Widge et al. (2019), weanalyzed trial-wise RT in a generalized linear model (GLM) usinga gamma distribution and identity link function, with conflict(congruent and incongruent) and stimulation condition (non-optimized VC/VS, optimized VC/VS, and combined) conditionas the fixed effects. Collinearity between day since operation andstimulation condition was high. Further, adding day to the modelcontaining conflict condition and stimulation condition (i.e.,adding day to RT ∼ conflict condition + stimulation condition)did not add significant explanatory power (F = 2.32, p = 0.13),whereas doing the same for stimulation condition (i.e., addingstimulation condition to RT ∼ conflict condition + day sinceoperation) did add significant explanatory power (F = 24.23,p < 0.0001). For these reasons we opted not to include day sinceoperation in the reported model.
Conflict adaptation, or Gratton effect (Gratton et al., 1992),has been shown to be modulated by CSTC connected regions(Sheth et al., 2012). The patient failed to show the typical effect(slower RT when switching from a low conflict to a high conflictcondition versus no switch), and therefore we did not examinechanges in this effect across treatment.
Intraoperative Local Field Potential (LFP) RecordingsAs stated previously, the high resolution intraoperativemonitoring system (NeuroOmega, Alpha-Omega Systems,Nazareth, Israel) was used to record LFPs intraoperatively, afterthe electrodes had been implanted. We recorded simultaneouslyfrom all cortical and striatal contacts, with separate recordings forthe left and right hemispheres. Two recordings per hemispherewere taken. Each recording was 2.25–2.5 min, with a samplingrate of 1000 Hz. LFP recordings were referenced against a needleelectrode in the scalp.
Daily Local Field Potential (LFP) RecordingsDaily timer triggered recordings were taken by the corticaland VC/VS Activa PC + S devices throughout the courseof the study. Recordings were taken every 6 h, yielding fourrecordings per day. Recordings were from a pair of contacts(bipolar montage) not used for stimulation. Recordings were1 min long, at a sampling rate of 200 Hz (see Figure 2 forother recording parameters). Recordings were downloaded at
least every 2 weeks. Note on Figure 2 that there are brief periodsduring the course of the study with missing LFP data, the largestof which occurred when the patient took an extended vacation.Given the potential for drift, the internal clocks of the cortical andVC/VS IPGs were re-synchronized with the programming deviceat each data download.
Saline Bath Testing and Artifact SubtractionThe recording/sensing capabilities of the Activa PC + S systemhave been utilized in preclinical (e.g., Connolly et al., 2015) andclinical (e.g., Swann et al., 2017; Huang et al., 2019; Veerakumaret al., 2019) studies. However, while the sensing capabilities inthe PC + S system were designed to minimize the influenceof stimulation artifacts, small artifacts remain (Stanslaski et al.,2012). Additionally, these original tests focused on measuringLFPs in the spectral domain; Stanslaski et al. (2012) state thatresults do not transfer easily to time domain, making phase-related analyses less reliable. For example, Swann et al. (2017)found broadband stimulation artifacts, as well as narrow bandartifacts (with stimulation off) that were influenced by thesampling rate of recordings. Stimulation artifacts have causedsome recent PC + S studies to analyze only stimulation-offrecordings (e.g., Huang et al., 2019; Veerakumar et al., 2019).
Given that the recording and artifact removal capabilities ofthe PC + S device were not designed for our configuration (twoIPGs delivering different frequency stimulation at the same time;Stanslaski et al., 2012), we specifically characterized the artifactsin our configuration in the absence of brain signal. We testedthe recording and stimulation setting configurations used in theexperiment in a saline preparation. We rejected the resultingartifact from the patient recordings (see LFP preprocessing andanalysis below).
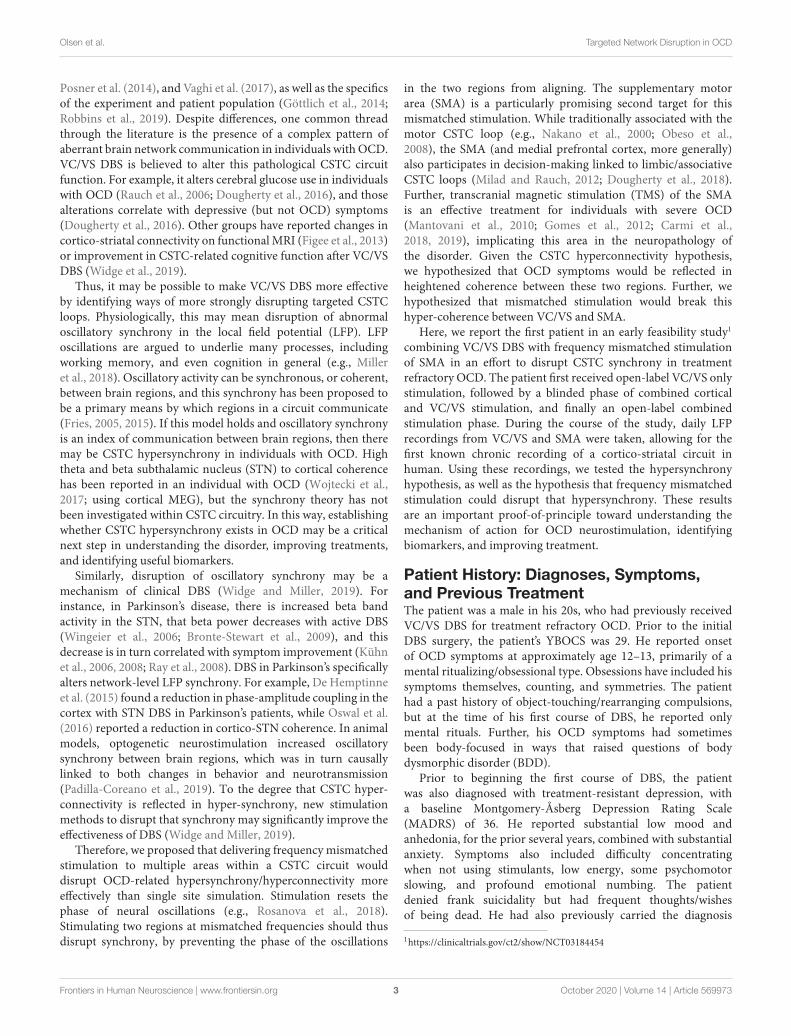
Saline testing used two Activa PC+ S IPGs, with one electrodeper IPG (Medtronic model 3387 and 3391). Settings were testedby taking simultaneous recordings, with the recording andstimulation settings used for the patient’s VC/VS leads in oneIPG, and the settings used for the patient’s cortical leads in theother. Due to limited availability of leads, we were able to mimiconly one hemisphere of the brain with a cortical and a VC/VSlead at one time. That is, this testing captured intra-hemisphericbut not cross-hemispheric artifacts. Each lead had 4 contacts andwere immersed in a saline bath. Each IPG was grounded throughan alligator clip that was taped to the IPG body on one end viaa metal foil and a resistor on the other end that was suspendedin the same saline bath as the leads. Each IPG was connectedvia an antenna to a Nexus-D telemetry head which was in turnconnected to a laptop (Figure 3). The recording settings on theIPGs were changed using a sensing programmer (SP) while thestimulation settings were changed using a clinician programmer(CP). Before starting any recordings, we first measured theimpedances of both the electrodes with the CP. We ensured goodcontact on all leads, with impedance below 1000 � on at least 3 ofthe 4 contacts. We verified impedances again between recordings.
We manipulated frequency (cortical only), pulsewidth (150 µsfor left VC/VS channel, 90 µs for other channels), configurationof the recording contacts (whether or not recording contactsdirectly flanked the stimulation contact), centering frequency,
Frontiers in Human Neuroscience | www.frontiersin.org 7 October 2020 | Volume 14 | Article 569973

fnhum-14-569973 October 19, 2020 Time: 19:18 # 8
Olsen et al. Targeted Network Disruption in OCD
FIGURE 3 | Schematic of saline bath preparation.
and gain (see Figure 2 for list of possible values). Samplingrate (200 Hz), and VC/VS channel frequency (135 Hz) didnot vary over the course of the patient experiment, and thuswere not varied in the saline test. To reduce the number oftests, only configurations used in the study were used in thesaline test. We also took baseline (stimulation off) recordings,in which we assessed the change in the signal while varying onlyrecording settings.
We took at least two recordings per setting configuration,on two separate days. Each recording was 2 min in length.We used custom written code in MATLAB to manuallytrigger recording in both the IPGs. Before sending thetrigger command, we changed the recording settings (centeringfrequency, recording contact pair, gain) using the SP and thestimulation settings (stimulation current, frequency, pulse width,and lead contact) using the CP.
The saline bath recordings were preprocessed and power andsynchrony were calculated using the same steps and criteria usedfor the patient recordings. See the LFP preprocessing and analysissection below for these criteria, and for a description of themethods used for artifact subtraction.
Intraoperative LFP Preprocessing andAnalysisWe calculated cortical-striatal synchrony for the left and rightside, as a function of VC/VS depth. For the purposes ofclarity/brevity and alignment with previous studies exploringcortical-striatal connectivity, we use the term cortical-striatalhere, though at least one of the contacts is not technically in thestriatal gray matter (but in VC/VS, more broadly). Data from thefour contacts on each lead were first bipolar referenced, yielding3 pairs. Intraoperative recordings were then epoched into onesecond segments, and bad epochs were identified and removedby visual inspection for artifacts. Epochs for the two recordings(from a given hemisphere) were concatenated.
We used the debiased weighted phase lag index (WPLI)as the measure of cortical-striatal synchrony. This measurewas selected as a way to minimize stimulation artifacts in thedaily LFP recordings from the device. Volume conduction of
stimulation artifacts could create artificial synchrony betweenbrain regions. We selected the debiased weighted phase lag index(WPLI) because it is less sensitive to this artifactual synchronycaused by volume conduction (Vinck et al., 2011). The WPLI,and other similar measures, use the principles proposed by theimaginary part of coherency (Nolte et al., 2004), which operateson the assumption that volume conduction has essentially notime lag (e.g., Stinstra and Peters, 1998), and therefore effectsdue to volume conduction will have zero phase lag. By usingthe imaginary components of the cross-spectral density, whichare themselves phase shifted, phase synchrony with zero phaselag is removed (Nolte et al., 2004). The WPLI builds on thephase lag index (PLI; Stam et al., 2007), which is a measureof the asymmetry of the phase leads and lags between twosignals, by weighting the contribution of phase asymmetriesbased on the magnitude of the imaginary component of the cross-spectral density (Vinck et al., 2011). Given that the WPLI can bepositively biased (Vinck et al., 2011), the debiased estimator orsquared WPLI was used.
To calculate WPLI each epoch was decomposed to itstime-frequency representation (TFR) using Morlet waveletconvolution, with wavelet base frequencies from 5 to 50 Hz,in 32 logarithmically spaced steps, and the number of cyclescharacterizing a wavelet ranging from 3 to 7, in 32 logarithmicallyspaced steps. WPLI was calculated between the ipsilateral corticaland VC/VS leads.
Daily LFP Preprocessing and AnalysisLocal field potentials from the two recording contacts werebipolar re-referenced by the device internally prior to downloadfrom the IPG. All other LFP pre-processing and analysis wasconducted using the MNE-Python suite (Gramfort et al., 2013).
Cortical and VC/VS recordings were temporally alignedusing each IPG’s internal timestamp, which was reset duringeach data download session to reduce the amount of temporaldrift. Given the reliance on the accuracy of the two devices’timestamps, which do not have millisecond level precision, thereis some uncertainty regarding the synchrony of the timing of thecortical and VC/VS signals. However, the temporal offset of thesignals remains consistent within each pair of 1-min recordings.Phase synchrony is defined as a consistent phase difference,and thus can be calculated regardless of a constant shift/offsetbetween two recordings. Only the portions of the recordingsthat overlapped temporally between the cortical and VC/VSIPGs were used in analysis. Therefore, while timer triggeredrecordings were each 1 min, the portion of the recording usedin analysis was slightly less than 1 min in length. Recordingswere band pass filtered between 5 and 50 Hz, in an effort toreduce the influence of stimulation artifacts. Additionally, givenvariations in the scale across recordings, each recording (withina channel) was normalized by scaling the band passed data to theinterval from−1 to 1.
Spectral AnalysisSingle recordings (5–50 Hz bandpass, normalized) weredecomposed to their time-frequency representation (TFR)using Morlet wavelet convolution, and then averaged within
Frontiers in Human Neuroscience | www.frontiersin.org 8 October 2020 | Volume 14 | Article 569973

fnhum-14-569973 October 19, 2020 Time: 19:18 # 9
Olsen et al. Targeted Network Disruption in OCD
the approximately 1-min recording to arrive at the powerspectral density (PSD) for a given recording within each channel(VC/VS left, VC/VS right, cortical left, and cortical right).TFRs were calculated with wavelet base frequencies of 5–50 Hz,in 32 logarithmically spaced steps, and the number of cyclescharacterizing a wavelet ranging from 3 to 7, in 32 logarithmicallyspaced steps. These same TFR parameters were used for thesynchrony analysis.
We then subtracted the artifact signal from the recording. Thiswas done by subtracting the PSD from the saline bath recordingmatching the recording/stimulation settings used in the patientrecording (PSD averaged across at least two saline recordings)from the PSD of a given channel for the corresponding 1-minpatient recording.
Finally, for analysis of changes in power across the courseof the study, we averaged the PSDs within each channel acrossthe recordings for a single day to arrive at the average PSDfor each day for the VC/VS left and right, and cortical leftand right channels.
Cortical-Striatal Synchrony: Weighted Phase LagIndexTo calculate the WPLI the time-aligned, band-pass filtered,normalized recordings were epoched into one second segments.Within recording, each epoch was then decomposed to its TFRas above. WPLI was calculated between the ipsilateral corticaland striatal leads (separately for left and right hemispheres), thenaveraged across time to get the WPLI at each base frequency andhemisphere for a single minute recording. WPLI was calculatedusing the spectral connectivity function in the MNE python suite,with the wpli2_debiased option.
We then subtracted the artifactual WPLI from the left andright hemisphere WPLI of a given recording, by subtracting theWPLI across frequency from the saline bath recording matchingthe recording/stimulation settings used in the patient recordingfrom the WPLI values for that 1-min patient recording.
To assess changes across the study, the WPLI from recordingson a single day were then averaged to get the average WPLI forthat day for the left and right hemispheres.
Clinical Outcomes and WPLI CorrelationsBased on our initial hypotheses, we explored the relationshipbetween the clinical outcome measures (YBOCS, MADRS, PGI,EMA) and cortical-striatal synchrony (WPLI) in each frequencyband. We calculated the mean WPLI (left and right hemispheresaveraged) within each frequency band (theta, alpha, beta, gamma)for the nearest recording day that occurred prior to the day ofthe corresponding clinical outcome measurement. The day priorwas used for clinical outcomes (YBOCS, MADRS, PGI), as onmany occasions there were also stimulation settings changes thatoccured on the day the measure was taken (i.e., the recordingsfor that day reflected the stimulation settings, not the symptomburden over the prior week). In cases where the EMA did notoccur on a clinical session day, the recordings from the day theEMA was taken were used to calculate WPLI. We then correlatedthe WPLI in each band to the clinical measures. Given multiple
comparisons for each clinical outcome, a Bonferroni correctedp-value of 0.0125 was used to determine significance.
Random Forests Using LFP Features to PredictClinical OutcomesWe conducted five-fold cross validated (using five equallysized groups) random forest regressions to predict each clinicaloutcome measure (YBOCS, MADRS, PGI, EMA) using featuresof the LFP recordings, as well as some recording and stimulationsettings features. The number of dependent data points for eachregression depended on the instances of the given outcome (totalof 39 for YBOCS and MADRS, 38 for PGI, and 215 for EMA).
We created power and WPLI features from the LFPrecordings. Power and WPLI for each recording, in each band(theta, alpha, beta, or gamma) were either averaged across afull day of recording (full day), or binned into the time ofday they occurred (night: 12:00am to 6:00am; morning: 6:00amto 12:00pm; afternoon: 12:00pm to 6:00pm; evening 6:00pmto 12:00am). Within each of those groups, features were thencreated based on whether recordings contributing to the featureswere from the day prior (for clinical outcomes; day of for EMAonly days) to the day a given outcome measure was taken,or were the average of the recordings across all the days inthe 2 weeks prior the outcome measure. The total number ofLFP features was 280. Features also included 12 recording andstimulation parameters that varied throughout the experiment(for a total of 292 features): cortical stimulation (on vs. off),cortical stimulation frequency, cortical and VC/VS (left andright separately) stimulation voltage, and left and right corticalrecording channel names. Missing values were possible, as therewas not always a recording that occurred during a given time ofday when only a single day of data was used. Missing values wereimputed using the mean from that feature.
We used the scikit-learn package in Python (Pedregosa et al.,2011) to perform the random forest analyses. The random forestwas conducted using 2000 estimators, with 2 samples required tosplit the group (a low sample to split was chosen because of thelow number of instances of the clinical outcomes). All possiblefeatures were used at each split. The model was calculated firstwith all the features, and then again using only the top 5 features(based on importance scoring) from the first model. We reportmodel accuracy, R2, and feature importances for the model usingthe top five features only. Model accuracy is 100 minus themean absolute percentage error (MAPE) in prediction of theoutcome variable on the held-out test set. R2, or coefficient ofdetermination, is essentially a measure of whether the modelcreated using the training set is performing better than a constantmodel (i.e., using the training set mean) for predicting the valuesin the test set. R2, in this case, ranges from −1 to 1, with an R2
of 1 indicating perfect prediction, R2 > 0 indicating the modelis performing better than the constant model, and an R2 < 0indicating that the model is performing worse than the constantmodel at predicting the test set values. Feature importances area normalized estimate of predictive power for each feature, basedon the fraction of samples a feature contributes to, combined withdecrease in error by splitting. Reported values for all measures
Frontiers in Human Neuroscience | www.frontiersin.org 9 October 2020 | Volume 14 | Article 569973
fnhum-14-569973 October 19, 2020 Time: 19:18 # 10
Olsen et al. Targeted Network Disruption in OCD
are calculated as the average of the values for each of the fivecross-validated test sets.
RESULTS
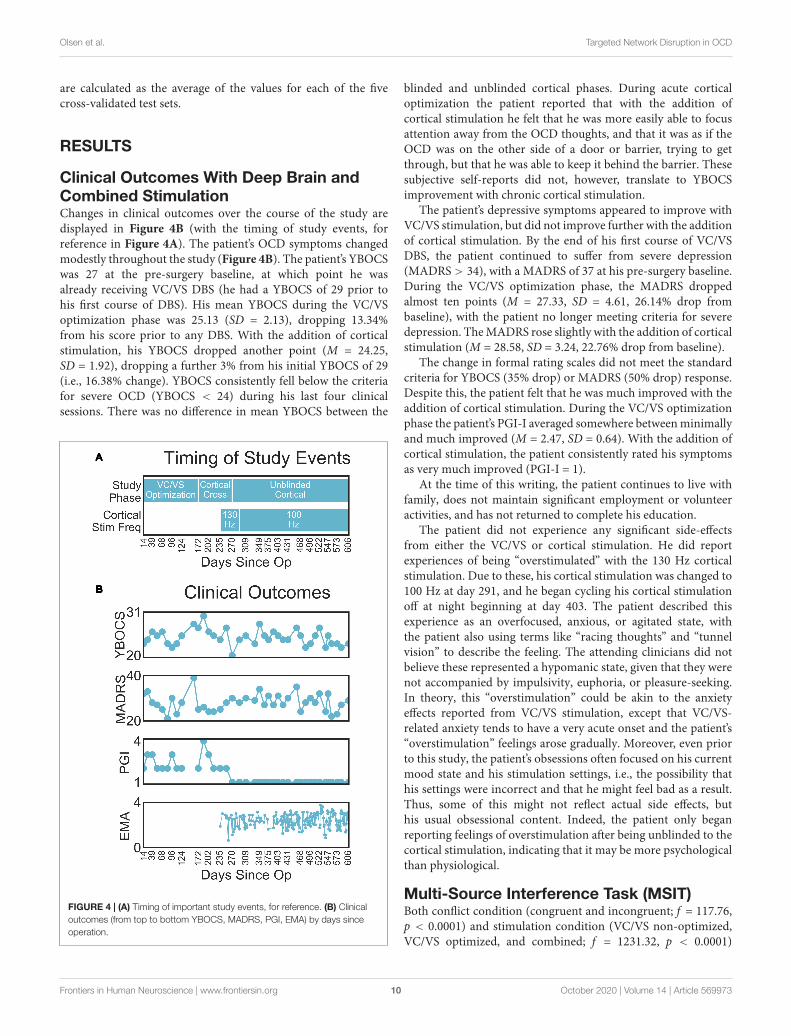
Clinical Outcomes With Deep Brain andCombined StimulationChanges in clinical outcomes over the course of the study aredisplayed in Figure 4B (with the timing of study events, forreference in Figure 4A). The patient’s OCD symptoms changedmodestly throughout the study (Figure 4B). The patient’s YBOCSwas 27 at the pre-surgery baseline, at which point he wasalready receiving VC/VS DBS (he had a YBOCS of 29 prior tohis first course of DBS). His mean YBOCS during the VC/VSoptimization phase was 25.13 (SD = 2.13), dropping 13.34%from his score prior to any DBS. With the addition of corticalstimulation, his YBOCS dropped another point (M = 24.25,SD = 1.92), dropping a further 3% from his initial YBOCS of 29(i.e., 16.38% change). YBOCS consistently fell below the criteriafor severe OCD (YBOCS < 24) during his last four clinicalsessions. There was no difference in mean YBOCS between the
FIGURE 4 | (A) Timing of important study events, for reference. (B) Clinicaloutcomes (from top to bottom YBOCS, MADRS, PGI, EMA) by days sinceoperation.
blinded and unblinded cortical phases. During acute corticaloptimization the patient reported that with the addition ofcortical stimulation he felt that he was more easily able to focusattention away from the OCD thoughts, and that it was as if theOCD was on the other side of a door or barrier, trying to getthrough, but that he was able to keep it behind the barrier. Thesesubjective self-reports did not, however, translate to YBOCSimprovement with chronic cortical stimulation.
The patient’s depressive symptoms appeared to improve withVC/VS stimulation, but did not improve further with the additionof cortical stimulation. By the end of his first course of VC/VSDBS, the patient continued to suffer from severe depression(MADRS > 34), with a MADRS of 37 at his pre-surgery baseline.During the VC/VS optimization phase, the MADRS droppedalmost ten points (M = 27.33, SD = 4.61, 26.14% drop frombaseline), with the patient no longer meeting criteria for severedepression. The MADRS rose slightly with the addition of corticalstimulation (M = 28.58, SD = 3.24, 22.76% drop from baseline).
The change in formal rating scales did not meet the standardcriteria for YBOCS (35% drop) or MADRS (50% drop) response.Despite this, the patient felt that he was much improved with theaddition of cortical stimulation. During the VC/VS optimizationphase the patient’s PGI-I averaged somewhere between minimallyand much improved (M = 2.47, SD = 0.64). With the addition ofcortical stimulation, the patient consistently rated his symptomsas very much improved (PGI-I = 1).
At the time of this writing, the patient continues to live withfamily, does not maintain significant employment or volunteeractivities, and has not returned to complete his education.
The patient did not experience any significant side-effectsfrom either the VC/VS or cortical stimulation. He did reportexperiences of being “overstimulated” with the 130 Hz corticalstimulation. Due to these, his cortical stimulation was changed to100 Hz at day 291, and he began cycling his cortical stimulationoff at night beginning at day 403. The patient described thisexperience as an overfocused, anxious, or agitated state, withthe patient also using terms like “racing thoughts” and “tunnelvision” to describe the feeling. The attending clinicians did notbelieve these represented a hypomanic state, given that they werenot accompanied by impulsivity, euphoria, or pleasure-seeking.In theory, this “overstimulation” could be akin to the anxietyeffects reported from VC/VS stimulation, except that VC/VS-related anxiety tends to have a very acute onset and the patient’s“overstimulation” feelings arose gradually. Moreover, even priorto this study, the patient’s obsessions often focused on his currentmood state and his stimulation settings, i.e., the possibility thathis settings were incorrect and that he might feel bad as a result.Thus, some of this might not reflect actual side effects, buthis usual obsessional content. Indeed, the patient only beganreporting feelings of overstimulation after being unblinded to thecortical stimulation, indicating that it may be more psychologicalthan physiological.
Multi-Source Interference Task (MSIT)Both conflict condition (congruent and incongruent; f = 117.76,p < 0.0001) and stimulation condition (VC/VS non-optimized,VC/VS optimized, and combined; f = 1231.32, p < 0.0001)
Frontiers in Human Neuroscience | www.frontiersin.org 10 October 2020 | Volume 14 | Article 569973

fnhum-14-569973 October 19, 2020 Time: 19:18 # 11
Olsen et al. Targeted Network Disruption in OCD
FIGURE 5 | Mean response time (in seconds) for each MSIT run as a functionof day since operation the patient performed the task, collapsed acrosscongruent and incongruent trials. Color of points indicates the stimulationphase: VC/VS only prior to setting optimization, VC/VS only after optimization,and combined VC/VS and cortical (100 Hz) stimulation.
contributed significantly to the final model. RT was faster forcongruent (M = 0.507 s, SEM = 0.004) than for incongruent(M = 0.691 s, SEM = 0.004) trials (β = 0.18, z = 34.36, p < 0.001),replicating the robust subject-level effects seen in the literature.
RT also differed as a function of stimulation condition (seeFigure 5). RT was faster when the patient was receiving optimizedVC/VS stimulation (M = 0.596 s, SEM = 0.005) compared tonon-optimized VC/VS stimulation (M = 0.676 s, SEM = 0.009;β = −0.08, z = −10.33, p < 0.001). RT was fastest duringcombined stimulation (M = 0.564 s, SEM = 0.005), differingfrom both non-optimized (β = 0.11, z = 14.54, p < 0.001) andoptimized (β = 0.03, z = 5.60, p < 0.001) VC/VS only stimulation.
Daily LFP Recordings: Power andCortical-Striatal Synchrony WithSingle-Site and Combined StimulationIntraoperative Cortical-Striatal SynchronyA prominent alpha WPLI peak was detected intraoperativelyusing the high resolution OR rig (Figure 6). Alpha WPLI was
more pronounced in the right hemisphere at each VC/VS depth.Right hemisphere alpha WPLI was relatively constant acrossVC/VS depth, whereas left hemisphere alpha WPLI was strongermore dorsally (near the head of the caudate). There was also asmall gamma band WPLI peak, particularly in the left mid anddorsal striatum.
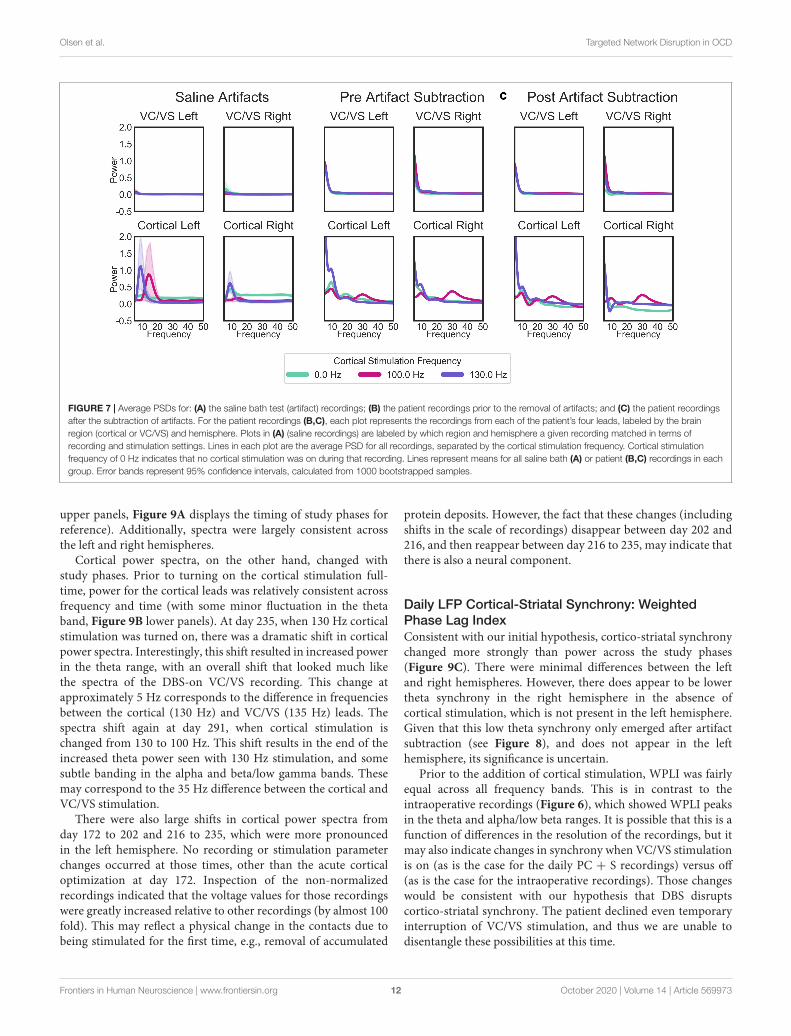
Saline Bath Test and Artifact Subtraction ResultsWhen separated by the “cortical” stimulation frequency, thereare noticeable artifacts in the “cortical,” but not “VC/VS,” salinerecordings (Figure 7A). The spectrum of these artifacts differsdepending on cortical stimulation frequency. For the patientrecordings (Figures 7B,C), spectra also differ as a functionof cortical stimulation frequency, particularly in the corticalrecordings. These fluctuations largely remain after artifactsubtraction, though the theta/beta peak appears to be muchreduced. The 10 Hz peak in the cortical/right lead (Figure 7C,bottom right), at 130 Hz cortical stimulation is over-corrected,i.e., the saline artifact was larger than the same peak in theactual recording. Given this, 130 Hz cortical recordings showinga pronounced decrease in power in the 10 Hz range will not beinterpreted as reflecting changes in brain signal.
While there are some marked artifacts in the power spectra,the synchrony spectra appear relatively artifact-free, as expectedfrom a measure that is insensitive to volume conducted artifact(Figure 8A). In the patient recordings (Figure 8B), there aredifferences in WPLI with the type of cortical stimulation, whichlargely remain after artifact subtraction (Figure 8C). Contrary toour initial hypothesis, cortical-striatal synchrony increased withcortical stimulation, especially for 130 Hz stimulation. There isovercorrection in the lower frequencies of the right hemisphere,0 Hz stimulation recordings (Figure 8C, top plot), thereforethis will not be interpreted as hyposynchrony in the absence ofcortical stimulation.
Daily LFP Spectral Analysis: Power Changes OverTimeVC/VS power spectra were relatively constant across stimulationsettings, with a consistent peak in the theta range, and no otherdiscernible peaks in the higher frequency bands (Figure 9B,
FIGURE 6 | Intraoperative WPLI as a function of VC/VS depth.
Frontiers in Human Neuroscience | www.frontiersin.org 11 October 2020 | Volume 14 | Article 569973
fnhum-14-569973 October 19, 2020 Time: 19:18 # 12
Olsen et al. Targeted Network Disruption in OCD
FIGURE 7 | Average PSDs for: (A) the saline bath test (artifact) recordings; (B) the patient recordings prior to the removal of artifacts; and (C) the patient recordingsafter the subtraction of artifacts. For the patient recordings (B,C), each plot represents the recordings from each of the patient’s four leads, labeled by the brainregion (cortical or VC/VS) and hemisphere. Plots in (A) (saline recordings) are labeled by which region and hemisphere a given recording matched in terms ofrecording and stimulation settings. Lines in each plot are the average PSD for all recordings, separated by the cortical stimulation frequency. Cortical stimulationfrequency of 0 Hz indicates that no cortical stimulation was on during that recording. Lines represent means for all saline bath (A) or patient (B,C) recordings in eachgroup. Error bands represent 95% confidence intervals, calculated from 1000 bootstrapped samples.
upper panels, Figure 9A displays the timing of study phases forreference). Additionally, spectra were largely consistent acrossthe left and right hemispheres.
Cortical power spectra, on the other hand, changed withstudy phases. Prior to turning on the cortical stimulation full-time, power for the cortical leads was relatively consistent acrossfrequency and time (with some minor fluctuation in the thetaband, Figure 9B lower panels). At day 235, when 130 Hz corticalstimulation was turned on, there was a dramatic shift in corticalpower spectra. Interestingly, this shift resulted in increased powerin the theta range, with an overall shift that looked much likethe spectra of the DBS-on VC/VS recording. This change atapproximately 5 Hz corresponds to the difference in frequenciesbetween the cortical (130 Hz) and VC/VS (135 Hz) leads. Thespectra shift again at day 291, when cortical stimulation ischanged from 130 to 100 Hz. This shift results in the end of theincreased theta power seen with 130 Hz stimulation, and somesubtle banding in the alpha and beta/low gamma bands. Thesemay correspond to the 35 Hz difference between the cortical andVC/VS stimulation.
There were also large shifts in cortical power spectra fromday 172 to 202 and 216 to 235, which were more pronouncedin the left hemisphere. No recording or stimulation parameterchanges occurred at those times, other than the acute corticaloptimization at day 172. Inspection of the non-normalizedrecordings indicated that the voltage values for those recordingswere greatly increased relative to other recordings (by almost 100fold). This may reflect a physical change in the contacts due tobeing stimulated for the first time, e.g., removal of accumulated
protein deposits. However, the fact that these changes (includingshifts in the scale of recordings) disappear between day 202 and216, and then reappear between day 216 to 235, may indicate thatthere is also a neural component.
Daily LFP Cortical-Striatal Synchrony: WeightedPhase Lag IndexConsistent with our initial hypothesis, cortico-striatal synchronychanged more strongly than power across the study phases(Figure 9C). There were minimal differences between the leftand right hemispheres. However, there does appear to be lowertheta synchrony in the right hemisphere in the absence ofcortical stimulation, which is not present in the left hemisphere.Given that this low theta synchrony only emerged after artifactsubtraction (see Figure 8), and does not appear in the lefthemisphere, its significance is uncertain.
Prior to the addition of cortical stimulation, WPLI was fairlyequal across all frequency bands. This is in contrast to theintraoperative recordings (Figure 6), which showed WPLI peaksin the theta and alpha/low beta ranges. It is possible that this is afunction of differences in the resolution of the recordings, but itmay also indicate changes in synchrony when VC/VS stimulationis on (as is the case for the daily PC + S recordings) versus off(as is the case for the intraoperative recordings). Those changeswould be consistent with our hypothesis that DBS disruptscortico-striatal synchrony. The patient declined even temporaryinterruption of VC/VS stimulation, and thus we are unable todisentangle these possibilities at this time.
Frontiers in Human Neuroscience | www.frontiersin.org 12 October 2020 | Volume 14 | Article 569973

fnhum-14-569973 October 19, 2020 Time: 19:18 # 13
Olsen et al. Targeted Network Disruption in OCD
FIGURE 8 | WPLI across frequency for: (A) the saline bath test (artifact) recordings; (B) the patient recordings prior to the removal of artifacts; and (C) the patientrecordings after the subtraction of artifacts. Plots of patient recordings (B,C) indicate the cortical-striatal WPLI for the left and right hemispheres, with colored linesindicating the cortical stimulation frequency at the time of recording. Saline test plots (A) indicate whether the recording and stimulation settings for the IPGsmatched those of the left or right hemisphere of patient recordings. Error bands represent 95% confidence intervals, calculated from 1000 bootstrapped samples.
There is a dramatic increase in WPLI in the theta, alpha, beta,and low gamma bands when cortical stimulation is turned onfull-time at 130 Hz (day 235). When stimulation is reduced to100 Hz (day 291) this increase abates, although WPLI in thealpha, beta, and low gamma bands remains high relative to theother frequencies. Given the absence of WPLI artifacts in salinetesting, these synchrony changes likely reflect true physiologicchange. Contrary to our initial expectation, there was an increasein synchrony with combined VC/VS and cortical stimulation, andthis increase was greatest when cortical stimulation was 130 Hz.
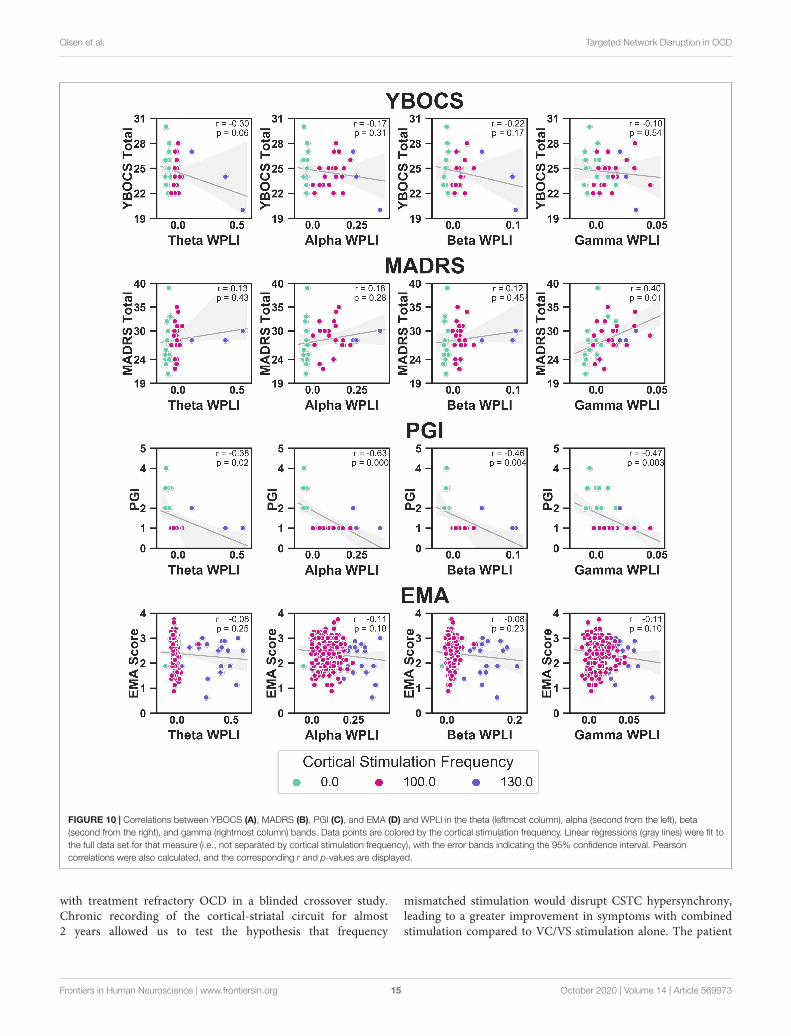
Relationship of Power andCortical-Striatal Synchrony to ClinicalOutcomesClinical Outcomes and WPLI CorrelationsWe correlated WPLI in each band (theta, alpha, beta, andgamma) to the clinical measures (Figure 10). Raw p-values arereported here; only p-values below the Bonferroni threshold of0.0125 were considered significant. YBOCS improvement wascorrelated with higher WPLI in the theta band, but this did notreach significance (r = −0.30, p = 0.06) and may be driven byoutliers. Improvement in MADRS was significantly correlatedwith lower WPLI in the gamma band (r = 0.40, p = 0.01). PGIcorrelations echoed the YBOCS, with improvement associatedwith increased WPLI in the alpha (r = −0.63, p < 0.001), beta(r = −0.46, p = 0.004), and gamma (r = −0.47, p = 0.003)
bands. There were no significant correlations between EMA andWPLI in any band.
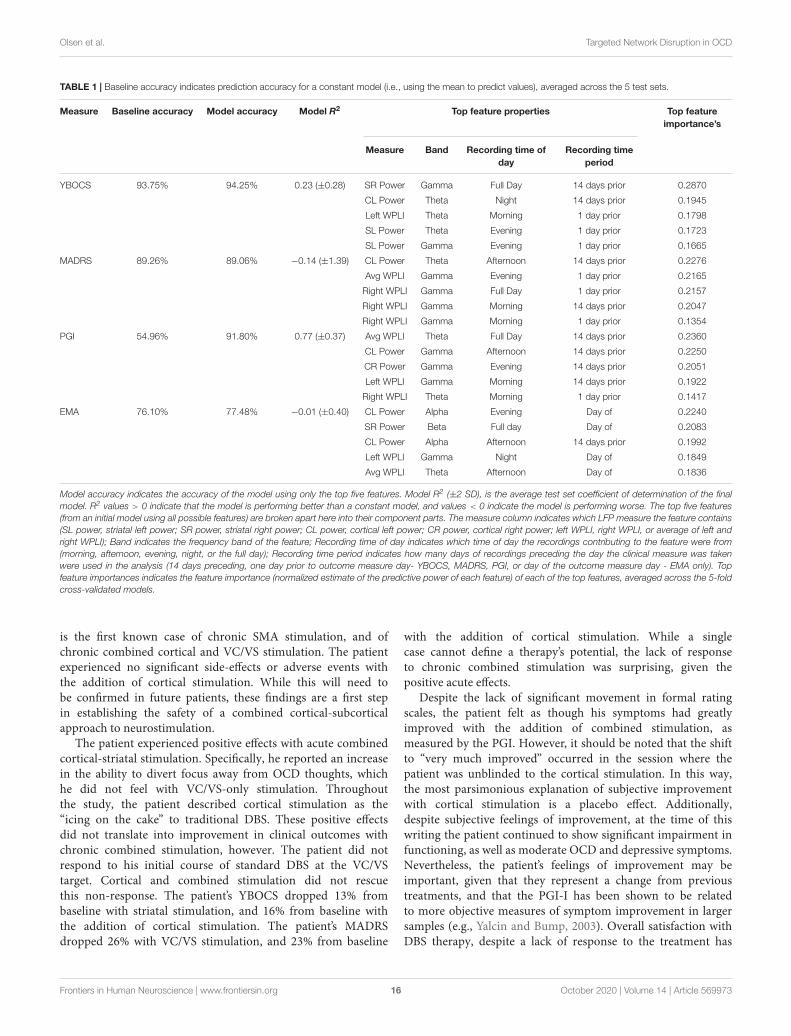
Random Forests Using LFP Features to PredictClinical OutcomesTable 1 contains the results of the random forest regressionspredicting the clinical outcomes using LFP features. The modelspredicting MADRS (R2 = −0.14 ± 1.39) and EMA score(R2 = −0.01 ± 0.40) failed to perform better than a constantmodel. While average R2 for the model predicting YBOCS waspositive, the 2 SD confidence interval included 0. We thereforeconcluded that the model did not meet performance criteria(R2 = 0.23 ± 0.28). This was likely due to a lack of variabilityin YBOCS scores across the course of the study; the meanpredicted YBOCS scores with 94% accuracy, calculated as theaverage across the 5 cross validated test sets. In line with thecorrelation results, the model predicting PGI did perform betterthan the constant model (R2 = 0.77 ± 0.37), and was able topredict PGI of the test sets with 92% accuracy. Cortical-striatalsynchrony in the gamma and theta bands appeared as importantfeatures in the model.
DISCUSSION
We examined targeted CSTC network disruption with combinedcortical (SMA) and VC/VS neurostimulation in one patient
Frontiers in Human Neuroscience | www.frontiersin.org 13 October 2020 | Volume 14 | Article 569973

fnhum-14-569973 October 19, 2020 Time: 19:18 # 14
Olsen et al. Targeted Network Disruption in OCD
FIGURE 9 | (A) Timing of important study events for reference. (B) Heatmaps denoting the artifact corrected power (5–50 Hz) across the course of the study.(C) Artifact corrected cortical-striatal synchrony (WPLI) across the frequencies tested, as a function of days since operation. To better show subtle changes in WPLI,the range used for the color map is –0.1 to 0.2. Dotted lines on heatmaps (B,C) indicate clinical sessions, during which stimulation and recording settings changedand clinical outcomes were taken (see Figure 2 above for timing of important settings changes). Areas with missing LFP recordings have been interpolated (e.g.,between days 138 and 151).
Frontiers in Human Neuroscience | www.frontiersin.org 14 October 2020 | Volume 14 | Article 569973
fnhum-14-569973 October 19, 2020 Time: 19:18 # 15
Olsen et al. Targeted Network Disruption in OCD
FIGURE 10 | Correlations between YBOCS (A), MADRS (B), PGI (C), and EMA (D) and WPLI in the theta (leftmost column), alpha (second from the left), beta(second from the right), and gamma (rightmost column) bands. Data points are colored by the cortical stimulation frequency. Linear regressions (gray lines) were fit tothe full data set for that measure (i.e., not separated by cortical stimulation frequency), with the error bands indicating the 95% confidence interval. Pearsoncorrelations were also calculated, and the corresponding r and p-values are displayed.
with treatment refractory OCD in a blinded crossover study.Chronic recording of the cortical-striatal circuit for almost2 years allowed us to test the hypothesis that frequency
mismatched stimulation would disrupt CSTC hypersynchrony,leading to a greater improvement in symptoms with combinedstimulation compared to VC/VS stimulation alone. The patient
Frontiers in Human Neuroscience | www.frontiersin.org 15 October 2020 | Volume 14 | Article 569973
fnhum-14-569973 October 19, 2020 Time: 19:18 # 16
Olsen et al. Targeted Network Disruption in OCD
TABLE 1 | Baseline accuracy indicates prediction accuracy for a constant model (i.e., using the mean to predict values), averaged across the 5 test sets.
Measure Baseline accuracy Model accuracy Model R2 Top feature properties Top featureimportance’s
Measure Band Recording time ofday
Recording timeperiod
YBOCS 93.75% 94.25% 0.23 (±0.28) SR Power Gamma Full Day 14 days prior 0.2870
CL Power Theta Night 14 days prior 0.1945
Left WPLI Theta Morning 1 day prior 0.1798
SL Power Theta Evening 1 day prior 0.1723
SL Power Gamma Evening 1 day prior 0.1665
MADRS 89.26% 89.06% −0.14 (±1.39) CL Power Theta Afternoon 14 days prior 0.2276
Avg WPLI Gamma Evening 1 day prior 0.2165
Right WPLI Gamma Full Day 1 day prior 0.2157
Right WPLI Gamma Morning 14 days prior 0.2047
Right WPLI Gamma Morning 1 day prior 0.1354
PGI 54.96% 91.80% 0.77 (±0.37) Avg WPLI Theta Full Day 14 days prior 0.2360
CL Power Gamma Afternoon 14 days prior 0.2250
CR Power Gamma Evening 14 days prior 0.2051
Left WPLI Gamma Morning 14 days prior 0.1922
Right WPLI Theta Morning 1 day prior 0.1417
EMA 76.10% 77.48% −0.01 (±0.40) CL Power Alpha Evening Day of 0.2240
SR Power Beta Full day Day of 0.2083
CL Power Alpha Afternoon 14 days prior 0.1992
Left WPLI Gamma Night Day of 0.1849
Avg WPLI Theta Afternoon Day of 0.1836
Model accuracy indicates the accuracy of the model using only the top five features. Model R2 (±2 SD), is the average test set coefficient of determination of the finalmodel. R2 values > 0 indicate that the model is performing better than a constant model, and values < 0 indicate the model is performing worse. The top five features(from an initial model using all possible features) are broken apart here into their component parts. The measure column indicates which LFP measure the feature contains(SL power, striatal left power; SR power, striatal right power; CL power, cortical left power; CR power, cortical right power; left WPLI, right WPLI, or average of left andright WPLI); Band indicates the frequency band of the feature; Recording time of day indicates which time of day the recordings contributing to the feature were from(morning, afternoon, evening, night, or the full day); Recording time period indicates how many days of recordings preceding the day the clinical measure was takenwere used in the analysis (14 days preceding, one day prior to outcome measure day- YBOCS, MADRS, PGI, or day of the outcome measure day - EMA only). Topfeature importances indicates the feature importance (normalized estimate of the predictive power of each feature) of each of the top features, averaged across the 5-foldcross-validated models.
is the first known case of chronic SMA stimulation, and ofchronic combined cortical and VC/VS stimulation. The patientexperienced no significant side-effects or adverse events withthe addition of cortical stimulation. While this will need tobe confirmed in future patients, these findings are a first stepin establishing the safety of a combined cortical-subcorticalapproach to neurostimulation.
The patient experienced positive effects with acute combinedcortical-striatal stimulation. Specifically, he reported an increasein the ability to divert focus away from OCD thoughts, whichhe did not feel with VC/VS-only stimulation. Throughoutthe study, the patient described cortical stimulation as the“icing on the cake” to traditional DBS. These positive effectsdid not translate into improvement in clinical outcomes withchronic combined stimulation, however. The patient did notrespond to his initial course of standard DBS at the VC/VStarget. Cortical and combined stimulation did not rescuethis non-response. The patient’s YBOCS dropped 13% frombaseline with striatal stimulation, and 16% from baseline withthe addition of cortical stimulation. The patient’s MADRSdropped 26% with VC/VS stimulation, and 23% from baseline
with the addition of cortical stimulation. While a singlecase cannot define a therapy’s potential, the lack of responseto chronic combined stimulation was surprising, given thepositive acute effects.
Despite the lack of significant movement in formal ratingscales, the patient felt as though his symptoms had greatlyimproved with the addition of combined stimulation, asmeasured by the PGI. However, it should be noted that the shiftto “very much improved” occurred in the session where thepatient was unblinded to the cortical stimulation. In this way,the most parsimonious explanation of subjective improvementwith cortical stimulation is a placebo effect. Additionally,despite subjective feelings of improvement, at the time of thiswriting the patient continued to show significant impairment infunctioning, as well as moderate OCD and depressive symptoms.Nevertheless, the patient’s feelings of improvement may beimportant, given that they represent a change from previoustreatments, and that the PGI-I has been shown to be relatedto more objective measures of symptom improvement in largersamples (e.g., Yalcin and Bump, 2003). Overall satisfaction withDBS therapy, despite a lack of response to the treatment has
Frontiers in Human Neuroscience | www.frontiersin.org 16 October 2020 | Volume 14 | Article 569973

fnhum-14-569973 October 19, 2020 Time: 19:18 # 17
Olsen et al. Targeted Network Disruption in OCD
been described before (e.g., Denys et al., 2020). It is possiblethat this effect represents changes in overall mood, or thelimitations of the YBOCS in terms of sensitivity to changeat extremes of pathology (van Westen et al., 2020). It is alsopossible, however, that this is simply a subjective sense of, “Ihad brain surgery, so it must be doing something.” Regardless,overall satisfaction with the treatment even in the absence ofresponse may serve a protective function, as it may representa decrease in hopelessness, which is correlated with long-termadverse outcomes such as suicide (Papakostas et al., 2005;Beck et al., 2006).
The patient’s cognitive control, as measured by performanceon the MSIT, also appeared to improve with combinedstimulation. In line with previous research showing improvedperformance with VC/VS DBS (Basu et al., preprint; Widgeet al., 2019), the patient’s response speed improved when hewas receiving optimized VC/VS stimulation. With the additionof cortical stimulation he showed an additional quickening ofresponse time, compared to optimized VC/VS stimulation alone.It should be noted, though, that the patient did appear toshow an effect of time, such that he improved as day sinceoperation increased (see Figure 5). Our study design meantthat stimulation condition and day since operation were highlycollinear. Therefore, we are unable to dissociate the improvementseen with stimulation condition from an improvement withtime. However, Widge et al. (2019) found no differences in RTbetween multiple MSIT runs conducted an average of 88 minapart. It is unlikely that such effects would emerge at muchlonger time delays, such as those seen in our study. Therefore,differences between VC/VS only stimulation and combinedstimulation may reflect an additional boost to cognitive controlwith the addition of cortical stimulation. This finding trackswith our finding of subjective symptom improvement withcombined stimulation, and the possibility that the YBOCS maynot have been sensitive enough to detect changes in our patient’sOCD pathology. Namely, there may have been subtle shifts insome of the cognitive deficits thought to underly OCD (e.g.,Robbins et al., 2012; Shin et al., 2014; Voon et al., 2015; Vaghiet al., 2017) which resulted in the subjective improvementfelt by the patient, but which were too subtle to producesignificant changes in traditional rating scales. This findingalso tracks with prior studies implicating medial prefrontalcortex in the cognitive deficits seen in OCD (Haber, 2003;Cocchi et al., 2012; Robbins et al., 2012; Vaghi et al., 2017;Robbins et al., 2019).
This study represents the first chronic recording of thecortical-striatal circuit in a human. Using these recordings wewere able to measure cortical-striatal synchrony continuouslyfor nearly 2 years. In line with our initial prediction, frequencymismatched stimulation did in fact alter cortical-striatalsynchrony. However, this alteration was in the opposite directionof our initial prediction - frequency mismatched stimulationactually increased cortical-striatal synchrony. Further, theincrease in synchrony was greater when the two frequencieswere closer together (130 and 135 Hz), versus when theywere farther apart (100 and 135 Hz). While there were powerchanges with acute cortical stimulation, synchrony changes only
emerged with chronic stimulation. These findings remainedeven after the removal of stimulation artifacts. Additionally,the increase in cortical-striatal synchrony (in the alpha, beta,and gamma bands) was associated with an increase in thepatient’s subjective feelings of improvement, with LFP features(especially synchrony) predicting PGI with 92% accuracy ina random forest regression. Synchrony was not significantlyrelated to either OCD or MDD symptoms. Importantly, giventhe n of 1 and the absence of baseline and stimulation offrecordings, any conclusions regarding changes in synchrony areextremely tentative. Future research is needed to elucidate theinfluence of combined (and arguably, single-site) stimulationon the synchrony of neural oscillations, and its relationship tosymptom improvement.
If the finding holds, one possibility for the unexpected increasein synchrony with combined stimulation is that neural elementsmay have imprecise or broadly tuned frequency responses, orresponses that become insensitive to mismatch at high drivingcurrents (Fröhlich, 2015). At the relatively high stimulationintensities used in clinical DBS, a small mismatch betweendriving frequencies may essentially be zero mismatch from thebiological system’s perspective. Another possibility is that theDBS frequency may entrain the endogenous frequency, as wasobserved for narrowband gamma in Swann et al. (2016). Finally,rather than causing disruption (by forcing two oscillators out ofphase), it may be that the separation between frequencies canactually entrain activity at the difference between the two drivingfrequencies, an effect that some have proposed could be exploitedtherapeutically (Grossman et al., 2017).
Subjective symptom improvement with increases in cortico-striatal synchrony was not in line with our initial hypothesisthat OCD arises from CSTC hypersynchrony. While thisfinding clearly requires replication, one explanation is that thehyperconnectivity hypothesis represents an oversimplified viewof the neurobiology of OCD. As discussed previously, there isevidence of both hyper and hypoconnectivity (Gürsel et al., 2018),which may be partially a function of which CSTC loop (e.g.,motor, associative, or limbic loops: Obeso et al., 2008; Kracket al., 2010; Milad and Rauch, 2012; Lapidus et al., 2013) theregions showing aberrant connectivity are in Harrison et al.(2009); Göttlich et al. (2014), Posner et al. (2014), and Vaghiet al. (2017). In this way, it is possible that our patient’s specificpattern between VC/VS and SMA was one of hypoconnectivity,and combined stimulation did move his networks toward a morenormal/healthy connectivity pattern.
Establishing an individual’s specific pattern of connectivity,therefore, may be a critical step in developing personalizedtreatments for OCD. However, establishing this pattern doesno good if there is no means of restoring the communicationto “normal” levels. Neurostimulation, and in particularcombined stimulation, offers a unique means of directlyinfluencing connectivity between regions. Despite the direction,our results suggest that the communication between CSTCregions, as measured by phase synchrony, may be alteredby neurostimulation. Further, our results indicate that thesealterations can potentially be sustained across long periods oftime, while the patient is receiving stimulation. Thus, this case
Frontiers in Human Neuroscience | www.frontiersin.org 17 October 2020 | Volume 14 | Article 569973

fnhum-14-569973 October 19, 2020 Time: 19:18 # 18
Olsen et al. Targeted Network Disruption in OCD
supports the possibility of using DBS to deliver personalized,network-level therapy.
Limitations, Lessons Learned, andFuture ConsiderationsThe results of the present study are limited in that it isdifficult to assess whether changes in power and synchronyare a result of actual changes in brain signal, or are artifactsof stimulation. This is in part a result of the imperfectartifact rejection from the device recordings (Stanslaski et al.,2012; Swann et al., 2017), amplified in this case by thefact that some of our optimal stimulation contacts did notpermit the use of the preferred “flanking dipole” recordingconfiguration. Further, while we attempted to subtract the artifactsignal from our recordings using saline bath test recordings,these methods were imperfect. Most notably, we did nothave enough leads to test the full four lead configuration insaline, potentially missing artifacts that only emerge with thatfull configuration. Despite imperfections, we do feel that theprocess of establishing the signal in the absence of brain signal(which to our knowledge has not been reported before inthe DBS literature) may be an important check when makingclaims about the effect of DBS on neural oscillations in thepresence of potential stimulation artifacts. Further, effectiveartifact subtraction/removal will almost certainly be critical fordeveloping closed-loop therapies, which are a critical next stepin advancing neurostimulation (Bilge et al., 2018; Widge et al.,2018).
To the prior point, we believe this study is the firstto report an attempt at multi-structure chronic recordingthrough two implanted PC + S systems. One of ourunpleasant surprises was that this implant configurationcould not be combined with real-time data streaming. Thetwo implanted neurostimulators exhibited cross-talk duringstreaming attempts, whether using the base PC + S system(Sensing Programmer) or the more advanced Nexus-D toolkit.Starting streaming sessions from a second IPG immediatelyended the streaming from whichever IPG we had contactedfirst. It is unclear whether this will continue to be alimitation in future generations of sensing systems, whichmay benefit from continued advances in medical implantcommunication infrastructure. There is a move toward wirelessprogramming even for clinical applications, which necessitatesthe development of devices that can flexibly switch bands toprevent cross talk.
One solution to the problem of stimulation artifacts issimply taking recordings with stimulation off. This is theapproach that has been taken in previous studies (Huang et al.,2019; Veerakumar et al., 2019), and will be our approachmoving forward. However, taking stimulation off recordingspresents potential challenges/drawbacks. The first is the potentialunblinding of the participant during a randomized protocol.There is also the potential that the changes in synchronydue to combined stimulation only occur while stimulationis on. One indication that this may be the case comesfrom studies showing that the beneficial effects of VC/VS
DBS for OCD are not sustained when stimulation is turnedoff in a blinded fashion (Luyten et al., 2016), and fromour own studies showing rapid cognitive change from DBSdiscontinuation (Widge et al., 2019). Therefore, we also planto take recordings with stimulation on. While this bringsus back to the issue of stimulation artifacts, we believe thathaving corresponding stimulation on and off recordings wouldonly be beneficial.
The data from this specific patient are limited in that therewere no baseline recordings taken prior to turning on VC/VSstimulation. Baseline recordings would have helped establishthe level of cortical-striatal synchrony in our patient in theabsence of an intervention. The original protocol called for 2-weeks of baseline recordings. However, as discussed previously,while recovering in the hospital the patient reported suicidality,which he attributed to cessation from his prior DBS therapy.From then on, the patient declined any deactivation of VC/VSstimulation, and as such, we were unable to obtain any recordingsin the absence of stimulation. This is also the reason wewere unable to obtain stimulation off recordings throughoutthe course of the study. Psychiatric DBS patients generallytolerate turning the device off [e.g., 14 out of 14 participantsin Widge et al. (2019) tolerated having their stimulation turnedoff], so DBS on/off comparisons will likely be possible in thefuture, and will clarify the baseline, non-stimulation recordingcharacteristics.
The results are also potentially limited in the specific patientselected as the first participant. Given that the patient did notrespond to his initial course of VC/VS DBS, the approvingphysicians felt that there was hope of improvement with theaddition of combined stimulation. In hindsight, the lack ofresponse to prior VC/VS DBS may instead have been anindication that the patient would also be more likely to bea non-responder to other types of neurostimulation. Further,the presentation of the patient’s OCD symptoms is particularlychallenging, in that his compulsions are largely mental and thusdifficult to target for exposure. It is very hard to distinguishsome of these compulsions from ruminative preoccupation. Thispattern may have made it less likely that the patient wouldrespond to treatment, and is an important caution for DBSpatient selection generally.
Moving forward, we also plan on implementing EMAstyle assessments of OCD and other symptoms, which arean important way of capturing more frequent variability insymptoms [see Walz et al. (2014) for a review of their use inanxiety disorders]. We will also attempt take corresponding LFPrecordings in an effort to more successfully model changes insymptoms using the features of the LFP. The EMA used in thepresent study was limited in that it did not specifically measureOC symptoms, but instead was an assessment of motivationand the ability to perform daily tasks. Further, the EMA onlybegan being collected mid-way through the study, meaning thatimportant baseline levels were not established. For the nextpatient, we plan to collect a wide range of baseline questionnairesand EMAs prior to initiating treatment. Theoretically, it shouldalso be possible to then titrate future EMAs to just the areasin which the patient shows the most impairment, making the
Frontiers in Human Neuroscience | www.frontiersin.org 18 October 2020 | Volume 14 | Article 569973

fnhum-14-569973 October 19, 2020 Time: 19:18 # 19
Olsen et al. Targeted Network Disruption in OCD
EMAs more user friendly. As previously discussed, there aresignificant nuances and (likely) individual differences in thecomplex pattern of aberrant connectivity in individuals withOCD. Therefore, establishing an individual’s specific patternof connectivity may help improve neurostimulation therapiesfor psychiatric disorders through targeting brain regions whichshow dysfunctional connectivity. While there are almost certainlyothers, we see two methods of implementing this type oftargeting. The first is the use of diffusion tensor imaging (DTI)and tractography. This type of MRI was not possible in thefirst patient due to his chronic indwelling hardware, but weanticipate collecting it in future patients. Using the patient’stractography between certain CSTC seed regions, we may beable to more specifically target both sub-cortical and corticalelectrodes. The second is the through measuring cortical-striatalsynchrony intraoperatively, in real-time. Electrodes (especiallycortical) could be placed in areas showing the most pronouncedsynchrony patterns (either high or low synchrony, dependingon the patient).
CONCLUSION
Psychiatric disorders, including OCD, are network disorders.We have shown that those networks can potentially besafely manipulated with multi-site continuous stimulation,and measured over periods of years with currently availabletechnologies. Although the patient was not relieved of hispsychiatric symptoms to the extent expected, our results areimportant safety and feasibility evidence toward a more network-oriented and personalized approach to DBS.
DATA AVAILABILITY STATEMENT
Preprocessed data and analysis script are available at:https://github.com/tne-lab/Olsen-et-al-2020. Raw data andpreprocessing scripts can be made available upon request.
ETHICS STATEMENT
The studies involving human participants were reviewed andapproved by Institutional Review Board of MassachusettsGeneral Hospital. The patients/participants provided theirwritten informed consent to participate in this study. Writteninformed consent was obtained from the individual(s) for thepublication of any potentially identifiable images or data includedin this article.
AUTHOR CONTRIBUTIONS
AW conceived, developed, and supervised all aspects of thestudy, with significant input from DD. SO wrote the manuscriptwith support from AW and IB and performed the final dataanalysis with significant input from MTB, IB, and AW. AW, DD,CC, and TD performed the clinical care aspects of the study.ZW performed the study surgical procedures. MTB, IB, AK,MJB, AR, AG, and EH carried out the study procedures andcollected the data. IB performed the saline bath test study. MTBconceptualized and created the data analysis procedures. IB, AK,MJB, AR, AG, and EH provided the data analysis support. NPand AR performed the MRI analysis and developed the MMVTsoftware. JB conceived of and carried out the separate studyof which the ecological momentary assessments are reportedhere. ME, IS, KF-H, and JS performed the data collection andsome analysis of the ecological momentary assessment study.All the authors contributed to the article and approved thesubmitted version.
FUNDING
This study was supported by the NIH (UH3-NS100548-01), NIH (U01MH116925), the MnDRIVE Brain ConditionsProgram, and the University of Minnesota Medical DiscoveryTeam on Addictions.
REFERENCESAlexander, G. E., DeLong, M. R., and Strick, P. L. (1986). Parallel organization
of functionally segregated circuits linking basal ganglia and cortex.Annu. Rev. Neurosci. 9, 357–381. doi: 10.1146/annurev.ne.09.030186.002041
Basu, I., Yousefi, A., Crocker, B., Zelmann, R., Paulk, A. C., Peled, N., et al.(Preprint). Closed Loop Enhancement and Neural Decoding of Human CognitiveControl. Available online at: https://www.biorxiv.org/content/10.1101/2020.04.24.059964v1.full
Beck, A. T., Brown, G., Berchick, R. J., Stewart, B. L., and Steer, R. A. (2006).Relationship between hopelessness and ultimate suicide: a replication withpsychiatric outpatients. Focus 4, 291–296. doi: 10.1176/foc.4.2.291
Bilge, M. T., Gosai, A. K., and Widge, A. S. (2018). Deep brain stimulation inpsychiatry: mechanisms, models, and next-generation therapies. Psychiatr. Clin.North Am. 41, 373–383.
Brennan, B., and Rauch, S. (2017). “Functional neuroimaging studies in obsessive-compulsive disorder: overview and synthesis,” in Obsessive-CompulsiveDisorder: Phenomenology, Pathophysiology and Treatment, ed. C. Pittenger(Oxford: Oxford University Press), 213–230.
Bronte-Stewart, H., Barberini, C., Koop, M. M., Hill, B. C., Henderson, J. M.,and Wingeier, B. (2009). The STN beta-band profile in Parkinson’s disease isstationary and shows prolonged attenuation after deep brain stimulation. Exp.Neurol. 215, 20–28. doi: 10.1016/j.expneurol.2008.09.008
Brown, L. T., Mikell, C. B., Youngerman, B. E., Zhang, Y., McKhann, G. M., andSheth, S. A. (2016). Dorsal anterior cingulotomy and anterior capsulotomyfor severe, refractory obsessive-compulsive disorder: a systematic review ofobservational studies. J. Neurosurg. 124, 77–89. doi: 10.3171/2015.1.jns14681
Bush, G., and Shin, L. M. (2006). The multi-source interference task: an fMRI taskthat reliably activates the cingulo-frontal-parietal cognitive/attention network.Nat. Protoc. 1, 308–313. doi: 10.1038/nprot.2006.48
Bush, G., Shin, L. M., Holmes, J., Rosen, B. R., and Vogt, B. A. (2003). The multi-source interference task: validation study with fMRI in individual subjects. Mol.Psychiatry 8, 60–70. doi: 10.1038/sj.mp.4001217
Calzà, J., Gürsel, D. A., Schmitz-Koep, B., Bremer, B., Reinholz, L., Berberich, G.,et al. (2019). Altered cortico–striatal functional connectivity during resting statein obsessive–compulsive disorder. Front. Psychiatry 10:319. doi: 10.3389/fpsyt.2019.00319
Carmi, L., Alyagon, U., Barnea-Ygael, N., Zohar, J., Dar, R., and Zangen, A.(2018). Clinical and electrophysiological outcomes of deep TMS over the medial
Frontiers in Human Neuroscience | www.frontiersin.org 19 October 2020 | Volume 14 | Article 569973
fnhum-14-569973 October 19, 2020 Time: 19:18 # 20
Olsen et al. Targeted Network Disruption in OCD
prefrontal and anterior cingulate cortices in OCD patients. Brain Stimul. 11,158–165. doi: 10.1016/j.brs.2017.09.004
Carmi, L., Tendler, A., Bystritsky, A., Hollander, E., Blumberger, D. M., Daskalakis,J., et al. (2019). Efficacy and safety of deep transcranial magnetic stimulation forobsessive-compulsive disorder: a prospective multicenter randomized double-blind placebo-controlled trial. Am. J. Psychiatry 176, 931–938. doi: 10.1176/appi.ajp.2019.18101180
Cocchi, L., Harrison, B. J., Pujol, J., Harding, I. H., Fornito, A., Pantelis, C., et al.(2012). Functional alterations of large-scale brain networks related to cognitivecontrol in obsessive-compulsive disorder. Hum. Brain Mapp. 33, 1089–1106.doi: 10.1002/hbm.21270
Connolly, A. T., Muralidharan, A., Hendrix, C., Johnson, L., Gupta, R., Stanslaski,S., et al. (2015). Local field potential recordings in a non-human primate modelof Parkinsons disease using the Activa PC+ S neurostimulator. J. Neural Eng.12:066012. doi: 10.1088/1741-2560/12/6/066012
De Hemptinne, C., Swann, N. C., Ostrem, J. L., Ryapolova-Webb, E. S., SanLuciano, M., Galifianakis, N. B., et al. (2015). Therapeutic deep brainstimulation reduces cortical phase-amplitude coupling in Parkinson’s disease.Nat. Neurosci. 18, 779–786. doi: 10.1038/nn.3997
Denys, D., Graat, I., Mocking, R., de Koning, P., Vulink, N., Figee, M., et al. (2020).Efficacy of deep brain stimulation of the ventral anterior limb of the internalcapsule for refractory obsessive-compulsive disorder: a clinical cohort of 70patients. Am. J. Psychiatry 177, 265–271. doi: 10.1176/appi.ajp.2019.19060656
Dougherty, D. D., Brennan, B. P., Stewart, S. E., Wilhelm, S., Widge, A. S., andRauch, S. L. (2018). Neuroscientifically informed formulation and treatmentplanning for patients with obsessive-compulsive disorder: a review. JAMAPsychiatry 75, 1081–1087. doi: 10.1001/jamapsychiatry.2018.0930
Dougherty, D. D., Chou, T., Corse, A. K., Arulpragasam, A. R., Widge, A. S., Cusin,C., et al. (2016). Acute deep brain stimulation changes in regional cerebralblood flow in obsessive-compulsive disorder. J. Neurosurg. 125, 1087–1093.doi: 10.3171/2015.9.jns151387
Felsenstein, O., and Peled, N. (2017). MMVT - Multi-Modality Visualization Tool.GitHub Repository. Available online at: https://github.com/pelednoam/mmvt(accessed June 1, 2020).
Felsenstein, O., Peled, N., Hahn, E., Rockhill, A. P., Folsom, L., Gholipour, T., et al.(2019). Multi-modal neuroimaging analysis and visualization tool (MMVT).arXiv [Preprint]. Available online at: https://arxiv.org/abs/1912.10079 (accessedJune 1, 2020)
Figee, M., Luigjes, J., Smolders, R., Valencia-Alfonso, C. E., Van Wingen, G., DeKwaasteniet, B., et al. (2013). Deep brain stimulation restores frontostriatalnetwork activity in obsessive-compulsive disorder. Nat. Neurosci. 16,386–387.
Fineberg, N. A., and Gale, T. M. (2005). Evidence-based pharmacotherapy ofobsessive–compulsive disorder. Int. J. Neuropsychopharmacol. 8, 107–129.
Foa, E. B., Liebowitz, M. R., Kozak, M. J., Davies, S., Campeas, R., Franklin,M. E., et al. (2005). Randomized, placebo-controlled trial of exposure and ritualprevention, clomipramine, and their combination in the treatment of obsessive-compulsive disorder. Am. J. Psychiatry 162, 151–161. doi: 10.1176/appi.ajp.162.1.151
Fries, P. (2005). A mechanism for cognitive dynamics: neuronal communicationthrough neuronal coherence. Trends Cogn. Sci. 9, 474–480. doi: 10.1016/j.tics.2005.08.011
Fries, P. (2015). Rhythms for cognition: communication through coherence.Neuron 88, 220–235. doi: 10.1016/j.neuron.2015.09.034
Fröhlich, F. (2015). Experiments and models of cortical oscillations as a target fornoninvasive brain stimulation. Prog. Brain Res. 222, 41–73. doi: 10.1016/bs.pbr.2015.07.025
Gomes, P. V. O., Brasil-Neto, J. P., Allam, N., and Rodrigues de Souza, E.(2012). A randomized, double-blind trial of repetitive transcranial magneticstimulation in obsessive-compulsive disorder with three-month follow-up.J. Neuropsychiatry Clin. Neurosci. 24, 437–443. doi: 10.1176/appi.neuropsych.11100242
González-Villar, A. J., and Carrillo-de-la-Peña, M. T. (2017). Brain electricalactivity signatures during performance of the multisource interference task.Psychophysiology 54, 874–881. doi: 10.1111/psyp.12843
Goodman, W. K., Price, L. H., Rasmussen, S. A., Mazure, C., Fleischmann,R. L., Hill, C. L., et al. (1989). The Yale-Brown obsessive compulsive scale: I.
Development, use, and reliability. Arch. Gen. Psychiatry 46, 1006–1011. doi:10.1001/archpsyc.1989.01810110048007
Göttlich, M., Krämer, U. M., Kordon, A., Hohagen, F., and Zurowski, B. (2014).Decreased limbic and increased fronto-parietal connectivity in unmedicatedpatients with obsessive-compulsive disorder. Hum. Brain Mapp. 35, 5617–5632.doi: 10.1002/hbm.22574
Gramfort, A., Luessi, M., Larson, E., Engemann, D. A., Strohmeier, D., Brodbeck,C., et al. (2013). MEG and EEG data analysis with MNE-Python. Front.Neurosci. 7:267. doi: 10.3389/fnins.2013.00267
Gratton, G., Coles, M. G., and Donchin, E. (1992). Optimizing the use ofinformation: strategic control of activation of responses. J. Exp. Psychol. Gen.121, 480–506. doi: 10.1037/0096-3445.121.4.480
Graybiel, A. M., and Rauch, S. L. (2000). Toward a neurobiology of obsessive-compulsive disorder. Neuron 28, 343–347. doi: 10.1016/s0896-6273(00)00113-6
Greenberg, B. D., Gabriels, L. A., Malone, D. A., Rezai, A. R., Friehs, G. M., Okun,M. S., et al. (2010). Deep brain stimulation of the ventral internal capsule/ventralstriatum for obsessive-compulsive disorder: worldwide experience. Mol.Psychiatry 15, 64–79.
Grossman, N., Bono, D., Dedic, N., Kodandaramaiah, S. B., Rudenko, A., Suk, H. J.,et al. (2017). Noninvasive deep brain stimulation via temporally interferingelectric fields. Cell 169, 1029–1041. doi: 10.1016/j.cell.2017.05.024
Gürsel, D. A., Avram, M., Sorg, C., Brandl, F., and Koch, K. (2018). Frontoparietalareas link impairments of large-scale intrinsic brain networks with aberrantfronto-striatal interactions in OCD: a meta-analysis of resting-state functionalconnectivity. Neurosci. Biobehav. Rev. 87, 151–160. doi: 10.1016/j.neubiorev.2018.01.016
Haber, S. N. (2003). The primate basal ganglia: parallel and integrative networks.J. Chem. Neuroanat. 26, 317–330. doi: 10.1016/j.jchemneu.2003.10.003
Harrison, B. J., Soriano-Mas, C., Pujol, J., Ortiz, H., López-Solà, M., Hernández-Ribas, R., et al. (2009). Altered corticostriatal functional connectivity inobsessive-compulsive disorder. Arch. Gen. Psychiatry 66, 1189–1200. doi: 10.1001/archgenpsychiatry.2009.152
Hazari, N., Narayanaswamy, J. C., and Venkatasubramanian, G. (2019).Neuroimaging findings in obsessive–compulsive disorder: a narrative reviewto elucidate neurobiological underpinnings. Indian J. Psychiatry 61(Suppl. 1),S9–S29.
Huang, Y., Cheeran, B., Green, A. L., Denison, T. J., and Aziz, T. Z. (2019).Applying a sensing-enabled system for ensuring safe anterior cingulate deepbrain stimulation for pain. Brain Sci. 9:150. doi: 10.3390/brainsci9070150
Karas, P. J., Lee, S., Jimenez-Shahed, J., Goodman, W. K., Viswanathan, A.,and Sheth, S. A. (2019). Deep brain stimulation for obsessive compulsivedisorder: evolution of surgical stimulation target parallels changing model ofdysfunctional brain circuits. Front. Neurosci. 12:998. doi: 10.3389/fnins.2018.00998
Klein, E., Goering, S., Gagne, J., Shea, C. V., Franklin, R., Zorowitz, S., et al. (2016).Brain-computer interface-based control of closed-loop brain stimulation:attitudes and ethical considerations. Brain Comput. Interfaces 3, 140–148. doi:10.1080/2326263x.2016.1207497
Kleiner, M., Brainard, D., and Pelli, D. (2007). What’s new in Psychtoolbox-3.Perception 36, 1–16.
Kopell, B. H., Halverson, J., Butson, C. R., Dickinson, M., Bobholz, J., Harsch, H.,et al. (2011). Epidural cortical stimulation of the left dorsolateral prefrontalcortex for refractory major depressive disorder. Neurosurgery 69, 1015–1029.doi: 10.1227/neu.0b013e318229cfcd
Koran, L. M., Thienemann, M. L., and Davenport, R. (1996). Quality of life forpatients with obsessive-compulsive disorder. Am. J. Psychiatry 153, 783–788.doi: 10.1176/ajp.153.6.783
Krack, P., Hariz, M. I., Baunez, C., Guridi, J., and Obeso, J. A. (2010). Deep brainstimulation: from neurology to psychiatry? Trends Neurosci. 33, 474–484.
Kühn, A. A., Kempf, F., Brücke, C., Doyle, L. G., Martinez-Torres, I., Pogosyan, A.,et al. (2008). High-frequency stimulation of the subthalamic nucleus suppressesoscillatory β activity in patients with Parkinson’s disease in parallel withimprovement in motor performance. J. Neurosci. 28, 6165–6173. doi: 10.1523/jneurosci.0282-08.2008
Kühn, A. A., Kupsch, A., Schneider, G. H., and Brown, P. (2006). Reduction insubthalamic 8–35 Hz oscillatory activity correlates with clinical improvement in
Frontiers in Human Neuroscience | www.frontiersin.org 20 October 2020 | Volume 14 | Article 569973

fnhum-14-569973 October 19, 2020 Time: 19:18 # 21
Olsen et al. Targeted Network Disruption in OCD
Parkinson’s disease. Eur. J. Neurosci. 23, 1956–1960. doi: 10.1111/j.1460-9568.2006.04717.x
Lapidus, K. A., Kopell, B. H., Ben-Haim, S., Rezai, A. R., and Goodman, W. K.(2013). History of psychosurgery: a psychiatrist’s perspective. World Neurosurg.80, S27.e1–S27.e16.
Luyten, L., Hendrickx, S., Raymaekers, S., Gabriëls, L., and Nuttin, B. (2016).Electrical stimulation in the bed nucleus of the stria terminalis alleviates severeobsessive-compulsive disorder. Mol. Psychiatry 21, 1272–1280. doi: 10.1038/mp.2015.124
Maia, T. V., Cooney, R. E., and Peterson, B. S. (2008). The neural bases of obsessive–compulsive disorder in children and adults. Dev. Psychopathol. 20, 1251–1283.doi: 10.1017/s0954579408000606
Mancebo, M. C., Greenberg, B., Grant, J. E., Pinto, A., Eisen, J. L., Dyck, I., et al.(2008). Correlates of occupational disability in a clinical sample of obsessive-compulsive disorder. Compr. Psychiatry 49, 43–50. doi: 10.1016/j.comppsych.2007.05.016
Mantovani, A., Simpson, H. B., Fallon, B. A., Rossi, S., and Lisanby, S. H.(2010). Randomized sham-controlled trial of repetitive transcranial magneticstimulation in treatment-resistant obsessive–compulsive disorder. Int. J.Neuropsychopharmacol. 13, 217–227. doi: 10.1017/s1461145709990435
Menchón, J. M., Real, E., Alonso, P., Aparicio, M. A., Segalas, C., Plans, G., et al.(2019). A prospective international multi-center study on safety and efficacyof deep brain stimulation for resistant obsessive-compulsive disorder. Mol.Psychiatry. doi: 10.1038/s41380-019-0562-6 [Epub ahead of print].
Milad, M. R., and Rauch, S. L. (2012). Obsessive-compulsive disorder: beyondsegregated cortico-striatal pathways. Trends Cogn. Sci. 16, 43–51. doi: 10.1016/j.tics.2011.11.003
Miller, E. K., Lundqvist, M., and Bastos, A. M. (2018). Working Memory 2.0.Neuron 100, 463–475.
Montgomery, S. A., and Åsberg, M. A. R. I. E. (1979). A new depression scaledesigned to be sensitive to change. Br. J. Psychiatry 134, 382–389. doi: 10.1192/bjp.134.4.382
Nakano, K., Kayahara, T., Tsutsumi, T., and Ushiro, H. (2000). Neural circuits andfunctional organization of the striatum. J. Neurol. 247(Suppl 5), V1–V15.
Nolte, G., Bai, O., Wheaton, L., Mari, Z., Vorbach, S., and Hallett, M. (2004).Identifying true brain interaction from EEG data using the imaginary part ofcoherency. Clin. Neurophysiol. 115, 2292–2307. doi: 10.1016/j.clinph.2004.04.029
Nuttin, B., Cosyns, P., Demeulemeester, H., Gybels, J., and Meyerson, B. (1999).Electrical stimulation in anterior limbs of internal capsules in patients withobsessive-compulsive disorder. Lancet 354:1526. doi: 10.1016/s0140-6736(99)02376-4
Obeso, J. A., Rodríguez-Oroz, M. C., Benitez-Temino, B., Blesa, F. J., Guridi,J., Marin, C., et al. (2008). Functional organization of the basal ganglia:therapeutic implications for Parkinson’s disease. Mov. Disord. 23(Suppl 3),S548–S559.
Oswal, A., Beudel, M., Zrinzo, L., Limousin, P., Hariz, M., Foltynie, T., et al. (2016).Deep brain stimulation modulates synchrony within spatially and spectrallydistinct resting state networks in Parkinson’s disease. Brain 139, 1482–1496.doi: 10.1093/brain/aww048
Padilla-Coreano, N., Canetta, S., Mikofsky, R. M., Alway, E., Passecker,J., Myroshnychenko, M. V., et al. (2019). Hippocampal-prefrontal thetatransmission regulates avoidance behavior. Neuron 104, 601–610. doi: 10.1016/j.neuron.2019.08.006
Pallanti, S., Hollander, E., Bienstock, C., Koran, L., Leckman, J., Marazziti,D., et al. (2002). Treatment non-response in OCD: methodologicalissues and operational definitions. Int. J. Neuropsychopharmacol. 5,181–191.
Papakostas, G. I., Petersen, T., Pava, J., Masson, E., Worthington, J. J. III, Alpert,J. E., et al. (2005). Hopelessness and suicidal ideation in outpatients withtreatment-resistant depression: prevalence and impact on treatment outcome.Focus 191, 444–145. doi: 10.1097/01.nmd.0000081591.46444.97
Parent, A., and Hazrati, L. N. (1995). Functional anatomy of the basal ganglia.I. The cortico-basal ganglia-thalamo-cortical loop. Brain Res. Rev. 20, 91–127.doi: 10.1016/0165-0173(94)00007-c
Pedregosa, F., Varoquaux, G., Gramfort, A., Michel, V., Thirion, B., Grisel, O.,et al. (2011). Scikit-learn: machine learning in python. J. Mach. Learn. Res. 12,2825–2830.
Posner, J., Marsh, R., Maia, T. V., Peterson, B. S., Gruber, A., and Simpson,H. B. (2014). Reduced functional connectivity within the limbic cortico-striato-thalamo-cortical loop in unmedicated adults with obsessive-compulsivedisorder. Hum. Brain Mapp. 35, 2852–2860. doi: 10.1002/hbm.22371
Rasmussen, S. A., Noren, G., Greenberg, B. D., Marsland, R., McLaughlin, N. C.,Malloy, P. J., et al. (2018). Gamma ventral capsulotomy in intractable obsessive-compulsive disorder. Biol. Psychiatry 84, 355–364. doi: 10.1016/j.biopsych.2017.11.034
Rauch, S. L., Dougherty, D. D., Malone, D., Rezai, A., Friehs, G., Fischman, A. J.,et al. (2006). A functional neuroimaging investigation of deep brain stimulationin patients with obsessive–compulsive disorder. J. Neurosurg. 104, 558–565.
Ray, N. J., Jenkinson, N., Wang, S., Holland, P., Brittain, J. S., Joint, C., et al.(2008). Local field potential beta activity in the subthalamic nucleus of patientswith Parkinson’s disease is associated with improvements in bradykinesia afterdopamine and deep brain stimulation. Exp. Neurol. 213, 108–113. doi: 10.1016/j.expneurol.2008.05.008
Raymaekers, S., Vansteelandt, K., Luyten, L., Bervoets, C., Demyttenaere, K.,Gabriëls, L., et al. (2017). Long-term electrical stimulation of bed nucleus ofstria terminalis for obsessive-compulsive disorder. Mol. Psychiatry 22, 931–934.doi: 10.1038/mp.2016.124
Robbins, T. W., Gillan, C. M., Smith, D. G., de Wit, S., and Ersche, K. D. (2012).Neurocognitive endophenotypes of impulsivity and compulsivity: towardsdimensional psychiatry. Trends Cogn. Sci. 16, 81–91. doi: 10.1016/j.tics.2011.11.009
Robbins, T. W., Vaghi, M. M., and Banca, P. (2019). Obsessive-compulsivedisorder: puzzles and prospects. Neuron 102, 27–47. doi: 10.1016/j.neuron.2019.01.046
Rosanova, M., Fecchio, M., Casarotto, S., Sarasso, S., Casali, A. G., Pigorini, A., et al.(2018). Sleep-like cortical OFF-periods disrupt causality and complexity in thebrain of unresponsive wakefulness syndrome patients. Nat. Commun. 9:4427.
Sheth, S. A., Mian, M. K., Patel, S. R., Asaad, W. F., Williams, Z. M.,Dougherty, D. D., et al. (2012). Human dorsal anterior cingulate cortex neuronsmediate ongoing behavioural adaptation. Nature 488, 218–221. doi: 10.1038/nature11239
Shiffman, S., Stone, A. A., and Hufford, M. R. (2008). Ecological momentaryassessment. Annu. Rev. Clin. Psychol. 4, 1–32.
Shin, N. Y., Lee, T. Y., Kim, E., and Kwon, J. S. (2014). Cognitive functioning inobsessive-compulsive disorder: a meta-analysis. Psychol. Med. 44, 1121–1130.doi: 10.1017/s0033291713001803
Spatola, G., Martinez-Alvarez, R., Martínez-Moreno, N., Rey, G., Linera, J., Rios-Lago, M., et al. (2018). Results of Gamma Knife anterior capsulotomy forrefractory obsessive-compulsive disorder: results in a series of 10 consecutivepatients. J. Neurosurg. 131, 376–383. doi: 10.3171/2018.4.jns171525
Stam, C. J., Nolte, G., and Daffertshofer, A. (2007). Phase lag index: assessmentof functional connectivity from multi channel EEG and MEG with diminishedbias from common sources. Hum. Brain Mapp. 28, 1178–1193. doi: 10.1002/hbm.20346
Stanslaski, S., Afshar, P., Cong, P., Giftakis, J., Stypulkowski, P., Carlson, D.,et al. (2012). Design and validation of a fully implantable, chronic, closed-loopneuromodulation device with concurrent sensing and stimulation. IEEE Trans.Neural Syst. Rehabil. Eng. 20, 410–421. doi: 10.1109/tnsre.2012.2183617
Stinstra, J. G., and Peters, M. J. (1998). The volume conductor may act as atemporal filter on the ECG and EEG. Med. Biol. Eng. Comput. 36, 711–716.doi: 10.1007/bf02518873
Swann, N. C., de Hemptinne, C., Miocinovic, S., Qasim, S., Ostrem, J. L.,Galifianakis, N. B., et al. (2017). Chronic multisite brain recordings from atotally implantable bidirectional neural interface: experience in 5 patients withParkinson’s disease. J. Neurosurg. 128, 605–616. doi: 10.3171/2016.11.jns161162
Swann, N. C., de Hemptinne, C., Miocinovic, S., Qasim, S., Wang, S. S., Ziman, N.,et al. (2016). Gamma oscillations in the hyperkinetic state detected with chronichuman brain recordings in Parkinson’s disease. J. Neurosci. 36, 6445–6458.doi: 10.1523/jneurosci.1128-16.2016
Vaghi, M. M., Vértes, P. E., Kitzbichler, M. G., Apergis-Schoute, A. M., vander Flier, F. E., Fineberg, N. A., et al. (2017). Specific frontostriatal circuitsfor impaired cognitive flexibility and goal-directed planning in obsessive-compulsive disorder: evidence from resting-state functional connectivity. Biol.Psychiatry 81, 708–717. doi: 10.1016/j.biopsych.2016.08.009
Frontiers in Human Neuroscience | www.frontiersin.org 21 October 2020 | Volume 14 | Article 569973

fnhum-14-569973 October 19, 2020 Time: 19:18 # 22
Olsen et al. Targeted Network Disruption in OCD
van Westen, M., Rietveld, E., Bergfeld, I. O., de Koning, P., Vullink, N., Ooms,P., et al. (2020). Optimizing deep brain stimulation parameters in obsessive–compulsive disorder. Neuromodulation. doi: 10.1111/ner.13243
Veerakumar, A., Tiruvadi, V., Howell, B., Waters, A. C., Crowell, A. L., Voytek, B.,et al. (2019). Field potential 1/f activity in the subcallosal cingulate region as acandidate signal for monitoring deep brain stimulation for treatment-resistantdepression. J. Neurophysiol. 122, 1023–1035. doi: 10.1152/jn.00875.2018
Vinck, M., Oostenveld, R., Van Wingerden, M., Battaglia, F., and Pennartz, C. M.(2011). An improved index of phase-synchronization for electrophysiologicaldata in the presence of volume-conduction, noise and sample-size bias.Neuroimage 55, 1548–1565. doi: 10.1016/j.neuroimage.2011.01.055
Voon, V., Derbyshire, K., Rück, C., Irvine, M. A., Worbe, Y., Enander, J., et al.(2015). Disorders of compulsivity: a common bias towards learning habits. Mol.Psychiatry 20, 345–352. doi: 10.1038/mp.2014.44
Walz, L. C., Nauta, M. H., and Aan Het Rot, M. (2014). Experience samplingand ecological momentary assessment for studying the daily lives of patientswith anxiety disorders: a systematic review. J. Anxiety Disord. 28, 925–937.doi: 10.1016/j.janxdis.2014.09.022
Widge, A. S., Dougherty, D. D., and Marks, W. J. Jr. (eds) (2019). “Managingpatients with psychiatric disorders with deep brain stimulation,” in Deep BrainStimulation Management, 2nd Edn, (Cambridge: Cambridge University Press).
Widge, A. S., Malone, D. A. Jr., and Dougherty, D. D. (2018). Closing the loopon deep brain stimulation for treatment-resistant depression. Front. Neurosci.12:175. doi: 10.3389/fnins.2018.00175
Widge, A. S., and Miller, E. K. (2019). Targeting cognition and networks throughneural oscillations: next-generation clinical brain stimulation. JAMA Psychiatry76, 671–672. doi: 10.1001/jamapsychiatry.2019.0740
Widge, A. S., Zorowitz, S., Basu, I., Paulk, A. C., Cash, S. S., Eskandar,E. N., et al. (2019). Deep brain stimulation of the internal capsule enhanceshuman cognitive control and prefrontal cortex function. Nat. Commun.10:1536.
Williams, N. R., Short, E. B., Hopkins, T., Bentzley, B. S., Sahlem, G. L., Pannu,J., et al. (2016). Five-year follow-up of bilateral epidural prefrontal corticalstimulation for treatment-resistant depression. Brain Stimul. 9, 897–904. doi:10.1016/j.brs.2016.06.054
Wingeier, B., Tcheng, T., Koop, M. M., Hill, B. C., Heit, G., and Bronte-Stewart, H. M. (2006). Intra-operative STN DBS attenuates the prominent beta
rhythm in the STN in Parkinson’s disease. Exp. Neurol. 197, 244–251. doi:10.1016/j.expneurol.2005.09.016
Wojtecki, L., Hirschmann, J., Elben, S., Boschheidgen, M., Trenado, C., Vesper,J., et al. (2017). Oscillatory coupling of the subthalamic nucleus in obsessivecompulsive disorder. Brain 140:e56. doi: 10.1093/brain/ awx164
Yalcin, I., and Bump, R. C. (2003). Validation of two global impressionquestionnaires for incontinence. Am. J. Obstet. Gynecol. 189, 98–101. doi:10.1067/mob.2003.379
Conflict of Interest: AW, DD, and TD are named inventors on patent applicationsrelated to deep brain stimulation and oscillations, including at least one applicationrelated to the subject of this paper. AW and DD have received consulting incomeand/or research support from Medtronic, which manufactured the devices usedin this study. Medtronic had no financial or technical involvement with thisspecific research. TD discloses honoraria, consultation fees, and/or royalties fromthe MGH Psychiatry Academy, BrainCells Inc., Clintara, LLC., Systems Researchand Applications Corporation, Boston University, the Catalan Agency forHealth Technology Assessment and Research, the National Association of SocialWorkers Massachusetts, the Massachusetts Medical Society, Tufts University,NIDA, NIMH, and Oxford University Press. None of those entities manufacturestechnology or products used in the study.
The remaining authors declare that the research was conducted in the absence ofany commercial or financial relationships that could be construed as a potentialconflict of interest.
The reviewer SS declared a past co-authorship with several of the authors DD, andAW to the handling editor.
Copyright © 2020 Olsen, Basu, Bilge, Kanabar, Boggess, Rockhill, Gosai, Hahn,Peled, Ennis, Shiff, Fairbank-Haynes, Salvi, Cusin, Deckersbach, Williams, Baker,Dougherty and Widge. This is an open-access article distributed under the termsof the Creative Commons Attribution License (CC BY). The use, distribution orreproduction in other forums is permitted, provided the original author(s) and thecopyright owner(s) are credited and that the original publication in this journalis cited, in accordance with accepted academic practice. No use, distribution orreproduction is permitted which does not comply with these terms.
Frontiers in Human Neuroscience | www.frontiersin.org 22 October 2020 | Volume 14 | Article 569973