Embed Size (px)
Citation preview
CascadiaGPSAnalysisTeacherInformationandAnswerKey Page1
CascadiaGPSAnalysis:TeacherInformationTechnologyisamazing.TheGlobalPositioningSystem,knownasGPS,hasbeenaroundformanyyears,anditsapplicationsaremany.Inanutshell,GPScanbeusedtolocatewhereyouareontheEarthwithinafewmeters,andpeoplearemostfamiliarwithGPSunitsincarstohelpwithdirections,orforrecreation,likehiking.AspecifictypeofGPScalleddifferentialGPS,ordGPS,isextremelypreciseandcanbeusedtoshowtectonicplatemovementofmillimeters!
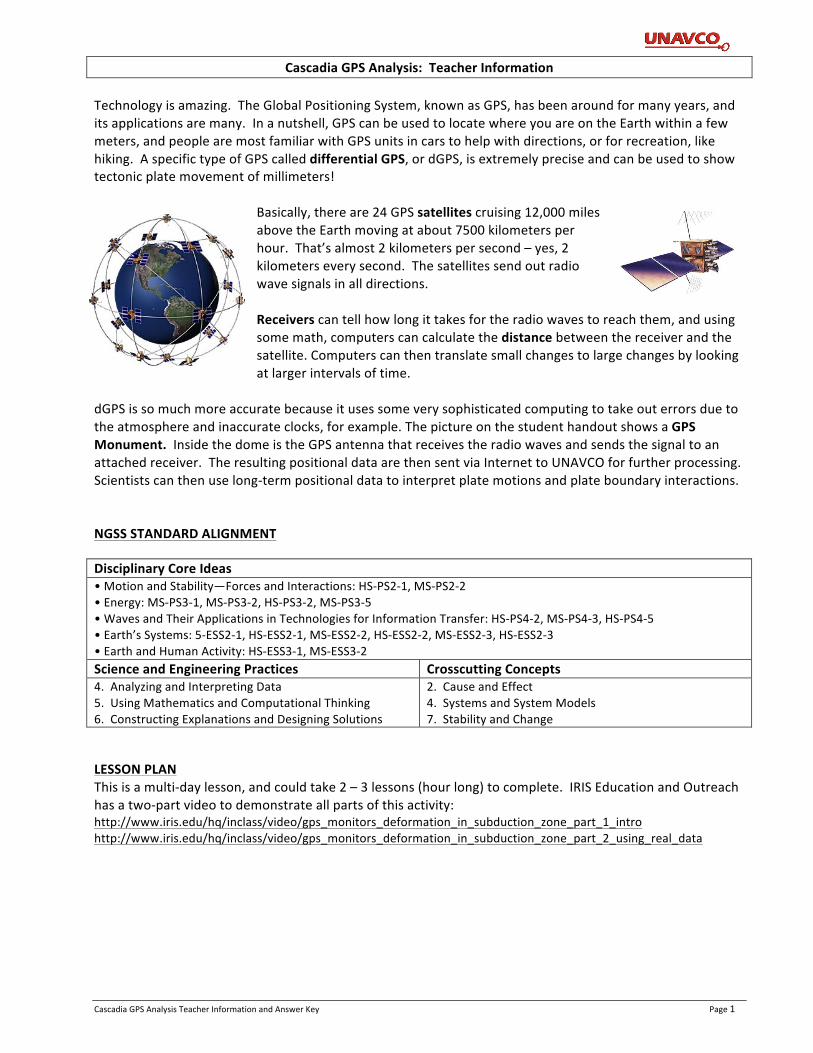
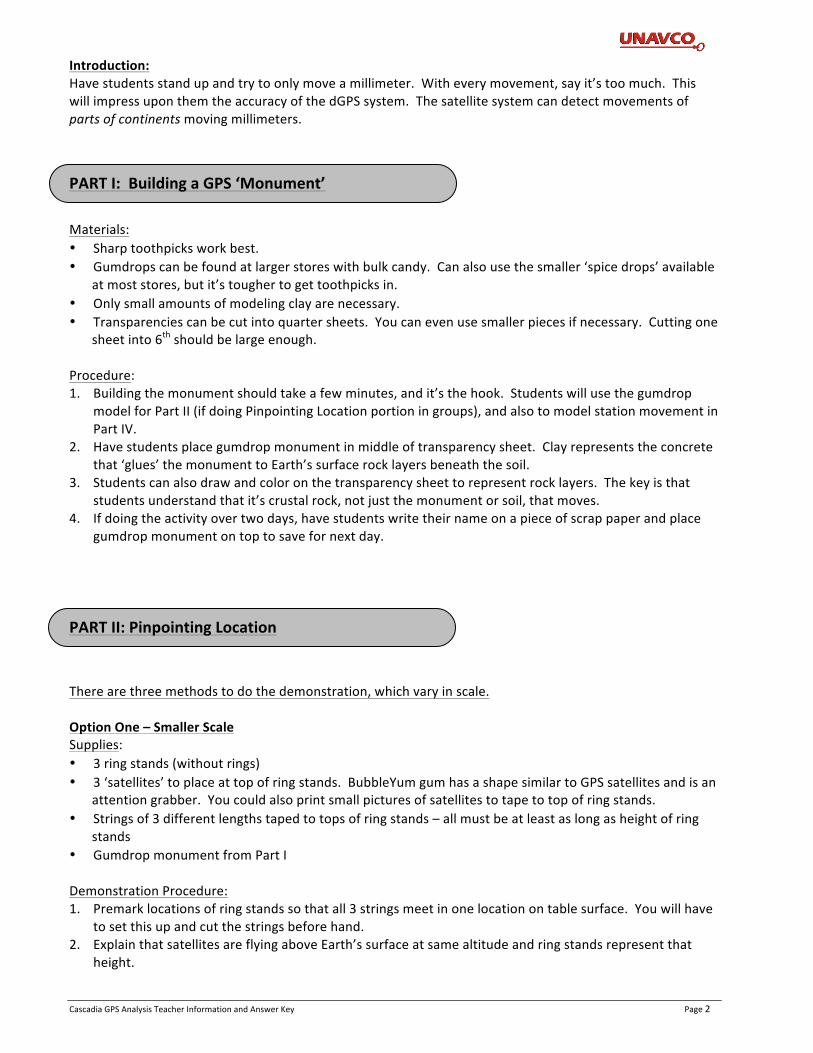
Basically,thereare24GPSsatellitescruising12,000milesabovetheEarthmovingatabout7500kilometersperhour.That’salmost2kilometerspersecond–yes,2kilometerseverysecond.Thesatellitessendoutradiowavesignalsinalldirections.Receiverscantellhowlongittakesfortheradiowavestoreachthem,andusingsomemath,computerscancalculatethedistancebetweenthereceiverandthesatellite.Computerscanthentranslatesmallchangestolargechangesbylookingatlargerintervalsoftime.
dGPSissomuchmoreaccuratebecauseitusessomeverysophisticatedcomputingtotakeouterrorsduetotheatmosphereandinaccurateclocks,forexample.ThepictureonthestudenthandoutshowsaGPSMonument.InsidethedomeistheGPSantennathatreceivestheradiowavesandsendsthesignaltoanattachedreceiver.TheresultingpositionaldataarethensentviaInternettoUNAVCOforfurtherprocessing.Scientistscanthenuselong-termpositionaldatatointerpretplatemotionsandplateboundaryinteractions.NGSSSTANDARDALIGNMENTDisciplinaryCoreIdeas•MotionandStability—ForcesandInteractions:HS-PS2-1,MS-PS2-2•Energy:MS-PS3-1,MS-PS3-2,HS-PS3-2,MS-PS3-5•WavesandTheirApplicationsinTechnologiesforInformationTransfer:HS-PS4-2,MS-PS4-3,HS-PS4-5•Earth’sSystems:5-ESS2-1,HS-ESS2-1,MS-ESS2-2,HS-ESS2-2,MS-ESS2-3,HS-ESS2-3•EarthandHumanActivity:HS-ESS3-1,MS-ESS3-2ScienceandEngineeringPractices CrosscuttingConcepts4.AnalyzingandInterpretingData5.UsingMathematicsandComputationalThinking6.ConstructingExplanationsandDesigningSolutions
2.CauseandEffect4.SystemsandSystemModels7.StabilityandChange
LESSONPLANThisisamulti-daylesson,andcouldtake2–3lessons(hourlong)tocomplete.IRISEducationandOutreachhasatwo-partvideotodemonstrateallpartsofthisactivity:http://www.iris.edu/hq/inclass/video/gps_monitors_deformation_in_subduction_zone_part_1_introhttp://www.iris.edu/hq/inclass/video/gps_monitors_deformation_in_subduction_zone_part_2_using_real_data
CascadiaGPSAnalysisTeacherInformationandAnswerKey Page2
Introduction:Havestudentsstandupandtrytoonlymoveamillimeter.Witheverymovement,sayit’stoomuch.ThiswillimpressuponthemtheaccuracyofthedGPSsystem.Thesatellitesystemcandetectmovementsofpartsofcontinentsmovingmillimeters.
PARTI:BuildingaGPS‘Monument’
Materials:• Sharptoothpicksworkbest.• Gumdropscanbefoundatlargerstoreswithbulkcandy.Canalsousethesmaller‘spicedrops’available
atmoststores,butit’stoughertogettoothpicksin.• Onlysmallamountsofmodelingclayarenecessary.• Transparenciescanbecutintoquartersheets.Youcanevenusesmallerpiecesifnecessary.Cuttingone
sheetinto6thshouldbelargeenough.Procedure:1. Buildingthemonumentshouldtakeafewminutes,andit’sthehook.Studentswillusethegumdrop
modelforPartII(ifdoingPinpointingLocationportioningroups),andalsotomodelstationmovementinPartIV.
2. Havestudentsplacegumdropmonumentinmiddleoftransparencysheet.Clayrepresentstheconcretethat‘glues’themonumenttoEarth’ssurfacerocklayersbeneaththesoil.
3. Studentscanalsodrawandcoloronthetransparencysheettorepresentrocklayers.Thekeyisthatstudentsunderstandthatit’scrustalrock,notjustthemonumentorsoil,thatmoves.
4. Ifdoingtheactivityovertwodays,havestudentswritetheirnameonapieceofscrappaperandplacegumdropmonumentontoptosavefornextday.
PARTII:PinpointingLocation
Therearethreemethodstodothedemonstration,whichvaryinscale.OptionOne–SmallerScaleSupplies:• 3ringstands(withoutrings)• 3‘satellites’toplaceattopofringstands.BubbleYumgumhasashapesimilartoGPSsatellitesandisan
attentiongrabber.Youcouldalsoprintsmallpicturesofsatellitestotapetotopofringstands.• Stringsof3differentlengthstapedtotopsofringstands–allmustbeatleastaslongasheightofring
stands• GumdropmonumentfromPartIDemonstrationProcedure:1. Premarklocationsofringstandssothatall3stringsmeetinonelocationontablesurface.Youwillhave
tosetthisupandcutthestringsbeforehand.2. ExplainthatsatellitesareflyingaboveEarth’ssurfaceatsamealtitudeandringstandsrepresentthat
height.
CascadiaGPSAnalysisTeacherInformationandAnswerKey Page3
3. Explainrelationshipbetweengumdropmonument(builtinPartI)andsatellite–they‘talk’toeachotherandestablishthedistancebetweenthem.
4. Thestringrepresentsthedistancebetweenthesatelliteandmonument.5. Haveastudentcomeandmoveonestring(heldtautly)inalldirectionstoindicatethatthedistanceis
known,butthedirectionisn’t.Aspherearoundthetopoftheringstandisestablishedwithradiusequalingthedistancefromthesatellite.
6. Haveanotherstudentmovea2ndstringaroundandnotewherestringsintersect–thereisacircleofpossibleplacesthishappens.Emphasizeagainthattheonlyknownentityisthedistancebetweenthemonumentandsatellite.
7. Haveathirdstudentmovethe3rdstringtoshowwhereall3stringsintersect.Thereshouldbetwoplaces–oneonEarth’ssurfaceandoneinspace–whereall3stringsintersect.Notethatcomputerscanautomaticallydetectthattheoneinspaceisnon-sensical.
8. Placethegumdropatthepointwhere3stringsintersect.9. Remindstudentsthatthesemeasurementsaretakingplacewhilesatellitesaremovingat2
kilometers/second!10. HavestudentscompletePartIIquestionsonworksheet.Note:activitycanbedoneingroupsfollowingsamedirections.
OptionTwo–LargerScaleSupplies:• 3longlengthsoftwine(constructiontwineworksfine)thatwillreachfromhighuponthewallstoa
centralpointsomewhereintheroom.• Tapetoholduptwineonwall.• 3‘satellites’toplaceattopofringstands.BubbleYumgumstillwillwork.Youcouldalsoprintlarger
picturesofsatellitestotapeonthewalls.• GumdropmonumentfromPartI,oralargerversionofaGPSmonument.DemonstrationProcedure:11. Tapeendsofstringsonwallssothatall3stringsmeetinonelocationsomewhereonthefloorofthe
room.Youwillhavetosetthisupandcutthestringsbeforehand.12. Coilupthelongstringsandtapethemuponthewallsoyoucaneasilypullthemdownandhandtoa
student.13. Followsameprocedureasaboveforlocatingthethreeplaceswhereall3strings(distances)meet.
OptionThree–LargestScaleDemonstrationProcedure:14. PresentdemonstrationjustaswithOptionTwoabove,onlyusemuchlongerstringandusethegymor
outdoorbasketballhoops.
Hereisavideoyoucouldalsouse:
https://www.youtube.com/watch?v=IoRQiNFzT0k
CascadiaGPSAnalysisTeacherInformationandAnswerKey Page4
PARTIII:MeasuringCascadiaGPS/TectonicMovement
Procedure:
1. Reviewmetricsystem(millimeter,centimeter,meter,kilometer).2. Reviewcardinaldirections.3. TherearehundredsofdGPSstationsinoperation.4. Instructstudentshowto‘read’aTSP.UseexamplefromPacificBeachasexampletodoaswhole
class.5. Verticalisnotusedbecauseitismoredifficulttodetermineachangeinaltitude.Imagineasatellite
overheadlookingforside-to-sidemotion,andthentryingtodetermineverticalmotion.Itwouldbemuchmoredifficulttoseetheup/downmotion.
6. Witharuler,drawalineofbestfittoshowtrendofTSP.Trytodrawthelinesothatthereareanequalnumberofpointsaboveandbelowtheline.Usingaclearrulerworksbest.
7. Usingy-axismmscale,determineoverallchangeinpositioningiventimeperiod.8. Calculateannualmovementbydividingoverallchangeinpositionbytotaltimeperiod.
DetailonInterpretingTimeSeriesPlots(TSP)
a) AllplotshaveaY-axiswith‘zero’andpositivenumbersabovethelineandnegativenumbersbelowtheline.Numberlesstickmarksontherightmirrorthemeasurements.
b) The‘North’plotshowsNorthandSouthmovement–anythingmovinginthe‘positive’(up)directionismovingNorth,andanythingmovinginthe‘negative’oroppositedirectionismovingSouth.
c) ThesameistrueforEast/West–movementinapositivedirectionismovementtotheEast,andanythingmovinginthenegativedirectionismovingWest.
d) Mosttimeseriesdonotincludegridlines,soit’shelpfultousearulerorstraightedge(aclearoneisbest)tocalculatehowmuchmovementthereis.
e) Thescaleontheaxeswillvaryandtheunitsmayvaryaswell.f) UsuallyN/SandE/Wmovementiseasiertoseeapatternwithcomparedtoheight.Butremember
thattherearealotoferrorsthatmustbecorrected,sothedatawon’talwaysbeperfect,orinaclearpattern.
g) Thedataintheexamplesareverylinear–usuallythey’realotmessier.h) Thetimescaleisshownbyyearsandtwelfthsofyears.i) Receiverscollectapositionalmeasurementeverysecond.That’s86,400measurementsaday.These
areaveragedtogetonepointforeachdaythatshowsuponatimeseries.j) Mostplotsnowstartrightat‘0’onthey-axis;whatisimportantisthechangeinposition.However,
sometimesyouwillneedtousethetrendlines,notthepoints,todeterminechangeinposition.k) ThemovementsthatdGPSreceiversshowareverysmall–millimetersorcentimetersatmost.But
justthinkhowmuchmovementthatwouldmeanoverthousandsofyears!Aneasyequivalenttorememberis1mm/yristhesameas1kilometer/1millionyears.
CascadiaGPSAnalysisTeacherInformationandAnswerKey Page5
AnswerstoStudentWorksheetareshownbelowonAnswerKey.
PARTIV:PlottingGPSStationMotionProcedure:1. Followproceduresonstudenthandout.Confusionmayariseaboutscaletranslationofcentimetersto
millimeters.Scaleusedonthegridiscentimeterstomakegraphingeasier.Actualmovementisinmillimetersbutthisisfartoohardtoseeat1:1scale.
2. VectorgraphshouldlookliketheexampleprovidedonAnswerKey.Colorsusedmayvary.3. TheGPSgumdropstationswillmovealongpathofvectors,mimickingthemovementofthetectonic
platewithGPSstationattached.Foraddedeffect,have3studentsputtheirgumdropmodelsonONEmap(page7ofthestudentworksheet)andthensimultaneouslyhavethemmovethegumdropstheappropriatedistancealongthevectorinthesametimeperiod.Althoughcramped,itshowstheshorteningeffectofthewesternmarginquitewell.PARTV:AnalysisofGPSStationMotionThebigpictureresultoftheactivityisthatcoastalstationsofOregonandWashingtonarebeingpushedtowardthenortheastatabout1/2ofthevelocityofJuandeFucaPlatemotionwithrespecttointeriorNorthAmerica.Urbancorridorstations(inWillametteValleyofOregonorPugetLowlandofWashington)arebeingpushedtowardthenortheastatabout1/4ofthevelocityofJuandeFucaPlatemotionwithrespecttointeriorNorthAmerica.StationseastoftheCascadesarenotmovingatallorarebarelymoving.TheclearimplicationisthatcoastalareasaremovingtowardseasternareasastheactivecontinentalmarginisbeingcompressedinSW–NEdirection.StrainisbuildingwithinthePacificNorthwestmarginoftheNorthAmericanPlateastheJuandeFucaPlatepushestheNorthAmericanPlatemargintowardthenortheast.ThisaccumulatingstrainwilleventuallybereleasedinthenextgreatearthquakeontheCascadiaSubductionZone.TheplateboundaryregionsoftheJuandeFucaandNorthAmericanplatesare“lockedandloading”.Furtherimplicationsofthe“lockedandloading”natureofthePacificNorthwestcontinentalmarginareelasticenergywillbestoredupoverlongintervalsoftimeandthensuddenlyreleasedinthenextgreatCascadiaearthquake.Forexample,overtheaverage500yearsrecurrencetimebetweengreatearthquakes,thecoastalstationswillmovenortheastabout7.5meters(25feet).Duringthenextgreatearthquake,thestoredenergyduetotheslowNEmovementwillsuddenlybesuddenlyreleasedasthecoastalareasreboundthesamedistancetowardsthesouthwest.Procedure:1. LeadstudentstoanswersfromobservationsofthePacificNorthwestvectormap.2. Discussbigpictureafterstudentsrealizethattheregionisbeingsqueezed.3. Afurtherdemonstrationistakingapieceofpaperorclothandholdingtherightsideofitstationary,
andthenpushingtheleftsidetowardstheright.Thepaper/clothwillbuckle.
CascadiaGPSAnalysisTeacherInformationandAnswerKey Page6
Name: CASCADIAGPSANALYSISToday’sDate:
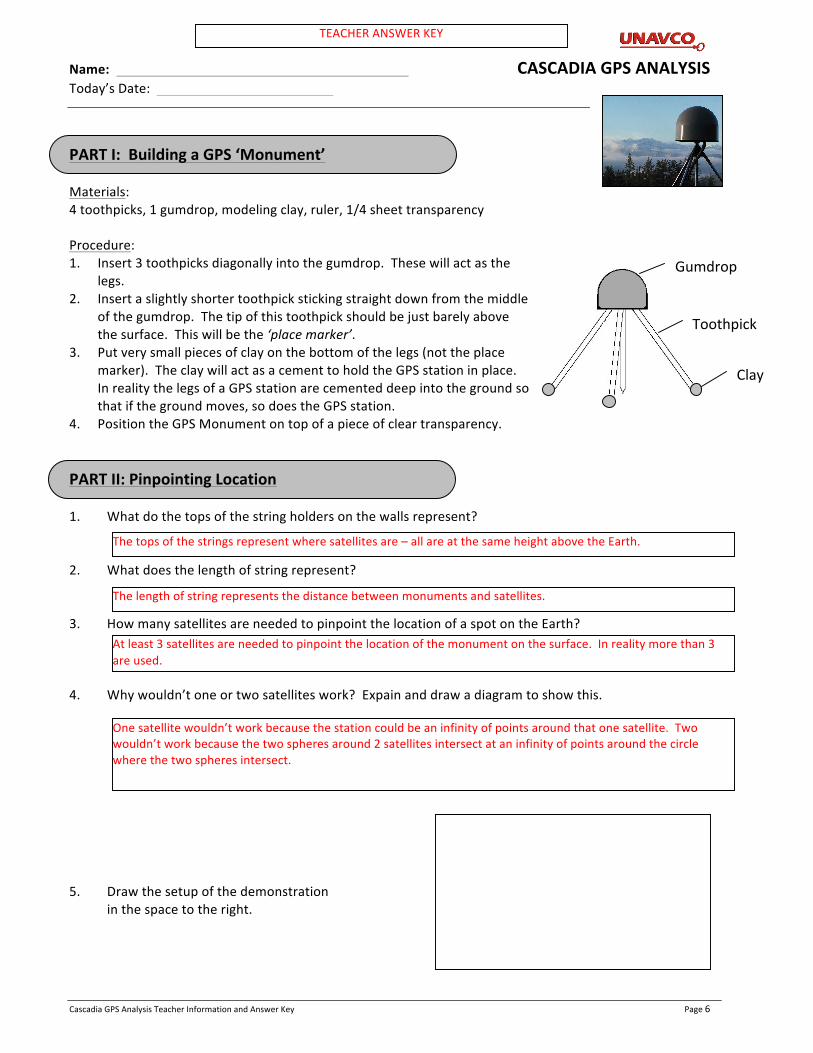
PARTI:BuildingaGPS‘Monument’Materials: 4toothpicks,1gumdrop,modelingclay,ruler,1/4sheettransparencyProcedure: 1. Insert3toothpicksdiagonallyintothegumdrop.Thesewillactasthe
legs.2. Insertaslightlyshortertoothpickstickingstraightdownfromthemiddle
ofthegumdrop.Thetipofthistoothpickshouldbejustbarelyabovethesurface.Thiswillbethe‘placemarker’.
3. Putverysmallpiecesofclayonthebottomofthelegs(nottheplacemarker).TheclaywillactasacementtoholdtheGPSstationinplace.InrealitythelegsofaGPSstationarecementeddeepintothegroundsothatifthegroundmoves,sodoestheGPSstation.
4. PositiontheGPSMonumentontopofapieceofcleartransparency.PARTII:PinpointingLocation1. Whatdothetopsofthestringholdersonthewallsrepresent?2. Whatdoesthelengthofstringrepresent?3. HowmanysatellitesareneededtopinpointthelocationofaspotontheEarth?4. Whywouldn’toneortwosatelliteswork?Expainanddrawadiagramtoshowthis.5. Drawthesetupofthedemonstration inthespacetotheright.
Gumdrop
Toothpick
Clay
TEACHERANSWERKEY
Thetopsofthestringsrepresentwheresatellitesare–allareatthesameheightabovetheEarth.
Thelengthofstringrepresentsthedistancebetweenmonumentsandsatellites.
Atleast3satellitesareneededtopinpointthelocationofthemonumentonthesurface.Inrealitymorethan3areused.
Onesatellitewouldn’tworkbecausethestationcouldbeaninfinityofpointsaroundthatonesatellite.Twowouldn’tworkbecausethetwospheresaround2satellitesintersectataninfinityofpointsaroundthecirclewherethetwospheresintersect.
CascadiaGPSAnalysisTeacherInformationandAnswerKey Page7
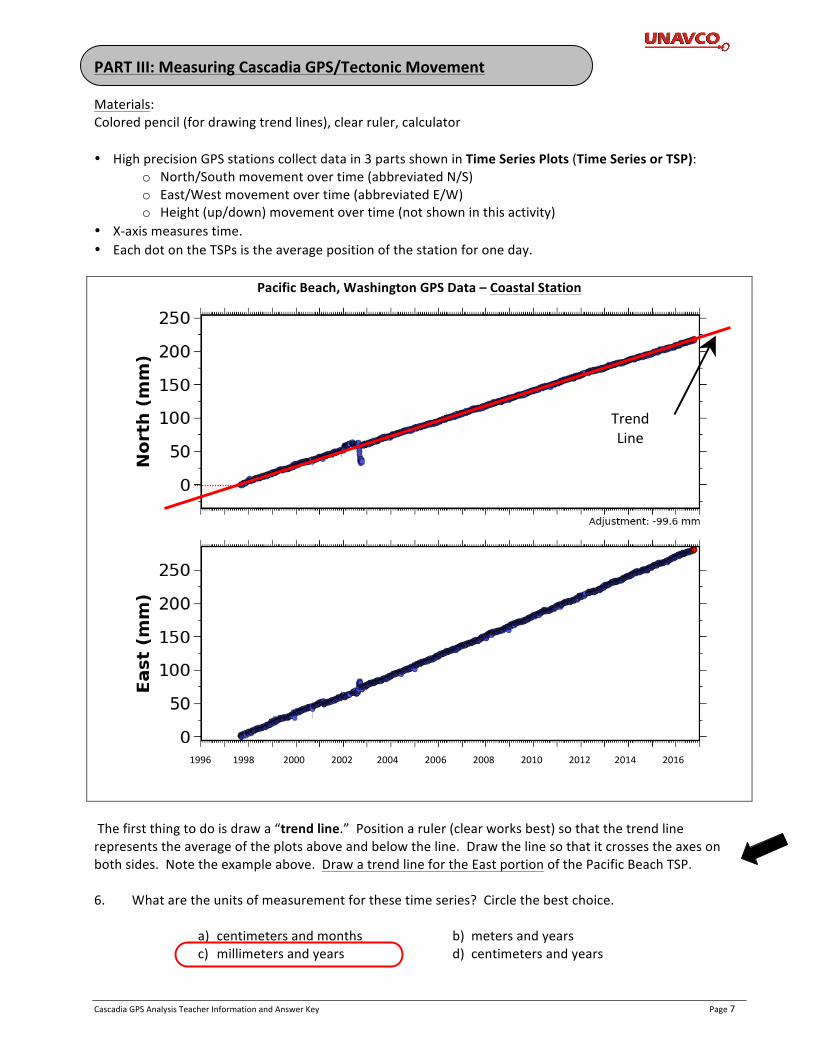
PARTIII:MeasuringCascadiaGPS/TectonicMovementMaterials: Coloredpencil(fordrawingtrendlines),clearruler,calculator• HighprecisionGPSstationscollectdatain3partsshowninTimeSeriesPlots(TimeSeriesorTSP):
o North/Southmovementovertime(abbreviatedN/S)o East/Westmovementovertime(abbreviatedE/W)o Height(up/down)movementovertime(notshowninthisactivity)
• X-axismeasurestime.• EachdotontheTSPsistheaveragepositionofthestationforoneday.
PacificBeach,WashingtonGPSData–CoastalStation
Thefirstthingtodoisdrawa“trendline.”Positionaruler(clearworksbest)sothatthetrendlinerepresentstheaverageoftheplotsaboveandbelowtheline.Drawthelinesothatitcrossestheaxesonbothsides.Notetheexampleabove.DrawatrendlinefortheEastportionofthePacificBeachTSP.6. Whataretheunitsofmeasurementforthesetimeseries?Circlethebestchoice. a) centimetersandmonths b) metersandyears c) millimetersandyears d) centimetersandyears
19961998200020022004200620082010201220142016
TrendLine
CascadiaGPSAnalysisTeacherInformationandAnswerKey Page8
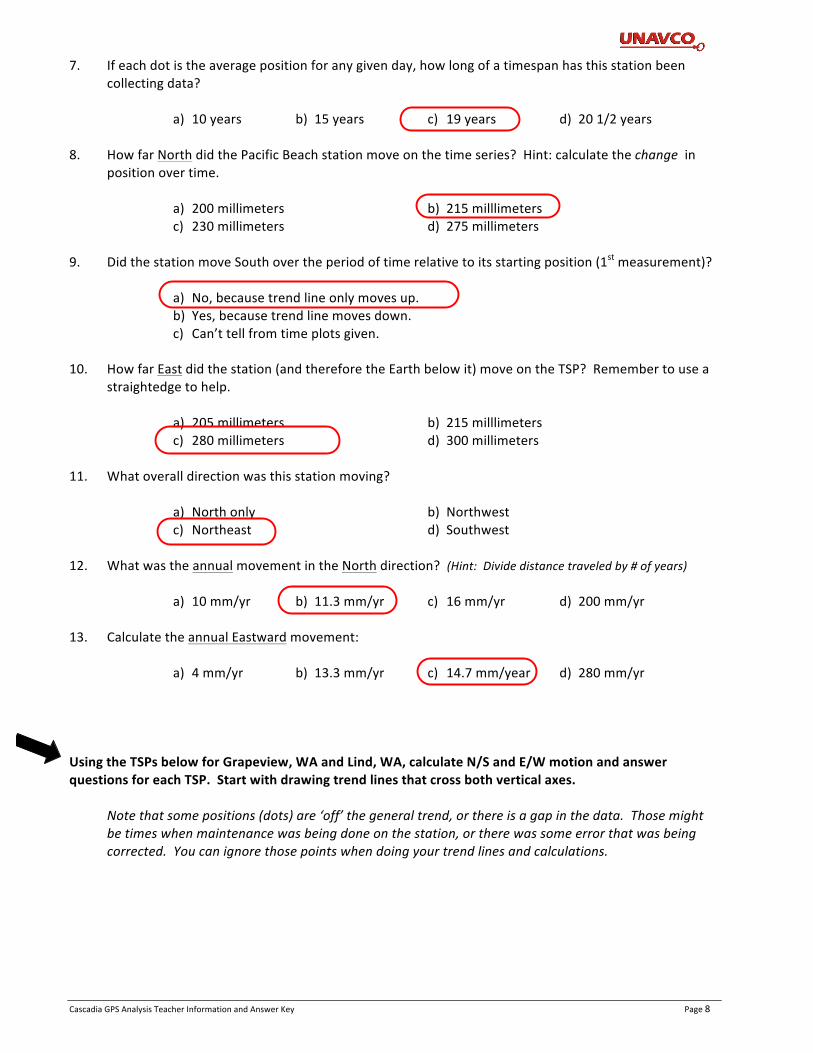
7. Ifeachdotistheaveragepositionforanygivenday,howlongofatimespanhasthisstationbeencollectingdata?
a) 10years b) 15years c) 19years d) 201/2years8. HowfarNorthdidthePacificBeachstationmoveonthetimeseries?Hint:calculatethechangein
positionovertime. a) 200millimeters b) 215milllimeters c) 230millimeters d) 275millimeters9. DidthestationmoveSouthovertheperiodoftimerelativetoitsstartingposition(1stmeasurement)? a) No,becausetrendlineonlymovesup. b) Yes,becausetrendlinemovesdown. c) Can’ttellfromtimeplotsgiven.10. HowfarEastdidthestation(andthereforetheEarthbelowit)moveontheTSP?Remembertousea
straightedgetohelp. a) 205millimeters b) 215milllimeters c) 280millimeters d) 300millimeters11. Whatoveralldirectionwasthisstationmoving? a) Northonly b) Northwest c) Northeast d) Southwest12. WhatwastheannualmovementintheNorthdirection?(Hint:Dividedistancetraveledby#ofyears) a) 10mm/yr b) 11.3mm/yr c) 16mm/yr d) 200mm/yr13. CalculatetheannualEastwardmovement: a) 4mm/yr b) 13.3mm/yr c) 14.7mm/year d) 280mm/yrUsingtheTSPsbelowforGrapeview,WAandLind,WA,calculateN/SandE/WmotionandanswerquestionsforeachTSP.Startwithdrawingtrendlinesthatcrossbothverticalaxes.
Notethatsomepositions(dots)are‘off’thegeneraltrend,orthereisagapinthedata.Thosemightbetimeswhenmaintenancewasbeingdoneonthestation,ortherewassomeerrorthatwasbeingcorrected.Youcanignorethosepointswhendoingyourtrendlinesandcalculations.
CascadiaGPSAnalysisTeacherInformationandAnswerKey Page9
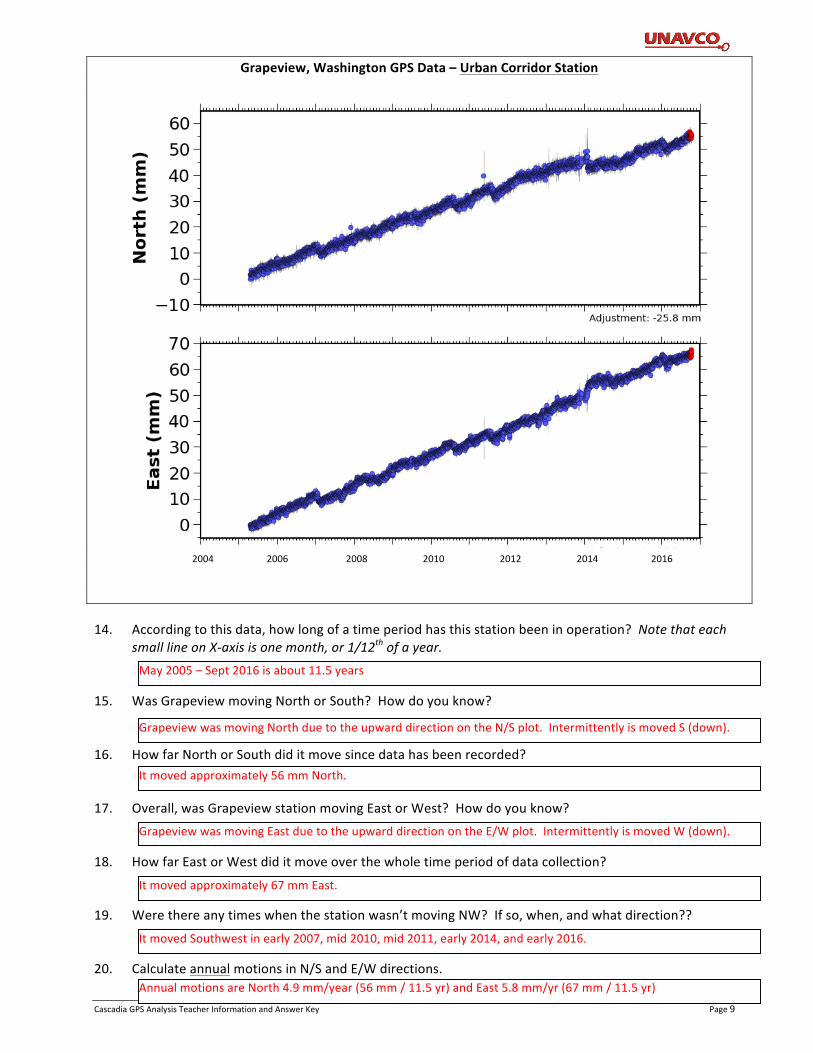
Grapeview,WashingtonGPSData–UrbanCorridorStation
14. Accordingtothisdata,howlongofatimeperiodhasthisstationbeeninoperation?Notethateach
smalllineonX-axisisonemonth,or1/12thofayear.15. WasGrapeviewmovingNorthorSouth?Howdoyouknow?16. HowfarNorthorSouthdiditmovesincedatahasbeenrecorded?17. Overall,wasGrapeviewstationmovingEastorWest?Howdoyouknow?18. HowfarEastorWestdiditmoveoverthewholetimeperiodofdatacollection?19. Werethereanytimeswhenthestationwasn’tmovingNW?Ifso,when,andwhatdirection??20. CalculateannualmotionsinN/SandE/Wdirections.
2004200620082010201220142016
May2005–Sept2016isabout11.5years
GrapeviewwasmovingNorthduetotheupwarddirectionontheN/Splot.IntermittentlyismovedS(down).
Itmovedapproximately56mmNorth.
GrapeviewwasmovingEastduetotheupwarddirectionontheE/Wplot.IntermittentlyismovedW(down).
Itmovedapproximately67mmEast.
ItmovedSouthwestinearly2007,mid2010,mid2011,early2014,andearly2016.
AnnualmotionsareNorth4.9mm/year(56mm/11.5yr)andEast5.8mm/yr(67mm/11.5yr)
CascadiaGPSAnalysisTeacherInformationandAnswerKey Page10
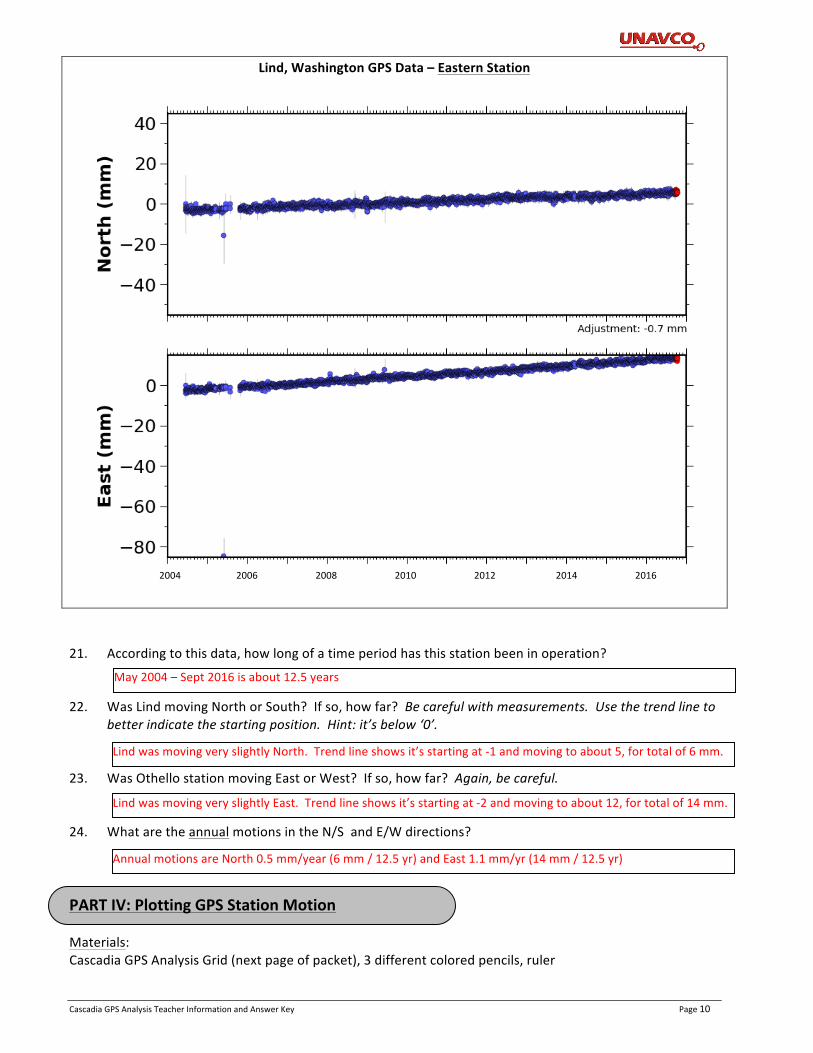
Lind,WashingtonGPSData–EasternStation
21. Accordingtothisdata,howlongofatimeperiodhasthisstationbeeninoperation?22. WasLindmovingNorthorSouth?Ifso,howfar?Becarefulwithmeasurements.Usethetrendlineto
betterindicatethestartingposition.Hint:it’sbelow‘0’.23. WasOthellostationmovingEastorWest?Ifso,howfar?Again,becareful.24. WhataretheannualmotionsintheN/SandE/Wdirections?PARTIV:PlottingGPSStationMotionMaterials: CascadiaGPSAnalysisGrid(nextpageofpacket),3differentcoloredpencils,ruler
2004200620082010201220142016
May2004–Sept2016isabout12.5years
LindwasmovingveryslightlyNorth.Trendlineshowsit’sstartingat-1andmovingtoabout5,fortotalof6mm.
LindwasmovingveryslightlyEast.Trendlineshowsit’sstartingat-2andmovingtoabout12,fortotalof14mm.
AnnualmotionsareNorth0.5mm/year(6mm/12.5yr)andEast1.1mm/yr(14mm/12.5yr)
CascadiaGPSAnalysisTeacherInformationandAnswerKey Page11
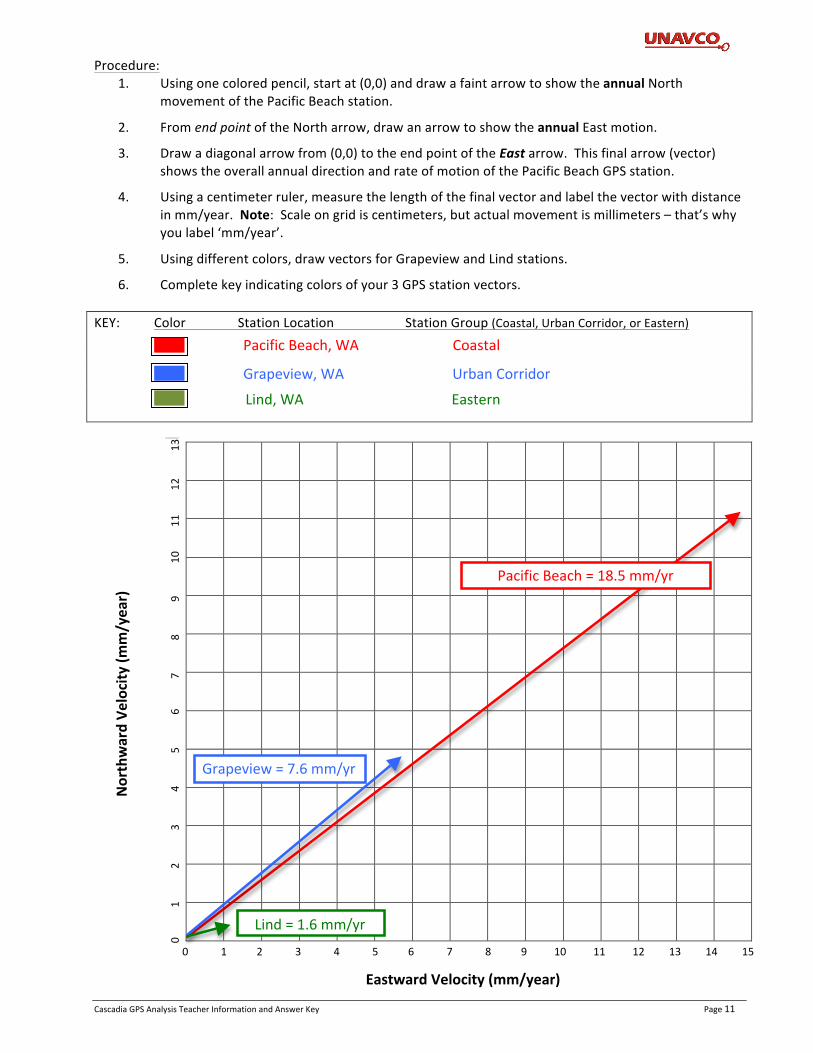
Procedure:1. Usingonecoloredpencil,startat(0,0)anddrawafaintarrowtoshowtheannualNorth
movementofthePacificBeachstation.
2. FromendpointoftheNortharrow,drawanarrowtoshowtheannualEastmotion.
3. Drawadiagonalarrowfrom(0,0)totheendpointoftheEastarrow.Thisfinalarrow(vector)showstheoverallannualdirectionandrateofmotionofthePacificBeachGPSstation.
4. Usingacentimeterruler,measurethelengthofthefinalvectorandlabelthevectorwithdistanceinmm/year.Note:Scaleongridiscentimeters,butactualmovementismillimeters–that’swhyyoulabel‘mm/year’.
5. Usingdifferentcolors,drawvectorsforGrapeviewandLindstations.
6. Completekeyindicatingcolorsofyour3GPSstationvectors.
KEY: Color StationLocation StationGroup(Coastal,UrbanCorridor,orEastern)
012345678910
11
12
13 TEACHERANSWERKEY
0123456789101112131415
EastwardVelocity(mm/year)
NorthwardVe
locity(m
m/year)
PacificBeach,WACoastal
Grapeview,WAUrbanCorridor
PacificBeach=18.5mm/yr
Grapeview=7.6mm/yr
Lind=1.6mm/yr
Lind,WAEastern
CascadiaGPSAnalysisTeacherInformationandAnswerKey Page12
Procedure(continued):7. Placegumdropstation(ontopoftransparency)at0,0andmovethetransparencysheetalongoneofthe
Northeastvectorstosimulatethemotionofthelandatthatpoint.
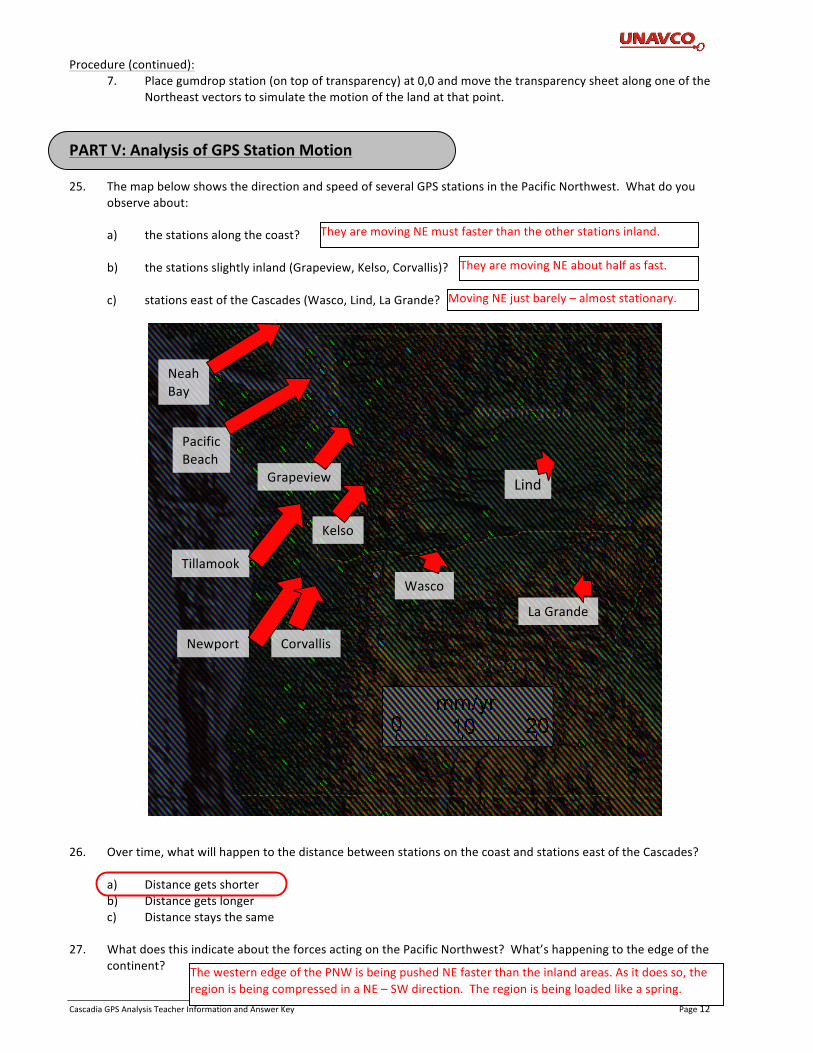
PARTV:AnalysisofGPSStationMotion25. ThemapbelowshowsthedirectionandspeedofseveralGPSstationsinthePacificNorthwest.Whatdoyou
observeabout: a) thestationsalongthecoast? b) thestationsslightlyinland(Grapeview,Kelso,Corvallis)? c) stationseastoftheCascades(Wasco,Lind,LaGrande?26. Overtime,whatwillhappentothedistancebetweenstationsonthecoastandstationseastoftheCascades? a) Distancegetsshorter b) Distancegetslonger c) Distancestaysthesame27. WhatdoesthisindicateabouttheforcesactingonthePacificNorthwest?What’shappeningtotheedgeofthe
continent?
Newport Corvallis
Tillamook
PacificBeach
NeahBay
Kelso
Grapeview Lind
LaGrande
Wasco
TheyaremovingNEmustfasterthantheotherstationsinland.
TheyaremovingNEabouthalfasfast.
MovingNEjustbarely–almoststationary.
ThewesternedgeofthePNWisbeingpushedNEfasterthantheinlandareas.Asitdoesso,theregionisbeingcompressedinaNE–SWdirection.Theregionisbeingloadedlikeaspring.