Embed Size (px)
Citation preview

J.Stat.M
ech.(2005)
P02001
ournal of Statistical Mechanics:An IOP and SISSA journalJ Theory and Experiment
Cartography of complex networks:modules and universal roles
Roger Guimera and Luıs A Nunes Amaral
NICO and Department of Chemical and Biological Engineering, NorthwesternUniversity, Evanston, IL 60208, USAE-mail: [email protected] and [email protected]
Received 21 December 2004Accepted 22 December 2004Published 1 February 2005
Online at stacks.iop.org/JSTAT/2005/P02001doi:10.1088/1742-5468/2005/02/P02001
Abstract. Integrative approaches to the study of complex systems demand thatone knows the manner in which the parts comprising the system are connected.The structure of the complex network defining the interactions provides insightinto the function and evolution of the components of the system. Unfortunately,the large size and intricacy of these networks implies that such insight is usuallydifficult to extract. Here, we propose a method that allows one to systematicallyextract and display information contained in complex networks. Specifically, wedemonstrate that one can (i) find modules in complex networks and (ii) classifynodes into universal roles according to their pattern of within- and between-module connections. The method thus yields a ‘cartographic representation’ ofcomplex networks.
Keywords: network dynamics
c©2005 IOP Publishing Ltd 1742-5468/05/P02001+13$30.00

J.Stat.M
ech.(2005)
P02001
Cartography of complex networks: modules and universal roles
Contents
1. Introduction 2
2. Modules in complex networks 32.1. Modularity . . . . . . . . . . . . . . . . . . . . . . . . . . . . . . . . . . . 32.2. Simulated annealing for module identification . . . . . . . . . . . . . . . . 3
3. Roles in complex modular networks 43.1. Within-module degree and participation coefficient . . . . . . . . . . . . . 63.2. Arguments for the definition of a universal set of discrete roles . . . . . . . 7
4. Roles in real networks: validation of the role definitions 94.1. Uncertainty in the position of nodes in parameter space and the density
landscape . . . . . . . . . . . . . . . . . . . . . . . . . . . . . . . . . . . . 114.2. Non-hub nodes . . . . . . . . . . . . . . . . . . . . . . . . . . . . . . . . . 114.3. Hub nodes . . . . . . . . . . . . . . . . . . . . . . . . . . . . . . . . . . . . 12
5. Conclusions 12
Acknowledgments 12
References 12
1. Introduction
Integrative approaches to the study of complex systems demand that one knows themanner in which the parts comprising the system are connected. Recent studies haverevealed that these interaction networks often display complex features themselves, thusdeviating from purely random or purely ordered topologies [1]–[8]. The Internet [9], foodwebs [10]–[12], and metabolic networks [13] are examples of complex networks.
To extract the relevant information from the topology of large complex networks,knowledge of the role of each node is of crucial importance. A cartographic analogyhelps to illustrate this point. Consider the network formed by all cities and towns in acountry—the nodes—and all the roads that connect them—the links. It is clear that amap in which each city and town is represented by a circle of fixed size and each road isrepresented by a line of fixed width is of little use. Rather, real maps emphasize capitalsand important communication lines so that one can obtain scale-specific information ata glance. Similarly, it is difficult, if not impossible, to obtain information from a networkwith hundreds or thousands of nodes and links, unless the information about nodes andlinks is presented in a scale-specific context.
Here, we propose a methodology, which is based on the connectivity of the nodes,that yields a ‘cartographic representation’ of a complex network. The first step in ourmethod is to identify the modules [14] in the network. In the cartographic picture, modulesare analogous to countries or regions, and enable a coarse-grained, and thus simplified,description of the network. Then, we classify the nodes in the network into a small numberof system-independent ‘universal roles’.
doi:10.1088/1742-5468/2005/02/P02001 2

J.Stat.M
ech.(2005)
P02001
Cartography of complex networks: modules and universal roles
2. Modules in complex networks
It is a matter of common experience that social networks have communities of highlyinterconnected nodes that are less connected to nodes in other communities. Suchmodular structures have been reported not only in social networks [14]–[17], but alsoin the Internet [18], in food webs [19, 20] and in biochemical networks [21]–[24]. It iswidely believed that the modular structure of complex networks plays a critical role intheir functionality [21, 22, 25]. There is therefore a clear need to develop algorithms foridentifying modules accurately [14, 16, 18, 26, 27].
2.1. Modularity
Here we propose a method that is based on the maximization of the modularity [16, 26, 28].For a given partition of the nodes of a network into modules, the modularity M of thispartition is
M ≡NM∑s=1
[lsL−
(ds
2L
)2], (1)
where NM is the number of modules, L is the number of links in the network, ls is thenumber of links between nodes in module s, and ds is the sum of the degrees of the nodesin module s. The rationale for this definition of modularity is the following. A goodpartition of a network into modules must comprise many within-module links and as fewas possible between-module links. However, if one just tries to minimize the number ofbetween-module links (or, equivalently, maximize the number of within-module links) theoptimal partition consists of a single module and no between-module links. Equation (1)addresses this difficulty by imposing that M = 0 if nodes are placed at random intomodules or if all nodes are in the same cluster [16, 26, 28].
2.2. Simulated annealing for module identification
The objective of a module identification algorithm is to find the partition with largestmodularity, and several methods have been proposed for attaining such a goal. Most ofthem rely on heuristic procedures and use M—or a similar measure—only to assess theirperformance. In contrast, we use simulated annealing (SA) [29, 28] to obtain the bestdetermination of the modules of a network by direct maximization of M .
Simulated annealing [29] is a stochastic optimization technique that enables one tofind ‘low cost’ configurations without getting trapped in ‘high cost’ local minima. Thisis achieved by introducing a computational temperature T . When T is high, the systemcan explore configurations of high cost while at low T the system only explores low costregions. Starting at high T and slowly decreasing it, the system descends gradually towarddeep minima, overcoming small cost barriers.
When identifying modules, the objective is to maximize the modularity and, thus,the cost is C = −M , where M is the modularity as defined in equation (1). At eachtemperature, we perform a number of random updates and accept them with probability
p =
1 if Cf ≤ Ci
exp
(−Cf − Ci
T
)if Cf > Ci
(2)
where Cf is the cost after the update and Ci is the cost before the update.
doi:10.1088/1742-5468/2005/02/P02001 3

J.Stat.M
ech.(2005)
P02001
Cartography of complex networks: modules and universal roles
Specifically, at each T we propose ni = fS2 individual node movements from onemodule to another, where S is the number of nodes in the network. We also proposenc = fS collective movements, which involve either merging two modules or splitting amodule. For f we typically choose f = 1. After the movements are evaluated at a certainT , the system is cooled down to T ′ = cT , with c = 0.995.
Both the individual movement of a node from a module to another, and the mergingof two modules are straightforward movements. The split movement is, however, moreinvolved. In principle, any heuristic procedure that generates non-deterministic plausiblesplits of a module—that is, splits that have a finite probability of being accepted—wouldsuffice.
We have considered a number of different schemes. The one that performs bestconsists in isolating the module from the rest of the network, and performing a ‘nested’SA, entirely independent of the ‘global’ one. We start by isolating the module that weintend to split. We then partition its nodes into two random groups, and set the initialtemperature of the nested SA to a high value. Then, we make individual node movementsaccording to the modularity of the isolated module and decrease the temperature of thenested SA until it reaches the value of the global SA. The result of the nested SA is apartition of the module into two new modules, which we accept or reject according to theglobal modularity and the global temperature.
In using M as a ‘fitness function’, our method is more ‘transparent’ than those relyingon heuristic procedures. Furthermore, SA enables us to carry out an exhaustive searchand to minimize the problem of finding sub-optimal partitions. It is noteworthy that, inour method, one does not need to specify a priori the number of modules; rather, thenumber of modules is an outcome of the algorithm.
To test the performance of the method, we build ‘random networks’ with knownmodule structure. Each test network comprises 128 nodes divided into 4 modules of 32nodes. Each node is connected to the other nodes in its module with probability pin, andto nodes in other modules with probability pout < pin. On average, thus, each node isconnected to kout = 96pout nodes in other modules and to kin = 31pin in the same module.Additionally, pin and pout are selected so that the average degree of the nodes is k = 16.Our algorithm, which significantly outperforms the best algorithm in the literature [14],is able to reliably identify modules in a network whose nodes have as many as 50% oftheir connections outside their own module (figure 1).
3. Roles in complex modular networks
Already in 1957, Nadel argued that ‘roles’ are the central elements in the analysisof social systems [30, 31], and in the 1970s White and co-workers introduced theconcepts of structural equivalence and block model to address this issue from a networkperspective [32]–[34], [31]. Two nodes are structurally equivalent if they are connected tothe same nodes [32, 34]. Therefore, any network can be divided into blocks of structurallyequivalent nodes in such a way that the structure of the network is summarized in a blockmodel by stating the relations between the blocks (figure 2).
Usually, structural equivalence is too strong a requirement for a large complexnetwork; it is very unlikely that two nodes are connected to exactly the same set ofother nodes. Regular structural equivalence [35, 34] relaxes this requirement by requiring
doi:10.1088/1742-5468/2005/02/P02001 4

J.Stat.M
ech.(2005)
P02001
Cartography of complex networks: modules and universal roles
0 0.1 0.2 0.3 0.4 0.5 0.6
Fraction of inter-community edges, kout / k
0.0
0.2
0.4
0.6
0.8
1.0P
erfo
rman
ce
PresentGirvan-Newman
100.0
0.0
50.0
1 32 64 96 128
1
32
64
96
128
Nodes
Nod
es
(b)(a)
Figure 1. (a) The performance of a module identification algorithm is typicallydefined as the fraction of correctly classified nodes. We compare our algorithmto the Girvan–Newman algorithm [14, 26], which is the reference algorithm formodule identification [16, 26, 27]. Note that our method is 90% accurate evenwhen half of a node’s links are to nodes in outside modules. (b) Our moduleidentification algorithm is stochastic, so different runs yield, in principle, differentpartitions. To test the robustness of the algorithm, we obtain 100 partitions ofa network with kin = kout = 8 and plot, for each pair of nodes in the network,the fraction of times that they are classified in the same module. As shown inthe figure, most pairs of nodes are either always classified in the same module(red) or never classified in the same module (dark blue), which indicates that thesolution is robust.
4321
1 1
1
1
1
1
1 0
0 0
0
0
000
0
1 2 3 4
1
2
3
4
(a) (b)
Figure 2. (a) Structural equivalence and blocks. The network depicted can bedivided into four blocks of structurally equivalent nodes. All nodes in block 1are connected to each other and to all nodes in block 2. All nodes in block 2 areconnected to all nodes in blocks 1 and 3, and so forth. (b) The structure of thenetwork can be conveniently summarized using a block model matrix.
that regularly equivalent nodes have identical links to other equivalent nodes. Formally,if nodes i and j are regularly equivalent and i has a link to/from some node k, thennode j must have a link to/from some node l, and nodes k and l must be, also, regularlyequivalent [34].
doi:10.1088/1742-5468/2005/02/P02001 5
J.Stat.M
ech.(2005)
P02001
Cartography of complex networks: modules and universal roles
C
A
D
B
B
B
B
B
AA
A1 1
2
3
2
3
4
5
B
Participation coefficient
With
in-m
odul
e de
gree
Peripheral Connectors
Module centres
C
A
B
DB1-5
A1-3
(a) (b)
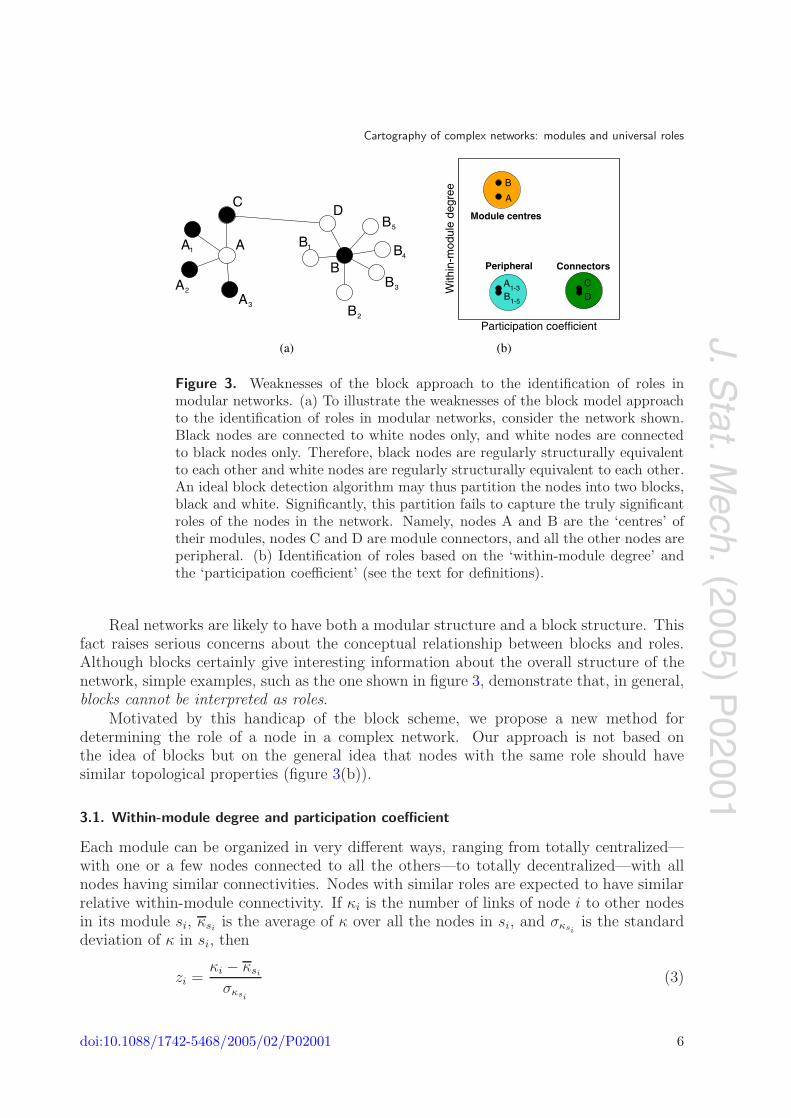
Figure 3. Weaknesses of the block approach to the identification of roles inmodular networks. (a) To illustrate the weaknesses of the block model approachto the identification of roles in modular networks, consider the network shown.Black nodes are connected to white nodes only, and white nodes are connectedto black nodes only. Therefore, black nodes are regularly structurally equivalentto each other and white nodes are regularly structurally equivalent to each other.An ideal block detection algorithm may thus partition the nodes into two blocks,black and white. Significantly, this partition fails to capture the truly significantroles of the nodes in the network. Namely, nodes A and B are the ‘centres’ oftheir modules, nodes C and D are module connectors, and all the other nodes areperipheral. (b) Identification of roles based on the ‘within-module degree’ andthe ‘participation coefficient’ (see the text for definitions).
Real networks are likely to have both a modular structure and a block structure. Thisfact raises serious concerns about the conceptual relationship between blocks and roles.Although blocks certainly give interesting information about the overall structure of thenetwork, simple examples, such as the one shown in figure 3, demonstrate that, in general,blocks cannot be interpreted as roles.
Motivated by this handicap of the block scheme, we propose a new method fordetermining the role of a node in a complex network. Our approach is not based onthe idea of blocks but on the general idea that nodes with the same role should havesimilar topological properties (figure 3(b)).
3.1. Within-module degree and participation coefficient
Each module can be organized in very different ways, ranging from totally centralized—with one or a few nodes connected to all the others—to totally decentralized—with allnodes having similar connectivities. Nodes with similar roles are expected to have similarrelative within-module connectivity. If κi is the number of links of node i to other nodesin its module si, κsi
is the average of κ over all the nodes in si, and σκsiis the standard
deviation of κ in si, then
zi =κi − κsi
σκsi
(3)
doi:10.1088/1742-5468/2005/02/P02001 6
J.Stat.M
ech.(2005)
P02001
Cartography of complex networks: modules and universal roles
is the so-called z-score. The within-module degree z-score measures how ‘well connected’node i is to other nodes in the module.
Different roles can also arise because of the connections of a node to modules otherthan its own. For example, two nodes with the same z-score will probably play differentroles if one of them is connected to several nodes in other modules while the other is not.We define the participation coefficient Pi of node i as
Pi = 1 −NM∑s=1
(κis
ki
)2
(4)
where κis is the number of links of node i to nodes in module s, and ki is the total degreeof node i. The participation coefficient of a node is therefore close to one if its links areuniformly distributed among all the modules and zero if all its links are within its ownmodule.
We hypothesize that the role of a node can be determined, to a great extent, byits within-module degree and its participation coefficient, which define how the node ispositioned in its own module and with respect to other modules [36, 37]. Note that thesetwo properties are easily computed once the modules of a network are known.
3.2. Arguments for the definition of a universal set of discrete roles
We surmise that the role of a node is defined mainly by its within-community degreeand its participation coefficient. Our definition of the roles is firstly determined by thewithin-module degree. We classify nodes with z ≥ 2.5 as module hubs and nodes z < 2.5as non-hubs. Both hub and non-hub nodes are then more finely characterized by usingthe values of the participation coefficient. Simple calculations suggest that non-hub nodescan be naturally assigned into four roles:
• Ultra-peripheral nodes (role R1).If a node has all its links within its module (P ≈ 0).
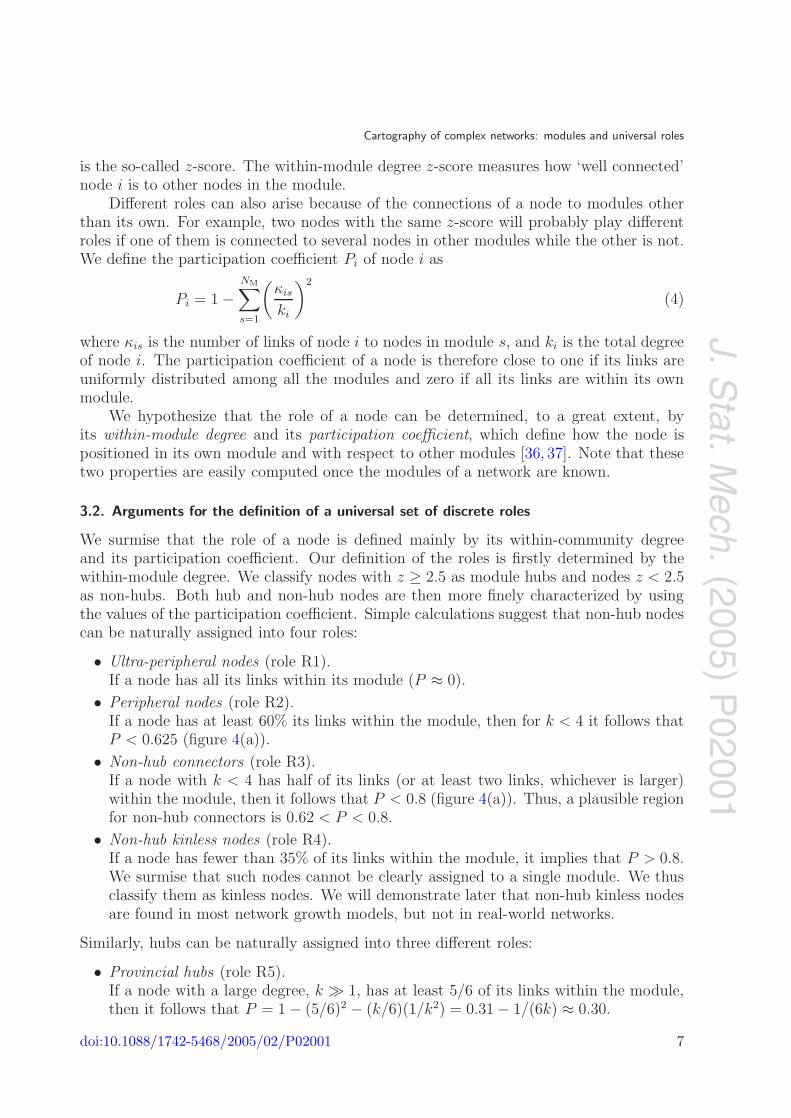
• Peripheral nodes (role R2).If a node has at least 60% its links within the module, then for k < 4 it follows thatP < 0.625 (figure 4(a)).
• Non-hub connectors (role R3).If a node with k < 4 has half of its links (or at least two links, whichever is larger)within the module, then it follows that P < 0.8 (figure 4(a)). Thus, a plausible regionfor non-hub connectors is 0.62 < P < 0.8.
• Non-hub kinless nodes (role R4).If a node has fewer than 35% of its links within the module, it implies that P > 0.8.We surmise that such nodes cannot be clearly assigned to a single module. We thusclassify them as kinless nodes. We will demonstrate later that non-hub kinless nodesare found in most network growth models, but not in real-world networks.
Similarly, hubs can be naturally assigned into three different roles:
• Provincial hubs (role R5).If a node with a large degree, k � 1, has at least 5/6 of its links within the module,then it follows that P = 1 − (5/6)2 − (k/6)(1/k2) = 0.31 − 1/(6k) ≈ 0.30.
doi:10.1088/1742-5468/2005/02/P02001 7
J.Stat.M
ech.(2005)
P02001
Cartography of complex networks: modules and universal roles
0 2 4 6 8 10Node’s degree, k
0
0.2
0.4
0.6
0.8Pa
rtic
ipat
ion
coef
fici
ent
0 20 40 60 80 100Node’s degree, k
(a) (b)
Figure 4. The dependence of the value of the participation coefficient on thetotal degree and fraction of within-module links. (a) P for, from top to bottom,1/3, 0.4, 1/2, 0.6, 0.66, 0.7, 0.75, 0.8, and 0.9 of within-module links. The redhorizontal line corresponds to P = 0.8 and the dark green one to P = 0.625.These results suggest that P > 0.8 occurs only for cases in which the assignmentof a node to a role is mostly a matter of chance. (b) P for, from top to bottom,0.4, 1/2, 0.6, 0.7, 0.8, and 0.9 of within-module links. The red curve, whichcorresponds to half of the links being within the module, converges to P = 0.75.The green curve, which corresponds to 80% of the links being within the module,converges to P = 0.35.
0.0 0.2 0.4 0.6 0.8 1.0
Participation coefficient, P
-2
0
2
4
6
8
With
in-m
odul
e de
gree
, Z
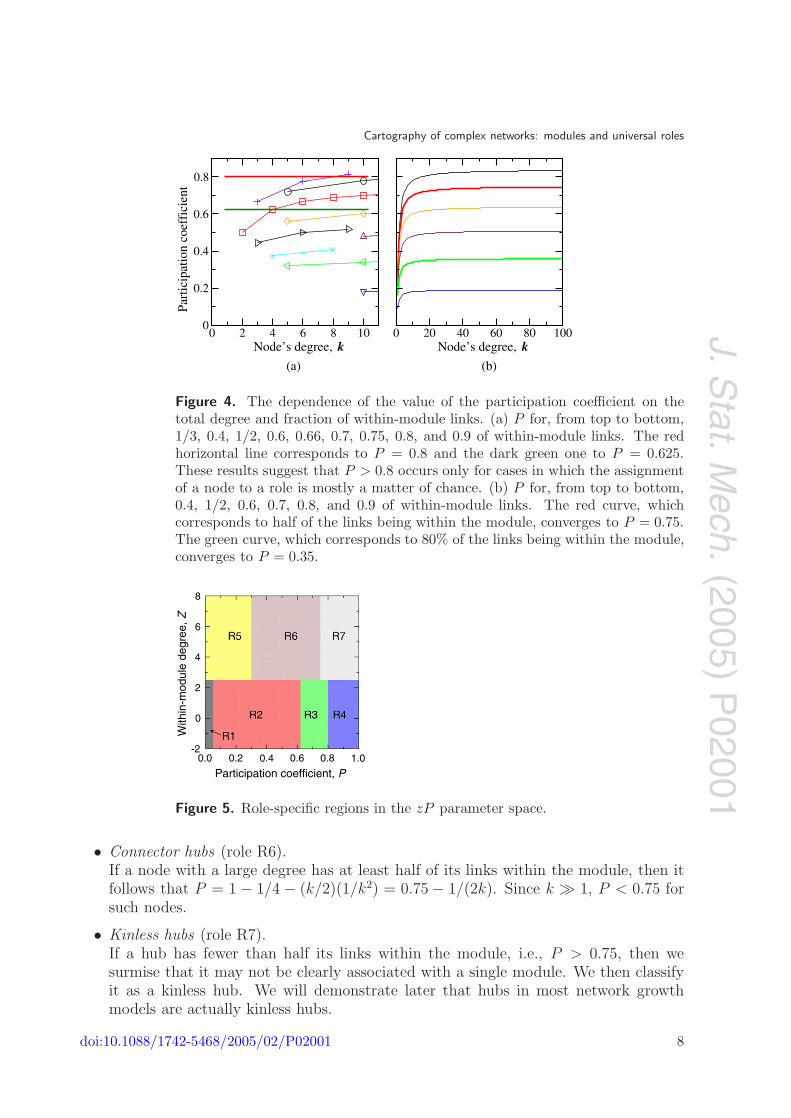
Figure 5. Role-specific regions in the zP parameter space.
• Connector hubs (role R6).If a node with a large degree has at least half of its links within the module, then itfollows that P = 1 − 1/4 − (k/2)(1/k2) = 0.75 − 1/(2k). Since k � 1, P < 0.75 forsuch nodes.
• Kinless hubs (role R7).If a hub has fewer than half its links within the module, i.e., P > 0.75, then wesurmise that it may not be clearly associated with a single module. We then classifyit as a kinless hub. We will demonstrate later that hubs in most network growthmodels are actually kinless hubs.
doi:10.1088/1742-5468/2005/02/P02001 8

J.Stat.M
ech.(2005)
P02001
Cartography of complex networks: modules and universal roles
0 0.2 0.4 0.6 0.8 1Participation coefficient
-2.0
0.0
2.0
4.0
6.0
8.0
10.0
With
in-m
odul
e de
gree
North-America airport system
0 0.2 0.4 0.6 0.8 1Participation coefficient
Erdos-Renyi graphsp = 0.006p = 0.010
(c) (d)
0 0.2 0.4 0.6 0.8 1Participation coefficient
-2.0
0.0
2.0
4.0
6.0
8.0
10.0W
ithin
-mod
ule
degr
ee
0 0.2 0.4 0.6 0.8 1Participation coefficient
(a) (b)
Barabasi-Albert graphsm = 2m = 4
Figure 6. (a) Values of z and P for 26 771 nodes from 16 networks, includingthe metabolic networks of three organisms, the proteome of C. elegans, theNorth-American airport network [38, 39], the collaboration networks of chemicalengineers obtained from two journals (Chemical Engineering Science and theAIChE Journal), the Internet at the autonomous system level [9], four Erdos–Renyi graphs with p = 0.004, 0.006, 0.008, and 0.010, and four Barabasi–Albertgraphs with m = 1, 2, 3, and 4. (b) Values of z and P for two Barabasi–Albertgraphs with 1000 nodes each. (c) Values of z and P for 940 nodes in the largestfully connected component of the North-American airport network. (d) Valuesof z and P for two Erdos–Renyi graphs with 1000 nodes each.
In total, we are left with seven roles that correspond to seven regions of the zPparameter space (figure 5).
4. Roles in real networks: validation of the role definitions
Our definition of a set of distinct roles has been, so far, based on mathematical arguments.A question that we need to address is, therefore, how this definition relates to the rolesof nodes in real networks.
doi:10.1088/1742-5468/2005/02/P02001 9

J.Stat.M
ech.(2005)
P02001
Cartography of complex networks: modules and universal roles
5010
015
020
025
030
0
20 40 60 80 100
120
140
160
180
200
0.0
2.0
4.0
6.0
8.0W
ithin
–m
odul
e de
gree
10.0
–2.0
Participation Coefficient
5010
015
020
025
030
0
20 40 60 80 100
120
140
160
180
200
0.0
2.0
4.0
6.0
8.0
With
in–
mod
ule
degr
ee
10.0
–2.0
Participation Coefficient(a) (b)
0.2 0.4 0.6 0.8 1.00.0 0.2 0.4 0.6 0.8 1.00.0
Figure 7. The density landscape for the nodes belonging to eight real-worldnetworks and eight model networks. Due to the fact that more than 98% of thenodes have z < 2.5, one finds that the density landscape for z > 2.5 is quite‘washed’ down by the background of the non-hub region. For this reason, weobtain the density landscape under two distinct conditions: (a) in the first, weweigh each hub with a weight of one; (b) in the second, we weigh each hub witha weight of five.
5010
015
020
025
030
0
20 40 60 80 100
120
140
160
180
200
0.0
2.0
4.0
6.0
8.0
With
in–
mod
ule
degr
ee
10.0
–2.0
Participation Coefficient0.2 0.4 0.6 0.8 1.00.0
0.62 0.75
5010
015
020
025
030
0
20 40 60 80 100
120
140
160
180
200
0.0
2.0
4.0
6.0
8.0
With
in–
mod
ule
degr
ee
10.0
–2.0
Participation Coefficient0.2 0.4 0.6 0.8 1.00.0
(a) (b)
5010
015
020
025
030
0
20 40 60 80 100
120
140
160
180
200
0.0
2.0
4.0
6.0
8.0
With
in–
mod
ule
degr
ee
10.0
–2.0
Participation Coefficient0.2 0.4 0.6 0.8 1.00.0
5010
015
020
025
030
0
20 40 60 80 100
120
140
160
180
200
0.0
2.0
4.0
6.0
8.0
With
in–
mod
ule
degr
ee
10.0
–2.0
Participation Coefficient0.2 0.4 0.6 0.8 1.00.0
(c) (d)
Figure 8. Basins of attraction for density landscapes obtained for non-hub nodesobtained with (a) σP = 0.03, (b) σP = 0.035, (c) σP = 0.05, and (d) σP = 0.08.Note how the values of P identified in our simple analysis provide a good matchto the boundaries of the basins of attraction in the node density landscapes.
doi:10.1088/1742-5468/2005/02/P02001 10
J.Stat.M
ech.(2005)
P02001
Cartography of complex networks: modules and universal roles
5010
015
020
025
030
0
20 40 60 80 100
120
140
160
180
200
0.0
2.0
4.0
6.0
8.0W
ithin
–m
odul
e de
gree
10.0
–2.0
Participation Coefficient
0.2 0.4 0.6 0.8 1.00.0
0.30 0.75
5010
015
020
025
030
0
20 40 60 80 100
120
140
160
180
200
0.0
2.0
4.0
6.0
8.0
With
in–
mod
ule
degr
ee
10.0
–2.0
Participation Coefficient
0.2 0.4 0.6 0.8 1.00.0
(a) (b)
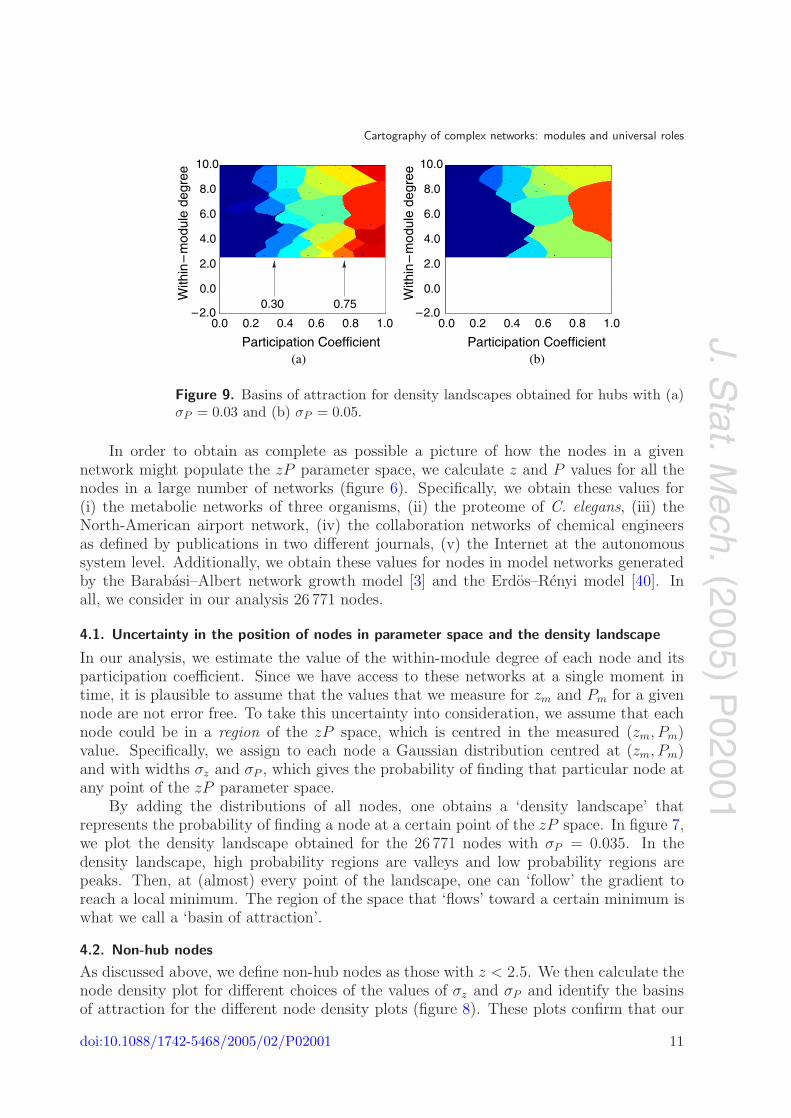
Figure 9. Basins of attraction for density landscapes obtained for hubs with (a)σP = 0.03 and (b) σP = 0.05.
In order to obtain as complete as possible a picture of how the nodes in a givennetwork might populate the zP parameter space, we calculate z and P values for all thenodes in a large number of networks (figure 6). Specifically, we obtain these values for(i) the metabolic networks of three organisms, (ii) the proteome of C. elegans, (iii) theNorth-American airport network, (iv) the collaboration networks of chemical engineersas defined by publications in two different journals, (v) the Internet at the autonomoussystem level. Additionally, we obtain these values for nodes in model networks generatedby the Barabasi–Albert network growth model [3] and the Erdos–Renyi model [40]. Inall, we consider in our analysis 26 771 nodes.
4.1. Uncertainty in the position of nodes in parameter space and the density landscape
In our analysis, we estimate the value of the within-module degree of each node and itsparticipation coefficient. Since we have access to these networks at a single moment intime, it is plausible to assume that the values that we measure for zm and Pm for a givennode are not error free. To take this uncertainty into consideration, we assume that eachnode could be in a region of the zP space, which is centred in the measured (zm, Pm)value. Specifically, we assign to each node a Gaussian distribution centred at (zm, Pm)and with widths σz and σP , which gives the probability of finding that particular node atany point of the zP parameter space.
By adding the distributions of all nodes, one obtains a ‘density landscape’ thatrepresents the probability of finding a node at a certain point of the zP space. In figure 7,we plot the density landscape obtained for the 26 771 nodes with σP = 0.035. In thedensity landscape, high probability regions are valleys and low probability regions arepeaks. Then, at (almost) every point of the landscape, one can ‘follow’ the gradient toreach a local minimum. The region of the space that ‘flows’ toward a certain minimum iswhat we call a ‘basin of attraction’.
4.2. Non-hub nodes
As discussed above, we define non-hub nodes as those with z < 2.5. We then calculate thenode density plot for different choices of the values of σz and σP and identify the basinsof attraction for the different node density plots (figure 8). These plots confirm that our
doi:10.1088/1742-5468/2005/02/P02001 11

J.Stat.M
ech.(2005)P
02001
Cartography of complex networks: modules and universal roles
definition of non-hub roles with boundaries at P = 0.62 and P = 0.80 is a sensible oneand that, indeed, these regions of the zP space correspond to distinct universal roles inreal networks.
4.3. Hub nodes
We define hub nodes as those with z ≤ 2.5. We then calculate the node density plot fordifferent choices of the values of σz and σP and identify the basins of attraction for thedifferent node density plots (figure 9).
In this case, there are many more basins of attraction than for the non-hub regionbecause of the scarcity of data points. However, the density plots are compatible witha selection of three regions corresponding to distinct roles, with boundaries at P = 0.30and 0.75, as estimated before.
5. Conclusions
Computational and high throughput techniques are leading to an explosive andunprecedented growth in the amount of information available for some physical, biological,and socio-economic systems. These advances are creating the opportunity to revolutionizeour understanding of nature, life and disease, and social organization. Interpretation ofthese data remains, however, a major scientific challenge.
Here, we presented a methodology for extracting relevant scale-specific informationfrom complex networks. Our method is based on the analysis of the connectivity patternsof the nodes, and yields a ‘cartographic representation’ of a complex network. The firststep in our method is to identify the modules in the network. In the cartographic picture,modules are analogous to countries or regions, and enable a coarse-grained, and thussimplified, description of the network. Then, we classify the nodes in the network into asmall number of system-independent ‘universal roles’. A node’s role is determined fromits pattern of inter- and intra-module connections.
Our ‘cartographic method’ provides a way to process the information contained in thestructure of complex networks, and to extract knowledge about the function carried outby the network and its constituents. This should allow us, in turn, to identify key playersin the network. Some of these key nodes are likely to be already known. For example,hubs are highly visible due to their large number of connections. More interestingly,our method also enables one to identify more ‘subtle’ roles, such as non-hub connectors,which play important structural roles in spite of their small number of connections. Inmetabolic networks, for example, it seems that these nodes are highly conserved comparedto provincial hubs [24].
Acknowledgments
We thank L Broadbelt, A A Moreira, E T Papoutsakis, M Sales-Pardo, and D B Stoufferfor stimulating discussions and helpful suggestions. RG thanks the Fulbright Program andthe Spanish Ministry of Education, Culture & Sports. LANA gratefully acknowledges thesupport of a Searle Leadership Fund Award and of a NIH/NIGMS K-25 award.
References
[1] Watts D J and Strogatz S H, 1998 Nature 393 440[2] Barthelemy M and Amaral L A N, 1999 Phys. Rev. Lett. 82 3180
doi:10.1088/1742-5468/2005/02/P02001 12

J.Stat.M
ech.(2005)
P02001
Cartography of complex networks: modules and universal roles
[3] Barabasi A L and Albert R, 1999 Science 286 509[4] Amaral L A N, Scala A, Barthelemy M and Stanley H E, 2000 Proc. Nat. Acad. Sci. 97 11149[5] Albert R and Barabasi A L, 2002 Rev. Mod. Phys. 74 47[6] Dorogovtsev S N and Mendes J F F, 2002 Adv. Phys. 51 1079[7] Newman M E J, 2003 SIAM Rev. 45 167[8] Amaral L A N and Ottino J, 2004 Eur. Phys. J. B 38 147[9] Vazquez A, Pastor-Satorras R and Vespignani A, 2002 Phys. Rev. E 65 066130
[10] Camacho J, Guimera R and Amaral L A N, 2002 Phys. Rev. Lett. 88 228102[11] Camacho J, Guimera R and Amaral L A N, 2002 Phys. Rev. E 65 030901[12] Stouffer D B, Camacho J, Guimera R, Ng C A and Amaral L A N, 2005 Ecology at press[13] Jeong H, Tombor B, Albert R, Oltvai Z N and Barabasi A L, 2000 Nature 407 651[14] Girvan M and Newman M E J, 2002 Proc. Nat. Acad. Sci. 99 7821[15] Guimera R, Danon L, Dıaz-Guilera A, Giralt F and Arenas A, 2003 Phys. Rev. E 68 065103[16] Newman M E J and Girvan M, 2004 Phys. Rev. E 69 026113[17] Arenas A, Danon L, Dıaz-Guilera A, Gleiser P M and Guimera R, 2004 Eur. Phys. J. B 38 373[18] Eriksen K A, Simonsen I, Maslov S and Sneppen K, 2003 Phys. Rev. Lett. 90 148701[19] Pimm S L, 1979 Theor. Popul. Biol. 16 144[20] Krause A E, Frank K A, Mason D M, Ulanowicz R E and Taylor W W, 2003 Nature 426 282[21] Hartwell L H, Hopfield J J, Leibler S and Murray A W, 1999 Nature 402 C47[22] Ravasz E, Somera A L, Mongru D A, Oltvai Z N and Barabasi A L, 2002 Science 297 1551[23] Holme P and Huss M, 2003 Bioinformatics 19 532[24] Guimera R and Amaral L A N, 2005 Nature at press[25] Alon U, 2003 Science 301 1866[26] Newman M E J, 2004 Phys. Rev. E 69 066133[27] Radicchi F, Castellano C, Cecconi F, Loreto V and Parisi D, 2004 Proc. Nat. Acad. Sci. 101 2658[28] Guimera R, Sales-Pardo M and Amaral L A N, 2004 Phys. Rev. E 70 025101[29] Kirkpatrick S, Gelatt C D and Vecchi M P, 1983 Science 220 671[30] Nadel S F, 1957 The Theory of Social Structure (London: Cohen and West)[31] Scott J, 2000 Social Network Analysis: A Handbook 2nd edn (London: SAGE Publications)[32] Lorrain F and White H C, 1971 J. Math. Sociol. 1 49[33] White H C, Boorman S A and Breiger R L, 1976 Am. J. Sociol. 81 730[34] Wasserman S and Faust K, 1994 Social Network Analysis (Cambridge: Cambridge University Press)[35] Sailer L D, 1978 Soc. Networks 1 73[36] Rives A W and Galitski T, 2003 Proc. Nat. Acad. Sci. 100 1128[37] Han J D J, Bertin N, Hao T, Goldberg D S, Berriz G F, Zhang L V, Dupuy D, Wallhout A J M,
Cusick M E, Roth F P and Vidal M, 2004 Nature 430 88[38] Guimera R, Mossa S, Turtschi A and Amaral L A N, 2003 submitted[39] Guimera R and Amaral L A N, 2004 Eur. Phys. J. B 38 381[40] Bollobas B, 2001 Random Graphs 2nd edn (Cambridge: Cambridge University Press)
doi:10.1088/1742-5468/2005/02/P02001 13