Embed Size (px)
Citation preview

South Florida Water Management District Written Comments for the EPA's Scientific Advisory Board
Carter, Kevin to:
Stephanie Sanzone 12/06/2010 06:09 PM 12/06/2010 06:09 PM
Dear Ms. Sanzone:
The South Florida Water Management District (the District) respectfully submits the following documents for distribution to the United States Environmental Protection Agency’s (EPA) Scientific Advisory Board (SAB) who will meet on December 13 – 14 to discuss EPA’s Methods and Approaches for Deriving Numeric Criteria for Nitrogen/Phosphorus Pollution in Florida’s Estuaries, Coastal Waters, and Southern Inland Flowing Waters:
• Canals in South Florida: A Technical Support Document (South Florida Water Management District, April 28, 2010, 86 pp.);
• The District’s cover letter and “Comments (April 28, 2010) on the Proposed 40 CFR Part 131 Water Quality Standards for the State of Florida’s Lakes and Flowing Waters”;
• The South Florida Environmental Report 2010 (http://my.sfwmd.gov/portal/page/portal/xweb%20about%20us/agency%20reports);
• The District’s Facilities and Major Canals Map (http://www.sfwmd.gov/portal/page/portal/xrepository/sfwmd_repository_pdf/facility_map_overview.pdf).
The District is providing you with electronic copies or links (because of file size) in this communication and we are also forwarding 20 hard copies of these documents to your office for distribution to the SAB. The District extends our thanks to the SAB panel members and the EPA, in advance, for your time and efforts on this important endeavor for the State of Florida. As the SAB process continues, please do not hesitate to contact me at 561-682-6949 or [email protected].
Sincerely,
Kevin Carter Lead Scientist – Numeric Nutrient Criteria Coordinator South Florida Water Management District 3301 Gun Club Rd. West Palm Beach, FL 33406

Canals in South Florida: A Technical Support Document
(April 28, 2010)
Prepared by
South Florida Water Management District West Palm Beach, Florida

Canals in South Florida Acknowledgements
ii
ACKNOWLEDGEMENTS
This report was prepared by the Canal Science Inventory Workgroup led by Kevin Carter. Garth
Redfield provided overall science direction. Scott Huebner compiled and summarized the water
quality data with support from Lucia Baldwin, Steve Hill, and Nenad Iricanin. Lawrence Glenn,
Scot Hagerthey, Brad Jones, Mac Kobza, and Sue Newman compiled information on fish and
wildlife including fish, alligators, and birds. John Maxted compiled data on macroinvertebrate
communities in canals and prepared summaries and a reanalysis of key data. Matahel Ansar,
Lucine Dadrian, Sally Kennedy, Adnan Mirza, and Cled Weldon provided information on the
operation, management design, and construction of canals. Christopher Pettit provided legal
guidance. Joel VanArman compiled historic information on canals and provided technical
support in the preparation of this report under contract with the SFWMD.

Canals in South Florida Executive Summary
iii
EXECUTIVE SUMMARY
SOUTH FLORIDA CANALS IN A NUTSHELL
Background
This report was prepared to support a variety of activities related to the management of South
Florida Water Management District (SFWMD or District) canals. Canals are engineered
waterways designed to convey water to meet water supply and flood control objectives. Water
delivered by canals also supports aquatic habitat for fish and wildlife. The report compiles and
summarizes available information on the history, physical characteristics, biology, and water
quality of District canals. The information included comes from published literature, reports, and
original data derived from searches of resources from the District, cities, counties, municipalities,
and universities. No new data were collected for this report; however, additional analyses of
existing macroinvertebrate data were conducted to address our specific questions related to
conditions in canals. The information is presented at three levels of detail to promote
communications to a wide audience of managers, scientists, and the public: executive summary,
summary report, and appendices.
Canals of the South Florida Water Management System
Developed over the past hundred years, the canal-based water management system in South
Florida is one of the world‘s largest and most complex civil works projects. Over 1300 water
control structures, 64 pump stations, and 2600 miles of canals are used by the SFWMD to
provide flood control, water supply, navigation, water quality improvements, and environmental
management over its 16-county, 17,000-square mile region.1
Canals were built to meet human needs by controlling the water levels and the movement of
water from one place to another for water supply, flood control, drainage, and navigation, as well
as to provide water needed to sustain natural communities in lakes, rivers, wetlands and
estuaries. Ecological functions in canals can be valuable for recreation and aesthetics, but are
secondary and largely incidental to their use for conveyance.
A primary function of a canal is to control water levels in order to maintain groundwater control
in dry conditions. This can be particularly important for water supply needs such as preventing
salt water intrusion. Canals also provide the conduit to remove excess water from drainage
basins in wet periods to prevent flooding.
District canals differ greatly in their design, construction, and operation, depending primarily on
their geography, intended function, adjacent land use, and development within the basin. Canals
exist in the full range of land uses in South Florida including areas that are completely
surrounded by natural wetlands, such as those within the Water Conservation Areas or the
Kissimmee River Floodplain; areas that are surrounded by intensive urban development, such as
coastal canals in Miami-Dade and Broward counties; and areas that are completely surrounded
by agriculture, such as the Everglades Agricultural Area.
1 Data from http://www.sfwmd.gov/portal/page/portal/pg_grp_sfwmd_whatwedo/pg_sfwmd_whatwedo_canalstruc
tureops.

Canals in South Florida Executive Summary
iv
Canal diversity is reflected in many observations:
Water quality in canals is affected by tributary sources, surrounding soil types,
topography, groundwater interaction, and adjacent land uses. In some areas, notably
eastern Miami-Dade and Broward counties, water quality in the canals is strongly
influenced by groundwater seepage.
Soil types surrounding canals range from sandy upland soils of the Atlantic Coastal
Ridge to hydric sands, marls, and peats of the Everglades.
Topography differs across the SFWMD, resulting in differences in canal depths, water
levels, and flow rates. Water level elevations in canals range from 20 to 60 feet above sea
level in the Kissimmee and Istokpoga basins to less than 10 feet above sea level
throughout most of Miami-Dade, Broward, and Monroe counties.
Water Quality and System Ecology in South Florida Canals
A survey of existing data for the primary canal system indicates that water quality varies greatly
among regions of the SFWMD, individual canals within regions, and sections of the same canal.
Some canals convey water that has been treated in one of the Stormwater Treatment Areas, the
goal of which is to reduce total phosphorus concentrations to levels necessary to achieve
compliance with the phosphorus criterion in the Everglades. A net increase in nutrient
concentrations tends to occur in canals adjacent to urban and agricultural land uses and a net
decrease occurs in canals surrounded by wetlands or areas where canal water interacts strongly
with groundwater. Little is known about the natural chemical and biological assimilation
processes that occur in canals and more information is necessary.
Some preliminary findings on canal water quality include the following:
Canal phosphorus concentrations span an order of magnitude and appear to demonstrate a
clear spatial pattern that follows the intensity of land use and the inflow sources (such as
Stormwater Treatment Area discharges). The variability of phosphorus concentrations
tends to be much higher than that for nitrogen and the two constituents do not correspond
closely.
Within canals, phosphorus concentrations tend to change more than nitrogen as water
moves downstream. Nutrient levels tend to be higher at inland and upstream sites, but
there also is considerable variation in nutrient concentrations over space and time.
Primary production, as measured by chlorophyll a, is higher in canals compared to
natural streams but not particularly elevated compared to other open bodies of water such
as ponds and lakes. A frequent concentration for chlorophyll a in canals is about
10 mg/m3 (equivalent to 10 µg/L), which is well below the State of Florida‘s nutrient
impairment threshold of 20 mg/m3 for lakes. Based only upon chlorophyll a
measurements, canal primary production does not appear to be sensitive to nutrient
concentrations.
Despite large uncertainty and lack of information, many District canals are currently
listed as impaired and are included in the Florida Department of Environmental
Protection‘s Total Maximum Daily Loads and Basin Management Action Plan process.

Canals in South Florida Executive Summary
v
Natural systems are periodically disturbed through natural processes (i.e., droughts, fires, floods,
hurricanes) and biological communities in a particular ecosystem reflect such disturbances over
time. By contrast, canals are disturbed almost continually by human interventions for
maintenance including herbicide application, mowing, dredging, removing obstructions, and
mechanical harvesting. As artificial conveyances with large variations in flow, stage, and water
turnover, canals provide less stable and predictable environments than other flowing waters.
South Florida canals are part of a large water management system and must convey large
volumes of water during storm events. (They do not have the floodplains that natural streams
have to reduce the velocity of high flow events, and instead have levees that keep flows in the
channel.) While water is retained in the drainage basins during major storms, canals are designed
to move high flows accompanied with relatively high velocities. They are more susceptible to
channel erosion and the delivery of larger volumes of water and contaminant loads downstream
than natural streams and wetlands. At the other extreme, during droughts and dry season
operations, canals may be stagnant for long periods and a small number may have little or no
water.
Scientific studies (especially in ecology) of canals are a tiny fraction of those found for other
South Florida ecosystems. The Everglades marsh numeric criterion for phosphorus was based on
literally hundreds of scientific articles spanning more than a decade. Similarly, the Total
Maximum Daily Load for Lake Okeechobee was supported by dozens of research publications
quantifying algal dynamics in relation to nutrient levels. The limited information available on
canal ecology provides some general concepts:
Canals provide marginal/stressed habitat for many aquatic species in South Florida.
Canals tend to have lower species diversity and richness than streams and those species
that are present tend to be indicative of stressed or structurally unstable conditions,
including many exotic and nuisance species such as hydrilla, cattails, and cichlid fishes.
Canals contain a diverse community of macroinvertebrates (e.g., larval stages of insects),
and the quality of macroinvertebrate assemblages is associated primarily with canal
physical features including habitat quality (particularly channel banks and aquatic
vegetation), adjacent land uses, and connectivity to wetlands. However, evidence
suggests that canals would fail the Stream Condition Index used by the Florida
Department of Environmental Protection for assessing impairment. The highly variable
nutrients levels in canals show no apparent relationship to macroinvertebrates.
Fish communities in canals are dominated by large predatory and exotic species. Canals
provide a pathway for the spread of exotic species, provide refugia for many species
during dry periods and thermal refugia for exotic species during cold events, and are a
source for recolonizing wetlands when wet conditions return.
Large alligators tend to live in canals, although survival of young alligators is greater in
marshes. Also, alligators in canals tend to be isolated from marsh alligators.

Canals in South Florida Contents
vi
CONTENTS
Canals in South Florida: ............................................................................................................... i
A Technical Support Document ................................................................................................... i
Prepared by .................................................................................................................................... i
South Florida Water Management District ................................................................................. i
West Palm Beach, Florida ............................................................................................................. i
Acknowledgements ....................................................................................................................... ii
Executive Summary ..................................................................................................................... iii
South Florida Canals in a Nutshell ............................................................................................ iii
Background ................................................................................................................................ iii
Canals of the South Florida Water Management System .......................................................... iii
Water Quality and System Ecology in South Florida Canals .................................................... iv
Figures ........................................................................................................................................... ix
Tables ............................................................................................................................................. x
Appendices ..................................................................................................................................... x
Introduction ................................................................................................................................... 1
1. The South Florida Canal System ........................................................................................... 3
Background on the Canal Report ................................................................................................ 3
Classification and Designated Uses ........................................................................................ 4
Change of Classification or Designated Use .......................................................................... 4
Historical Overview of the SFWMD Canal System ................................................................... 5
Origins ..................................................................................................................................... 5
Environmental Resource Management ................................................................................... 6
Features and Functions of South Florida Canals ........................................................................ 7
Canals in South Florida: A Practical Definition ..................................................................... 7
SFWMD Canals as Water Bodies ........................................................................................... 7
Types and Uses of Canals ....................................................................................................... 8
Design and Construction of Canals ....................................................................................... 10
Operation of Canals .............................................................................................................. 13
Maintenance Requirements ................................................................................................... 14
Description of Primary Water Management Features by Region ............................................. 15
Upper Kissimmee River Watershed ...................................................................................... 15
Canals in South Florida Contents
vii
Lower Kissimmee – Kissimmee River and Lake Istokpoga ................................................. 16
Everglades Agricultural Area................................................................................................ 19
Water Conservation Areas and Everglades National Park.................................................... 23
Upper East Coast - Martin and St. Lucie Counties ............................................................... 26
Lower East Coast – Palm Beach, Broward and Miami-Dade Counties ............................... 28
Lower West Coast Watersheds ............................................................................................. 32
2. Analysis of Biological Data from SFWMD Canals ............................................................ 37
Introduction ............................................................................................................................... 37
Macroinvertebrate Communities .............................................................................................. 37
Studies of Canals using FDEP methods ................................................................................ 37
Other Macroinvertebrate Studies in South Florida Canals ................................................... 43
Macroinvertebrate Studies in Canals in Other States............................................................ 44
Fish ............................................................................................................................................ 44
Canals Located in Undeveloped or Natural Areas of South Florida .................................... 44
Kissimmee River/C-38 Canal Studies .................................................................................. 46
Canals in Developed Areas ................................................................................................... 46
Fish Studies in Canals in Other Areas .................................................................................. 47
Birds .......................................................................................................................................... 47
Alligators .................................................................................................................................. 47
Reproduction and Development ........................................................................................... 47
Diet ........................................................................................................................................ 47
Hydrology ............................................................................................................................. 48
Migration and Distribution ................................................................................................... 48
Crocodiles ................................................................................................................................. 48
3. Survey of SFWMD Canal Water Quality and Sediments ................................................. 49
Introduction ............................................................................................................................... 49
Methods .................................................................................................................................... 49
Identification of Canal Water Quality Monitoring Stations.................................................. 49
Identification of Key Water Quality Constituents ................................................................ 51
Period of Analysis ................................................................................................................. 51
Data Management and QA/QC ............................................................................................. 51
Summary Statistics ................................................................................................................ 52

Canals in South Florida Contents
viii
Results and Discussion ............................................................................................................. 52
Regional Comparisons and Spatial Patterns ......................................................................... 52
Temporal Variability and Wet Season Effects ...................................................................... 52
Regional Canals .................................................................................................................... 59
Canal Stations ....................................................................................................................... 59
Summary ................................................................................................................................... 68
Sediments .................................................................................................................................. 69
4. Summary, Conclusions and Synthesis ................................................................................ 71
The South Florida Canal System: History, Function and Diversity ......................................... 71
History ................................................................................................................................... 71
Design and Function ............................................................................................................. 71
Diversity of Canals in the South Florida Water Management System ................................. 72
Upper and Lower Kissimmee Basins .................................................................................... 73
Everglades Agricultural Area................................................................................................ 73
Water Conservation Areas and Everglades National Park.................................................... 73
Upper East Coast ................................................................................................................... 74
Lower East Coast .................................................................................................................. 74
Caloosahatchee River Basin and Collier County .................................................................. 75
Analysis of Biological Data from South Florida Canals .......................................................... 75
Macroinvertebrate Communities in Canals........................................................................... 76
Fish Assemblages in Canals .................................................................................................. 77
Alligators and Crocodiles in Canals ..................................................................................... 78
Regional Trends in Canal Water Quality .................................................................................. 78
Phosphorus ............................................................................................................................ 79
Nitrogen ................................................................................................................................ 79
Chlorophyll a ........................................................................................................................ 79
Conductance .......................................................................................................................... 79
Local Variability ................................................................................................................... 79
Canal Sediments ....................................................................................................................... 80
A Context for Water Quality Management in South Florida Canals ........................................ 80
References .................................................................................................................................... 82
Canals in South Florida Figures, Tables and Appendices
ix
FIGURES
Figure 1. Primary SFWMD canals, structures, and major features of the hydrologic system. ....... 2
Figure 2. Cross-sections of representative canals ......................................................................... 12
Figure 3. Sub-basins and general features of the Lower Kissimmee River and Lake Istokpoga. 17
Figure 4. Everglades Agricultural Area drainage basins. ............................................................. 21
Figure 5. WCA and Everglades National Park Drainage Basins. ................................................. 25
Figure 6. Sub-basins and District facilities in Martin and St. Lucie counties. ............................. 27
Figure 7. SFWMD canals and structures in coastal sub-basins of Miami-Dade, Broward, and
Palm Beach counties. .................................................................................................................... 31
Figure 8. Major features of the Caloosahatchee River watershed. ............................................... 33
Figure 9. Major drainage basins and water management features within the
Big Cypress basin. ........................................................................................................................ 36
Figure 10. Macroinvertebrate sites within the District boundary sampled using
FDEP methods. ............................................................................................................................. 39
Figure 11. SFWMD monitoring locations used in this survey of water quality and the eight
regional groups of stations. ........................................................................................................... 50
Figure 12. Total phosphorus concentration summary statistics by region. ................................... 54
Figure 13. Total nitrogen concentration summary statistics by region. ........................................ 54
Figure 14. Corrected chlorophyll a concentration summary statistics by region. ........................ 55
Figure 15. Specific conductance summary statistics by region. ................................................... 55
Figure 16. Total phosphorus median values. ................................................................................ 56
Figure 17. Total nitrogen median values. ..................................................................................... 57
Figure 18. Total phosphorus concentration by region – wet season and annual. ......................... 58
Figure 19. Total phosphorus concentrations over time at S8........................................................ 58
Figure 20. Upper East Coast canals surveyed in this report. ........................................................ 60
Figure 21. Total phosphorus concentration summary statistics for canals in the
Upper East Coast region. .............................................................................................................. 61
Figure 22. Total nitrogen concentration summary statistics for canals in the
Upper East Coast region. .............................................................................................................. 61
Figure 23. Lower East Coast canals surveyed in this report ......................................................... 62
Figure 24. Total phosphorus concentration summary statistics for canals in the
Lower East Coast region. .............................................................................................................. 63
Figure 25. Total nitrogen concentration summary statistics for canals in the
Lower East Coast region. .............................................................................................................. 63
Figure 26. West Palm Beach canal stations. ................................................................................. 64

Canals in South Florida Figures, Tables and Appendices
x
Figure 27. Total phosphorus concentration summary statistics for stations in the
West Palm Beach Canal. ............................................................................................................... 65
Figure 28. Total nitrogen concentration summary statistics for stations in the
West Palm Beach Canal. ............................................................................................................... 65
Figure 29. Miami Canal stations. .................................................................................................. 66
Figure 30. Total phosphorus concentration summary statistics for stations in the
Miami Canal.................................................................................................................................. 67
Figure 31. Total nitrogen concentration summary statistics for stations in the
Miami Canal.................................................................................................................................. 67
TABLES
Table 1. Number of sites and metrics where macroinvertebrate, habitat, and water quality
data have been collected by FDEP in canals in South Florida. .................................................... 40
Table 2. Key canal water quality constituents. ............................................................................. 51
APPENDICES
Appendix A - Basic Concepts, Glossary of Terms and Abbreviations
Appendix B - Timelines of Canal Construction in the Kissimmee Watershed and South of Lake
Okeechobee
Appendix C - Additional Data and Description of SFWMD Canals and Water Control Structures
Appendix D - Summaries of Macroinvertebrate and Sediment Studies
Appendix E - Summaries of Fish Studies and Supplemental Data
Appendix F - Water Quality Summary Statistics by Region, by Canal and by Station
Appendix G - Sediment Studies

Canals in South Florida Introduction
1
INTRODUCTION
This document provides a review, summary, and analysis of historical and scientific information
related to the development, physical structure, uses, water quality, and ecology of primary canals
within the South Florida Water Management District‘s (District or SFWMD) borders. The main
report is written for a broad audience with extensive technical supporting documentation
provided as appendices.
The primary water conveyance system in South Florida consists of the network of canals and
associated features that are managed by the District and U.S. Army Corps of Engineers (shown
in Figure 1) for regional flood protection, water supply, navigation, drainage, and environmental
benefits.
The SFWMD has particular interest in the methods used to define how canals are designated and
how the development and application of numeric water quality criteria, especially nutrient
concentrations, will be developed and applied to the diversity of freshwater canal systems within
its jurisdiction. The District has compiled and summarized information on its canal system to
support these efforts. Emphasis has been placed on providing information concerning biological
communities, physical parameters, water quality conditions, and nutrient concentrations that may
be useful for setting criteria and designating appropriate use classifications.

Canals in South Florida Introduction
2
Figure 1. Primary SFWMD canals, structures, and major features of the hydrologic system.

Canals in South Florida South Florida Canal System
3
1. THE SOUTH FLORIDA CANAL SYSTEM
The SFWMD region is divided into seven study areas for the purposes of this report:
Upper Kissimmee
Lower Kissimmee River/Lake Istokpoga
Everglades Agricultural Area
Water Conservation Areas and Everglades National Park
Lower East Coast – Eastern Palm Beach, Broward, and Miami-Dade counties
Upper East Coast – Martin, St. Lucie, and part of Okeechobee Counties
Lower West Coast – Caloosahatchee River basin (Glades, Hendry, and Lee counties) and
Big Cypress basin in Collier County
These areas are based on pragmatic divisions of canals by basin, water supply and water
management. They may not be suitable for future water quality investigations to support
rulemaking. Information about the canals within each of these areas is summarized and analyzed
to characterize the canals‘ physical features, watersheds, water quality, and biological condition.
The analysis focuses on information, especially biological communities and water quality
criteria, that may be useful to develop general and specific descriptions of SFWMD canals, to
support ―Designated Use‖ classification of canals, and to support any associated rule
development. In some cases, effects of these canals on adjacent or downstream water
management areas, detention/retention areas, treatment areas, lakes, tributary creeks, rivers and
streams, and estuaries are discussed. This study also identifies significant gaps in our
understanding of canals that may require additional studies.
Some technical terms and concepts related to hydrology, ecology, and water quality are used, as
well as abbreviations and designations for water management features (e.g., canals, levees,
pumps, structures). A glossary of terms and a list of abbreviations are included in Appendix A.
Background on the Canal Report
The need to develop water quality criteria is based on requirements of the Clean Water Act, 33
U.S.C. § 1251, which provides the regulatory foundation for numerous water quality
management activities in the United States. The SFWMD and a diverse group of stakeholders are
participating in a rulemaking process initiated by the U.S. Environmental Protection Agency
(USEPA) and the Florida Department of Environmental Protection (FDEP) to designate uses of
water bodies and establish nutrient criteria for Florida waters, including canals.
The SFWMD will be directly affected by any actions that change designated uses or criteria in
the water quality standards because the District has jurisdiction over, and management
responsibilities for a wide variety and large number of water bodies in South Florida. These
water bodies range from natural lakes, rivers, and wetlands to artificially managed reservoirs,
retention and detention systems, treatment areas, and canals.
The FDEP plays a primary role in the rulemaking process through developing, monitoring, and
enforcing surface water quality standards at the state level. The standards specify the designated
Canals in South Florida South Florida Canal System
4
and potential uses of water bodies and set scientifically established physical, chemical, and
biological thresholds (criteria) to protect those uses. The standards also contain policies to
protect high quality waters. Taken together these standards ensure that a water body is suitable
for both human and aquatic life uses.
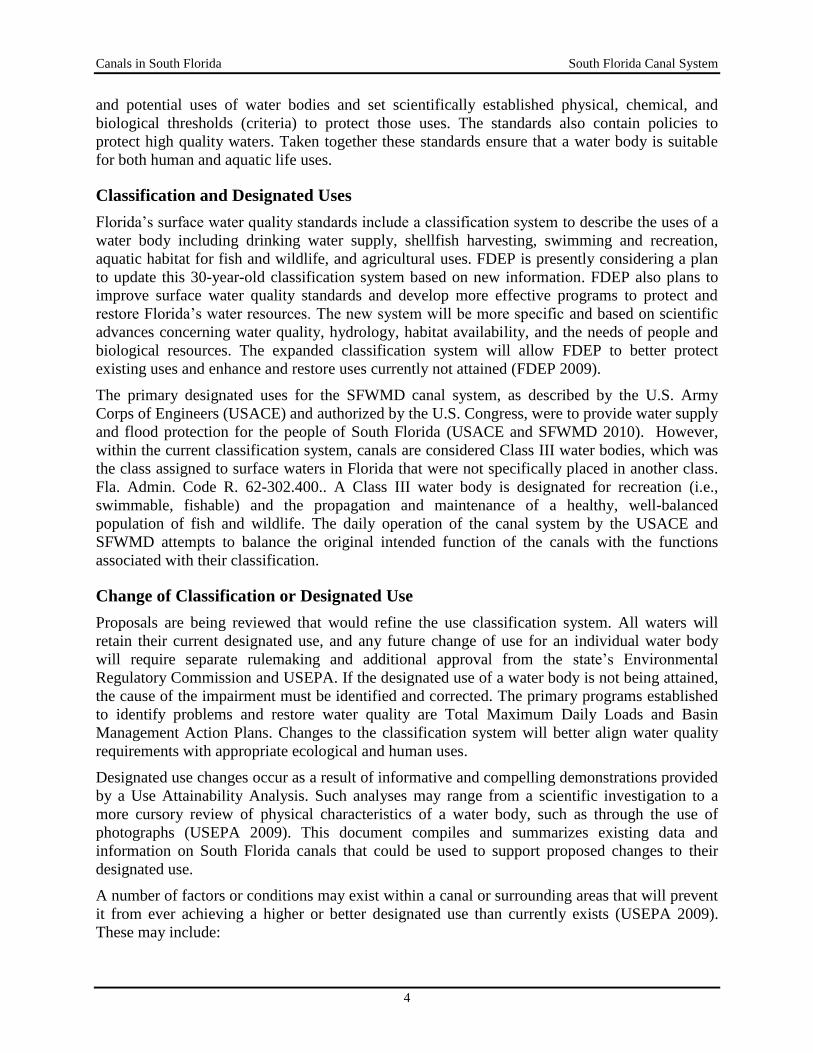
Classification and Designated Uses
Florida‘s surface water quality standards include a classification system to describe the uses of a
water body including drinking water supply, shellfish harvesting, swimming and recreation,
aquatic habitat for fish and wildlife, and agricultural uses. FDEP is presently considering a plan
to update this 30-year-old classification system based on new information. FDEP also plans to
improve surface water quality standards and develop more effective programs to protect and
restore Florida‘s water resources. The new system will be more specific and based on scientific
advances concerning water quality, hydrology, habitat availability, and the needs of people and
biological resources. The expanded classification system will allow FDEP to better protect
existing uses and enhance and restore uses currently not attained (FDEP 2009).
The primary designated uses for the SFWMD canal system, as described by the U.S. Army
Corps of Engineers (USACE) and authorized by the U.S. Congress, were to provide water supply
and flood protection for the people of South Florida (USACE and SFWMD 2010). However,
within the current classification system, canals are considered Class III water bodies, which was
the class assigned to surface waters in Florida that were not specifically placed in another class.
Fla. Admin. Code R. 62-302.400.. A Class III water body is designated for recreation (i.e.,
swimmable, fishable) and the propagation and maintenance of a healthy, well-balanced
population of fish and wildlife. The daily operation of the canal system by the USACE and
SFWMD attempts to balance the original intended function of the canals with the functions
associated with their classification.
Change of Classification or Designated Use
Proposals are being reviewed that would refine the use classification system. All waters will
retain their current designated use, and any future change of use for an individual water body
will require separate rulemaking and additional approval from the state‘s Environmental
Regulatory Commission and USEPA. If the designated use of a water body is not being attained,
the cause of the impairment must be identified and corrected. The primary programs established
to identify problems and restore water quality are Total Maximum Daily Loads and Basin
Management Action Plans. Changes to the classification system will better align water quality
requirements with appropriate ecological and human uses.
Designated use changes occur as a result of informative and compelling demonstrations provided
by a Use Attainability Analysis. Such analyses may range from a scientific investigation to a
more cursory review of physical characteristics of a water body, such as through the use of
photographs (USEPA 2009). This document compiles and summarizes existing data and
information on South Florida canals that could be used to support proposed changes to their
designated use.
A number of factors or conditions may exist within a canal or surrounding areas that will prevent
it from ever achieving a higher or better designated use than currently exists (USEPA 2009).
These may include:

Canals in South Florida South Florida Canal System
5
Naturally occurring pollutant concentrations
Natural, ephemeral, intermittent, or low flow conditions or water levels, unless these
conditions may be compensated for by the discharge of sufficient volume of effluent
without violating state water conservation requirements
Human-caused conditions or sources of pollution cannot be remedied or would cause
more environmental damage to correct than to leave in place
Dams, diversions, or other types of hydrologic modifications, and it is not feasible to
restore the water body to its original condition or to operate such modification in a way
that would result in the attainment of the use
Physical conditions related to natural features of the water body, such as lack of a proper
substrate, shade and cover, flow, depth, and the like, unrelated to water quality
Controls more stringent than those required by sections 301(b) and 306 of the Clean
Water Act would result in substantial and widespread economic and social impact
Canals intercept the water table, which is naturally low in dissolved oxygen and high in
iron and sulfates
Historical Overview of the SFWMD Canal System
From its inception until about the 1970s, the South Florida canal system served four primary
functions: drainage, navigation, flood control, and water supply. Ecological functions and
recreational uses have developed as incidental benefits.
Origins
Construction of what is today the primary canal system in South Florida began about 1880 in the
Kissimmee River Valley. In 1881, Hamilton Disston purchased four million acres of swampland
from the state and initiated efforts to drain this land. He channelized the Kissimmee River during
1881 and 1882 to connect Lake Kissimmee with Lake Okeechobee and then proceeded to
connect Lake Okeechobee westward to the Caloosahatchee River with the intent to create a
navigable route to Fort Myers. Disston continued channelization of the upper Kissimmee lakes
and constructed a number of the canals that connected the lakes together in what is today known
as the Kissimmee Chain of Lakes.
The first canals were dug to drain swamps and marshes to promote cultivation and provide
navigable links between agricultural communities in the interior of the state and markets in the
coastal cities. These canals drained the land but the effects often did not extend far from the
waterway and the initial system was overwhelmed by normal wet season rainfall. To be effective
over a larger area, the central canals were eventually enlarged and extensive networks of smaller
secondary and tertiary drainage systems were built. A timeline for these activities north of Lake
Okeechobee is provided in Appendix B.
The second phase of early canal construction was conducted south of Lake Okeechobee in the
Everglades. Although Hamilton Disston constructed a partial canal in the 1880s, serious
dredging did not begin until the early 1900s and continued until 1949. A timeline of activities
south of Lake Okeechobee is presented in Appendix B.
Canals in South Florida South Florida Canal System
6
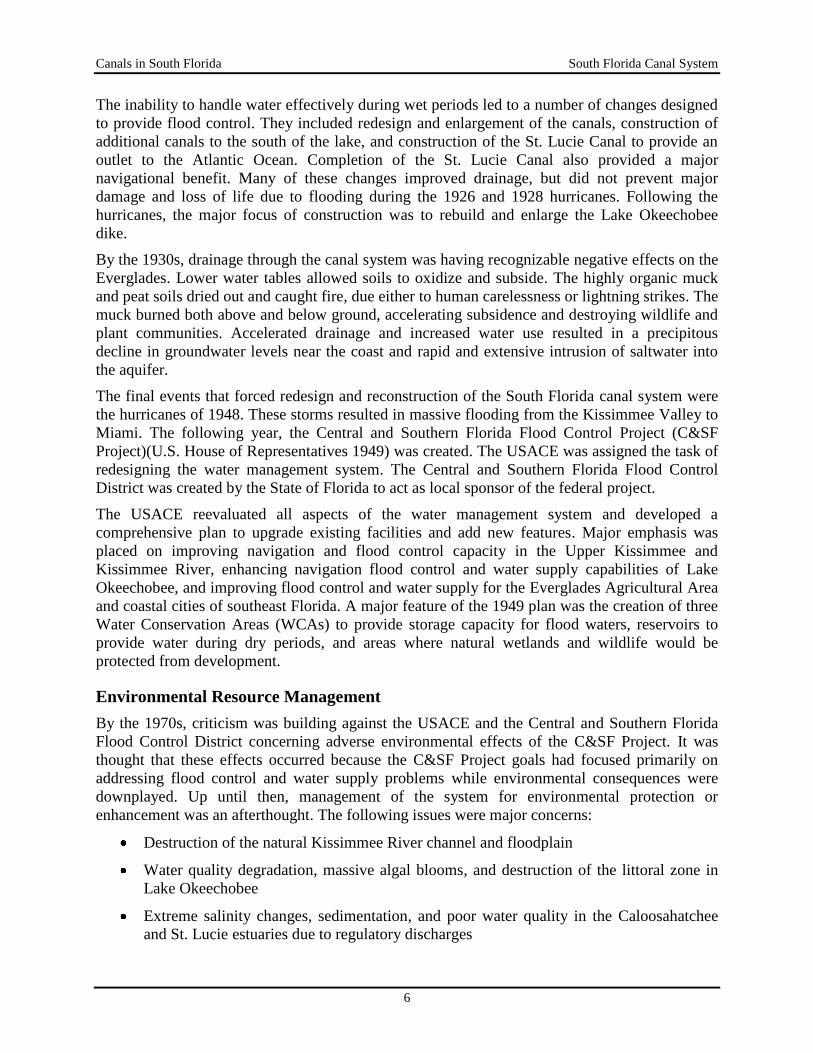
The inability to handle water effectively during wet periods led to a number of changes designed
to provide flood control. They included redesign and enlargement of the canals, construction of
additional canals to the south of the lake, and construction of the St. Lucie Canal to provide an
outlet to the Atlantic Ocean. Completion of the St. Lucie Canal also provided a major
navigational benefit. Many of these changes improved drainage, but did not prevent major
damage and loss of life due to flooding during the 1926 and 1928 hurricanes. Following the
hurricanes, the major focus of construction was to rebuild and enlarge the Lake Okeechobee
dike.
By the 1930s, drainage through the canal system was having recognizable negative effects on the
Everglades. Lower water tables allowed soils to oxidize and subside. The highly organic muck
and peat soils dried out and caught fire, due either to human carelessness or lightning strikes. The
muck burned both above and below ground, accelerating subsidence and destroying wildlife and
plant communities. Accelerated drainage and increased water use resulted in a precipitous
decline in groundwater levels near the coast and rapid and extensive intrusion of saltwater into
the aquifer.
The final events that forced redesign and reconstruction of the South Florida canal system were
the hurricanes of 1948. These storms resulted in massive flooding from the Kissimmee Valley to
Miami. The following year, the Central and Southern Florida Flood Control Project (C&SF
Project)(U.S. House of Representatives 1949) was created. The USACE was assigned the task of
redesigning the water management system. The Central and Southern Florida Flood Control
District was created by the State of Florida to act as local sponsor of the federal project.
The USACE reevaluated all aspects of the water management system and developed a
comprehensive plan to upgrade existing facilities and add new features. Major emphasis was
placed on improving navigation and flood control capacity in the Upper Kissimmee and
Kissimmee River, enhancing navigation flood control and water supply capabilities of Lake
Okeechobee, and improving flood control and water supply for the Everglades Agricultural Area
and coastal cities of southeast Florida. A major feature of the 1949 plan was the creation of three
Water Conservation Areas (WCAs) to provide storage capacity for flood waters, reservoirs to
provide water during dry periods, and areas where natural wetlands and wildlife would be
protected from development.
Environmental Resource Management
By the 1970s, criticism was building against the USACE and the Central and Southern Florida
Flood Control District concerning adverse environmental effects of the C&SF Project. It was
thought that these effects occurred because the C&SF Project goals had focused primarily on
addressing flood control and water supply problems while environmental consequences were
downplayed. Up until then, management of the system for environmental protection or
enhancement was an afterthought. The following issues were major concerns:
Destruction of the natural Kissimmee River channel and floodplain
Water quality degradation, massive algal blooms, and destruction of the littoral zone in
Lake Okeechobee
Extreme salinity changes, sedimentation, and poor water quality in the Caloosahatchee
and St. Lucie estuaries due to regulatory discharges

Canals in South Florida South Florida Canal System
7
Eutrophication and poor water quality in Lake Okeechobee due to channelization in the
basin and backpumping from the Everglades Agricultural Area
Damage to fish populations and deer herds in the WCAs
Loss of tree islands and degradation of the ridge and slough landscape in the Everglades
Inappropriate distribution of flows (i.e., too little during dry periods, too much during wet
periods) and poor water quality delivered to Everglades National Park
Seagrass die-offs and algal blooms in Florida Bay
The Florida legislature responded with the 1972 Water Resources Act, which renamed the
Central and Southern Florida Flood Control District to the South Florida Water Management
District, spelled out environmental management responsibilities for the agency, and formally
established the Florida Department of Environmental Regulation (now the FDEP) as the agency
with authority to oversee SFWMD management of environmental aspects of the C&SF Project.
Chapter 373, Fla. Stat. (2009).
Features and Functions of South Florida Canals
Canals in South Florida: A Practical Definition
In Florida state statutes, a canal is defined as ―a man-made trench, the bottom of which is
normally covered by water with the upper edges of its sides normally above water.‖ 403.803(2),
Fla. Stat. However, this definition is not functionally descriptive for the diverse system of canals
in South Florida. The following definition of canals in South Florida is consistent with other
common definitions2 and is more complete and useful for the purposes of this technical support
document:
A canal within the South Florida Water Management District is a man-made waterway dug as an
open trapezoidal channel for navigation or conveyance of water. Canals in South Florida are
designed to provide flood control, drainage, navigation, and water supply for agriculture, human
consumption, or the environment; canals can provide coincidental ecological, aesthetic, and
recreational values. Some regional canals have been created where no water course existed
before, while many others have been created by channelizing and connecting natural streams,
rivers or wetlands.
SFWMD Canals as Water Bodies
More than 1800 miles of such canals currently exist as part of the SFWMD primary water
management system. Canals serve an especially important role because they provide the primary
means by which water is moved in southern Florida. Without the canals, and their associated
pumps and control structures, water could not be effectively managed in the region and the
modern landscape of agricultural and urban development would not exist.
2 See the definitions of ―canal‖ at Your Dictionary.com (http://www.yourdictionary.com/canal)
and Merriam-Webster.com (http://www.merriam-webster.com/dictionary/canal).

Canals in South Florida South Florida Canal System
8
Much of the South Florida canal system originated as a legacy of channels constructed between
1880 and 1950 by various interests and for various purposes. As a result, there were not uniform
specifications. Beginning with the initiation of the C&SF Project in the 1950s, responsibility for
this network was adopted by USACE and the predecessor of the SFWMD. The design, flow
capacity, and associated structures and pumps of these canals have been extensively modified or
redesigned to meet modern engineering standards. These changes were based on a qualitative
and quantitative assessment of the present and anticipated future needs for water supply and
flood control within their drainage basins.
Canals are substantially different from most natural water bodies. Various features of their
design, construction, operation, and maintenance make them marginal habitats for most aquatic
life. Water levels and flow rates are subject to extreme fluctuations; depending on operational
needs, water may flow through a canal as if in a stream or sit as if in a reservoir. The sides of
canals are generally very steep and do not feature shallow areas that would support fish or
aquatic plant communities. Unlike natural river or stream systems, canals typically lack mature
vegetation communities (e.g., trees and shrubs) that stabilize channel banks, provide a diversity
of aquatic habitats, and shade the channel to reduce primary production and minimize swings in
dissolved oxygen, temperature, and pH. In general, the lack of suitable water depths, areas, flow
regimes, or substrate in canals prevents development of stable littoral, shoreline, and benthic
communities.
The surface water that enters canals often consists of runoff from urban and agricultural lands. It
may contain chemical fertilizers, pesticides, and other pollutants. The runoff also may carry large
amounts of suspended solids and is often highly colored from the presence of organic materials.
For this reason, light penetration is very low, which further inhibits growth of aquatic plants and
contributes to low oxygen concentrations.
Many of the canals are deep enough to penetrate the surficial aquifer, which contributes to
elevated nutrient and dissolved ion concentrations and low concentrations of dissolved oxygen in
the canal. Groundwater can also introduce contaminants from septic tanks and landfills. Many of
the aquifers in South Florida contain extremely high natural iron concentrations and surface
water bodies are often listed as impaired for iron. As iron oxidizes in the surface water body,
physical (increased color and turbidity) and chemical (decreased dissolved oxygen) processes
can further degrade water quality (Alleman et al. 1995, Brown 2003).
Despite the physical drawbacks, canals can provide incidental habitat for a wide variety of plants
and animals. Many organisms migrate into canals and become established over time. Canals are
often conducive to exotic species that may be better suited for such a habitat if it is more like
their natural environment or lacks predators.
Types and Uses of Canals
The primary canal system in South Florida consists of channels and associated features that are
managed by the SFWMD and USACE. Secondary systems consist of canals and features that are
managed by designated drainage districts or private entities, which may discharge to the coast or
receiving lakes, or into the primary system. Such secondary systems operate under permits
issued by the SFWMD. Tertiary systems consist of canals and features generally located on
private lands that provide localized drainage, such as for farms or residential developments, and

Canals in South Florida South Florida Canal System
9
discharge into retention/detention areas or into secondary systems. Such systems generally
operate and are regulated under a permit issued by the SFWMD.
The South Florida canal system is now managed for a much wider array of objectives than what
was originally intended. Uses of canals are summarized as follows:
Provide routes for waterborne transportation
Provide conveyance
- Drain surface water and groundwater over time to transform wetlands into dry
land suitable for human use
- Remove surface runoff rapidly from critical areas to minimize or avoid loss of
life or damage to crops or human structures
- Move excess water to tide
- Move water for human consumption or irrigation
- Move water to maintain appropriate flows in rivers and streams and maintain
salinity conditions in estuaries
Regulate water levels
- Move water seasonally or prior to a storm event to lower surface and
groundwater levels and enhance local basin storage
- Move water to maintain water levels below ground to enhance seepage and
crop production
- Move water to maintain groundwater levels that recharge wellfields and
protect aquifers from saltwater intrusion
- Move water to maintain appropriate water levels in lakes or wetlands
Storage
- Provide means to enhance local storage in groundwater or surface reservoirs
- Provide means to move water into and out of regional storage areas
Control seepage
- Enhance storage capabilities in reservoirs and conservation areas
- Protect adjacent areas from flooding
Support ecological systems
- Maintain appropriate water levels to minimize excessive drying or flooding
- Provide deep water habitat as refuge during droughts
- Limit the amount of exchange between contaminated or polluted water being
conveyed and less contaminated or uncontaminated water in the adjacent
wetlands
Canals in South Florida South Florida Canal System
10
Besides being built for their obvious benefits and primary uses, canals have also been created as
artifacts of the construction of levees or roadways. Such ―borrow canals‖ represent the area
where dirt and rock were removed to construct the levee or roadway. These channels may
subsequently become major conduits within a basin for drainage, flood control, water supply, or
conveyance.
Canals themselves also provide some limited environmental benefits. In some instances, canals
within shallow wetlands provide areas where larger fish and alligators prefer to live, and where
fish and wildlife can congregate during droughts. Without the canals, these animals may not
move into these areas. The associated levees and roadways provide upland areas where wildlife
can find dry land during floods. Levees and canals also facilitate public access to remote areas
for fishing, hunting, wildlife viewing, and other forms of recreation. Canals throughout the
District are also used extensively for recreational fishing (Florida Fish and Wildlife Conservation
Commission 2009).
In addition to their beneficial uses, canals may have harmful consequences. Canals receive
runoff from adjacent lands and roadways that may create water quality problems in the canals
themselves, adjacent wetlands, or the underlying aquifer system. They may also intercept or
divert overland flow, affecting hydrologic conditions and vegetation patterns. Canals also
provide conduits for transport of nutrients and pollutants over long distances and facilitate the
dispersal of exotic aquatic plants and animals. Over long periods, canals can result in chronic
overdrainage and soil subsidence, especially in areas such as the Everglades Agricultural Area
and the Everglades that have muck soils with high concentrations of organic material that
become oxidized.
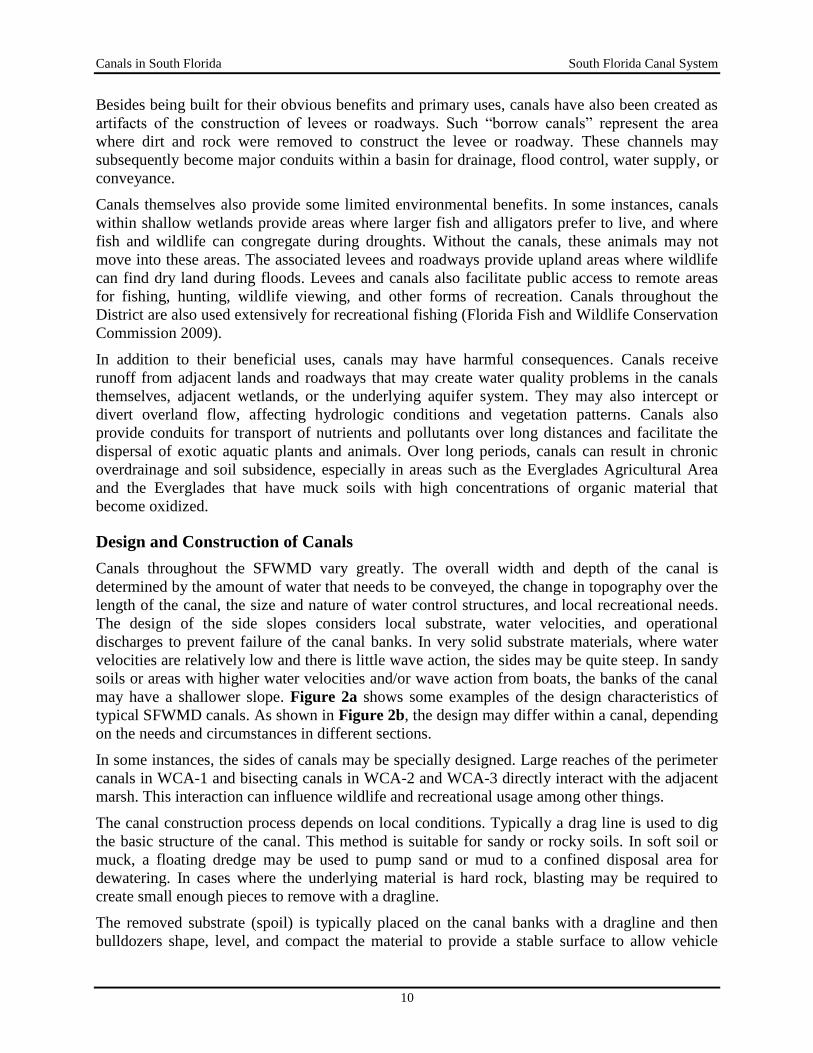
Design and Construction of Canals
Canals throughout the SFWMD vary greatly. The overall width and depth of the canal is
determined by the amount of water that needs to be conveyed, the change in topography over the
length of the canal, the size and nature of water control structures, and local recreational needs.
The design of the side slopes considers local substrate, water velocities, and operational
discharges to prevent failure of the canal banks. In very solid substrate materials, where water
velocities are relatively low and there is little wave action, the sides may be quite steep. In sandy
soils or areas with higher water velocities and/or wave action from boats, the banks of the canal
may have a shallower slope. Figure 2a shows some examples of the design characteristics of
typical SFWMD canals. As shown in Figure 2b, the design may differ within a canal, depending
on the needs and circumstances in different sections.
In some instances, the sides of canals may be specially designed. Large reaches of the perimeter
canals in WCA-1 and bisecting canals in WCA-2 and WCA-3 directly interact with the adjacent
marsh. This interaction can influence wildlife and recreational usage among other things.
The canal construction process depends on local conditions. Typically a drag line is used to dig
the basic structure of the canal. This method is suitable for sandy or rocky soils. In soft soil or
muck, a floating dredge may be used to pump sand or mud to a confined disposal area for
dewatering. In cases where the underlying material is hard rock, blasting may be required to
create small enough pieces to remove with a dragline.
The removed substrate (spoil) is typically placed on the canal banks with a dragline and then
bulldozers shape, level, and compact the material to provide a stable surface to allow vehicle

Canals in South Florida South Florida Canal System
11
traffic on top or along the side for maintenance or public access. If there is a need for the spoil
elsewhere, it may be removed. If creation of an embankment may cause drainage or other
problems, the spoil may be spread over adjacent land.

Canals in South Florida South Florida Canal System
12 March 16, 2010
Figure 2. Cross-sections of representative canals within (a) Miami-Dade (C-100), Broward (C-12) and Palm Beach (C-18) counties and Kissimmee River Channel (C-38) and (b) selected locations within the West Palm Beach Canal (C-51).

Canals in South Florida Primary Water Management Features
13
Operation of Canals
The primary water management system operated by the SFWMD (not including the Naples/Big
Cypress area, which is managed separately from the rest of the District) consists of more than
140 named canals or canal segments. These canals and canal segments are used for flood control,
water supply, irrigation, environmental restoration, navigation, or a combination of these. All
canal segments either contain a water control structure within them or are directly influenced by
the operation of an upstream or downstream control structure. As such, water levels in all canal
segments are effectively controlled through the operation of water control structures. Most
control structures, along with the upstream and downstream water levels, are monitored
electronically on a continuous basis.
Each control structure is operated according to normal operational criteria or based on a normal
lake or water conservation area regulation schedule. During unusual meteorological conditions
such as droughts or water shortages, it may not be possible to maintain water levels in the canals
as stated in the operational criteria or lake regulation schedules. In anticipation of large storm
events, water levels may be lowered preemptively to increase storage and reduce the risk to
human health and property from flooding.
The continuous monitoring and operation of the water management system is complicated by the
various competing interests for the water, and is further complicated by the physical limitations
of the canals and water control structures. Some of these include, but are not limited to, the
following:
Agricultural water demands
Recharge of groundwater
Prevention of saltwater intrusion
Water supply for utilities
Water supply for environmental purposes
Maintaining water level regulation schedules for various lakes
Maintaining water levels for navigation
Legal obligations (e.g., Everglades water quality requirements)
Water reservations
Local and regional flood control
Drought and water shortage operations
Maintenance of the canals and water control structures
Design and/or operational limitations of the canals and water control structures
Instrumentation and/or mechanical failures at water control structures

Canals in South Florida Primary Water Management Features
14
Maintenance Requirements
The South Florida primary canal network, being an entirely engineered system, requires
considerable effort to maintain its function. Structures have to be opened, closed, and
maintained. Pumps have to be placed in operation, fueled, maintained, shut off when not needed,
and replaced when they become obsolete or worn out. Canals have to be cleaned of plants,
debris, and sediments, and erosion needs to be controlled or repaired. These activities are
performed routinely throughout the year and often continuously during peak performance
periods or emergencies. Canal right-of-ways need to be maintained to ensure access, protect
stability of the banks, and allow maximum flow of water through canals during storm events.
Canal maintenance activities are summarized as follows:
Herbicide applications using ground, water, or aerial applications for the treatment of
exotic vegetation within its boundaries. Targeted vegetation includes aquatic, terrestrial,
and wetland species.
Aquatic mechanical harvesting removes excessive and obstructive aquatic vegetation
from District water bodies. Similar equipment is often used to remove floating debris
from urban canals.
Tree management and removal from canals, levees, and right-of-ways is essential to
ensure water conveyance and equipment access to District canals. Types of trees targeted
for removal include dead, dying, leaning, unhealthy, invasive/exotic species, or those that
fall within the District canals‘ right-of-way.
Weed barrier cleaning is necessary on a regular basis to remove trash, weeds, and
debris so the canal can convey design water flows.
Grading levee berms and roads to maintain a reasonably smooth and drivable surface.
Boat ramp installation and maintenance is necessary to provide access for District
boats and water-based equipment launched into canals.
Erosion repairs are needed due to wave action, pump station or structure discharges,
secondary discharges, surface water flows, and animal burrows.
Berm culverts are installed on canal right-of-ways, access roads, and maintenance berms
to divert water from swales and to prevent canal bank erosion.
Flat mowing helps to delineate the District right-of-way and to keep the area free from
undesirable vegetation.
Side slope mowing keeps canal banks free from unwanted vegetation and provides staff
with the ability to perform visual inspections of side slopes to find undermining and
erosion.
Shoal removal is performed when sediment accumulates within the canal and reduces
the ability to convey design water flows.

Canals in South Florida Primary Water Management Features
15
Description of Primary Water Management Features by Region
The following sections provide an overview of the primary water management system within the
SFWMD. For the purposes of this document, the District is divided into seven study regions,
based primarily on hydrology. Each region has a distinct history, operational constraints, soil,
land use, and topographic conditions that affect canals. Information about the canals within each
area has been compiled, summarized, and analyzed in an attempt to characterize the unique
features of each of these water regions. Water quality and biological conditions in canals within
each region are presented and summarized in subsequent parts of this report. More detailed
consideration of individual canals, basins, sub-basins, and water control features is provided in
Appendix C.
Upper Kissimmee River Watershed
Introduction
The Upper Kissimmee River watershed covers an area of 1596 square miles in Osceola, Polk,
Orange, and Lake counties. The SFWMD and USACE have authority over the primary water
management system. Several local drainage districts have local water management
responsibilities within this area. The watershed includes 18 major sub-basins, 15 SFWMD
primary canals, and 9 structures. Of the sub-basins, six (Boggy Creek, Shingle Creek, Reedy
Creek, Horse Creek, Lake Pierce, and Lake Weohyakapka) do not have any SFWMD canals or
structures.
Much of this watershed consists of open water (lakes, rivers, and canals) and wetlands. The
remaining uplands are primarily used for agricultural crops and pasture. Urban areas include
Kissimmee and St. Cloud. Kissimmee in the Lake Tohopekaliga basin is the hub of the cattle
industry in Central Florida. St. Cloud is in the East Lake Tohopekaliga basin, just south of East
Lake Tohopekaliga.
Many of the lakes in this region are connected by depressional features and wetlands. Historical
records confirm that before canals were dug, much of this area flooded frequently and was not
suitable for habitation or agricultural use. The original canals connecting the lakes in this region
were constructed through low-lying depressions, wetlands, and hydric soils. Canal construction
in the Upper Kissimmee River watershed lowered water levels considerably and made the
adjacent lands suitable for development.
Lakes are important features of the Upper Kissimmee River watershed. The major lakes have
been linked by canals to form a chain. Depending on local conditions, water may flow south
from one lake to another following a storm event or during periods of high water use. During
other periods, water may flow from south to north as conditions change. Thus water may flow
either north from Alligator Lake to Lake Mary Jane or south from Alligator Lake to Lake
Gentry. The western chain begins with Lake Hart, continues through Ajay Lake, East Lake
Tohopekaliga and Lake Tohopekaliga, and discharges into Cypress Lake. From Cypress Lake the
chain continues with Lake Hatchineha and finally, Lake Kissimmee. All major lakes in this basin
are shallow; mean depths vary from 6 to 13 feet. Lake water surface elevations vary with
topography of the area, ranging from 65 feet in Alligator Lake to 52 feet in Lake Kissimmee (see
Appendix C).
Canals in South Florida Primary Water Management Features
16
The primary canals and water control structures allow management and diversion of water within
this network to support navigation and to enhance irrigation, water supply, and flood control
capabilities in response to local conditions. Since 1971, extreme drawdowns have been used in
Lake Tohopekaliga, East Lake Tohopekaliga, and Lake Kissimmee to improve aquatic habitat,
water quality, and biological resources. Such reductions in water levels can only occur because
of the canal system that allows diversion of surface water flows.
The surface water management basins of the Upper Kissimmee River watershed were first
delineated in the mid-1950s by the USACE in their General Design Memoranda for the C&SF
Project. The canals and control structures were further modified based on a series of Detailed
Design Memoranda, primarily for flood control. Most of the hydraulic works constructed under
the C&SF Project are now managed by the SFWMD. Their use has since evolved to meet
demands caused by population growth, land use development, and increased water use.
The Primary Water Management System – Canals, Structures and Operations
The primary canal system in the Upper Kissimmee River Watershed consists of a network of 15
canals that range from 0.2 to 4.5 miles in length with a total length of 31.1 miles (see Appendix
C). The canals generally link one lake to another. The drainage area for each canal ranges from
21 to 60 square miles. Water levels, flows, or both in eight of these canals are controlled by
water management structures. Two of the structures (S-61 and S-65) include navigational locks.
Water levels in seven of the eight canals with water control structures are also constrained by
regulation schedules in one or both of the connected lakes. Operation of the canals and structures
are based both on local and regional water levels and weather conditions. When water levels are
above prescribed elevations, flood operation protocols and criteria are followed; low-water or
drought management operations are followed if water levels fall below prescribed depths.
Operations also depend on hydraulic and physical limitations of the structures. Additional details
concerning the canals, structures, and operational procedures are provided in Appendix C.
Lower Kissimmee – Kissimmee River and Lake Istokpoga
Introduction
The Lower Kissimmee River basin covers 727 square miles from Lake Kissimmee to Lake
Okeechobee, and includes 20 basins in parts of Osceola, Polk, Highlands, Okeechobee, and
Glades counties. These basins were first delineated in the 1950s by the USACE in their General
Design Memorandum for the C&SF Project. Discharge from all of these basins eventually
reaches Lake Okeechobee. The basin boundaries of the Lower Kissimmee River and Lake
Istokpoga areas, canals, levees, and control structures relative to roads, local landmarks, and
county lines are shown in Figure 3.
Nutrient concentrations in the Kissimmee River increase downstream due, in part, to increased
agricultural activity in the lower basins. Best Management Practices are being implemented to
various degrees to reduce nutrient loads from agriculture.
The vegetation in the Lower Kissimmee River basins changes with surface water depth,
elevation, type of soil, and extent of agricultural activity. The terrestrial forested areas are
covered with oak, cabbage palm, wax myrtle, and woody shrub. The wetland forests contain

Canals in South Florida Primary Water Management Features
17
willows, hardwood, and cypress. The marshy areas are covered with maidencane, aquatic
grasses, buttonbush, switchgrass, sawgrass, and various other plants.
The Lower Kissimmee-Lake Istokpoga area is not significantly developed. Land use patterns
reflect large areas of open land, rangeland, and agricultural use. The agricultural land consists of
intensively managed beef pasture, semi-improved beef pasture, improved dairy pasture, and
citrus groves. Winter truck crops and ornamental plant production are also important to the area.
Soils generally consist of high permeability sands. Along the floodplain of the Kissimmee River,
the soil type is sand and shell overlain by a variable layer of muck, peat, and unrecompensed
organic matter. The general soil classifications within the watershed indicate the relative extent
of hydric and poorly drained soils. Much of the area is prone to flooding and most of the canals
were constructed in these types of soils, which contributes to their construction and management
characteristics.
Figure 3. Sub-basins and general features of the Lower Kissimmee River and Lake Istokpoga.
Canals in South Florida Primary Water Management Features
18
The Primary Water Management System
Canals, Structures and Operations
The primary water management system in the Lower Kissimmee River/Lake Istokpoga Basin
consists of 11 canals and 40 water control structures. District canals and structures play an
important role in distributing water as needed to protect adjacent land uses, natural areas, and
biological communities in the river and lake. Additional details concerning the canals and their
operations are provided in Appendix C.
The C-38 Canal is the channel that was constructed by the USACE through the Kissimmee River
floodplain. This canal ranges from 90 to 340 feet wide and from 18 to 24 feet deep. Water levels
and flows in portions of the C-38 Canal are currently managed as part of the Kissimmee River
restoration. Sections of the canal have been filled, the S-65B locks and associated water control
structures were removed, and flow restored to oxbows. The primary canals (C-40, C-41, and
C-41A) and structures south of Lake Istokpoga provide drainage and flood control to adjacent
lands, convey excess flood waters from the Lake Istokpoga into regional storage in Lake
Okeechobee, and distribute water from the lakes to agricultural lands during drought. These four
primary canals and eight additional smaller canals and levee borrow canals (C-39A, L-48, L-49,
L-59, L-60, L-61, L-62, and L-63) comprise the primary water conveyance channels in the
Lower Kissimmee River basin. Most of these canals were designed for water conveyance
purposes. The various borrow canals were built in conjunction with construction of basin divide
levees and to help remove runoff and floodwaters from basin lands
The C-38 Canal extends 69 miles from Lake Kissimmee to Lake Okeechobee and consists of
five sub-basins. Four other basins (C-41A, L-59E, S-154, and S-154C) discharge into the section
of the C-38 Canal located between S-65E and Lake Okeechobee. Two of the primary canals
south of Lake Istokpoga (C-40 and C-41) ultimately discharge to Lake Okeechobee. Four basins
(L-59W, L-60E, L-60W, and L-61E) discharge into these canals. The remaining sub-basins in
this area discharge directly to Lake Okeechobee.
Kissimmee River Restoration Efforts
The Kissimmee River once meandered for 103 miles through Central Florida. Its floodplain,
reaching up to 3 miles wide, was inundated for long periods by heavy seasonal rains. Wetland
plants, wading birds, and fish thrived there. Prolonged flooding affected the local population,
which led to engineering changes to deepen, straighten, and widen the waterway. In the 1960s,
the Kissimmee River was cut and dredged to create the C-38 Canal. Before channelization was
complete, biologists suspected the project would have devastating ecological consequences.
While the project provided flood protection, it also destroyed a floodplain-dependent ecosystem
that nurtured threatened and endangered species, as well as hundreds of other animals.
Channelization of the Kissimmee River dramatically altered the system‘s hydrology and resulted
in drainage or obliteration of almost 35,000 acres of floodplain wetlands, elimination of in-
stream and overbank flow, and isolation of the river from its floodplain (Koebel 1995). These
hydrologic alterations propagated changes in physical, chemical, and biological aspects of the
ecosystem, reduced diversity, and diminished biotic integrity (Dahm et al. 1995). Reduced
dissolved oxygen levels, increased biological oxygen demand, and subsequent restructuring of

Canals in South Florida Primary Water Management Features
19
the food web contributed to these declines. These changes led to decreased fish density within
the river channel and restricted use of floodplain habitats by small-bodied forage fishes.
The effort to return flow to 43 miles of the Kissimmee River's historic channel and restore about
40 square miles of river/floodplain ecosystem began in 1999. After extensive planning,
restoration began with backfilling 7.5 miles of the C-38 Canal and removal of the S-65B
structure. Three construction phases are now complete and continuous water flow was
reestablished to 27 miles of the meandering Kissimmee River. Seasonal rains and flows now
inundate the floodplain in the restored area.
Since restoration began, the river and its floodplain have improved in remarkable ways,
surpassing at times the anticipated environmental response. Comprehensive monitoring for the
past 10 years has documented the following improvements relative to pre-restoration conditions:
The aquatic wading bird population in the restored river and floodplain region is more
than five times greater. The number of aquatic wading birds, including white ibis, great
egret, snowy egret, and little blue heron, has increased significantly; in some years they
are more than double the restoration target.
Duck species including fulvous whistling duck, northern pintail, northern shoveler,
American wigeon, and ring-necked duck have returned to the floodplain.
Several shorebird species including American avocet, black-necked stilt, dowitcher,
greater yellowlegs, semipalmated plover, least sandpiper, spotted sandpiper, and western
sandpiper have returned to the river and floodplain.
Organic deposits on the river bottom decreased by 71 percent, reestablishing sand bars
and providing new habitat for shorebirds and invertebrates, including native clams.
Dissolved oxygen levels have increased to a range normally observed in minimally
impacted Florida streams.
Largemouth bass and sunfishes now comprise 64 percent of the fish community, up from
38 percent.
Everglades Agricultural Area
Introduction
The Everglades Agricultural Area comprises those lands south and southeast of Lake
Okeechobee in Palm Beach, Martin, Hendry, and Glades counties. These lands were originally
part of the natural Everglades system, but were deemed well-suited for agricultural use. The area
was drained and used for agricultural production beginning in the early 1900s.
The primary water management system in the Everglades Agricultural Area consists of a
network of levees, canals, and water control structures. The canals were originally constructed to
provide drainage and to transport agricultural products to urban markets. Later, they were
enlarged and pumps and structures added to enhance water supply deliveries to agricultural and
urban areas during dry periods and provide additional drainage and flood protection during wet
periods. Coastal structures were added and water levels were raised to control soil subsidence
and saltwater intrusion. Most recently, canals in the area are used to convey stormwater flows
into and out of the Stormwater Treatment Areas for treatment prior to delivery to the WCAs.

Canals in South Florida Primary Water Management Features
20
Nine water management basins within the Everglades Agricultural Area have a combined area of
1181 square miles and are served by 15 primary canals and 25 water control structures (Figure
4). The L-8, S-4, and S-236 basins are not strictly part of the Everglades Agricultural Area legal
boundary, but are presently included because they are closely tied to the agricultural area, Lake
Okeechobee, or the WCAs by hydrology and water management. In general they are used to
discharge excess water from the basins during flooding and to maintain minimum water levels in
the canals during periods of low natural flow.
Extensive networks of secondary and tertiary canal systems are operated by landowners within
the Everglades Agricultural Area that periodically remove water from, and discharge to, the
primary water canals. Although these systems operate under permits from the SFWMD, they are
largely managed to meet the needs of individual farms and crops. These activities by private
interests can have significant impacts on the overall timing and volume of flow through and
water levels within the canal system at any given time.
Soils
Most soils in the Everglades Agricultural Area are muck or peat with a high content of organic
material. Flatwoods soils are used for sugarcane and citrus production and cattle ranching. The
L-8 basin contains depressional muck, sand, and peat intermixed with sandy soils. The watershed
largely consists of public lands that are protected in preserves and wildlife management areas.
The bedrock underlying the area has very low permeability and transmissivity, so there is less
exchange with the surficial aquifer than occurs in other parts of the District. The shallow aquifer
is not used as a significant source of irrigation water due to generally low yields and the presence
of connate (trapped) seawater in many areas. Crops are irrigated with water taken directly from
the canals and excess water from the fields flows or is pumped back into the canals. Water in the
Everglades Agricultural Area canals is dark due to the presence of tannins from the organic soils,
has high levels of organic materials, and occasionally has low concentrations of dissolved
oxygen. Nitrogen concentrations in the canals can be elevated due to decomposition of organic
material in soil. Phosphorus concentrations, as well as those of pesticides and metals, may
become elevated due to discharge from Lake Okeechobee and runoff from agricultural activities
in the watershed (Bottcher and Izuno 1992).

Canals in South Florida Primary Water Management Features
21
Figure 4. Everglades Agricultural Area drainage basins.
Canal Design
The original canals and water control structures in the basins were designed for flood control and
water supply. Water supply in the region was intended for irrigation and to maintain water levels
in the basin as high as possible to minimize soil subsidence and oxidation.
Lake Okeechobee Regulatory Releases
Although lake water level regulation was not a factor in the original design, it was anticipated
that regulatory releases could be as large as the capacity of the downstream receiving canals in
the Everglades Agricultural Area. The levees and discharge structures for Lake Okeechobee
were designed assuming releases would be made by way of the St. Lucie Canal, Caloosahatchee
River, and the four primary canal outlets through the agricultural area during a major storm
event, in accordance with the Lake Okeechobee regulation schedule. Although the St. Lucie
Canal and the Caloosahatchee River can pass the largest discharges by the USACE, they are not
the preferred outlets since these releases are lost to the ocean and can damage downstream
estuaries. To the maximum extent possible, regulatory releases are made south to the agricultural
canals and stored in the WCAs. This affords additional opportunity for using the water and
reduces the amount of fresh water that enters the estuaries of the Caloosahatchee and St. Lucie
rivers. When large quantities of water must be discharged, however, the Caloosahatchee and St.
Lucie rivers must be utilized.

Canals in South Florida Primary Water Management Features
22
S-2, S-3, S-5A, S-6, S-7 and S-8 Basin Boundaries
The primary canals and water control structures in the Everglades Agricultural Area have four
functions: (1) remove excess water from the basin to storage in Lake Okeechobee or the WCAs,
(2) prevent overdrainage of their respective basins, (3) supply water from Lake Okeechobee to
downstream basins as needed for irrigation, and (4) provide conveyance for regulatory releases
from Lake Okeechobee to the WCAs or to eastern Palm Beach, Broward and Miami-Dade
counties and Everglades National Park.
Holey Land Wetland Restoration
A wetlands restoration project is currently under way in the Holey Land area in the southeastern
quarter of the S-8 basin (see Figure 4). The Holey Land is a 35,336-acre impoundment that was
used was used as a bombing range during World War II and the Korean War, hence the name
―Holey.‖ While no physical evidence remains of this disturbance, the area was degraded by
decades (1940s to 1980s) of overdrainage and invasion by upland plant species, oxidation and
the resulting subsidence of organic peat soils, and muck fires that caused localized areas of even
lower elevation.
The Florida Fish and Wildlife Conservation Commission is primarily responsible for managing
the flora and fauna of the area and works closely with the District, whose responsibilities include
overall hydrological operations, and construction and maintenance of inflow and outflow
structures. The goal for management of the Holey Land is to promote historical vegetation
communities. Important components of this goal are to create conditions that support the
functional integrity of tree islands, maintain or reduce extent of cattail coverage, increase
potential for wading bird, snail kite and alligator usage, and maintain the terrestrial wildlife
populations near or at high-water carrying capacity.
Levees were constructed around the northern perimeter of the Holey Land to isolate the area
hydrologically from the surrounding basins. Water from the Miami Canal can be pumped into
the Holey Land at its northwestern corner and distributed along the north perimeter by a spreader
canal. Water moves south by sheet flow and is discharged to WCA-3A by way of three gaps cut
in L-5.
Primary Canals
The primary canals that convey water from Lake Okeechobee south and east to coastal basins are
the L-8, West Palm Beach, Hillsboro, North New River, and Miami canals (Figure 4, Appendix
C). Water enters these canals from Lake Okeechobee at the north end. In the EAA basin these
canals are primarily bordered by agricultural lands. When the water leaves the EAA, it is first
treated in the Stormwater Treatment Areas to reduce phosphorus levels, and then passes into the
WCAs where the canals are bordered by and interact with adjacent natural wetlands.
Other major canals in the Everglades Agricultural Area provide cross-connections between the
primary canals or consist of borrow canals associated with the levees that surround the WCAs
and Lake Okeechobee. Additional information concerning canals and structures of the water
management system within the Everglades Agricultural Area is provided in Appendix C.

Canals in South Florida Primary Water Management Features
23
Water Conservation Areas and Everglades National Park
Introduction
The Everglades includes six basins: five Water Conservation Areas (WCA-1, WCA-2A,
WCA-2B, WCA-3A, and WCA-3B) and Everglades National Park (Figure 5). The basins have a
combined area of 3060 square miles and are served by 18 levees, 5 primary canals, and 60 water
control structures. The canals and water control structures in each basin are described and are
discussed with regard to their operation and management in Appendix C.
The land use consists mostly of natural landscapes including a predominance of wetlands with a
few isolated upland areas of hammocks, tree islands, and pine flatwoods. Although the soils of
these areas have not been surveyed, they consist primarily of hydric peats, mucks, marls, and
sands with occasional rock outcroppings.
The WCAs were designed to provide viable wetland habitat, to receive excess water from the
Everglades Agricultural Area, to receive regulatory releases from Lake Okeechobee, to prevent
water accumulating in the Everglades from flooding urban and agricultural lands in eastern
coastal areas, to recharge regional groundwater, and to store water for dry season deliveries to
eastern Miami-Dade, Broward and Palm Beach counties. The WCAs are impounded by levees,
with inflows and outflows regulated by control structures. The Everglades National Park basin is
a natural basin set aside to preserve portions of the original Everglades. Surface water flows into
the park are through District canals and structures.
Canals and structures in the Everglades provide the means by which water is conveyed from one
place to another for purposes of flood control, drainage, agricultural and municipal water supply,
and regulatory releases from Lake Okeechobee. In general, the canals and structures are used to
discharge excess water from the WCAs during flooding and to maintain minimum water levels
during dry periods. Some structures are used to supply water from one WCA to another, or to
neighboring basins in Palm Beach, Broward, and Miami-Dade counties.
Lake Okeechobee Regulatory Discharges
The WCAs are the preferred receiving bodies for regulatory releases from Lake Okeechobee by
way of the primary canals that pass through the Everglades Agricultural Area – the Miami Canal
and North New River Canal, after first passing through Stormwater Treatment Area 3/4 for
treatment. However, during a major storm event, the USACE discharges water through structures
they operate, primarily to the Caloosahatchee River (C-43) and the St. Lucie Canal (C-44). This
is a result of localized drainage entering the Everglades Agricultural Area canals and reducing
their ability to receive regulatory discharges from the lake. These factors can combine to make
regulatory releases by way of the North New River and Miami canals rare events.
Everglades Agricultural Area Discharges
The original drainage design for the Everglades Agricultural Area called for moving excess
water to both Lake Okeechobee and the WCAs. Because of environmental problems in the lake
resulting from inflows of nutrient-rich water, the current SFWMD water management plan for
the agricultural area discourages discharge of water to Lake Okeechobee. Consequently, almost
all water pumped from the Everglades Agricultural Area passes through a Stormwater Treatment
Area for phosphorus removal before discharge to the WCAs.

Canals in South Florida Primary Water Management Features
24
Canals
The primary water management system in the Everglades National Park and WCA area includes
four primary canals that deliver water from Lake Okeechobee south and east toward the coast –
West Palm Beach, Hillsboro, North New River, and Miami canals - and numerous smaller canals
(see Appendix C). Primary canals provide outlets for excess water from Lake Okeechobee when
the lake is above its regulation schedule. They also deliver water from the lake during dry
periods to maintain water levels in the WCAs and to meet water supply needs in the Everglades
Agricultural Area and coastal basins. The remaining primary canals are peripheral to the WCAs
and the park and provide the means to manage the distribution of flows into the basin.
South Miami-Dade Conveyance System
Water deliveries to the southeastern section of Everglades National Park are provided by the
South Miami-Dade Conveyance System, which is described in the section of this report dealing
with canals in eastern Palm Beach, Broward, and Miami-Dade counties.

Canals in South Florida Primary Water Management Features
25
Figure 5. WCA and Everglades National Park Drainage Basins.

Canals in South Florida Primary Water Management Features
26
Upper East Coast - Martin and St. Lucie Counties
Introduction
Nine basins make up the Upper East Coast area: C-23, C-59, S-153, S-135, C-44, Tidal St. Lucie
River, North Fork St. Lucie River, C-25, and C-24. These basins cover 853 square miles of
Martin and St. Lucie counties (Figure 6) and are served by 12 canals and 15 water control
structures with the principal function of providing flood protection. Secondary uses include land
drainage for agriculture and urban or residential development and regulation of groundwater
levels to prevent saltwater intrusion. Most canals supply water for irrigation during periods of
low natural flow. The coastal structures have the additional function of preventing salt water
from a tidal or storm surge from entering those canals that discharge to tide.
Land use in this area is primarily agricultural – citrus, crops, and cattle. Some urban development
is present in areas surrounding Stuart, Port St. Lucie, Fort Pierce, Indiantown, and Okeechobee.
Large areas remain undeveloped with natural pine forested uplands, oak hammocks, swamps and
marshes, rangeland, and unimproved pasture. Soils are generally sandy flatwoods with
occasional hydric depressional features
North Fork St. Lucie Basin Flood Protection and Water Supply
With District approval, two areas in the North Fork St. Lucie basin can be pumped to the C-25
Canal to mitigate flooding in the basin: (1) an 18-square mile parcel in the northwest corner of
the basin that normally drains to Ten Mile Creek by gravity flow, and (2) a 3-square mile parcel
in the northeast corner of the North Fork St. Lucie basin that normally drains to Five Mile Creek
by gravity flow. Water can be diverted from C-25 to the Fort Pierce Farms Drainage District for
irrigation during the dry season. Fort Pierce Farms Drainage District drains by gravity flow to
C-25 below S-50 (i.e., to tidewater).
A large number of citrus growers are in the Upper East Coast basin and the demand for water is
high. Currently, the only source of water is local rainfall and artesian well water from the
Floridan Aquifer. This well water has a high mineral content and is generally mixed with surface
water before it is used for irrigation. To distribute the available surface water supply equitably,
the inverts of irrigation supply culverts and irrigation pump intakes have been limited to a
minimum elevation of 14.0 ft NGVD.

Canals in South Florida Primary Water Management Features
27
Figure 6. Sub-basins and District facilities in Martin and St. Lucie counties.
History of the St. Lucie Canal
It was realized early in the settlement of South Florida that Lake Okeechobee‘s water level
would have to be substantially lowered to drain and control flooding in the Everglades. The
easiest way to control water levels in the lake was by way of canals connecting the lake to the St.
Lucie and the Caloosahatchee rivers.
Work on the St. Lucie Canal began in 1915. The primary purpose of the canal was to divert the
entire flow from Lake Okeechobee to the ocean. Secondarily, it was expected to provide a
navigable waterway from Lake Okeechobee to the ocean and to provide hydroelectric power at
the eastern end of the canal. Because of difficulties in financing, the canal was not completed
until 1917 and was only half as large as the original design (i.e., 200 feet wide and 12 feet deep).
Flow regulation was provided by a dam and lock at the eastern end (at the present site of S-80).
A hydroelectric plant was installed at the control structure, but later proved to be impractical.
Lack of money prevented further work on the St. Lucie Canal until the 1930s when the USACE
built the Hoover Dike. As part of the legislation authorizing the dike, money was also authorized
for deepening the canal and constructing a new lock structure. In 1948, the St. Lucie Canal was
deepened again. When the C&SF Project was authorized in 1949, the canal was placed under its
management. As part of the project, a spillway and lock (S-308) were completed in 1977 at the
outlet from Lake Okeechobee to the St Lucie Canal.
Canals in South Florida Primary Water Management Features
28
Florida Power and Light Company Reservoir
An area of 6600 acres between the S-153 basin and C-44 that originally drained to the L-65
borrow canal and to S-153 is now the cooling reservoir for a Florida Power and Light power
plant. Since the reservoir is hydraulically connected to C-44, the land it occupies is now
considered part of the C-44 basin. Excess water in the S-153 basin is discharged to C-44 by way
of the L-65 borrow canal and S-153.
Primary Canals that Discharge to Coastal Waters
Four primary canals (C-23, C-44, C-25, and C-24) discharge directly to coastal waters. The C-23
Canal basin measures approximately 167.7 square miles and is located in southwest St. Lucie
County, eastern Okeechobee County, and northern Martin County (Figure 6). The C-44 basin is
approximately 189.8 square miles. The C-44 Canal is a component of the Lake Okeechobee
waterway and provides a navigable link from Lake Okeechobee to the lntracoastal Waterway
near Stuart. It runs parallel to state road 76 from S-308 at Port Mayaca on Lake Okeechobee to
S-80. The C-25 Canal basin is approximately 164.8 square miles and the canal discharges to the
lntracoastal Waterway (Indian River) west of the Fort Pierce Inlet. The C-24 basin is
approximately 166.6 square miles in area. In general, the only water supply to the C-24 basin is
from local rainfall and pumping of groundwater from the Floridan Aquifer; however, water can
be supplied from the C-23 basin when necessary.
Basins that Discharge to Lake Okeechobee
The S-135 basin is approximately 28.3 square miles in area. The basin is impounded by levees:
on the west by L-47, on the north by L-63S, on the south by L-65, and on the east by L-63S,
L-64, and L-65. The C-59 drainage basin is approximately 187.9 square miles in area and is
located in portions of Okeechobee, St. Lucie, and Martin counties.
Lower East Coast – Palm Beach, Broward and Miami-Dade Counties
Introduction
The coastal areas of Palm Beach, Broward, and Miami-Dade counties have a number of features
in common. The canals and structures were designed primarily to provide flood protection,
deliver water needed for urban and agricultural use, and prevent saltwater intrusion.
Most of the land surface in the eastern sections of Miami-Dade and Broward counties, as well as
Southern portion of Palm Beach County is underlain by the Biscayne Aquifer, which is directly
linked to surface water. The Biscayne Aquifer is highly permeable, transmissive, and extensively
used as a source of drinking water by utilities and homeowners. Wells developed in this aquifer
yield extremely large amounts of water. Because the aquifer is closely connected to surface
water bodies, such as lakes, rock pits, and canals, any contamination derived from these sources
spreads rapidly.
The canals are cut through the surface soils and into the rock of the underlying aquifer, providing
for a direct exchange of surface and groundwater. Canal water quality is thus continually
influenced by exchange with groundwater, which typically contains elevated concentrations of
dissolved nutrients and low concentrations of dissolved oxygen. Canals can also transfer
contaminants from surface sources to groundwater, including treated or untreated wastewater,

Canals in South Florida Primary Water Management Features
29
urban and agricultural runoff, seepage from septic tanks and landfills, and salt water from canals
that connect to tide (Alleman et al. 1995, Brown 2003).
Figure 7 shows the distribution of canals and water control structures in the drainage basins of
eastern Palm Beach, Broward, and Miami-Dade counties. In addition to providing water supply
and flood control, the primary canals are also an outlet for excess water from the Everglades and
Lake Okeechobee during wet periods. During dry periods, stored water can be delivered to
eastern Palm Beach, Broward, and Miami-Dade counties to help meet local urban and
agricultural needs and prevent saltwater intrusion.
The topography of these counties is very flat. The elevation of most the sub-basins is less than 20
feet above sea level, and many areas have an elevation of 5 feet or less. Historically, much of the
area was under water or had fully saturated soils for most of the year.
Most of the area is covered with hydric (wetland) soils, except for areas near the coast that are
underlain by an extensive limestone rock ridge (see Appendix C). Historically, this ridge had
rocky to sandy soils and was covered with upland vegetation consisting of pine flatwoods and
oak hammocks. Today, soil patterns show the predominance of urban and man-made lands in
eastern Miami-Dade, Broward, and Palm Beach counties. In northern Miami-Dade and southern
Broward counties, urban lands extend westward into areas that were historically Everglades peat,
muck, sand, and marl wetland soils. Western areas of Miami-Dade and Broward counties east of
the WCAs still have Everglades sand, marl, or peat soils in undeveloped areas. In Palm Beach
County, lands west of the coastal ridge have higher elevations and contained pine flatwoods
vegetation (sandy soils) with intermittent depressional features. This area was largely used for
farming in the early to mid-twentieth century but is increasingly transitioning to urban and
residential community development. In northern Palm Beach County, large areas east of Lake
Okeechobee that have hydric peat and depressional soils are protected from development within
various local, state and regional parks, preserves, and management areas.
Structures in the area regulate the flow and level of water in the canals. In general, they are used
to discharge excess water from the basins during flooding and maintain minimum water levels in
the canals during dry periods. The coastal structures also prevent salt water from a tidal or storm
surge from entering canals that discharge to tide. Tables summarizing features of these structures
are provided in Appendix C. Water levels in the coastal and regional canals are carefully
managed to be: (1) high enough, especially during the dry season, to prevent saltwater intrusion
and recharge the aquifer; and (2) low enough during the wet season and agricultural growing
season to provide drainage and flood control.
Primary Regional Canals
The primary canals in Miami-Dade, Broward, and Palm Beach counties are the coastal
extensions of the West Palm Beach Canal, Hillsboro Canal, North New River Canal, and Miami
Canal, which originate in at Lake Okeechobee, pass through the Everglades Agricultural Area
Everglades and Water Conservation Areas, and end at the estuaries. These primary canals
provide region-wide management capabilities. They are used as outlets for regulatory releases
from Lake Okeechobee and the WCAs, excess floodwaters from the Everglades Agricultural
Area lands, and runoff from the coastal basins. They also convey water releases from Lake
Okeechobee or the WCAs to recharge local wellfields and protect the surficial aquifer against
saltwater intrusion. Details of canal features and operations are provided in Appendix C.
Canals in South Florida Primary Water Management Features
30
The section of the West Palm Canal located east of WCA-1 is in the C-51 basin. This basin has
an area of 164.3 square miles in eastern Palm Beach County. The canal runs parallel to and south
of State Road 80, from L-40 to Congress Avenue. East of Congress Avenue, the canal extends to
the south and then to the east, connecting to the Intracoastal Waterway at S-155 east of Lake
Clarke.
The Hillsboro Canal connects Lake Okeechobee to the Intracoastal Waterway. The canal basin in
eastern Palm Beach and Broward counties has an area of 102.5 square miles. Excess water in
WCA-1 is discharged to the Hillsboro Canal by way of S-39 at the western edge of the basin.
The North New River Canal basin measures approximately 30 square miles in eastern Broward
County. The basin is divided into an eastern basin (7 square miles) and a western basin (23
square miles). The North New River was excavated and extended to drain the Everglades, and to
serve as a transportation route between Lake Okeechobee and the coast.
The section of the Miami Canal East of the WCAs is also known as C-6. The C-6 basin has an
area of approximately 69 square miles in eastern Miami-Dade County (Figure 7). Flow in the
C-6 Canal is to the southeast with discharge via S-26 into Biscayne Bay.

Canals in South Florida Primary Water Management Features
31
Figure 7. SFWMD canals and structures in coastal sub-basins of Miami-Dade, Broward, and Palm Beach counties.

Canals in South Florida Primary Water Management Features
32
Coastal Basin Canals
Coastal basin canals originate at or east of the Everglades and discharge to the Intracoastal
Waterway or an estuary. These canals were designed primarily to provide flood protection and
drainage for coastal development. Some of the canals are linked directly or indirectly to other
canals and provide a means to regulate surface and groundwater levels and to recharge the
surficial aquifer. Most of these canals have a downstream coastal outfall water control structure
to prevent upstream migration of salt water and contamination of groundwater. Some of the
coastal canal basins have an eastern and western sub-basin. The western basins tend to be more
flood-prone, and hence have more stringent construction criteria, lower densities of development,
and more agricultural use.
South Miami-Dade Conveyance System
The South Miami-Dade Conveyance System interconnects several of the basins in southern
Miami-Dade County. The system was developed during the 1970s was after a Congressional
mandate with the primary purpose of supplying water to Everglades National Park and to canals
in southern Miami-Dade County for irrigation, wellfield recharge, and control of saltwater
intrusion. The system was also built largely around existing structures. For example, S-151 was
enlarged and S-335 was changed to a gated spillway. Three new structures (S-336, S-337, and
S-338) were built for the system.
Lower West Coast Watersheds
Caloosahatchee River
Features of the Current System
Three structures and 41 miles of the C-43 Canal provide the primary water management system
within the Caloosahatchee basin. The canal was dug to connect Lake Okeechobee to the Gulf of
Mexico through the Caloosahatchee River. The resulting channel is 160 to 430 feet wide and 20
to 30 feet deep. The three structures are S-77 at Moore Haven, S-78 at Ortona (15 miles west of
S-77), and S-79 (also known as the W.P. Franklin Lock and Dam) near Ft. Myers (40 miles west
of S-77). Each of these structures includes water control facilities and navigational locks
(Figure 8). The structures and canal improvements were authorized not only for navigation and
flood protection, but also to manipulate water flow for eliminating undesirable salinity in the
lower Caloosahatchee River, raise dry-weather water table levels, and provide water for
agricultural irrigation.
The freshwater portion of the Caloosahatchee River watershed includes two primary basins. The
upstream section of the river between S-78 and S-77 drains approximately 338 square miles. The
water level in this part of the river is maintained at approximately 11 feet above mean sea level.
Downstream, between S-78 and S-79, the water level in the river is maintained at 3 feet above
mean sea level. The drainage basin for this lower pool is 497 square miles. Land use in the
Caloosahatchee basins is mostly agriculture, with some low density residential communities and
a small urban area near Labelle. The river, throughout its length, is used as a source of water for
agricultural irrigation, including citrus, pasture, vegetables, and flowers.
In the lower section of the Caloosahatchee River, especially areas west of Labelle, many oxbows
of the original meandering river remain as shallow diversions from the main canal. Areas where
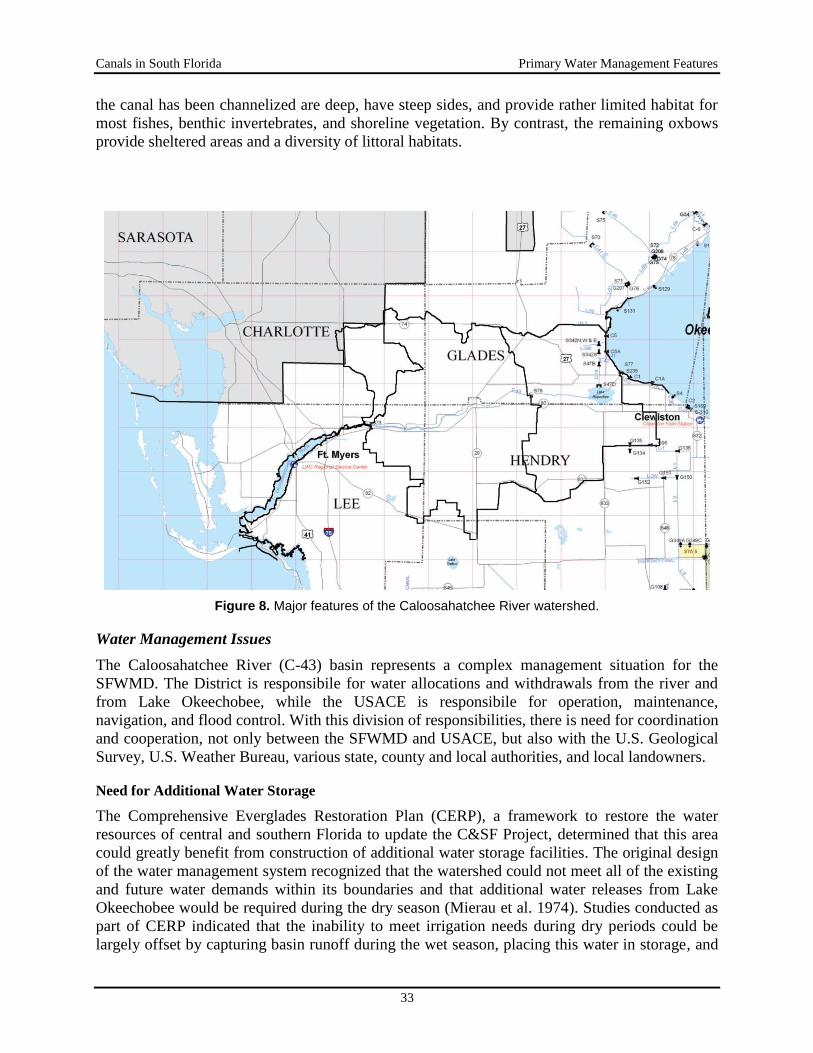
Canals in South Florida Primary Water Management Features
33
the canal has been channelized are deep, have steep sides, and provide rather limited habitat for
most fishes, benthic invertebrates, and shoreline vegetation. By contrast, the remaining oxbows
provide sheltered areas and a diversity of littoral habitats.
Figure 8. Major features of the Caloosahatchee River watershed.
Water Management Issues
The Caloosahatchee River (C-43) basin represents a complex management situation for the
SFWMD. The District is responsibile for water allocations and withdrawals from the river and
from Lake Okeechobee, while the USACE is responsibile for operation, maintenance,
navigation, and flood control. With this division of responsibilities, there is need for coordination
and cooperation, not only between the SFWMD and USACE, but also with the U.S. Geological
Survey, U.S. Weather Bureau, various state, county and local authorities, and local landowners.
Need for Additional Water Storage
The Comprehensive Everglades Restoration Plan (CERP), a framework to restore the water
resources of central and southern Florida to update the C&SF Project, determined that this area
could greatly benefit from construction of additional water storage facilities. The original design
of the water management system recognized that the watershed could not meet all of the existing
and future water demands within its boundaries and that additional water releases from Lake
Okeechobee would be required during the dry season (Mierau et al. 1974). Studies conducted as
part of CERP indicated that the inability to meet irrigation needs during dry periods could be
largely offset by capturing basin runoff during the wet season, placing this water in storage, and

Canals in South Florida Primary Water Management Features
34
later releasing the water back to the river. The CERP proposed construction of a large reservoir
in the watershed to address this need and it is currently being designed.
Regulatory Releases from Lake Okeechobee
One of the primary issues with management of the Caloosahatchee River is the need to
periodically regulate water stages in Lake Okeechobee. When the lake is above its regulated
water stage, the USACE discharges excess water through structures they operate, primarily
through the Caloosahatchee and St. Lucie rivers. During such discharges, river flow rates can
exceed 10,000 cubic feet per second. These discharges have significant adverse effects on plants
and animals in the estuary and adjacent coastal waters due to rapid changes in salinity and water
quality.
Controlling Saltwater Intrusion and Algal Blooms
A major problem with operation of the Caloosahatchee River is the control of saltwater intrusion
into the basin during dry periods. Before construction of the S-79 structure, tidal fluctuations and
varying amounts of runoff from the basin occasionally resulted in transfer of salt water as far
upstream as LaBelle, which contaminated shallow wells adjacent to the river. With the
construction of S-79, less salt water is getting upstream, but there continue to be occasional
exceedances of the Class I water designation standards that apply to that section of the river.
In conjunction with recurring salinity problems, periods of low river flow are often associated
with algal blooms, especially cyanobacteria (blue-green algae) that affect water taste and color.
These problems affect the Lee County water supply facility and the Ft. Myers wellfield.
Therefore, additional water is discharged from Lake Okeechobee to ―flush‖ the system during
periods of high salinity or algal blooms (Boggess 1972, Mierau 1974).
Minimum Flows and Levels
A further issue of concern is the need to prevent significant harm from occurring to the water
resources in the Caloosahatchee Estuary. The SFWMD established minimum flow criteria for the
Caloosahatchee River based on maintenance of suitable salinity conditions in the downstream
estuary (SFWMD 2000, SFWMD 2003). These criteria recommend that additional water be
provided from the Caloosahatchee River (and hence from Lake Okeechobee) as needed to
protect submerged aquatic vegetation in the section of the estuary adjacent to Fort Myers.
Collier County
Collier County may be roughly divided into the Big Cypress Region, the Western Flatlands, and
the Ten Thousand Islands. The area along the coast, west and north of the Big Cypress, and as
far south as Gordon‘s Pass, is part of the western flatlands. The flatlands are characterized by
marshes, swamps, and open water depressions, including Lake Trafford, the Corkscrew Marsh,
and the Okaloacoochee Slough.
The first canals in Collier County were dug to provide fill for the roads used to promote
harvesting of cypress timber. The combined canals and roads greatly altered the historical
surface water movements. In 1928, the Atlantic Coastline Railroad extended their service into
the Everglades. This railroad extension prepared a roadbed for a new highway and created
sizeable drainage canals that effectively divided the Big Cypress wetlands into east and west
portions.

Canals in South Florida Primary Water Management Features
35
South Florida Water Management District – Big Cypress Basin
The Big Cypress Basin (BCB) was established as a subdivision of the SFWMD by the Florida
legislature in 1976. One of the first actions of the BCB Governing Board was to begin efforts to
define and take management responsibility for the primary water management system in Collier
County. The ―primary canals‖ in this system are the canals that are maintained by BCB;
―secondary canals‖ are all other types of canals not maintained by BCB. The SFWMD through
the BCB presently operates and maintains a network of 162 miles of primary canals and 46 water
control structures (Figure 9) in western Collier County. These facilities provide flood control
during the wet season and prevent over-drainage during the dry season to protect the vulnerable
water supplies and environmental resources of a rapidly urbanizing region.
Surface Hydrology and Hydraulic Systems
The surface hydrology of the Big Cypress basin is dictated by an extensive system of drainage
canals and structures. This system of canals separates the contributory drainage areas of the
primary outfalls into the following eight major basins: Golden Gate Canal, Corkscrew-
Cocohatchee, District VI, Henderson Creek, Collier-Seminole, Faka Union Canal, Fakahatchee
Strand, and Okaloacoochee Slough-Barron River.
With the evolution of urban and agricultural development, the traditional surface water flow
patterns in the Big Cypress region have undergone drastic changes. As land areas were
developed, ―ditch and drain‖ construction practices resulted in a series of canals and numerous
roads that tended to overdrain the water table and drastically altered flow patterns of natural
drainage basins. Such combinations of development events greatly reduced the extent of
functional wetlands, lowered groundwater levels, reduced aquifer recharge, and contributed to
concentrating runoff flow rather than preserving sheet flow across the land. The change in flow
characteristics resulted in a significant shift in watershed boundaries.
Of the eight basins, three (Collier-Seminole, Fakahatchee Strand, and District VI) do not contain
primary water management canals or control structures. The surface hydrology and primary
drainage works of the remaining basins are described in Appendix C.

Canals in South Florida Primary Water Management Features
36
Figure 9. Major drainage basins and water management features within the Big Cypress basin.

Canals in South Florida Analysis of Biological Data
37
2. ANALYSIS OF BIOLOGICAL DATA FROM SFWMD CANALS
Introduction
A review of available literature was conducted by SFWMD staff to identify scientific studies of
animals that live in South Florida canals. Relatively few studies have been conducted in recent
years, and almost none of these have included synoptic water quality data that met the District
staff‘s evaluation criteria with respect to sampling period, methods, or proximity of water quality
sampling to biological sampling times or locations. Primary emphasis was placed on studies of
macroinvertebrates (e.g., larval stages of insects) because there is an extensive database of
Florida invertebrates available. These communities are widely accepted as indicators of
biological conditions by FDEP and the USEPA, and standardized procedures for collecting and
processing macroinvertebrate samples have been used in Florida since about 1992. These
procedures have been applied to canals by FDEP and private consultants. These
macroinvertebrate studies are summarized below and additional details, and in some cases re-
analyses of the data by SFWMD staff, are included in Appendix D.
A number of studies of other organisms, notably fish and alligators, in and adjacent to District
canals are also summarized, with additional information provided in Appendix E. While
research concerning ecological relationships among these higher organisms is highly developed
within some South Florida ecosystems, especially the Everglades and estuaries, canals have not
been systematically studied. Furthermore, when compared to macroinvertebrates, methods for
collecting and interpreting vertebrate data are more variable and less quantitatively linked to
other variables such as habitat quality, surrounding land uses, and water quality.
Macroinvertebrate Communities
Studies of Canals using FDEP methods
The Florida Department of Environmental Protection established the Bioassessment Program for
stream macroinvertebrates in 1992 (FDEP 2010). This program provides standard protocols for
sample collection, processing, and reporting macroinvertebrate data. The data have been used to
develop the Stream Condition Index (SCI), which is a numeric index of biological condition
using 10 macroinvertebrate metrics. The database includes a total of 2313 unique sites sampled
since 1992, with some sites sampled annually for trends. There are 53 minimally disturbed
reference stream sites covering most of the state north of Lake Okeechobee, and these sites were
used by FDEP to set quality thresholds (e.g., good, fair, poor) for the SCI. The data were also
used to divide Florida into bioregions, two of which include parts of the District. The peninsula
bioregion includes most of the Florida peninsula south to Lake Okeechobee; lands south of the
lake are in the Everglades bioregion. While SCI scoring has changed over the years, the methods
and metrics have not been substantially altered, providing a consistent and semi-quantitative
long-term database on Florida streams and canals.
From the Bioassessment Program, FDEP provided data on 156 canal sites south of Orlando and
14 stream reference sites in the southern portion of the peninsula bioregion that includes the
District north of Lake Okeechobee (Figure 10a). While not all of these canals are under the
jurisdiction of the SFWMD, they are all within District boundaries and meet the physical
requirement of canals. There are no reference stream sites south of the lake. The 14 reference

Canals in South Florida Analysis of Biological Data from SFWMD Canals
38
sites selected for analyses have been sampled annually for 14 or more years and provided
information on interannual variability. They were also analyzed to assess the application of the
SCI thresholds to South Florida canals. Four consultant reports were found that used FDEP
methods to assess the macroinvertebrate communities in canals within the District. More detailed
summaries and analyses of these five studies are provided in Appendix D.
FDEP Methods – State Bioassessment Database
Of the 156 canal sites sampled in the southern part of the state by FDEP since 1992, 140 were in
the southern portion of the peninsula bioregion (including about 60 stations within the SFWMD)
and 16 were in the Everglades bioregion (Figure 10a and Table 1). Although there are no SCI
thresholds for the Everglades bioregion, the data are useful for quantifying living resource
conditions in canals within this area.
Macroinvertebrate metrics included 10 used to calculate the Stream Condition Index, 3
additional metrics, and the name of the dominant taxon. Habitat and water quality measures were
also taken at a subset of these 156 sites (Table 1). Water quality parameters included
physicochemical, nutrients, and primary production measures at most sites; other measures (e.g.,
metals, coliforms, sulfate, turbidity, color, TSS, salinity, hardness) were taken at a small number
of sites. The data on canals were analyzed in two ways. First comparisons were between canals
in the peninsula and Everglades bioregions using mean values (± 1 standard deviation) for three
taxonomic richness metrics (total, chironomidae, and EPT richness3). The results were used to
identify differences in species richness across bioregions. Second, SCI scores and richness
measures were regressed against habitat quality scores to assess whether habitat quality was a
likely stressor in canals.
3 EPT richness refers to the total number of mayfly (Ephemeroptera), stonefly (Plecoptera) and caddisfly
(Trichoptera) taxa in a sample.

Canals in South Florida Analysis of Biological Data from SFWMD Canals
39
Figure 10. Macroinvertebrate sites within the District boundary sampled using FDEP methods. A) Locations of 156 canal sites sampled in two bioregions for macroinvertebrates by FDEP. Blue sites represent Zone 1 (east) and green sites represent zone 2 (west) of the peninsula bioregion
(see text). Brown sites represent the Everglades bioregion. Labeled gold sites are reference stream sites (see Maxted 2010 in Appendix D). B) Locations of sites sampled by consultants using FDEP methods discussed in this report. The light blue line is the FDEP bioregion boundary.
a. Locations OF 156 Canal Sites Sampled in two Bioregions for
macroinvertebrates by FDEP. Blue represents Zone 1 (east)
and green represents zone 2 (west) of the Peninsula
Bioregion (see text). Pink represents the Everglades Bioregion.
Labeled solid gold points are reference stream sites
(see Maxted 2010 in Appendix C).
A B
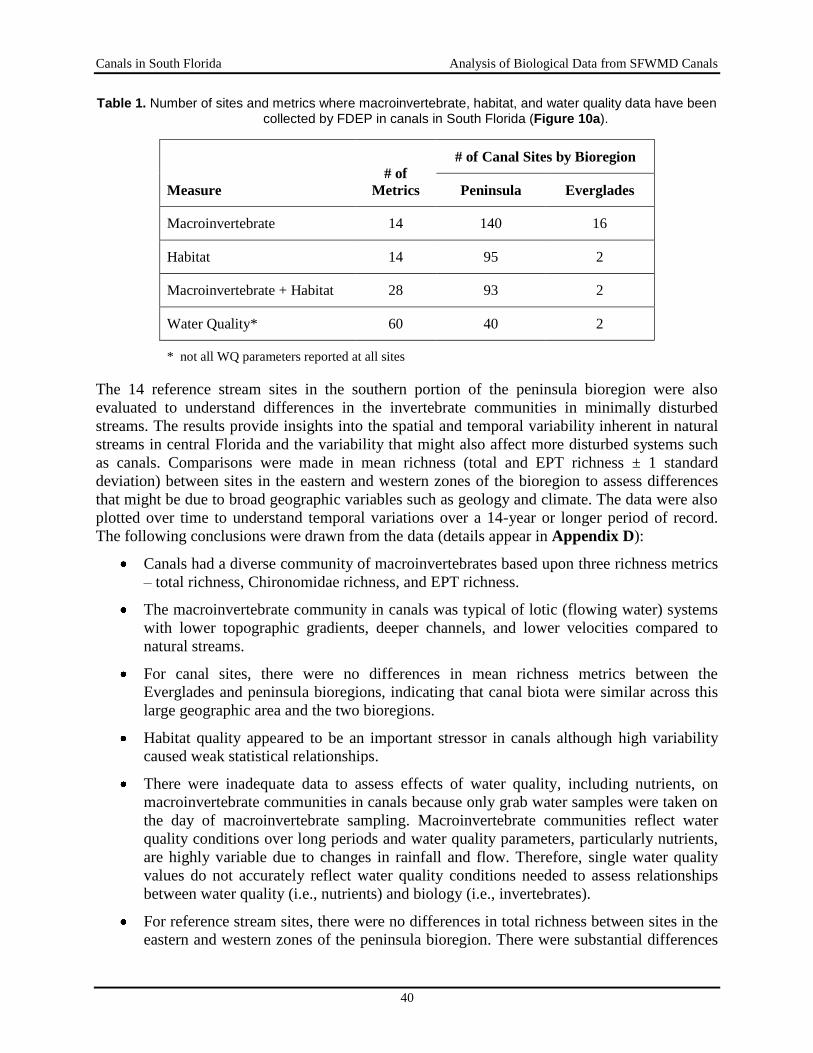
Canals in South Florida Analysis of Biological Data from SFWMD Canals
40
Table 1. Number of sites and metrics where macroinvertebrate, habitat, and water quality data have been collected by FDEP in canals in South Florida (Figure 10a).
Measure
# of
Metrics
# of Canal Sites by Bioregion
Peninsula Everglades
Macroinvertebrate 14 140 16
Habitat 14 95 2
Macroinvertebrate + Habitat 28 93 2
Water Quality* 60 40 2
* not all WQ parameters reported at all sites
The 14 reference stream sites in the southern portion of the peninsula bioregion were also
evaluated to understand differences in the invertebrate communities in minimally disturbed
streams. The results provide insights into the spatial and temporal variability inherent in natural
streams in central Florida and the variability that might also affect more disturbed systems such
as canals. Comparisons were made in mean richness (total and EPT richness ± 1 standard
deviation) between sites in the eastern and western zones of the bioregion to assess differences
that might be due to broad geographic variables such as geology and climate. The data were also
plotted over time to understand temporal variations over a 14-year or longer period of record.
The following conclusions were drawn from the data (details appear in Appendix D):
Canals had a diverse community of macroinvertebrates based upon three richness metrics
– total richness, Chironomidae richness, and EPT richness.
The macroinvertebrate community in canals was typical of lotic (flowing water) systems
with lower topographic gradients, deeper channels, and lower velocities compared to
natural streams.
For canal sites, there were no differences in mean richness metrics between the
Everglades and peninsula bioregions, indicating that canal biota were similar across this
large geographic area and the two bioregions.
Habitat quality appeared to be an important stressor in canals although high variability
caused weak statistical relationships.
There were inadequate data to assess effects of water quality, including nutrients, on
macroinvertebrate communities in canals because only grab water samples were taken on
the day of macroinvertebrate sampling. Macroinvertebrate communities reflect water
quality conditions over long periods and water quality parameters, particularly nutrients,
are highly variable due to changes in rainfall and flow. Therefore, single water quality
values do not accurately reflect water quality conditions needed to assess relationships
between water quality (i.e., nutrients) and biology (i.e., invertebrates).
For reference stream sites, there were no differences in total richness between sites in the
eastern and western zones of the peninsula bioregion. There were substantial differences

Canals in South Florida Analysis of Biological Data from SFWMD Canals
41
in EPT richness between the two zones, and this should be investigated further before
applying the SCI metrics and thresholds to canals. The differences may be due to
differences in gradient, depth, and velocity.
There was a downward trend in metric values at most reference stream sites over a
14-year period (1992-2006), indicating that changes in macroinvertebrate communities
may be due to events that exerted effects over a large geographic area. The variability in
macroinvertebrate metric values at reference sites helps to explain the variability
observed at all stream and canal sites in southern Florida.
Metric and SCI scores were lower in canal sites compared to reference stream sites
indicating that canals do not achieve the same level of biological quality compared to
natural streams. Of the 52 canal sites, 44 (85%) with recent SCI scores (2004 to present)
were classified in the lowest (―impaired‖) assessment category (SCI score < 35 points),
and only one site (SCI score = 59) was classified in the middle category (SCI score 35-70
points). No canal sites were classified in the highest category (SCI score > 70 points).
This may be due to physical differences related to channelization including riparian
habitat quality, depth, and velocity. These SCI results should be viewed with caution
because the SCI is not directly applicable to canals and streams in South Florida.
Additional research is needed to select sensitive metrics and a quality threshold
applicable to low gradient streams and canals within the peninsula and Everglades
bioregions.
FDEP Methods – Miami-Dade County
Snyder et al. (1998) collected macroinvertebrate and habitat quality data at 32 sites in Miami-
Dade County during February (winter, dry season) 1996 (see Figure 10b and Appendix D). The
sites were selected in four land use categories (wetlands, agriculture, suburban, and
urban/industrial) to provide a disturbance gradient for these engineered waterways. Twenty sites
were resampled in July (summer, wet season) 1996 to determine seasonal differences. Snyder et
al. (1998) concluded that surrounding land use and habitat quality were key drivers of
invertebrate community condition.
Several invertebrate metrics (total richness, Florida index, % dominant taxon, % midge) and the
SCI followed a pattern of increasing disturbance from wetlands → agricultural → suburban →
urban/industrial. This pattern was also identified from analysis of the raw taxonomic data. The
highest quality sites were those with wetlands as the predominant surrounding land use, but had
lower metric and SCI scores than FDEP reference stream sites in peninsular Florida. Biological
condition as measured by the SCI was weakly correlated with habitat quality (r2 = 0.35). Highest
quality canal sites were dominated by long-lived taxa, indicating that impacts were related to
periodic stressors. These results suggest that canals (1) have lower quality conditions than natural
streams and (2) are affected by land use and habitat quality.
FDEP Methods – Ft. Myers, Cape Coral, Golden Gate,
Picayune Strand, Fakahatchee Strand
A study by FDEP (2001) provides an assessment of the biological conditions in urban canals
across a range of development intensity and habitat conditions. In the fall of 1999 and spring of
2000, habitat, invertebrate, physico-chemical (temperature, DO, pH, conductivity, turbidity), and

Canals in South Florida Analysis of Biological Data from SFWMD Canals
42
water quality (NH3, NO3/NO2, TKN, TP, algal growth potential) data were collected at 13 sites
in residential canals in and around Ft. Myers and Cape Coral, 3 sites in Southern Golden Gate
Estates in an area that had canals and roads but no houses, and 2 sites in natural sloughs (moving
water channels) within Picayune Strand and Fakahatchee Strand State Preserve (Figure 10b).
The sites were selected to represent a disturbance gradient based upon the degree of local
development, water quality, and habitat quality. The data were insufficient to assess water
quality conditions in canals or to statistically correlate biology to water and habitat quality.
Results indicated that invertebrate communities were quite resilient to this type of physical
alteration. Variability was high within each site category – the canals with the highest degree of
water quality and habitat disturbances had both high and low invertebrate metric values.
Biological quality was generally related to habitat quality but variability was high making for
poor correlations. Three major conclusions of the study (FDEP 2001) were as follows:
―Based on their artificial construction, canals cannot be expected to span the full range of
scores found in the stream habitat assessment procedures, even in expected ‗reference
canal‘ habitat conditions.‖
― . . . our a priori approach to classifying least disturbed canals (which are all artificially
created systems) was not successful. Until additional 20 dip net sweep data is collected
from an assortment of canals subject to varying degrees of human disturbance (habitat
removal, water quality problems), we cannot fully establish reasonable expectations for
these artificial systems.‖
―If additional canals sampling is done (sufficient to bring the total number of sites up to
approximately 50) it is possible that a Canal Condition Index (CCI) could be formulated
for future use. This CCI would need to consider supplementary factors, such as ecoregion
and flow conditions (flowing vs. stagnant) during the calibration process.‖
FDEP Methods – Reedy Creek
DeBusk and Grace (2009a) examined the effects of improved water quality on the
macroinvertebrate community at a single site (RC-14) on Reedy Creek in the upper Kissimmee
Lakes region, south of Orlando (Figure 10b). Water quality, habitat, and macroinvertebrate data
collected over a 26-year period (1980-2006) were used to assess the effects of sewage treatment
plant improvements in 1990. The mean annual TP concentration before 1990 was 266 µg/L
compared to 75 µg/L after the improvements; mean annual TN concentrations were 1.92 µg/L
and 1.41 µg/L, respectively. The macroinvertebrate community showed little or no response to
improved water quality: five macroinvertebrate metrics did not change, two showed some
improved response, and six, including the Florida Biotic Index, declined in biological condition
with improved water quality. The site maintained ―optimal‖ habitat conditions over the study
period, including a natural meandering channel, diverse in-stream habitat, and good riparian
vegetation.
Samples also were also collected in a tributary of Reedy Creek (Bonnet Creek) upstream of site
RC-14. This site (C-12) was a channelized stream with poor habitat quality, providing a
framework for looking at the effects of habitat quality on the macroinvertebrate community. The
macroinvertebrate communities were compared between these two sites for the years that had
comparable water quality conditions.

Canals in South Florida Analysis of Biological Data from SFWMD Canals
43
Most metrics showed significant reductions in biological condition at site C-12 compared to site
RC-14, indicating that habitat quality was a key stressor. The finding of this study should be
viewed with caution due to the limited number of sites and the lack of replication. However, the
findings are similar to those of the FDEP (2001) and Snyder et al. (1998), which showed that
biological communities in channelized South Florida streams and wetlands are influenced by
surrounding land use and physical alterations of the channel and riparian habitat.
FDEP Methods – Canals near Lake Okeechobee
DeBusk and Grace (2009b) examined the water quality, physical habitat, and macroinvertebrate
communities in five canals near Lake Okeechobee; three sites were north of the lake (and south
of Lake Istokpoga) and two sites were in the Everglades Agricultural Area (Figure 10b). All
sites were engineered canals with poor habitat quality. The investigators compared their results
to macroinvertebrate data collected by FDEP as part of their SCI network that included 12 canals
and 53 reference streams throughout Florida.
Comparison of scores for total richness, EPT richness, and SCI scores for the five canal sites
indicated: (1) lower quality conditions in canals compared to natural streams, and (2) high
variability in all metrics. SCI scores were similar to FDEP canal sites and lower than all but one
of the FDEP reference stream sites. The metric and SCI values were also similar to other studies
of canals in South Florida (Snyder et al. 1998, FDEP 2001, DeBusk and Grace 2009a). The
metric and SCI data indicate that canals provide a diverse community of macroinvertebrates (20
to 30 taxa) typical of lotic environments with low velocities, high primary production, and
depositional substrata.
Other Macroinvertebrate Studies in South Florida Canals
Ross and Jones (1979) provide one of the earliest investigations of macroinvertebrate
communities in South Florida canals. This report included 32 stations throughout the region,
including 12 in freshwater canals of the SFWMD.
Rudolph (1985) examined the macroinvertebrate community structure at three canal sites west of
the urban areas and four canal sites impacted by urban development in eastern Miami-Dade
County. This study was conducted in conjunction with a chemical water quality assessment as a
part of the then Florida Department of Environmental Regulation's (now FDEP) statewide basin
assessment survey. The author concluded that all of the sites showed some degree of stress, most
likely due to effects of nutrient and organic input from the Everglades Water Conservation
Areas, the Everglades Agricultural Area, and runoff from urban canal systems. The natural flora
and fauna were also impacted by competitive interactions with exotic aquatic plants,
invertebrates, and fish. Results of this study are not directly comparable to more recent studies
because different methods for collection and processing of samples were used.
Rutchey (1992) monitored littoral shelf communities for three years in the West Palm Beach
Canal (C-51) to test whether shallow water habitat could be created and maintained in a canal
environment. Both bermed and unbermed littoral shelves quickly became dominated by exotic
species of floating vegetation, which limited plant community structure and caused reductions in
the number and diversity of benthic macroinvertebrates. The effects of the artificial structure and
management of canals were apparent both in the colonization by floating exotic species and by a
significant problem with floating debris that collected in the littoral area. Without continuous

Canals in South Florida Analysis of Biological Data from SFWMD Canals
44
control of invasive species, debris removal, and stabilization of bank areas, it was concluded that
canals were not a suitable setting for creating littoral shelves.
Macroinvertebrate Studies in Canals in Other States
Maxted et al. (2000) conducted a collaborative study among six states along the mid-Atlantic
seaboard of the United States to develop a consistent approach for collecting and interpreting
macroinvertebrate data for low gradient streams of the coastal plain. Macroinvertebrate, habitat
quality, physico-chemical (DO, conductivity, TSS, pH), and water nutrient (TP, NO3/NO2)
samples were collected in the fall of 1995 for three types of sites: (1) reference sites consisting of
natural streams, (2) habitat impaired sites (canals located primarily in agricultural areas), and
(3) water quality impaired sites (streams with flow dominated by a municipal wastewater
discharge and good habitat quality). Data were reanalyzed to compare macroinvertebrate metrics
among reference sites, habitat impaired sites, and water quality impaired sites separately
(Appendix D).
Results indicated that separation from reference sites was greater for habitat impaired sites than
for water quality impaired stream sites, indicating that habitat quality was a primary driver of
biological conditions in low gradient streams. Although the results are not directly applicable to
the aquatic fauna in Florida streams and canals, three conclusions can be drawn from the data
that may also apply to canals in South Florida:
The removal of riparian vegetation from canal banks makes it difficult for canals to
achieve a high degree of biological quality in canals
A high degree of biological quality can be achieved, despite poor water quality, if
natural channels and riparian vegetation are maintained
Reference sites were similar to each other from one state to the next, despite large
differences in land use and percentages of forested lands in their respective
catchments
Assuming that water quality is proportional to the degree of development in the catchment, the
high degree of urban and agricultural land uses at many reference sites did not affect the biology
of streams with natural channels and good riparian vegetation. Taken together, these results
provide further indication that water quality is less important than habitat quality in determining
the biological condition of canals.
Fish
SFWMD staff conducted a literature review of fish studies from South Florida canals. Results of
this review are summarized here and in Appendix E along with information provided on the use
of fish in aquatic weed maintenance.
Canals Located in Undeveloped or Natural Areas of South Florida
Trexler et al. (2000) concluded, based on results from studies conducted over several years at
eight sites in the Florida Everglades, that canals held the largest introduced fish populations in
the study area. Exotic species were more abundant in canals within disturbed or developed areas,
whereas canals in natural areas and natural habitats distant from canals held fewer introduced
fishes. Canals are a permanent aquatic refuge unlike any native Everglades habitat and are sites

Canals in South Florida Analysis of Biological Data from SFWMD Canals
45
where introduced species of fish often become established. Canals provide refuge from drought
for fish, which move into the marsh during the wet season. Urban and Everglades canals differ in
composition and proportion of native to exotic species – principally due to marsh-requirements
of native fishes (Trexler et al. 2000).
Jordan (1996) concluded that apparent changes in the occurrence and density of shrimp and
crayfish associated with proximity to canals may be due to top-down consumption by fishes and
lack of nutritive value of cyanobacteria to crayfish and shrimp in enriched zones. Fish had much
higher abundance within enriched areas bordering canals and this region may serve as a littoral
zone for fish production. Similarly, Turner et al. (1999) found that sharp nutrient gradients in
Everglades marshes along canals resulted in greater fish biomass at enriched sites than reference
sites. No such differences were apparent for invertebrates, suggesting that fish are consuming the
invertebrate production. Results of the study indicated standing stocks in the Everglades are
unusual, and are possibly similar to seasonal-tropical wetlands with limited deep-water refugia
for large-sized fish; in other words canals create excessive and artificial refugia for fish.
Rehage and Trexler (2006) found that density of fish and macroinvertebrates changed within
16 feet of canals with little change in community species composition, but showing a pattern,
most pronounced in the dry season, suggesting that canals act as refugia. The most apparent
effect of canals was that they act as conduits for nutrients that stimulated local productivity in
adjacent marshes. There was no evidence that canals were sources of predators into the marsh,
but more study is needed, particularly on how fish disperse from canals.
Within the Big Cypress National Preserve, canals supported the greatest diversity of fish species.
Most of these were saltwater-adapted or large freshwater predator species. As in other parts of
Florida, canals in the preserve also provide aquatic refuge during the dry season. Some species of
exotic fish captured on the marsh were exclusively taken at sites adjacent to canals (Ellis et al.
2004).
While canals clearly can act as refugia, the importance of this function depends on the size of the
fish (Howard et al. 1995). In the Arthur R. Marshall Loxahatchee National Wildlife Refuge,
large fish are uncommon in the marsh, but accumulate in large populations in canals and may
affect marsh fish densities within 1.5 miles of the canals (Trexler et al. 2004). Similarly,
preliminary results of studies conducted in coastal areas of Miami-Dade and Broward counties
indicated that small-bodied fishes were most common in shallow marsh habitats and larger-
bodied fishes were more common in canals (Nico et al. 2001).
In non-urbanized canals, particularly those through marshes, exotic fish are less numerous than
native fish (Hogg 1976). Many exotic species are less tolerant of low temperature conditions
than native species. During cold periods, water temperatures in the marshes tend to be
significantly lower than in the canals. This may explain why exotic species are less abundant in
the marshes. Canals and deep solution holes provide warm water refugia for exotic fish species
during cold weather conditions (Schofield et al. 2009). Other exotic species, such as the brown
hoplo, tolerate low temperature exposure and have expanded rapidly across many Everglades
habitats and into northern Florida following its introduction (Schofield and Huge 2009).
Langston and Schofield (2009) examined the spawning interaction between exotic Mayan cichlid
and native Everglades spotted sunfish to determine how an exotic fish can influence the
reproductive success and behavior of a native species. Mayans did not breed when native spotted
sunfish were present and did not appear to interfere with the native sunfish breeding success.
Canals in South Florida Analysis of Biological Data from SFWMD Canals
46
Kissimmee River/C-38 Canal Studies
In the Kissimmee River system, Perrin et al. (1982) found Florida gar was the dominant species
by weight in trawl samples of the C-38 Canal and the remnant river channels. Florida gar also
dominated gill net samples of C-38, while gizzard shad dominated samples from remnant river
runs (Perrin et al. 1982). Three species, the blackbanded darter, coastal shiner, and tidewater
silverside, have not been collected since channelization and may have been extirpated from the
system.
Furse et al. (1996) documented the presence and distribution of largemouth bass in the C-38
Canal and adjacent oxbows and marshes and concluded that large bass preferred to live in the
canals but tended to migrate toward shallower water in response to oxygen stress.
A creel survey conducted between September 1978 and August 1980 indicated that the
percentage of total fishing effort directed toward largemouth bass declined to 45 percent (Perrin
et al. 1982), a decrease of more than 30 percent since channelization. This indicates fishermen
began targeting other species, perhaps because fishing success for largemouth bass had
diminished. Mean catch rate for largemouth bass during the survey period was 0.25 fish/hour,
which was similar to the catch rate during historic conditions. Angler catch rates for bream have
increased by 32 percent (1.04 fish/hour), whereas catch rates for black crappie have declined by
29 percent (0.67 fish/hour).
Canals in Developed Areas
Canals in developed areas differ substantially with respect to their fish populations. Some
support healthy populations of native species, while others are dominated by exotics. Many
exotic fish historically existed only in canals after their initial introduction, and subsequently
became widespread and variably established in some Everglades marshes and peripheral habitats.
Some exotic species tolerate estuarine salinity conditions and low oxygen concentrations that
enhance their ability to survive in coastal canals and rock pits (Schofield et al. 2007). Poor water
quality and steep sides may make urban canals less than optimal for native fishes. These adverse
conditions allow invaders to more easily establish. Highly urban canals also receive little
predation pressure by wading birds or native fish due to low visitation or occurrence and may
allow exotics to flourish (Loftus and Kushlan 1987).
Studies by Loftus and Kushlan (1987) indicated that some canals remained free of exotics. Their
collections suggested that exotic species were not abundant in canals with healthy native fish
populations. Characteristics of canal size and shape, marginal and submerged vegetation, and
water quality permit native fishes to maintain their populations and perhaps prevent or delay a
large-scale takeover by exotics (Loftus and Kushlan 1987).
The presence of exotic species does not necessarily have adverse effect on native species.
Shafland et al. (1985) observed that an excellent largemouth bass fishery existed in Black Creek
Canal (C-1) despite the presence of large number of tilapia. Most native canal fishes are
primarily carnivorous, whereas most exotic fishes are herbivorous or detritivorous (Courtenay
and Hensley 1979), thus exotics can consume the large quantities of algae, macrophytes, and
detritus in canal system that are not exploited by native fishes (unpublished data, Loftus and
Kushlan 1987). Native and exotic species may therefore be able to coexist over long periods
since they are not necessarily competing for the same resources (see also Langston and Schofield
2009).

Canals in South Florida Analysis of Biological Data from SFWMD Canals
47
Fish Studies in Canals in Other Areas
Similar effects of channelization on fish assemblages have been documented in other systems.
Tarplee et al. (1971) found channelized Coastal Plain streams in North Carolina had reduced
biomass, diversity, carrying capacity, and number of harvestable sized game fishes. They also
noted channelization adversely affected game fish to a greater degree than nongame fish. Hortle
and Lake (1983) attributed decreased abundance and species richness of fishes in Australian
streams after channelization to loss of suitable habitat (i.e., area of snags, area of slack water,
length of bank fringed with vegetation). Other studies attribute reduced standing crop, density,
and diversity of stream fish to decreased habitat, as well as decreased cover and shelter, food,
and available spawning areas (Guillory 1979, Welcomme 1985, Sheaffer and Nickum 1986,
Copp 1989, Junk et al. 1989). Karr and Schlosser (1978) suggested that as much as 98 percent of
the standing crop of fishes in a river may be lost when the flood regime is altered by
channelization. Jurajda (1995) concluded that reduced reproduction and recruitment of age-0+
fish following channelization was primarily due to the isolation of inundated floodplain from the
main channel, resulting in loss of spawning habitat and refugia.
Birds
Dalrymple and Dalrymple (1996) found that canals served as focal point for some species,
especially wading birds and other wildlife. For other bird species, such as least bitterns, they
provide unfavorable habitat (Frederick et al. 1990).
Alligators
Reproduction and Development
Chopp et al. (2000) determined that hatching success and young survivorship is lower in canals.
Further studies by Chopp et al. (2001, 2002a) concluded that canals were harsh environments for
alligator reproduction compared to interior sites due to flooding and predation of canal nests.
However, Chopp et al. (2000) suggest that canal alligators benefit from warmer canal water and
better digestion rates and are therefore larger and healthier than marsh alligators. Chopp et al.
(2002b) determined that alligators in the Loxahatchee National Wildlife refuge produce
relatively small egg clutches compared to North Florida and Louisiana and therefore have
comparatively lower annual reproduction rates. Egg position in the clutch significantly affects
the probability of eggs being flooded and surviving and even small changes of nest elevation
affect survivorship along canals (Chopp, unpublished data). During 2000, all canal nests flooded,
while no interior marsh nests flooded.
Diet
Fogarty and Albury (1967) studied juvenile alligators from the L-38 Canal and observed that
apple snails and crayfish made up the vast majority of the diet. In contrast, Barr (1997)
conducted studies of alligator diets within the Everglades, primarily within Shark River Slough,
and found that snakes were dominant prey of adult alligators, snails for sub-adults, and insects
for juveniles. Fish were consumed far less than snakes and birds were rare in stomachs. The
author suggested that canals have a different prey base and thermal gradient than sawgrass

Canals in South Florida Analysis of Biological Data from SFWMD Canals
48
marshes. Urban canals and their alligators have a very different ecology than those associated
with the Everglades.
Hydrology
Studies by Fujisaki et al. (2009) suggest that alligators are very sensitive to hydrologic
conditions, even on short time scales (days). In areas that have become overdrained, alligators
only occur in permanent water bodies such as canals or ponds, or during periods of extremely
high water. Alligators, initially displaced by development or drainage, have ended up in canals
(Meshaka and Babbitt 2005).
Migration and Distribution
Kushlan (1974) concluded that canals are the primary refugia for alligators in many areas and
that many large alligators reside in canals. Studies by Mazzotti and Brandt (1994) and Chopp et
al. (2000) indicated that adult alligator density was high in canals due to immigration and high
adult survival rates. Canals influence alligator populations 0.6 miles into adjacent Everglades
marshes. Chopp et al. (2000) suggest that canal alligators move over larger distances and have
larger home ranges than alligators that reside primarily in the marshes. By contrast, Morea et al.
(2000) determined that alligators in the Water Conservation Areas and Everglades National Park
do not differ in home range; males moved longer distances and had wider home ranges than
females and canal alligators had linearly shaped home ranges as opposed to marsh alligator home
range size. Large alligators moved less and their movements increased as water levels increased.
Adult alligator density is higher in canals than in the marsh and alligators living in canals
preferred to stay there. Barr (personal communication) feels that alligators use canals as refugia
and conduits for long-distance movements, but often forage in the adjacent marsh.
More recently, Phillips et al. (2003) monitored alligator movements with telemetry. They
observed that canal alligators strongly selected canals over all other cover types. Canal alligators
spend most of their time in canals and move greater distances (i.e., have larger, more linear home
ranges) than alligators in the WCA or Everglades National Park marshes.
Crocodiles
Saltwater crocodiles generally prefer saline or brackish water and only occasionally occur in the
freshwater canals of South Florida. Populations in Biscayne Bay and Florida Bay have been
studied to some extent. Reported canal-dependant crocodiles range as far north as southern
Biscayne Bay/Turkey Point. The easternmost observations of crocodiles are on northern Key
Largo in old canals. The only permanent northern population is located in the warm canals in a
Fort Lauderdale power plant. Crocodiles have been reported to move 6 miles inland using canals
(Kushlan and Mazzotti 1989).

Canals in South Florida Survey of SFWMD Canal Water Quality and Sediments
49
3. SURVEY OF SFWMD CANAL WATER QUALITY AND SEDIMENTS
Introduction
A survey of canal water quality was undertaken to accurately characterize conditions in District
canals (primary canals) with respect to key water quality constituents. Water quality monitoring
locations were grouped by canal into one of eight regions:
Caloosahatchee River Basin (CAL)
Everglades Agricultural Area (EAA)
Lower East Coast (LEC)
Lower Kissimmee River Basin (KIS)
Lower West Coast (LWC)
Upper East Coast (UEC)
Upper Kissimmee Basin, Chain of Lakes (UKB)
Water Conservation Areas (WCA)
These groups allowed a comparison of basic water quality within and between regions, and to
illustrate variability within and between canals.
Methods
Identification of Canal Water Quality Monitoring Stations
In all, 208 canal water quality monitoring stations were identified using Google Earth EC and the
ArcHydro layers identifying the SFWMD‘s primary canal system and active water quality
monitoring stations (Figure 11). At these locations, samples were collected using grab samples,
an autosampler, or both. The station had to meet the following criteria:
Currently active sampling location
Have at least one sample during the period of analysis (1999 to 2009)
Be located directly in a primary canal
After the initial screening using Google Earth EC, a list of selected stations and associated maps
were circulated among the SFWMD‘s Water Quality Monitoring staff, who are responsible for
all District water quality compliance-related monitoring, to ensure that (1) the stations selected
met the first and third conditions above and (2) that no stations that would meet the selection
criteria had been omitted. The list was modified based on this review. Eight research canal
stations used by the SFWMD‘s Everglades Division were also added to the list. It should also be
noted that the District‘s primary canal system does not include canals in the urban areas of the
Lower East Coast that are part of those areas‘ secondary and tertiary canal systems.

Canals in South Florida Survey of SFWMD Canal Water Quality and Sediments
50
Figure 11. SFWMD monitoring locations used in this survey of water quality and the eight regional groups of stations.

Canals in South Florida Survey of SFWMD Canal Water Quality and Sediments
51
Identification of Key Water Quality Constituents
SFWMD scientists and engineers participating in the Canal Science Team proposed four key
water quality constituents for this analysis (Table 2).
Table 2. Key canal water quality constituents.
Parameter Units Abbreviation
Total Phosphorus mg/L TPO4
Total Nitrogen mg/L TOTN
Specific Conductance µS/cm COND
Chlorophyll a (corrected) mg/m3 CHLA
Period of Analysis
The period of analysis was January 1, 1999, to April 30, 2009. This period was selected to
emphasize more recent water quality conditions in canals based on consistent sampling and
quality assurance protocols, as opposed to examining the entire period of record for the identified
stations.
Data Management and QA/QC
Water quality data for the identified canal stations and parameters were extracted from the
DBHYDRO database. Concentrations that were below detection limits were assigned a value of
half of the detection limit. The data were placed in an MS Access 2007 database for further
review and QA/QC. The database contained 359,369 records prior to QA/QC. The database was
then screened using the following QA/QC processes:
Data that were qualified as having failed laboratory or field QA/QC tests were removed
Data with comments indicating that the data should not be used for analysis were deleted
Duplicate results were removed
The minimum and maximum values of each parameter were examined for outliers to be
further investigated using the SFWMD‘s established QA/QC procedures
Data that showed reversals in nutrient concentration (e.g., where dissolved PO4 was
greater than total TPO4) were removed
Following screening and review, 337,915 records remained. Some of those records were multiple
readings on the same day at the same location. These were collapsed into a mean daily value at
the location. Ultimately 331,733 records were used in this survey of canal water quality.

Canals in South Florida Survey of SFWMD Canal Water Quality and Sediments
52
Summary Statistics
SYSTAT 124 software was used to produce summary statics to analyze the water quality data
and the resulting figures follow. Corresponding tables of all summary statistics produced are
provided in Appendix F, shown by region, canal, and station.
Water quality data can be highly variable and often skewed (non-normal distribution). Therefore,
the median and geometric mean values are probably more reliable indicators of long-typical
water quality conditions within the canals. The 25th
and 75th
percentile values are provided to
indicate variability about the median and the range within which 50 percent of the observed
values fell.
Results and Discussion
Regional Comparisons and Spatial Patterns
Figures 12 through 15 show the variation in the summary statistics for the key water quality
parameters (Table 2) among the eight regions (Figure 11). The canal monitoring locations in the
Upper Kissimmee Basin only had total TPO4 analyses, so subsequent parameter graphs only
show the other seven regions.
These figures illustrate the large variation by region and unique patterns between parameters.
Results for median TPO4 vary by an order of magnitude among sites and appear to related to the
intensity of agricultural land use for the central and northern portions of the District (Figure 12).
Median values of TOTN and conductivity show less variation. Most water conveyed through the
canals has a specific conductance of 500 µS/cm or more (Figure 15), which is not surprising in
part because many canals were cut through surficial soils high in limestone content. Chlorophyll
a values are not particularly elevated in canals; all median values are about 10 mg/m3 or less
(Figure 14), well below the state‘s nutrient impairment threshold of 20 mg/m3. In the context of
high nutrient levels in the Caloosahatchee River Basin, Everglades Agricultural Area, Lower
Kissimmee River Basin, and the Upper East Coast, it appears that canals are not very sensitive to
nutrient concentrations.
The data show a distinct spatial pattern for both TPO4 (Figure 16) and TOTN (Figure 17). The
highest values are near Lake Okeechobee and the Everglades Agricultural Area and lowest
values furthest away from this central area.
Temporal Variability and Wet Season Effects
The data provide a relative comparison of data variability across the eight regions and between
stations within each region. Temporal variability was high for many stations and several
parameters. The interquartile ranges (size of the probability boxes) often exceeded median values
indicating high variability. Variations in TPO4 were highest in the Everglades Agricultural Area
and lowest in the Lower East Coast, Lower West Coast, Upper Kissimmee Basin, and Water
Conservation Areas. Variations in TOTN were highest in the Everglades Agricultural Area and
lowest in the Caloosahatchee River Basin. Variation associated with wet seasons was also
4 SYSTAT Software, Inc., Chicago, IL

Canals in South Florida Survey of SFWMD Canal Water Quality and Sediments
53
examined for TPO4. Figure 18 shows the impact by region of season by comparing the wet
season (June to October) TPO4 concentration summary statistics and annual summary statistics
(also shown in Figure 12). Wet season (June to October) summary statistics for TPO4 are higher
in each region and the range is higher and greater (Figure 18). The most obvious example of this
is the wet season and annual statistics for the Upper East Coast region.
There also is considerable variation in concentration over time at each station. For example,
Figure 19 shows that variation at S8, a major pump station on the Miami Canal in the
Everglades Agricultural Area. The variation and average values of TPO4 have been decreasing at
this station in association with the implementation of agricultural best management practices in
the mid-1990s and the completion of Stormwater Treatment Area 3/4 in 2005.

Canals in South Florida Survey of SFWMD Canal Water Quality and Sediments
54
Figure 12. Total phosphorus concentration summary statistics by region.
Figure 13. Total nitrogen concentration summary statistics by region.
0.00
0.05
0.10
0.15
0.20
0.25
0.30
0.35
0.40
0.45
0.50
CAL EAA KIS LEC LWC UEC UKB WCA
Tota
l Ph
osp
ho
rus
( m
g/L
)
Region
MeanGeometric MeanMedian25th to 75th
percentile range
0
0.5
1
1.5
2
2.5
3
CAL EAA KIS LEC LWC UEC WCA
Tota
l Nit
roge
n (
mg
/L)
Region
MeanGeometric MeanMedian25th to 75th
percentile range

Canals in South Florida Survey of SFWMD Canal Water Quality and Sediments
55
Figure 14. Corrected chlorophyll a concentration summary statistics by region.
Figure 15. Specific conductance summary statistics by region.
0
2
4
6
8
10
12
14
16
18
CAL EAA KIS LEC LWC UEC WCA
Ch
loro
ph
yll-
a (c
orr
ect
ed, m
g/M
3)
Region
MeanGeometric MeanMedian25th to 75th
percentile range
0
100
200
300
400
500
600
700
800
900
CAL EAA KIS LEC LWC UEC WCA
Spe
cifi
c C
on
du
ctan
ce (u
S/cm
)
Region
MeanGeometric MeanMedian25th to 75th
percentile range

Canals in South Florida Survey of SFWMD Canal Water Quality and Sediments
56
Figure 16. Total phosphorus median values.

Canals in South Florida Survey of SFWMD Canal Water Quality and Sediments
57
Figure 17. Total nitrogen median values.
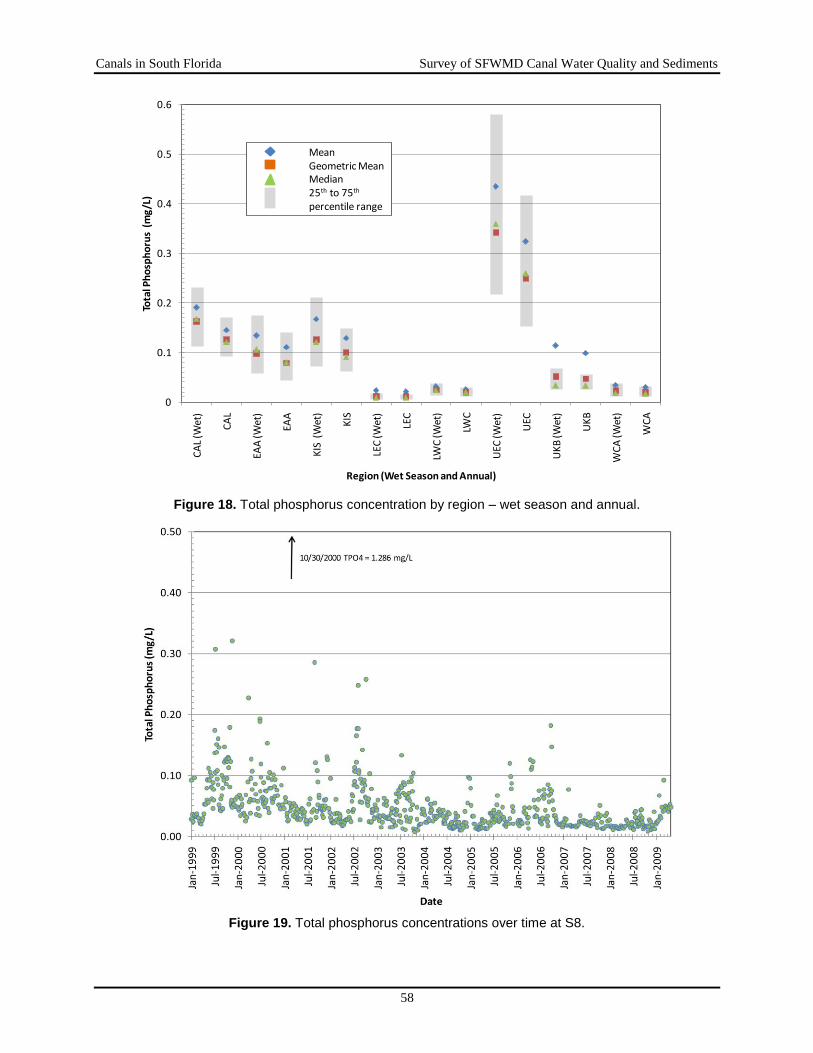
Canals in South Florida Survey of SFWMD Canal Water Quality and Sediments
58
Figure 18. Total phosphorus concentration by region – wet season and annual.
Figure 19. Total phosphorus concentrations over time at S8.
0
0.1
0.2
0.3
0.4
0.5
0.6
CA
L (W
et)
CA
L
EAA
(Wet
)
EAA
KIS
(W
et)
KIS
LEC
(Wet
)
LEC
LWC
(Wet
)
LWC
UEC
(Wet
)
UEC
UK
B (W
et)
UK
B
WC
A (W
et)
WC
A
Tota
l Ph
osp
ho
rus
(m
g/L
)
Region (Wet Season and Annual)
MeanGeometric MeanMedian25th to 75th
percentile range
Canals in South Florida Survey of SFWMD Canal Water Quality and Sediments
59
Regional Canals
Variation in summary statistics among canals within a region was also examined. Statistics for
TPO4 and TOTN for canals in the Upper East Coast (Figure 20) and the Lower East Coast
(Figure 23) were compared (Figures 12 to 13 and 24 to 25). In general, canal locations are
ordered from north to south (left to right) on the plot. As noted earlier in regional comparisons,
the variation of TPO4 in these regional canals (Figures 21 and 24) tends to be much higher than
that for TOTN (Figures 22 and 25) and the two constituents do not correspond closely.
Canal Stations
The West Palm Beach Canal (Figure 26) and the Miami Canal (Figure 29) were used to show
variation in summary statistics for nutrient (TPO4 and TOTN) concentrations at stations within
each canal. These are shown in Figures 27 to 28 and 30 to 31. Stations are ordered from
upstream to downstream (left to right). Within these canals, TPO4 (Figures 27 and 30) tends to
change more than TN (Figures 28 and 31) as water moves downstream and nutrient levels tend
to be higher at the more inland, upstream sites.
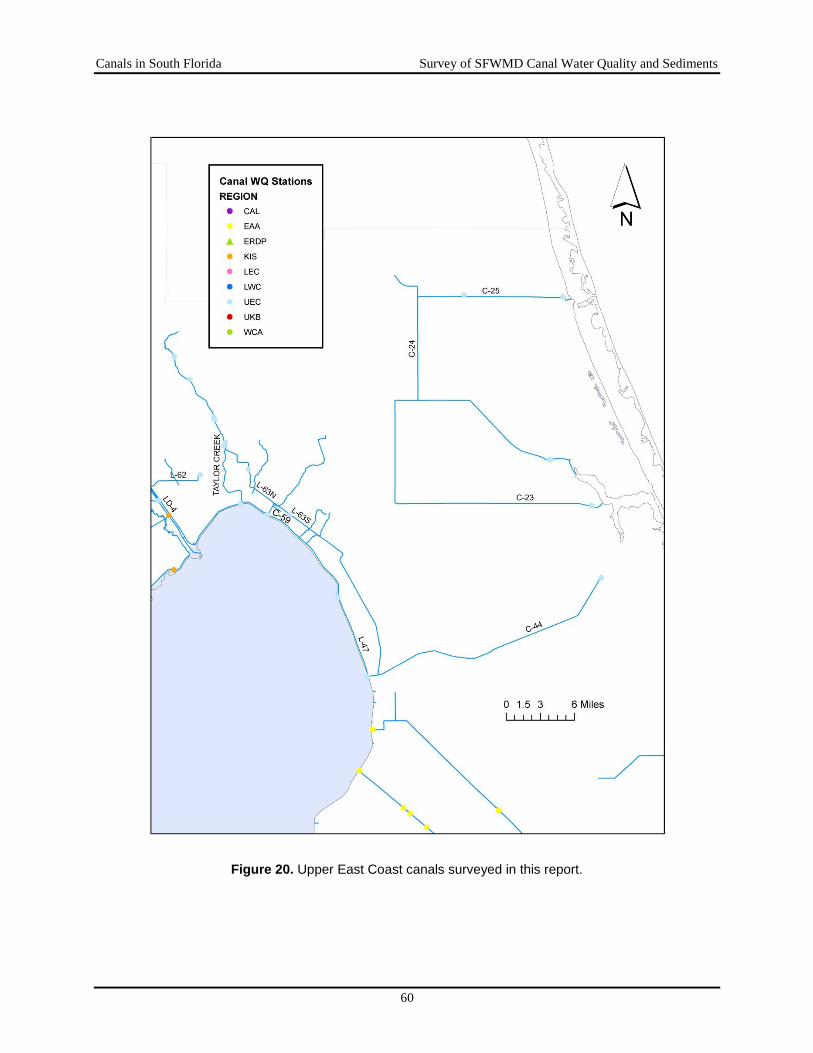
Canals in South Florida Survey of SFWMD Canal Water Quality and Sediments
60
Figure 20. Upper East Coast canals surveyed in this report.

Canals in South Florida Survey of SFWMD Canal Water Quality and Sediments
61
Figure 21. Total phosphorus concentration summary statistics for canals in the Upper East Coast region.
Figure 22. Total nitrogen concentration summary statistics for canals in the Upper East Coast region.
0
0.1
0.2
0.3
0.4
0.5
0.6
C-25 C-24 C-23 C-44 L-62 Ld-4 Taylor Creek
L-63n L-63s C-59 L-47
Tota
l Ph
osp
ho
rus
(mg
/L)
UEC Canals
Tributary to Indian River Lagoon Tributary to lake Okeechobee
MeanGeometric MeanMedian25th to 75th percentile range
0
0.5
1
1.5
2
2.5
3
C-25 C-24 C-23 C-44 L-62 Ld-4 Taylor Creek
L-63n L-63s C-59 L-47
Tota
l Nit
roge
n (m
g/L
)
UEC Canals
Tributary to Indian River Lagoon Tributary to Lake Okeechobee
MeanGeometric MeanMedian25th to 75th
percentile range

Canals in South Florida Survey of SFWMD Canal Water Quality and Sediments
62
Figure 23. Lower East Coast canals surveyed in this report

Canals in South Florida Survey of SFWMD Canal Water Quality and Sediments
63
Figure 24. Total phosphorus concentration summary statistics for canals in the Lower East Coast region.
Figure 25. Total nitrogen concentration summary statistics for canals in the Lower East Coast region.
0
0.05
0.1
0.15
0.2
0.25
C-18 C-17 C-51 C-16 C-15 C-11 L-31n C-111 C-111e
Tota
l Ph
osp
ho
rus
(mg
/L)
LEC Canals
MeanGeometric MeanMedian25th to 75th
percentile range
0
0.2
0.4
0.6
0.8
1
1.2
1.4
1.6
1.8
C-18 C-17 C-51 C-16 C-15 C-11 L-31n C-111 C-111e
Tota
l Nit
roge
n (m
g/L
)
LEC Canals
MeanGeometric MeanMedian25th to 75th
percentile range

Canals in South Florida Survey of SFWMD Canal Water Quality and Sediments
64
Figure 26. West Palm Beach canal stations.

Canals in South Florida Survey of SFWMD Canal Water Quality and Sediments
65
Figure 27. Total phosphorus concentration summary statistics for stations in the West Palm Beach Canal.
Figure 28. Total nitrogen concentration summary statistics for stations in the West Palm Beach Canal.
0
0.05
0.1
0.15
0.2
0.25
0.3
0.35
0.4
Tota
l Ph
osp
ho
rus
(mg
/L)
West Palm Beach Canal Stations
Canal 0 5.1 5.9 7.7 9.6 11.9 14.9 17.0 21.0 21.4 24.3 35.1Miles Lake
Okeechobee
MeanGeometric MeanMedian25th to 75th
percentile range
0
0.5
1
1.5
2
2.5
3
3.5
4
4.5
S352 S5A S5AE C51S155
Tota
l Nit
roge
n (m
g/L
)
West Palm Beach Canal Stations
Canal 0 21.0 21.4 35.1
Miles LakeOkeechobee
MeanGeometric MeanMedian25th to 75th
percentile range
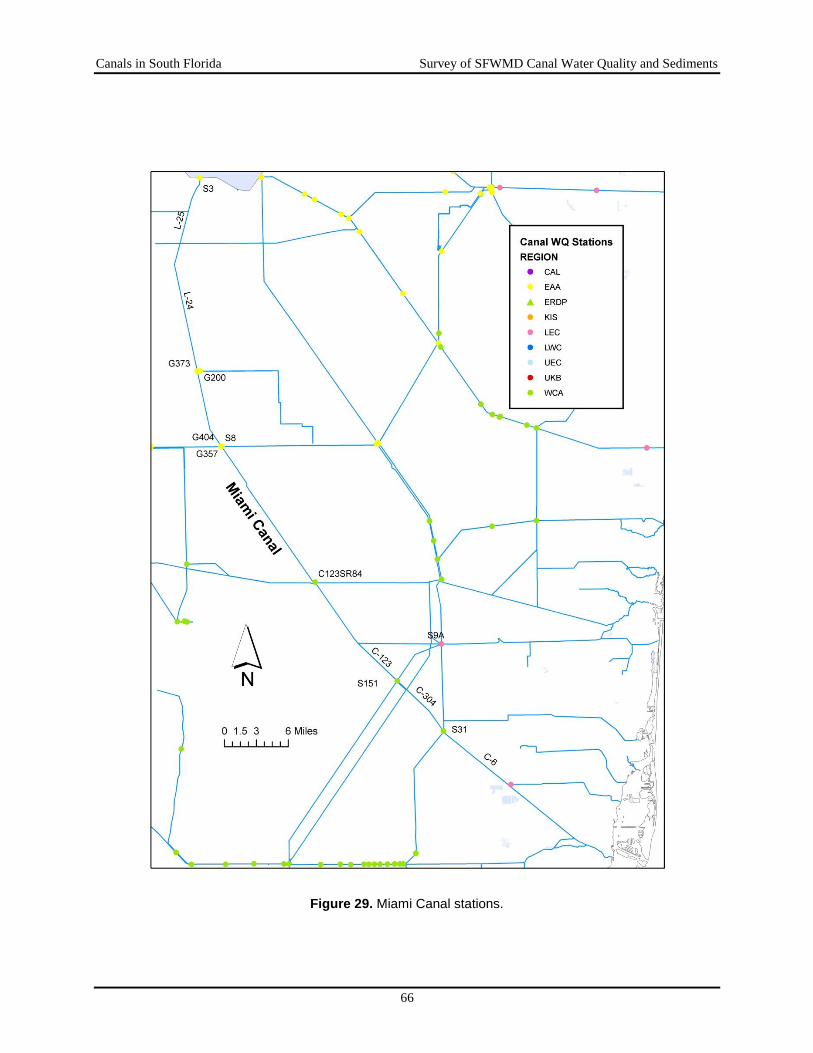
Canals in South Florida Survey of SFWMD Canal Water Quality and Sediments
66
Figure 29. Miami Canal stations.
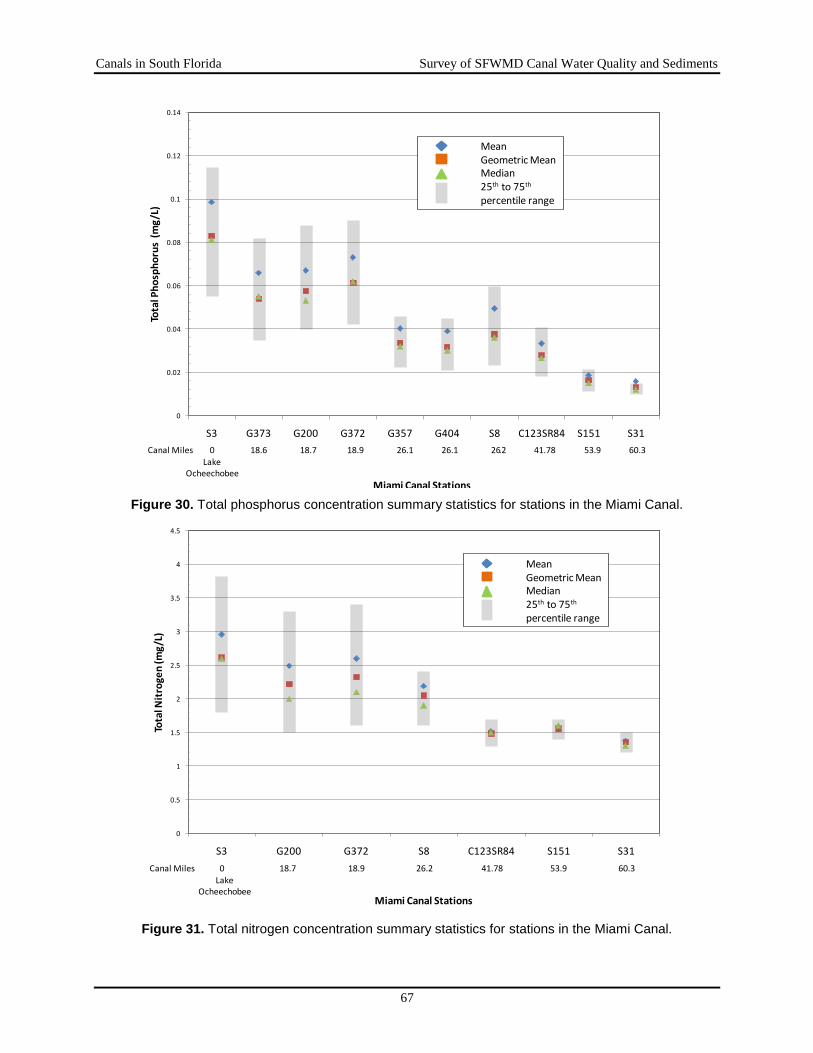
Canals in South Florida Survey of SFWMD Canal Water Quality and Sediments
67
Figure 30. Total phosphorus concentration summary statistics for stations in the Miami Canal.
Figure 31. Total nitrogen concentration summary statistics for stations in the Miami Canal.
0
0.02
0.04
0.06
0.08
0.1
0.12
0.14
S3 G373 G200 G372 G357 G404 S8 C123SR84 S151 S31
Tota
l Ph
osp
ho
rus
(m
g/L
)
Miami Canal Stations
Canal Miles 0 18.6 18.7 18.9 26.1 26.1 26.2 41.78 53.9 60.3
Lake Ocheechobee
MeanGeometric MeanMedian25th to 75th
percentile range
0
0.5
1
1.5
2
2.5
3
3.5
4
4.5
S3 G200 G372 S8 C123SR84 S151 S31
Tota
l Nit
roge
n (m
g/L
)
Miami Canal Stations
Canal Miles 0 18.7 18.9 26.2 41.78 53.9 60.3Lake
Ocheechobee
MeanGeometric MeanMedian25th to 75th
percentile range
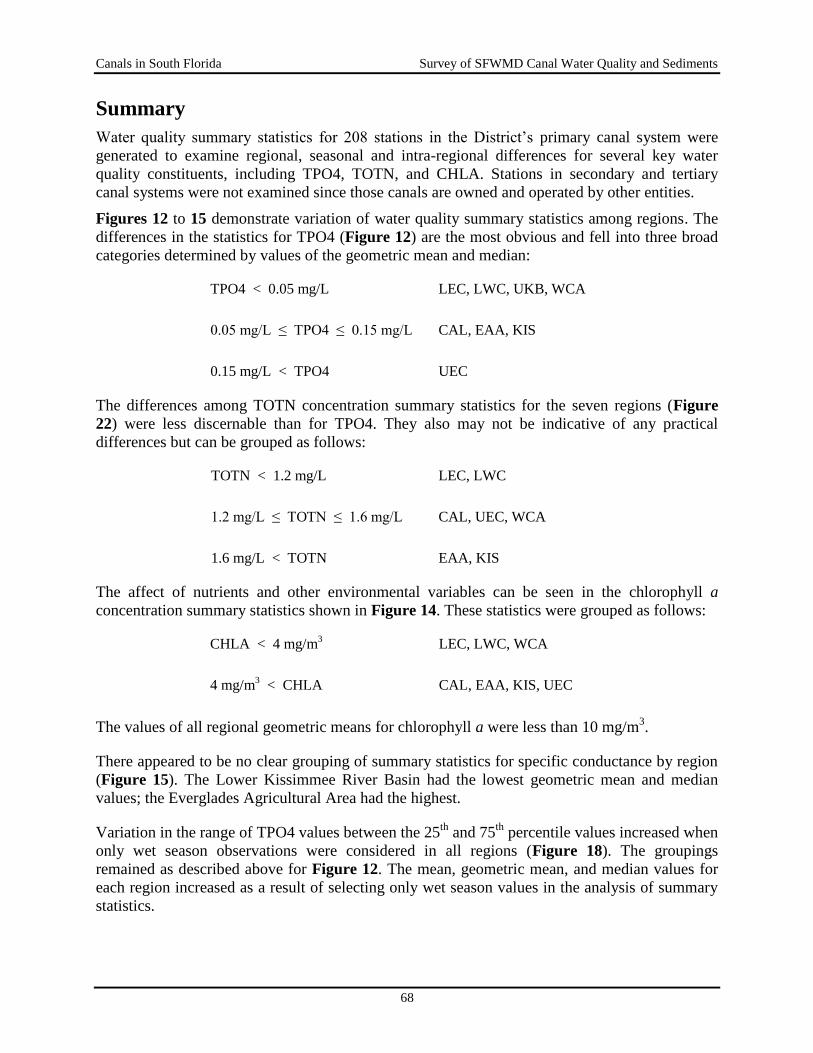
Canals in South Florida Survey of SFWMD Canal Water Quality and Sediments
68
Summary
Water quality summary statistics for 208 stations in the District‘s primary canal system were
generated to examine regional, seasonal and intra-regional differences for several key water
quality constituents, including TPO4, TOTN, and CHLA. Stations in secondary and tertiary
canal systems were not examined since those canals are owned and operated by other entities.
Figures 12 to 15 demonstrate variation of water quality summary statistics among regions. The
differences in the statistics for TPO4 (Figure 12) are the most obvious and fell into three broad
categories determined by values of the geometric mean and median:
TPO4 < 0.05 mg/L LEC, LWC, UKB, WCA
0.05 mg/L ≤ TPO4 ≤ 0.15 mg/L CAL, EAA, KIS
0.15 mg/L < TPO4 UEC
The differences among TOTN concentration summary statistics for the seven regions (Figure
22) were less discernable than for TPO4. They also may not be indicative of any practical
differences but can be grouped as follows:
TOTN < 1.2 mg/L LEC, LWC
1.2 mg/L ≤ TOTN ≤ 1.6 mg/L CAL, UEC, WCA
1.6 mg/L < TOTN EAA, KIS
The affect of nutrients and other environmental variables can be seen in the chlorophyll a
concentration summary statistics shown in Figure 14. These statistics were grouped as follows:
CHLA < 4 mg/m3 LEC, LWC, WCA
4 mg/m3 < CHLA CAL, EAA, KIS, UEC
The values of all regional geometric means for chlorophyll a were less than 10 mg/m3.
There appeared to be no clear grouping of summary statistics for specific conductance by region
(Figure 15). The Lower Kissimmee River Basin had the lowest geometric mean and median
values; the Everglades Agricultural Area had the highest.
Variation in the range of TPO4 values between the 25th
and 75th
percentile values increased when
only wet season observations were considered in all regions (Figure 18). The groupings
remained as described above for Figure 12. The mean, geometric mean, and median values for
each region increased as a result of selecting only wet season values in the analysis of summary
statistics.

Canals in South Florida Survey of SFWMD Canal Water Quality and Sediments
69
Differences among canals within the Upper East Coast and Lower East Coast are apparent for
TPO4 but less so for TOTN, although differences can be observed in the corresponding summary
statistics (Figures 21 to 22 and 24 to 25).
Along canal reaches, there is a downward trend in the summary statistics for TPO4 and TOTN as
water moved downstream in the Miami and West Palm Beach canals (Figures 24 to 25 and 27 to
28). Although not examined in this analysis, nutrient summary statistics are tied to land use. This
is most obvious in Figures 24 to 25 and 27 to 28. These figures show the change in statistics
from agricultural or urban areas through Stormwater Treatment Areas and WCAs to coastal ridge
land uses (primarily urban and agricultural) and ultimately to tide.
Sediments
The SFWMD recognizes that sediment characteristics in canals, lakes, and wetlands are an
important factor in determining the chemistry of overlying water. Numerous studies of sediments
have been conducted in lakes and wetlands of South Florida. Although fewer such studies have
been conducted in canals, information is available. Due to time and manpower constraints,
investigations on canal sediments were not extensively searched or reviewed for this report. Two
studies are included as representative of the types of additional data that are likely available.
Further information concerning these studies is provided in Appendix G.
Trefry et al. (2009) provide one of the only detailed studies of the chemistry of canal sediments
in South Florida. Bottom sediments in the West Palm Beach (C-51) Canal were analyzed in 33
locations. The average depth of sediments was about 20 inches with 5 of 33 samples in the canal
having sediment depths greater than 3 feet. Water depths at these locations averaged 14 feet with
shallower depths being seen upstream. No upstream/downstream pattern was evident in sediment
depth. Using a suite of chemical ratios for sediments from the C-51 Canal and from Lake Worth
Lagoon, Trefry et al. (2009) provided substantial evidence that downstream sediments in the
lagoon within 1.2 miles of the canal terminus are derived largely from canal sediments and that
canal sediments in turn, are sourced primarily from the western, agricultural portion of the canal.
Terrestrial inputs upstream are an important source of organic matter in the canal and
downstream in the lagoon. This observation is important as it suggests that the canal is
subsidized heavily from external particulate inputs, as opposed to generating organic matter
primarily within the canal food web.
A survey of canal sediments, characterizing approximately 122 miles of canals in the Water
Conservation Areas was conducted by the University of Florida Institute of Food and
Agricultural Sciences in 2001 (Daroub et al. 2003, Diaz et al. 2006). Canals were grouped by
location into eastern (L7, L39, and L40), central (L5, L6, and L38), and western (Miami Canal
North and Miami Canal South areas. Sediment samples and sediment depths were collected
along transects every 1 mile down the length of the canal. Average TPO4 concentrations from
surface sediments ranged from 258 mg/kg in sediment samples from the L6 Canal to 1700 mg/kg
in samples from the Miami Canal South. The results of this study indicated the following:
Sediment depths were highly variable, both across a given transect and longitudinally
down any given canal. Canal average sediment depth ranged from 1.8 feet in the L6
Canal to 8 feet in the L7N Canal with a volume totaling almost 2 million cubic yards.

Canals in South Florida Survey of SFWMD Canal Water Quality and Sediments
70
Low sediment accumulation in some canals was suggested to be a result of higher flow
velocities due to the canals‘ small cross-sectional areas, increasing the likelihood of
sediment resuspension and transport during strong drainage events.
The total sediment volume calculated for the entire 122 miles of canal reaches was almost
9 million cubic yards, with 71 percent stored in the canals from the eastern side (L7, L39,
and L40) of the WCAs.
The total phosphorus mass calculated for the entire sediment profile of all canal reaches
in the WCAs was estimated to be approximately 2000 tons.
Phosphorus fractionation results indicated that more than 80 percent of the TPO4 mass in
the surface 4-inch sediment layer of all canals in the WCAs is fairly stable and may be a
long-term sink for phosphorus.
Canal sediments from the eastern side of the WCAs were low in bulk density, highly
organic, and more susceptible to resuspension and transport during strong drainage
events. These sediments showed higher iron- and aluminum-bound phosphorus and
organic-bound phosphorus fractions, making them more susceptible to changes in redox
potential of the sediments that could result in long-term release of iron-bound phosphorus
to the overlying water column.

Canals in South Florida Summary, Conclusions and Synthesis
71
4. SUMMARY, CONCLUSIONS AND SYNTHESIS
This technical support document is intended to convey existing information on the nature and
ecology of canals in South Florida. This information can facilitate prudent management of these
unique resources while it supports FDEP‘s and USEPA‘s efforts to develop water quality criteria
for canals and FDEP‘s efforts to revise the existing designated use classifications of Florida
waters. The document summarizes a preliminary survey of information available on the water
quality and ecology of the primary water canal system in southern Florida. The compilation
encompasses published literature, agency reports and original data derived from searches of
information from cities, counties, municipalities, and universities. The document was assembled
and edited by a team of scientists and engineers at South Florida Water Management District,
West Palm Beach and this team intends to continue adding information on canals for future
versions of the report.
The South Florida Canal System: History, Function and Diversity
History
The primary water management system in South Florida consists of the canals and
management features operated by the SFWMD and the USACE, as opposed to secondary
and tertiary systems that are managed by local governments, special districts, or private
landowners.
Initial canal construction focused on needs for navigation, drainage, and flood control.
Construction of canals in South Florida began in the Kissimmee River watershed in the
late 1800s with the digging of channels to connect lakes in the upper Kissimmee basin,
channelization of the Kissimmee River from Lake Kissimmee to Lake Okeechobee, and
construction of a channel to connect Lake Okeechobee to the headwaters of the
Caloosahatchee River.
Construction of canals south of Lake Okeechobee began in the early twentieth century.
Initial efforts focused on drainage of lands for agricultural development. The key primary
canals were complete by 1917.
Improvements were added from the 1920s to the 1950s to provide services to urban areas
along the coast, increase flood protection, and reduce the potential for damage from
hurricanes. Water supply became a major issue in the mid-twentieth century.
Beginning in the 1970s and continuing through the end of the twentieth century,
additional emphasis was placed on improved management of environmental resources
and ecosystem restoration across the region.
Design and Function
Canals are designed and managed to meet human and natural system needs. Canals
primarily maintain appropriate water levels and convey water from areas that have too
much water and toward areas that have too little and move water for discharge to tide or
into areas where it can be conserved.

Canals in South Florida Summary, Conclusions and Synthesis
72
Most canals provide limited habitat for aquatic plants and animals. In some locations,
canals serve an important ecological function by providing deepwater refugia during dry
periods and some canals provide highly productive recreational fisheries.
Primary canals in South Florida were constructed to collect water from secondary
systems, convey water over long distances, provide interconnections among storage
areas, and in the process, provide regional drainage, flood control, and water delivery.
Storage areas and flood prone lands are often surrounded by protective levees. ―Borrow‖
canals are constructed adjacent to the levees to provide the necessary fill and often serve
as components of the primary water management system.
Canals that were constructed for one purpose have been subsequently modified and
improved to meet other needs. For example, the original regional canals extending south
of Lake Okeechobee were intended to provide drainage for adjacent lands and for
transport of agricultural products to the coast. Later they were enlarged to improve flood
protection and subsequently further modified with the placement of control structures to
enhance water supply capabilities for man and the environment.
Efforts to restore degraded environmental resources, notably in the Kissimmee River,
Lake Okeechobee, and the Everglades, are underway and will result in further
refinements to the primary canal system.
Diversity of Canals in the South Florida Water Management System
Developed over the past hundred years, the canal-based water management system in South
Florida is one of the world‘s largest and most complex civil works projects. Over 1300 water
control structures, 64 pump stations, and 2600 miles of canals have allowed the South Florida
Water Management District to provide flood control, water supply, navigation, and
environmental management over its 16 county, 17,000 square mile watershed.
Canals of the SFWMD differ greatly in their design and operation, depending primarily on the
land use and development within the basin. Land uses range from areas that are completely
surrounded by natural wetlands, such as those within the Water Conservation Areas or the
Kissimmee River Floodplain, to areas that are surrounded by intensive urban development, such
as coastal canals in Miami-Dade and Broward counties.
The diversity of our canals is reflected in many observations documented in this report:
Water quality conditions in canals are affected by surrounding soil conditions,
topography, groundwater interaction, and land uses. In some areas, notably eastern
Miami-Dade and Broward counties, water quality in the canals is strongly influenced by
direct interactions with groundwater.
Soil types surrounding canals range from sandy upland soils of the Atlantic Coastal
Ridge to hydric sands, marls, and peats of the Everglades.
Topography differs across the District, resulting in differences in canal depths, water
levels and flow rates. Water level elevations in canals range from 20 to 60 feet above sea
level in the Kissimmee and Istokpoga basins to less than 10 feet above sea level
throughout most of Miami-Dade, Broward, and Monroe counties.

Canals in South Florida Summary, Conclusions and Synthesis
73
Upper and Lower Kissimmee Basins
Canals in the Kissimmee Basin were initially constructed to provide drainage and
navigational access between lakes in the region and the Kissimmee River. They also
lowered water levels, drained wetlands, and made the adjacent lands suitable for
agriculture and development.
Today, the primary water management system in the Upper Kissimmee River Watershed
consists of a network of 15 canals that range from 0.2 to 4.5 miles in length for a total
length of over 30 miles. Water levels and flows in some of these canals are controlled by
nine primary water control structures that allow for the transfer of water in response to
local needs and regulation schedules.
The Lower Kissimmee and Lake Istokpoga Watershed includes 20 basins that reflect
large areas of open land, rangeland, citrus groves, and cropland. These basins eventually
discharge to Lake Okeechobee, either directly or via the primary canal system.
The C-38 Canal was constructed by the USACE through the Kissimmee River floodplain
to alleviate flood conditions and improve navigation. In recent years, sections of the C-38
Canal have been filled, structures removed, and water levels and flows managed as part
of the Kissimmee River Restoration Project. Restoration has resulted in significant
improvements to biological resources throughout the region.
Three major canals and structures south of Lake Istokpoga provide drainage and flood
control, convey excess water to Lake Okeechobee, and distribute water to agricultural
lands during drought.
Everglades Agricultural Area
The area within the Everglades Agricultural Area, directly south of Lake Okeechobee has
been drained, developed, and managed mainly for agricultural and urban use since the
early 1900s.
Nine water management basins within the area have a total area of 1181 square miles and
are served by 15 primary canals and 25 water control structures. This infrastructure
provides drainage, flood control, and water supply for croplands, local communities, and
Stormwater Treatment Areas, as well as conveys water supply and regulatory releases to
the south.
Water Conservation Areas and Everglades National Park
The WCAs and Everglades National Park basin is predominately wetlands with peat or
marl soils and isolated upland areas. The 3060 square mile area is served by 18 levees, 5
primary canals, and 60 water control structures.
The major regional canals that originate in Lake Okeechobee and pass through the WCAs
distribute water to balance the water management needs of the WCA marshes,
Everglades National Park, Lake Okeechobee, and adjacent watersheds.
Peripheral canals in this broad area are often associated with levees that define the edges
of storage areas. Delivery of water to the WCAs and Everglades National Park is
Canals in South Florida Summary, Conclusions and Synthesis
74
constrained by multiple management considerations in the upstream watersheds and
subject to balancing demand and supply.
Upper East Coast
The Upper East Coast includes seven canal drainage basins, the Tidal St. Lucie River,
and the North Fork of the St. Lucie River. The primary water management system
consists of 12 canals and 15 structures that control water distribution, level, and flows for
853 square miles of Martin, St. Lucie, and Okeechobee counties.
Land use in this area is primarily agricultural, consisting of citrus, crops, and cattle.
Urban development includes the cities and areas surrounding Stuart, Fort Pierce,
Indiantown, and Okeechobee. Large areas remain undeveloped natural pine forested
uplands, oak hammocks, wetlands, rangeland, or unimproved pasture.
The primary canals in this basin (C-44, C-23, C-24, and C-25) have a total length of
about 104 miles. They also provide drainage for agriculture, urban or residential
development, and regulation of groundwater levels. Most of the canals supply water for
irrigation during periods of low natural flow.
The C-44 Canal connects to the St. Lucie River and serves as an outlet for excess water
from Lake Okeechobee and is the eastern leg of the Okeechobee Waterway. Excess flows
from the enlarged watershed as well as periodic releases from Lake Okeechobee have
resulted in extensive erosion of the canal banks and significant stress to the St. Lucie
Estuary.
Lower East Coast
Canals in the coastal areas of Palm Beach, Broward, and Miami-Dade counties were
designed to provide flood protection, deliver water needed for urban and agricultural use,
and prevent saltwater intrusion.
Most of the area is covered with hydric soils, except for areas near the coast that are
underlain by a limestone rock ridge. These counties are very flat and most of the sub-
basins are less than 20 feet above sea level and many areas are five feet or less.
The eastern sections of these counties are underlain by the important Biscayne Aquifer,
which is closely linked to surface water and is extensively used as a source of drinking
water by utilities and homeowners. Many of the canals are cut into the rock of the
underlying aquifer, providing for a direct and continuous exchange of surface and
groundwater.
The four primary regional canals that transect this basin are connected to the Everglades
and Lake Okeechobee and provide an outlet to remove excess water from the Everglades
and the lake during wet periods.
The South Dade Conveyance System is a sub-regional network of canals and control
structures that connects several basins in southern Miami-Dade County and is used to
provide flood protection and supply water for urban and agricultural use and for delivery
to Biscayne Bay and Everglades National Park.

Canals in South Florida Summary, Conclusions and Synthesis
75
Caloosahatchee River Basin and Collier County
The original, natural Caloosahatchee River system has been significantly modified by
channelization, connection to Lake Okeechobee, and construction of navigational locks.
Three structures and 41 miles of the C-43 Canal now provide the primary water
management for the basin.
A number of water quality, water quantity and environmental issues within the river and
its watershed influence how water releases from Lake Okeechobee are managed and
downstream structures are operated.
Outside of the City of Naples and Golden Gate Estates, most of western Collier County is
developed for agricultural use. Most of eastern Collier County is undeveloped and large
areas are preserved under jurisdictions of state and federal government agencies.
The primary canals are managed by the SFWMD/Big Cypress Basin Board. The primary
water management system consists of 20 canals spanning 162 miles with 46 water control
structures.
Analysis of Biological Data from South Florida Canals
The Ecology of South Florida Canals Is Complex and Dominated by Physical Processes
Natural systems are periodically disturbed through natural processes (i.e., droughts, fires, floods,
hurricanes, etc.) and biological communities in a particular ecosystem reflect such disturbances.
By contrast, canals are disturbed almost continually by human interventions for maintenance
including herbicide application, mowing, dredging, removing obstructions, and mechanical
harvesting. As a result, plant and animal communities in canals are often dominated by stress
tolerant and pioneer species, although such information is very limited compared to natural
streams.
As artificial conveyances with large variations in flow and water turnover, canals provide a less
stable and predictable environment than other flowing waters. Canals are part of a large water
management system, and must convey large quantities of water during storm events. They do not
have the floodplains that natural streams have to reduce the energy (e.g., flow and velocity) of
high flow events, and instead have levees that keep flows in the channel. They are susceptible to
channel erosion and the delivery of larger volumes of water and contaminant loads downstream
than natural streams and wetlands. At the other extreme, during droughts and dry season
operations, canals may have little or no water movement for long periods, acting somewhat like
reservoirs or slow moving rivers. Taken together, these observations paint a picture of complex
dynamics and constant change for canals. Plants and animals in canals must cope with the
characteristics of rivers at times, those more akin to reservoirs at other times, and occasionally,
those associated with fast, deep lowland rivers during runoff events.
An initial review of key studies of animals that live in South Florida canals was conducted.
Primary emphasis was placed on studies of macroinvertebrates, primarily insects that used
standardized FDEP methods developed in the 1990s. A number of studies of other organisms,
notably fish and alligators, in and adjacent to District canals were also summarized.

Canals in South Florida Summary, Conclusions and Synthesis
76
Macroinvertebrate Communities in Canals
Information was gathered from FDEP data on 156 canal sites south of Orlando, collected as part
of a bioassessment program established in 1992. Of the 156 sites, 60 were located in the southern
portion of the peninsula bioregion within the SFWMD, and 16 were in the Everglades bioregion.
Fourteen stream reference sites are within the southern peninsula bioregion, but there are none
south of the lake. A summary of data on these South Florida sites reveals:
Canals have diverse communities of macroinvertebrates that were typical of flowing
water systems with lower topographic gradients, deeper channels, and lower velocities
compared to natural streams. For canal sites, there were no obvious differences between
the Everglades and peninsula bioregions.
There is inadequate data available to assess effects of water quality, including nutrients,
on macroinvertebrate communities in canals. Habitat quality appeared to be an important
factor that influences the quality of macroinvertebrate communities in canals.
Among the 14 stream reference sites in South Florida, there were differences in some
condition metrics but not in others. Differences between sites in the eastern and western
zones were seen and may be due to zonal differences in gradient, depth, and velocity.
Canals do not achieve the same level of biological quality as natural streams, due perhaps
to channelization effects on habitat quality, depth, and temporal dynamics in velocity.
Additional information will be needed if we are to define sensitive measurements and a
quality threshold applicable to low gradient streams and canals in the peninsula and
Everglades bioregions.
Other studies conducted in South Florida – in Miami-Dade County, Lee and Collier counties,
Reedy and Bonnet creeks near Orlando, and agricultural canals surrounding lake Okeechobee –
tend to confirm these findings:
Invertebrate communities in canals were of lower quality than natural streams, but had
similar species composition.
Surrounding land use and habitat quality were key drivers of invertebrate community
condition. Sites followed a pattern of increasing disturbance from wetlands →
agricultural → suburban →urban/industrial.
By their physical nature, canal systems are significantly different from streams. Canals
cannot be expected to span the full range of scores found in streams, even in expected
‗reference canal‘ habitat conditions.
There are insufficient data to establish ecological expectations for canal systems.
Additional sampling may eventually provide a basis to formulate a Canal Condition
Index, and consider factors such as ecoregion and unique flow conditions.
Improvements in water quality (decreases in phosphorus and nitrogen concentrations over
time) do not necessarily affect the quality of macroinvertebrate communities. Habitat
quality is more important than water quality.

Canals in South Florida Summary, Conclusions and Synthesis
77
Macroinvertebrate communities in canals were diverse and were typical of communities
found in lotic (flowing-water) environments with low velocities, high primary
production, and depositional substrata.
A collaborative study among six states along the mid-Atlantic seaboard of the United States
determined that reference sites from all states were similar despite large differences in land use
and percentages of forested lands in their respective catchments. A high degree of biological
quality can be achieved in canals despite poor water quality if natural channels and riparian
vegetation are maintained. Water quality is therefore considered less important than habitat
quality in determining the biological condition of canals.
Fish Assemblages in Canals
Canals provide unique habitat for aquatic life since they have characteristics of both
streams and lakes. Because they are man-made water bodies and often highly managed,
they tend to provide marginally suitable habitat. Some fish survive quite well and may
thrive under these conditions – including both native and exotic species.
Many exotic fishes are less tolerant of low temperature conditions than native species.
During cold periods, water temperatures in the marshes tend to be significantly lower
than in the canals. Some exotic species, such as the brown hoplo, tolerate low
temperature exposure and have expanded rapidly across many natural habitats.
Canals in natural areas provide refuge from drought for fish. Larger predatory fish are
generally the dominant species. Canals in natural areas tend to have more native and
fewer exotic fishes, principally due to lack of adequate marsh habitat.
Canals act as conduits for nutrients, creating sharp local gradients that stimulate
productivity in adjacent marshes. Fish are larger and more abundant in these enriched
areas, indicating the canals may serve as a littoral zone for fish production.
Macroinvertebrate (especially shrimp and crayfish) abundance near canals may be
reduced due to predation by fishes and poor quality food sources (an abundance of
cyanobacteria) in highly enriched zones.
Within the Big Cypress National Preserve, canals supported the greatest diversity of fish
species. Most of these were saltwater-adapted or large freshwater predator species.
Channelization of the Kissimmee River resulted in significant changes to fish
populations. After channelization, Florida gar and gizzard shad were the dominant
species captured in trawls and gill-nets. Three species, the blackbanded darter, coastal
shiner, and tidewater silverside, may have been extirpated from the system.
In areas where lands adjacent to canals have been developed for agricultural or urban
uses, larger bodied fishes were more common. Such canals may also receive less
predation pressure by wading birds. Exotic species tend to be more abundant than native
species, probably due to poor water quality and lack of shoreline habitat.
Some exotic species tolerate estuarine salinity conditions and low oxygen concentrations
and thus survive well in coastal canals and rock pits. Exotic fish historically existed only
in canals after their initial introduction, and subsequently spread into marshes and
peripheral habitats.

Canals in South Florida Summary, Conclusions and Synthesis
78
Despite the pressure from exotic species, some canals in disturbed areas support healthy
populations of native species. Characteristics of canal size and shape, shoreline and
submerged vegetation, and water quality may allow native fishes to maintain their
populations.
The presence of exotic species does not necessarily inhibit reproduction, growth, or
health of native fish populations. Native and exotic species may coexist over long periods
because most native canal fishes are primarily carnivorous, whereas the exotic fishes are
herbivorous or detritivorous and hence are not necessarily competing for the same
resources.
Similar effects of channelization on fish assemblages have been documented in other
systems in the United States and other parts of the world, and are attributed to loss of
suitable habitat for feeding, shelter, and spawning, as well as altered hydrologic patterns
of seasonal floodplain inundation.
Alligators and Crocodiles in Canals
Alligators seem to be very sensitive to hydrologic conditions, even on short time scales
(days). In areas that have become overdrained, alligators only occur in permanent water
bodies such as canals or ponds, although they may move to other areas during periods of
extremely high water.
Larger alligators prefer to live in canals, where they probably benefit from warmer canal
water and better digestion rates and are therefore larger and healthier than marsh
alligators. Alligators in urban canals have a very different ecology than those associated
with the Everglades.
Hatching success and young survivorship of alligators is lower in canals. Canals were
harsh environments for alligator reproduction and early development compared to interior
sites due to flooding and predation of canal nests.
Saltwater crocodiles generally prefer saline or brackish water and only occasionally occur
in the freshwater canals Crocodiles have been reported to move 6 miles inland using
canals.
Regional Trends in Canal Water Quality
A survey of existing SFWMD water quality data for the primary canal system indicates that there
are large variations in water quality conditions between regions of the District, between
individual canals within regions, and even between sections of the same canal. A net increase in
canal nutrient concentrations tends to occur in areas that have adjacent urban and agricultural
land uses and a net decrease in concentration occurs in canals that are surrounded by wetlands or
areas where water in the canals interacts strongly with groundwater. Little is known about the
natural chemical and biological assimilation processes that occur in canals and, in addition to
providing support for the current USEPA water quality criteria, more information on assimilation
is important to the Total Maximum Daily Load modeling process.
Water quality summary statistics for more than 200 stations in the District‘s primary canal
system were examined to identify regional, seasonal, and intra-regional differences for key water

Canals in South Florida Summary, Conclusions and Synthesis
79
quality constituents, including total phosphorus, total nitrogen, and chlorophyll a. Results were
analyzed independently for the seven basins or subregions.
Phosphorus
Analysis of total phosphorus data indicated three broad categories of stations as determined by
values of the geometric mean and median: 1) Stations that showed phosphorus concentrations
less than 50 ppb, which primarily represented the Lower East Coast, Lower West Coast, Upper
Kissimmee Basin, and the Everglades Water Conservation Areas; 2) Stations that had
phosphorus concentrations from 50 to 150 ppb are located primarily in the Caloosahatchee,
Everglades Agricultural Area, and Kissimmee River basins; and 3) Stations with the highest
concentrations, above 150 ppb, are located in the Upper East Coast Basin. These differences tend
to be associated with the degree of agricultural development within the watershed and proximity
to Lake Okeechobee.
Nitrogen
Analysis of data for total nitrogen for the seven regions indicated a somewhat different
distribution than was seen for phosphorus, and the pattern was not clearly related to geography or
land use. The lowest concentrations of total nitrogen, less than 1.2 ppm, occurred in the Lower
West and Lower East Coast watersheds. Concentrations from 1.2 to 1.6 ppb occurred in the
Caloosahatchee and Upper East Coast watersheds and the Water Conservation Areas. The
highest concentrations (above 1.6 ppm) occurred in the Everglades Agricultural Area and
Kissimmee River watersheds.
Chlorophyll a
The USEPA has suggested that nutrients (in conjunction with other environmental variables) can
impair the designated use of canals by causing an increase in the concentration of chlorophyll a.
Paradoxically, no chlorophyll criterion was proposed for streams by USEPA. Grouping of
chlorophyll a concentrations indicated that the lowest concentrations (less than 4 mg/m3)
occurred in the Lower East Coast and Lower West Coast basins and the Water Conservation
Areas. Chlorophyll a concentrations greater than 4 mg/m3 occurred in the Caloosahatchee,
Everglades Agricultural Area, Kissimmee River, and Upper East Coast basins. The values of all
regional geometric means for chlorophyll a were less than 10 mg/m3, about one-half of the 20
mg/m3 threshold of impairment for the statewide Total Maximum Daily Load process.
Conductance
There appeared to be no clear grouping of summary statistics for specific conductance by region.
The Lower Kissimmee River Basin had the lowest geometric mean and median values and the
Everglades Agricultural Area had the highest.
Local Variability
Total phosphorus concentrations were more variable and somewhat higher during the wet
season. Variation in the range of total phosphorus values between the 25th
and 75th
percentile values increased when only wet season observations were considered in all
regions.
Canals in South Florida Summary, Conclusions and Synthesis
80
Differences among canals within the Upper East Coast and Lower East Coast are
apparent for total phosphorus, but less so for total nitrogen, although differences can be
observed in the corresponding summary statistics.
Along canal reaches, there is a downward trend in the summary statistics for total
phosphorus and total nitrogen as water moved downstream in the Miami and West Palm
Beach canals.
Although not examined in this analysis, nutrient summary statistics are tied to land use,
as reflected in the change in concentrations of nutrients that occur as water moves from
south of Lake Okeechobee (agricultural or urban land uses) through Stormwater
Treatment Areas and WCAs (wetland marshes and tree islands) to the coastal ridge
(primarily urban and agricultural land uses) and ultimately to tide.
Canal Sediments
Examination of a very limited amount of sediment data, based on studies conducted in
regional canals of the Water Conservation Areas, indicated sediment depths were highly
variable, both across a given transect and longitudinally down any given canal. Canal
average sediment depth ranged from 1.8 feet to 8 feet with a volume totaling almost
2 million cubic yards.
Low sediment accumulation in some canals was suggested to be a result of higher flow
velocities due to the canals‘ small cross-sectional areas, increasing the likelihood of
sediment resuspension and transport during strong drainage events.
The total sediment volume calculated for the entire 122 miles of canal reaches was almost
9 million cubic yards, with a total phosphorus mass of 2000 tons.
More than 80 percent of the total phosphorus mass in the surface 4-inch sediment layer of
all canals in the WCAs is fairly stable and may be a long-term sink for phosphorus.
Canal sediments from the eastern side of the WCAs appear to be more susceptible to
resuspension and transport during strong drainage events and, due to their chemical
composition, they may be more susceptible to long-term release of iron-bound
phosphorus to the overlying water column.
A Context for Water Quality Management in South Florida Canals
The information compiled in this technical support document, albeit limited, provides an initial
conceptual framework for the ecology of these artificial systems and for the constraints to
applying Clear Water Act standards across the diverse South Florida landscape. No quantified
linkage between nutrients and impaired biology in South Florida canals was found during this
investigation, nor was evidence found that most canal ecosystems are even sensitive to total
nitrogen or total phosphorus. As a result of this limited information, there is no scientific basis to
conclude that instream nutrients adversely affect the designated uses of canals in South Florida.
To function as conveyance systems, canals must be maintained by removing or limiting
vegetation, creating immediate imbalances in canal flora and potentially fauna. The information
compiled in this document on the history and purposes of the complex South Florida canal
system demonstrates universally that the canal system is primarily used for flood control and

Canals in South Florida Summary, Conclusions and Synthesis
81
water supply. The designated uses derived under the Clean Water Act for maintenance of
healthy, well-balanced flora and fauna are not juxtaposed easily into this context. With the
available information reflected in this document, there is not a valid means of determining
biological ‗normalcy‘ in canals, and therefore, no rational basis upon which to demonstrate
impairment under the Clean Water Act.
Even describing water quality in canals is a challenge. They are highly modified physical
systems that behave in unnatural patterns, sometimes acting like reservoirs, other times flowing
more like streams, and other times flowing more like slow moving rivers. Compilations of data
in this report are only a starting point in describing such complexity. More refined ways of
evaluating data in canals must be developed in light of their runoff driven and seasonal
complexity. Analysis within years or across years should be done separately for flowing and not
flowing regimes. Flow-weighted means rather than annual geometric mean chlorophyll a, total
nitrogen, and total phosphorus concentrations might be more appropriate for analysis.
Furthermore, some primary canals in South Florida can cut across different geologic or
ecological regions. Pooling data over the entire water body masks regional differences and
provides statistics reflecting none of the actual environments being considered.
Natural systems are periodically disturbed through natural processes (i.e., droughts, fires, floods,
hurricanes) and biological communities in a particular ecosystem reflect such disturbances. By
contrast, canals are disturbed almost continually by human interventions for maintenance,
including herbicide application, mowing, dredging, removing obstructions, and mechanical
harvesting. As artificial conveyances with large variations in stage, flow and water turnover,
canals provide a less stable and predictable environment than other flowing waters. They do not
have the floodplains that natural streams have to reduce the energy of high flow events, and
instead have levees that keep flows in the channel. At the other extreme, during droughts and dry
season operations, canals may have little or no water movement for long periods. Taken together,
these observations paint a picture of complex dynamics and constant change for canals. Based on
the limited information summarized in this report on canal biology, the biological communities
in canals are strongly influenced by the physical aspects of canals and the availability of quality
habitat.
Scientific studies (especially in ecology) of canals are a tiny fraction of those found for other
South Florida ecosystems. The Everglades marsh numeric criterion for phosphorus was based on
literally hundreds of scientific articles spanning more than a decade. Similarly, the Total
Maximum Daily Load for Lake Okeechobee was supported by dozens of research publications
quantifying algal dynamics in relation to nutrient levels. Many more examples of technical
information available for potential use in nutrient criteria can be seen in the pages of the South
Florida Environmental Report. Selecting a protective numeric nutrient criteria is premature since
there is little information on what comprises the ecological communities which are being
protected. This technical support document has clearly shown the lack of canal ecological studies
as compared to other systems in Florida (e.g., the Everglades, Chapter 6, 2010 South Florida
Environmental Report). Even FDEP‘s own Technical Advisory Committee consistently
struggled with the lack of available information on the ecological components of canals and how
nutrients may or may not have an impact.
The application of Clear Water Act water quality standards directly to such a massive canal
system must be done with sound information applied rationally to these artificial water bodies
and interpreted in light of their nature and actual uses. Canals were built to meet human needs by
Canals in South Florida Summary, Conclusions and Synthesis
82
controlling the movement of water from one place to another for water supply, flood control,
drainage, and navigation, as well as to provide water needed to sustain natural communities in
lakes, rivers, wetlands, and estuaries. Ecological functions in canals themselves can be valuable
for recreation and aesthetics, but are secondary and largely incidental compared to their uses for
conveyance.
REFERENCES
Alleman, R.W., S.A. Bellmund, D.W. Black, S.E. Formati, C.A. Gove and L.K. Gulick. 1995. Biscayne
Bay Surface Water Improvement and Management – Technical Supporting Document. South Florida
Water Management District, West Palm Beach, FL. 189 pp.
Barr, B. 1997. Food habits of the American alligator, Alligator mississippiensis, in the southern
Everglades. Ph.D Dissertation. University of Miami. Miami, FL.
Boggess, D.H. 1972. Controlled discharge from the W.P. Franklin Dam as a means of flushing
saline water from the fresh-water reach of the Callosahatchee River, Lee County, Florida.
U.S. Geological Survey Open File Report FL-72028. 45 pp.
Bottcher, A.B., and F.T. Izuno. 1992. Everglades Agricultural Area: Water, Soil, Crop and
Environmental Management. University Presses of Florida, Gainesville, FL. 479 pp.
Brown, R.B. 2003. Soils and Septic Systems. University of Florida IFAS Extension. SL-118. 8 pp.
http://edis.ifas.ufl.edu/pdffiles/SS/SS11400.pdf.
Chopp, M.D., K.G. Rice, F. Mazzotti, and H.F. Percival. 2000. The Effects of Canals on Alligators in the
Everglades. Poster presented at the Greater Everglades Ecosystem Restoration Conference, December
2000.
Chopp, M.D., H.F. Percival, and K.G. Rice. 2002a Everglades alligator (Alligator mississippiensis)
production and natural history in interior and canal habitats at A.R.M. Loxahatchee National Wildlife
Refuge. The 16th Working Meeting of the Crocodile Specialist Group, Gainesville, FL.
Chopp, M.D., H.F. Percival, and K.G. Rice. 2002b. Everglades Alligator Production Differences between
Marsh Interior and Marsh Canal habitats at ARM Loxahatchee National Wildlife Refuge. Pp. 41-59 in:
Crocodiles. Proceedings of the 16th Working Meeting of the Crocodile Specialist Group, IUCN - The
World Conservation Union, Gland, Switzerland.
Copp, G.H. 1989. The habitat diversity and fish reproductive function of floodplain ecosystems.
Environmental Biology of Fishes. 26:1-27.
Courtenay Jr., W.R. and D.A. Hensley. 1979. Range expansion in southern Florida of the introduced
spotted tilapia with comments on its environmental impress. Environmental Conservation 6:149-151.
Dahm, C.N., K.W. Cummins, H.M. Valett, and R.L. Coleman. 1995. An ecosystem view of the
restoration of the Kissimmee River. Restoration Ecology 3:225-238.
Dalrymple, N.K. and G.H. Dalrymple, 1996. Dade County lake belt plan, wildlife study-8th quarterly
report exotic fish exotic species disturbance. Submitted to Dade County Department of Environmental
Resources Management, Miami, FL. 76 pp.
Daroub, S.H., J.D. Stuck, T.A. Lang, O.A. Diaz, and M. Chen. 2003. Implementation and verification of
BMPs for reducing P loading in the EAA. Final Project Report submitted to the Everglades

Contents
83
Agricultural Area Environmental Protection District and the Florida Department of Environmental
Protection, Tallahassee FL.
DeBusk, T. and K. Grace. 2009a. Relationships between water column nutrients and macroinvertebrate
assemblages in the Reedy Creek Drainage Basin, Central Florida. DB Environmental, Inc. and Azurea,
Inc., Rockledge FL. July 21, 2009. 49 pp.
DeBusk, T. and K. Grace. 2009b. Characteristics of Macroinvertebrate Populations in South Florida
Canals. Prepared by DB Environmental, Inc., Rockledge, FL, December 15, 2009, 39 pp.
Diaz, O.A., S.H. Daroub, J.D. Stuck, M.W. Clark, T.A. Lang, and K.R. Reddy. 2006. Sediment inventory
and phosphorus fractions for Water Conservation Area canals in the Everglades. Soil Sci. Soc. Am. J.
70:863-871.
Ellis, G., M. Zokan, W.F. Loftus, and J. Lorenz. 2004. Inventory of Freshwater Fishes of the Big Cypress
National Preserve. Final Project Report to the USGS Greater Everglades Priority Ecosystems Science
Program. USGS FISC-WRS, Everglades National Park Field Station, Homestead, FL 117 pp.
Florida Department of Environmental Protection. 2001. An Investigation of canals in southwest Florida:
relationships between biological health, water quality, and habitat. Division of Resource Assessment
and Management, Bureau of Laboratories, FDEP, Tallahassee, FL. 22 pages.
Florida Department of Environmental Protection. 2009.
http://www.dep.state.fl.us/secretary/designateduse.htm#faq. Accessed 10/29/09.
Florida Department of Environmental Protection. 2010. Current Bioassessment Projects.
http://www.dep.state.fl.us/water/bioassess/currproj.htm#Streams.
Florida Fish and Wildlife Conservation Commission. 2009. Website at
http://www.myfwc.com/NEWSROOM/Freshwater_FishBusters_index.htm. Accessed 10/29/09.
Fogarty, M.J. and J.D. Albury. 1967. Late summer foods of young alligators in Florida. Proceedings 21st
Annual Conference of Southeastern Association of Game and Fish Commissioners. 3pp.
Frederick, P.C., N. Dwyer, S. Fitzgerald and R.E. Bennetts 1990. Relative abundance and habitat
preferences of least bitterns (Ixobrychus exilis) in the Everglades. Florida Field Naturalist 18(1):1-8.
Fujisaki, I., K.G. Rice, L.G. Pearlstine, and F.J. Mazzotti, 2009. Relationship between body condition of
American alligators and water depth in the Everglades, Florida. Hydrobiologia 635:329–338.
Furse, J.B., L.J. Davis and L.A. Bull. 1996. Habitat use and movements of largemouth bass associated
with changes in dissolved oxygen and hydrology in Kissimmee River, Florida. Proceedings of the
Annual Conference, Southeastern Association of Fish and Wildlife Agencies 50:12-25.
Guillory, V. 1979. Utilization of an inundated floodplain by Mississippi River fishes. Florida Scientist.
42(4): 222-228.
Hogg, R.G. 1976. Established exotic cichlid fishes in Dade County, Florida. Florida Scientist 39(2):97–
103.
Hortle, K. G. and P. S. Lake. 1983. Fishes of the channelized and unchannelized sections of the Bunyip
River, Victoria. Aust. J. Mar. Freshw. Res. 34:441-450.
Howard, K.S., W.F. Loftus and J.C. Trexler, 1995. Seasonal Dynamics of Fishes in Artificial Culvert
Pools in the C-111 Basin, Dade County, Florida. Final Report to the United States Army Corps of
Engineers under Everglades National Park Cooperative Agreement CA5280-2-9024, Everglades
National Park, Homestead, Florida.
Jordan, F. 1996. Spatial ecology of decapods and fishes in a northern Everglades wetland mosaic.
Doctoral Dissertation. University of Florida, Gainesville, FL. 155 pp.

Contents
84
Junk, W.J., P.B. Bayley and R.E. Sparks. 1989. The floodpulse concept in river-floodplain systems.
Canadian Special Publication of Fisheries and Aquatic Sciences. 106:110-127.
Jurajda, P. 1995. Effect of channelization and regulation on fish recruitment in a floodplain river.
Regulated Rivers: Research and Management. 10:207-215.
Karr, J.R. and I.J. Schlosser. 1978. Water resources and the land-water interface. Sciences. 210:229-234.
Koebel, J.W. 1995. An historical perspective on the Kissimmee River Restoration Project. Restoration
Ecology 3:149-159.
Kushlan, J.A. 1974. Observations of the role of the American alligator in the southern Florida wetlands.
Copeia 993-996.
Kushlan, J.A. and F. Mazzotti, 1989. Historic and present distribution of the American crocodile in
Florida. Journal of Herpetology 23(1), 1–7.
Langston, J.N. and P.J. Schofield. 2009. The effect of the Mayan cichlid (Cichlasoma urophthalmus) on
growth and behavior of the spotted sunfish (Lepomis punctatus) under laboratory conditions. Final
Report, SFWMD.
Loftus, W.F. and J.A. Kushlan, 1987. Freshwater Fishes of Southern Florida. Bulletin of the Florida State
Museum Biological Sciences 31(4). University of Florida, Gainesville, FL
Maxted, J.R., M.T. Barbour, J. Gerritsen, V. Poretti, N Primrose, A. Silvia, D. Penrose and R. Renfrow.
2000. Assessment framework for mid-Atlantic coastal plain streams using benthic macroinvertebrates.
Journal of the North American Benthological Society, Vol. 19(1): 128-144.
Maxted, J. 2010. Canal Science Inventory Overview and Preliminary Analysis. FDEP Bioassessment
Program – Stream Macroinvertebrate Data. (see Appendix D of this report).
Mazzotti, F. and L. Brandt, 1994. Ecology of the American alligator in a seasonally fluctuating
environment. In: Everglades: The Ecosystem and its Restoration. S. Davis and J. Ogden (eds). St.
Lucie Press, FL.
Meshaaka, Jr., W.E. and K.J. Babbitt. 2005. Amphibians and Reptiles: Status and Conservation in
Florida. Krieger Publishing Company. Melbourne, FL. 317 pp.
Mierau, R. 1974. Supplemental Water Use in the Everglades Agricultural Area. SFWMD, West Palm
Beach, FL. Tech. Publication 74-4. 46 pp.
Mierau, R., D. Irons and W. Storch. 1974. Memorandum Report on Surface Water Availability in the
Caloosahatchee River Basin. Resource Planning Department, SFWMD, West Palm Beach FL.
Technical Publication No. DRE-38 September, 1974. 71 pp.
Morea, C.R. 1999. Home Range, Movement, and Habitat Use of the American Alligator In The
Everglades M.S. Thesis, University Of Florida, Gainesville, FL.
Morea, C.R., K.G. Rice, H.F. Percival and S.R. Howarter, 2000. Home Range and Movement of
Alligators in the Everglades. Poster presented December 2000, at the Greater Everglades Ecosystem
Restoration Conference
Nico, L.G., J.J. Herod and W.F. Loftus, 2001. Life History Parameters and Population Dynamics of
Freshwater Fishes of South Florida Canal. American Society of Ichthyologists and Herpetologists 81st
annual meeting, Pennsylvania State University, 5-10 July 2001. Abstract Only.
Perrin, L.S., M.J. Allen, L.A. Rowse, F. Montalbano, K.J. Foote and M.W. Olinde. 1982. A report on fish
and wildlife studies in the Kissimmee River Basin and recommendations for restoration. Florida Game
and Fresh Water Fish Commission, Okeechobee, FL, USA.

Contents
85
Phillips, M.L., K.G. Rice, C.R. Morea, H.F. Percival and S.R. Howarter. 2003. Habitat Selection and
Home Range of American Alligators in the Greater Everglades. Greater Everglades Ecosystem
Restoration (GEER) USGS Open File Report 03-54.
Rehage, J.S. and J.C. Trexler, 2006. Assessing the net effect of anthropogenic disturbance on aquatic
communities in wetlands community structure relative to distance from canals. Hydrobiologia (2006)
569:359–373
Ross, L.T. and D.A. Jones. 1979. Biological Aspects of Water Quality in Florida, Part IV: Lower Florida
Drainage Basin. Department of Environmental Regulation, Technical Series. 4(3). Tallahassee FL.
Rudolph, H.D. 1985. A biological basin assessment survey: a study of the macroinvertebrates collected in
north Dade County canals during February and July 1995. Florida Department of Environmental
Protection, Port St. Lucie, FL.
Rutchey, K. 1992. The response of vegetation and benthic macroinvertebrates to constructed littoral
habitat in Canal 51. DRE Technical Memorandum #306, January 1992, SFWMD, West Palm Beach.
37 pp. http://www.sfwmd.gov/portal/page/portal/pg_grp_tech_pubs/portlet_tech_pubs/dre-306.pdf.
Schofield, P.J. and D.H. Huge. 2009. Low temperature tolerance of brown hoplo (Hoplosternum littorale)
and black acara (Cichlasoma bimaculatum). Final Report, SFWMD.
Schofield, P.J., W.F. Loftus and J.A. Fontaine. 2007. Salinity effects on hypoxia tolerance of an
introduced cichlid (Cichlasoma urophthalmus) from karstic Everglades wetlands, southern Florida,
U.S.A. SFWMD, West Palm Beach, FL.
Schofield, P.J., W.F. Loftus, R.M. Kobza and M.I. Cook. 2009. Tolerance of nonindigenous cichlid fishes
(Cichlasoma urophthalmus, Hemichromis letourneuxi) to low temperature: laboratory and field
experiments in south Florida. Biological Invasions.
Shafland, P.L., B.D. Hilton and R.J. Metzger. 1985. Fishes of Black Creek Canal—Completion report for
Study XII (1981-1985). Florida Game and Fresh Water Fish Commission, Tallahassee, FL. 108 pp.
Sheaffer, W.A. and J.G. Nickum. 1986. Backwater areas as nursery habitats for fishes in pool 13 of the
Upper Mississippi River. Hydrobiologia 136: 131-140.
Snyder, B.D., M.T. Barbour and E.W. Leppo. 1998. Development of a watershed-based approach for
biomonitoring of fresh surface waters in coastal Florida canal systems. Prepared by Tetra Tech, Inc.,
Owings Mills, MD under contract with Metro-Dade Environmental Resources Management, 201 pp.
South Florida Water Management District. 2000. Caloosahatchee Water Management Plan. Support
Document. South Florida Water Management District, West Palm Beach, FL, 84 pp.
South Florida Water Management District. 2003. Minimum Flows and Levels for the Caloosahatchee
Estuary. Status Update report. South Florida Water Management District, West Palm Beach, FL.
February 2002 Draft. 67 pp.
Tarplee, W.H., Jr., D.E. Louder and A.J. Weber. 1971. Evaluation of the effects of channelization on fish
populations in North Carolina's coastal plain streams. North Carolina Wildlife Resources Commission.
Raleigh. Pp. 22.
Trefry, J.H., R.P. Trocine and H. Bennett. 2009. Sediment sourcing study of Lake Worth Lagoon and C-
51 Basin, Palm Beach County. Draft Final Report to Palm Beach County and the South Florida Water
Management District, Contract R2008-0985. October 2009. 80 pp.
Trexler, J.C., W.F. Loftus, F. Jordan, J. Lorenz, J. Chick and R.M. Kobza. 2000. Empirical assessment of
fish introductions in a subtropical wetland: an evaluation of contrasting views. Biological Invasions
2:265-277

Contents
86
Trexler, J.C., W.F. Loftus and K.C. Tarboton, 2004. Chapter 6 - Fish Habitat Suitability Index. Pp 85-91
In: Tarboton, K.C. M.M. Irizarry-Ortiz, D.P. Loucks, S.M. Davis and J.T. Obeysekera (eds.) Habitat
Suitability Indices for Evaluating Water Management Alternatives. SFWMD, West Palm Beach, FL.
170 pp.
Turner, A.M., J.C. Trexler, C.F. Jordan, S.J. Slack, P. Geddes, J.H. Chick and W.F. Loftus. 1999.
Targeting ecosystem features for conservation: Standing crops in the Florida Everglades. Conservation
Biology, 13(4 Aug. 1999):898-911.
U.S. Army Corps of Engineers and South Florida Water Management District. 2010. Development of the
Central & South Florida (C&SF) Project.
http://www.evergladesplan.org/about/restudy_csf_devel.aspx. Accessed 3/31/10.
U.S. Environmental Protection Agency. 2009. http://www.epa.gov/waterscience/standards/about/.
Accessed 10/29/09
U.S. House of Representatives. 1949. Comprehensive report on central and southern Florida for flood
control and other purposes. House Document 643. U.S. Government Printing Office, Washington, D.
C. pp 60. May.
Wegener, W. and V. Williams, 1974. Lake Tohopekaliga Drawdown Study Completion Report. July 1.
1970-June 30, 1974. Florida Game and Freshwater Fish Commission.
Welcomme, R.L. 1985. River Fisheries. FAO Fish. Tech. Pap. 262. Pp. 300.


Comments of the South Florida Water Management District
(April 28, 2010)
concerning
Proposed 40 CFR Part 131 – Water Quality
Standards for the State of Florida’s Lakes and Flowing Waters
published in the
Federal Register, Volume 75, No. 16 Tuesday, January 26, 2010
Docket No. EPA-HQ-OW-2009-0596

Page 2 of 53; South Florida Water Management District Comments on USEPA‟s Proposed Florida Water Quality Standards (04/28/2010)
TABLE OF CONTENTS
List of Figures .................................................................................................................................5
List of Tables ..................................................................................................................................6
I. South Florida Water Management District Response to USEPA
Proposed Numeric Nutrient Criteria: Lakes......................................................................7
A. Nutrient-Chlorophyll a Relationships Do Not Show Direct Cause and
Effect ...............................................................................................................................7
B. Limitations to the Use of Statewide Empirical Relationships for
Establishing Nutrient Criteria Need to be More Fully Evaluated ...................................7
C. Log-Log Transformations need to be Augmented with Further
Scientific Data .................................................................................................................9
D. The Classification Method for Colored Lakes is Overly Simplistic and
Nutrient Criteria for Highly Colored Lakes is Indefensible ..........................................10
E. Minimally Impacted (Reference) Lakes May Be Classified As Impaired
for Nitrogen ...................................................................................................................11
F. How Are Lake Criteria Influenced by Downstream Criteria? ......................................12
G. Period of Record Requirements Need to be Defined ....................................................12
H. Text Specific Comments ...............................................................................................12
I. An Alternative Approach for Establishing Lake Numeric Nutrient
Criteria ...........................................................................................................................15
J. Literature Cited..............................................................................................................24
II. South Florida Water Management District Response to USEPA
Proposed Numeric Nutrient Criteria: River and Streams ..............................................26
A. USEPA Has Not Adequately Assessed Several Critical Assumptions
Necessary to Set Defensible Water Quality Criteria Using a Reference
Approach .......................................................................................................................26
B. USEPA Has Failed to Demonstrate a Link Between Its Proposed
Nutrient Criteria and a Biological Response .................................................................26
C. USEPA Should Document Why They Did Not Adopt the FDEP‟s
Benchmark Approach ....................................................................................................27
D. The Precision Associated with the Percentiles Used to Define Nutrient
Thresholds Have Not Been Adequately Assessed ........................................................28
E. Analyses to Support Duration and Frequency Criteria are Incomplete.........................28
F. The Different Criteria for Canals and Streams Produces Inconsistencies
in Their Applications Throughout The District (Also See District
Comments On Canals)...................................................................................................29

Page 3 of 53; South Florida Water Management District Comments on USEPA‟s Proposed Florida Water Quality Standards (04/28/2010)
G. Promulgating Numeric Criteria for Streams in Advance of Setting
Criteria for Downstream Waterbodies Such As Estuaries May Cause
Confusion With the TMDL Process ..............................................................................29
H. Site Specific Alternative Criteria (SSAC) Were Designed to Address
Unique or Unusual Situations, and Should Not Be Used to Overcome
Weakly Supported Regional Criteria ............................................................................30
I. Potential Additional Research Pathways .......................................................................30
J. Literature Cited..............................................................................................................31
III. South Florida Water Management District Response to USEPA
Proposed Numeric Nutrient Criteria: Canals ..................................................................32
A. Sound Scientific and Regulatory Foundations Are Not Provided for
Protective Numeric Nutrient Criteria (NNC) in South Florida Canals by
USEPA ..........................................................................................................................32
B. The Volume of Scientific Studies (Especially in Ecology) Available for
Canals is Much Lower than Found for Other South Florida Ecosystems
(e.g., the Everglades Marsh Systems) ...........................................................................32
C. Imbalances in Flora and Fauna Cannot be Used as a Basis for
Determining Impairment in Canals Maintained for Conveyance
Purposes.........................................................................................................................33
D. Establishing Numeric Nutrient Criteria for Canals Requires the
Analysis of Different Parameters and Derivation Techniques Than
Those Used for Streams, Springs or Lakes ...................................................................33
E. Setting Regional Criteria Based on Statistical Analyses of Diverse
Environments is Invalid.................................................................................................34
F. Using Water Quality Monitoring Sites Not Included in Florida‟s Clean
Water Act Section 303(d) List as „Reference Sites‟ is Highly Biased,
Provides No Evidence Concerning Ecological Balance, and is an
Inappropriate Interpretation of the Listing Process .......................................................35
G. Proper Justification Is Not Provided for Separate NNC for South
Florida Canals, While Canals in More Northern locations Are
Classified as „Streams‟ ..................................................................................................36
H. The Use of the Everglades Protection Area TP Rule Criterion of 10 ppb
as an Instream Criterion is Unsound .............................................................................36
I. USEPA Has No Documented Peer Review of the South Florida Canal
Numeric Nutrient Criteria .............................................................................................37
IV. South Florida Water Management District Response to USEPA
Proposed Numeric Nutrient Criteria: Comments on Statistical Methods
and Assumptions .................................................................................................................38
A. Statistical Flaws in the Derivation Process: Global Issues............................................38
B. Statistical Flaws in the Derivation Process: Lakes ........................................................38

Page 4 of 53; South Florida Water Management District Comments on USEPA‟s Proposed Florida Water Quality Standards (04/28/2010)
C. Statistical Flaws in the Derivation Process: Canals ......................................................41
V. South Florida Water Management District Response to USEPA
Proposed Numeric Nutrient Criteria: Criteria Implementation Issues ........................46
A. Restoration Programs and Projects................................................................................46
B. Effects on State of Florida‟s Current Total Maximum Daily Load
Program .........................................................................................................................48
C. Effects on Water Supply Reuse Programs and Projects ................................................49
D. District Regulatory Programs ........................................................................................51
E. Additional Peer Review and Comment .........................................................................52

Page 5 of 53; South Florida Water Management District Comments on USEPA‟s Proposed Florida Water Quality Standards (04/28/2010)
List of Figures
Figure 1: Total Phosphorus (TP) – Total Nitrogen (TN) relationships for clear and
colored lakes from same log (ln) transformed data set used by USEPA in criteria
development. ....................................................................................................................................8
Figure 2: Histogram and percent cumulative distribution of TP values in moderately
colored lakes: (A) shows plot for samples with chlorophyll a ≤ 20 µg/l; (B) shows plot
for samples with chlorophyll a > 20 µg/l; and (C) plot shows cumulative percent of
samples that are correctly identified (as meeting or exceeding the chlorophyll a criterion)
for a given TP concentration, cumulative percent of all samples incorrectly identified as
exceeding the standard when they do not (false positive), and cumulative percent of
samples incorrectly identified as meeting the standard at or below a given TP when they
do not (false negative). ...................................................................................................................20
Figure 3: Histogram and percent cumulative distribution of TN values in moderately
colored lakes: (A) shows plot for samples with chlorophyll a ≤ 20 µg/l; (B) shows plot
for samples with chlorophyll a > 20 µg/l; and (C) plot shows cumulative percent of
samples that are correctly identified (as meeting or exceeding the chlorophyll a criterion)
for a given TN concentration, cumulative percent of all samples incorrectly identified as
exceeding the standard when they do not (false positive), and cumulative percent of
samples incorrectly identified as meeting the standard at or below a given TN when they
do not (false negative). ...................................................................................................................21
Figure 4: Histogram of TP in clear alkaline lakes and cumulative percent of lakes: A)
with chlorophyll a < 20 µg/l; B) with chlorophyll a > 20 µg/l; C) Percent of lakes that are
correctly identified as meeting or exceeding the chlorophyll a criterion at a given TP
value, cumulative percent of all lakes incorrectly identified as exceeding the standard
when they do not (false positive), and incorrectly identified as meeting the standard at or
below a given TP when they do not (false negative). ....................................................................22
Figure 5: Histogram of TN in alkaline clear lakes and cumulative percent of lakes: A)
with chlorophyll a < 20 µg/l; B) with chlorophyll a > 20 µg/l; C) Percent of lakes that are
correctly identified as meeting or exceeding the chlorophyll a criteria at a given TN
value, cumulative percent of all lakes incorrectly identified as exceeding the standard
when they do not (false positive), and incorrectly identified as meeting the standard at or
below a given TN when they do not (false negative). ...................................................................23

Page 6 of 53; South Florida Water Management District Comments on USEPA‟s Proposed Florida Water Quality Standards (04/28/2010)
List of Tables
Table 1: Potential criteria for TN and TP by lake type and the associated percentage of
samples correctly identified (as meeting or exceeding the chlorophyll a criterion) as well
as percentage of type I and type II errors. ......................................................................................18
Table 2: USEPA Proposed Nutrient Criteria for colored and alkaline lakes (From 40
CFR Part 131 EPA-HQ-OW-2009-0596; Water Quality Standards for the State of
Florida‟s Lakes and Flowing Waters, 2010) ..................................................................................19
Table 3: Arithmetic averages of the annual geometric means calculated by ecoregion .............43

Page 7 of 53; South Florida Water Management District Comments on USEPA‟s Proposed Florida Water Quality Standards (04/28/2010)
I. South Florida Water Management District Response to USEPA
Proposed Numeric Nutrient Criteria: Lakes
A. Nutrient-Chlorophyll a Relationships Do Not Show Direct Cause and Effect
The assumptions underlying the use of regression relationships between individual nutrients and
chlorophyll a to derive numeric criteria need to be clearly stated. The chlorophyll a -nutrient
regressions do not reflect simple cause-effect relationships. In reality, the presumed stressor
(nutrients) and response (chlorophyll a) values are intertwined such that lakes with high
phytoplankton biomass will necessarily have high concentrations of both water-column total
nitrogen (TN) and total phosphorus (TP) since these nutrients are a component of the algal
biomass. Therefore, the mere presence of such relationships does not show that both TN and TP
are responsible for increased chlorophyll a in lakes throughout the state. Concentrations of TN
and TP are themselves correlated in Florida lakes (Figure 1), making it impossible to tease out
cause-effect relationships between individual nutrients and chlorophyll a based on a simple
regression analysis. Additional analyses should be performed to identify the limiting nutrient for
reference lakes in different regions of the state and to focus regulatory efforts towards controlling
inputs of that nutrient to impaired lakes in the same region. In summary, the proposal to target
both TN and TP in all Florida lakes is not supported by the simple fact that these nutrients are
associated with chlorophyll a.
B. Limitations to the Use of Statewide Empirical Relationships for Establishing
Nutrient Criteria Need to be More Fully Evaluated
While simple empirical relationships are widely used as screening tools for examining effects of
increased nutrients on lake productivity, their power to predict nutrient thresholds for individual
lakes or sets of lakes is often quite low (Welch and Jacoby 2004). The United States
Environmental Protection Agency (EPA) (2000) provided guidance to the States and Tribes for
the development of numeric nutrient criteria for lakes. The limitation to the use of nutrient-
chlorophyll a relationships for establishing these criteria is noted in this guidance document:
“In summary, although they have some utility, empirical models (and particularly those based
on global data) do not usually have the required precision upon which high-cost decisions can
be made. As such, empirical models should be relegated to broad screening applications and for
identifying atypical lakes. However, they may have sufficient precision if developed and applied
for regional populations of lakes and reservoirs.”

Page 8 of 53; South Florida Water Management District Comments on USEPA‟s Proposed Florida Water Quality Standards (04/28/2010)
Figure 1: Total Phosphorus (TP) – Total Nitrogen (TN) relationships for clear and colored
lakes from same log (ln) transformed data set used by USEPA in criteria development.
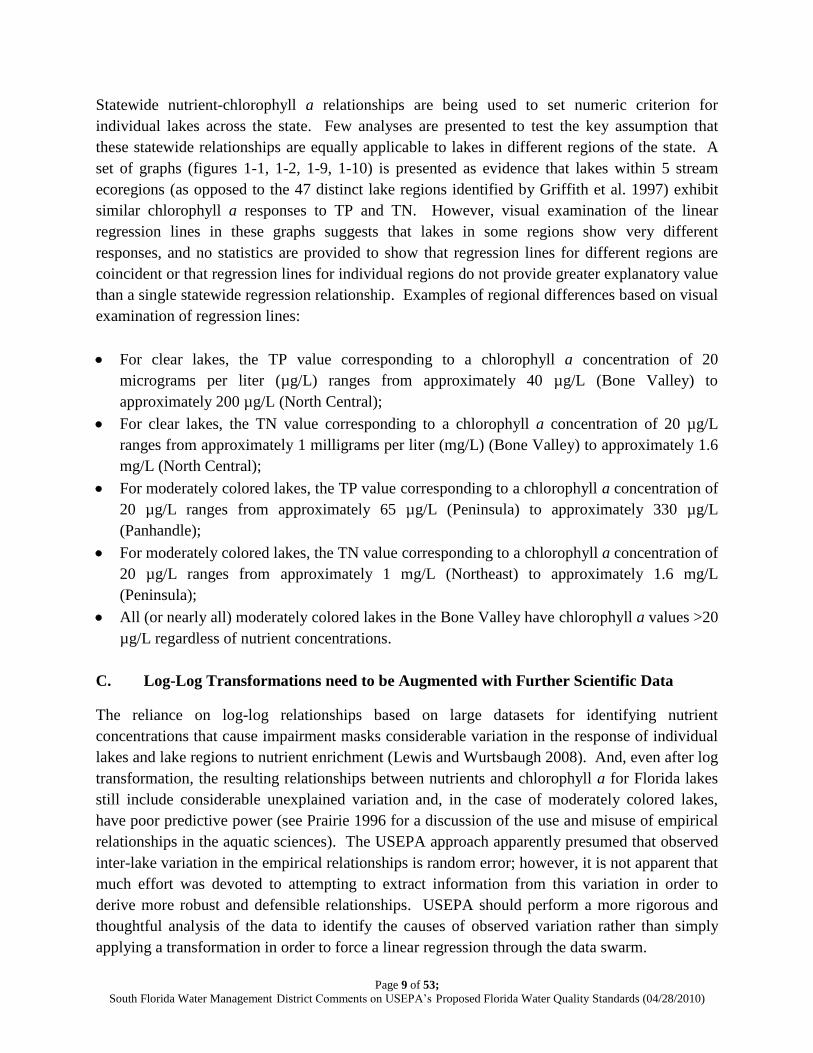
Page 9 of 53; South Florida Water Management District Comments on USEPA‟s Proposed Florida Water Quality Standards (04/28/2010)
Statewide nutrient-chlorophyll a relationships are being used to set numeric criterion for
individual lakes across the state. Few analyses are presented to test the key assumption that
these statewide relationships are equally applicable to lakes in different regions of the state. A
set of graphs (figures 1-1, 1-2, 1-9, 1-10) is presented as evidence that lakes within 5 stream
ecoregions (as opposed to the 47 distinct lake regions identified by Griffith et al. 1997) exhibit
similar chlorophyll a responses to TP and TN. However, visual examination of the linear
regression lines in these graphs suggests that lakes in some regions show very different
responses, and no statistics are provided to show that regression lines for different regions are
coincident or that regression lines for individual regions do not provide greater explanatory value
than a single statewide regression relationship. Examples of regional differences based on visual
examination of regression lines:
For clear lakes, the TP value corresponding to a chlorophyll a concentration of 20
micrograms per liter (µg/L) ranges from approximately 40 µg/L (Bone Valley) to
approximately 200 µg/L (North Central);
For clear lakes, the TN value corresponding to a chlorophyll a concentration of 20 µg/L
ranges from approximately 1 milligrams per liter (mg/L) (Bone Valley) to approximately 1.6
mg/L (North Central);
For moderately colored lakes, the TP value corresponding to a chlorophyll a concentration of
20 µg/L ranges from approximately 65 µg/L (Peninsula) to approximately 330 µg/L
(Panhandle);
For moderately colored lakes, the TN value corresponding to a chlorophyll a concentration of
20 µg/L ranges from approximately 1 mg/L (Northeast) to approximately 1.6 mg/L
(Peninsula);
All (or nearly all) moderately colored lakes in the Bone Valley have chlorophyll a values >20
µg/L regardless of nutrient concentrations.
C. Log-Log Transformations need to be Augmented with Further Scientific Data
The reliance on log-log relationships based on large datasets for identifying nutrient
concentrations that cause impairment masks considerable variation in the response of individual
lakes and lake regions to nutrient enrichment (Lewis and Wurtsbaugh 2008). And, even after log
transformation, the resulting relationships between nutrients and chlorophyll a for Florida lakes
still include considerable unexplained variation and, in the case of moderately colored lakes,
have poor predictive power (see Prairie 1996 for a discussion of the use and misuse of empirical
relationships in the aquatic sciences). The USEPA approach apparently presumed that observed
inter-lake variation in the empirical relationships is random error; however, it is not apparent that
much effort was devoted to attempting to extract information from this variation in order to
derive more robust and defensible relationships. USEPA should perform a more rigorous and
thoughtful analysis of the data to identify the causes of observed variation rather than simply
applying a transformation in order to force a linear regression through the data swarm.

Page 10 of 53; South Florida Water Management District Comments on USEPA‟s Proposed Florida Water Quality Standards (04/28/2010)
D. The Classification Method for Colored Lakes is Overly Simplistic and Nutrient
Criteria for Highly Colored Lakes is Indefensible
Classification of lakes into two color categories (<40 PCU vs. >40 PCU) facilitates analysis but
ignores the reality that the effects of color on nutrient-chlorophyll a relationships represent a
continuum. The more colored a lake‟s waters, the less closely its productivity (chlorophyll a
concentration) is tied to ambient nutrient levels. The references used to support the two-tier
classification used by USEPA are Shannon and Brezonik (1972) and Gerritsen et al. (2000).
Neither of these investigations supports a “natural” separation of lakes into just two color
categories.
Shannon and Brezonik (1972) relied on cluster analysis to separate 55 Florida lakes into
categories based on measured water chemistry parameters. While they determined that color was
an important factor distinguishing different lake types, they also concluded that lakes within their
“colored” category were highly heterogeneous. In particular, they concluded that, with respect to
nutrients and chlorophyll a, “a simple harmonious oligo- to eutrophic gradation may not occur in
highly colored lakes.” They go on to state that their colored lakes could be subdivided into
“anywhere from two to six or more [trophic] groups, none of them satisfactorily interpretable.”
Gerritsen et al. (2000) use ordination (principal components analysis) to separate 570 Florida
lakes into categories based on 8 water chemistry variables. Again, these investigators identified
color as an important lake classification factor. However, their results also show considerable
variability within their colored lakes categories and do not support the proposition that these
lakes can be considered as a single homogeneous group. The authors state that their results
“confirm” the classification of Shannon and Brezonik, which, as already noted, was inconclusive
with respect to colored lakes.
The USEPA analyses of colored lakes revealed these classification problems. It was concluded
that nutrient-chlorophyll a relationships for this category were weak and lacked predictive power
and that “color in excess of approximately 150 PCU depresses the nutrient response.” On the
basis of additional statistical analyses, it was possible to identify two subcategories for colored
lakes: (a) moderately colored lakes (40-140 PCU) that could be used to derive improved (but still
weak) nutrient-chlorophyll a relationships (fig 1-11); (b) a second subset of highly colored lakes
(>140 PCU) where chlorophyll a concentrations could not be predicted from nutrient levels (fig
1-12). Clearly, other environmental factors strongly influence primary productivity in colored
lakes and additional information is required before scientifically or statistically defensible
nutrient criteria can be developed for highly colored lakes.
The USEPA established separate nutrient criteria for colored and highly colored lakes as follows:
(a) determined that the empirical relationship between nutrients and chlorophyll a was poor
when applied to all colored lakes (>40 PCU); (b) determined that an improved relationship could
be obtained if analysis was limited to lakes with a color range of 40-140 PCU; (c) used this

Page 11 of 53; South Florida Water Management District Comments on USEPA‟s Proposed Florida Water Quality Standards (04/28/2010)
improved relationship to establish numeric nutrient criteria for this subset of colored lakes; (d)
then applied these criteria to the highly colored (>140 PCU) lakes that had been removed from
the analysis in order to generate the improved relationship. There is no scientific basis for
extrapolating the results of the analysis on one subset of lakes to a second subset of lakes that
had been intentionally removed from the analysis in order to generate a satisfactory statistical
relationship.
There are scientific explanations for why chlorophyll a concentrations are poorly correlated with
nutrient levels in highly colored lakes. For example, as discussed in USEPA‟s Nutrient Criteria
Technical Guidance Manual: Lakes and Reservoirs (USEPA 2000):
“Highly colored lakes have been termed dystrophic because they often are observed to have low
productivity in spite of moderate to high nutrient concentrations (Wetzel, 1975). Colored water
not only reduces light penetration, but the dissolved organic matter also can chelate nutrients,
making them unavailable for algal uptake. Therefore, water color is an important classification
variable (or covariate; see below) for lake nutrient criteria.”
In other words, the simple presence of high nutrients (particularly TN) in highly colored lakes is
not a good indicator of either nutrient availability or impacts. It is unclear why established
science was ignored and arbitrary criteria set for this lake type.
E. Minimally Impacted (Reference) Lakes May Be Classified As Impaired for Nitrogen
Lakes within the South Florida Water Management District (the District) fall into the colored and
highly colored categories defined by FDEP and USEPA. Minimally impacted (i.e., reference)
lakes within this region have not been routinely monitored for water quality. However, water
quality in three of these lakes (Lakes Preston, Joel, and Myrtle) was surveyed by the District in
February 2009 and the findings from this preliminary assessment were that these lakes:
Are highly colored (>250 PCU);
Have low TP concentrations (17-20 µg/L);
Have high TN concentrations (1.94-2.31 mg/L);
Appear to be strongly P limited (based on TN:TP ratios >100:1) and, therefore, unresponsive
to N levels;
Are highly unproductive (Chla values in the 1-3 µg/L range).
These findings are consistent with the broader scientific literature on highly colored lakes (noted
above) and with USEPA analyses showing that productivity (chlorophyll a) in highly colored
lakes is poorly correlated with nutrient levels. Yet, these minimally impacted lakes have TN
concentrations that approach or even exceed the upper allowable limit proposed by USEPA.
High background N levels in these lakes are likely a consequence of high inputs of dissolved
organic nitrogen (DON) from the surrounding, largely undeveloped watershed. The south

Page 12 of 53; South Florida Water Management District Comments on USEPA‟s Proposed Florida Water Quality Standards (04/28/2010)
Florida watershed contains large areas of wetland and riparian habitat, which has been found to
be a significant natural source of DON to downstream waters in other watersheds (Daley and
McDowell 2002, Pellerin et al. 2004). Much of this DON is refractory in nature and, therefore,
not capable of promoting phytoplankton productivity in either the lake where it is measured or in
downstream waters (streams, estuaries). Therefore, TN may not be a reliable predictor of either
N availability or anthropogenic N enrichment in south Florida lakes.
F. How Are Lake Criteria Influenced by Downstream Criteria?
Most Florida lakes discharge into streams or man-made canals. In these situations, USEPA has
not explained whether lake numeric nutrient criteria are to be determined based on the proposed
lake criteria or on the criteria for the downstream waterbody. For example, within the District,
all of the Lake Management Areas of the Kissimmee-Chain-of-Lakes discharge into canal
segments, which are classified as streams in that region. The lakes are the sole or primary source
of water for these canals. Does this mean that TN and TP concentrations in lake discharges
cannot exceed stream nutrient criteria (annual geometric mean concentrations) of 0.107 mg/L for
TP and 1.203 mg/L for TN? Given that background TN levels in at least some of these lakes
may be above 1.2 mg/L (see comment E above), this could require treatment to remove naturally
occurring N.
G. Period of Record Requirements Need to be Defined
Within the District boundaries (and probably elsewhere), some lakes have water quality
(nutrient, chlorophyll a) data stretching as far back as the early 1980s. This period of record
encompasses the period when secondary treatment infrastructure was installed in wastewater
treatment plants to reduce nutrient discharges from these point sources. Several District lakes
exhibited marked improvements in water quality during the 1980s and early 1990s following
these treatment upgrades (James et al. in press). Poor water-quality conditions prior to the
implementation of these effective nutrient reduction measures should therefore not be included in
current determinations of nutrient impairment. USEPA should adjust its period of record
requirements for determining compliance to account for past improvements in water quality.
H. Text Specific Comments
Comment
#
Page Comment
1 2 “Nutrient concentrations, chlorophyll concentration, specific
conductance, and alkalinity were log-transformed (natural log) for
statistical analyses.” Please clarify that the transformations were for raw
data. Why was natural log used? Were other transformations
considered? How was it determined that transformations were needed?

Page 13 of 53; South Florida Water Management District Comments on USEPA‟s Proposed Florida Water Quality Standards (04/28/2010)
Comment
#
Page Comment
2 2 “FDEP categorized lakes into clear and colored lakes on the basis of the
geometric mean color for the period of record.” This is not consistent
with the footnote statement on Table 1-4 “Platinum Cobalt Units (PCU)
assessed as true color free from turbidity. Long-term average color based
on a rolling average of up to seven years using all available lake color
data.”
3 2 How were shifts between colored and clear classification of some lakes
(including Lake Okeechobee) handled?
4 2 “Lakes showed similar chl. a responses regardless of location, with some
differences in the range of nutrient concentrations (Figures 1-1 and 1-
2).” Please show analysis of covariance to justify the statement. It
appears that some of the lake sets have different slopes or are
significantly separated to justify sub-setting based on location.
4 4 Salas and Martino (1991) do not discuss Trophic State Indices (TSIs).
The citation is inappropriate here. The District suggests the following
Kratzer & Brezonik (1981), Brezonik (1984), Dierberg et al. (1988).
5 5 Salas & Martino (1991) did not consider trophic state indices. They
considered trophic states based on total phosphorus concentrations.
6 5 Havens (2000) did not suggest averaging the TSIs, rather he suggested
looking at differences to define the general mechanism that is
maintaining the TSI at the given level. A better citation for this
procedure is Carlson & Havens (2005).
7 5 “Salas and Martino considered that same range of TSI values to be
mesotrophic in warm-water lakes.” Salas and Martino (1991) did not
consider TSI values, but rather TP concentrations.
8 12 For designated uses, USEPA should consider Bachmann et al. (1996).
9 13 “The USEPA proposes the TAC suggested nutrient thresholds in clear,
high-specific conductance lakes be based on preventing the annual
average chl. a from exceeding 20 μg/L.” Please clarify: Is this proposal
for high (> 100 uS/cm) conductivity, or are you including these in high
alkalinity lakes ( > 50 mg CaCO3/L or conductivity > 250 uS/cm). How
are lakes with conductivity between 100 and 250 uS/cm and alkalinity <
50 mg CaCO3/L considered?
10 14 There are also strong relationships among TP, TN, and color. Thus,
light is limited because of higher color, TN and TP, making chlorophyll
values lower.
11 14 “Regional differences among the moderately colored lakes (color
between 40 and 140 PCU) were evaluated, but USEPA found that those
colored lakes show similar chl. a responses regardless of location,
although there were differences in the range of nutrient concentrations
(Figures 1-9 and 1-10).” USEPA should demonstrate this statistically
using analysis of covariance (it appears that the slopes and positions of
the curve are quite different).

Page 14 of 53; South Florida Water Management District Comments on USEPA‟s Proposed Florida Water Quality Standards (04/28/2010)
Comment
#
Page Comment
12 14 “Without a strong and robust nutrient-chl. a relationship in the highly
colored (> 140 PCU) lakes, fully protective criteria for these systems
can be developed on the basis of the response relationships from the
moderately colored lakes (40–140 PCU), although the criteria will be
somewhat overprotective, given that high color will reduce algal
response and biomass.” If TP and TN are not related to chlorophyll a in
highly colored lakes, then using a surrogate to impose a standard is not
logical because based on the chlorophyll a standard only five or six of
these highly colored lake samples exceed the standard. Most meet the
standard throughout the range of TN and TP values. Setting TN and TP
values would misclassify most of these lakes as impaired when they are
not.
13 14 Given this approach and using annual average chl. a values of 20 μg/L
for colored lakes and higher-specific conductance clear lakes, and 6 μg/L
for clear, low-specific conductance Florida lakes, respectively, criteria
ranges associated with protection of designated uses can be defined on
the basis of the 50% prediction intervals depicted in Figures 1-11 and 1-
13.” The axes should be reversed. Since you are trying to define TP and
TN values based on chlorophyll a of 20, then the independent variable is
chlorophyll a and TN and TP are the dependant variables
14 14 “Results indicate that a 5-year rolling average was generally sufficient to
ensure minimization of the variance (for an example data set, see Figure
1-14). Yet a 7-year average is the basis to determine color in the rule.
15 17 “The 50% prediction interval is the range within which one-half of chl. a
observations are expected to fall for a given nutrient concentration (TN
or TP), centered on the mean expectation at the regression line. In other
words, the lower and upper bounds approximate the 25th and 75th
percentiles of expected chl. a response for the given TN or TP, as
predicted by the regression equations (Figures 1-11, 1-13).” See
comment 13 above.
16 19 “…the cool season (October to April) and the warm season (May
to September).” For the southern part of the state these are considered
dry (October to April) and wet (May to September) seasons.
17 19 TP, TN, chlorophyll, and specific conductance are all correlated with
alkalinity in the described data set (Figure 1-16).” The data are
compressed by the natural log. USEPA should provide figures showing
results if the data are un-transformed.
18 19 “The acidic and alkaline lakes appeared to lie on the same regression
relationship, although alkaline lakes had higher mean nutrient and
chlorophyll concentrations.” USEPA should use analysis of covariance
to demonstrate this.
19 22 Table 1-1. Only the TP values are from Salas and Martino (1991)

Page 15 of 53; South Florida Water Management District Comments on USEPA‟s Proposed Florida Water Quality Standards (04/28/2010)
I. An Alternative Approach for Establishing Lake Numeric Nutrient Criteria
The following alternative approach is provided by the District for developing Lakes Numeric
Nutrient Criteria. The purpose of this alternative approach is to offer another tool for USEPA in
the development of lake criteria. The previous concerns listed in Sections A through H still
apply, especially in terms of nitrogen criteria. A major benefit of this approach is its
independence of relying on any specific nutrient and chlorophyll a relationship (e.g., does not
assume a linear response). It does not assume any statistical distribution, skewness or kurtosis
for the parameters TN, TP, and chlorophyll a as presented in detail below.
Given that both total nitrogen and total phosphorus (TN and TP) are associated with each other,
with chlorophyll a, as well as other water quality parameters (such as color, dissolved organic
carbon, etc.) using regression techniques to define criteria of nutrients for Lakes is not ideal.
The method considers each individual point (chlorophyll a, TN, TP) in the data set and classifies
them as either meeting the chlorophyll a criterion (chlorophyll a ≤ 20 µg/L) or not (chlorophyll a
> 20 µg/l). This analysis is presented for TP and TN in clear and moderately colored lakes.
Frequency diagrams of nutrients (TP or TN) for each set can be compared, and nutrient criteria
can be suggested as corresponding to the majority of non-impaired samples meeting the
chlorophyll a criterion and a majority of the impaired samples having chlorophyll a above this
threshold (see Attachment A). The procedure becomes more powerful, more precise, and more
robust as more samples are added. Tradeoffs between categories of percent correctly identified,
percent false positives (categorizing samples as impaired when they are not), and percent false
negatives (categorizing samples as not impaired when they are) based on chlorophyll a criterion
can be compared and optimal nutrient criteria values (or ranges) can be chosen.
The FDEP‟s data set of averaged annual lake observations is used to illustrate an alternative
method for establishing TP and TN thresholds. Using some basic statistical concepts of error
rate (i.e. type I or false positive, and type II or false negative), the available data can be used to
set nutrient criteria. These criteria can be set by choosing nutrient values associated with the
desired outcome of type I /type II errors being low. While the ideal values (e.g. 5% false
positive, and 10% false negative) are not always attainable, reasonable accommodation may be
attained through understanding of the information.
Annual averaged data for Florida lakes were obtained from: publicfiles.dep.state.fl.us -
/DEAR/Weaver/Inland TSD Data/02) Lakes/All Lakes Ann Av N4.xls
From the 924 annual-lake averaged observations, data sets were created for moderately colored
lakes (apparent color values between 40 and 140 PCU and predefined as “col”, 308 observations)
and clear lakes (apparent color values below or equal to 40 PCU and predefined as “clr”, 509
observations).

Page 16 of 53; South Florida Water Management District Comments on USEPA‟s Proposed Florida Water Quality Standards (04/28/2010)
The analysis was done separately for each nutrient (TP and TN) and for clear lakes and
moderately colored lakes. Each lake type data set provided by USEPA contains chlorophyll a,
TP and TN natural log transform values that were averaged for each lake-year. Prior to
performing the current analysis, chlorophyll a, TP and TN data were back transformed.
Individual data records (containing chlorophyll a, TP and TN values) were classified as either
meeting the chlorophyll a criterion (chlorophyll a ≤ 20 µg/L) or not (chlorophyll a > 20 µg/l).
Histograms of TP and TN from these data sets were produced for each lake type in Microsoft
Excel. The cumulative percentage of all samples correctly identified at a given nutrient value as
exceeding or meeting the criterion (20 µg/L) was plotted for all values of TN and TP. In
addition the cumulative percentage of samples that exceeded the nutrient value but met the
chlorophyll a criterion (false positive) was also plotted, as was the cumulative percentage of
samples that did not exceed the nutrient value but did exceed the chlorophyll a criterion (false
negative).
These plots can be evaluated to determine the nutrient value that:
Correctly identifies a large percentage of samples that meet or exceed the chlorophyll a
criteria;
Maintains a low percent of false positives;
Maintains a low percent of false negatives.
For colored lakes there were 178 observations that did not exceed the criteria and 131 that did
(Figure 1). Nutrient values for the samples that did not exceed the chlorophyll a criterion ranged
from 0.004 to 0.55 mg/l for TP (Figure 1A) and 0.22 to 2.6 mg/l for TN (Figure 2A).
Conversely, nutrient values for samples that did exceed the chlorophyll a criterion ranged from
0.04 to 0.96 mg/l for TP and 1.14 to 10.6 mg/l for TN (Figures 1B, 2B). The maximum percent
of lakes correctly identified as meeting or exceeding the chlorophyll a criterion were 0.059 mg/l
(77%) of TP and 1.4 mg/l (82%) for TN (Figures 1C, 2C). No matter what nutrient criterion
value is selected, there will also be some false positives and negatives. The curves (Figures 1C,
2C) can be used to identify the tradeoffs for each criteria value. For example at the TP value of
0.059 mg/l, 19% of the lakes exceed this value but meet the chlorophyll a criterion (i.e. a false
positive). As a tradeoff, using higher values of TP for the nutrient criteria will result in fewer
lakes correctly identified, but will also result in fewer false positives. Most statisticians use a
false positive (Type I) error rate of 5% although 10% is sometimes used.
Three values from each lake type and nutrient (TP and TN) are presented that are closest to the
type I error rate of 5%. (Table 1). Using a 5% type I error rate for colored lakes gives nutrient
criteria of 0.136 mg/L for TP and 1.71 mg/l for TN, resulting in 67.7% and 80.5%, respectively,
of the lakes being correctly identified as meeting or exceeding the chlorophyll a criterion.
However this is offset with a 27.5% and 15.3% false negatives (or Type II error rate),
Page 17 of 53; South Florida Water Management District Comments on USEPA‟s Proposed Florida Water Quality Standards (04/28/2010)
respectively. In this case 27.5% and 15.3% of the samples are classified as meeting the given
nutrient criteria but actually exceed the chlorophyll a criterion.
For alkaline lakes, there were 325 observations that did not exceed the chlorophyll a criterion
and 185 that did (Figure 3). Nutrient values for samples that did not exceed the chlorophyll a
criterion ranged from 0.002 to 0.25 mg/l for TP (Figure 3A) and 0.06 to 1.89 for TN (Figure 4A).
Conversely, nutrient values that did exceed the chlorophyll a criterion ranged from 0.019 to
0.921 mg/l for TP (Figure 3B) and 0.89 to 6.6 mg/l for TN (Figure 4B). The maximum percent
of samples correctly identified as meeting or exceeding the chlorophyll a criterion occurred at
0.026 mg/l for TP (85%) and 1.15 for TN (93%) (Figures 3C, 4C). Using these values to set
nutrient criteria would result in type I errors of 12.9% and 2.7%, respectively. Using the values
that are closest to the 5% error rate (0.050 mg/l and 1.14 mg/l for TP and TN, respectively)
produce Type II error rates of 15.4% and 4.3%, respectively.
For comparison the baseline values for clear alkaline lakes proposed by USEPA (Table 2) would
result in 12.9% and 5.6% false positives for TP and TN, respectively. The baseline values for
colored lakes proposed by USEPA would result in approximately 18.9 and 16.3% false positives
for TP and TN respectively.

Page 18 of 53; South Florida Water Management District Comments on USEPA‟s Proposed Florida Water Quality Standards (04/28/2010)
Table 1: Potential criteria for TN and TP by lake type and the associated percentage of
samples correctly identified (as meeting or exceeding the chlorophyll a criterion) as well as
percentage of type I and type II errors.
Lake Type Nutrient Standard
value
Number
of False
positive
(type I
error)
Number
of False
negative
(type II
error)
Number of
correctly
identified
lakes
Percent
false
positive
Percent
false
negative
Percent
correctly
identified
Colored
TP
0.103 21 61 209 7.22% 20.96% 71.82%
0.136 14 80 197 4.81% 27.49% 67.70%
0.180 5 104 182 1.72% 35.74% 62.54%
TN
1.396 30 30 248 9.74% 9.74% 80.52%
1.711 13 47 248 4.22% 15.26% 80.52%
2.097 2 67 239 0.65% 21.75% 77.60%
Clear
Alkaline
TP
0.037 34 43 427 6.75% 8.53% 84.72%
0.050 20 78 406 3.97% 15.48% 80.56%
0.070 12 108 384 2.38% 21.43% 76.19%
TN
0.892 39 10 459 7.68% 1.97% 90.35%
1.147 14 22 472 2.76% 4.33% 92.91%
1.474 5 61 442 0.98% 12.01% 87.01%

Page 19 of 53; South Florida Water Management District Comments on USEPA‟s Proposed Florida Water Quality Standards (04/28/2010)
Table 2: USEPA Proposed Nutrient Criteria for colored and alkaline lakes (From 40 CFR
Part 131 EPA-HQ-OW-2009-0596; Water Quality Standards for the State of Florida’s
Lakes and Flowing Waters, 2010)
Long Term
Average Lake
Color and
Alkalinity
Chla
(μg/L) Baseline Criteria
Modified Criteria (within
these bounds)
TP (mg/L)
TN
(mg/L) TP (mg/L) TN (mg/L)
Colored Lakes >
40 PCU 20 0.050 1.23 0.050-0.157 1.23-2.25
Clear Lakes,
Alkaline ≤ 40 PCU
and > 50 mg/L
CaCO3 20 0.030 1.00 0.030-0.087 1.00-1.81
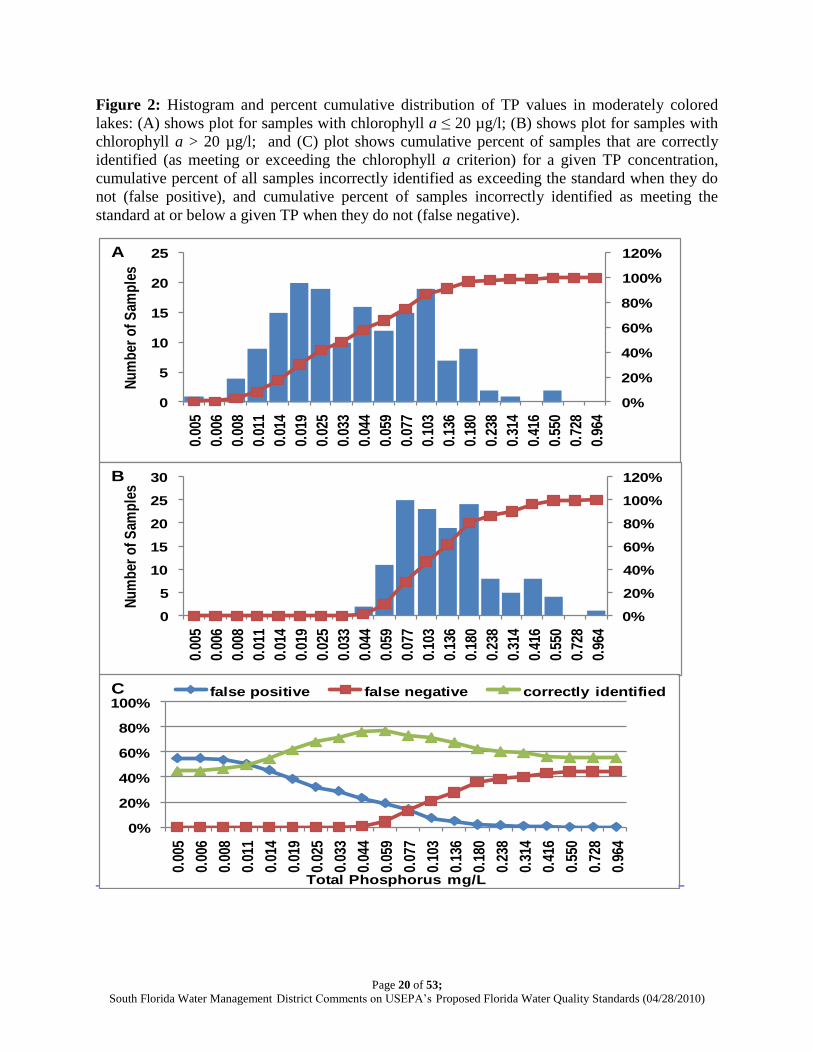
Page 20 of 53; South Florida Water Management District Comments on USEPA‟s Proposed Florida Water Quality Standards (04/28/2010)
Figure 2: Histogram and percent cumulative distribution of TP values in moderately colored
lakes: (A) shows plot for samples with chlorophyll a ≤ 20 µg/l; (B) shows plot for samples with
chlorophyll a > 20 µg/l; and (C) plot shows cumulative percent of samples that are correctly
identified (as meeting or exceeding the chlorophyll a criterion) for a given TP concentration,
cumulative percent of all samples incorrectly identified as exceeding the standard when they do
not (false positive), and cumulative percent of samples incorrectly identified as meeting the
standard at or below a given TP when they do not (false negative).
0%
20%
40%
60%
80%
100%
120%
0
5
10
15
20
25
0.00
5
0.00
6
0.00
8
0.01
1
0.01
4
0.01
9
0.02
5
0.03
3
0.04
4
0.05
9
0.07
7
0.10
3
0.13
6
0.18
0
0.23
8
0.31
4
0.41
6
0.55
0
0.72
8
0.96
4
Nu
mb
er o
f S
amp
les
A
0%
20%
40%
60%
80%
100%
120%
0
5
10
15
20
25
30
0.00
5
0.00
6
0.00
8
0.01
1
0.01
4
0.01
9
0.02
5
0.03
3
0.04
4
0.05
9
0.07
7
0.10
3
0.13
6
0.18
0
0.23
8
0.31
4
0.41
6
0.55
0
0.72
8
0.96
4
Nu
mb
er o
f S
amp
les
B
0%
20%
40%
60%
80%
100%
0.00
5
0.00
6
0.00
8
0.01
1
0.01
4
0.01
9
0.02
5
0.03
3
0.04
4
0.05
9
0.07
7
0.10
3
0.13
6
0.18
0
0.23
8
0.31
4
0.41
6
0.55
0
0.72
8
0.96
4
Total Phosphorus mg/L
false positive false negative correctly identifiedC

Page 21 of 53; South Florida Water Management District Comments on USEPA‟s Proposed Florida Water Quality Standards (04/28/2010)
Figure 3: Histogram and percent cumulative distribution of TN values in moderately colored
lakes: (A) shows plot for samples with chlorophyll a ≤ 20 µg/l; (B) shows plot for samples with
chlorophyll a > 20 µg/l; and (C) plot shows cumulative percent of samples that are correctly
identified (as meeting or exceeding the chlorophyll a criterion) for a given TN concentration,
cumulative percent of all samples incorrectly identified as exceeding the standard when they do
not (false positive), and cumulative percent of samples incorrectly identified as meeting the
standard at or below a given TN when they do not (false negative).
0%
20%
40%
60%
80%
100%
120%
0
5
10
15
20
25
30
35
0.22
4
0.27
5
0.33
7
0.41
2
0.50
5
0.61
9
0.75
9
0.93
0
1.14
0
1.39
6
1.71
1
2.09
7
2.57
0
3.14
9
3.85
9
4.72
9
5.79
5
7.10
1
8.70
1
10.6
63
Nu
mb
er o
f S
amp
les
A
0%
20%
40%
60%
80%
100%
120%
0
5
10
15
20
25
0.22
4
0.27
5
0.33
7
0.41
2
0.50
5
0.61
9
0.75
9
0.93
0
1.14
0
1.39
6
1.71
1
2.09
7
2.57
0
3.14
9
3.85
9
4.72
9
5.79
5
7.10
1
8.70
1
10.6
63
Nu
mb
er o
f S
amp
les
B
0%
20%
40%
60%
80%
100%
0.22
4
0.27
5
0.33
7
0.41
2
0.50
5
0.61
9
0.75
9
0.93
0
1.14
0
1.39
6
1.71
1
2.09
7
2.57
0
3.14
9
3.85
9
4.72
9
5.79
5
7.10
1
8.70
1
10.6
63
Total Nitrogen mg/L
false positive false negative correctly identifiedC

Page 22 of 53; South Florida Water Management District Comments on USEPA‟s Proposed Florida Water Quality Standards (04/28/2010)
Figure 4: Histogram of TP in clear alkaline lakes and cumulative percent of lakes: A) with
chlorophyll a < 20 µg/l; B) with chlorophyll a > 20 µg/l; C) Percent of lakes that are correctly
identified as meeting or exceeding the chlorophyll a criterion at a given TP value, cumulative
percent of all lakes incorrectly identified as exceeding the standard when they do not (false
positive), and incorrectly identified as meeting the standard at or below a given TP when they do
not (false negative).
0%
20%
40%
60%
80%
100%
120%
0
10
20
30
40
50
60
70
0.00
2
0.00
3
0.00
4
0.00
5
0.00
7
0.01
0
0.01
4
0.01
9
0.02
6
0.03
7
0.05
0
0.07
0
0.09
6
0.13
3
0.18
3
0.25
3
0.35
0
0.48
3
0.66
7
0.92
1
nu
mb
er o
f sa
mp
les
A
0%
20%
40%
60%
80%
100%
120%
0
5
10
15
20
25
30
35
40
0.00
2
0.00
3
0.00
4
0.00
5
0.00
7
0.01
0
0.01
4
0.01
9
0.02
6
0.03
7
0.05
0
0.07
0
0.09
6
0.13
3
0.18
3
0.25
3
0.35
0
0.48
3
0.66
7
0.92
1
nu
mb
er o
f sa
mp
les
B
0%
20%
40%
60%
80%
100%
0.00
2
0.00
3
0.00
4
0.00
5
0.00
7
0.01
0
0.01
4
0.01
9
0.02
6
0.03
7
0.05
0
0.07
0
0.09
6
0.13
3
0.18
3
0.25
3
0.35
0
0.48
3
0.66
7
0.92
1
Total Phosphorus mg/L
false negative correctly identified false positiveC

Page 23 of 53; South Florida Water Management District Comments on USEPA‟s Proposed Florida Water Quality Standards (04/28/2010)
Figure 5: Histogram of TN in alkaline clear lakes and cumulative percent of lakes: A) with
chlorophyll a < 20 µg/l; B) with chlorophyll a > 20 µg/l; C) Percent of lakes that are correctly
identified as meeting or exceeding the chlorophyll a criteria at a given TN value, cumulative
percent of all lakes incorrectly identified as exceeding the standard when they do not (false
positive), and incorrectly identified as meeting the standard at or below a given TN when they do
not (false negative).
0%
20%
40%
60%
80%
100%
120%
0
10
20
30
40
50
60
70
80
0.05
6
0.07
2
0.09
3
0.12
0
0.15
4
0.19
8
0.25
4
0.32
7
0.42
0
0.54
0
0.69
4
0.89
2
1.14
7
1.47
4
1.89
5
2.43
6
3.13
2
4.02
6
5.17
6
6.65
4
nu
mb
er o
f sa
mp
les
A
0%
20%
40%
60%
80%
100%
120%
0
5
10
15
20
25
30
35
40
45
0.05
6
0.07
2
0.09
3
0.12
0
0.15
4
0.19
8
0.25
4
0.32
7
0.42
0
0.54
0
0.69
4
0.89
2
1.14
7
1.47
4
1.89
5
2.43
6
3.13
2
4.02
6
5.17
6
6.65
4
nu
mb
er o
f sa
mp
les
B
0%
20%
40%
60%
80%
100%
0.05
6
0.07
2
0.09
3
0.12
0
0.15
4
0.19
8
0.25
4
0.32
7
0.42
0
0.54
0
0.69
4
0.89
2
1.14
7
1.47
4
1.89
5
2.43
6
3.13
2
4.02
6
5.17
6
6.65
4
Total Nitrogen mg/L
false negative correctly identified false positiveC

Page 24 of 53; South Florida Water Management District Comments on USEPA‟s Proposed Florida Water Quality Standards (04/28/2010)
J. Literature Cited
Bachmann, R.W., B.L. Jones, D.D. Fox, M. Hoyer, L.A. Bull, and D.E. Canfield, Jr. 1996.
Relations between trophic state indicators and fish in Florida (U.S.A.) lakes. Canadian
Journal of Fisheries and Aquatic Sciences 53: 842-855.
Brezonik, P.L. 1984. Trophic state indices: rationale for multivariate approaches. - In USEPA,
(ed.): Lake and Reservoir Management. - USEPA, Washington pp. 441-445.
Carlson, R.E., and K.E. Havens. 2005. Simple graphical methods for the interpretation of
relationships between trophic state variables. Lake and Reservoir Management. 21:107-118.
Daley, M.L., and W.H. McDowell. 2002. Relationships between Nitrate and Dissolved Organic
Nitrogen and Watershed Characteristics in a Rural Temperate Basin. American Geophysical
Union Spring Meeting, Abstract #B52B-07.
Dierberg, F. E., V.P. Williams, and W.H. Schneider. 1988. Evaluating water quality effects of
lake management in Florida. Lake and Reservoir Management. 4:101-111.
Gerritsen J, Jessup B, Leppo E, et al. 1999. Development and testing of a biological index for
Florida lakes. Prepared for Florida Department of Environmental Protection, Tallahassee, FL.
Griffith, G., D. Canfield, C. Horsburgh, J. Omernik, and S. Azevedo. 1997. Lake regions of
Florida (map). U.S. EPA and Florida Department of Environmental Protection, Tallahassee,
Florida.
Havens, K. E. 2000. Using trophic state index (TSI) values to draw inferences regarding
phytoplankton limiting factors and seston composition from routine water quality monitoring
data. Korean Journal of Limnology 33:187-196.
James, R.T., K.E. Havens, P.V. McCormick, B. Jones, and C. Ford. Accepted. Water quality
trends of the Upper Kissimmee Chain of Lakes, Lake Istokpoga and Lake Okeechobee.
Critical Reviews in Environmental Science and Technology.
Kratzer, C. R., and P.L. Brezonik. 1981. A Carlson-type Trophic State Index for nitrogen in
Florida Lakes. Water Resources Bulletin 17:713-715.
Lewis, W.M., and W.A. Wurtsbaugh. 2008. Control of lacustrine phytoplankton by nutrients:
erosion of the phosphorus paradigm. International Review of Hydrobiologia 93:446-465.
Pellerin, B.A., and others. 2004. Role of wetlands and developed land use on dissolved organic
nitrogen concentrations and DON/TDN in northeastern U.S. rivers and streams. Limnology
and Oceanography 49:910-918.
Prairie, Y.T. 1996. Evaluating the predictive power of regression models. Canadian Journal of
Fisheries and Aquatic Science 53:490-492.
Page 25 of 53; South Florida Water Management District Comments on USEPA‟s Proposed Florida Water Quality Standards (04/28/2010)
Salas, H.J., and P. Martino. 1991. A simplified phosphorus trophic state model for warm-water
tropical lakes. Water Research. 25:341-350.
Shannon, E.E., and P.L. Brezonik. 1972. Limnological characteristics of north and central
Florida lakes. Limnology and Oceanography 17:97-110.
USEPA. 2000. Nutrient Criteria Technical Guidance Manual: Lakes and Reservoirs. EPA-822-
B00-001. USEPA Office of Water, Washington D.C.
Welch, E.B., and J.M. Jacoby. 2004. Pollutant Effects in Freshwater: Applied Limnology, 3rd
ed. Cambridge University Press, New York.

Page 26 of 53; South Florida Water Management District Comments on USEPA‟s Proposed Florida Water Quality Standards (04/28/2010)
II. South Florida Water Management District Response to USEPA
Proposed Numeric Nutrient Criteria: River and Streams
Numerous papers have been published on using landscape classification (e.g., ecoregions,
bioregions) to define reference conditions for environmental management. A recent review of
published papers over the last 25 years (Hawkins et al. 2010) made the following conclusions
with regard to the use of reference sites to set numeric water quality criteria that are applicable to
USEPA‟s proposed numeric criteria for nutrients.1
A. USEPA Has Not Adequately Assessed Several Critical Assumptions Necessary to Set
Defensible Water Quality Criteria Using a Reference Approach
The proposed Nutrient Watershed Regions produced coarse estimates of reference conditions
leading to numeric criteria that may not be ecological meaningful. The lack of predictive
modeling that links nutrients to a biological response is a major shortcoming (see comment B
below). USEPA has not provided evidence to demonstrate that it adequately assessed the natural
variability in the data to minimize predictive bias. No analysis has been provided supporting the
assertion that the reference data, and the 75th percentile, are an accurate statistic for defining the
distribution and natural variability in the data at reference and other sites. The application of this
statistic to all sites in the region cannot be assessed with any degree of confidence without this
assessment of data variability. Variations in time and space at any particular site may be greater
than the variation within the region. Hydrologic variability, day-to-day, season-to-season, and
year-to-year, make the interpretations of criteria exceedances difficult to assess without a large
number of measurements taken over a long period of time (see comment E below).
B. USEPA Has Failed to Demonstrate a Link Between Its Proposed Nutrient Criteria
and a Biological Response
Dodds and Welch (2000) outlined the many difficulties in setting nutrient criteria in streams,
including the multiple management reasons for setting the criteria, the uncertainties associated
with biological responses, and the high variability associated with nutrient data collected in
streams. Although this white paper is 10 years old, these conclusions are relevant to the criteria
proposed by USEPA today.
It is necessary that the proposed thresholds (i.e., criteria) have a quantified link to a biological
response. Without such a link, there is no basis that reducing nutrients will have a measureable
effect on the biota, and could lead to costly and unnecessary controls. Existing water quality
criteria (e.g., temperature, dissolved oxygen, pH, metals) use laboratory bioassays to link
stressors to biology. Studies of natural systems use modeling to relate stressors to biology as has
1 FDEPs comments can be found at: http://www.dep.state.fl.us/water/wqssp/nutrients/docs/
federal/fdep_comments_streams_criteria.pdf . Cross-references to FDEP draft comments dated
March 12, 2010, are provided where applicable.)
Page 27 of 53; South Florida Water Management District Comments on USEPA‟s Proposed Florida Water Quality Standards (04/28/2010)
been done for nutrients and chlorophyll biomass in New Zealand rivers. (Snelder et al., 2004).
Such evidence has not been provided for Florida streams. This conclusion was made by FDEP
(see FDEP comments D, F, and J) and acknowledged by USEPA in the proposed rule.
The natural environment is an uncontrolled experiment with biological conditions affected
regionally by geology, climate, and land use. FDEP should be commended for assessing many of
these regional patterns by developing specific bioregions for the Stream Condition Index (SCI),
Nutrient Watershed Regions (NWR), and the Landscape Development Intensity (LDI) index.
However, these tools do not fully explain the high spatial and temporal variability of nutrients in
Florida streams. Highly variable flow conditions in streams, compared to lakes, and seasonal
changes in macrophyte and periphyton growth make correlations between nutrients and biology
(e.g., SCI and component metrics) statistically weak. They may need to be assessed on a site-by-
site basis rather than a broad regional basis (see FDEP comment E and Appendices A-C). Both
USEPA and FDEP have recognized this limitation and have additionally identified the
importance of shade in regulating stream primary production.
C. USEPA Should Document Why They Did Not Adopt the FDEP’s Benchmark
Approach
The District supports the comments provided by FDEP (see FDEP comment C1-C4) and sees no
defensible reasons why USEPA did not adopt the FDEP benchmark approach. USEPA failed to
provide the significant lines of evidence needed to support its approach. If the reference
approach, with its inherent shortcomings, is the tool used to develop numeric nutrient criteria, it
is appropriate to utilize the technical methodologies from the state agency that developed the tool
for the state in question.
Furthermore, the state agency in this instance has invested significant time and resources in the
development of their benchmark approach to ensure validity of its approach. Specifically, the
FDEP has spent over a decade and over three million dollars refining their SCI based benchmark
approach (FDEP Numeric Nutrient Criteria Development Plan, March 2009).2 They also went to
extra quality control measures in the selection of their benchmark sites, a process not followed
by USEPA in its approach.
Where the data sets have been rigorously developed, the selection of the 90th percentile for the
criterion development should be used in favor of the 75th percentile due to the documented rigor
associated with FDEP‟s methodology. More importantly, FDEP has evidenced the importance
of a biological validation as part of a rule developed with the reference approach. The District
strongly supports the use of the biological confirmation as a mechanism to handle the uncertainty
associated with criteria developed without known dose-response relationships.
2 FDEP‟s NNC Development Plan is available at http://www.dep.state.fl.us/water/wqssp/
nutrients/docs/fl-nutrient-plan-v030309.pdf.

Page 28 of 53; South Florida Water Management District Comments on USEPA‟s Proposed Florida Water Quality Standards (04/28/2010)
D. The Precision Associated with the Percentiles Used to Define Nutrient Thresholds
Have Not Been Adequately Assessed
The reference condition approach ignores the lack of evidence on nutrient stressors in streams,
leading to the high potential for over-protection or possibly under-protection. There is no
technical basis supporting the assertion that levels of nutrients at a few reference sites accurately
define what is achievable at other sites to meet some prescribed level of biological condition or
use. Selecting a threshold based on a probability value (e.g., 75th percentile) assumes that all the
sites in the population of that region function similarly, and ignores the spatial and temporal
(seasonal) variability inherent in the data. The precision of the proposed criteria is determined
by an analysis of the variability in the data at both reference sites and sites where the proposed
criteria will be applied to determine use attainment. Such analyses have not been completed.
The District substantially agrees with comments made by FDEP in its Streams Document (See
FDEP comment D) and supports FDEP‟s 90th percentile approach with accompanying biological
validation given the uncertainties inherent in a reference basal approach.
E. Analyses to Support Duration and Frequency Criteria are Incomplete
Water quality criteria include magnitude (concentration that exerts an adverse effect), duration
(exposure period, or averaging period) and frequency (how long it takes the system to recover)
criteria. Frequency criteria are generally less definitive than threshold and duration criteria
because the magnitude and duration of an adverse event are measured directly by dose-response
studies while the frequency requires judgment to determine how often an adverse event can be
allowed to occur without causing unacceptable harm. The lack of dose-response information for
Florida streams makes selection of both the magnitude and duration criteria subjective and
arbitrary.
USEPA provided no analysis as part of its proposed rule that defines the proposed annual
geometric mean as the averaging period that best defines ecological effects, and specifically
requested comments on this component. It is not possible to assess this and any other alternative
without a good understanding of the dose-response relationships. The lack of technical support
for the duration criterion further illustrates the difficulties setting numeric criteria without an
understanding of dose-response. Without this understanding, numeric criteria define only where
there are values that exceed 75% of those measurements at reference sites.
The District substantially agrees with FDEP comments D2, G, and I and requests that USEPA
provide support and analysis as to why the proposed F and D were chosen. Additionally, based
on existing evidence, USEPA should undertake additional peer review and research to properly
produce and confirm a defensible D and F.

Page 29 of 53; South Florida Water Management District Comments on USEPA‟s Proposed Florida Water Quality Standards (04/28/2010)
F. The Different Criteria for Canals and Streams Produces Inconsistencies in Their
Applications Throughout The District (Also See District Comments On Canals)
Fla. Admin. Code R. 62-302.400 articulates the designated uses for Florida‟s waters. Class III
waters are designated for recreation and the propagation and maintenance of a healthy, well
balanced population of fish and wildlife (i.e. “fishable and swimmable”). While both streams
and canals are designated as Class III waters, as noted in the attached Canal Science Inventory,
the physical and biological nature of canals is significantly different than that of a natural stream.
In other words, what is protective of recreation and a healthy, well balanced population of fish
and wildlife in a natural stream is entirely different than that in a canal. Both waterbodies can be
classified as Class III waterbodies, but USEPA must still examine how the use specifically
applies to the physical and biological attributes of a given waterbody instead of subjectively
promulgating criteria that does not reflect the nature of the designated use on an eco-region basis.
It is therefore arbitrary and capricious to treat canals outside of the South Florida Region as
streams under the proposed rule since they are operated and managed the same as canals in the
South Florida Region.
USEPA has provided no support for approaching canals north of the South Florida Region in this
manner. Additionally, USEPA has not proposed any solutions regarding how to address systems
that are heavily managed in certain sections but qualify as natural streams in others.
G. Promulgating Numeric Criteria for Streams in Advance of Setting Criteria for
Downstream Waterbodies Such As Estuaries May Cause Confusion With the
TMDL Process
Nutrients effects occur over long time frames and are most severe in downstream waterbodies
(e.g., lakes and estuaries) that accumulate nutrients over time in sediments and in the water
column. Establishing numeric criteria for streams in advance of estuaries may require revising
the criteria for streams after the criteria for estuaries have been adopted. It seems most effective
to adopt numeric criteria for downstream waterbodies first because (1) nutrient effects are
cumulative over time, and (2) focuses management attention on the most severe nutrient
problems in Florida, (3) the knowledge base for nutrient problems is the most well understood
for downstream waterbodies (e.g., lakes and estuaries) compared to flowing water systems such
as streams and canals.
In addition, criteria designed to protect downstream waters may cause confusion between water
quality standards and the TMDL process. Water quality standards for a particular waterbody are
designed to protect the designated uses of that waterbody. Setting criteria to protect downstream
uses will likely be based on tools and modeling currently used to set TMDLs, and may blur the
distinctions between these regulatory tools. This creates difficulties for both unimpaired and
impaired streams (and canals). Unimpaired streams discharging to a heavily impaired lake or
estuary could have higher criteria, and allow higher nutrient loadings, compared to streams

Page 30 of 53; South Florida Water Management District Comments on USEPA‟s Proposed Florida Water Quality Standards (04/28/2010)
discharging to higher quality downstream waterbody. Conversely, heavily impaired streams
discharging to high quality lake or estuary could have lower criteria, and require lower nutrient
loadings, compared to other streams discharging to a lower quality downstream waterbody.
There is substantial agreement between FDEP and the District (see FDEP comment E), and
FDEP Appendices A-C provide a process for setting numeric criteria on a watershed basis.
H. Site Specific Alternative Criteria (SSAC) Were Designed to Address Unique or
Unusual Situations, and Should Not Be Used to Overcome Weakly Supported
Regional Criteria
EPA proposes the option of developing SSACs as a way to address the technical uncertainties of
the proposed regional criteria are somewhat addressed by the. However, the implication of such
an approach is difficult to assess without a detailed estimate of the number of SSACs that would
likely be required. If the number is very large, which is likely given the lack of dose-response
relationship and the proportion of reference sites that do not meet the criteria (see FDEP
comment J, Tables 2 and 3), then it may be more efficient to adopt site-specific criteria from the
start. For instance, the District supports the adoption of TMDLs previously set and approved by
USEPA and FDEP as protective of a given water body as automatic SSACs requiring no further
submissions under the rule. SSACs should not be used to support regional or statewide numbers
without a detailed estimate of the expected numbers of SSACs.
SSACs are costly and time consuming, and can be contentious in the context of stringent criteria.
They are intended to apply to unique and unusual cases, and should not be used to supplement
weakly supported regional or statewide criteria.
I. Potential Additional Research Pathways
Additional research for streams (and canals) might include two basic types; (1) studies of natural
systems and (2) controlled experimental designs that include bioassay and mesocosm studies.
Empirical studies of natural systems include assessments of water quality and biological
communities at reference sites compared to sites with similar physiographic characteristics and
high nutrient concentrations.
Hydrology and water quality are more variable in streams than lakes and wetlands, making it
more difficult to define relationships between nutrients and biology in the natural environment.
Controlled testing will likely be required. Such studies would identify the “potential” for
streams to exhibit nutrient related problems, and identify those factors (geology, habitat, land
use) that define the degree of impact in specific streams or watersheds. The types of research
conducted on phosphorus limitations for the Everglades over the last two decades can provide a
template for such research in streams. It will be important to define the expectation for such
research: it will take several years of targeted research of both types to establish numeric criteria
for streams.

Page 31 of 53; South Florida Water Management District Comments on USEPA‟s Proposed Florida Water Quality Standards (04/28/2010)
J. Literature Cited
Dodds, WK and Welch EB. 2000. Establishing nutrient criteria for streams. Bridges, Journal of
the North American Benthological Society 19(1):186-196.
Hawkins, CP; Olson, JR; Hill, RA. 2010. The reference condition: predicting benchmarks for
ecological and water-quality assessments. Journal of the North American Benthological
Society 29(1):312-343.
Snelder, TH; Biggs, BFJ; Weatherhead, MA. 2004. Nutrient concentration criteria and
characterization of patterns in trophic state for rivers in heterogeneous landscapes. Journal
of the American Water Resources Association February 2004.
Page 32 of 53; South Florida Water Management District Comments on USEPA‟s Proposed Florida Water Quality Standards (04/28/2010)
III. South Florida Water Management District Response to USEPA
Proposed Numeric Nutrient Criteria: Canals
A. Sound Scientific and Regulatory Foundations Are Not Provided for Protective
Numeric Nutrient Criteria (NNC) in South Florida Canals by USEPA
In the USEPA proposed rule, there is no quantified linkage between nutrients and impaired
biology in south Florida canals, and no evidence is provided that canal ecosystems are even
sensitive to total nitrogen (TN) or total phosphorus (TP). As a result of these scientific
weaknesses, the District cannot support any conclusion that these nutrients will adversely affect
the designated uses of canals in south Florida. The USEPA does not provide a valid regulatory
connection between the NNC values and achievement of the designated use of the waterbody,
the heart of the Clean Water Act. Without a proper foundation, it is entirely possible that the
State of Florida could spend millions of dollars and many years of effort on nutrient controls that
would have little or no measureable benefit to the designated uses of canals. Simply stated,
USEPA can provide no evidence to demonstrate what recreation or a healthy population of fish
and wildlife are for canals and thereby cannot develop criteria to support them, particularly given
the uncertainties inherent in their highly managed states and design.
Similarly, no data are provided that link chlorophyll a (Chla) concentrations to designated uses
in south Florida canals, and even if USEPA could furnish some such evidence, they would need
to separate Chla generated from within the canal from that imported during periods of discharges
from upstream systems, particularly lakes. Additionally, USEPA notes that TP and Chla are
correlated, but then fails to account for their mutual chemistry. Much of the TP measured in
water samples with significant concentrations of algae is derived from the chlorophyll-containing
algae, so naturally the two parameters will be correlated. However, due to the complexity of
canal flow patterns, the regression of TP and Chla is weak and cannot be used for any regulatory
purposes unless it is corrected for this lack of independence, seasonal flow patterns and for the
proportion imported into the canal.
B. The Volume of Scientific Studies (Especially in Ecology) Available for Canals is
Much Lower Than Those Found for Other South Florida Ecosystems (e.g., the
Everglades Marsh Systems)
Determining the appropriate protective numeric nutrient criteria is premature if it is not clear
what comprises the ecological community which is being protected. The District‟s recent „Canal
Science Inventory‟ (see District Attachment 1) has clearly shown the lack of canal ecological
studies as compared to other systems in Florida (e.g., the Everglades, see „2010 South Florida
Environmental Report; see District Attachment 2). FDEP‟s own Technical Advisory Committee
(TAC) consistently struggled with the lack of available information on the ecological
components of canals and how nutrients may or may not have an impact. In fact many of the
Page 33 of 53; South Florida Water Management District Comments on USEPA‟s Proposed Florida Water Quality Standards (04/28/2010)
TAC‟s conversations often would focus on what is the appropriate designated use of these
conveyance systems and what a canal biological community should look like.
C. Imbalances in Flora and Fauna Cannot be Used as a Basis for Determining
Impairment in Canals Maintained for Conveyance Purposes
In order to function as conveyance systems, canals must be maintained by removing or limiting
vegetation, creating immediate imbalances in canal flora and potentially fauna. The
congressional authority for the Central and Southern Florida Project, which upgraded and
expanded South Florida canals, specifies their primary uses as flood control and water supply,
including environmental supply for the Water Conservation Areas and other natural systems. The
designated uses derived under the Clean Water Act for maintenance of healthy, well balanced
flora and fauna were not considered in this legislated intent. To keep their conveyance capacity
and protect public safely, canals and their banks must be maintained open and free of obstructive
vegetation, natural habitat, through mechanical harvesting or the use of herbicides. The FDEP
TAC has discussed the extreme challenge of determining biological „normalcy‟ under such
circumstances and therefore, has noted on several occasions that it is extremely problematic to
determine a rational basis upon which to develop numeric nutrient criteria in these systems.
D. Establishing Numeric Nutrient Criteria for Canals Requires the Analysis of
Different Parameters and Derivation Techniques Than Those Used for Streams,
Springs or Lakes
USEPA recognizes that canals are modified systems that behave in unnatural patterns,
sometimes acting like reservoirs, other times flowing more like streams, and other times flowing
more like slow moving rivers. Simple compilations of data cannot describe such complexity. As
a result of these complex interactions, canals cannot be subject to the same parameters and
derivation approaches applied to streams or lakes. Consider:
Using annual geometric means is not representative for canals.
Canals behave like streams when the water is flowing for flood control or water supply, and then
behave like lakes/reservoirs when water is not flowing, sometimes for months at a time. A single
annual geometric mean (for Chla, TP and TN) used by USEPA to establish nutrient criteria may
not be representative of the actual conditions for a conveyance waterbody in light of their rainfall
driven and seasonal complexity. Analysis of a certain year and across years should be done
separately for flowing and not flowing regimes. Flow weighted means rather than annual
geometric mean Chla/TN/TP concentrations might be more appropriate for analysis.
Averaging over an entire waterbody is not representative for the canals crossing
multiple ecoregions or other landscape types.
Page 34 of 53; South Florida Water Management District Comments on USEPA‟s Proposed Florida Water Quality Standards (04/28/2010)
Some primary canals in South Florida can cut across different geologic or ecological regions.
Applying an annual geometric mean over the entire waterbody (canal WBID) might mask
regional differences and provides statistics reflecting none of the actual environments being
considered. The District‟s statistical comment section (see Section IV) provides a quantitative
example of this problem.
There is no means provided by USEPA to deal with any sporadic stratification in
canals.
There is little doubt that deeper primary canals have the potential to stratify thermally during
periods with no flow. However, all samples are taken at 0.5 m near the surface. During
stratification, surface values can be reduced temporarily and during subsequent mixing with
flow, surface values will be elevated. This process could add greatly to data variance and could
contribute to future exceedances in some canals whether the reference canals representative of
stratification patterns of canals as a whole! USEPA does not indicate one way or the other.
E. Setting Regional Criteria Based on Statistical Analyses of Diverse Environments is
Invalid
Nutrient levels are highly variable (site specific), and USEPA provides no basis for the
establishment of reference sites upon which to examine designated uses and potential
impairment. The reference condition approach used for canals and the regional/ecoregional
scheme for streams also ignores the lack of evidence that nutrients are key stressors in canals or
streams (see above), leading to the high potential for unnecessary protection with little or no net
benefit to the environment. As stressed by USEPA reviewers, both their Scientific Advisory
Board and reviewers of the proposed rule (Attachments 3 and 4), there must be more information
on stressor-response and impairment before any criterion can be justified for canals. An
alternative approach would establish numeric nutrient criteria on a more rational watershed basis
using available site specific information, such as setting criteria for a downstream body and then
determining the proper way to operate the system and build projects to achieve this objective
(i.e., the TMDL process). USEPA must identify specific canals that are nutrient sensitive,
identify those impaired and the associated water quality levels, and then put into place numeric
nutrient criteria to protect uses of these systems. The 303d list used by USEPA does not do this,
even partially. No evidence was provided supporting the unimpaired status of selected canals as
a basis for finding a threshold concentration of TN, TP or Chla applicable to all canals.

Page 35 of 53; South Florida Water Management District Comments on USEPA‟s Proposed Florida Water Quality Standards (04/28/2010)
F. Using Water Quality Monitoring Sites Not Included in Florida’s Clean Water Act
Section 303(d) List (“303(d) List) as ‘Reference Sites’ is Highly Biased, Provides No
Evidence Concerning Ecological Balance, and is an Inappropriate Interpretation of
the Listing Process
The 303(d) list was developed to identify areas appearing not to meet water quality standards and
therefore requiring prioritization for TMDL development. Using the list to select unimpaired
canals is scientifically unsound and may be contrary to Section 403.067, Fla. Stat., which states
that the 303(d) list is not to be used for any regulatory purpose, at least under Florida law.
Any canal reference site should reflect direct evidence of conditions fully meeting the designated
use and should be selected based on known thresholds that define imbalances in flora and fauna
(e.g., land use, riparian habitat, pollution sources, etc.) and encompass physiographic differences
(e.g., ecoregions). As noted above (#2), USEPA would have to demonstrate for the south Florida
water management system canals, how imbalance would be defined for devices maintained for
water conveyance purposes.
Due to the fact that canals are conveyance devices and flow dynamics can vary greatly based on
location, USEPA must also match any potential reference sites with representative flow regimes.
It would not be defensible to use canals draining small undeveloped areas as reference sites for
those draining large, developed areas. The selection process for reference sites should not be
based upon the target parameters (TN & TP) to avoid obvious circularity and lack of
independence.
By USEPA‟s logic, a site is a reference site for contaminant A because the levels of contaminant
A are low without any consideration of biological functions. In addition, sites used must be
independent of each other to avoid spurious correlation and unintended data bias (multiple sites
in one canal are NOT independent). Bias is self-evident in the fact that the draft criteria for TP
(42 ppb) and Chla (4 ppb) in South Florida canals are substantially lower than those for natural
streams (TP, 107 ppb) and lakes (Chla, 20 ppb), respectively; an absurd result. There is no
justification for this inconsistency and none is apparent from general principles of ecological
science.
Additionally, USEPA supplied no justification for using the 75th percentile of the reference site
data. If USEPA‟s selection process is sound, then the 90th or even 95th percentile could be used
to provide a reasonable margin of safety. Using the 75th percentile, forces up to 25% of canals in
the reference set to become impaired when split off at the 75th percentile and to require
unnecessary regulation. In addition, the use of an alternative percentile analyses (e.g. 25th) using
an “all canals” approach is not justified for developing criteria for canals. The problems with
this methodology have been well documented by FDEP and its TAC.

Page 36 of 53; South Florida Water Management District Comments on USEPA‟s Proposed Florida Water Quality Standards (04/28/2010)
G. Proper Justification Is Not Provided for Separate NNC for South Florida Canals,
While Canals in More Northern locations Are Classified as ‘Streams’
There is no technical basis for setting different NNC for canals in the Everglades Nutrient
Watershed (South Florida canals) and canals in the Peninsula Nutrient Watershed that use the
NNC for “streams” (i.e., canals in all nutrient watersheds should be classified as canals). In fact,
USEPA excluded data from Peninsula canals in the development of the NNC for the nutrient
watershed (Chapter 2: Methodology for Deriving USEPA‟s Proposed Criteria for Streams, page
2-34). This would appear to mean USEPA appreciates the many different characteristics that
exist between canals and natural streams.
For example, there are 11 significant canals in the Lower Kissimmee and Lake Istokpoga
watershed (e.g., C38, C40 and C41) and 4 major canals along the Upper East Coast (C44, C23,
24, &25). In fact, these canals in the Peninsula Bioregion are typical, large artificial
conveyances. Some canals in the Lake Okeechobee watershed have segments that are somewhat
natural and others that are fully engineered. Many canals in South Florida were built in part
along gradients provided by natural steams and some drain into former streams. Under such
conditions, how does USEPA propose differentiation between a canal and stream, and what
guidance will be provided on deciding between which instream criterion applies along a single
canal? What is a stream and what is a canal, and how do canals in the north differ from canals
farther south? Some rationale should be provided by USEPA for deciding which designation
applies within and between regions.
This disparity between streams and canals has significant impacts. Canals in the Peninsula
Region have no Chla criterion at all, according to USEPA, but they do have a TP NNC more
than 2.5 times the 42 ppb requirement farther south. Based on land use, location and design,
canals are clearly more prone to higher baseline nutrient levels, and if anything, their NNCs
should be less stringent than those of more natural streams. Some canals north of the EAA and
some canals south of the EAA discharge directly to tide. What justification does USEPA have
for the large difference in the NNC north versus south, both discharging into nitrogen limited
marine systems?
H. The Use of the Everglades Protection Area TP Rule Criterion of 10 ppb as an
Instream Criterion is Unsound
The TP Rule for the Everglades Protection Area was developed after extensive research on biotic
community responses to TP in P-limited marshes. The Rule was based on evidence from many
different experimental and observational data sets, but did not include any use of or reliance
upon a TP to Chla relationship in marshes or in canals. In fact, the TP rule included no data
whatsoever on canal nutrient effects. This fact and the nearly complete lack of ecological
similarity between canals and marsh sloughs, precludes the use of a criterion developed for

Page 37 of 53; South Florida Water Management District Comments on USEPA‟s Proposed Florida Water Quality Standards (04/28/2010)
marshes as an instream NNC for South Florida Canals in the Everglades Protection Area without
qualification.
If USEPA is going to justify the scientifically inappropriate application of the TP criterion to
canals, then it must clearly specify that it is not an instream protection number, but is being
asserted based upon downstream or in this case, lateral marsh interactions. Justification must be
provided by USEPA for protecting some canals to 10 ppb, while neighboring canals on the other
side of a levee are held to 42 ppb with Chla at 4 ppb and those 20 miles north are at 107 ppb TP
and no Chla. This unjustified segmentation of criteria is not defensible.
I. USEPA Has No Documented Peer Review of the South Florida Canal Numeric
Nutrient Criteria
In the District‟s review of the USEPA‟s rule and supporting documentation (on USEPA website:
Docket Folder containing Supporting Technical Documents), we have not found any reference
on scientific peer review of the South Florida Canal nutrient watershed criteria or methodology
used to create those criteria. In addition, we have not observed scientific peer review for the
alternatives reviewed by USEPA for the South Florida Canal nutrient watershed. The District
requests any information that USEPA may have gathered as a scientific peer review for the
South Florida Canal nutrient watershed. If no such peer review has been undertaken, the District
strongly suggests such a review by USEPA‟s own SAB, the NAS, NRC, or other recognized
body of experts.

Page 38 of 53; South Florida Water Management District Comments on USEPA‟s Proposed Florida Water Quality Standards (04/28/2010)
IV. South Florida Water Management District Response to USEPA
Proposed Numeric Nutrient Criteria: Comments on Statistical Methods
and Assumptions
A. Statistical Flaws in the Derivation Process: Global Issues
Universally, USEPA has not documented that their data assumptions are validated or satisfied
based on the distribution of the data. Use of transformations, parametric tests and other more
complex statistical measures need direct evidence of meeting all assumptions. For example,
USEPA never appears to test for the log-normality of the water quality data; this untested
assumption is important in setting criteria.
The calculation of percentiles as presented by USEPA from means and standard deviations of
log-transformed data distributions is unnecessary and potentially incorrect. If USEPA elects to
use percentiles of the data approach to criteria setting, then they should derive percentiles from
the available data directly, without log-transforming. Using data from different regions for TP,
TN and Chla can bias the results and render them inappropriate for application across the region,
as proposed by USEPA. For example, canals may cross different landscape types, as noted
above, and data being summarized for a single threshold number using an assumption of a single
statistical distribution can be invalid because multiple distributions may be present in the
underlying data.
For the linear regression analyses used by USEPA, the assumptions of log-normality and
constant variance of residuals could lead to large discrepancies. Measurement error associated
with using average values has not been unaccounted for. Beyond these global concerns, the
following text focuses on specific statistical concerns within the lakes and South Florida canals
section of the proposed rule.
B. Statistical Flaws in the Derivation Process: Lakes
The statistical results used to derive numeric nutrient criteria are only valid if various
assumptions about the distribution of the data are met. The document provides no evidence that
any of these assumptions were considered or tested. Consequently, the resulting prediction
intervals (criteria) generated by USEPA may be inaccurate. The following statistical
assumptions and considerations should be tested and/or considered.
(1) Distributional Assumptions
Log-normal distribution of data: USEPA assumes that all the water quality data used in
their assessments are log-normally distributed. The document does not provide any
evidence that this assumption is correct. In other words, there are no formalized tests
(outside of an occasional plot) to support/validate this assumption. While normal

Page 39 of 53; South Florida Water Management District Comments on USEPA‟s Proposed Florida Water Quality Standards (04/28/2010)
probability and cumulative distribution plots are helpful in identifying severe skewness
and kurtosis, more formal tests should be used to account for cases where the departure
from normality is not obvious. This is especially true when setting strict compliance
criteria.
(2) Linear Regression Assumptions
Log-normal distribution of residuals: USEPA used the (log transformed) chlorophyll a to
nutrient relationship to set the nutrient criteria for lakes. These criteria are based on a
statistical model (linear regression) between the two parameters. It does not appear that
the normality of the residuals from this model was tested or discussed in the document.
If the residuals statistically deviate from normality, then the prediction intervals are
erroneous. However, the District did test the residuals of chlorophyll a vs TP for colored
and clear lakes and found the residuals deviating from normality at the 0.05 level.
Distribution assumptions should be tested using formalized tests rather than visual
examinations (see Item 1).
(a) Constant variance of residuals (heteroskedasticity or
homoskedasticity)
It appears the USEPA assumed (and did not test) that the residuals had constant
variance. This assumption can be tested by doing a plot of residuals versus
predicted values. High concentration of residuals above zero or below zero
indicates the variance is not constant (systematic error exists). In addition,
performing a plot(s) of the residuals versus the X value(s) can be done. A Fanning
effect in the residuals indicates the variance is not constant. Formal tests such as
White‟s and Breusch-Pagan‟s can also be performed.
A violation of constant variance assumption will cause the ordinary least squares
(OLS) standard errors to be biased, so the usual confidence intervals and test
statistics will be incorrect, and may lead to incorrect conclusions such as
described below:
If errors increase as X increases (fanning out as X increases) OLS
underestimates true variance/standard errors and overestimates test statistics
yielding p-values that are too small for tests of hypotheses and
confidence/prediction intervals that are too narrow (Type I error inflation);
If errors decrease as X increases (funneling inward as X increases) OLS
underestimates true variance/standard errors and overestimates test statistics

Page 40 of 53; South Florida Water Management District Comments on USEPA‟s Proposed Florida Water Quality Standards (04/28/2010)
yielding p-values that are too small for tests of hypotheses and
confidence/prediction intervals that are too narrow (Type I error inflation);
If errors increases (up to a point) and then decreases as X increases (fanning
out and then funneling inward as X increases) OLS overestimates true
variance/standard errors and underestimates test statistics, yielding p-values
that are too large for test of hypotheses and confidence/prediction intervals
that are too wide (Type II error inflation).
(b) Measurement Error
A basic assumption of linear regression is that the data points are measured
without error. The data points used in the regressions are annual means. Any
mean has an error associated with it. How are these errors being accounted for in
the determination of nutrient limits from the regression analyses? Based on the
USEPA document, it is not apparent that this error was accounted for.
(c) Independence of Error Terms - successive residuals are not correlated
This assumption can be tested as follows by a plot of residual versus predicted
value. Patterns in residuals such as successive positive residuals followed by
successive negative residuals (positively correlated errors) or alternating positive
and negative residuals (negatively correlated errors).
In addition, the Durbin-Watson test can be performed. Violation of the
Independence assumption causes the ordinary least squares (OLS) standard errors
to be biased, so the usual confidence intervals and test statistics are incorrect, and
may lead to incorrect conclusions.
Positively correlated errors have the following effects on statistics. OLS
underestimates standard errors and overestimates test statistics, yielding p-values
that are too small for tests of hypotheses and confidence/prediction intervals that
are too narrow (Type I error inflation). R2 will be higher than it should be;
Negatively correlated errors has the following effects on statistics. OLS
overestimates standard errors and underestimates test statistics, yielding p-values
that are too large for tests of hypotheses and confidence/prediction intervals that
are too wide (Type II error inflation). R2 will be lower than it should be.
(d) Predictive Ability

Page 41 of 53; South Florida Water Management District Comments on USEPA‟s Proposed Florida Water Quality Standards (04/28/2010)
The coefficient of determination (R2) expresses the amount of variability in the Y-
variable that is explained by the X-variable. It also determines how well the
regression predicts the dependent value (Y-variable). Models with R2 ≤ 0.65 have
low predictive power (Prairie 1996).
(3) Linear Regression Approach: Predictor/Predicted Values
Based on the regression plots as presented in the document, the nutrients (TP and TN) are
the predictor variables (X-axis) and chlorophyll a is the predicted variable (Y-axis).
USEPA establishes the chlorophyll a limit of 20 µg/L (based on a TSI=60) to set the
nutrient criteria. Rather than regressing chlorophyll a as the predicted variable, USEPA
should use it as the predictor because the interest is in establishing a nutrient limit for a
given/required/fixed chlorophyll a concentration.
(4) Seasonal Differences: Comparison of Data
USEPA used a simple box plot of wet and dry season chlorophyll a data for clean and
colored lakes (their Figure 1-3) to show that there is not a statistically significant
difference between seasons. A notched box and whisker plot would have provided more
information. However, a formal (two-sample) statistical test (e.g., t-test, Wilcoxon rank
sum) should have been done and would provide more conclusive results.
(5) Handling varying method detection limits (MDLs) within the dataset
USEPA did not provide any information on how differing MDLs for a particular
parameter (chlorophyll a, TN, TP) were handled. For instance, chlorophyll a MDL could
range from 0.1 µg/L to 10 µg/L (based on STORET). It is not clear how USEPA applied
these varying limits with regards to using significant figures for the overall data analyses.
The spread in MDL values could be highly influential for lakes with low chlorophyll a
criterion (e.g. clear acidic lakes have a proposed limit of 6 µg/L).
C. Statistical Flaws in the Derivation Process: Canals
As stated in Section III of this document the District does not believe the inference model used
by USEPA is appropriate for setting numeric nutrient criteria for South Florida Canals. Beyond
the global concern of the methodology not being appropriate, the following comments on
focused solely on concerns we have the statistical methodologies of the Canal section.
(1) Distributional Assumptions:
(a) Log-normal distribution of data

Page 42 of 53; South Florida Water Management District Comments on USEPA‟s Proposed Florida Water Quality Standards (04/28/2010)
USEPA assumes that all the water quality data used in their assessments are log-
normally distributed. The document does not provide any evidence that this
assumption is correct. In other words, there are no formalized tests (outside of an
occasional plot) to support/validate this assumption. Normal probability and
cumulative distribution plots are helpful in identifying severe skewness and
kurtosis. However, more formal tests should be used to account for cases where
the departure from normality is not obvious. This is especially true when setting
strict compliance criteria.
(b) Annual geometric mean is not representative for canals
Canals behave as streams when the water is flowing (mostly during the wet
season) and as lakes/reservoirs when water is not flowing (mostly during the dry
season). Therefore the annual geometric mean (for Chla, TP and TN) used by
USEPA to establish nutrient criteria may not be representative of the actual
conditions for the waterbody since canals may not behave as either category
(stream or lake) on an equal basis. Analysis of a certain year and across years
should be done separately for flowing and not flowing regimes in canals. Flow
weighted means rather than annual geometric mean Chla/TN/TP concentrations
might be more appropriate for analysis.
(c) Averaging over an entire waterbody is not representative for the
canals crossing multiple regions.
Some canals cross 2-3 landscape regions and annual geometric mean over entire
waterbody (canal WBID) might mask natural differences between different
ecoregions. The table and the graph below present the TN annual geometric mean
for the waterbody “3245” for the interval 1996 through 2009. This canal crosses
two ecoregions: HESEA and SEA. TN annual geometric mean averaged over the
stations along for the entire waterbody is compared to TN annual geometric mean
averaged over the stations placed in ecoregions HESEA and SEA separately.
Note in the graph that each ecoregions appear to differ from the average over the
entire canal. In addition when the annual geomeans for the entire canal and the
ecoregions are compared, they were all found to be significantly different
statistically.
(d) Improper use of a single distribution to determine a percentile
Using a single distribution (of Chla, TN or TP respectively) to determine a
percentile as the threshold for chlorophyll a and nutrients may be incorrect
because different distributions may exist between different ecoregions. We used
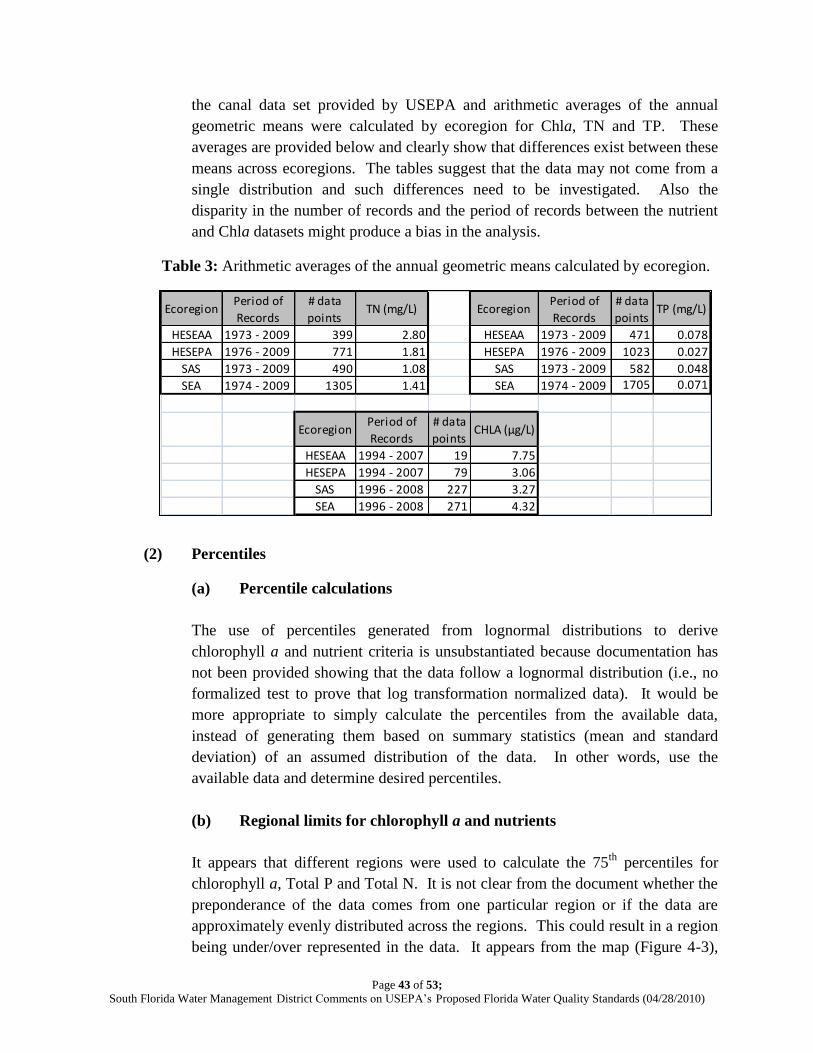
Page 43 of 53; South Florida Water Management District Comments on USEPA‟s Proposed Florida Water Quality Standards (04/28/2010)
the canal data set provided by USEPA and arithmetic averages of the annual
geometric means were calculated by ecoregion for Chla, TN and TP. These
averages are provided below and clearly show that differences exist between these
means across ecoregions. The tables suggest that the data may not come from a
single distribution and such differences need to be investigated. Also the
disparity in the number of records and the period of records between the nutrient
and Chla datasets might produce a bias in the analysis.
Table 3: Arithmetic averages of the annual geometric means calculated by ecoregion.
(2) Percentiles
(a) Percentile calculations
The use of percentiles generated from lognormal distributions to derive
chlorophyll a and nutrient criteria is unsubstantiated because documentation has
not been provided showing that the data follow a lognormal distribution (i.e., no
formalized test to prove that log transformation normalized data). It would be
more appropriate to simply calculate the percentiles from the available data,
instead of generating them based on summary statistics (mean and standard
deviation) of an assumed distribution of the data. In other words, use the
available data and determine desired percentiles.
(b) Regional limits for chlorophyll a and nutrients
It appears that different regions were used to calculate the 75th
percentiles for
chlorophyll a, Total P and Total N. It is not clear from the document whether the
preponderance of the data comes from one particular region or if the data are
approximately evenly distributed across the regions. This could result in a region
being under/over represented in the data. It appears from the map (Figure 4-3),
EcoregionPeriod of
Records
# data
pointsTN (mg/L) Ecoregion
Period of
Records
# data
pointsTP (mg/L)
HESEAA 1973 - 2009 399 2.80 HESEAA 1973 - 2009 471 0.078
HESEPA 1976 - 2009 771 1.81 HESEPA 1976 - 2009 1023 0.027
SAS 1973 - 2009 490 1.08 SAS 1973 - 2009 582 0.048
SEA 1974 - 2009 1305 1.41 SEA 1974 - 2009 1705 0.071
EcoregionPeriod of
Records
# data
pointsCHLA (μg/L)
HESEAA 1994 - 2007 19 7.75
HESEPA 1994 - 2007 79 3.06
SAS 1996 - 2008 227 3.27
SEA 1996 - 2008 271 4.32

Page 44 of 53; South Florida Water Management District Comments on USEPA‟s Proposed Florida Water Quality Standards (04/28/2010)
that certain canals may be over represented (due to the close proximity of
sampling sites along the same canal) while other canals are underrepresented.
(3) Setting Criteria
(a) Unimpaired canals
It is not clear why the 75th percentile is being used to set a nutrient criterion from
unimpaired canal data. This means that 25% of the “clean” canals do not meet
criteria. The nutrient criteria should be set to maximum nutrient level using
“unimpaired” canal data sets.
(b) Chlorophyll a criterion
The Chla data set contains approximately 5-fold fewer stations than the nutrient
data sets. Based on the geometric mean and 75th percentile, it would be a safe
assumption to say that some stations (~25%?) in the EVPA would not meet the
criterion. The chlorophyll a criterion based on the 75th percentile is at (or within)
the PQL range. The District‟s freshwater Chla MDL is 1.0 µg/L. Collier County
has an MDL level for Chla at 3.0 µg/L.
It appears that the statistical analyses performed for chlorophyll a may be highly
skewed by data with concentrations between the MDL and PQL. Is it the
contention of USEPA that Chla criterion should be set at practically the method
detection limit? USEPA has categorized several District canals (e.g., C-44, C-43)
as streams rather than canals. Both of these canals carry Lake Okeechobee water
to tide. Since these canals have been classified as streams, there is no proposed
Chla criterion. What makes these canals different from other canals (such as C-
51) that discharge to tide and not to the EVPA?
In canals, the relationship Chla vs nutrients is hard to define and quantify.
Chlorophyll a can be produced within the canal when discharges are less frequent
and of smaller volume. During periods of flow, chlorophyll a will be transported
from other regions and therefore no correlation with the nutrient concentrations
would be expected, just as it was not found in streams. Based on the USEPA‟s
analyses, they realized that the correlation between waterbody annual geometric
mean chlorophyll a vs nutrients (TN/TP) was weak and was not used in the
determination of nutrient criteria.

Page 45 of 53; South Florida Water Management District Comments on USEPA‟s Proposed Florida Water Quality Standards (04/28/2010)
(4) Linear Regression Assumptions
The District has the same concerns with the USEPA‟s linear regression assumptions for
South Florida Canals as stated in this section for Lakes.

Page 46 of 53; South Florida Water Management District Comments on USEPA‟s Proposed Florida Water Quality Standards (04/28/2010)
V. South Florida Water Management District Response to USEPA
Proposed Numeric Nutrient Criteria: Criteria Implementation Issues
A. Restoration Programs and Projects
The implementation of the numeric nutrient criteria from USEPA will have significant affects on
current environmental restoration efforts being conducted by the South Florida Water
Management District, including the Comprehensive Everglades Restoration Plan (CERP). CERP
was approved by Congress as the framework for Everglades Restoration in the Water Resources
Development Act of 2000 (WRDA-2000). CERP components include Stormwater Treatment
Areas (STA‟s), surface water storage reservoirs, aquifer storage and recovery, seepage
management, operational changes, and other components to be implemented over 35 years. To
date, the state of Florida has invested over 1.8 billion dollars towards CERP.
The Florida Legislature in 2007 adopted the Northern Everglades and Estuaries Protection Act
(NEEPA) to strengthen protection for the Northern Everglades. NEEPA recognizes Lake
Okeechobee, Caloosahatchee and St. Lucie watersheds are critical water resources of the State
and consolidates numerous restoration activities into a comprehensive approach.
All restoration projects, including CERP and Northern Everglades, are regulated under Chapter
373, Florida Statutes (F.S) to ensure protection of the State‟s water resources and specifically
need to meet the State‟s water quality criteria. There are a variety of specific regulations for
restoration projects with varying water quality requirements. For example for CERP projects,
state water quality standards, including water quality criteria will be met. Under no
circumstances shall the project component cause or contribute to violations of state water quality
standards. However, for Lake Okeechobee restoration projects, discharges must be “of equal or
better quality than inflows” and “not pose a serious danger to public health, safety, or welfare”
for water quality parameters other than phosphorus. Fla. Stat. § 373.4595(7)(d).
Implementation of the nutrient criteria may have a significant impact on restoration projects in
Florida, depending on how the criteria are applied. Strict application of the criteria could result
in project redesigns, the need for additional land acquisition, project delays, increased costs, and
ultimately could result in the inability to move forward with restoration projects. The criteria
will also likely result in reduced flexibility of operations, and operational constraints that may
reduce or negate the effectiveness of restoration projects.
For example, the initial WRDA of 1996 authorized the United States Army Corps of Engineers
(Corps) to cost share with the state of Florida (50-50) on CERP water quality features the
Secretary of Army deemed to be essential to Everglades Restoration. In addition, the April 1999
Feasibility Report (“the Yellow Book”) determined 22 project components with water quality
features to be essential to Everglades Restoration and recommended 50-50-costs share on these.
However, the Corps has subsequently interpreted the “essential to Everglades Restoration” cost

Page 47 of 53; South Florida Water Management District Comments on USEPA‟s Proposed Florida Water Quality Standards (04/28/2010)
share requirement to apply only to those projects or components that provide WQ improvement
beyond the State WQS that would need to be achieved prior to inflow to the project. For
example, through the Lake Okeechobee Watershed Project process the Corps has indicated that
they are unsure if there will be federal cost sharing water quality elements of this project as a
result of the establishment of a TMDL for Lake Okeechobee, even though the TMDL is a
restoration standard. For example, the Corps has indicated reluctance regarding possible federal
cost sharing on water quality elements of the Lake Okeechobee Watershed Project as result of
the establishment of a TMDL for Lake Okeechobee, even though the TMDL is a restoration
standard.
The District is unsure how the Corps will work within the context of numeric nutrient criteria as
we continue our discussions with them on this complex issue. However, the development of
numeric nutrient criteria without sound science will lead to even more challenges for our Federal
Partners in Everglades restoration The proposed rule will result in inherent conflicts between
CERP‟s overall South Florida restoration goals (i.e., “getting the water right,” Quality, Quantity,
Timing and Distribution of water) and new federally imposed water quality standards that have
poor scientific linkages to protecting the environment and no linkages to the region‟s current
comprehensive restoration plan.
In order to avoid these affects on environmental restoration projects, USEPA needs to include
restoration specific provisions within the new regulations, which recognize the unique nature of
restoration projects. Typically, restoration projects are not a source of pollutants, rather they
result in a net improvement to water quality and/or quantity. A restoration project should not be
held responsible for fully resolving water quality problems caused by other point and non-point
sources, therefore restoration specific provisions such as net improvement provisions,
exemptions, variances and/or compliance schedules for large scale restoration projects and
STA‟s should be included within the new regulations.
With regard to water quality restoration projects, most of the emphasis in Everglades Restoration
has been on nutrient reduction. To date, the focus has primarily been on the use of natural
treatment systems (e.g., Stormwater Treatment Areas) for phosphorus reduction. Significant
data collection and management practices have been in place to ensure maximum performance
for phosphorus removal. STA‟s have not been focused on or designed to reduce other nutrients
that are included in the proposed nutrient criteria rule (e.g. nitrogen or chlorophyll a). It is not
currently clear, the extent to which these natural treatment systems can be optimized to reduce
nitrogen or chlorophyll a to levels consistent with the proposed criteria.
In addition, several restoration projects are planned and designed to address water quantity rather
than quality (e.g., storage reservoirs, hydropattern restoration, Aquifer Storage and Recovery). If
the proposed criteria are applied in a strict manner, a restoration project designed to improve
water quantity issues could also be held responsible for resolving water quality issues and
ensuring discharges could comply with proposed criteria. Currently as a part of the
Page 48 of 53; South Florida Water Management District Comments on USEPA‟s Proposed Florida Water Quality Standards (04/28/2010)
Comprehensive Everglades Restoration Plan, the District and U.S. Army Corps of Engineers
have NPDES permits for their ASR pilot projects that allow them to return water back to its
regional source (e.g., canal). The proposed criteria have the potential to adversely impact those
permits.
It has always been recognized that Everglades Restoration will take a comprehensive approach
involving a large number of projects that work together to achieve restoration. Applying water
quality criteria in a way that forces each project to fully achieve/address water quality issues will
significantly impact the current approach to restoration. Therefore, consideration of alternatives
specific for restoration projects is imperative in order for restoration to continue.
B. Effects on State of Florida’s Current Total Maximum Daily Load Program
The District is concerned that the numeric nutrient criteria proposed by USEPA does not
consider fully the current total maximum daily load program (TMDLs) and Basin Management
Action Plan (BMAP) processes already in place. Through programs such as the Northern
Everglades (see section IV.A.), the District has been participating and investing significant time
and resources with both the TMDL and BMAP processes.
As noted by USEPA in its preamble of the numeric nutrient criteria rule, the state of Florida is a
leader across the nation in terms of its (TMDLs). From the rule:
“Moreover, Florida is one of the few states that has in place a comprehensive framework of
accountability that applies to both point and nonpoint sources and provides the enforceable
authority to address nutrient reductions in impaired waters based upon the establishment of site
specific total maximum daily loads (TMDLs).”
Through the Florida Watershed Restoration Act (Fla. Stat. § 403.067), the Florida Department of
Environmental Protection has developed a prototype five-step program to manage the listing of
impaired waters, the development and implementation of TMDLs across the state. These are the
same TMDLs that have been approved by the USEPA. Yet, in the rule, USEPA states
“TMDL targets submitted to USEPA by the State for consideration as new or revised WQS
could be reviewed under this SSAC process.”
The District is uncertain how this affects current TMDLs. The District cannot support the
requirement that TMDLs be resubmitted under the Site Specific Alternative Criteria process.
This would slow down water quality restoration efforts across the state and run in conflict with
USEPA‟s stated goal of speeding up the process with numeric nutrient criteria. For example, it
would seem stakeholders in a BMAP planning process would be hesitant to start planning for
load allocations if the TMDL has a significant chance of being delayed and/or changing.
In addition, the District has concerns with the Proposed Restoration Water Quality Standards
(WQS) Provision and its comparability with the BMAP program. Initially some portions of the

Page 49 of 53; South Florida Water Management District Comments on USEPA‟s Proposed Florida Water Quality Standards (04/28/2010)
Restoration WQS provision reads similar to BMAP language. In fact, USEPA acknowledges the
Florida BMAP program covers many of the provisions in the Restoration WQS process.
However, USEPA goes on to state:
“To the extent necessary, FDEP could potentially use aspects of the BMAP process and plans
such as these to help form the basis for Restoration WQS.”
The District is uncertain how this affects current BMAPs. Will current BMAPs for nutrients
need to be resubmitted under the Restoration WQS process? If so, this would seem to slow
down water quality restoration efforts significantly across the state and run in conflict with
USEPA‟s stated goal of speeding up the process with numeric nutrient criteria. For example, it
would seem stakeholders in a BMAP planning process would be hesitant to start planning and
allocating funding for restoration projects if a BMAP has a significant chance of being delayed
and/or changing.
If BMAP components would need to be integrated with the USEPA‟s Restoration WQS process
then it would appear from the rule that Use Attainability Analyses would need to be retroactively
performed for all current nutrient TMDLS and BMAP processes. The District requests USEPA
to determine the number of UAAs developed nationwide over the last 5 years and the
approximate length of time and resources it has taken to develop them. This information will
assist us in understanding how the Restoration WQS process will be implemented.
Overall, the District supports the FDEP‟s approach for the TMDL and BMAP process as the
proper alternatives. As stated in the draft numeric nutrient criteria (draft revisions Florida
Administrative Code [F.A.C.] July 2009) presented at a public workshop (Marco Island Florida
July 22, 2009) the FDEP would, in effect, take all current TMDLs as SSACs immediately within
their rule without further administrative review. In addition, the District requests the USEPA to
utilize the FDEP‟s current BMAP process over the Restoration WQS.
C. Effects on Water Supply Reuse Programs and Projects
Although the District does not directly operate or regulate water reuse, it has actively promoted,
encouraged, and funded water reuse programs. The District is concerned that the proposed
criteria may impact the ability of local wastewater utilities to provide reclaimed water – and it
may have a ripple effect throughout the water management activities in the District. Reclaimed
water has been a valuable resource in meeting existing water needs and is critical to meet future
water needs. Currently, almost 240 million gallons per day of previously wasted water is being
reused in the District.
In response to the state objectives in Sections 373.250 and 403.064, Florida Statutes, of
"encouraging and promoting reuse," the State of Florida has developed a comprehensive reuse
Page 50 of 53; South Florida Water Management District Comments on USEPA‟s Proposed Florida Water Quality Standards (04/28/2010)
program. The Florida Department of Environmental Protection (FDEP) has created extensive
rules dealing with water reuse which are contained in Chapter 62-610, F.A.C.
Water reuse involves taking domestic wastewater, giving it a high degree of treatment, and using
the resulting high-quality reclaimed water for a new, beneficial purpose. Extensive treatment and
disinfection ensure that public health and environmental quality are protected.
Florida Statutes state, “A water management district may require the use of reclaimed water in
lieu of surface water or groundwater when the use of uncommitted reclaimed water is
environmentally, economically, and technically feasible and of such quality and reliability as is
necessary to the user.” Fla. Stat. § 373.250. Additionally, “The South Florida Water
Management District shall require the use of reclaimed water made available by the elimination
of wastewater ocean outfall discharges … in lieu of surface water or groundwater when the use
of uncommitted reclaimed water is environmentally, economically, and technically feasible and
of such quality and reliability as is necessary to the user. This legislation directed that each
domestic wastewater facility that discharges through an ocean outfall shall install a functioning
reuse system no later than December 31, 2025.” Fla. Stat. § 403.086.
The District is concerned that the proposed criteria will trigger violations related to water reuse,
causing local wastewater utilities to abandon or reduce the practice – thus eliminating or
reducing the reuse of a beneficial, fresh-water resource. As an example, consider a south Florida
wastewater utility that has invested to upgrade its facilities so it can produce reclaimed water.
As in many cases in south Florida, the utility delivers its reclaimed water to a storm-water pond
at a local golf course. The golf course, in turn, uses the combination storm-water/reclaimed
water pond for irrigation of the golf course and, in some cases, residences. The pond is
connected for flood protection purposes to the regional drainage canal. As a result of the
proposed criteria for canals, the utility might be in violation of its NPDES municipal separate
storm sewer system (MS4) permit. If so, the utility either pays for costly upgrades to its
treatment facility to meet the criteria, or it chooses to dispose of the reclaimed water in a deep
injection well previously used as a backup.
Other main concerns with the numeric nutrient criteria on reuse programs include:
Reclaimed water is a valuable, fresh-water resource (i.e., water management tool) for the
District. As a water management agency, the use of reclaimed water is essential to reducing
the dependence on limited fresh-water sources, such as groundwater and surface water. If
water reuse declines as a result of the proposed criteria, stress on these limited resources
would increase.
Any reduction in existing or projected water reuse would result in unmet water needs, and
increased additional investment in costly alternative water supplies would be required, if
available.

Page 51 of 53; South Florida Water Management District Comments on USEPA‟s Proposed Florida Water Quality Standards (04/28/2010)
Effluent disposal, in lieu of reuse, would increase (e.g., deep-well injection)
For those utilities that decide to continue a water reuse program, wastewater treatment costs
will dramatically increase. Such cost increases, ultimately to be borne by the rate payer, may
not be economically or politically feasible and reduce water reuse in the future.
Those utilities that are required by State legislation to reuse a minimum 60% of their ocean
discharge (Ocean Outfall Legislation, Chapter 2008-232) might be severely handicapped in
their ability to meet those requirements.
The proposed criteria could affect the availability and timing of water in environmentally-
sensitive areas. The loss of reclaimed water might adversely affect water reservations that
the District is developing to secure the long-term availability of water for thousands of fish
and wildlife species throughout the region. The effect may come directly from disposal
instead of reuse (e.g., deep-injection wells) or indirectly by increasing groundwater and
surface water withdrawals to substitute for the loss of reclaimed water. Those additional
groundwater and surface water allocations may be in direct competition with the
environmental needs.
The proposed criteria could limit or eliminate the use of Aquifer Storage and Recovery
(ASR) technology as a component in the federally-partnered Comprehensive Everglades
Restoration Plan (CERP). Currently, the District and U.S. Corps of Engineers have NPDES
permits for their ASR pilot projects that allow them to return water back to its regional
source (e.g., canal). The proposed criteria have the potential to adversely impact those
permits and therefore ASR technology, which is a vital component to restoring America‟s
Everglades.
D. District Regulatory Programs
The proposed NNC rule may require existing regulatory programs (Rules 40E-61 and 63, F.A.C.
for the District) that currently focus on total phosphorus source control Best Management
Practices (BMPs), the limiting nutrient for the waterbodies of concern, to be amended to include
nitrogen source control BMPs. These programs have reduced phosphorus loads up to 50%
compared to historic levels. Amending and implementing these rules to add BMPs for nitrogen
will require additional resources from the District to conduct research, monitoring, rulemaking,
implementation and compliance with no real ecological benefit since nitrogen is not the limiting
nutrient.
The proposed NNC rule has the potential to erroneously increase the number of impaired
waterbodies, thus, increasing the complexity of Environmental Resource Permit (ERP)
applications and the resources necessary for the agencies implementing the program and the
entities applying for the permits. The District issues an average 1,800 permits per year. The
District and the other 4 water management districts, along with FDEP, issue these permits
throughout the State.

Page 52 of 53; South Florida Water Management District Comments on USEPA‟s Proposed Florida Water Quality Standards (04/28/2010)
The State ERP program, in existence since the mid 1980s, and a proposed comprehensive
statewide revision to the water quality treatment aspects of the ERP program (focusing on
nutrient reduction) are predicated on a rebuttable presumption that an applicant will not cause or
contribute to violations of surface water standards if the applicant is in compliance with the
design criteria within the rules. In addition, the ERP program provides state water quality
certification. The proposed NNC rule could require a change in the water quality analysis
methodology and compliance requirements to be similar to NPDES permits, which the state
agencies do not have the authority to implement. This could result in the State no longer being
able to issue water quality certification.
Currently, the State has a net improvement provision for retrofit or restoration projects submitted
for ERP applications. The proposed NNC rule does not have these provisions, which could
severely limit the number of retrofit or restoration projects being submitted. Without net
improvement provisions local governments and other entities would not be able to get ERP
permits for projects designed to improve waterbodies that are impaired.
E. Additional Peer Review and Comment
EPA‟s own Scientific Advisory Board (“SAB”) found substantial shortcomings in the technical
guidance documents published by EPA in order to assist states in developing their own numeric
standards, yet EPA did not return to the SAB for a peer review of the scientific methodologies
and approaches underlying the current proposed rule. In fact, no review of the methodology and
approaches utilized to develop the canal criteria was ever undertaken or included in the proposed
rule. The District strongly recommends that EPA delay promulgating criteria, particularly for
streams and canals in the state, until such time as a more thorough peer review is undertaken by
the SAB, National Academy of Sciences, or other nationally recognized scientific panel to
determine the validity of the technical and scientific underpinnings of the proposed criteria.
Although EPA requested that stakeholders comment on the alternatives considered as part of the
rulemaking process, it failed to include adequate methodological explanations or explanations of
scientific assumptions underlying these alternatives, instead addressing the alternatives in
“general terms.” See Amer. Med. Ass’n. v. U.S., 887 F.2d 760 (7th
Cir. 1989) (holding that notice
was inadequate when an issue was only addressed in general terms in the initial proposal). The
District was therefore unable to thoroughly address the validity of the science and methodologies
supporting the considered alternatives. The District has also had no opportunity to address any
alternatives proposed by other commenting stakeholders. The District respectfully requests that
should the EPA change its approach and methodology to adopt a different rule than that
proposed based on either those alternatives considered in the proposed rule or any alternative
proposed by a commenting stakeholder, it republish the proposed rule to allow additional time
for review and comment on the newly adopted alternatives. A substantially changed final rule
based on alternatives utilizing different methodologies and scientific assumptions that currently
lack an adequate explanation of scientific assumptions and methodologies would not qualify as a

Page 53 of 53; South Florida Water Management District Comments on USEPA‟s Proposed Florida Water Quality Standards (04/28/2010)
logical outgrowth of the rulemaking process and EPA should not promulgate a final rule based
on these alternatives until a new round of comments was held so that stakeholders would be
provided “their first occasion to offer new and different criticisms that the agency might find
convincing,” regarding the newly adopted alternatives. See Assoc. of Battery Recyclers Inc. v.
U.S. EPA, 208 F.3d 1047 at 1059 (C.A.D.C. 2000).