Embed Size (px)
Citation preview

CCaarrrriieerr®® CChhiilllleerrVVuu™™ EEnneerrggyy DDaasshhbbooaarrdd IInnssttaallllaattiioonn aanndd SSttaarrtt--uupp GGuuiiddee
CARRIER CORPORATION ©2017 A member of the United Technologies Corporation family · Stock symbol UTX · Catalog No. 11-808-564-01 · 5/10/2017

Verify that you have the most current version of this document from www.hvacpartners.com or your local Carrier office.
Important changes are listed in Document revision history at the end of this document.
CARRIER CORPORATION ©2017. All rights reserved throughout the world. i-Vu is a registered trademark of Carrier Corporation. All other trademarks are the property of their respective owners.

Contents What are the Carrier® ChillerVu™ Energy Dashboards? .......................................................................................... 1
Overview to setting up the Energy Dashboards ............................................................................................... 2 Select control program and graphics in EquipmentBuilder ..................................................................................... 4 Customize your graphics in ViewBuilder .................................................................................................................... 5 Add control programs and graphics in the i-Vu® interface ...................................................................................... 7 Map inputs ................................................................................................................................................................... 8 Mapped Points ............................................................................................................................................................. 9 Enter cost value and set up gauges ......................................................................................................................... 12
Home dashboard gauges ................................................................................................................................. 13 Detail dashboard for water-cooled chiller plant gauges .............................................................................. 15 Detail dashboard for air-cooled chiller plant gauges ................................................................................... 16
Document revision history ........................................................................................................................................ 17


Carrier® ChillerVu™ Energy Dashboard Carrier Proprietary and Confidential CARRIER CORPORATION ©2017 Installation and Start-up Guide All rights reserved 1
The Carrier® ChillerVu™ Energy Dashboards are graphic representations of a chilled water plant’s energy performance. You can manipulate how the performance data is displayed, both numerically and graphically. Overall plant performance is tracked using the measurement kW/Ton or, for metric applications, the Coefficient of Performance and ikW/kW.
You must have the SAL library version 1.2 or higher to use the Energy Dashboards.
Assuming you have the correct instrumentation, the dashboards can track and display:
• The electric demand for each piece of equipment (chillers, pumps, fans), both individually and totalized
• The electric consumption for each system (chilled water and condenser water), both individually and totalized
• The totalized peak electric demand for each system
• Accumulated energy use in kW/h
• Accumulated chilled water consumption in consumed Tonnage
• Certain device-specific operational data points (VFD speed, chilled water flow rate, chilled water temperature, etc.)
The data is organized into Home and Detail dashboards.
• Home displays overall plant demand, consumption, and performance.
• Detail displays a more in-depth view of the data that is related to the chilled water and condenser water systems.
NOTE You can click the arrow on any dashboard to switch to a different one.
Standard dashboards are available for both air-cooled and water-cooled plants. The default dashboards have data for:
• 8 chillers
• 8 chilled water pumps
• 8 condenser water pumps
• 8 single-cell cooling towers
You can easily modify the default configurations in ViewBuilder and you can download secondary loop pumping system dashboards by starting with the default views. You can remove or add data.
Logic and associated view files are part of the Carrier® ChillerVu™ SAL file (version 1.2 or higher). In EquipmentBuilder, you create and download the control program and dashboard graphics and then you add them to the Carrier® ChillerVu™ chiller plant control system in SiteBuilder.
For kW/Ton, ikW/kW, and COP calculations, you MUST HAVE chilled water flow data from a chilled water flow meter, calculated by an evaporator differential pressure sensor or other source.
What are the Carrier® ChillerVu™ Energy Dashboards?
What are the Carrier® ChillerVu™ Energy Dashboards?
Carrier® ChillerVu™ Energy Dashboard Carrier Proprietary and Confidential CARRIER CORPORATION ©2017 Installation and Start-up Guide All rights reserved 2
Electrical power values for devices must have data from one or a combination of the following:
• Carrier PIC on-board chiller controls
• Data from communicating third party chiller controls
• Communicating variable frequency drives
• Additional field-installed electrical monitoring instrumentation
Carefully review the data display needs of the project to ensure that suitable instrumentation, either existing or able to be field-installed, is available to support the project requirements of the Energy Dashboards.
Overview to setting up the Energy Dashboards
The Energy Dashboard control program (energy_dashboard-x_x_xxxxxxxx.equipment) includes support for the following dashboard views:
• Air-cooled chiller plants
○ Home screen - Total Plant Energy Dashboard for air-cooled plants - (cvu_ac_hm_db.view)
○ Detail screen - Chiller Water System Energy Dashboard - (cvu_chw_db.view)
• Water-cooled chiller plants
○ Home screen - Total Plant Energy Dashboard for water-cooled plants - (cvu_wc_hm_db.view)
○ Detail screen - Condenser Water System Energy Dashboard - (cvu_cw_db.view)
○ Detail screen - Chiller Water System Energy Dashboard - (cvu_chw_db.view)
Overview of steps to set up the dashboards 1 Customize the appearance of the dashboards
1. Use EquipmentBuilder to obtain your graphics and equipment file. See Select control program and graphics in EquipmentBuilder.
2. In ViewBuilder, you can modify your dashboards in several ways:
○ Change the text
○ Change your currency symbol
○ Link OA conditions on each graphic (default is #oa_conditions)
○ Delete information for unneeded towers, pumps, and chillers if you have less than 8, which is the default maximum configuration for a single view file
○ Change the equipment graphic on the air-cooled Home dashboard (cvu_ac_hm_db.view) to match your equipment model
NOTE See Customize your graphics in ViewBuilder for more details.

What are the Carrier® ChillerVu™ Energy Dashboards?
Carrier® ChillerVu™ Energy Dashboard Carrier Proprietary and Confidential CARRIER CORPORATION ©2017 Installation and Start-up Guide All rights reserved 3
2 Add dashboard files to your Carrier® ChillerVu™ controller
Add graphics and control program in the i-Vu® application.
NOTE See Add control programs and graphics in the i-Vu® interface (page 7).
3 Set up gauges
In the i-Vu® application, you must assign the minimum and maximum values for each gauge.
NOTE See Enter cost value and set up gauges (page 12).
4 Map the inputs
In the i-Vu® application, you must map the inputs to the dashboards.
NOTE See Map inputs (page 8).

Select control program and graphics in EquipmentBuilder
Carrier® ChillerVu™ Energy Dashboard Carrier Proprietary and Confidential CARRIER CORPORATION ©2017 Installation and Start-up Guide All rights reserved 4
1 Obtain the latest SAL library (version 1.2 or higher).
2 Save the file in the i-Vu_Tools_6x.x\sals (or later) folder.
3 In EquipmentBuilder, click Create Equipment.
4 Select psm-6.0-<date>.sal from the Library drop-down menu.
5 Select Energy Dashboard under Energy Dashboard at the bottom of the list.
6 Click Next.
NOTE Do not change the Equipment Name.
7 Check English or Metric.
NOTE If you select Metric, all units of measure, except the currency symbol (see Customize your graphics), are automatically metricized throughout the dashboards. The only modification to the graphics that you must make in ViewBuilder is changing the currency symbol.
8 Click Next.
9 Verify that Control Program and Attachment are checked.
10 Save the .equipment file and attachments to your computer.
11 Click Next.
12 Click Next.
13 Click Exit.
Select control program and graphics in EquipmentBuilder

Customize your graphics in ViewBuilder
Carrier® ChillerVu™ Energy Dashboard Carrier Proprietary and Confidential CARRIER CORPORATION ©2017 Installation and Start-up Guide All rights reserved 5
To edit the dashboards in ViewBuilder, select File > Open and browse to the .view files.
You can modify the dashboards in the following ways: Change currency
1 Change your currency symbol if you do not use the dollar sign.
a) Click on a dollar sign on the graphic.
b) In the Static Text dialog that appears, type in your currency symbol.
CAUTION Do NOT use Edit > Find/Replace. You must change each symbol individually.
Number of currency signs to change
Dashboard
5 Home - Water-cooled chiller plants - (cvu_wc_hm_db.view)
5 Home - Air-cooled chiller plants - (cvu_ac_hm_db.view)
4 Detail - Chiller manager - (cvu_chw_db.view)
3 Detail - Tower manager - (cvu_cw_db.view)
NOTES
• If you do not need an energy use currency value, you can delete the graphic element.
• If you selected Metric in EquipmentBuilder, all units of measure, except the currency symbol, are automatically metricized. You do not need to edit them.
Customize your graphics in ViewBuilder

Customize your graphics in ViewBuilder
Carrier® ChillerVu™ Energy Dashboard Carrier Proprietary and Confidential CARRIER CORPORATION ©2017 Installation and Start-up Guide All rights reserved 6
Change the number of equipment inputs on the Detail dashboards
Customize the number of tower manager and chiller manager inputs (8 is the default maximum configuration for a single dashboard view) to match your system's configuration. You can delete extra inputs for Chillers, Towers, and Pumps, by selecting the line(s) and details from the bottom of the list and then pressing Delete or Ctrl-x on your keyboard.
Change the equipment graphic on the Home dashboard for air-cooled chiller plant
1 Select the default equipment graphic on the dashboard - (cvu_ac_hm_db.view).
2 Press Delete or Ctrl-x on your keyboard.
3 Click the Add Image tab in the Tools window.
4 In the Look in field, browse to the folder that contains the image you want.
5 Select the image.
6 Click in the workspace to place the image.
7 Save your customized dashboard.
You MUST not change the default name of the dashboard .view file.
Change text
Click and type in any editable field to change the text.

Add control programs and graphics in the i-Vu® interface
Carrier® ChillerVu™ Energy Dashboard Carrier Proprietary and Confidential CARRIER CORPORATION ©2017 Installation and Start-up Guide All rights reserved 7
Add the control program (.equipment file)
1 Uncheck Include graphics in Open programmable controller download as follows:
In the i-Vu® Standard or Plus interface, go to and select System Options > General tab > Download.
In the i-Vu® Pro interface, go to and select System Options > System Settings > General tab > Download.
2 In the navigation tree, select the Carrier® ChillerVu™.
3 On the Devices > Manage tab, select the Carrier® ChillerVu™ in the list on the page.
4 Click the Add Control Program button . A dialog window appears.
5 Enter a Display Name for the control program.
6 Select the Controller that you are adding the program to.
NOTE If you already have the maximum number of control programs for the controller, it will not appear in the list.
7 To add the control program, do the following:
If the control program is...
In the Control Program drop-down list 1. Select the control program that you generated in EquipmentBuilder.
2. Click Accept.
Not in the Control Program drop-down list 1. Click Add New.
2. Browse to select the control program.
3. Click Open.
4. Click Continue.
5. Click Close.
6. Click Accept.
Adding Graphics (.view files)
1 To add the graphics, click Add New under Views and browse to your .view files.
2 Click Continue. When message appears File added successfully, click Close.
3 Click Close again.
4 Right-click on the Carrier® ChillerVu™ in the controller list and select Check Status from the list. The status of the controller should say File Mismatch.
5 Click the Download All Content button.
6 Check out and commission the equipment.
Add control programs and graphics in the i-Vu® interface

Map inputs
Carrier® ChillerVu™ Energy Dashboard Carrier Proprietary and Confidential CARRIER CORPORATION ©2017 Installation and Start-up Guide All rights reserved 8
You have to map each input that is on the dashboard.
Map the temperature and humidity
Follow these steps to obtain live data for the weather icon in the right upper corner of the dashboards.
1 In the i-Vu® interface, go to the Properties page > Control Program tab > Configuration section.
2 Click on Outdoor Air Temperature (ANI2) to open the microblock popup.
3 On the Details tab, expand the tree under Primary Address and click on the point that you want to map the temperature from.
4 Repeat for Outdoor Air Humidity (ANI2).
To map the points
1 In the i-Vu® interface, go to the Properties page > Network Points tab.
2 Click a point name to open the microblock popup.
3 On the Details tab, expand the tree under Primary Address and click on the point that you want to map from.
4 Repeat for every point.
Map inputs

Mapped Points
Carrier® ChillerVu™ Energy Dashboard Carrier Proprietary and Confidential CARRIER CORPORATION ©2017 Installation and Start-up Guide All rights reserved 9
NOTES
• All of the following points are BACnet Analog Values (BAV)
• CHW = Chilled water
• CW = Condenser water
Name English
Unit Metric Unit
Description Reference Name Object ID
Data Source
Chiller 1-8% Capacity
% % % of total refrigeration capacity chiller is currently running
db_chX_cap Mapped
Chiller 1-8 Flow GPM L/M water flow rate through chiller
db_chX_flow Mapped
Chiller 1-8 Input kW
kW kW chiller electrical demand db_chX_kw Mapped
Chiller 1-8 Lvg Temp
F C chiller leaving water temp db_chX_lvg_t Mapped
Chiller 1-8 Nominal Capacity
Tons kW refrigeration capacity of chiller
db_chX_nom_cap_ton Mapped
Chiller 1-8 Output
Tons kW chiller refrigeration output db_chX_otpt Mapped
CHWP 1-8 VFD %
% % CHW pump Vfd speed db_chwpX_vfd Mapped
CHW Pump 1-8 Amps
A A instantaneous current draw of CHW pump
db_chwpX_amp Mapped
CHW Pump 1-8 kW
kW kW CHW pump electrical demand
db_chwpX_kw Mapped
CWP 1-8 VFD % % % cw pump Vfd speed db_cwpX_vfd Mapped
CW Pump 1-8 Amps
A A current draw of CW pump db_cwpX_amp Mapped
CW Pump 1-8 kW
kW kW CW pump electrical demand
db_cwpX_kw Mapped
Tower 1-8 kW kW kW tower fan electrical demand
db_twX_kw Mapped
Tower 1-8 Lvg Temp
F C cooling tower leaving water temp
db_twX_lvg_t Mapped
Tower 1-8 VFD %
% % tower fan Vfd speed db_twX_vfd Mapped
CHW Cost Per Output Unit
cost per unit of refrigeration output measured by electrical power comsumption for CHW system only
db_chw_cost_per_otpt_unit AV:1 Calculated
CHW Cost Today electrical cost for CHW system only for the current day
db_chw_cost_today AV:2 Calculated
CHW Cost Yesterday
electrical cost for CHW system only for the previous day
db_chw_cost_yesterday AV:3 Calculated
CHW DP PSI kPa CHW loop dp db_chw_dp Mapped
Mapped Points

Mapped Points
Carrier® ChillerVu™ Energy Dashboard Carrier Proprietary and Confidential CARRIER CORPORATION ©2017 Installation and Start-up Guide All rights reserved 10
Name English Unit
Metric Unit
Description Reference Name Object ID
Data Source
CHW Entering Temp
F C common CHW return temp db_chw_ent_t Mapped
CHW kWh Today kWh kWh electrical usage for CHW system only for current day
db_chw_kwh_today AV:4 Calculated
CHW kWh Yesterday
kWh kWh electrical usage for CHW system only for previous day
db_chw_kwh_yesterday AV:5 Calculated
CHW Leaving Temp
F C common CHW supply temp db_chw_lvg_t Mapped
CHW Output Today
ton-hr kWh refrigeration output of CHW system only for the current day
db_chw_otpt_today AV:6 Calculated
CHW Output Yesterday
ton-hr kWh refrigeration output of CHW system only for the previous day
db_chw_otpt_yesterday AV:7 Calculated
CHW Peak Input kW
kW kW Peak demand of CHW system only for current day
db_chw_peak_kw AV:8 Calculated
CHW Peak Inst. Output
tons kW Peak refrigeration demand of CHW system only for current day
db_chw_peak_otpt AV:9 Calculated
CHW system Efficiency
kW/ton ikW/kW electrical power consumed per ton of refrigeration output for CHW system
db_chw_efficiency AV:10 Calculated
CW Cost Today electrical cost for CW system only for the current day
db_cw_cost_today AV:11 Calculated
CW Cost Yesterday
electrical cost for CW system only for the previous day
db_cw_cost_yesterday AV:12 Calculated
CW DP PSI kPa CW loop dp db_cw_dp Mapped
CW Entering Temp
F C CW return temp db_cw_ent_t Mapped
CW kWh Today kWh kWh electrical usage for CW system only for current day
db_cw_kwh_today AV:13 Calculated
CW kWh Yesterday
kWh kWh electrical usage for CW system only for previous day
db_cw_kwh_yesterday AV:14 Calculated
CW Peak kW kW kW peak electrical demand of CW system for current day
db_cw_peak_kw AV:15 Calculated
Total Chiller Input kW
kW kW electrical demand of all chillers
db_ttl_chl_kw AV:16 Calculated
Total Chiller Inst. Output
tons kW instantaneous refrigeration output of all chillers
db_ttl_chl_otpt AV:17 Calculated
Total CHW Input kW
kW kW electrical demand of CHW system
db_ttl_chw_kw AV:18 Calculated
Total CHWP kW kW kW electrical demand of CHW pumps
db_ttl_chwp_kw AV:19 Calculated
Total CW kW kW kW electrical demand of system
db_ttl_cw_kw AV:20 Calculated
Total CWP kW kW kW electrical demand of CW pumps
db_ttl_cwp_kw AV:21 Calculated
Total Plant Input kW
kW kW electrical demand of plant db_ttl_plant_kw AV:22 Calculated
Total Tower kW kW kW electrical demand of tower fans
db_ttl_twr_kw AV:23 Calculated

Mapped Points
Carrier® ChillerVu™ Energy Dashboard Carrier Proprietary and Confidential CARRIER CORPORATION ©2017 Installation and Start-up Guide All rights reserved 11
Name English Unit
Metric Unit
Description Reference Name Object ID
Data Source
Differential Temp
F C differential temperature of CHW loop
db_diff_t Mapped
Plant COP plant coefficient of performance
db_plant_cop AV:24 Calculated
Plant Cost Per Output Unit
cost per unit of refrigeration output measured by electrical power comsumption for plant
db_plant_cost_per_otpt_unit AV:25 Calculated
Plant Cost Today electrical cost for plant for the current day
db_plant_cost_today AV:26 Calculated
Plant Cost Yesterday
electrical cost for plant for the previous day
db_plant_cost_yesterday AV:27 Calculated
Plant Efficiency kW/ton ikW/kW electrical power consumed per ton of refrigeration output for plant
db_plant_efficiency AV:28 Calculated
Plant kWh Today kWh kWh electrical usage for plant for current day
db_plant_kwh_today AV:29 Calculated
Plant kWh Yesterday
kWh kWh electrical usage for plant for previous day
db_plant_kwh_yesterday AV:30 Calculated
Plant Nominal Capacity
tons kW refrigeration capacity of plant
db_ttl_nom_cap AV:31 Calculated
Plant Peak Input kW
kW kW Peak demand of plant for current day
db_plant_peak_kw AV:32 Calculated
Outdoor Air Humidity
%rh %rh current outdoor air humidity
db_oah Mapped
Outdoor Air Temperature
F C current outdoor air temperature
db_oat Mapped

Enter cost value and set up gauges
Carrier® ChillerVu™ Energy Dashboard Carrier Proprietary and Confidential CARRIER CORPORATION ©2017 Installation and Start-up Guide All rights reserved 12
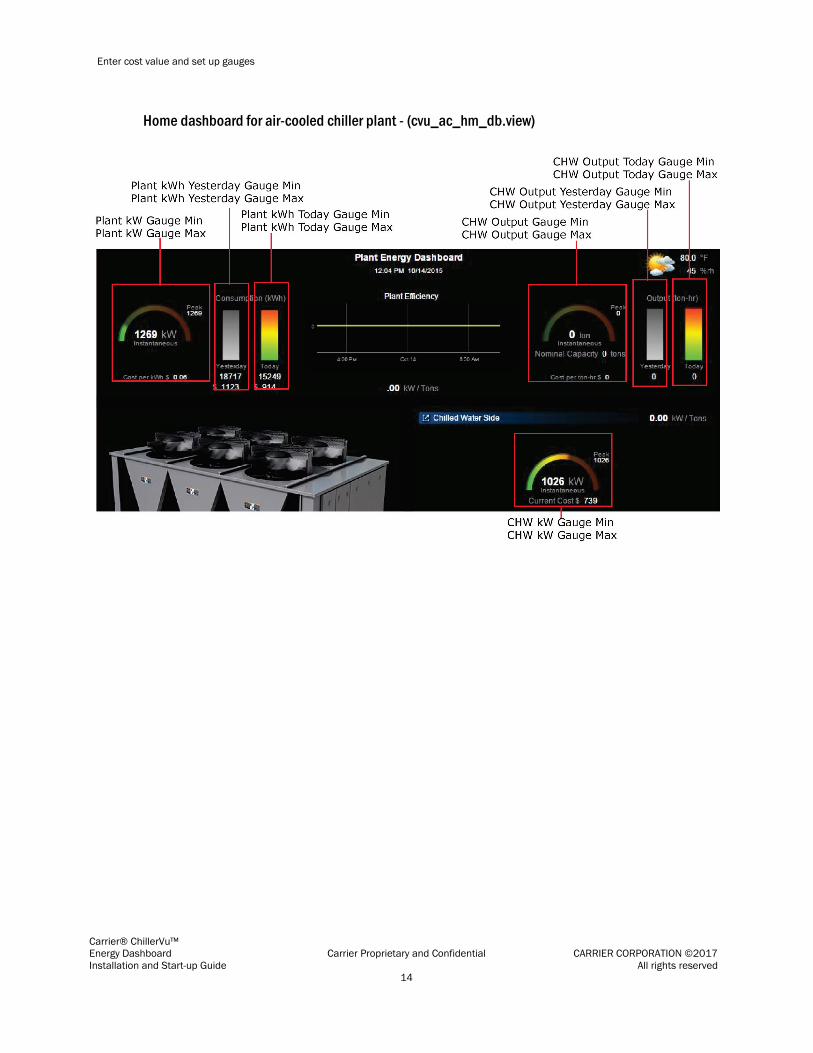
You must enter the cost value and set the range for every gauge that is displayed on the graphics.
1 In the i-Vu® interface, go to the Properties page > Control Program tab > Configuration section.
2 Type in the Cost Per kWh in your local currency in Default Value.
3 Type in the minimum and maximum values for each gauge, as shown below.
4 Use the following labeled graphics as a guide to the properties that correspond to each gauge.
Enter cost value and set up gauges

Enter cost value and set up gauges
Carrier® ChillerVu™ Energy Dashboard Carrier Proprietary and Confidential CARRIER CORPORATION ©2017 Installation and Start-up Guide All rights reserved 13
Home dashboard gauges
In the i-Vu® interface, go to the Properties page > Control Program tab > Configuration section.
Home dashboard for water-cooled chiller plant -(cvu_wc_hm_db.view)
Enter cost value and set up gauges
Carrier® ChillerVu™ Energy Dashboard Carrier Proprietary and Confidential CARRIER CORPORATION ©2017 Installation and Start-up Guide All rights reserved 14
Home dashboard for air-cooled chiller plant - (cvu_ac_hm_db.view)

Enter cost value and set up gauges
Carrier® ChillerVu™ Energy Dashboard Carrier Proprietary and Confidential CARRIER CORPORATION ©2017 Installation and Start-up Guide All rights reserved 15
Detail dashboard for water-cooled chiller plant gauges

Enter cost value and set up gauges
Carrier® ChillerVu™ Energy Dashboard Carrier Proprietary and Confidential CARRIER CORPORATION ©2017 Installation and Start-up Guide All rights reserved 16
Detail dashboard for air-cooled chiller plant gauges

Document revision history
Carrier® ChillerVu™ Energy Dashboard Carrier Proprietary and Confidential CARRIER CORPORATION ©2017 Installation and Start-up Guide All rights reserved 17
Important changes to this document are listed below. Minor changes such as typographical or formatting errors are not listed.
Date Topic Change description Code*
5/10/17 Select control program and graphics in EquipmentBuilder
Updated EquipmentBuilder process. CA-TS-JN-E
Add control programs and graphics in the i-Vu® interface
New topic. Instructions now apply to the i-Vu® Standard, Plus, and Pro applications Added the step to uncheck "Include graphics in Open programmable controller download"
C-TS-JN-E
Overview to setting up the Energy Dashboards
Name of control program updated CA-TS-JN-E
* For internal use only
Document revision history


CARRIER CORPORATION ©2017 A member of the United Technologies Corporation family · Stock symbol UTX · Catalog No. 11-808-564-01 · 5/10/2017


![Sun[TM] Identity Manager 8.0 Technical Deployment Overvew · system configurations and other configuratio n files necessary to customize Identity Manager for a customer installation](https://img.dokumen.tips/doc/110x75/5e8e880d4a571e39fb7fdbf4/suntm-identity-manager-80-technical-deployment-overvew-system-configurations.jpg)