Embed Size (px)
Citation preview
DIPLOMA THESIS
Energy efficient Scheduling for LTE
Uplink
Carried out in the Institute of Telecommunications of the
Vienna University of Technology
by
Víctor Sen Abad

Supervisors:
Univ.Prof. Dipl.-Ing. Dr.techn. Markus Rupp (Vienna University of Technology)
Dipl.-Ing. Stefan Schwarz (Vienna University of Technology)
Univ.Prof. Dipl.-Ing. Dr.techn. Ángela Hernández Solana (Universidad de Zaragoza)
i
Abstract
In a scenario where mobile users are exponentially growing, new generation mobile
communication systems such as Long Term Evolution (LTE) have been designed to
provide higher data rates and lower latencies to allow a broad number of services and
applications in a mobile device. The development of new and demanding services such
as video streaming, real-time gaming entails Quality of Service (QoS) support as well as
capacity increase.
On the other hand, this increased number of high consuming services and components
is not coming with battery developments, for that reason the energy efficiency has
become a crucial issue. These mobile devices, which are battery supplied, not only have
to run an increasing number of services and lots of software functions they are also
equipped with high consuming components (e.g. screen, processor). Such a device
requires a huge battery capacity that is not affordable with the actual battery
technology. Therefore, the energy-efficiency is assumed to be the main challenge for
the researchers in designing of new architectures of the new mobile communication
systems.
The objective of this diploma thesis is to design an energy-efficient packet scheduling
algorithm. The Packet Scheduler (PS) is in charge of the allocation of radio resources to
users over the shared wireless channel. In such a scenario where different users want
to transmit over a wireless channel, the PS aims to achieve spectral efficiency by using
the variability of the wireless channel and the offered traffic data. The PS requires
information about the instantaneous channel quality to be able to exploit time, space,
frequency and multi-user diversity. Multi-user diversity is of particular interest in this
thesis, it aims at exploiting the statistic independence of the channel fading by multiple
users within the same cell or coverage area. It allows to allocate users which are
experiencing better channel conditions.
In LTE packet schedulers play a key role in the overall system performance. The main
goal of this scheduler is to fulfil the expectations of as many users in the system as
possible, taking into account the QoS requirements of their respective applications and
in addition, avoiding energy waste in order to extend battery life in the User Equipment
(UE).
In the first part of this thesis, a comparison study between several basic schedulers is
carried out in order to evaluate their performance and general characteristics. As a
result of this comparison the Proportional Fair (PF) scheduler is proposed as a starting
allocation scheme. The reasons for this decision are not only its well-known trade-off
between fairness and throughput, but also its flexibility. The PF scheduler computes a
metric, for each Resource Block (RB) and user in the current Time Transmission Interval
(TTI), trying to maximize total throughput while at the same time allowing all users at
ii
least a minimal level of service. The next chapter presents a modification of the PF
metric as a good energy-saving approach, which is also applied in the final resource
allocation scheme design.
In the second part of the thesis, the most common traffic models are implemented and
they are randomly assigned among users with certain appearance probability in order
to build a traffic-mix scenario. In that scheme several PF-based schedulers are evaluated
for different number of users in the system. The results show the improvements
achieved with the proposed scheduler in terms of delay and throughput for high-loaded
systems and the possible energy saves under low-load conditions.
The final part briefly presents the overall conclusions and two topics for future research
such as the Discontinuous Reception- (DRX), Transmission (DTX) that LTE exploits and
Interference Coordinated Scheduling.
iii
Preface
This thesis represents the results and conclusions of the work developed during the last 7
months in the department of Mobile Communications of the Institute of Telecommunications in
the Vienna University of Technology Wien, under the supervision of Stefan Schwarz (Vienna
University of Technology), Markus Rupp (Vienna University of Technology) and Ángela
Hernández (Universidad de Zaragoza).
I want to express my gratitude to Stefan Schwarz, who advised and supported my daily work.
My second thanks go to Prof. Markus Rupp, who gave me the chance to develop my work in the
department.
I would like to thank Prof. Ángela Hernandez for all the suggestions and advices she gave me.
And last but not least, I would like to thank my family, my parents and brother, whose love,
support and encouragement have always accompanied me. They supported me in every
possible way and they were always beside me although they were many kilometers away. Words
alone can never express my gratitude.
iv
List of figures Figure 1.1: Schedule of 3GPP standard and their commercial deployments .................. 2
Figure 2.1: Functional split between the E-UTRAN and the EPC ...................................... 9
Figure 2.2: User plane protocol stack ............................................................................. 11
Figure 2.3: Graphical representation of OFDMA and SC-FDMA. Four subcarriers over 2
symbols are represented. ............................................................................................... 13
Figure 2.5: Transmission resource structure .................................................................. 15
Figure 2.5: Uplink time-frequency grid with reference symbols of the LTE uplink ........ 16
Figure 2.6: Mapping between uplink transport channel and uplink physical channel .. 18
Figure 2.7: Signaling exchange between UE and eNodeB .............................................. 20
Figure 3.1: Simplified model of a packet scheduler and the signaling involved ............ 23
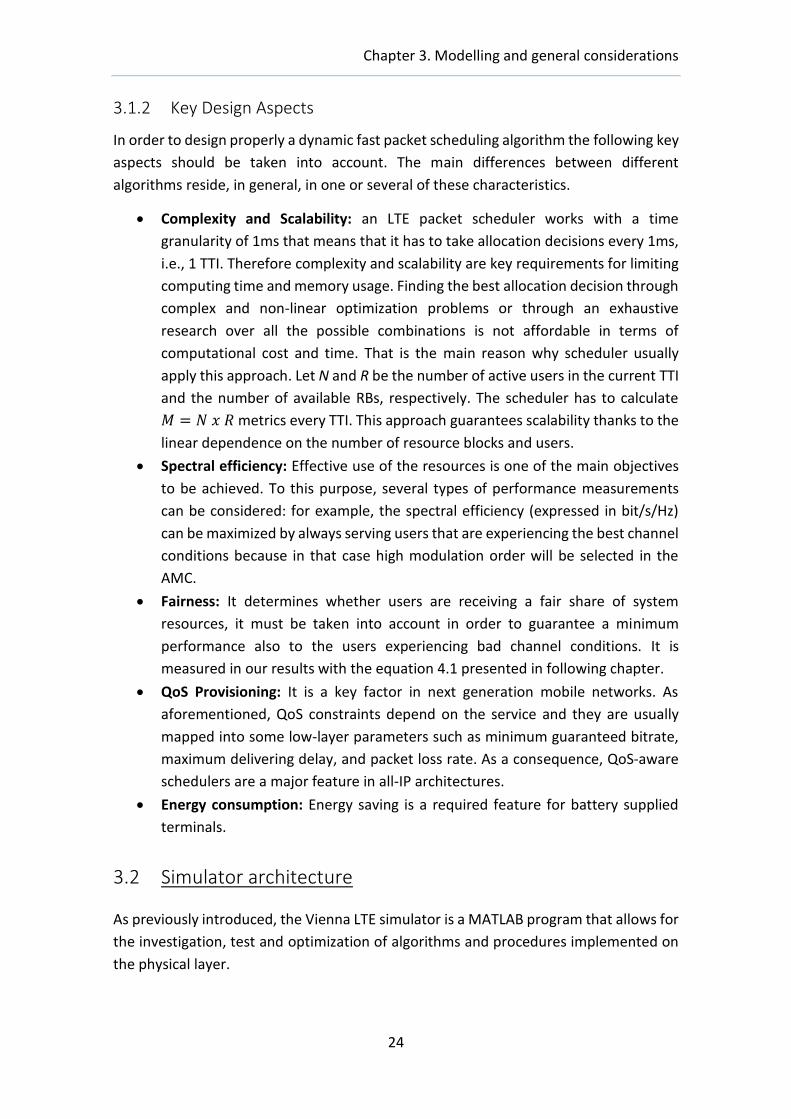
Figure 3.3: Vienna LTE link level simulator structure. .................................................... 25
Figure 3.3: two-state voice activity model ..................................................................... 26
Figure 4.1: Fairness achieved with different schedulers ................................................ 33
Figure 4.1: Fairness achieved with different schedulers ................................................ 33
Figure 4.2: Sum of user throughputs achieved with different schedulers ..................... 33
Figure 4.3: Throughput simultaneously achieved by UEs with different average SNRs for
several schedulers .......................................................................................................... 34
Figure 4.4: Efficiency simultaneously achieved for every scheduler ............................. 36
Figure 4.5: Average power efficiency for several schedulers in terms of Mbit/s per µW
........................................................................................................................................ 36
Figure 4.6: Power consumption simultaneously achieved for several schedulers ........ 37
Figure 5.1: Fairness achieved with each metric for each β value with 20UE ................. 41
Figure 5.2:Sum of Throughput achieved with each metric for each β value with 20UE 41
Figure 5.3: Efficiency achieved with each metric for each β value with 20UE .............. 42
Figure 5.4: Fairness achieved with each metric for each β value with 30UE ................. 43
Figure 5.5: Sum of Throughput achieved with each metric for each β value with 30UE43
Figure 5.6: Efficiency achieved with each metric for each β value with 20UE .............. 44
Figure 6.1: General Packet Scheduling Model with QoS support .................................. 45
Figure 6.2: Simultaneous throughput for different selections of the param δ. ............. 51
Figure 6.3: Averaged Sum of throughput for different selections of the paramr δ. ...... 51
Figure 6.4: Delay-CDF for VoIP users 40UE with different selections of the param δ. .. 52
Figure 6.5: Delay-CDF for 40 video users with different selections of the param δ ...... 53
Figure 6.5: Delay-CDF for 40 gaming users with different selections of the param δ ... 53
Figure 6.6: Delay-CDF for VoIP users 40UE .................................................................... 55
Figure 6.7: Delay-CDF for gaming users 40UE ................................................................ 56
Figure 6.8: Delay-CDF for video users 40UE ................................................................... 57
Figure 6.9: Simultaneous throughput achieved by different scheduler only the NRT
services (HTTP and FTP) with 40UE in the system (12 NRT- UE) are presented ............ 58
Figure 6.10: Sum of throughput and efficiency achieved by different scheduler.......... 59
v
Figure 6.11: Simultaneously achieved throughput by the 40UE with Criteria PF with
β=0.1 ............................................................................................................................... 60
Figure 6.12: Simultaneously achieved throughput by the 40UE with normal PF .......... 60
Figure 6.15: Delay-CDF for streaming video with 30UE ................................................. 61
Figure 6.13: Delay-CDF for VoIP with 30UE .................................................................... 61
Figure 6.14: Delay-CDF for RT-gaming with 30UE .......................................................... 61
Figure 6.16: Simultaneous throughput of the NRT services (HTTP and FTP) with 30UE in
the system (9 NRT-UE) .................................................................................................... 62
Figure 6.17: Sum of throughput and efficiency achieved by different scheduler.......... 62
vi
List of Tables Table 2.1: Standardized QoS Class Identifier for LTE ..................................................... 10
Table 3.1: Traffic model main characteristics ................................................................ 27
Table 4.1: Simulation Parameters Sim#4 ....................................................................... 32
Table 4.2: CQI Parameters and its MCS .......................................................................... 35
Table 5.1: Simulation Parameters Sim#5 ....................................................................... 40
Table 6.1: Simulation Parameters Sim#6 ....................................................................... 50
Table 6.2: Traffic model main characteristics ................................................................ 54
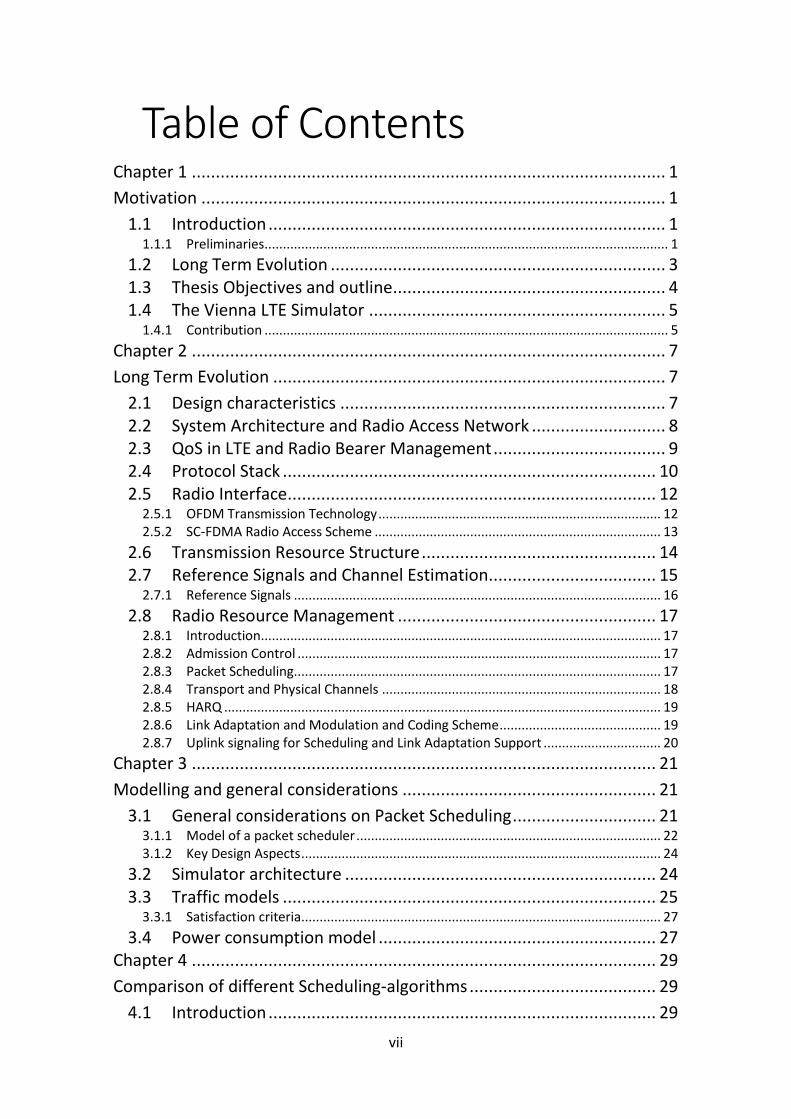
vii
Table of Contents
Chapter 1 ................................................................................................... 1
Motivation ................................................................................................. 1
1.1 Introduction ................................................................................... 1 1.1.1 Preliminaries .............................................................................................................. 1
1.2 Long Term Evolution ...................................................................... 3
1.3 Thesis Objectives and outline ......................................................... 4
1.4 The Vienna LTE Simulator .............................................................. 5 1.4.1 Contribution .............................................................................................................. 5
Chapter 2 ................................................................................................... 7
Long Term Evolution .................................................................................. 7
2.1 Design characteristics .................................................................... 7
2.2 System Architecture and Radio Access Network ............................ 8
2.3 QoS in LTE and Radio Bearer Management .................................... 9
2.4 Protocol Stack .............................................................................. 10
2.5 Radio Interface ............................................................................. 12 2.5.1 OFDM Transmission Technology ............................................................................. 12 2.5.2 SC-FDMA Radio Access Scheme .............................................................................. 13
2.6 Transmission Resource Structure ................................................. 14
2.7 Reference Signals and Channel Estimation................................... 15 2.7.1 Reference Signals .................................................................................................... 16
2.8 Radio Resource Management ...................................................... 17 2.8.1 Introduction............................................................................................................. 17 2.8.2 Admission Control ................................................................................................... 17 2.8.3 Packet Scheduling.................................................................................................... 17 2.8.4 Transport and Physical Channels ............................................................................ 18 2.8.5 HARQ ....................................................................................................................... 19 2.8.6 Link Adaptation and Modulation and Coding Scheme ............................................ 19 2.8.7 Uplink signaling for Scheduling and Link Adaptation Support ................................ 20
Chapter 3 ................................................................................................. 21
Modelling and general considerations ..................................................... 21
3.1 General considerations on Packet Scheduling .............................. 21 3.1.1 Model of a packet scheduler ................................................................................... 22 3.1.2 Key Design Aspects .................................................................................................. 24
3.2 Simulator architecture ................................................................. 24
3.3 Traffic models .............................................................................. 25 3.3.1 Satisfaction criteria .................................................................................................. 27
3.4 Power consumption model .......................................................... 27
Chapter 4 ................................................................................................. 29
Comparison of different Scheduling-algorithms ....................................... 29
4.1 Introduction ................................................................................. 29

viii
4.1.1 Fairness.................................................................................................................... 29
4.2 Scheduling Strategies ................................................................... 30 4.2.1 Round Robin ............................................................................................................ 30 4.2.2 Best Channel Quality Indicator ................................................................................ 30 4.2.3 Maximum Throughput ............................................................................................ 31 4.2.4 Resource Fair ........................................................................................................... 31 4.2.5 Proportional Fair ..................................................................................................... 31 4.2.6 MaxMin Scheduler .................................................................................................. 31
4.3 Simulation Results ........................................................................ 32 4.3.1 Scenario ................................................................................................................... 32 4.3.2 Fairness and Throughput comparison ..................................................................... 32 4.3.3 Simultaneous Throughput comparison ................................................................... 34 4.3.4 Efficient energy consumption comparison ............................................................. 35
4.4 General conclusion comparison ................................................... 37
Chapter 5 ................................................................................................. 39
Energy-saving modification ...................................................................... 39
5.1 Approach ..................................................................................... 39
5.2 Scenario ....................................................................................... 40
5.3 Simulation results ........................................................................ 40 5.3.1 Simulation results 20 UE ......................................................................................... 40 5.3.2 Simulation results 30 UE ......................................................................................... 42
5.4 Conclusion ................................................................................... 44
Chapter 6 ................................................................................................. 45
Investigation of PF Scheduling with QoS Support ..................................... 45
6.1 Introduction ................................................................................. 45
6.2 Scenario ....................................................................................... 46 6.2.1 Basic Proportional Fair ............................................................................................ 46 6.2.2 Real-Time Priority Scheduler ................................................................................... 46 6.2.3 Exponential/Proportional Fair ................................................................................. 47 6.2.4 Criteria Proportional Fair ......................................................................................... 48 6.2.5 Simulations parameters .......................................................................................... 49
6.3 Selection of δ parameter in EXP/PF .............................................. 50
6.4 Simulation results ........................................................................ 54 6.4.1 Delay performance under High load conditions: 40 Users ..................................... 54 6.4.2 Throughput performance under High load conditions: 40 Users ........................... 57 6.4.3 Delay and throughput performance under low-load conditions: 30UE.................. 61
Chapter 7 ................................................................................................. 63
Conclusions .............................................................................................. 63
7.1 Conclusion ................................................................................... 63
7.2 Future work: Topics for Future Research ..................................... 64 7.2.1 DRX/DTX Parameters .............................................................................................. 64 7.2.2 Coordinated Scheduling .......................................................................................... 64
Bibliography ............................................................................................. 65
ix
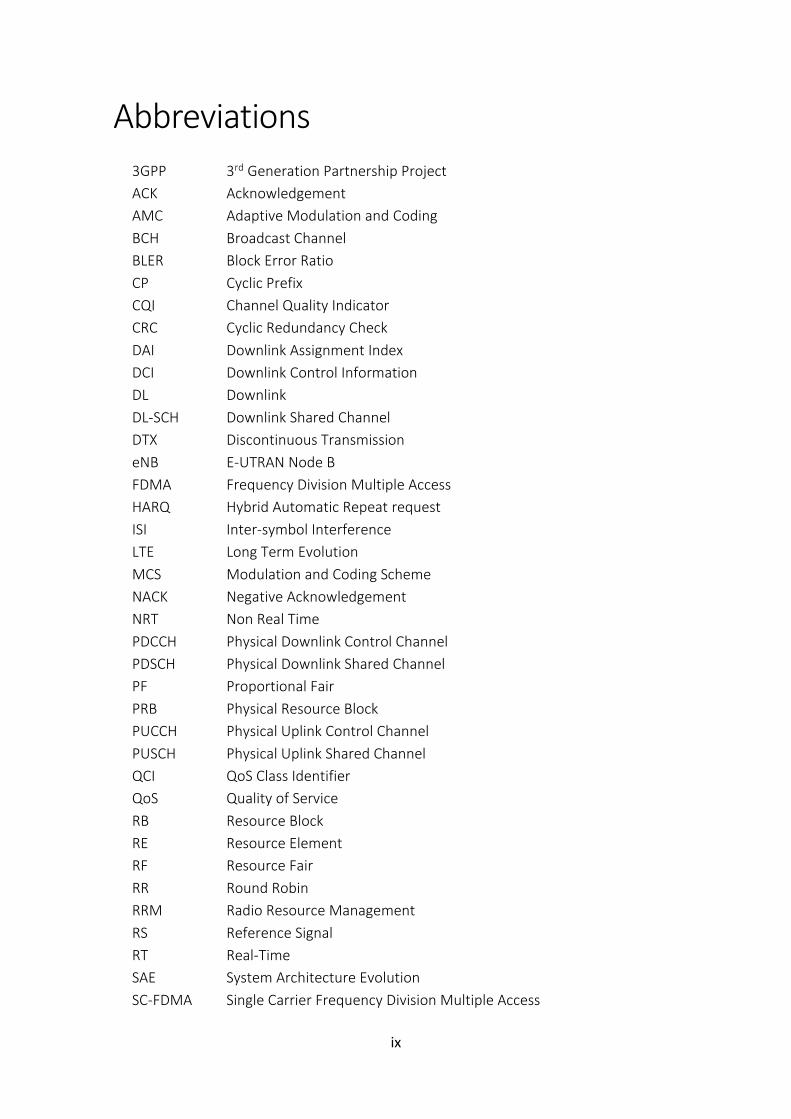
Abbreviations
3GPP 3rd Generation Partnership Project
ACK Acknowledgement
AMC Adaptive Modulation and Coding
BCH Broadcast Channel
BLER Block Error Ratio
CP Cyclic Prefix
CQI Channel Quality Indicator
CRC Cyclic Redundancy Check
DAI Downlink Assignment Index
DCI Downlink Control Information
DL Downlink
DL-SCH Downlink Shared Channel
DTX Discontinuous Transmission
eNB E-UTRAN Node B
FDMA Frequency Division Multiple Access
HARQ Hybrid Automatic Repeat request
ISI Inter-symbol Interference
LTE Long Term Evolution
MCS Modulation and Coding Scheme
NACK Negative Acknowledgement
NRT Non Real Time
PDCCH Physical Downlink Control Channel
PDSCH Physical Downlink Shared Channel
PF Proportional Fair
PRB Physical Resource Block
PUCCH Physical Uplink Control Channel
PUSCH Physical Uplink Shared Channel
QCI QoS Class Identifier
QoS Quality of Service
RB Resource Block
RE Resource Element
RF Resource Fair
RR Round Robin
RRM Radio Resource Management
RS Reference Signal
RT Real-Time
SAE System Architecture Evolution
SC-FDMA Single Carrier Frequency Division Multiple Access
x
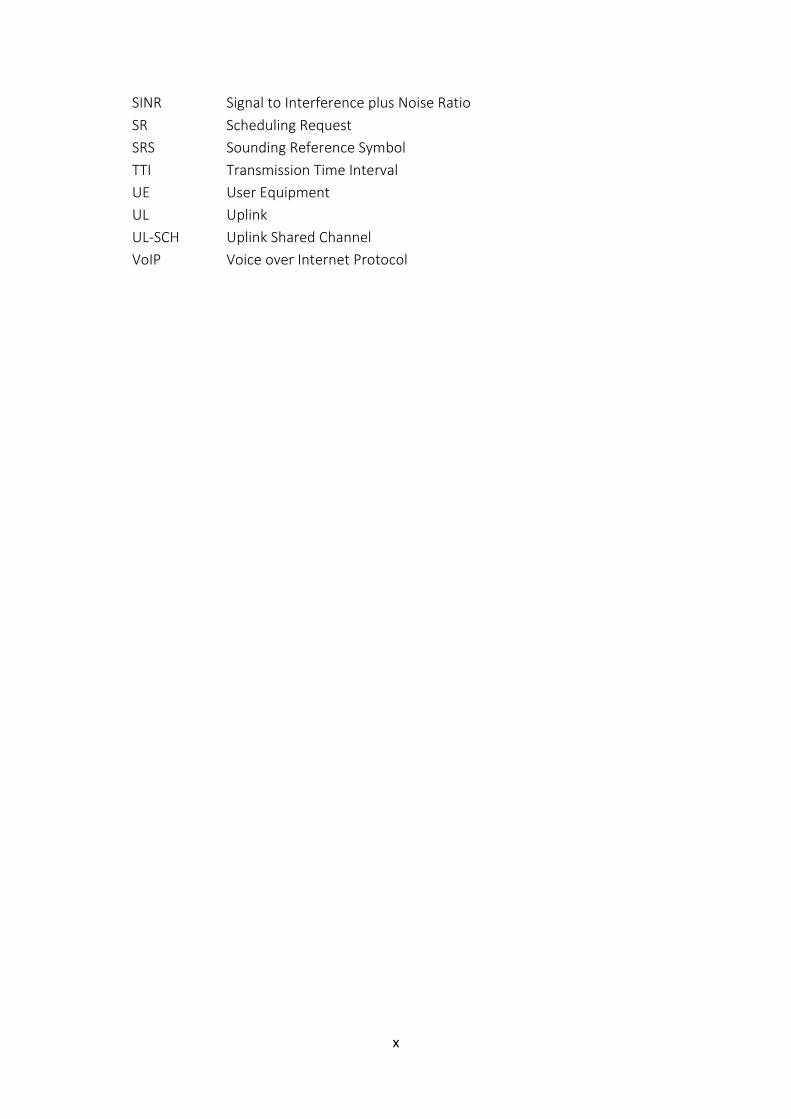
SINR Signal to Interference plus Noise Ratio
SR Scheduling Request
SRS Sounding Reference Symbol
TTI Transmission Time Interval
UE User Equipment
UL Uplink
UL-SCH Uplink Shared Channel
VoIP Voice over Internet Protocol
1
Chapter 1
Motivation
1.1 Introduction
The continuously growing number of mobile users all around the world and the interest
in high-speed data services has suggested network operators to introduce mobile
Internet packet based services. The launching of new and demanding services such as
audio/video streaming, interactive gaming with high requirements has drawn
consideration on the importance of providing the required Quality of Service (QoS) as
well as on the need of increasing the available capacity. Nevertheless, this increasing
number of high demanding services and component is not coming with battery
developments, for that reason the energy efficiency has become a crucial matter.
The issue is that the energy demand in those mobile devices, which are battery supplied,
not only have to run an increasing number of services and lots of software functions
they are also equipped with high consuming components (e.g. screen, processor). Such
a device requires a huge battery capacity that the actual technology is not providing.
Therefore, the power-efficiency is assumed to be the main challenge for the researchers
in designing of new architectures of the new mobile communication systems.
Long Term Evolution (LTE) is popularly called 4G technology. The 4th generation of
mobile communication systems, where LTE is included, are designed from the very
beginning to provide a huge breakthrough. Their objective is not only providing higher
data rates but also lower latencies in order to make possible to run an entire variety of
services and applications in the mobile devices.
LTE is an all-IP technology based on Orthogonal Frequency-Division Multiplexing (OFDM)
aiming to provide spectral efficiency. LTE offers not only full integration but also
handover to and from existing networks, supporting full mobility and global roaming,
and ensuring that operators can gradually deploy LTE by pulling their existing networks
in order to enable service continuity.
1.1.1 Preliminaries
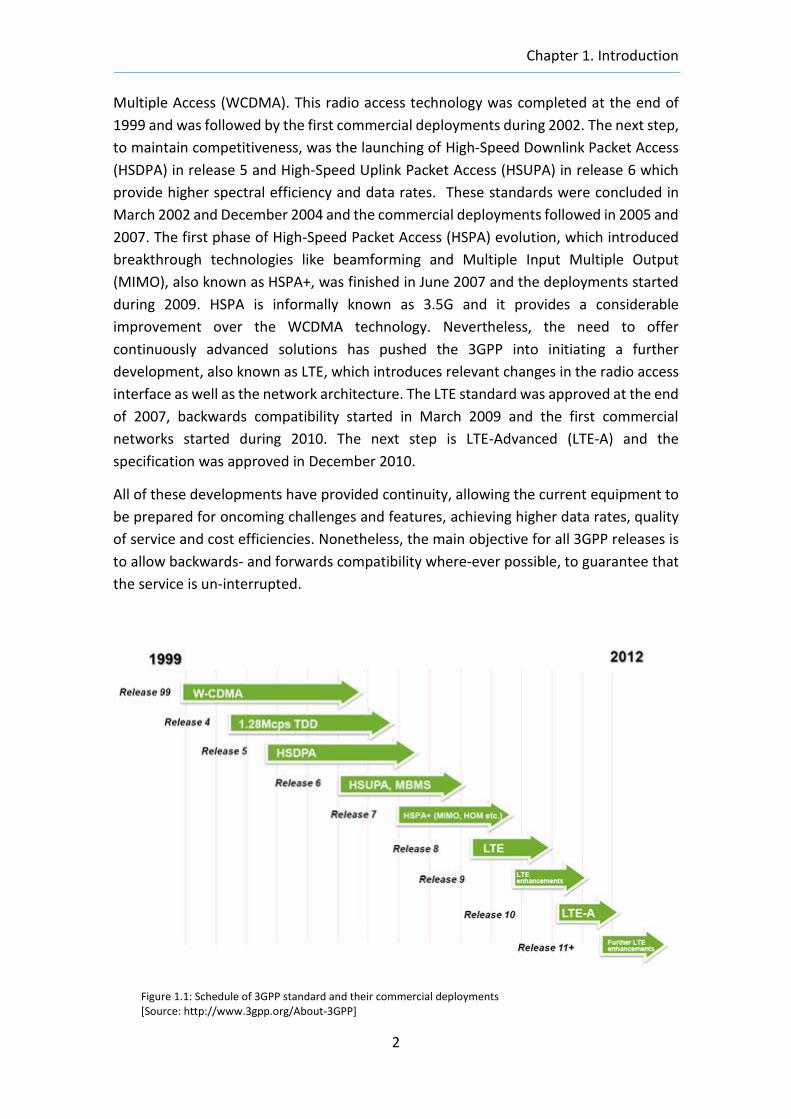
The Third Generation Partnership Project (3GPP) [1] is an organization to develop
telecommunications standards. Some of the last radio technologies and systems
standards presented by 3GPP are shown in figure 1.1. The 3GPP dates refer to the
approval of the specifications. The first development was Wideband Code Division
Chapter 1. Introduction
2
Multiple Access (WCDMA). This radio access technology was completed at the end of
1999 and was followed by the first commercial deployments during 2002. The next step,
to maintain competitiveness, was the launching of High-Speed Downlink Packet Access
(HSDPA) in release 5 and High-Speed Uplink Packet Access (HSUPA) in release 6 which
provide higher spectral efficiency and data rates. These standards were concluded in
March 2002 and December 2004 and the commercial deployments followed in 2005 and
2007. The first phase of High-Speed Packet Access (HSPA) evolution, which introduced
breakthrough technologies like beamforming and Multiple Input Multiple Output
(MIMO), also known as HSPA+, was finished in June 2007 and the deployments started
during 2009. HSPA is informally known as 3.5G and it provides a considerable
improvement over the WCDMA technology. Nevertheless, the need to offer
continuously advanced solutions has pushed the 3GPP into initiating a further
development, also known as LTE, which introduces relevant changes in the radio access
interface as well as the network architecture. The LTE standard was approved at the end
of 2007, backwards compatibility started in March 2009 and the first commercial
networks started during 2010. The next step is LTE-Advanced (LTE-A) and the
specification was approved in December 2010.
All of these developments have provided continuity, allowing the current equipment to
be prepared for oncoming challenges and features, achieving higher data rates, quality
of service and cost efficiencies. Nonetheless, the main objective for all 3GPP releases is
to allow backwards- and forwards compatibility where-ever possible, to guarantee that
the service is un-interrupted.
Figure 1.1: Schedule of 3GPP standard and their commercial deployments [Source: http://www.3gpp.org/About-3GPP]
Chapter 1. Introduction
3
1.2 Long Term Evolution
In this frame of skyrocketing demand for mobile data, LTE is a radio access network
technology standardized in 3GPP and evolving as an evolution of Universal Mobile
Telecommunications System (UMTS). LTE is a converged all-IP network, where providing
QoS is essential for allowing a range of IP-based services and applications within the new
generation networks. Therefore an evolved 3GPP QoS concept has been developed. In
wireless networks, QoS provides traffic prioritization and multiple bearers (a bearer is
an end-to-end communication service between two network elements) with
configuration and priorities to guarantee satisfactory service quality for each service.
A network-initiated bearer creation and QoS Class Identifier (QCI) establishment are
among the key elements of the evolved QoS concept. The purpose of both is
guaranteeing consistent QoS between different User Equipment (UE) vendors and
standards as well as in roaming scenarios.
LTE has been designed to provide spectrum flexibility, that is, to make possible its
deployment in many different spectrum allocations. Besides, support for broad
transmission bandwidth of up to 20MHz is provided in order to achieve high data rates.
Simultaneously low transmission bandwidths, down to 1.4 MHz, are also possible.
Additionally, the focus of LTE is on the improvement of packet based services. The
overall goal is to develop an optimized packet based access system with high data rate
and low latency.
Examples of these services include High Definition Television (HDTV) broadcast,
streaming films, interactive gaming, and VoIP. Hence, it has been designed to provide
high data rates, low latency, and an improved spectral efficiency compared to previous
networks. In order to achieve these objectives, the Radio Resource Management (RRM)
block exploits a mix of advanced MAC and Physical functions, such as resource sharing,
Channel Quality Indicator (CQI) reporting, link adaptation through Adaptive Modulation
and Coding (AMC), and Hybrid Automatic Repeat Request (HARQ).
In this context, the development of efficient resource allocation strategies becomes
crucial. Efficient handling of the radio resources is fundamental to fulfil the system
performance requirements and to satisfy the user needs in accordance to their QoS. The
Packet Scheduler (PS) works at the radio base station, namely the evolved NodeB (eNB),
and it is in charge of distributing the available resources among users. In a wireless
scenario the PS plays an additional key role: it aims to maximize the spectral efficiency
by means of an effective resource allocation strategy that reduces or makes negligible
the negative influence of channel quality drops. Due to its nature, wireless channels are
exposed to huge quality fluctuations in time and frequency domains because of several
reasons, spanning from fading effects to multipath propagation and Doppler Effect.
Chapter 1. Introduction
4
For these reasons, PS usually applies channel-aware approaches in order to allow
exploiting channel quality variations by assigning higher priority to users experiencing
better channel conditions. Although it comes with an added cost due to the feedback.
In the second chapter a deeper overview of the main LTE features is given.
1.3 Thesis Objectives and outline
The objective of this diploma thesis is to design an energy-efficient packet scheduling
algorithm. The PS is in charge of the allocation of radio resources to users over the
shared wireless channel. In such a scenario where different users want to transmit over
a wireless channel, the PS aims to achieve spectral efficiency by using the variability of
the wireless channel and the offered traffic data. The PS requires information about the
instantaneous channel quality to be able to exploit time, space, frequency and multi-
user diversity. Multi-user diversity is of particular interest in this thesis, it aims at
exploiting the statistical independence of the channel fading by multiple users within
the same cell or coverage area. It allows to allocate users which are experiencing better
channel conditions.
The main goal of this scheduler is to fulfil the expectations of as many users in the system
as possible, taking into account the QoS requirements of their respective applications
and avoiding energy waste in order to extend battery life in the UE. The scheduler needs
to be aware of the type of data to be scheduled and of the state of each user, e.g., the
availability of user-data for transmission, how long a packet of a user has already been
in the queue, the channel quality that certain user is currently experiencing or the
resource allocation policy. Furthermore the scheduler, deployed at the eNB, has to
perform the allocation decision every TTI.
In LTE, given the choice of supporting only data transfer, the packet scheduler plays a
key role in the overall system performance. As opposed to the downlink where the
employment of the OFDMA allows exploiting frequency diversity, in uplink the
transmission technology is SC-FDMA, which restricts such possibility but still leaves the
opportunity to achieve multi-user diversity.
In summary there are several key aspects that should be considered when designing a
dynamic resource sharing scheme for LTE, they will be discussed afterwards in more
detail.
The successive chapters of the thesis are distributed in this way:
Chapter 2 presents an overview on LTE Networks. Special attention is given to
the description of the uplink RRM functionalities in LTE.
Chapter 1. Introduction
5
Chapter 3 provides the actual modelling and implementation of LTE features. The
chapter also briefly presents the traffic models used by the users. The power
consumption model is also described.
Chapter 4 shows a comparison study between several basic schedulers, it is
carried out in order to evaluate their performance and general characteristics.
As a result of this comparison the Proportional Fair (PF) scheduler is proposed as
a starting allocation scheme.
Chapter 5 presents an energy-efficient modification of the PF. The results show
that it especially useful under low-load conditions. It proves that the energy
efficiency can be improved by approx. 33%.
Chapter 6 provides an investigation in terms of QoS support (delay and
throughput) and energy efficiency in a traffic-mix scenario. The most common
traffic models are implemented. In that study several PF-based schedulers are
evaluated for different number of users in the system. The results show the
improvements in the system in terms of delay and throughput for high-loaded
systems and the possible energy saves under low-load conditions thanks to our
proposed design.
Chapter 7 summarizes the report conclusion indicating possible future work,
such as, the idea of Discontinuous Reception (DRX) and Discontinuous
Transmission (DTX) that LTE exploits. The main point of this functionality makes
the terminal to not continuously monitor control channels, allowing it to turn the
radio frequency modem in sleep state for long periods, activating it only in
certain instants.
1.4 The Vienna LTE Simulator
To be able to compare the performance of different scheduling-algorithms, the Vienna
LTE Link-Level Simulator is employed. This computationally efficient simulator enables
studying the performance of different scheduling-strategies in networks with an
authentic size. Further description of that simulator can be found under [2] and [3]. In
that paper the structure of the transmitter, channel model and receiver are explained,
as well as the capabilities of the simulator and some examples of its application.
Nevertheless a brief description about the simulator structure is provided in chapter 3.
That simulator is available under an academic non-commercial use license providing
researchers full access to standard-compliant simulation environments.
1.4.1 Contribution
The main contribution of this diploma thesis on the Uplink Link Level Simulator is the
implementation of several scheduler algorithms and adapting them to a traffic model
scenario.
Chapter 1. Introduction
6
Some solutions, such as the scheduling algorithms, derived for downlink case cannot be
directly applied to the uplink due to differences in terms of transmission technology and
network resource constraints. The first step was to modify those scheduler algorithms
that were already implemented on the downlink simulator. The main issue is that it is
not possible to assign Resource Blocks (RB) to two different users within the same
subframe. That is due to the application of Single-carrier Frequency-Division multiple
access scheme (SC-FDMA) in the LTE Uplink and the frequency contiguity that this
technique requires. It will be further explained in the next chapter, how the physical
layer in the LTE Uplink is defined.
The second big step was to implement the traffic models in order to be able to study the
performance of the scheduler in a traffic-mix scenario. Different services are
characterized by different requirements on provided resources by the network to meet
the QoS-constraints. Traffic Models are used to emulate services with these
requirements. The specification for the set of Traffic Models and the probability of
appearance of each type in a typical traffic-mix scenario is based on [4].
7
Chapter 2
Long Term Evolution
This chapter provides an overview of the main LTE characteristics. First of all the system
architectures is described, including the main aspects of the protocol stack. The air
interface technology selected for LTE is OFDMA, which is also illustrated. Finally, a
description of the essential RRM features is provided, with special attention on issues
related to scheduling, as it is the main concern in the thesis.
As mentioned previously, LTE is the next step in the evolution of mobile cellular systems
and was standardized as part of the 3GPP Release 8 specifications. While 2G and 3G
technologies were developed mainly considering voice service, LTE was built for high-
speed data services, which is the reason why LTE is a packet-switched network from end
to end and has no support for circuit-switched services.
2.1 Design characteristics
The important targets for LTE radio-interface and radio-access network architecture are
as follows:
• Peak data rates exceeding 100Mbps in the downlink and 50Mbps in the uplink using a
system bandwidth of 20MHz.
• Significantly higher capacity compared to the Release 6 reference case i.e. increase in
spectral efficiency by a factor of three to four times in downlink and two to three times
in uplink.
• Significantly reduced control plane latency as well as user plane latency (below 5ms
round-trip time with 5 MHz bandwidth or higher spectrum allocation).
• Scalable bandwidth operation up to 20 MHz, i.e., 1.4, 3, 5, 10, 15 and 20 MHz, that
gives to network operators the possibility to throttle the bandwidth occupation and
hence providing high flexibility for a worldwide market.
• Support for packet switched domain only.
• Enhanced support for end-to-end QoS by means of new sophisticated Radio Resources
Management (RRM) techniques.
• Optimized performance for user speed of less than 15 km/h, and high performance for
speeds up to 120 km/h. The connection should be maintained with speeds even up to
350 km/h.
Chapter 2. LTE Overview
8
• Backwards compatibility. Possibility for simplified co-existence between operators in
adjacent bands as well as cross-border coexistence.
• Reduced cost for operator and end user.
2.2 System Architecture and Radio Access Network
To meet the requirements of reduced latency and cost, the LTE system is based on a flat
system architecture (known as the “Service Architecture Evolution”) that contains a
reduced number of network nodes along the data path. A reduction of the number of
nodes enables for example to reduce the call setup times, as fewer nodes will be
involved in the call setup procedure. This guarantees a seamless mobility support and a
high speed delivery for data and signaling.
The Service Architecture Evolution (SAE) consists of a core network, namely Evolved
Packet Core (EPC), and a radio access network, namely the Evolved Universal Terrestrial
Radio Access Network (EUTRAN).
The EPC is composed of:
The Packet Data Network (PDN) Gateway (P-GW), links the LTE network with the rest
of the world, providing a connection among UEs and external packet data networks.
Each packet data network is identified by an Access Point Name (APN).
The serving gateway (S-GW) acts as a router, forwards data between the base station
and the P-GW and handles handover among LTE and other 3GPP technologies.
The Mobility Management Entity (MME) controls the high-level operation of the
mobile by means of signaling messages.
The LTE access networks can host only two types of node namely the UE (the end-user)
and the eNB. Note that eNBs are directly connected to each other and to the MME
gateway. An important feature of LTE is that, differently from other cellular network
architectures, the eNB is the only entity in charge of performing both Radio Resource
Management (RRM) and control procedures on the radio interface. This key feature has
several advantages, which will be explained later in more detail.
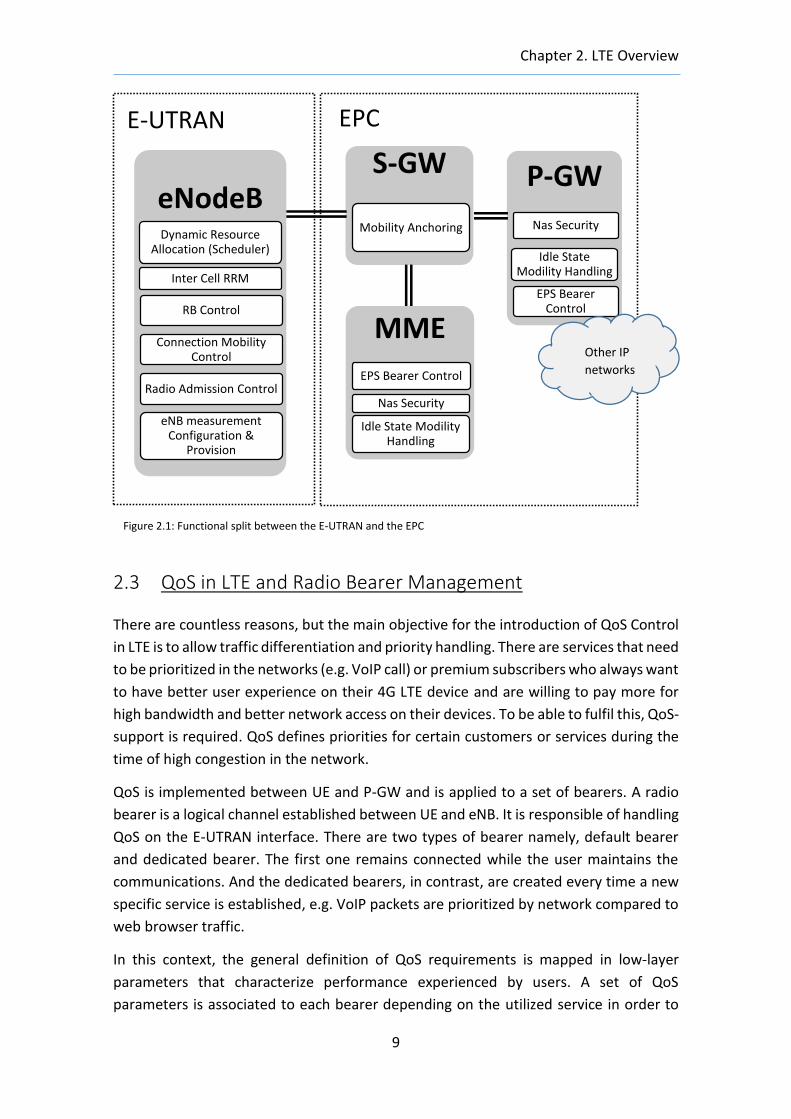
Following diagram (fig. 2.1) shows the functional split between the E-UTRAN and the
EPC for an LTE network:
Chapter 2. LTE Overview
9
eNodeBDynamic Resource
Allocation (Scheduler)
Inter Cell RRM
RB Control
Connection Mobility Control
Radio Admission Control
eNB measurement Configuration &
Provision
S-GW
Mobility Anchoring
MME
Nas Security
Idle State Modility Handling
EPS Bearer Control
P-GW
Nas Security
Idle State Modility Handling
EPS Bearer Control
2.3 QoS in LTE and Radio Bearer Management
There are countless reasons, but the main objective for the introduction of QoS Control
in LTE is to allow traffic differentiation and priority handling. There are services that need
to be prioritized in the networks (e.g. VoIP call) or premium subscribers who always want
to have better user experience on their 4G LTE device and are willing to pay more for
high bandwidth and better network access on their devices. To be able to fulfil this, QoS-
support is required. QoS defines priorities for certain customers or services during the
time of high congestion in the network.
QoS is implemented between UE and P-GW and is applied to a set of bearers. A radio
bearer is a logical channel established between UE and eNB. It is responsible of handling
QoS on the E-UTRAN interface. There are two types of bearer namely, default bearer
and dedicated bearer. The first one remains connected while the user maintains the
communications. And the dedicated bearers, in contrast, are created every time a new
specific service is established, e.g. VoIP packets are prioritized by network compared to
web browser traffic.
In this context, the general definition of QoS requirements is mapped in low-layer
parameters that characterize performance experienced by users. A set of QoS
parameters is associated to each bearer depending on the utilized service in order to
Figure 2.1: Functional split between the E-UTRAN and the EPC
Other IP
networks
E-UTRAN EPC
Chapter 2. LTE Overview
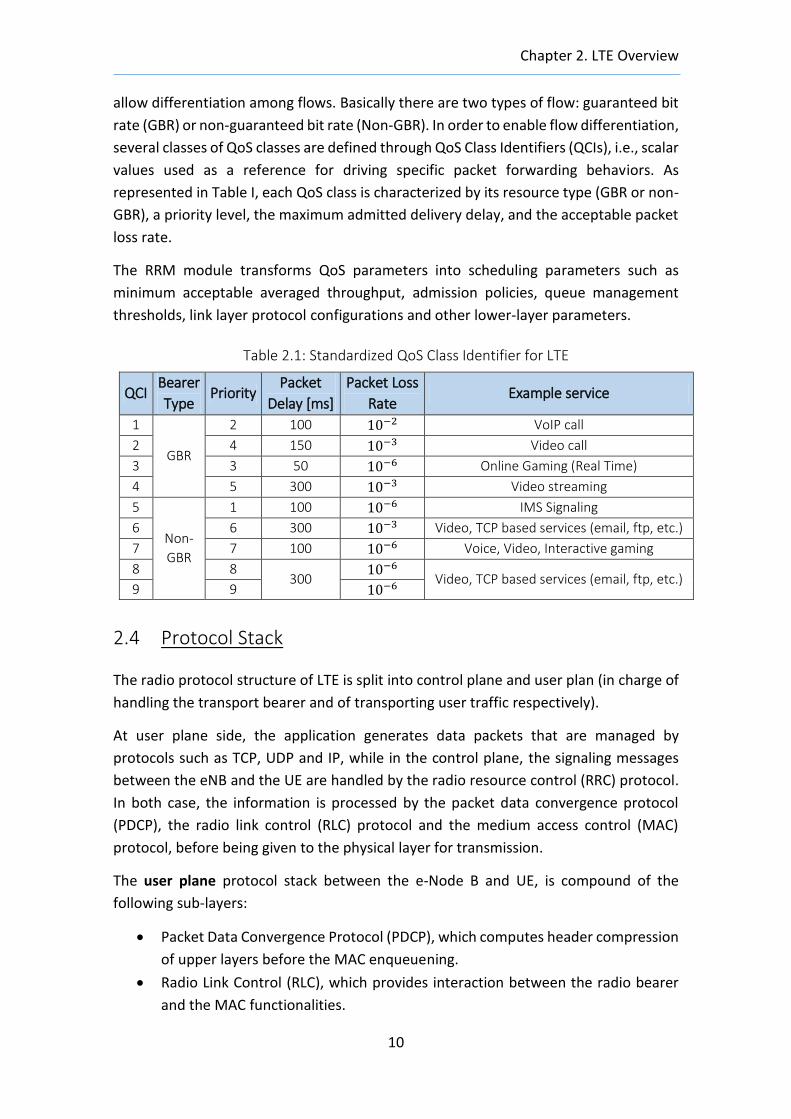
10
allow differentiation among flows. Basically there are two types of flow: guaranteed bit
rate (GBR) or non-guaranteed bit rate (Non-GBR). In order to enable flow differentiation,
several classes of QoS classes are defined through QoS Class Identifiers (QCIs), i.e., scalar
values used as a reference for driving specific packet forwarding behaviors. As
represented in Table I, each QoS class is characterized by its resource type (GBR or non-
GBR), a priority level, the maximum admitted delivery delay, and the acceptable packet
loss rate.
The RRM module transforms QoS parameters into scheduling parameters such as
minimum acceptable averaged throughput, admission policies, queue management
thresholds, link layer protocol configurations and other lower-layer parameters.
Table 2.1: Standardized QoS Class Identifier for LTE
QCI Bearer
Type Priority
Packet
Delay [ms]
Packet Loss
Rate Example service
1
GBR
2 100 10−2 VoIP call
2 4 150 10−3 Video call
3 3 50 10−6 Online Gaming (Real Time)
4 5 300 10−3 Video streaming
5
Non-
GBR
1 100 10−6 IMS Signaling
6 6 300 10−3 Video, TCP based services (email, ftp, etc.)
7 7 100 10−6 Voice, Video, Interactive gaming
8 8 300
10−6 Video, TCP based services (email, ftp, etc.)
9 9 10−6
2.4 Protocol Stack
The radio protocol structure of LTE is split into control plane and user plan (in charge of
handling the transport bearer and of transporting user traffic respectively).
At user plane side, the application generates data packets that are managed by
protocols such as TCP, UDP and IP, while in the control plane, the signaling messages
between the eNB and the UE are handled by the radio resource control (RRC) protocol.
In both case, the information is processed by the packet data convergence protocol
(PDCP), the radio link control (RLC) protocol and the medium access control (MAC)
protocol, before being given to the physical layer for transmission.
The user plane protocol stack between the e-Node B and UE, is compound of the
following sub-layers:
Packet Data Convergence Protocol (PDCP), which computes header compression
of upper layers before the MAC enqueuening.
Radio Link Control (RLC), which provides interaction between the radio bearer
and the MAC functionalities.
Chapter 2. LTE Overview
11
Medium Access Control (MAC), which handles all the most important procedures
for the LTE radio interface, such as multiplexing/demultiplexing, random access,
radio resource allocation and scheduling requests.
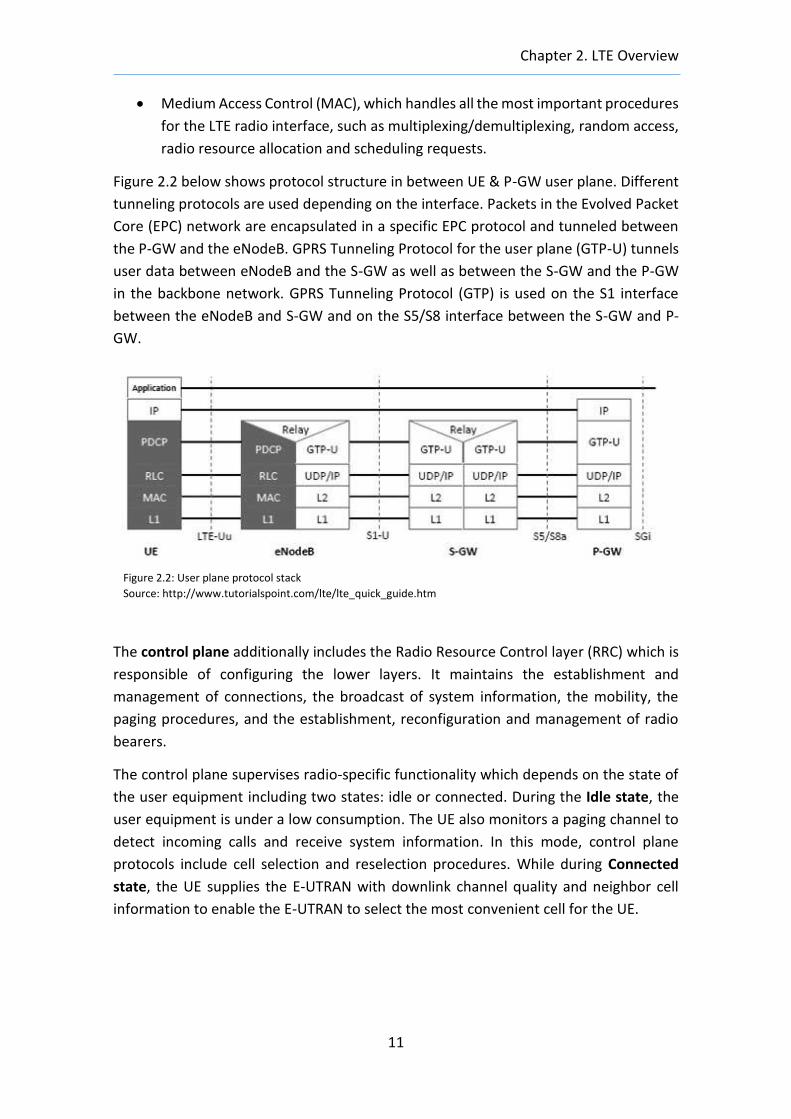
Figure 2.2 below shows protocol structure in between UE & P-GW user plane. Different
tunneling protocols are used depending on the interface. Packets in the Evolved Packet
Core (EPC) network are encapsulated in a specific EPC protocol and tunneled between
the P-GW and the eNodeB. GPRS Tunneling Protocol for the user plane (GTP-U) tunnels
user data between eNodeB and the S-GW as well as between the S-GW and the P-GW
in the backbone network. GPRS Tunneling Protocol (GTP) is used on the S1 interface
between the eNodeB and S-GW and on the S5/S8 interface between the S-GW and P-
GW.
The control plane additionally includes the Radio Resource Control layer (RRC) which is
responsible of configuring the lower layers. It maintains the establishment and
management of connections, the broadcast of system information, the mobility, the
paging procedures, and the establishment, reconfiguration and management of radio
bearers.
The control plane supervises radio-specific functionality which depends on the state of
the user equipment including two states: idle or connected. During the Idle state, the
user equipment is under a low consumption. The UE also monitors a paging channel to
detect incoming calls and receive system information. In this mode, control plane
protocols include cell selection and reselection procedures. While during Connected
state, the UE supplies the E-UTRAN with downlink channel quality and neighbor cell
information to enable the E-UTRAN to select the most convenient cell for the UE.
Figure 2.2: User plane protocol stack
Source: http://www.tutorialspoint.com/lte/lte_quick_guide.htm
Chapter 2. LTE Overview
12
2.5 Radio Interface
LTE has been designed as a highly flexible radio access technology in order to support
several system bandwidth configurations (from 1.4 MHz up to 20 MHz). Compared to its
previous generation HSPA another fundamental evolution is the introduction of the
Orthogonal Frequency Division Multiplexing (OFDM) multi-carrier transmission scheme.
One of the main reasons for the decision was the feasible cost of the transceiver. In
particular, Single Carrier Freq. Division Multiple Access (SC-FDMA) is used in uplink.
2.5.1 OFDM Transmission Technology
The OFDM scheme splits up the information data in a set of parallel data streams carried
by closely spaced and orthogonal subcarriers. Afterwards, the signal is modulated with
a conventional modulation scheme like Quadrature Phase Shift Keying (QPSK), 16-QAM
or 64-QAM (Quadrature Amplitude Modulation). The low symbol rate allows the use of
guard interval between symbols which enables controlling of time-spreading and Inter-
Symbol Interference (ISI). There are several reason why the OFDM was chosen as the
multi-carrier transmission scheme by LTE:
Simplified channel equalization
High spectral efficiency and Multi-path delay Spread Tolerance. Both due to the
increase in the symbol time, which leads to a consequently increase in the
effectiveness of OFDM against the ISI caused due to multi-path delay spread. In
addition, employing the Cyclic Prefix (CP) can completely eliminate ISI from the
system.
Efficient implementation via Fast Fourier Transform (FFT).
Inherent bandwidth scalability, flexibility of bandwidth allocation by varying the
number of subcarriers used for transmissions.
High robustness against the time-frequency selective nature of radio channel
fading. In other words, OFDM enables exploiting frequency diversity because it
is inherently in the system.
Nevertheless, OFDM also presents some disadvantages like sensitivity to frequency
synchronization and above all a high Peak-To-Average Power Ratio (PAPR). As the
amplitude of the time-domain signal depends on hundreds of subcarriers, large signal
peaks will occasionally reach the amplifier saturation region, resulting in a non-linear
distortion, which causes intermodulation and out-of-band emissions. To solve that
problem, high linearity power amplifiers are required, which operate with a large
backoff from their peak power suffering from poor power efficiency. In addition, there
are other solution such as Peak Windowing, clipping, coding, bit-scrambling or selective
mapping. Nevertheless, all these approaches have disadvantages like increasing of the
bandwidth or the system complexity.
Chapter 2. LTE Overview
13
Before it was selected for LTE, OFDMA has been also successfully used in many areas of
digital transmissions, like Digital Video Broadcasting (DVB) and WLAN.
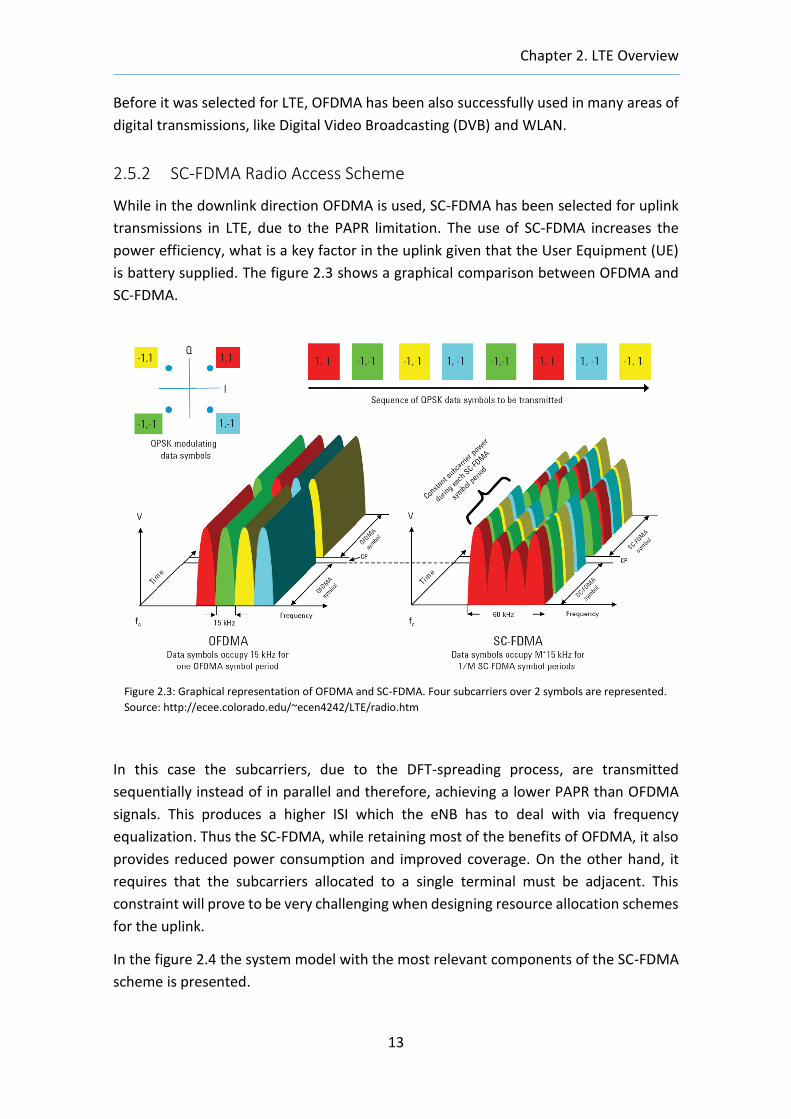
2.5.2 SC-FDMA Radio Access Scheme
While in the downlink direction OFDMA is used, SC-FDMA has been selected for uplink
transmissions in LTE, due to the PAPR limitation. The use of SC-FDMA increases the
power efficiency, what is a key factor in the uplink given that the User Equipment (UE)
is battery supplied. The figure 2.3 shows a graphical comparison between OFDMA and
SC-FDMA.
In this case the subcarriers, due to the DFT-spreading process, are transmitted
sequentially instead of in parallel and therefore, achieving a lower PAPR than OFDMA
signals. This produces a higher ISI which the eNB has to deal with via frequency
equalization. Thus the SC-FDMA, while retaining most of the benefits of OFDMA, it also
provides reduced power consumption and improved coverage. On the other hand, it
requires that the subcarriers allocated to a single terminal must be adjacent. This
constraint will prove to be very challenging when designing resource allocation schemes
for the uplink.
In the figure 2.4 the system model with the most relevant components of the SC-FDMA
scheme is presented.
Figure 2.3: Graphical representation of OFDMA and SC-FDMA. Four subcarriers over 2 symbols are represented.
Source: http://ecee.colorado.edu/~ecen4242/LTE/radio.htm
Chapter 2. LTE Overview
14
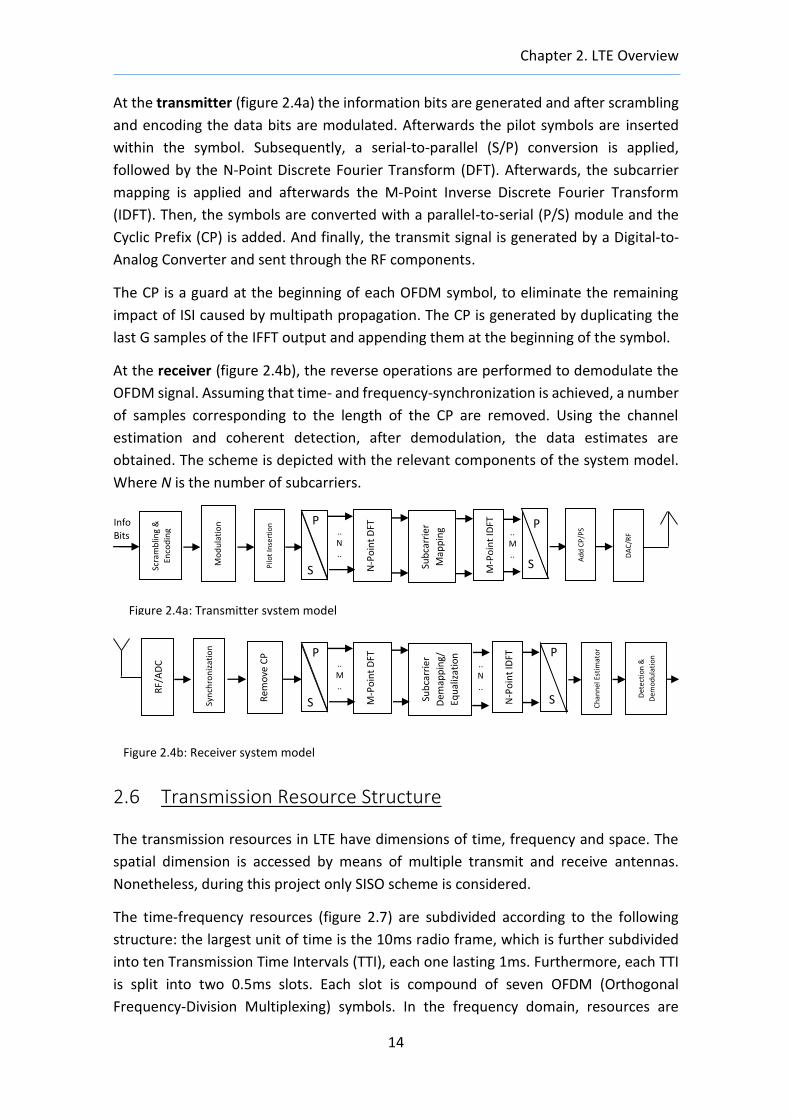
At the transmitter (figure 2.4a) the information bits are generated and after scrambling
and encoding the data bits are modulated. Afterwards the pilot symbols are inserted
within the symbol. Subsequently, a serial-to-parallel (S/P) conversion is applied,
followed by the N-Point Discrete Fourier Transform (DFT). Afterwards, the subcarrier
mapping is applied and afterwards the M-Point Inverse Discrete Fourier Transform
(IDFT). Then, the symbols are converted with a parallel-to-serial (P/S) module and the
Cyclic Prefix (CP) is added. And finally, the transmit signal is generated by a Digital-to-
Analog Converter and sent through the RF components.
The CP is a guard at the beginning of each OFDM symbol, to eliminate the remaining
impact of ISI caused by multipath propagation. The CP is generated by duplicating the
last G samples of the IFFT output and appending them at the beginning of the symbol.
At the receiver (figure 2.4b), the reverse operations are performed to demodulate the
OFDM signal. Assuming that time- and frequency-synchronization is achieved, a number
of samples corresponding to the length of the CP are removed. Using the channel
estimation and coherent detection, after demodulation, the data estimates are
obtained. The scheme is depicted with the relevant components of the system model.
Where N is the number of subcarriers.
2.6 Transmission Resource Structure
The transmission resources in LTE have dimensions of time, frequency and space. The
spatial dimension is accessed by means of multiple transmit and receive antennas.
Nonetheless, during this project only SISO scheme is considered.
The time-frequency resources (figure 2.7) are subdivided according to the following
structure: the largest unit of time is the 10ms radio frame, which is further subdivided
into ten Transmission Time Intervals (TTI), each one lasting 1ms. Furthermore, each TTI
is split into two 0.5ms slots. Each slot is compound of seven OFDM (Orthogonal
Frequency-Division Multiplexing) symbols. In the frequency domain, resources are
Scra
mb
ling
&
Enco
din
g
Mo
du
lati
on
Pilo
t In
sert
ion
N-P
oin
t D
FT
Info Bits ..
N..
Figure 2.4a: Transmitter system model
Figure 2.4b: Receiver system model
P
S Sub
carr
ier
Map
pin
g
M-P
oin
t ID
FT
S
P
Ad
d C
P/P
S
DA
C/R
F
RF/
AD
C
Syn
chro
niz
atio
n
Rem
ove
CP
M-P
oin
t D
FT
.. M ..
P
S Sub
carr
ier
Dem
app
ing/
Equ
aliz
atio
n
N-P
oin
t ID
FT
S
Ch
ann
el E
stim
ato
r
Det
ecti
on
&
Dem
od
ula
tio
n P
.. M..
.. N..
Chapter 2. LTE Overview
15
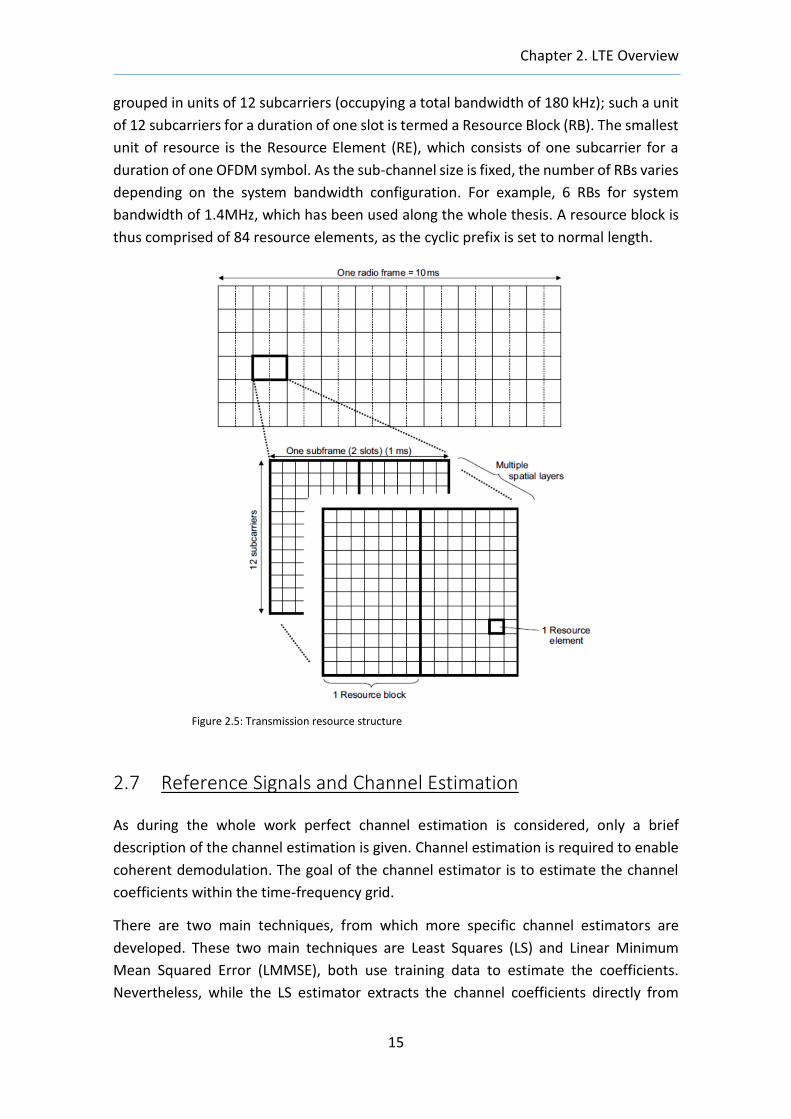
grouped in units of 12 subcarriers (occupying a total bandwidth of 180 kHz); such a unit
of 12 subcarriers for a duration of one slot is termed a Resource Block (RB). The smallest
unit of resource is the Resource Element (RE), which consists of one subcarrier for a
duration of one OFDM symbol. As the sub-channel size is fixed, the number of RBs varies
depending on the system bandwidth configuration. For example, 6 RBs for system
bandwidth of 1.4MHz, which has been used along the whole thesis. A resource block is
thus comprised of 84 resource elements, as the cyclic prefix is set to normal length.
2.7 Reference Signals and Channel Estimation
As during the whole work perfect channel estimation is considered, only a brief
description of the channel estimation is given. Channel estimation is required to enable
coherent demodulation. The goal of the channel estimator is to estimate the channel
coefficients within the time-frequency grid.
There are two main techniques, from which more specific channel estimators are
developed. These two main techniques are Least Squares (LS) and Linear Minimum
Mean Squared Error (LMMSE), both use training data to estimate the coefficients.
Nevertheless, while the LS estimator extracts the channel coefficients directly from
Figure 2.5: Transmission resource structure
Chapter 2. LTE Overview
16
training data, LMMSE requires in addition a priori knowledge of the statistics of the
channel. The working principle of training data is to extract channel coefficients from
received symbols by using transmit symbols known at RX (Reception). These known
symbols can be placed in two different ways:
Regularly on a time-frequency lattice as pilots
At the beginning of the packet as a preamble
Regarding the system requirements we use different type of training data. Nevertheless,
there are systems, such as the standard IEEE 802.11a WiFi, that use both types of pilot
patterns. In general, regular-pilots scheme will be used for fast fading channels, that is,
the coherence time of the channel is smaller than the block length. On the other hand,
training preamble symbol will be utilized in block-fading (slowly varying) channels.
The regular-pilots scheme has to be designed carefully to get the optimum solution. The
more pilots are placed, the better estimation it obtains, although it comes with
throughput losses and higher complexity. Hence, the designer has to deal with this
trade-off.
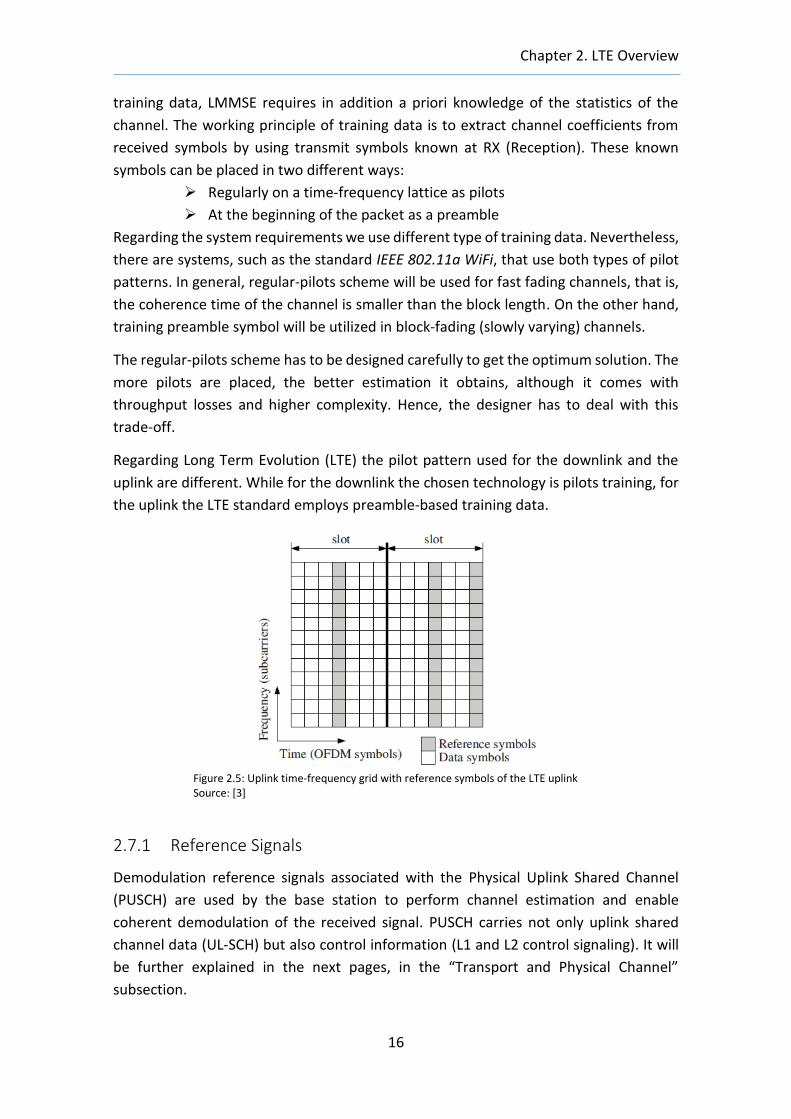
Regarding Long Term Evolution (LTE) the pilot pattern used for the downlink and the
uplink are different. While for the downlink the chosen technology is pilots training, for
the uplink the LTE standard employs preamble-based training data.
2.7.1 Reference Signals
Demodulation reference signals associated with the Physical Uplink Shared Channel
(PUSCH) are used by the base station to perform channel estimation and enable
coherent demodulation of the received signal. PUSCH carries not only uplink shared
channel data (UL-SCH) but also control information (L1 and L2 control signaling). It will
be further explained in the next pages, in the “Transport and Physical Channel”
subsection.
Figure 2.5: Uplink time-frequency grid with reference symbols of the LTE uplink Source: [3]
Chapter 2. LTE Overview
17
Due to the relevance of low PAPR and corresponding high power-amplifier efficiency for
uplink transmissions, the key points for uplink reference-signal transmission are
different in contrast with the downlink. In brief, transmitting reference signals in parallel
with other uplink transmissions from the same terminal is not convenient for the uplink.
Instead, the reference signals are time multiplexed with other uplink transmissions from
the same terminal. The structure of the reference signal then ensures a low PAPR in
these symbols and it maintains the single carrier nature of the SC-FDMA signal i.e. all
data carriers are contiguous.
2.8 Radio Resource Management
2.8.1 Introduction
The evolution of radio interface and network architecture in LTE provides new
opportunities and challenges to enhance spectral efficiency and QoS provisioning. The
Radio Resource Management (RRM) entity involves all of the strategies and algorithms
used to control parameters like transmit power, bandwidth allocation, Modulation and
Coding Scheme (MCS), Admission Control (AC), etc. These functionalities are placed at
the eNB so they can interact and make faster decisions. For example to supply efficient
QoS control, it is necessary that both AC and PS are QoS aware.
2.8.2 Admission Control
The AC is a Layer 3 (network layer) functionality whose task is to admit or reject the
request either of a new bearer or of a handover candidate. The criteria used to allow a
new radio bearer is based on ensuring an efficient utilization of the available radio
resources. In other words, new bearers will be allowed while there are radio resources
available and simultaneously, the QoS provisioning of ongoing sessions is guaranteed.
The eNB could also exchange information with neighboring cells in order to make AC
decisions. In this project, though, only local cell information is considered. Furthermore,
it is assumed that each user has only a single bearer and the number of users is
considered fixed once the simulation has started, that is, handover is not implemented
due to the lack of mobility. Therefore in this project there is no need of Admission
Control.
2.8.3 Packet Scheduling
The Packet Scheduling (PS) is an entity situated in the MAC sublayer whose purpose is
the efficient employment of the UL-SCH resources. The main role of the PS is to
distribute the time and frequency resources among the users. Such distribution takes
place via mapping of users to the available physical resources. If the system is affected
by time and frequency selective fading the PS can exploit the multi-user diversity by
Chapter 2. LTE Overview
18
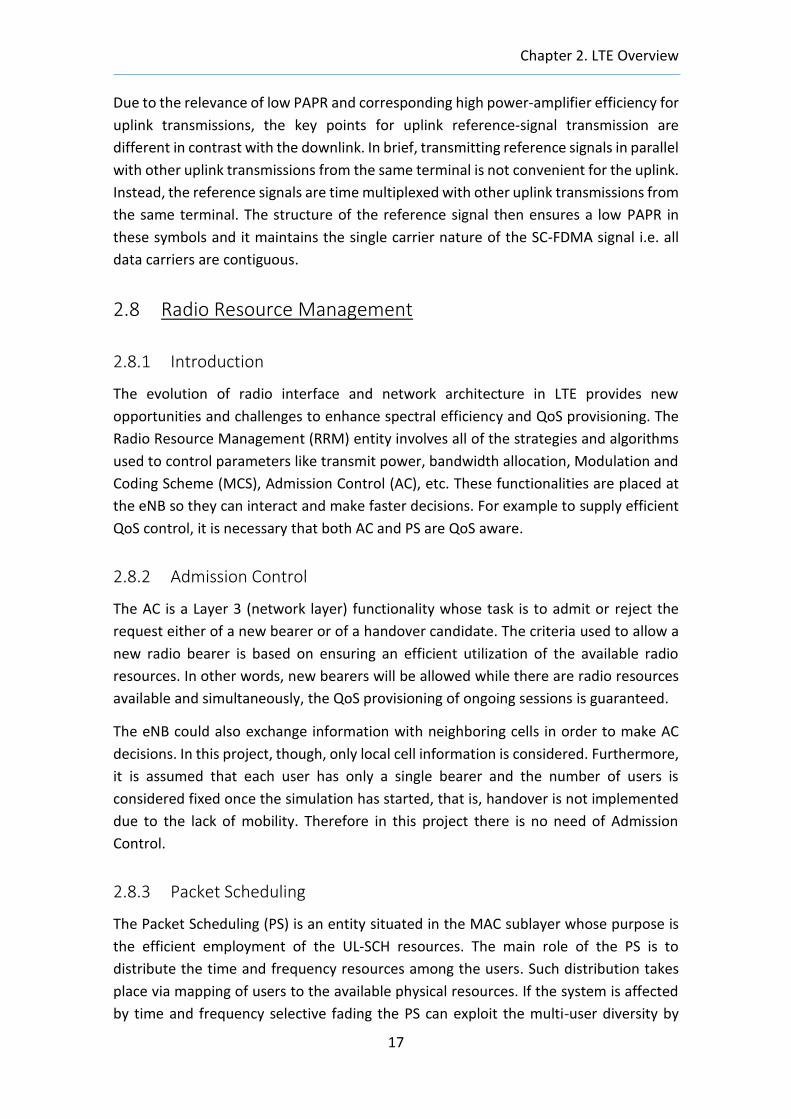
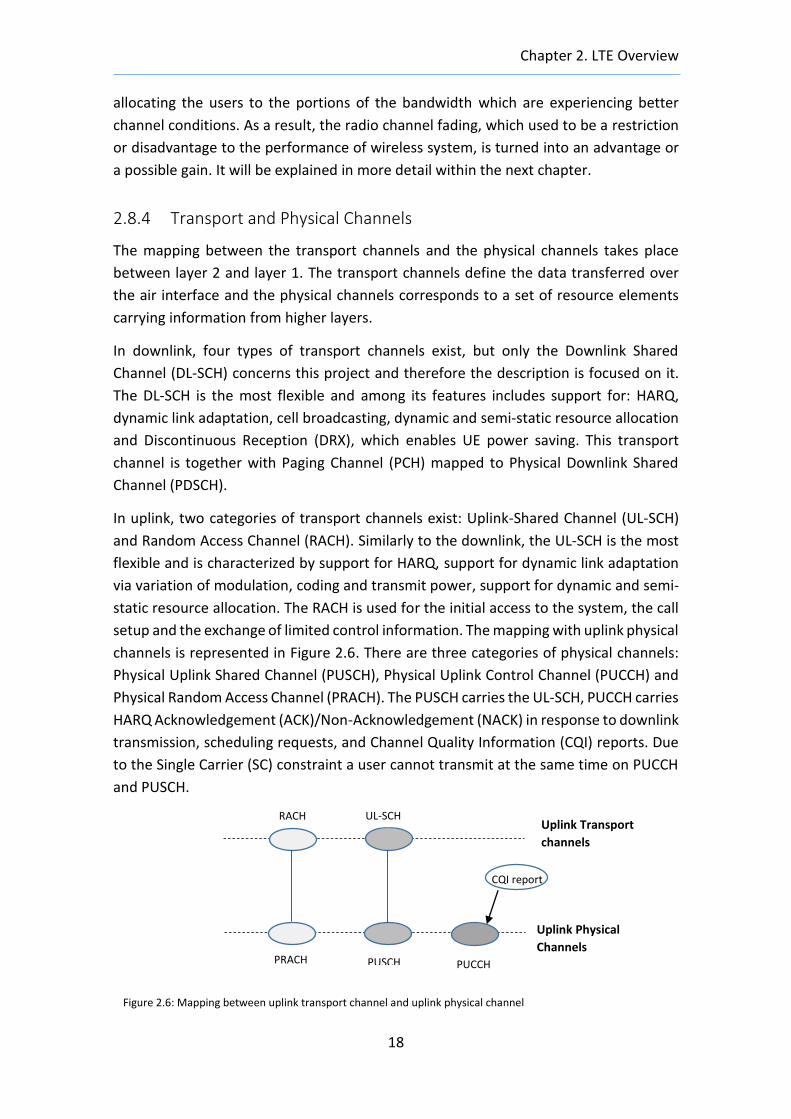
Figure 2.6: Mapping between uplink transport channel and uplink physical channel
CQI report
allocating the users to the portions of the bandwidth which are experiencing better
channel conditions. As a result, the radio channel fading, which used to be a restriction
or disadvantage to the performance of wireless system, is turned into an advantage or
a possible gain. It will be explained in more detail within the next chapter.
2.8.4 Transport and Physical Channels
The mapping between the transport channels and the physical channels takes place
between layer 2 and layer 1. The transport channels define the data transferred over
the air interface and the physical channels corresponds to a set of resource elements
carrying information from higher layers.
In downlink, four types of transport channels exist, but only the Downlink Shared
Channel (DL-SCH) concerns this project and therefore the description is focused on it.
The DL-SCH is the most flexible and among its features includes support for: HARQ,
dynamic link adaptation, cell broadcasting, dynamic and semi-static resource allocation
and Discontinuous Reception (DRX), which enables UE power saving. This transport
channel is together with Paging Channel (PCH) mapped to Physical Downlink Shared
Channel (PDSCH).
In uplink, two categories of transport channels exist: Uplink-Shared Channel (UL-SCH)
and Random Access Channel (RACH). Similarly to the downlink, the UL-SCH is the most
flexible and is characterized by support for HARQ, support for dynamic link adaptation
via variation of modulation, coding and transmit power, support for dynamic and semi-
static resource allocation. The RACH is used for the initial access to the system, the call
setup and the exchange of limited control information. The mapping with uplink physical
channels is represented in Figure 2.6. There are three categories of physical channels:
Physical Uplink Shared Channel (PUSCH), Physical Uplink Control Channel (PUCCH) and
Physical Random Access Channel (PRACH). The PUSCH carries the UL-SCH, PUCCH carries
HARQ Acknowledgement (ACK)/Non-Acknowledgement (NACK) in response to downlink
transmission, scheduling requests, and Channel Quality Information (CQI) reports. Due
to the Single Carrier (SC) constraint a user cannot transmit at the same time on PUCCH
and PUSCH.
RACH
PRACH PUSCH
UL-SCH
PUCCH
Uplink Transport
channels
Uplink Physical
Channels
Chapter 2. LTE Overview
19
2.8.5 HARQ
In LTE both retransmission functionalities Automatic Repeat reQuest (ARQ) and HARQ
are provided. ARQ provides error correction by retransmissions in acknowledged mode
at the Radio Link Control (RLC) sublayer of Layer 2. HARQ takes place in the MAC
sublayer of Layer 2 and ensures delivery between peer entities at Layer 1. In case a data
packet is not correctly received, the HARQ ensures a fast Layer 1 retransmission from
the transmitter (UE). In this way the HARQ provides robustness against link adaptation
errors (due, for example, to errors in CSI estimation and reporting) and it improves the
reliability of the channel.
The HARQ has the following characteristics:
• It uses an N-process Stop-And-Wait (SAW) protocol between the UE and the eNodeB.
• It is based on ACK/NACK messages.
• It is synchronous (in uplink) and adaptive, like in dynamic scheduling, or non-adaptive,
like in semi-persistent scheduling. Synchronous refers to the fact that retransmissions
need to occur at specific time instants while adaptive refers to the possibility of changing
transmission parameters such as resource allocation and MCS in the subsequent
retransmissions.
2.8.6 Link Adaptation and Modulation and Coding Scheme
As previously mentioned, the Link Adaptation (LA) and AMC are fundamental
functionalities in a channel affected by fading.
In general, in any cellular communications system, the quality of the received signal is
affected by different phenomena inherent to wireless environments such as path loss,
interferences, multipath propagation, Doppler Shifts, etc. The objective of LA is to adapt
the resource allocation to the particular user channel conditions, matching the
transmission parameters such as MCS, pre-coding as well as transmission power control
for physical channels, in order to guarantee the required QoS of each UE.
In the transmissions, the eNodeB does not know the actual channel conditions of the
UE, and for this reason, it requires a Channel Quality Indicator (CQI) feedback from the
receiver to select an appropriate MCS. This feedback in the uplink is provided by
Sounding Reference Signals (SRS). The modulation scheme chosen for LTE is composed
by different-order QAM. In general, the eNodeB can select QPSK, 16-QAM, and 64-QAM
schemes and different code rates to provide the higher data throughput for the Block
Error Rate (BLER) target. Choosing a low order modulation, the eNodeB guarantees a
more robust transmission but a lower bit rate. In contrast, selecting higher-order
modulation the eNodeB allows higher data rate and consequently lower robustness.
Chapter 2. LTE Overview
20
eNB UE
UL Grant; PC commands, UE to
PRB mapping, Transport Block
Size (TBS) allocation
SRS; BSR
Power Headroom reports
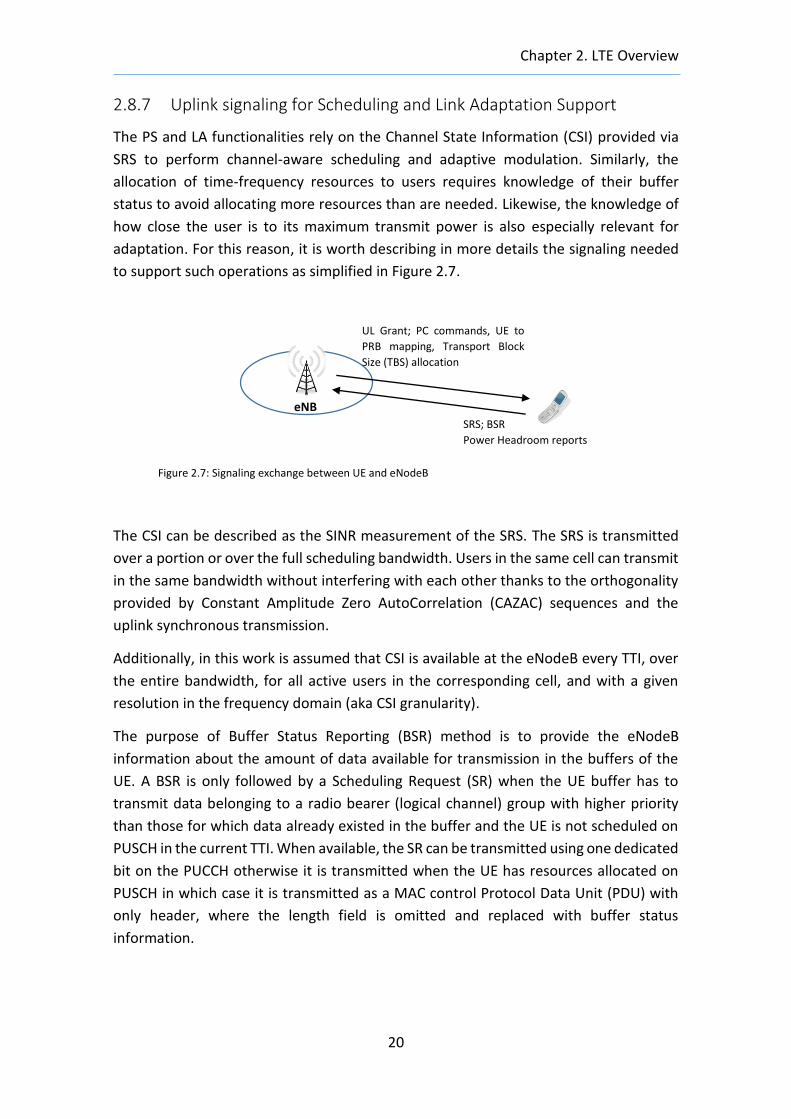
2.8.7 Uplink signaling for Scheduling and Link Adaptation Support
The PS and LA functionalities rely on the Channel State Information (CSI) provided via
SRS to perform channel-aware scheduling and adaptive modulation. Similarly, the
allocation of time-frequency resources to users requires knowledge of their buffer
status to avoid allocating more resources than are needed. Likewise, the knowledge of
how close the user is to its maximum transmit power is also especially relevant for
adaptation. For this reason, it is worth describing in more details the signaling needed
to support such operations as simplified in Figure 2.7.
The CSI can be described as the SINR measurement of the SRS. The SRS is transmitted
over a portion or over the full scheduling bandwidth. Users in the same cell can transmit
in the same bandwidth without interfering with each other thanks to the orthogonality
provided by Constant Amplitude Zero AutoCorrelation (CAZAC) sequences and the
uplink synchronous transmission.
Additionally, in this work is assumed that CSI is available at the eNodeB every TTI, over
the entire bandwidth, for all active users in the corresponding cell, and with a given
resolution in the frequency domain (aka CSI granularity).
The purpose of Buffer Status Reporting (BSR) method is to provide the eNodeB
information about the amount of data available for transmission in the buffers of the
UE. A BSR is only followed by a Scheduling Request (SR) when the UE buffer has to
transmit data belonging to a radio bearer (logical channel) group with higher priority
than those for which data already existed in the buffer and the UE is not scheduled on
PUSCH in the current TTI. When available, the SR can be transmitted using one dedicated
bit on the PUCCH otherwise it is transmitted when the UE has resources allocated on
PUSCH in which case it is transmitted as a MAC control Protocol Data Unit (PDU) with
only header, where the length field is omitted and replaced with buffer status
information.
Figure 2.7: Signaling exchange between UE and eNodeB
21
Chapter 3
Modelling and general considerations
3.1 General considerations on Packet Scheduling
In a real propagation environment the radio channel is affected by fast fading variations
due to the scattering of multiple paths, Doppler shifts and the constructive or
destructive recombination at the receiver. Such variations take place on top of slower
fading variations due to, for example, the location.
The Packet Scheduler (PS) is in charge of the allocation of system resources to users over
the shared data channel. In such a scenario where different users want to transmit over
a wireless channel, the PS aims to achieve spectral efficiency by utilizing the variability
of the wireless channel and the offered traffic data. The PS requires information about
the channel quality to be able to exploit time, space, frequency and multi-user diversity.
The latter is of special interest in this thesis; multi-user diversity exploits the statistical
independence of the channel fading by multiple users within the same cell or coverage
area.
The multi-user diversity offers the possibility to allocate resources to users that are
experiencing good channel conditions. Therefore, in a scenario with multiple users
suffering independent fading effects, there is a high possibility to locate a user with good
channel quality. Thus, the advantages are twofold:
It makes possible higher data rates, that is, adaptive modulation is enabled and
under good channel quality appropriate MCS will be selected and consequently
higher data rates will be achieved. In fact, this multi-user gain can be cast as
double-logarithmic growth of the network throughput with the number of users.
As there are multiple users and each experiencing independent fading, there will
be always a user with better channel conditions. That is, it offers immunity to
frequency-selective fading effect as those users suffering of very bad channel will
never be severed.
Nevertheless multi-user diversity gain appears to be upper bounded due to the
proportional growth of the control overhead with the number of users in the system.
It is worth mentioning that as opposed to the Downlink where the adoption of the
OFDMA makes the exploitation of the frequency diversity possible, in Uplink the
transmission technology is SC-FDMA, which restricts such possibility but still leaves the
Chapter 3. Modelling and general considerations
22
opportunity to achieve multi-user diversity. The employment of this technique forces
the PS to assign contiguously the frequency resources among the users.
3.1.1 Model of a packet scheduler
The generic function of a PS is to distribute data on a shared set of physical resources.
In general, scheduling algorithms can make use of two types of measurement
information to make the scheduling decisions, namely channel-state information and
traffic measurements (volume and priority). These are obtained either by direct
measurements at the eNodeB or via feedback signaling channels, or a combination of
both. The amount of feedback used is an important factor, as the availability of accurate
channel state and traffic information enables maximizing the data rate in one direction
but at the cost of more overhead in the other. For that reason, a trade-off is required.
This fundamental trade-off, which is common to all feedback-based resource scheduling
schemes, is particularly important in Frequency Division Duplex (FDD) operation where
uplink-downlink reciprocity of the radio channels cannot be assumed.
Based on the reported information, the PS aims to handling the different requirements
of all the UEs in the cells under its control to ensure that sufficient radio transmission
resources are allocated to each UE within acceptable delay in order to satisfy their QoS
requirements in a spectrally-efficient way. This process is not completely standardized
as it is placed inside the eNodeB, allowing for specific algorithms to be developed which
can be optimized for specific scenarios. Nevertheless, the key inputs available to the PS
are common, and generally some typical approaches can be identified.
The PS, deployed at the eNodeB, allocates resources with a granularity of one TTI and
one RB in the time and frequency domain, respectively. It works under the assumption
that OFDMA ideally provides no inter-channel interference. The resource assignment for
each UE usually establishes its decision on a metric. That approach has several
advantages and the reasons are given in the next subsection. The allocation decision is
simple: the k-th RB is allocated to the j-th user if its metric 𝑚𝑗,𝑘 is the biggest one, i.e., if
it satisfies the equation:
𝑚𝑗,𝑘 = max𝑖
{𝑚𝑖,𝑘} (3.1)
In order to compute these metrics, which can be interpreted as a prioritization of some
users within a certain time-frequency grid, different information is used:
Channel quality: reported CQI values are used in channel-aware strategies to
allocate resources to users with better instantaneous channel conditions (e.g.
the higher the expected throughput, the higher the metric).
Resource allocation history: information about the past performance is used to
guarantee a certain fairness (e.g. the lower the past achieved throughput, the
higher the metric).
Chapter 3. Modelling and general considerations
23
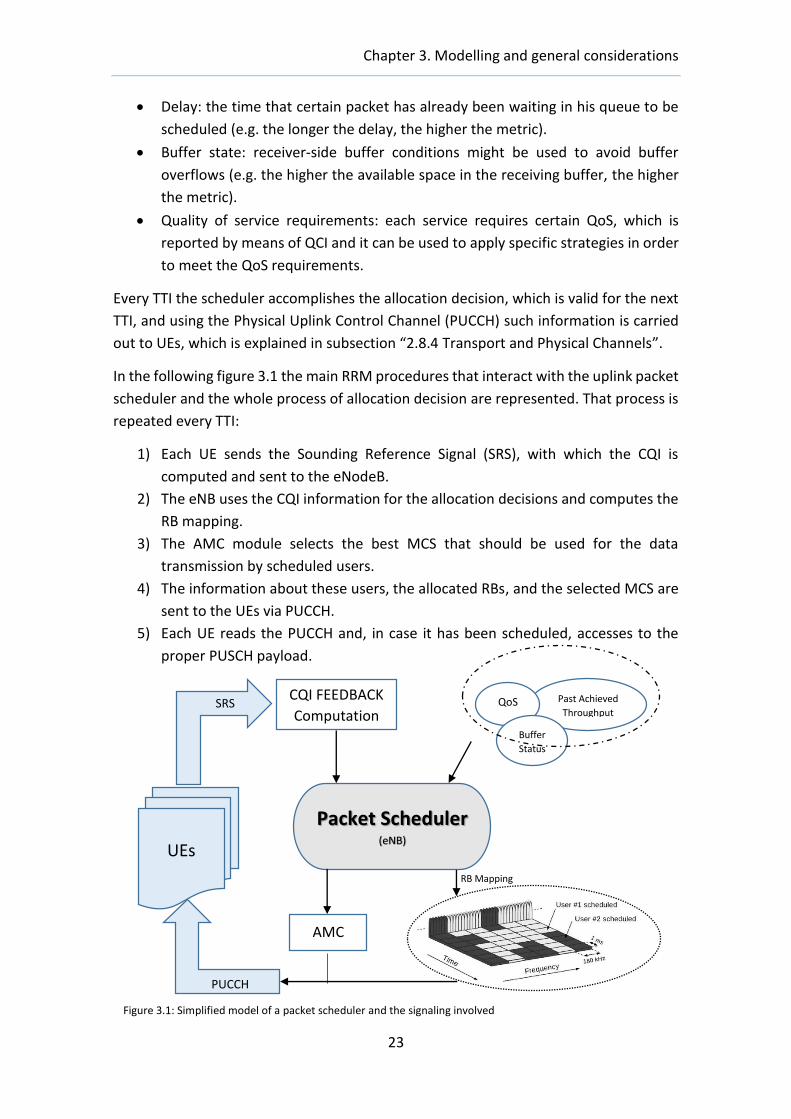
Figure 3.1: Simplified model of a packet scheduler and the signaling involved
Past Achieved
Throughput
Delay: the time that certain packet has already been waiting in his queue to be
scheduled (e.g. the longer the delay, the higher the metric).
Buffer state: receiver-side buffer conditions might be used to avoid buffer
overflows (e.g. the higher the available space in the receiving buffer, the higher
the metric).
Quality of service requirements: each service requires certain QoS, which is
reported by means of QCI and it can be used to apply specific strategies in order
to meet the QoS requirements.
Every TTI the scheduler accomplishes the allocation decision, which is valid for the next
TTI, and using the Physical Uplink Control Channel (PUCCH) such information is carried
out to UEs, which is explained in subsection “2.8.4 Transport and Physical Channels”.
In the following figure 3.1 the main RRM procedures that interact with the uplink packet
scheduler and the whole process of allocation decision are represented. That process is
repeated every TTI:
1) Each UE sends the Sounding Reference Signal (SRS), with which the CQI is
computed and sent to the eNodeB.
2) The eNB uses the CQI information for the allocation decisions and computes the
RB mapping.
3) The AMC module selects the best MCS that should be used for the data
transmission by scheduled users.
4) The information about these users, the allocated RBs, and the selected MCS are
sent to the UEs via PUCCH.
5) Each UE reads the PUCCH and, in case it has been scheduled, accesses to the
proper PUSCH payload.
Packet Scheduler (eNB)
QoS
Buffer
Status
AMC
PUCCH
CQI FEEDBACK
Computation
UEs
RB Mapping
SRS
Chapter 3. Modelling and general considerations
24
3.1.2 Key Design Aspects
In order to design properly a dynamic fast packet scheduling algorithm the following key
aspects should be taken into account. The main differences between different
algorithms reside, in general, in one or several of these characteristics.
Complexity and Scalability: an LTE packet scheduler works with a time
granularity of 1ms that means that it has to take allocation decisions every 1ms,
i.e., 1 TTI. Therefore complexity and scalability are key requirements for limiting
computing time and memory usage. Finding the best allocation decision through
complex and non-linear optimization problems or through an exhaustive
research over all the possible combinations is not affordable in terms of
computational cost and time. That is the main reason why scheduler usually
apply this approach. Let N and R be the number of active users in the current TTI
and the number of available RBs, respectively. The scheduler has to calculate
𝑀 = 𝑁 𝑥 𝑅 metrics every TTI. This approach guarantees scalability thanks to the
linear dependence on the number of resource blocks and users.
Spectral efficiency: Effective use of the resources is one of the main objectives
to be achieved. To this purpose, several types of performance measurements
can be considered: for example, the spectral efficiency (expressed in bit/s/Hz)
can be maximized by always serving users that are experiencing the best channel
conditions because in that case high modulation order will be selected in the
AMC.
Fairness: It determines whether users are receiving a fair share of system
resources, it must be taken into account in order to guarantee a minimum
performance also to the users experiencing bad channel conditions. It is
measured in our results with the equation 4.1 presented in following chapter.
QoS Provisioning: It is a key factor in next generation mobile networks. As
aforementioned, QoS constraints depend on the service and they are usually
mapped into some low-layer parameters such as minimum guaranteed bitrate,
maximum delivering delay, and packet loss rate. As a consequence, QoS-aware
schedulers are a major feature in all-IP architectures.
Energy consumption: Energy saving is a required feature for battery supplied
terminals.
3.2 Simulator architecture
As previously introduced, the Vienna LTE simulator is a MATLAB program that allows for
the investigation, test and optimization of algorithms and procedures implemented on
the physical layer.
Chapter 3. Modelling and general considerations
25
As it is explained on [2] and [3], the link level simulator is composed of three basic
structural parts: transmitter, channel model and receiver. The transmitter and receiver
blocks are interconnected by the channel, through which the data is transmitted. For
simplicity signaling and uplink feedback are assumed error-free. That hypothesis of
error-free signaling is quite realistic since signaling is stronger protected than data, by
means of lower coding rates and/or lower-order modulations. In addition, those errors
in signaling and feedback take place only under really bad channel conditions, on which
the presented investigations are not going to be focused.
More details about the description of the Vienna LTE Uplink physical layer Simulator can
found in [3]. The structure of the transmitter is based on the TS36’ standard series [6-
8].
The PS receives the feedback by means of Channel Quality Index (CQI), which is
employed to distributes resources (RBs) to UEs and chooses the optimal MCS (code rate
and modulation scheme ranging from QPSK to 16-, 64-QAM) for a given BLER target. The
simulator is equipped with algorithms that compute the feedback indicators from the
estimated channel coefficients, more information about those specific feedback
algorithms can be found under [9].
3.3 Traffic models
In order to carry out the investigation of the PS performance in a traffic-mix scenario
several traffic models are implemented. These traffic models emulate services
employed by the users, which have some QoS requirements. In our scenario each user
is randomly assigned to one traffic model with certain probability based on [4].
Figure 3.3: Vienna LTE link level simulator structure.
Source: [3]
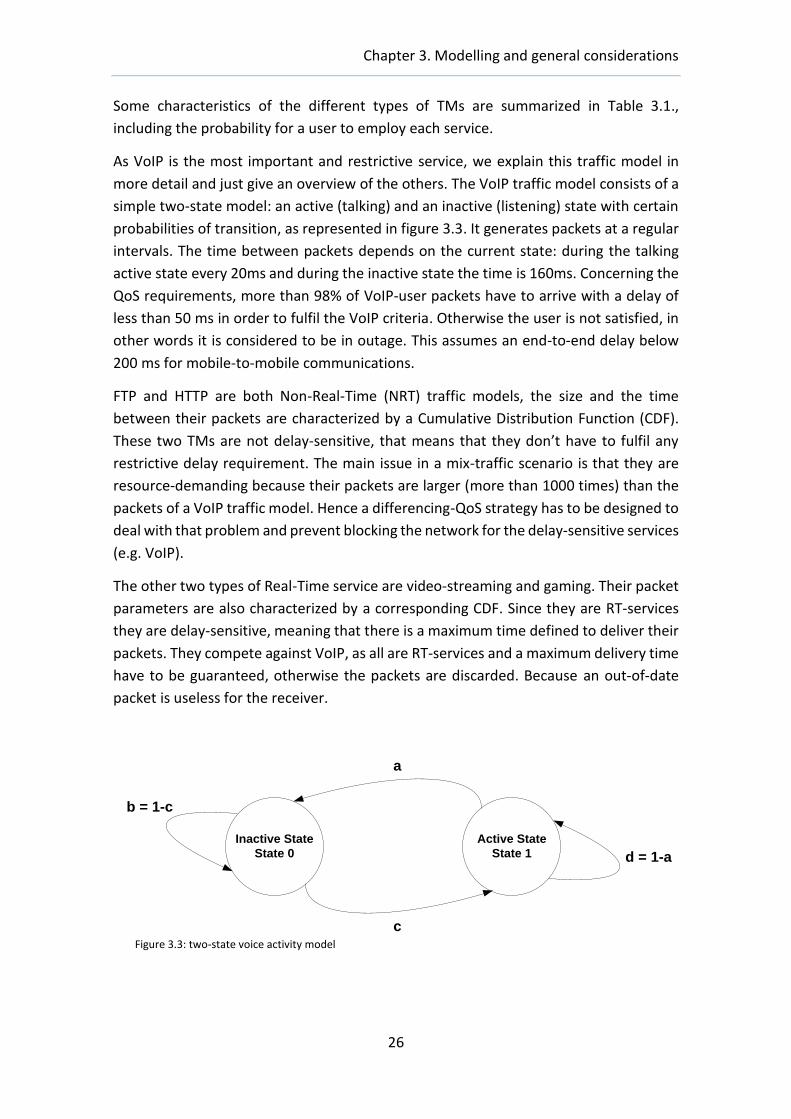
Chapter 3. Modelling and general considerations
26
Some characteristics of the different types of TMs are summarized in Table 3.1.,
including the probability for a user to employ each service.
As VoIP is the most important and restrictive service, we explain this traffic model in
more detail and just give an overview of the others. The VoIP traffic model consists of a
simple two-state model: an active (talking) and an inactive (listening) state with certain
probabilities of transition, as represented in figure 3.3. It generates packets at a regular
intervals. The time between packets depends on the current state: during the talking
active state every 20ms and during the inactive state the time is 160ms. Concerning the
QoS requirements, more than 98% of VoIP-user packets have to arrive with a delay of
less than 50 ms in order to fulfil the VoIP criteria. Otherwise the user is not satisfied, in
other words it is considered to be in outage. This assumes an end-to-end delay below
200 ms for mobile-to-mobile communications.
FTP and HTTP are both Non-Real-Time (NRT) traffic models, the size and the time
between their packets are characterized by a Cumulative Distribution Function (CDF).
These two TMs are not delay-sensitive, that means that they don’t have to fulfil any
restrictive delay requirement. The main issue in a mix-traffic scenario is that they are
resource-demanding because their packets are larger (more than 1000 times) than the
packets of a VoIP traffic model. Hence a differencing-QoS strategy has to be designed to
deal with that problem and prevent blocking the network for the delay-sensitive services
(e.g. VoIP).
The other two types of Real-Time service are video-streaming and gaming. Their packet
parameters are also characterized by a corresponding CDF. Since they are RT-services
they are delay-sensitive, meaning that there is a maximum time defined to deliver their
packets. They compete against VoIP, as all are RT-services and a maximum delivery time
have to be guaranteed, otherwise the packets are discarded. Because an out-of-date
packet is useless for the receiver.
Inactive State
State 0
Active State
State 1
a
c
d = 1-a
b = 1-c
Figure 3.3: two-state voice activity model
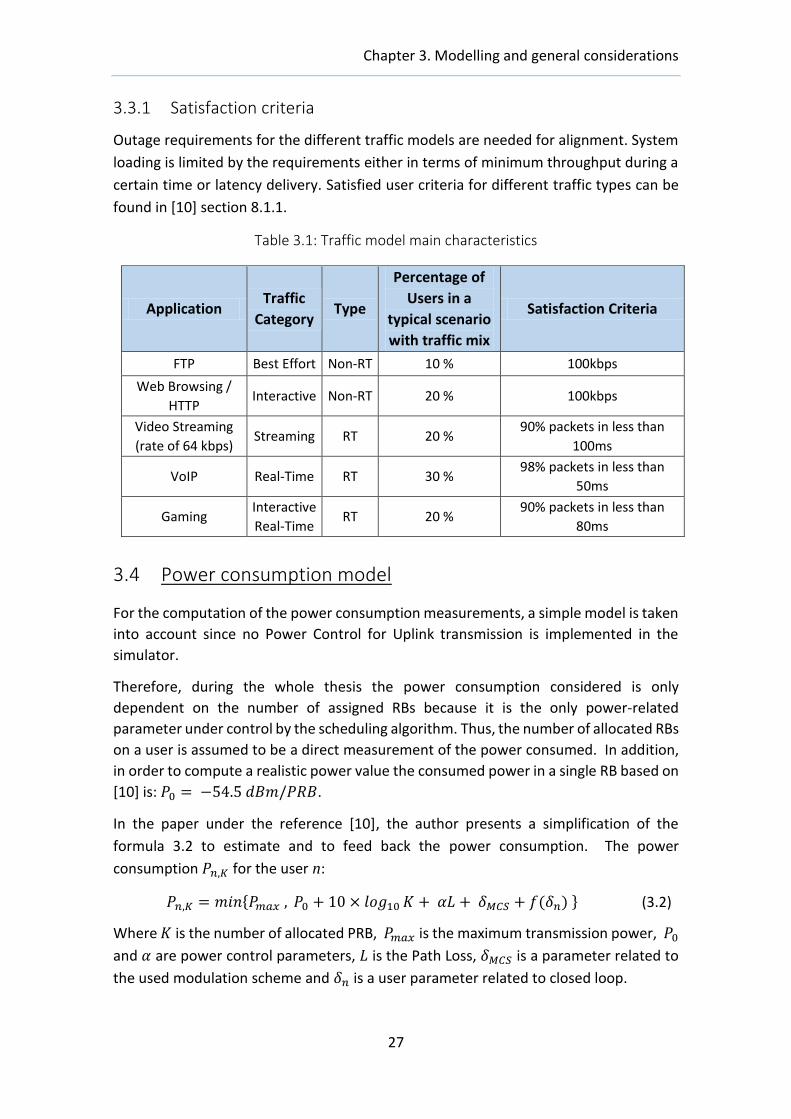
Chapter 3. Modelling and general considerations
27
3.3.1 Satisfaction criteria
Outage requirements for the different traffic models are needed for alignment. System
loading is limited by the requirements either in terms of minimum throughput during a
certain time or latency delivery. Satisfied user criteria for different traffic types can be
found in [10] section 8.1.1.
Table 3.1: Traffic model main characteristics
Application Traffic
Category Type
Percentage of
Users in a
typical scenario
with traffic mix
Satisfaction Criteria
FTP Best Effort Non-RT 10 % 100kbps
Web Browsing /
HTTP Interactive Non-RT 20 % 100kbps
Video Streaming
(rate of 64 kbps) Streaming RT 20 %
90% packets in less than
100ms
VoIP Real-Time RT 30 % 98% packets in less than
50ms
Gaming Interactive
Real-Time RT 20 %
90% packets in less than
80ms
3.4 Power consumption model
For the computation of the power consumption measurements, a simple model is taken
into account since no Power Control for Uplink transmission is implemented in the
simulator.
Therefore, during the whole thesis the power consumption considered is only
dependent on the number of assigned RBs because it is the only power-related
parameter under control by the scheduling algorithm. Thus, the number of allocated RBs
on a user is assumed to be a direct measurement of the power consumed. In addition,
in order to compute a realistic power value the consumed power in a single RB based on
[10] is: 𝑃0 = −54.5 𝑑𝐵𝑚/𝑃𝑅𝐵.
In the paper under the reference [10], the author presents a simplification of the
formula 3.2 to estimate and to feed back the power consumption. The power
consumption 𝑃𝑛,𝐾 for the user n:
𝑃𝑛,𝐾 = 𝑚𝑖𝑛{𝑃𝑚𝑎𝑥 , 𝑃0 + 10 × 𝑙𝑜𝑔10 𝐾 + 𝛼𝐿 + 𝛿𝑀𝐶𝑆 + 𝑓(𝛿𝑛) } (3.2)
Where 𝐾 is the number of allocated PRB, 𝑃𝑚𝑎𝑥 is the maximum transmission power, 𝑃0
and 𝛼 are power control parameters, 𝐿 is the Path Loss, 𝛿𝑀𝐶𝑆 is a parameter related to
the used modulation scheme and 𝛿𝑛 is a user parameter related to closed loop.
Chapter 3. Modelling and general considerations
28
In the previous equation 3.2, the parameter 𝛿𝑀𝐶𝑆 is a channel dependent parameter
signaled by the Radio Resources Control (RRC), but it can be set to zero. In this case,
since the other are either user dependent or cell dependent parameters, the author
deduces that the transmission power is proportional to the allocated RB on the user.
29
Chapter 4
Comparison of different Scheduling-algorithms
4.1 Introduction
In this section different schedulers are compared in terms of their achieved throughput,
fairness and energy efficiency. The schedulers taken into account in this first comparison
are selected in order to find the best one as a good starting point to develop more
complex algorithms. For that reason, a broad range of schedulers with different
objectives is chosen.
In this first scenario there is no traffic models (i.e. full-buffer traffic) and the schedulers
are not QoS-aware. The scenario is supposed to be as simple as possible in order to focus
on the allocation strategies and gradually, within the next steps, the scenario will
become more complex and more inputs for the scheduling algorithms will be used. The
schedulers selected for that first comparison are:
MaxMin, maximizes the minimum of the user throughputs
Semi-static Round Robin, fixed pattern but rate adaptation
Resource Fair, it assigns the same number of RBs to all UEs
Proportional Fair
Maximum Throughput
BCQI: Best Channel Quality Indicator
These scheduling-strategies are in the next subsection in more detail explained.
4.1.1 Fairness
We quantify fairness using Jain’s Fairness Index [11]. It is used to determine whether
users are receiving a fair share of system resources. The index is computed with the
following formula:
𝐽(𝑻) =(∑ 𝑻(𝑛)𝑁
𝑛=1 )2
𝑁 ∑ 𝑻(𝑛)2𝑁𝑛=1
(4.1)
Where T is a user throughput vector, n is the user and N is the total number of users.
When the resources are totally fairly distributed, that is, when all the users achieve the
same throughputs, Jain’s Fairness Index is equal one. On the other hand with lower
fairness, Jain’s fairness index approaches 1/N. In the results absolute fairness is
Chapter 4. Comparison of different Scheduling-algorithms
30
considered, meaning that the SNR differences are not taken into account in the fairness
measure.
4.2 Scheduling Strategies
In this section, the different allocation strategies used for this comparison are
illustrated. They will be addressed in an increasing-complexity order.
4.2.1 Round Robin
This is a channel-unaware strategy making it a bad solution for a real LTE or any time-
variant wireless channel system. However, it is employed as a basic (worst-case)
reference. Furthermore it can be used in association with channel-aware strategies in
order to deliver better system performance.
This scheduling strategy lets users take turn in using the shared resources, without
taking the instantaneous channel conditions into account. It can be seen as fair
scheduling in the sense that the same amount of radio resources is provided to each
user. However, RR scheduling is not fair in the sense of providing the same service
quality to all users. Since more radio resources should be provided to users with worse
channel conditions. Furthermore, it is evident that it cannot be an efficient allocation
strategy because it assigns resources to users a priori even when they have no data to
transmit.
However, in this investigation a semi-static version of the round robin is implemented
meaning that the assigning pattern is fixed but there is rate adaptation.
4.2.2 Best Channel Quality Indicator
It assigns resources to the user with the instantaneously best radio-channel conditions.
As the highest quality channel is selected, a correspondingly higher data rate can be
achieved by applying adaptive rate control. Therefore this strategy aims at maximizing
the data rate by allocating in each RB the user that can perform the highest throughput
in the current TTI.
The allocation algorithm just finds the maximum CQI of each RB looking over all the
users. Is it clear that with such a strategy the average throughput is maximized but on
the other hand, the users with poor channel conditions (e.g. cell-edge users) will get a
low percentage of the available resources or in extreme case they will never be
scheduled. Therefore it performs unfair resources sharing.
Chapter 4. Comparison of different Scheduling-algorithms
31
4.2.3 Maximum Throughput
In the paper [12] the author formulates a sum rate maximization resource allocation
strategy that performs similar results in the same way that the Best-CQI strategy does,
as it will be explained in the simulation results subsection. However, this algorithm is
also presented because it will be used as a starting point for the next ones, only some
additional constraints will have to be imposed.
4.2.4 Resource Fair
The strategy of an RF scheduler is to achieve a high throughput while assuring a
minimum level of fairness, so that every UE receives a little amount of resources. This
can be easily achieved by imposing an additional constraint to the optimization problem
of the maximum throughput strategy so that each user receives the same amount of
resources. If the reader is interested in more details, those can be found also in [12].
4.2.5 Proportional Fair
A common approach to deliver a compromise between requirements on fairness and
spectral efficiency is the use of Proportional Fair (PF) scheduler.
A good strategy to implement it is through a metric algorithm. It is based on the relation
between the past average throughput and the expected rate. So that the past average
throughput 𝑅𝑖̅̅ ̅(𝑡) acts as weighting factor of the expected rate. In our algorithm this
user throughput is averaged with an exponential window with a decay constant of 10
subframes. With such an allocation policy even users with really bad channel conditions
will be scheduled within a certain amount of time. The employed metric is:
𝑚𝑖,𝑘𝑃𝐹 =
𝑑𝑘𝑖 (𝑡)
𝑅𝑖̅̅ ̅(𝑡−1) (4.2)
where 𝑅𝑖̅̅ ̅(𝑡) represents the past average throughput experienced by the i-th user at
time t and 𝑑𝑘𝑖 (𝑡) is the achievable throughput expected for the i-th user at the t-th TTI.
In the scheduler a slightly suboptimal reduced complexity algorithm is implemented,
based on [15], which fulfils the conditions for a multicarrier scheduler to be
proportionally fair.
4.2.6 MaxMin Scheduler
The aim of a MaxMin scheduler is to maximize the minimum of the user throughput. The
optimization problem and the recasting of the problem into a linear integer problem is
out of scope of this work, but it can be found in [12].
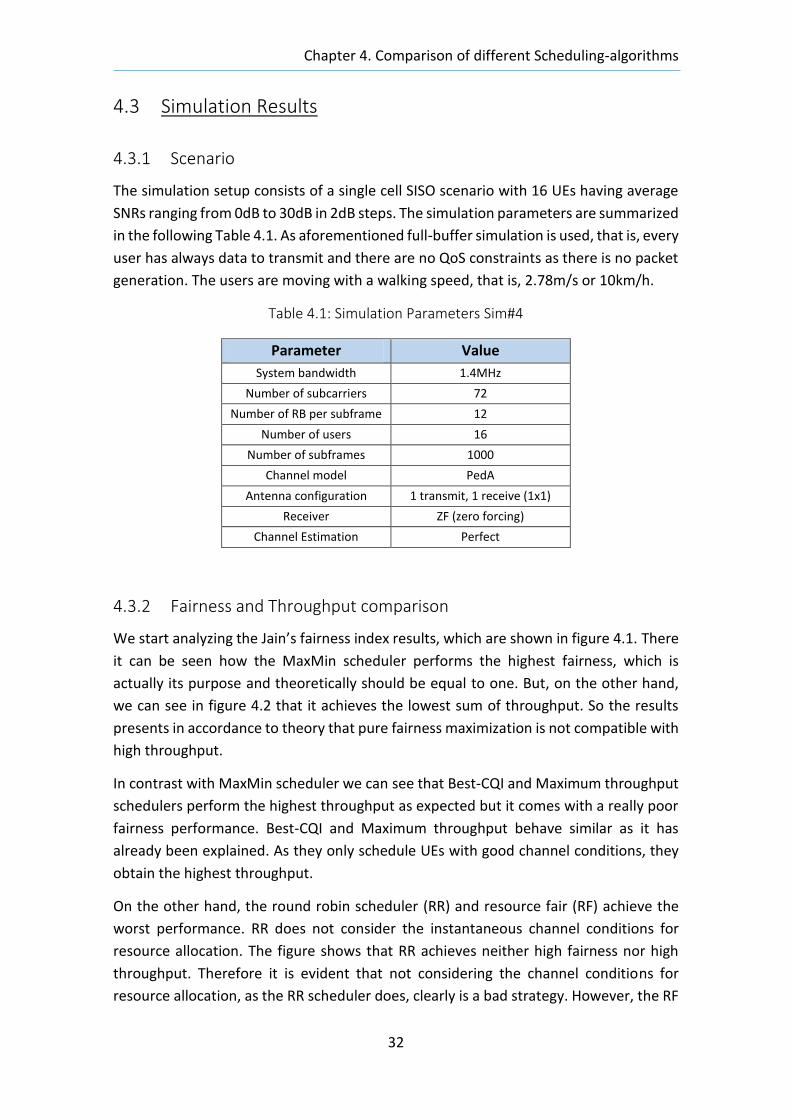
Chapter 4. Comparison of different Scheduling-algorithms
32
4.3 Simulation Results
4.3.1 Scenario
The simulation setup consists of a single cell SISO scenario with 16 UEs having average
SNRs ranging from 0dB to 30dB in 2dB steps. The simulation parameters are summarized
in the following Table 4.1. As aforementioned full-buffer simulation is used, that is, every
user has always data to transmit and there are no QoS constraints as there is no packet
generation. The users are moving with a walking speed, that is, 2.78m/s or 10km/h.
Table 4.1: Simulation Parameters Sim#4
Parameter Value
System bandwidth 1.4MHz
Number of subcarriers 72
Number of RB per subframe 12
Number of users 16
Number of subframes 1000
Channel model PedA
Antenna configuration 1 transmit, 1 receive (1x1)
Receiver ZF (zero forcing)
Channel Estimation Perfect
4.3.2 Fairness and Throughput comparison
We start analyzing the Jain’s fairness index results, which are shown in figure 4.1. There
it can be seen how the MaxMin scheduler performs the highest fairness, which is
actually its purpose and theoretically should be equal to one. But, on the other hand,
we can see in figure 4.2 that it achieves the lowest sum of throughput. So the results
presents in accordance to theory that pure fairness maximization is not compatible with
high throughput.
In contrast with MaxMin scheduler we can see that Best-CQI and Maximum throughput
schedulers perform the highest throughput as expected but it comes with a really poor
fairness performance. Best-CQI and Maximum throughput behave similar as it has
already been explained. As they only schedule UEs with good channel conditions, they
obtain the highest throughput.
On the other hand, the round robin scheduler (RR) and resource fair (RF) achieve the
worst performance. RR does not consider the instantaneous channel conditions for
resource allocation. The figure shows that RR achieves neither high fairness nor high
throughput. Therefore it is evident that not considering the channel conditions for
resource allocation, as the RR scheduler does, clearly is a bad strategy. However, the RF
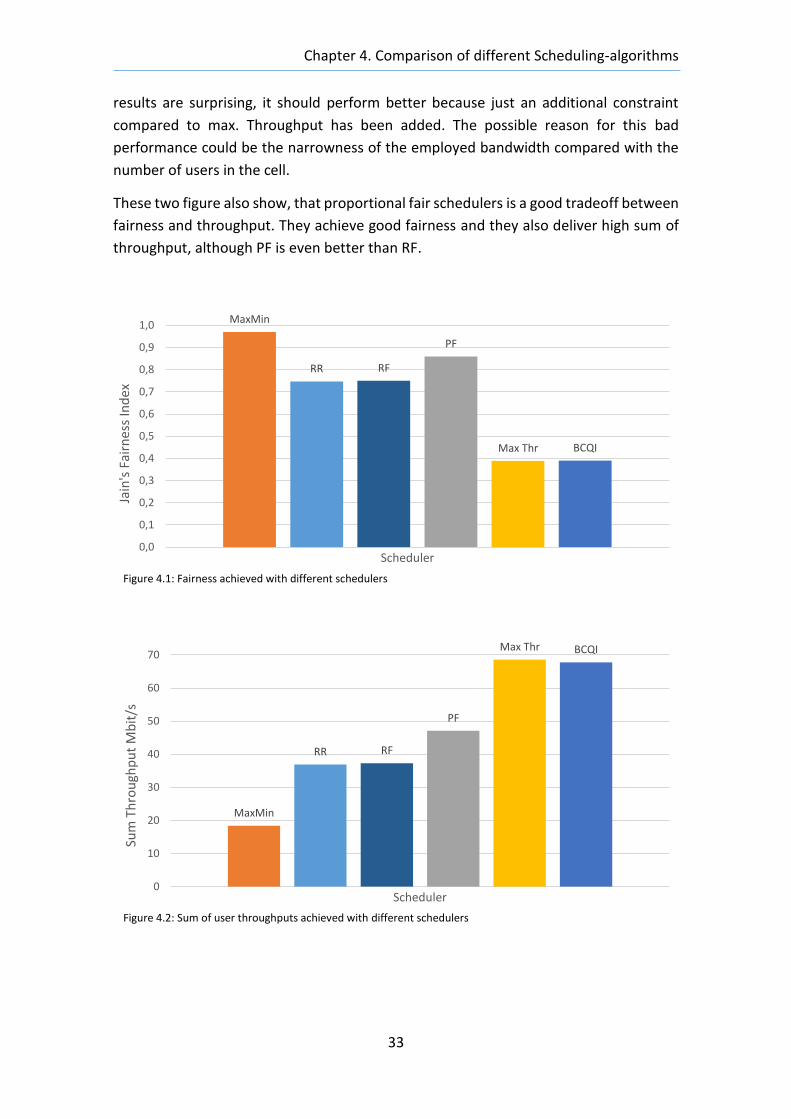
Chapter 4. Comparison of different Scheduling-algorithms
33
Figure 4.1: Fairness achieved with different schedulers
results are surprising, it should perform better because just an additional constraint
compared to max. Throughput has been added. The possible reason for this bad
performance could be the narrowness of the employed bandwidth compared with the
number of users in the cell.
These two figure also show, that proportional fair schedulers is a good tradeoff between
fairness and throughput. They achieve good fairness and they also deliver high sum of
throughput, although PF is even better than RF.
MaxMin
RR RF
PF
Max Thr BCQI
0,0
0,1
0,2
0,3
0,4
0,5
0,6
0,7
0,8
0,9
1,0
Jain
's F
airn
ess
Ind
ex
Scheduler
MaxMin
RR RF
PF
Max Thr BCQI
0
10
20
30
40
50
60
70
Sum
Th
rou
ghp
ut
Mb
it/s
Scheduler
Figure 4.2: Sum of user throughputs achieved with different schedulers
Figure 4.1: Fairness achieved with different schedulers
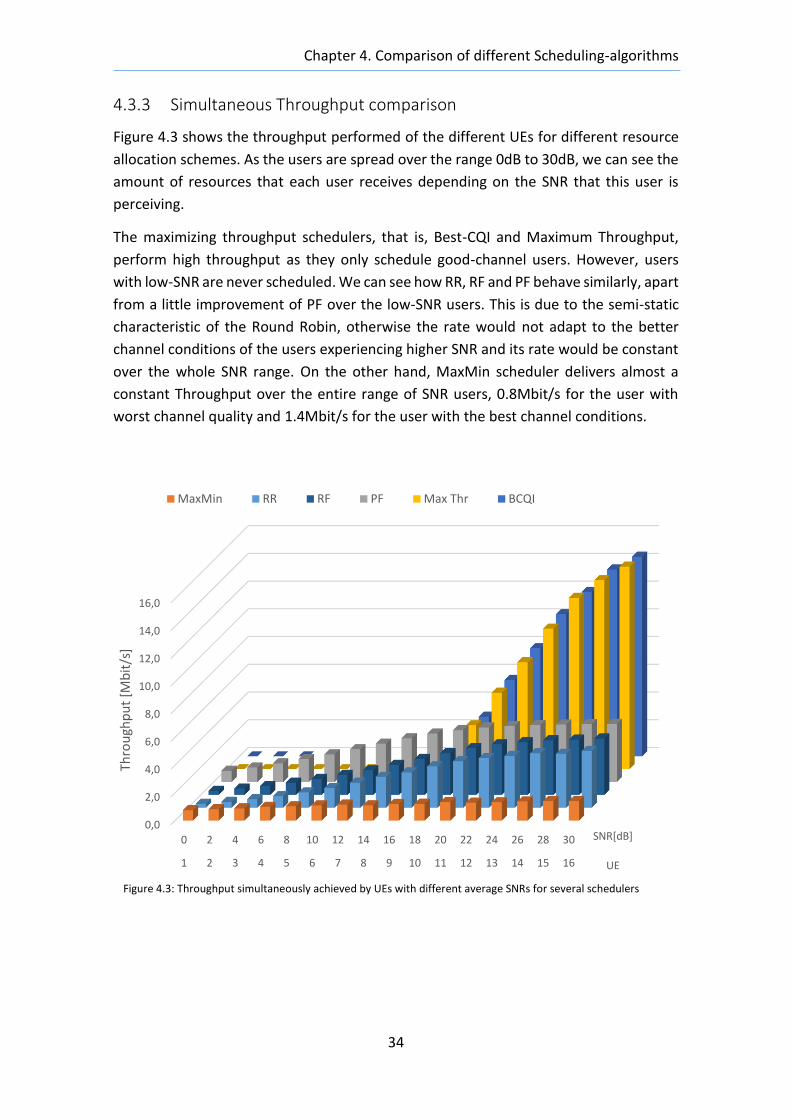
Chapter 4. Comparison of different Scheduling-algorithms
34
4.3.3 Simultaneous Throughput comparison
Figure 4.3 shows the throughput performed of the different UEs for different resource
allocation schemes. As the users are spread over the range 0dB to 30dB, we can see the
amount of resources that each user receives depending on the SNR that this user is
perceiving.
The maximizing throughput schedulers, that is, Best-CQI and Maximum Throughput,
perform high throughput as they only schedule good-channel users. However, users
with low-SNR are never scheduled. We can see how RR, RF and PF behave similarly, apart
from a little improvement of PF over the low-SNR users. This is due to the semi-static
characteristic of the Round Robin, otherwise the rate would not adapt to the better
channel conditions of the users experiencing higher SNR and its rate would be constant
over the whole SNR range. On the other hand, MaxMin scheduler delivers almost a
constant Throughput over the entire range of SNR users, 0.8Mbit/s for the user with
worst channel quality and 1.4Mbit/s for the user with the best channel conditions.
0,0
2,0
4,0
6,0
8,0
10,0
12,0
14,0
16,0
0 2 4 6 8 10 12 14 16 18 20 22 24 26 28 30
1 2 3 4 5 6 7 8 9 10 11 12 13 14 15 16
Thro
ugh
pu
t [M
bit
/s]
SNR[dB]
UE
MaxMin RR RF PF Max Thr BCQI
Figure 4.3: Throughput simultaneously achieved by UEs with different average SNRs for several schedulers
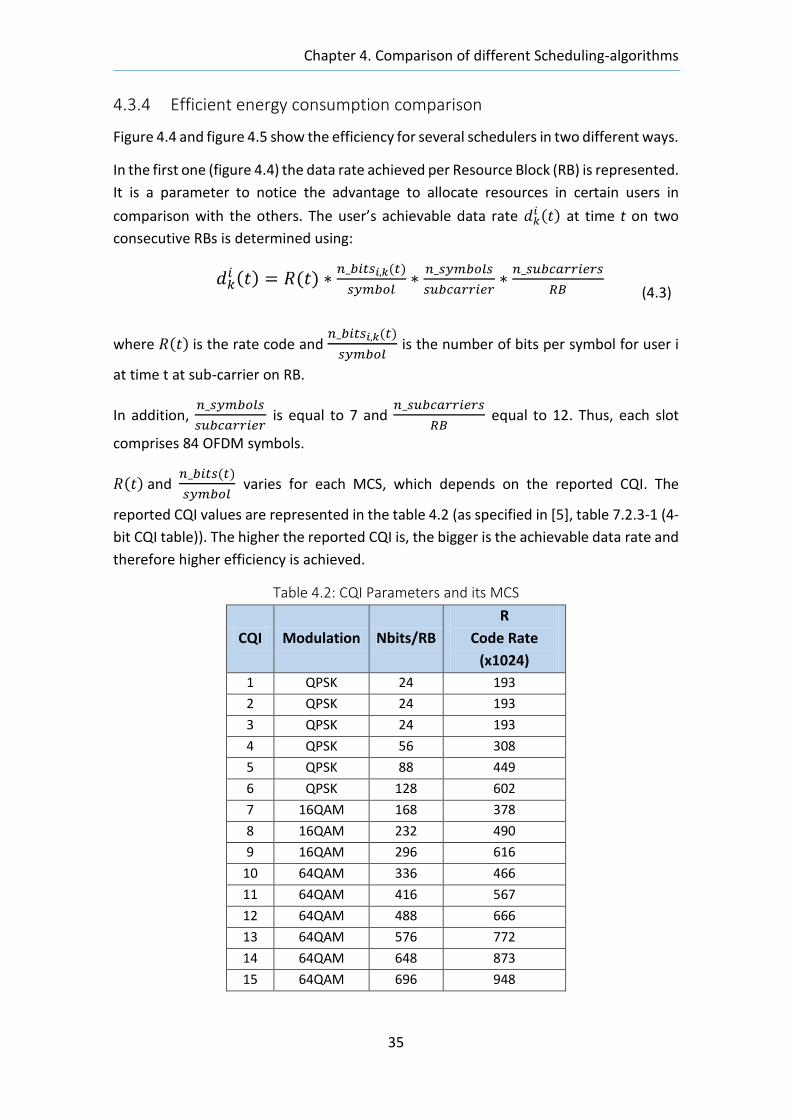
Chapter 4. Comparison of different Scheduling-algorithms
35
4.3.4 Efficient energy consumption comparison
Figure 4.4 and figure 4.5 show the efficiency for several schedulers in two different ways.
In the first one (figure 4.4) the data rate achieved per Resource Block (RB) is represented.
It is a parameter to notice the advantage to allocate resources in certain users in
comparison with the others. The user’s achievable data rate 𝑑𝑘𝑖 (𝑡) at time t on two
consecutive RBs is determined using:
𝑑𝑘𝑖 (𝑡) = 𝑅(𝑡) ∗
𝑛_𝑏𝑖𝑡𝑠𝑖,𝑘(𝑡)
𝑠𝑦𝑚𝑏𝑜𝑙∗
𝑛_𝑠𝑦𝑚𝑏𝑜𝑙𝑠
𝑠𝑢𝑏𝑐𝑎𝑟𝑟𝑖𝑒𝑟∗
𝑛_𝑠𝑢𝑏𝑐𝑎𝑟𝑟𝑖𝑒𝑟𝑠
𝑅𝐵
(4.3)
where 𝑅(𝑡) is the rate code and 𝑛_𝑏𝑖𝑡𝑠𝑖,𝑘(𝑡)
𝑠𝑦𝑚𝑏𝑜𝑙 is the number of bits per symbol for user i
at time t at sub-carrier on RB.
In addition, 𝑛_𝑠𝑦𝑚𝑏𝑜𝑙𝑠
𝑠𝑢𝑏𝑐𝑎𝑟𝑟𝑖𝑒𝑟 is equal to 7 and
𝑛_𝑠𝑢𝑏𝑐𝑎𝑟𝑟𝑖𝑒𝑟𝑠
𝑅𝐵 equal to 12. Thus, each slot
comprises 84 OFDM symbols.
𝑅(𝑡) and 𝑛_𝑏𝑖𝑡𝑠(𝑡)
𝑠𝑦𝑚𝑏𝑜𝑙 varies for each MCS, which depends on the reported CQI. The
reported CQI values are represented in the table 4.2 (as specified in [5], table 7.2.3-1 (4-
bit CQI table)). The higher the reported CQI is, the bigger is the achievable data rate and
therefore higher efficiency is achieved.
Table 4.2: CQI Parameters and its MCS
CQI Modulation Nbits/RB
R
Code Rate
(x1024)
1 QPSK 24 193
2 QPSK 24 193
3 QPSK 24 193
4 QPSK 56 308
5 QPSK 88 449
6 QPSK 128 602
7 16QAM 168 378
8 16QAM 232 490
9 16QAM 296 616
10 64QAM 336 466
11 64QAM 416 567
12 64QAM 488 666
13 64QAM 576 772
14 64QAM 648 873
15 64QAM 696 948
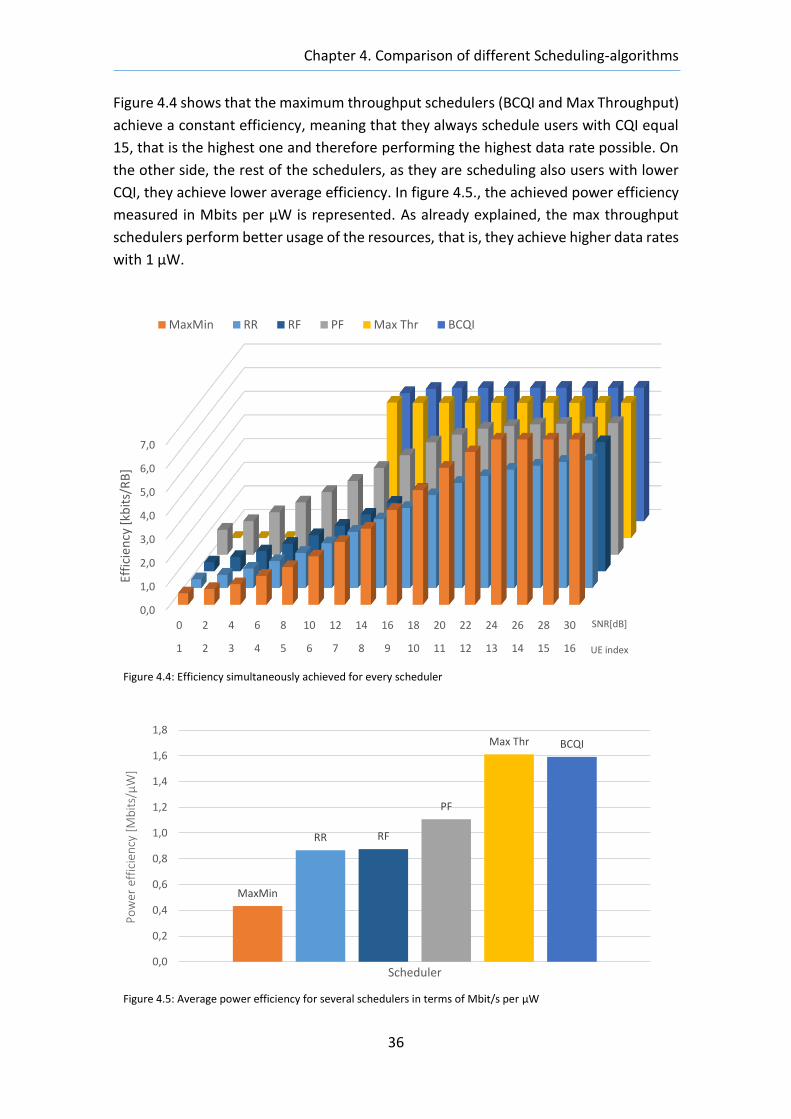
Chapter 4. Comparison of different Scheduling-algorithms
36
Figure 4.4 shows that the maximum throughput schedulers (BCQI and Max Throughput)
achieve a constant efficiency, meaning that they always schedule users with CQI equal
15, that is the highest one and therefore performing the highest data rate possible. On
the other side, the rest of the schedulers, as they are scheduling also users with lower
CQI, they achieve lower average efficiency. In figure 4.5., the achieved power efficiency
measured in Mbits per µW is represented. As already explained, the max throughput
schedulers perform better usage of the resources, that is, they achieve higher data rates
with 1 µW.
0,0
1,0
2,0
3,0
4,0
5,0
6,0
7,0
0 2 4 6 8 10 12 14 16 18 20 22 24 26 28 30
1 2 3 4 5 6 7 8 9 10 11 12 13 14 15 16
Effi
cien
cy [
kbit
s/R
B]
SNR[dB]
UE index
MaxMin RR RF PF Max Thr BCQI
MaxMin
RR RF
PF
Max Thr BCQI
0,0
0,2
0,4
0,6
0,8
1,0
1,2
1,4
1,6
1,8
Po
wer
eff
icie
ncy
[M
bit
s/µ
W]
Scheduler
Figure 4.4: Efficiency simultaneously achieved for every scheduler
Figure 4.5: Average power efficiency for several schedulers in terms of Mbit/s per µW
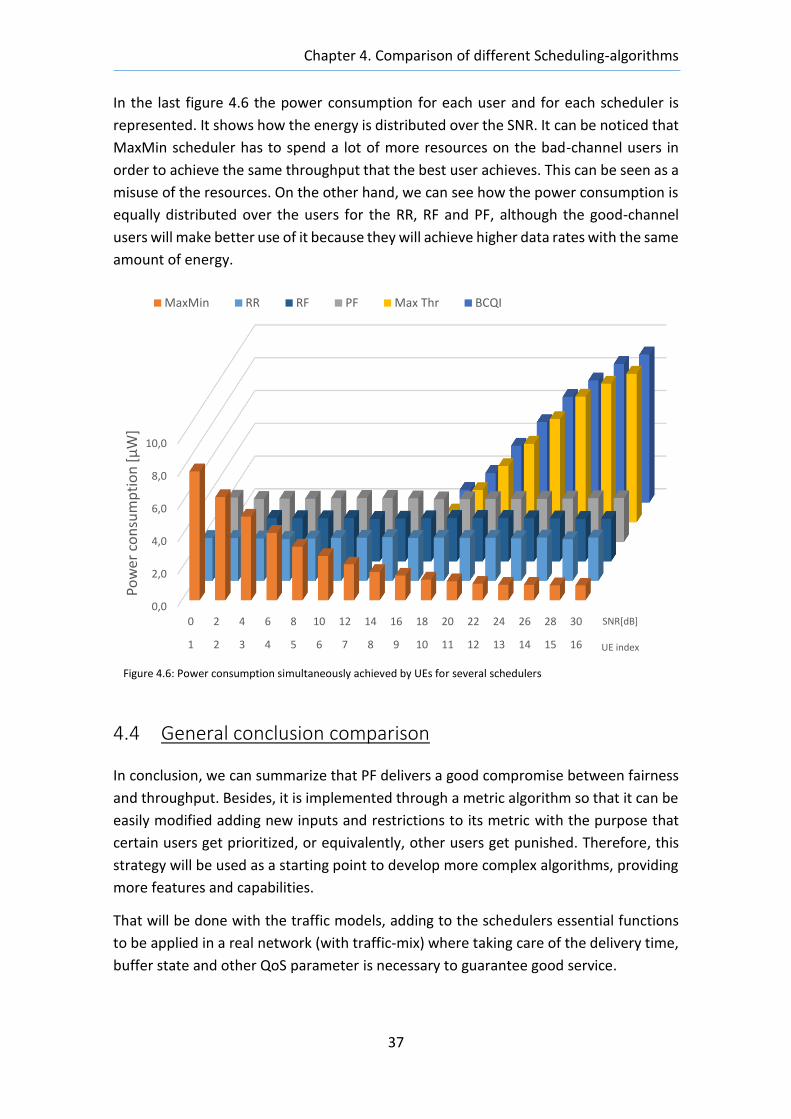
Chapter 4. Comparison of different Scheduling-algorithms
37
In the last figure 4.6 the power consumption for each user and for each scheduler is
represented. It shows how the energy is distributed over the SNR. It can be noticed that
MaxMin scheduler has to spend a lot of more resources on the bad-channel users in
order to achieve the same throughput that the best user achieves. This can be seen as a
misuse of the resources. On the other hand, we can see how the power consumption is
equally distributed over the users for the RR, RF and PF, although the good-channel
users will make better use of it because they will achieve higher data rates with the same
amount of energy.
4.4 General conclusion comparison
In conclusion, we can summarize that PF delivers a good compromise between fairness
and throughput. Besides, it is implemented through a metric algorithm so that it can be
easily modified adding new inputs and restrictions to its metric with the purpose that
certain users get prioritized, or equivalently, other users get punished. Therefore, this
strategy will be used as a starting point to develop more complex algorithms, providing
more features and capabilities.
That will be done with the traffic models, adding to the schedulers essential functions
to be applied in a real network (with traffic-mix) where taking care of the delivery time,
buffer state and other QoS parameter is necessary to guarantee good service.
0,0
2,0
4,0
6,0
8,0
10,0
0 2 4 6 8 10 12 14 16 18 20 22 24 26 28 30
1 2 3 4 5 6 7 8 9 10 11 12 13 14 15 16
Pow
er c
on
sum
pti
on
[µ
W]
SNR[dB]
UE index
MaxMin RR RF PF Max Thr BCQI
Figure 4.6: Power consumption simultaneously achieved by UEs for several schedulers

Chapter 4. Comparison of different Scheduling-algorithms
38
39
Chapter 5
Energy-saving modification
In this section, a modification of the Proportional Fair (PF) is investigated. This
modification aims to reduce the energy consumption or, equivalently, to increase the
energy efficiency of the transmission. In other words, with the same amount of power
consumption it provides higher overall throughput.
Although the results show that the improvements are really good, these stunning
improvements are achieved under low load conditions corresponding to 20 users in out
system. With 30 users there is also improvement, but when the system gets closer to
the maximum possible load (40 users) the improvements are negligible or even
nonexistent.
5.1 Approach
As a first modification of the basic PF metric we consider to add a parameter in the
denominator. The main purpose of this approach is to make the overall performance of
the scheduler unfair. This parameter allows the operators to match the metric scheduler
to the current system conditions.
The new metric looks:
𝑚𝑖,𝑘𝑃𝐹 =
𝑑𝑘𝑖 (𝑡)
[𝑅𝑖̅̅ ̅(𝑡 − 1)]𝛽
(5.1)
In fact, what it is done when we tune the parameter β is modifying the weight that the
past achieved throughput has in the current metric. Therefore when we settle the
parameter β to be less than one, we are decreasing the weight of the achieved past.
Consequently we are achieving a metric less fair, what it is actually the goal. As an
extreme case, if the parameter β is set equal to zero, we have in fact the equivalent
metric of a rate maximizing scheduler, where as in the preceding chapter the results
shows the throughput and the energy-efficient is optimal. Therefore we have to achieve
a compromise in matching the parameter β. More details can be found in [21], where
the impact of the parameter β is explained in more details.
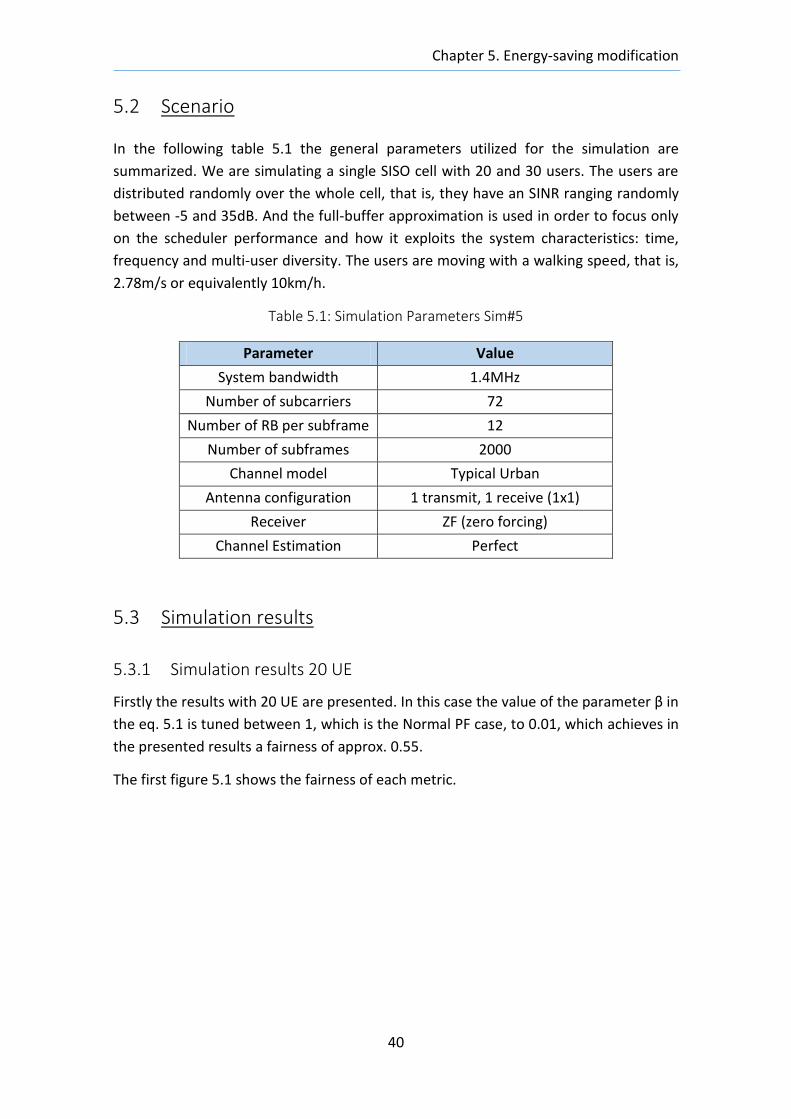
Chapter 5. Energy-saving modification
40
5.2 Scenario
In the following table 5.1 the general parameters utilized for the simulation are
summarized. We are simulating a single SISO cell with 20 and 30 users. The users are
distributed randomly over the whole cell, that is, they have an SINR ranging randomly
between -5 and 35dB. And the full-buffer approximation is used in order to focus only
on the scheduler performance and how it exploits the system characteristics: time,
frequency and multi-user diversity. The users are moving with a walking speed, that is,
2.78m/s or equivalently 10km/h.
Table 5.1: Simulation Parameters Sim#5
Parameter Value
System bandwidth 1.4MHz
Number of subcarriers 72
Number of RB per subframe 12
Number of subframes 2000
Channel model Typical Urban
Antenna configuration 1 transmit, 1 receive (1x1)
Receiver ZF (zero forcing)
Channel Estimation Perfect
5.3 Simulation results
5.3.1 Simulation results 20 UE
Firstly the results with 20 UE are presented. In this case the value of the parameter β in
the eq. 5.1 is tuned between 1, which is the Normal PF case, to 0.01, which achieves in
the presented results a fairness of approx. 0.55.
The first figure 5.1 shows the fairness of each metric.
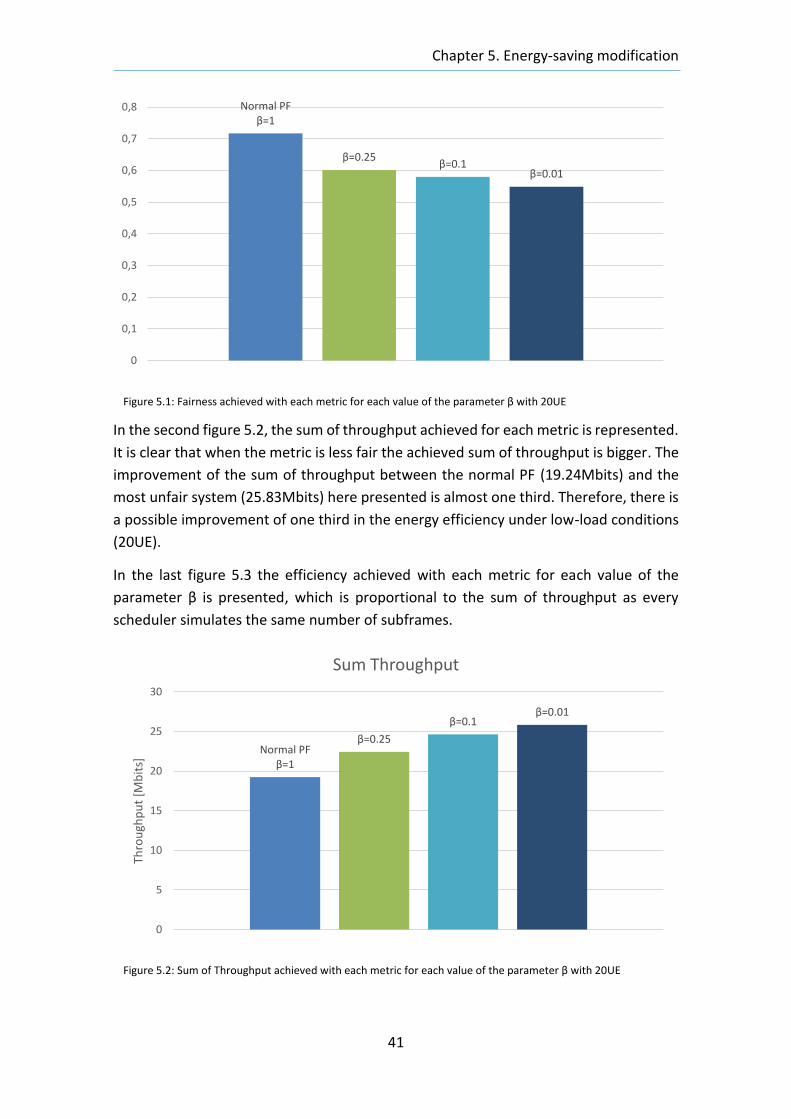
Chapter 5. Energy-saving modification
41
In the second figure 5.2, the sum of throughput achieved for each metric is represented.
It is clear that when the metric is less fair the achieved sum of throughput is bigger. The
improvement of the sum of throughput between the normal PF (19.24Mbits) and the
most unfair system (25.83Mbits) here presented is almost one third. Therefore, there is
a possible improvement of one third in the energy efficiency under low-load conditions
(20UE).
In the last figure 5.3 the efficiency achieved with each metric for each value of the
parameter β is presented, which is proportional to the sum of throughput as every
scheduler simulates the same number of subframes.
Normal PFβ=1
β=0.25β=0.1
β=0.01
0
0,1
0,2
0,3
0,4
0,5
0,6
0,7
0,8
Normal PFβ=1
β=0.25
β=0.1β=0.01
0
5
10
15
20
25
30
Thro
ugh
pu
t [M
bit
s]
Sum Throughput
Figure 5.1: Fairness achieved with each metric for each value of the parameter β with 20UE
Figure 5.2: Sum of Throughput achieved with each metric for each value of the parameter β with 20UE
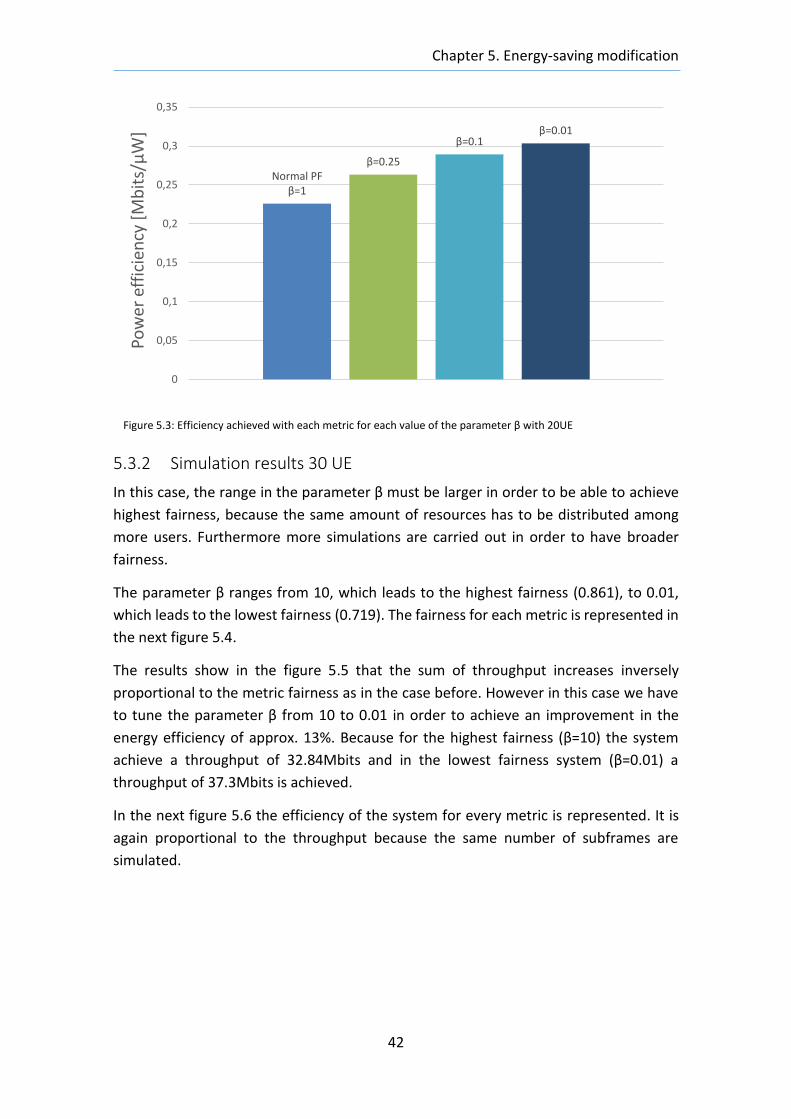
Chapter 5. Energy-saving modification
42
5.3.2 Simulation results 30 UE
In this case, the range in the parameter β must be larger in order to be able to achieve
highest fairness, because the same amount of resources has to be distributed among
more users. Furthermore more simulations are carried out in order to have broader
fairness.
The parameter β ranges from 10, which leads to the highest fairness (0.861), to 0.01,
which leads to the lowest fairness (0.719). The fairness for each metric is represented in
the next figure 5.4.
The results show in the figure 5.5 that the sum of throughput increases inversely
proportional to the metric fairness as in the case before. However in this case we have
to tune the parameter β from 10 to 0.01 in order to achieve an improvement in the
energy efficiency of approx. 13%. Because for the highest fairness (β=10) the system
achieve a throughput of 32.84Mbits and in the lowest fairness system (β=0.01) a
throughput of 37.3Mbits is achieved.
In the next figure 5.6 the efficiency of the system for every metric is represented. It is
again proportional to the throughput because the same number of subframes are
simulated.
Normal PFβ=1
β=0.25
β=0.1β=0.01
0
0,05
0,1
0,15
0,2
0,25
0,3
0,35
Pow
er e
ffic
ien
cy [
Mb
its/
µW
]
Figure 5.3: Efficiency achieved with each metric for each value of the parameter β with 20UE
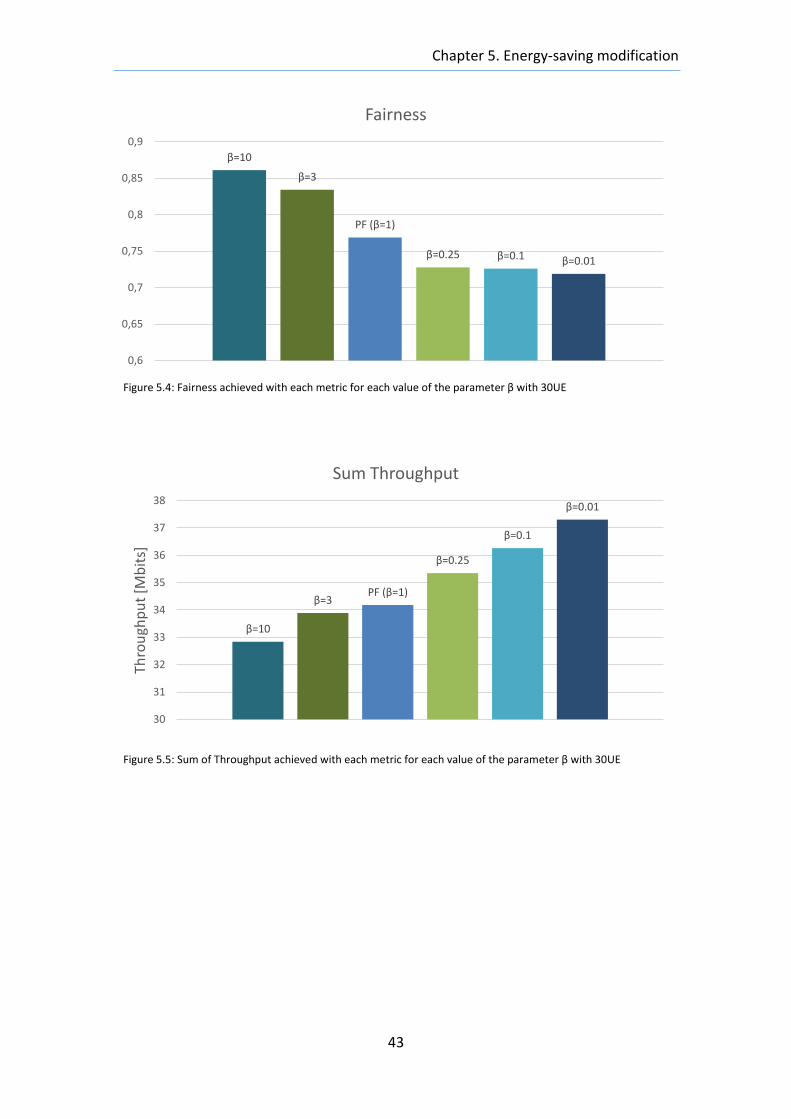
Chapter 5. Energy-saving modification
43
β=10
β=3
PF (β=1)
β=0.25 β=0.1 β=0.01
0,6
0,65
0,7
0,75
0,8
0,85
0,9
Fairness
β=10
β=3PF (β=1)
β=0.25
β=0.1
β=0.01
30
31
32
33
34
35
36
37
38
Thro
ugh
pu
t [M
bit
s]
Sum Throughput
Figure 5.4: Fairness achieved with each metric for each value of the parameter β with 30UE
Figure 5.5: Sum of Throughput achieved with each metric for each value of the parameter β with 30UE
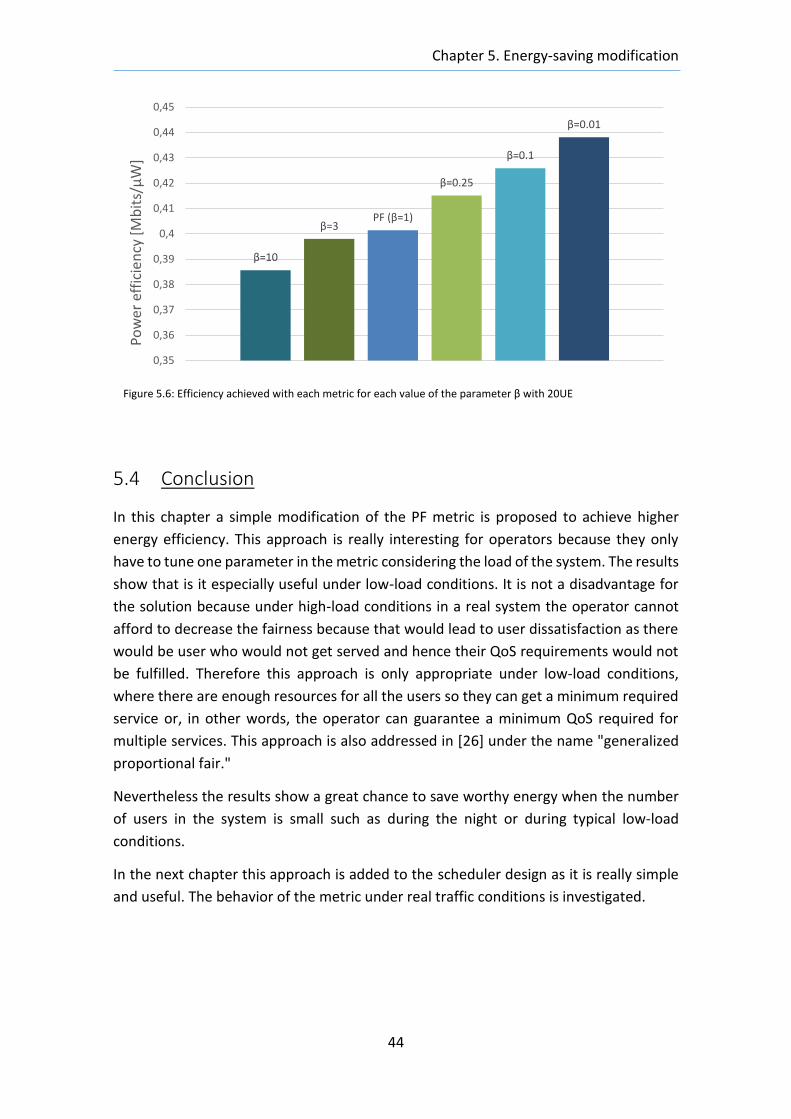
Chapter 5. Energy-saving modification
44
5.4 Conclusion
In this chapter a simple modification of the PF metric is proposed to achieve higher
energy efficiency. This approach is really interesting for operators because they only
have to tune one parameter in the metric considering the load of the system. The results
show that is it especially useful under low-load conditions. It is not a disadvantage for
the solution because under high-load conditions in a real system the operator cannot
afford to decrease the fairness because that would lead to user dissatisfaction as there
would be user who would not get served and hence their QoS requirements would not
be fulfilled. Therefore this approach is only appropriate under low-load conditions,
where there are enough resources for all the users so they can get a minimum required
service or, in other words, the operator can guarantee a minimum QoS required for
multiple services. This approach is also addressed in [26] under the name "generalized
proportional fair."
Nevertheless the results show a great chance to save worthy energy when the number
of users in the system is small such as during the night or during typical low-load
conditions.
In the next chapter this approach is added to the scheduler design as it is really simple
and useful. The behavior of the metric under real traffic conditions is investigated.
β=10
β=3PF (β=1)
β=0.25
β=0.1
β=0.01
0,35
0,36
0,37
0,38
0,39
0,4
0,41
0,42
0,43
0,44
0,45
Pow
er e
ffic
ien
cy [
Mb
its/
µW
]
Figure 5.6: Efficiency achieved with each metric for each value of the parameter β with 20UE
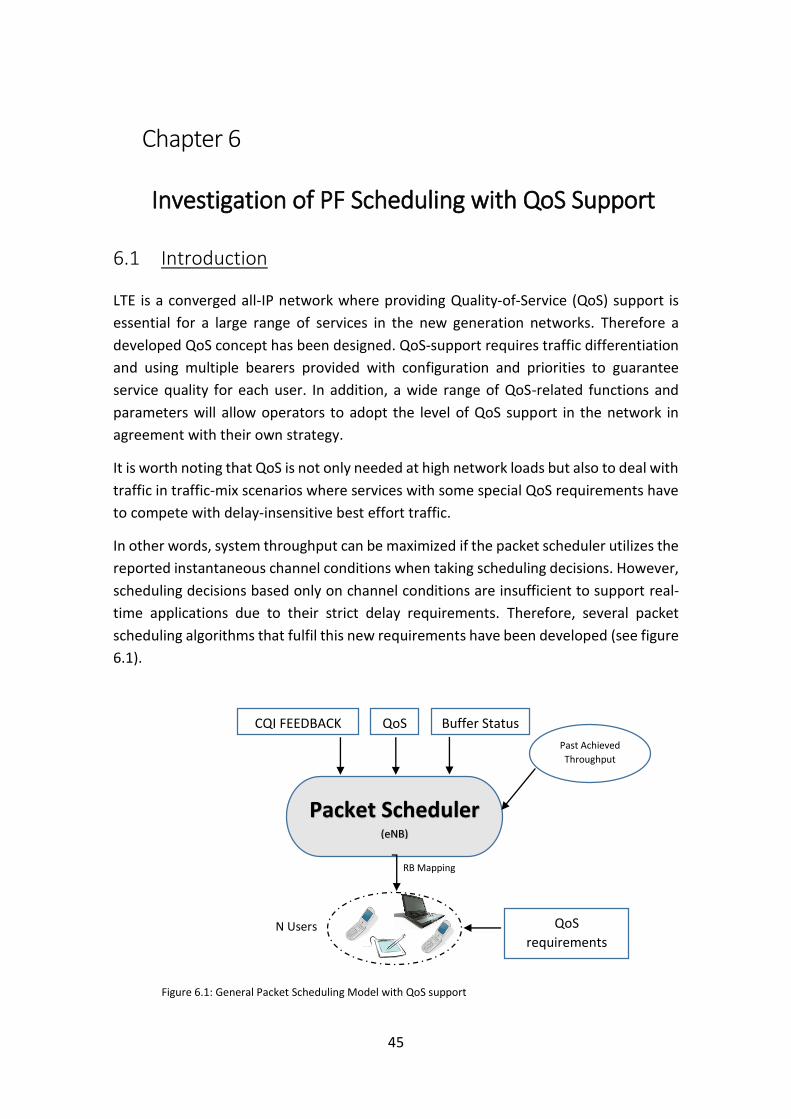
45
Past Achieved
Throughput
Chapter 6
Investigation of PF Scheduling with QoS Support
6.1 Introduction
LTE is a converged all-IP network where providing Quality-of-Service (QoS) support is
essential for a large range of services in the new generation networks. Therefore a
developed QoS concept has been designed. QoS-support requires traffic differentiation
and using multiple bearers provided with configuration and priorities to guarantee
service quality for each user. In addition, a wide range of QoS-related functions and
parameters will allow operators to adopt the level of QoS support in the network in
agreement with their own strategy.
It is worth noting that QoS is not only needed at high network loads but also to deal with
traffic in traffic-mix scenarios where services with some special QoS requirements have
to compete with delay-insensitive best effort traffic.
In other words, system throughput can be maximized if the packet scheduler utilizes the
reported instantaneous channel conditions when taking scheduling decisions. However,
scheduling decisions based only on channel conditions are insufficient to support real-
time applications due to their strict delay requirements. Therefore, several packet
scheduling algorithms that fulfil this new requirements have been developed (see figure
6.1).
Packet Scheduler (eNB)
CQI FEEDBACK
RB Mapping
QoS Buffer Status
N Users
Figure 6.1: General Packet Scheduling Model with QoS support
QoS
requirements
Chapter 6. Investigation of PF Scheduling with QoS Support
46
During this chapter the performance of several scheduler is investigated when delivering
different services over a network in terms of capacity of delay-critical services, such as
Voice over Internet Protocol (VoIP) and minimum throughput in a mixed traffic scenario.
The main challenge is to enable traffic differentiation and service prioritization in such a
traffic-mix scenario when delay-critical services, e.g., VoIP, are employed together with
delay-insensitive traffic. For that purpose, several different schedulers are proposed in
order to compare performance. In addition, to emulate the services performed by the
users several traffic model are implemented whose characteristics are introduced and
summarized in subsection 3.3.
6.2 Scenario
As it has been demonstrated in the chapter 4, the PF scheduler is well-suited for our
purpose. Therefore it has been taken as a starting point to develop our scheduler. Four
schedulers are developed in order to be able to compare and choose the better solution.
All the proposed schedulers are based on a per-metric decision and PF-allocation
strategy. The schedulers under investigation are:
I. Basic Proportional Fair
II. Real-Time Priority Scheduler
III. Exponential/Proportional Fair
IV. Proportional Fair Criteria
6.2.1 Basic Proportional Fair
As it has already been introduced in the preceding chapter, here only a brief introduction
will be given. It is based on the idea of computing the past average throughput as a
weighting factor of the expected rate.
𝑚𝑖,𝑘𝑃𝐹 =
𝑑𝑘𝑖 (𝑡)
𝑅𝑖̅̅ ̅(𝑡−1) (5.1)
Although this strategy is not adapted to prioritize any kind of traffic, it actually gives a
certain priority to RT-users because of their low data rate nature. That is, as the RT-
services generate less amount of data than NRT services, such as HTTP or FTP, they have
a smaller average throughput, what results in a higher metric than the NRT.
Nevertheless, there are still improvements to be done, as the results have shown.
6.2.2 Real-Time Priority Scheduler
As the main objective is traffic differentiation, as a first enhancement, a scheduler with
prioritization of real-time users is proposed. It employs the same PF metric but with RT
prioritization. Therefore it first schedules all the RT users and then, when no RT-data is
left, it distributes the spare resources among the NRT users. In other words, there are
Chapter 6. Investigation of PF Scheduling with QoS Support
47
two different queues: the scheduler allocates the RT-queue while they still have data
waiting, afterwards it goes on allocating with the second NRT queue.
This approach provides the lowest delay solution but the results show that this solution
can punish the NRT users and consequently they may not achieve their minimum
throughput requirements. In addition, as the delivered throughput is lower, the energy
efficiency also drops.
6.2.3 Exponential/Proportional Fair
The Exponential/Proportional Fair (EXP/PF) scheduler is based on the paper [16]. That
algorithm was firstly developed to support multimedia applications [17, 18]. It belongs
to the strategies that aim at guaranteeing bounded delay, as delay is the most
challenging requirements in the QoS-aware schemes, especially in interactive or real-
time applications.
For NRT users the same metric as in basic PF (eq. 5.1) is applied but for Real-Time users
an exponentially increasing factor is included. Therefore, the metric is calculated as:
𝑚𝑖,𝑘𝐸𝑋𝑃/𝑃𝐹
= 𝑒𝑥𝑝 (𝛼𝑖 𝐷𝑖 − 𝑥
1 + √𝑥) ∗ 𝑚𝑖,𝑘
𝑃𝐹 (5.2)
That is,
𝑚𝑖,𝑘𝐸𝑋𝑃/𝑃𝐹
= 𝑒𝑥𝑝 (𝛼𝑖 𝐷𝑖 −𝑥
1+√𝑥) ∗
𝑑𝑘𝑖 (𝑡)
𝑅𝑖̅̅ ̅(𝑡−1) (5.3)
Where
𝛼𝑖 = −𝑙𝑜𝑔 𝛿𝑖
𝜏𝑖 (5.4)
And:
𝑥 =1
𝑁𝑟𝑡∑ 𝛼𝑖 𝐷𝑖
𝑁𝑟𝑡
𝑖=1
(5.5)
where 𝛿𝑖 is the acceptable packet loss rate of the i-th user, 𝜏𝑖 is the delay threshold of
the i-th user, 𝑁𝑟𝑡 is the number of real-time users. Furthermore, let 𝐷𝑖 be the delay of
the first packet in the queue of the i-th user.
The simulations results have shown how decisive the parameter 𝛿𝑖 is. For that reason,
firstly several simulations are carried out with the purpose of determining that
parameter. The selection of this parameters is done through the trial and error
methodology. It is further explained in the following section 6.3.
Chapter 6. Investigation of PF Scheduling with QoS Support
48
6.2.4 Criteria Proportional Fair
This approach has been designed based on the idea to adapt the metric according not
only to the respective delay of the current packets, as EXP/PF does, but also to the buffer
state. In addition, the energy saving considerations are a crucial issue.
It is also a modification of the Largest Delay Weighted First (LDWF) proposed on [16],
the buffer state input is added and different thresholds are defined. Besides, several
energy-efficiency enhancing modifications are added.
The main characteristics are summarized here:
For the RT-Users a new metric is computed, the metric increases exponentially
when the user gets closer to its maximum delay threshold.
Two different thresholds defined to maximize the multi-user diversity while still
guaranteeing QoS criteria.
Takes into account the buffer state
Added fairness parameter β, that is, when it is lower than 1 it forces to distribute
unfairly the resources, leading to higher energy efficiency. Several simulations
are carried out aiming at precise determining this parameter, as it is in preceding
chapter 5 exposed.
New energy-efficient characteristic according to [19]. In there the author
concludes that it is more energy-efficient to allocate as many RBs as possible to
a single user instead of assigning several users less RBs. That conclusion is
explained in more detail within the next lines.
In the paper [19], the author investigates the effect of RB allocation on an LTE modem’s
transmit power and total modem energy consumption.
The simulation results presented on that paper, based on a mapping from transmission
power to energy consumption, show that it is more energy efficient to allocate as many
PRBs as possible to a single user instead of assigning several users less PRBs. For
example, the author concludes that on average 24 % energy can be saved if a user is
allocated an entire 10 MHz channel (48 PRBs) instead of 8 PRBs. LTE’s Uplink Power
Control leads to that users with more PRBs will transmit with higher power, but in the
same way the throughput increases proportionally and therefore energy can be saved.
Furthermore the applied power consumption model requires that the UE’s efficiency
grows when the transmit power grows.
Equivalently, the author implemented a scheduler to evaluate how the energy
consumption is influenced when scheduling a maximum of 6, 8, and 10 simultaneous
users. The results present that scheduling maximum 10 users instead of 6 increases the
average transmission time with ∼4 % and the average energy consumption with ∼6 %.
Therefore, he concludes that there is no reason to scheduling more than 6 users due to
the fact that the cell throughput is not depending on the number of users. The
Chapter 6. Investigation of PF Scheduling with QoS Support
49
conclusion of the investigation in the paper is that one user should be assigned as many
PRBs as possible, while limiting the number of simultaneous users to reduce the average
waiting time.
This new feature of allocating as many resources as possible resources as possible to
one user has been implemented in that scheduler but only for the Real-Time users,
because otherwise the NRT user would occupy all the resources and blocking the rest of
services.
For NRT users the same metric as in basic PF (eq 5.1) is applied but for Real-Time users
the metric is calculated with the following formula:
𝑚𝑖,𝑘𝐸𝑋𝑃/𝑃𝐹
= (𝑘𝑖
(𝐷𝑖
𝜏𝑖,𝑚𝑖𝑛)
∗ 𝑑𝑘
𝑖 (𝑡)
[𝑅𝑖̅̅ ̅(𝑡 − 1)]𝛽 )
𝑛𝑖
(5.6)
Let 𝑛𝑖 be the number of packets waiting in the buffer. Furthermore, let 𝜏𝑖,𝑗 be the j-th
delay threshold of the i-th user and let 𝐷𝑖 be the delay of the first packet of the i-th user.
Additionally:
𝑘𝑖 = {
1 𝑤ℎ𝑒𝑛 𝐷𝑖 < 𝜏𝑖,𝑚𝑖𝑛
5 𝑤ℎ𝑒𝑛 𝜏𝑖,𝑚𝑖𝑛 < 𝐷𝑖 < 𝜏𝑖,2
20 𝑤ℎ𝑒𝑛 𝜏𝑖,2 < 𝐷𝑖 < 𝜏𝑖,𝑚𝑎𝑥
(5.7)
And finally, in the worst case when the packet exceeds the maximum delivering time
𝐷𝑖 > 𝜏𝑖,𝑚𝑎𝑥 𝑘𝑖 = ∞ , so that the user is definitely scheduled. Although for this extreme
case it means that the channel conditions are no more taken into account. On the other
hand, these packets are useless as they are arriving out-of-date to the receiver, but we
are not directly discarding them in order to see the improvements between the
scheduling strategies.
6.2.5 Simulations parameters
The parameters of the simulation set up are summarized in the following Table 5.1. It
consists of a single cell SISO scenario with a variable number of UEs, defined a priori and
which stays fixed during the whole simulation as there is no handover or admission
control system implemented. The users are distributed randomly over the whole cell,
that is, they have an SINR ranging randomly between -5 and 35dB. Nevertheless, in order
to be able to compare the obtained results, the simulations are carried out with the
same SINR realization. Otherwise, it would impossible compare different schedulers
with different SINR realizations. The users are moving with a walking speed, that is,
2.78m/s or equivalently 10km/h.
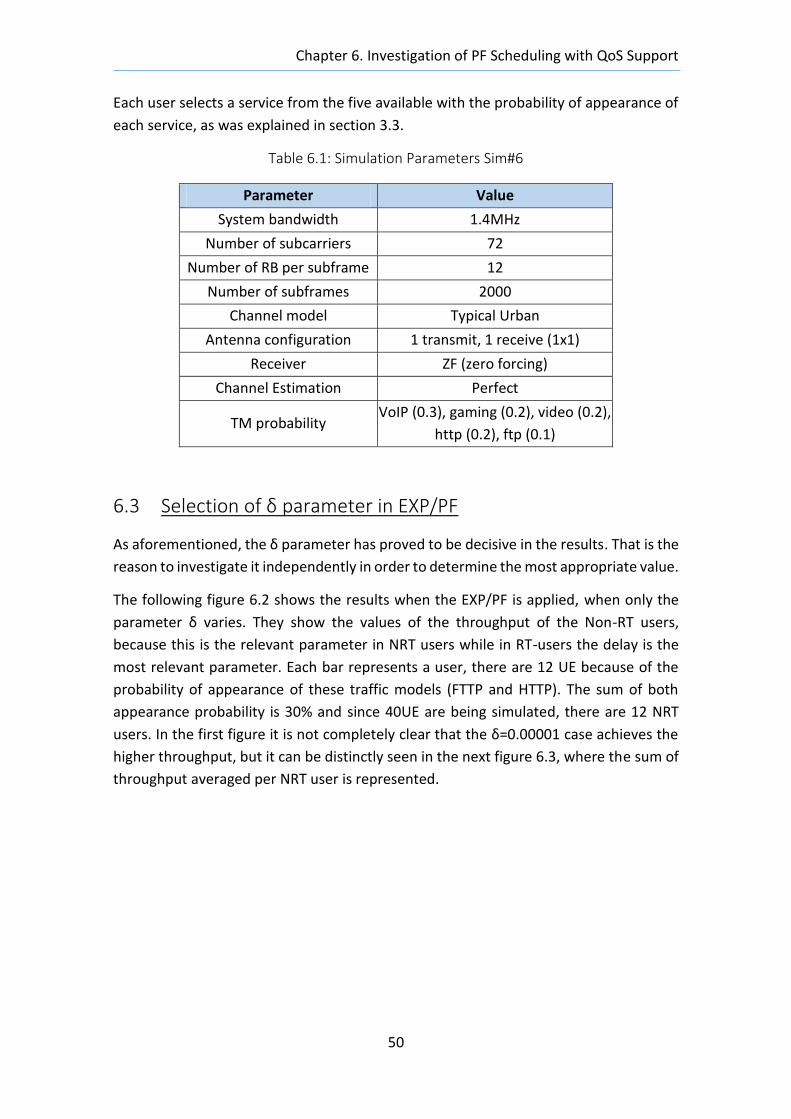
Chapter 6. Investigation of PF Scheduling with QoS Support
50
Each user selects a service from the five available with the probability of appearance of
each service, as was explained in section 3.3.
Table 6.1: Simulation Parameters Sim#6
Parameter Value
System bandwidth 1.4MHz
Number of subcarriers 72
Number of RB per subframe 12
Number of subframes 2000
Channel model Typical Urban
Antenna configuration 1 transmit, 1 receive (1x1)
Receiver ZF (zero forcing)
Channel Estimation Perfect
TM probability VoIP (0.3), gaming (0.2), video (0.2),
http (0.2), ftp (0.1)
6.3 Selection of δ parameter in EXP/PF
As aforementioned, the δ parameter has proved to be decisive in the results. That is the
reason to investigate it independently in order to determine the most appropriate value.
The following figure 6.2 shows the results when the EXP/PF is applied, when only the
parameter δ varies. They show the values of the throughput of the Non-RT users,
because this is the relevant parameter in NRT users while in RT-users the delay is the
most relevant parameter. Each bar represents a user, there are 12 UE because of the
probability of appearance of these traffic models (FTTP and HTTP). The sum of both
appearance probability is 30% and since 40UE are being simulated, there are 12 NRT
users. In the first figure it is not completely clear that the δ=0.00001 case achieves the
higher throughput, but it can be distinctly seen in the next figure 6.3, where the sum of
throughput averaged per NRT user is represented.
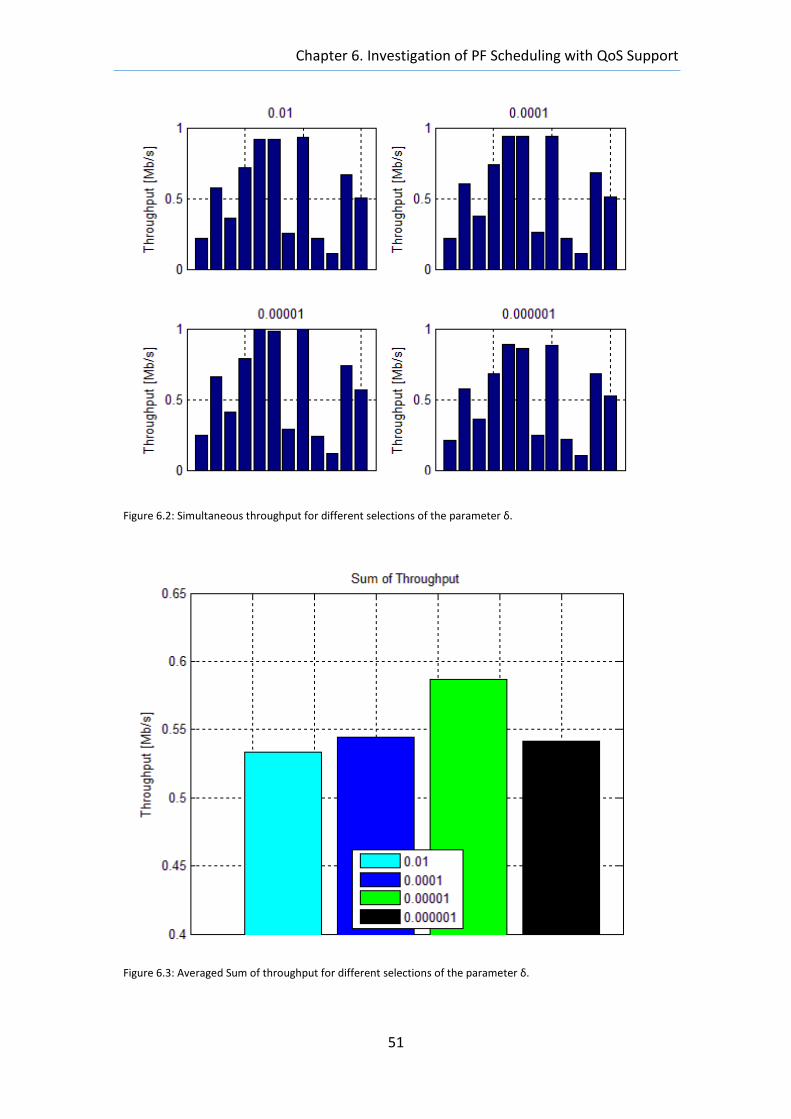
Chapter 6. Investigation of PF Scheduling with QoS Support
51
Figure 6.2: Simultaneous throughput for different selections of the parameter δ.
Figure 6.3: Averaged Sum of throughput for different selections of the parameter δ.
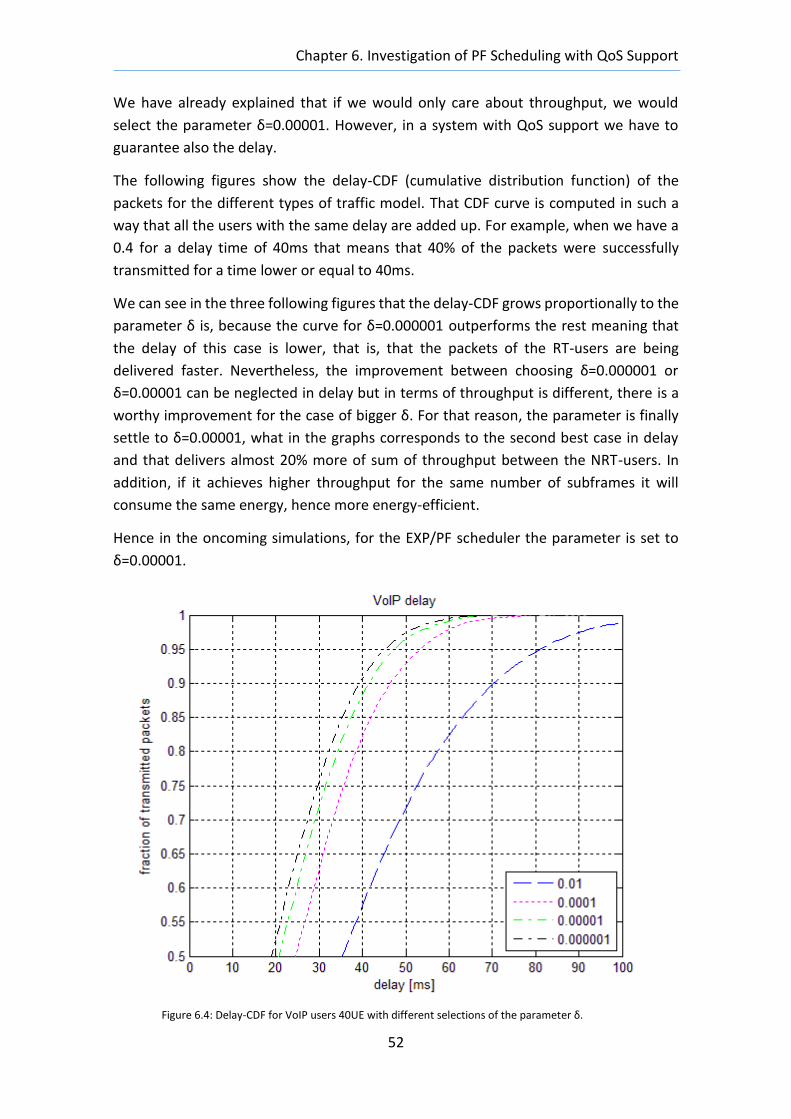
Chapter 6. Investigation of PF Scheduling with QoS Support
52
We have already explained that if we would only care about throughput, we would
select the parameter δ=0.00001. However, in a system with QoS support we have to
guarantee also the delay.
The following figures show the delay-CDF (cumulative distribution function) of the
packets for the different types of traffic model. That CDF curve is computed in such a
way that all the users with the same delay are added up. For example, when we have a
0.4 for a delay time of 40ms that means that 40% of the packets were successfully
transmitted for a time lower or equal to 40ms.
We can see in the three following figures that the delay-CDF grows proportionally to the
parameter δ is, because the curve for δ=0.000001 outperforms the rest meaning that
the delay of this case is lower, that is, that the packets of the RT-users are being
delivered faster. Nevertheless, the improvement between choosing δ=0.000001 or
δ=0.00001 can be neglected in delay but in terms of throughput is different, there is a
worthy improvement for the case of bigger δ. For that reason, the parameter is finally
settle to δ=0.00001, what in the graphs corresponds to the second best case in delay
and that delivers almost 20% more of sum of throughput between the NRT-users. In
addition, if it achieves higher throughput for the same number of subframes it will
consume the same energy, hence more energy-efficient.
Hence in the oncoming simulations, for the EXP/PF scheduler the parameter is set to
δ=0.00001.
Figure 6.4: Delay-CDF for VoIP users 40UE with different selections of the parameter δ.
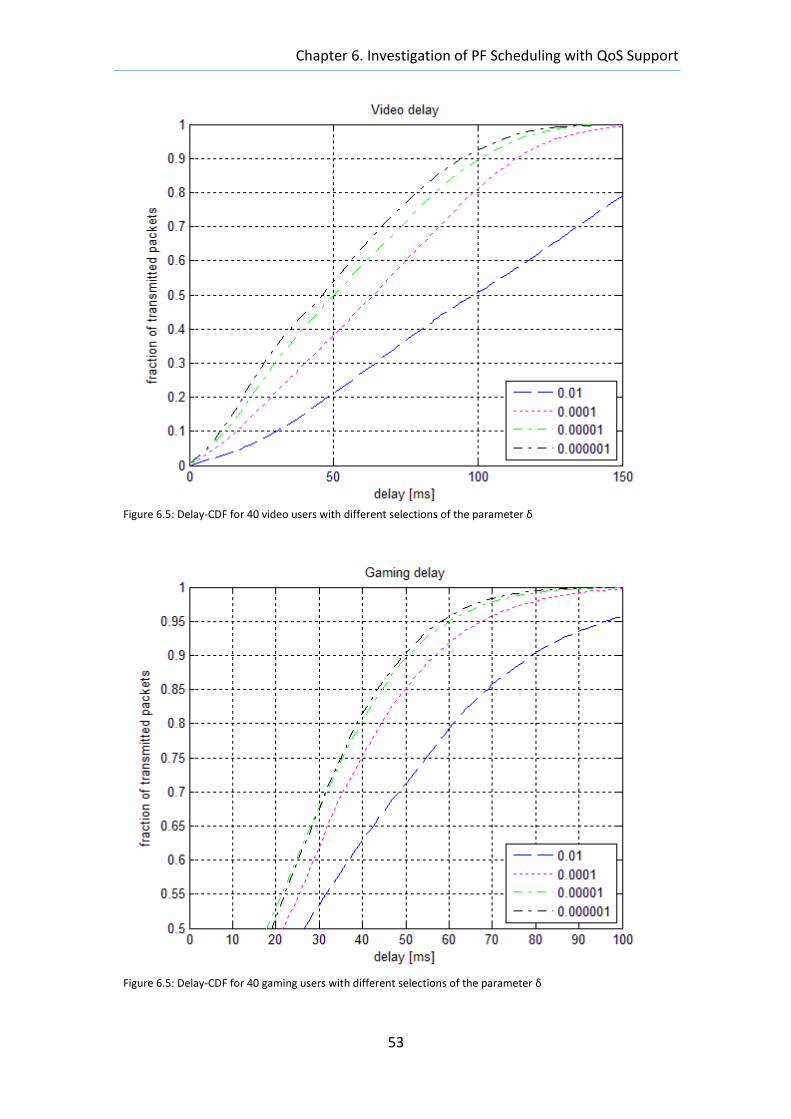
Chapter 6. Investigation of PF Scheduling with QoS Support
53
Figure 6.5: Delay-CDF for 40 video users with different selections of the parameter δ
Figure 6.5: Delay-CDF for 40 gaming users with different selections of the parameter δ
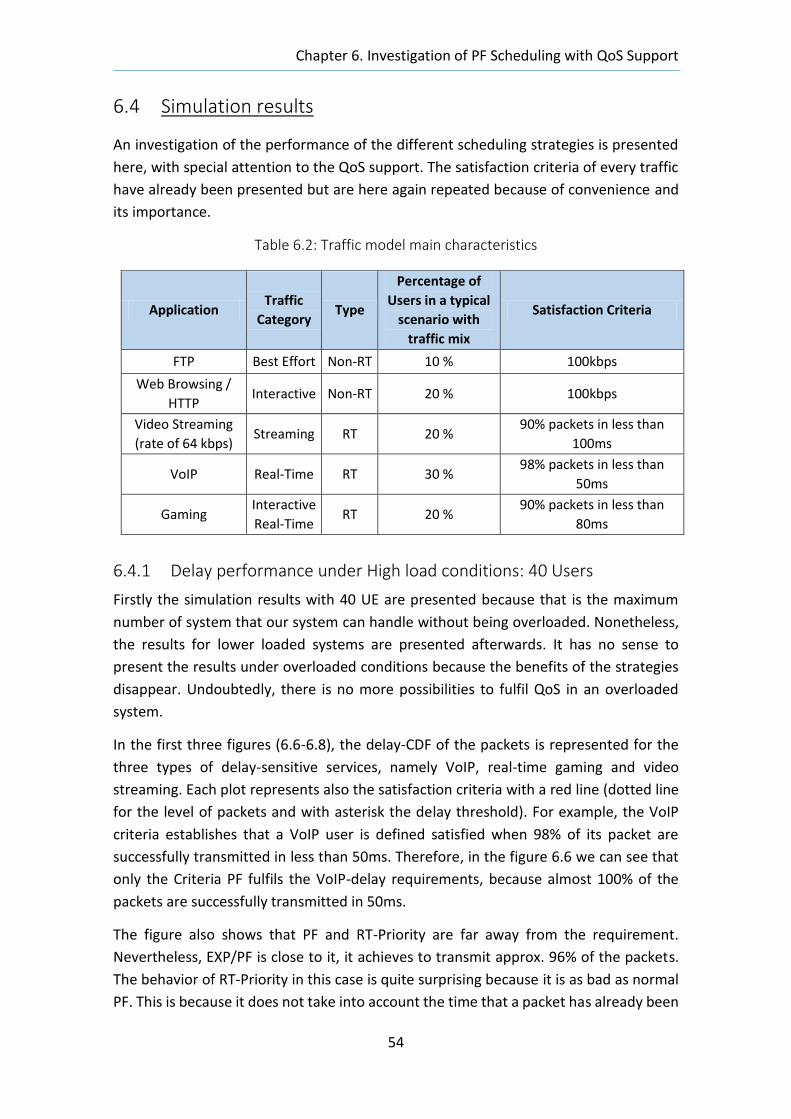
Chapter 6. Investigation of PF Scheduling with QoS Support
54
6.4 Simulation results
An investigation of the performance of the different scheduling strategies is presented
here, with special attention to the QoS support. The satisfaction criteria of every traffic
have already been presented but are here again repeated because of convenience and
its importance.
Table 6.2: Traffic model main characteristics
Application Traffic
Category Type
Percentage of
Users in a typical
scenario with
traffic mix
Satisfaction Criteria
FTP Best Effort Non-RT 10 % 100kbps
Web Browsing /
HTTP Interactive Non-RT 20 % 100kbps
Video Streaming
(rate of 64 kbps) Streaming RT 20 %
90% packets in less than
100ms
VoIP Real-Time RT 30 % 98% packets in less than
50ms
Gaming Interactive
Real-Time RT 20 %
90% packets in less than
80ms
6.4.1 Delay performance under High load conditions: 40 Users
Firstly the simulation results with 40 UE are presented because that is the maximum
number of system that our system can handle without being overloaded. Nonetheless,
the results for lower loaded systems are presented afterwards. It has no sense to
present the results under overloaded conditions because the benefits of the strategies
disappear. Undoubtedly, there is no more possibilities to fulfil QoS in an overloaded
system.
In the first three figures (6.6-6.8), the delay-CDF of the packets is represented for the
three types of delay-sensitive services, namely VoIP, real-time gaming and video
streaming. Each plot represents also the satisfaction criteria with a red line (dotted line
for the level of packets and with asterisk the delay threshold). For example, the VoIP
criteria establishes that a VoIP user is defined satisfied when 98% of its packet are
successfully transmitted in less than 50ms. Therefore, in the figure 6.6 we can see that
only the Criteria PF fulfils the VoIP-delay requirements, because almost 100% of the
packets are successfully transmitted in 50ms.
The figure also shows that PF and RT-Priority are far away from the requirement.
Nevertheless, EXP/PF is close to it, it achieves to transmit approx. 96% of the packets.
The behavior of RT-Priority in this case is quite surprising because it is as bad as normal
PF. This is because it does not take into account the time that a packet has already been
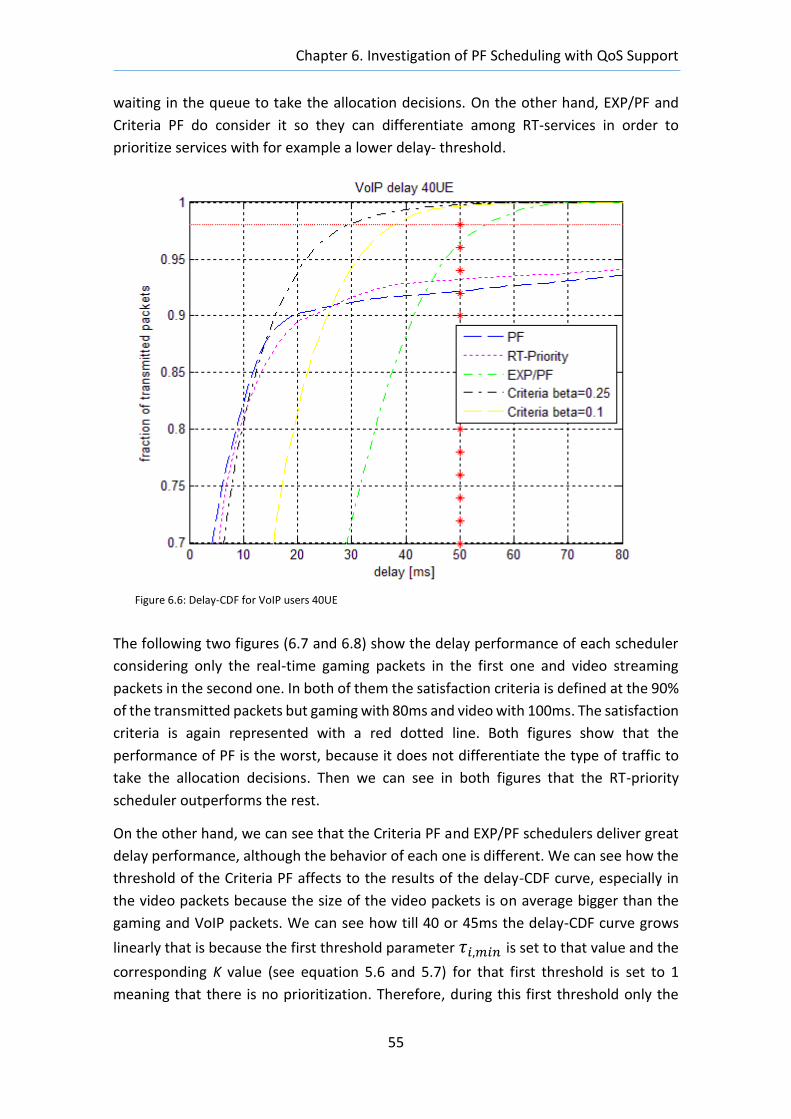
Chapter 6. Investigation of PF Scheduling with QoS Support
55
waiting in the queue to take the allocation decisions. On the other hand, EXP/PF and
Criteria PF do consider it so they can differentiate among RT-services in order to
prioritize services with for example a lower delay- threshold.
The following two figures (6.7 and 6.8) show the delay performance of each scheduler
considering only the real-time gaming packets in the first one and video streaming
packets in the second one. In both of them the satisfaction criteria is defined at the 90%
of the transmitted packets but gaming with 80ms and video with 100ms. The satisfaction
criteria is again represented with a red dotted line. Both figures show that the
performance of PF is the worst, because it does not differentiate the type of traffic to
take the allocation decisions. Then we can see in both figures that the RT-priority
scheduler outperforms the rest.
On the other hand, we can see that the Criteria PF and EXP/PF schedulers deliver great
delay performance, although the behavior of each one is different. We can see how the
threshold of the Criteria PF affects to the results of the delay-CDF curve, especially in
the video packets because the size of the video packets is on average bigger than the
gaming and VoIP packets. We can see how till 40 or 45ms the delay-CDF curve grows
linearly that is because the first threshold parameter 𝜏𝑖,𝑚𝑖𝑛 is set to that value and the
corresponding K value (see equation 5.6 and 5.7) for that first threshold is set to 1
meaning that there is no prioritization. Therefore, during this first threshold only the
Figure 6.6: Delay-CDF for VoIP users 40UE
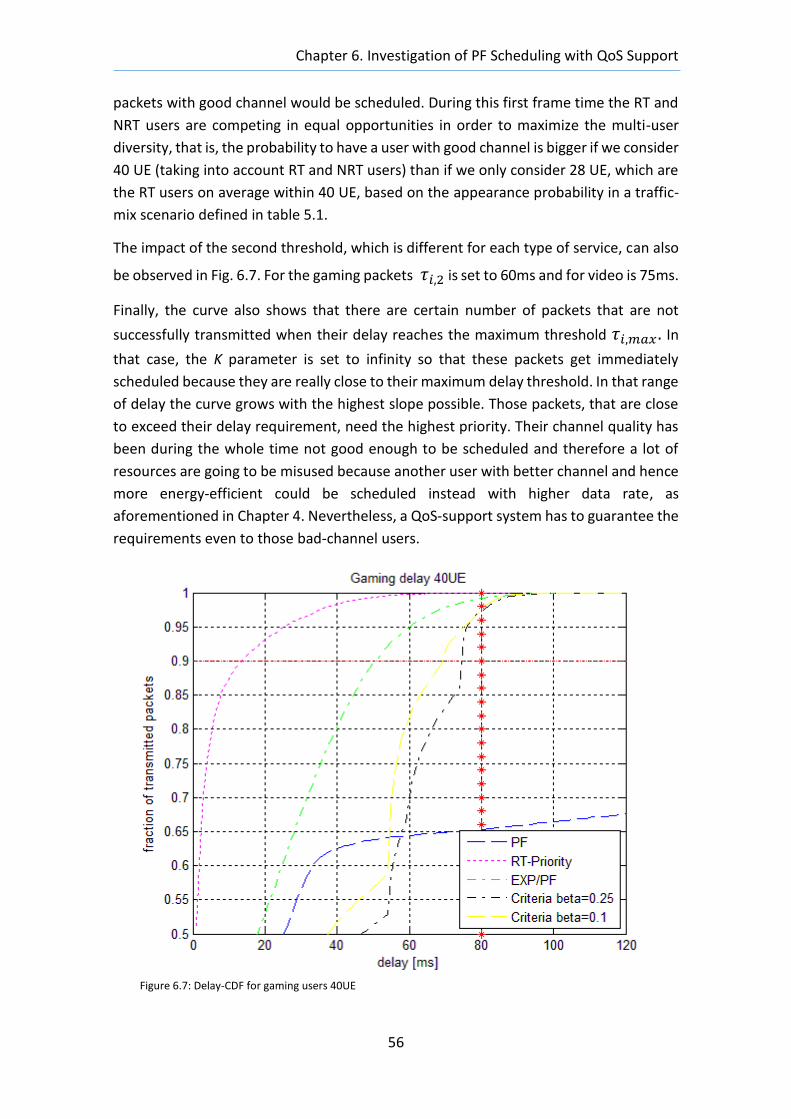
Chapter 6. Investigation of PF Scheduling with QoS Support
56
packets with good channel would be scheduled. During this first frame time the RT and
NRT users are competing in equal opportunities in order to maximize the multi-user
diversity, that is, the probability to have a user with good channel is bigger if we consider
40 UE (taking into account RT and NRT users) than if we only consider 28 UE, which are
the RT users on average within 40 UE, based on the appearance probability in a traffic-
mix scenario defined in table 5.1.
The impact of the second threshold, which is different for each type of service, can also
be observed in Fig. 6.7. For the gaming packets 𝜏𝑖,2 is set to 60ms and for video is 75ms.
Finally, the curve also shows that there are certain number of packets that are not
successfully transmitted when their delay reaches the maximum threshold 𝜏𝑖,𝑚𝑎𝑥 . In
that case, the K parameter is set to infinity so that these packets get immediately
scheduled because they are really close to their maximum delay threshold. In that range
of delay the curve grows with the highest slope possible. Those packets, that are close
to exceed their delay requirement, need the highest priority. Their channel quality has
been during the whole time not good enough to be scheduled and therefore a lot of
resources are going to be misused because another user with better channel and hence
more energy-efficient could be scheduled instead with higher data rate, as
aforementioned in Chapter 4. Nevertheless, a QoS-support system has to guarantee the
requirements even to those bad-channel users.
Figure 6.7: Delay-CDF for gaming users 40UE
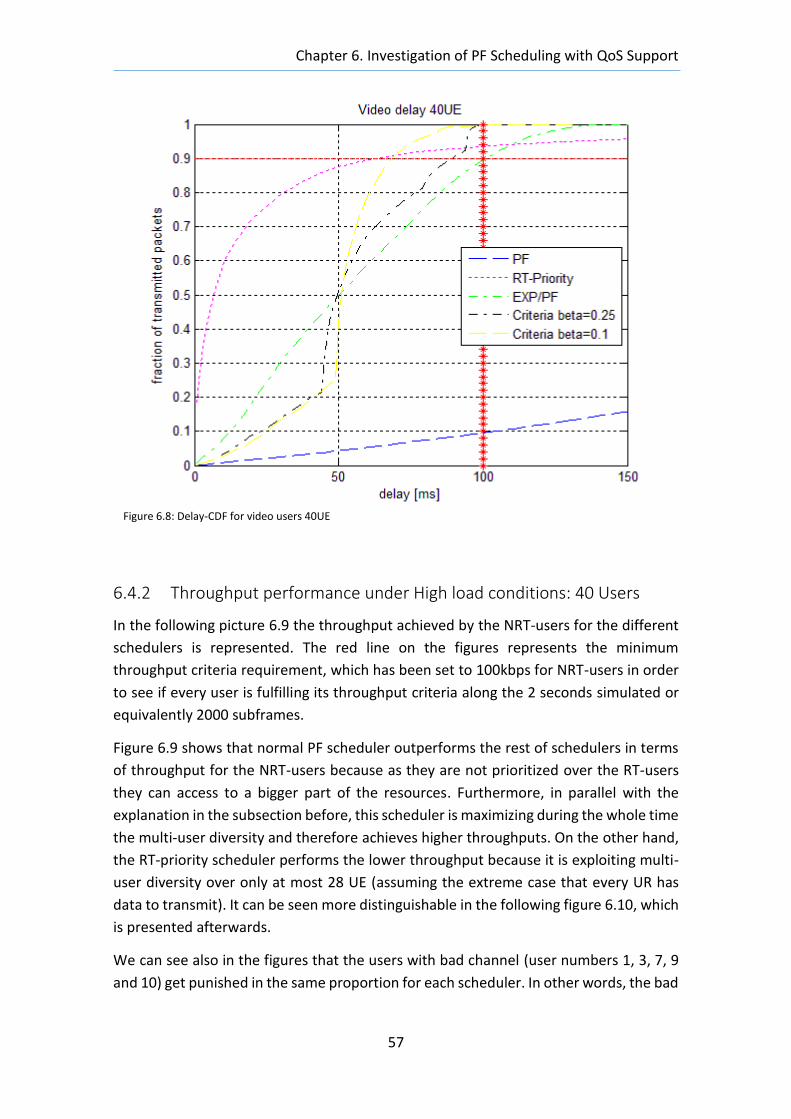
Chapter 6. Investigation of PF Scheduling with QoS Support
57
6.4.2 Throughput performance under High load conditions: 40 Users
In the following picture 6.9 the throughput achieved by the NRT-users for the different
schedulers is represented. The red line on the figures represents the minimum
throughput criteria requirement, which has been set to 100kbps for NRT-users in order
to see if every user is fulfilling its throughput criteria along the 2 seconds simulated or
equivalently 2000 subframes.
Figure 6.9 shows that normal PF scheduler outperforms the rest of schedulers in terms
of throughput for the NRT-users because as they are not prioritized over the RT-users
they can access to a bigger part of the resources. Furthermore, in parallel with the
explanation in the subsection before, this scheduler is maximizing during the whole time
the multi-user diversity and therefore achieves higher throughputs. On the other hand,
the RT-priority scheduler performs the lower throughput because it is exploiting multi-
user diversity over only at most 28 UE (assuming the extreme case that every UR has
data to transmit). It can be seen more distinguishable in the following figure 6.10, which
is presented afterwards.
We can see also in the figures that the users with bad channel (user numbers 1, 3, 7, 9
and 10) get punished in the same proportion for each scheduler. In other words, the bad
Figure 6.8: Delay-CDF for video users 40UE
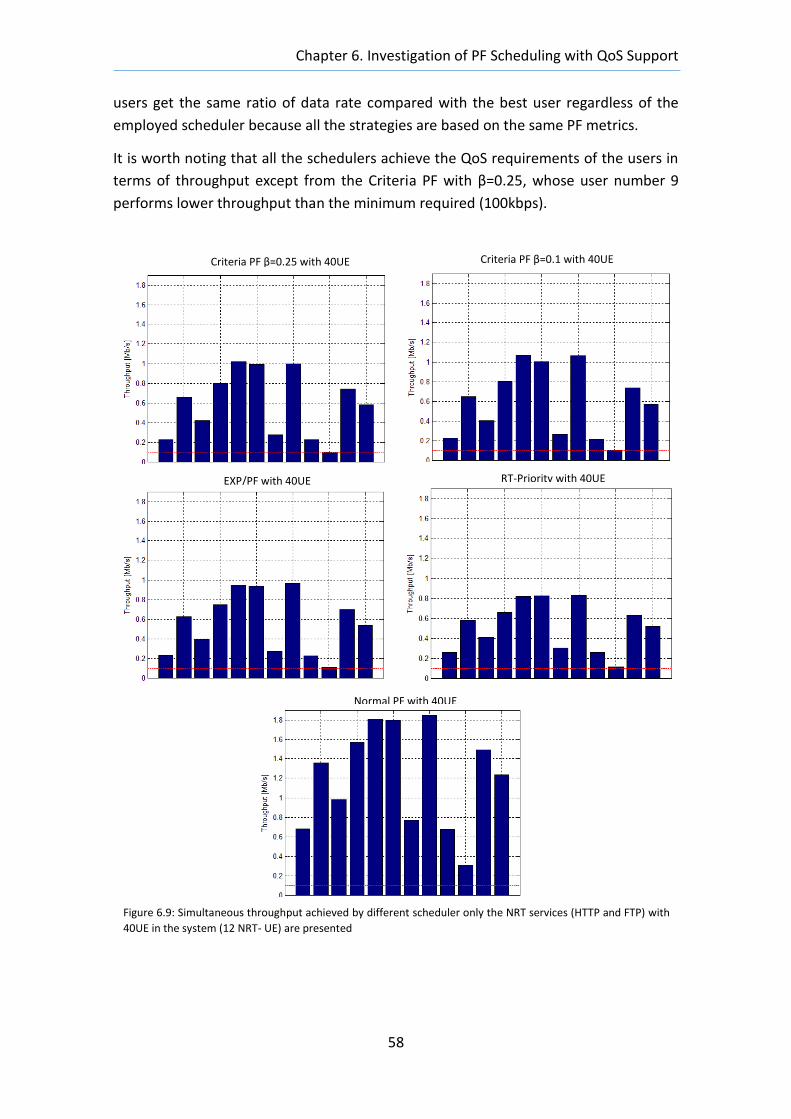
Chapter 6. Investigation of PF Scheduling with QoS Support
58
users get the same ratio of data rate compared with the best user regardless of the
employed scheduler because all the strategies are based on the same PF metrics.
It is worth noting that all the schedulers achieve the QoS requirements of the users in
terms of throughput except from the Criteria PF with β=0.25, whose user number 9
performs lower throughput than the minimum required (100kbps).
Figure 6.9: Simultaneous throughput achieved by different scheduler only the NRT services (HTTP and FTP) with
40UE in the system (12 NRT- UE) are presented
Criteria PF β=0.25 with 40UE
EXP/PF with 40UE RT-Priority with 40UE
Normal PF with 40UE
Criteria PF β=0.1 with 40UE
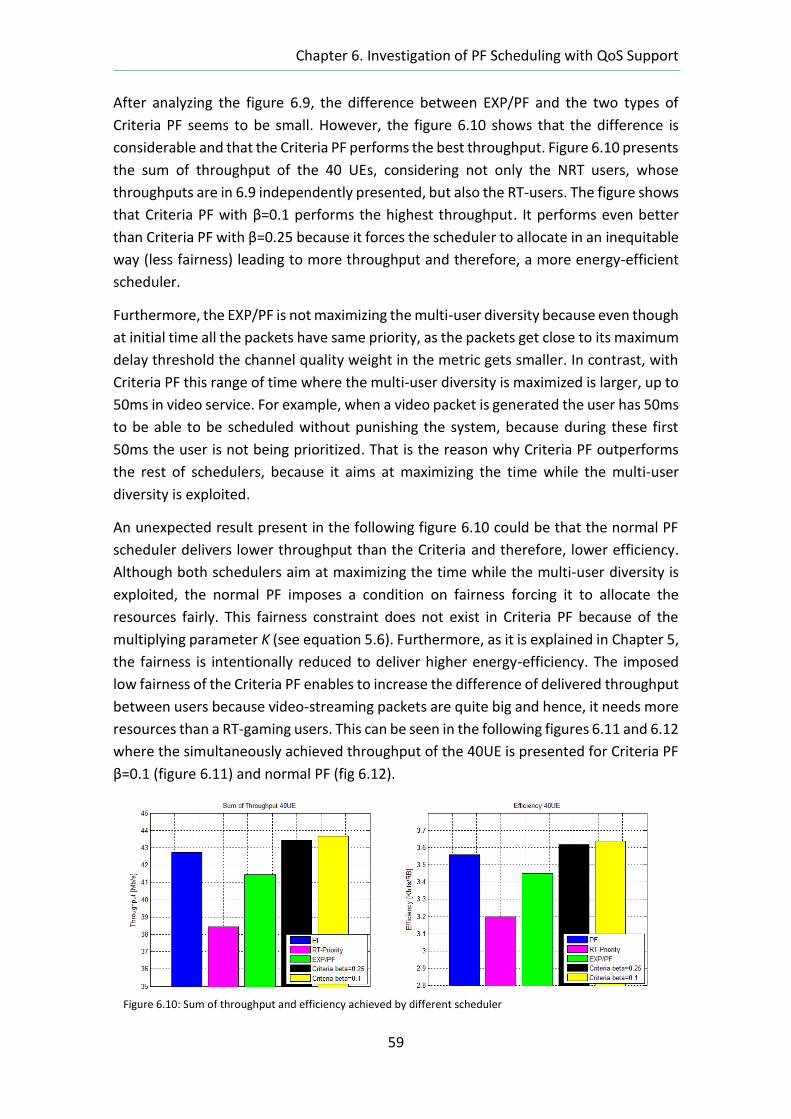
Chapter 6. Investigation of PF Scheduling with QoS Support
59
After analyzing the figure 6.9, the difference between EXP/PF and the two types of
Criteria PF seems to be small. However, the figure 6.10 shows that the difference is
considerable and that the Criteria PF performs the best throughput. Figure 6.10 presents
the sum of throughput of the 40 UEs, considering not only the NRT users, whose
throughputs are in 6.9 independently presented, but also the RT-users. The figure shows
that Criteria PF with β=0.1 performs the highest throughput. It performs even better
than Criteria PF with β=0.25 because it forces the scheduler to allocate in an inequitable
way (less fairness) leading to more throughput and therefore, a more energy-efficient
scheduler.
Furthermore, the EXP/PF is not maximizing the multi-user diversity because even though
at initial time all the packets have same priority, as the packets get close to its maximum
delay threshold the channel quality weight in the metric gets smaller. In contrast, with
Criteria PF this range of time where the multi-user diversity is maximized is larger, up to
50ms in video service. For example, when a video packet is generated the user has 50ms
to be able to be scheduled without punishing the system, because during these first
50ms the user is not being prioritized. That is the reason why Criteria PF outperforms
the rest of schedulers, because it aims at maximizing the time while the multi-user
diversity is exploited.
An unexpected result present in the following figure 6.10 could be that the normal PF
scheduler delivers lower throughput than the Criteria and therefore, lower efficiency.
Although both schedulers aim at maximizing the time while the multi-user diversity is
exploited, the normal PF imposes a condition on fairness forcing it to allocate the
resources fairly. This fairness constraint does not exist in Criteria PF because of the
multiplying parameter K (see equation 5.6). Furthermore, as it is explained in Chapter 5,
the fairness is intentionally reduced to deliver higher energy-efficiency. The imposed
low fairness of the Criteria PF enables to increase the difference of delivered throughput
between users because video-streaming packets are quite big and hence, it needs more
resources than a RT-gaming users. This can be seen in the following figures 6.11 and 6.12
where the simultaneously achieved throughput of the 40UE is presented for Criteria PF
β=0.1 (figure 6.11) and normal PF (fig 6.12).
Figure 6.10: Sum of throughput and efficiency achieved by different scheduler
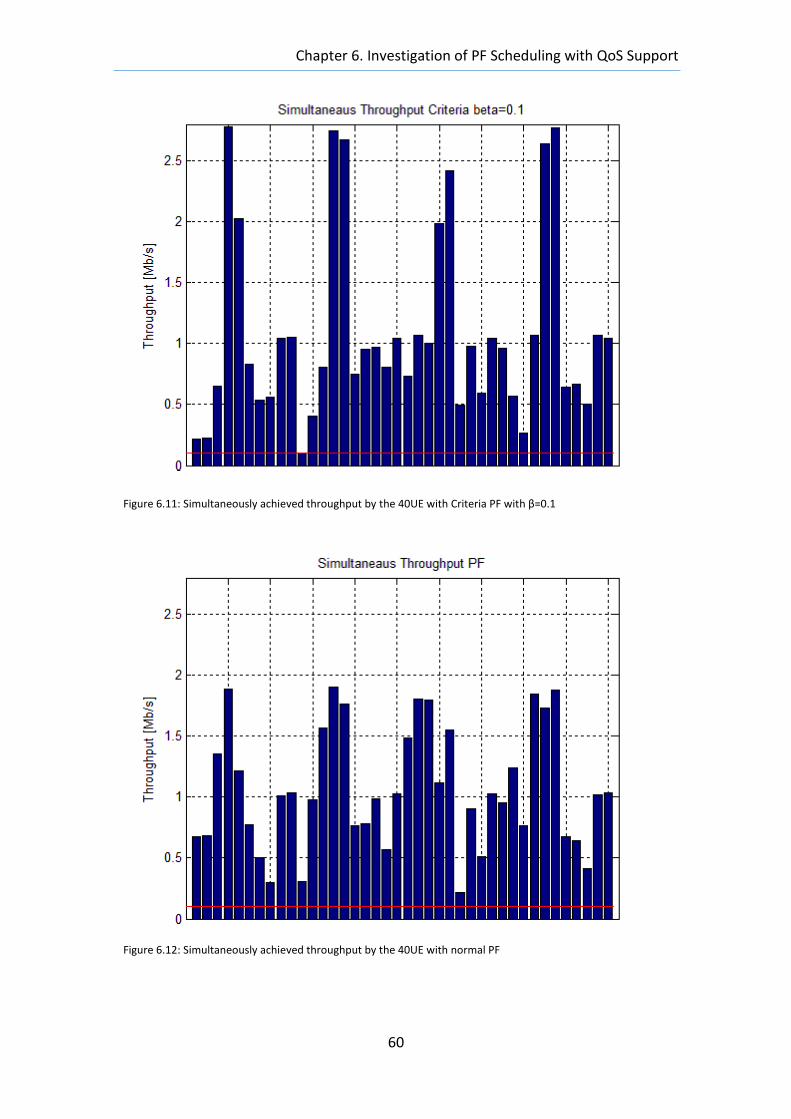
Chapter 6. Investigation of PF Scheduling with QoS Support
60
Figure 6.12: Simultaneously achieved throughput by the 40UE with normal PF
Figure 6.11: Simultaneously achieved throughput by the 40UE with Criteria PF with β=0.1
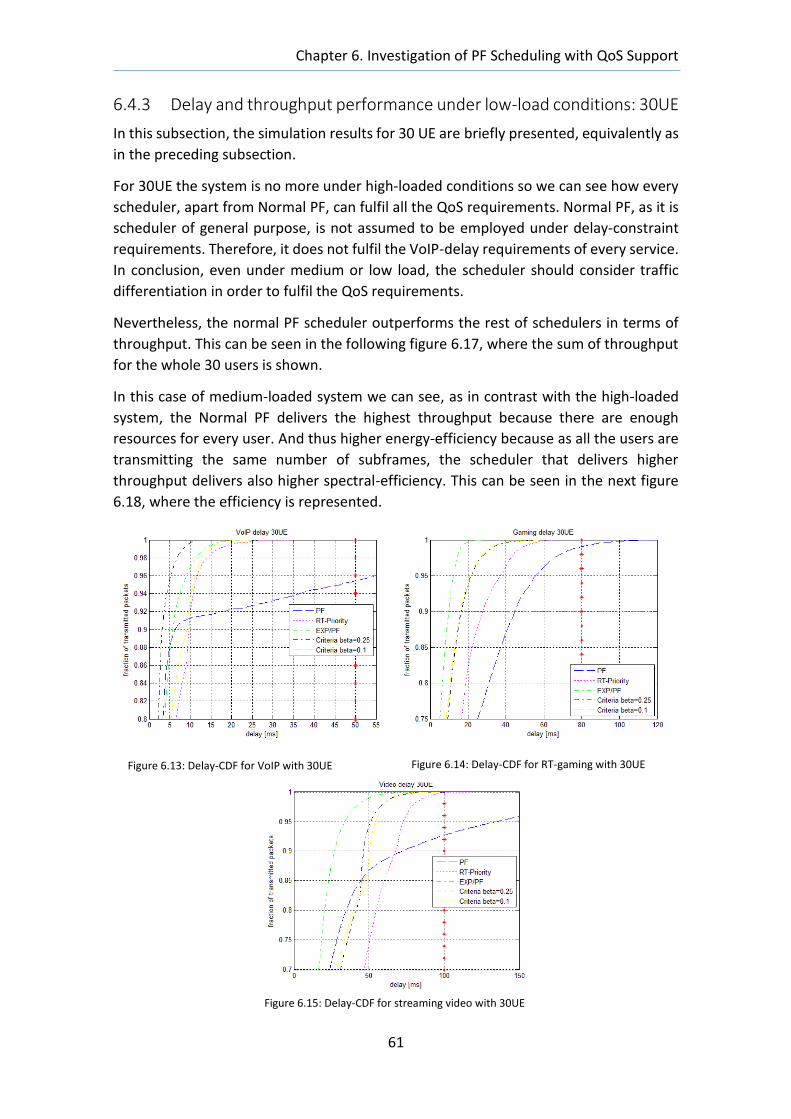
Chapter 6. Investigation of PF Scheduling with QoS Support
61
6.4.3 Delay and throughput performance under low-load conditions: 30UE
In this subsection, the simulation results for 30 UE are briefly presented, equivalently as
in the preceding subsection.
For 30UE the system is no more under high-loaded conditions so we can see how every
scheduler, apart from Normal PF, can fulfil all the QoS requirements. Normal PF, as it is
scheduler of general purpose, is not assumed to be employed under delay-constraint
requirements. Therefore, it does not fulfil the VoIP-delay requirements of every service.
In conclusion, even under medium or low load, the scheduler should consider traffic
differentiation in order to fulfil the QoS requirements.
Nevertheless, the normal PF scheduler outperforms the rest of schedulers in terms of
throughput. This can be seen in the following figure 6.17, where the sum of throughput
for the whole 30 users is shown.
In this case of medium-loaded system we can see, as in contrast with the high-loaded
system, the Normal PF delivers the highest throughput because there are enough
resources for every user. And thus higher energy-efficiency because as all the users are
transmitting the same number of subframes, the scheduler that delivers higher
throughput delivers also higher spectral-efficiency. This can be seen in the next figure
6.18, where the efficiency is represented.
Figure 6.13: Delay-CDF for VoIP with 30UE Figure 6.14: Delay-CDF for RT-gaming with 30UE
Figure 6.15: Delay-CDF for streaming video with 30UE
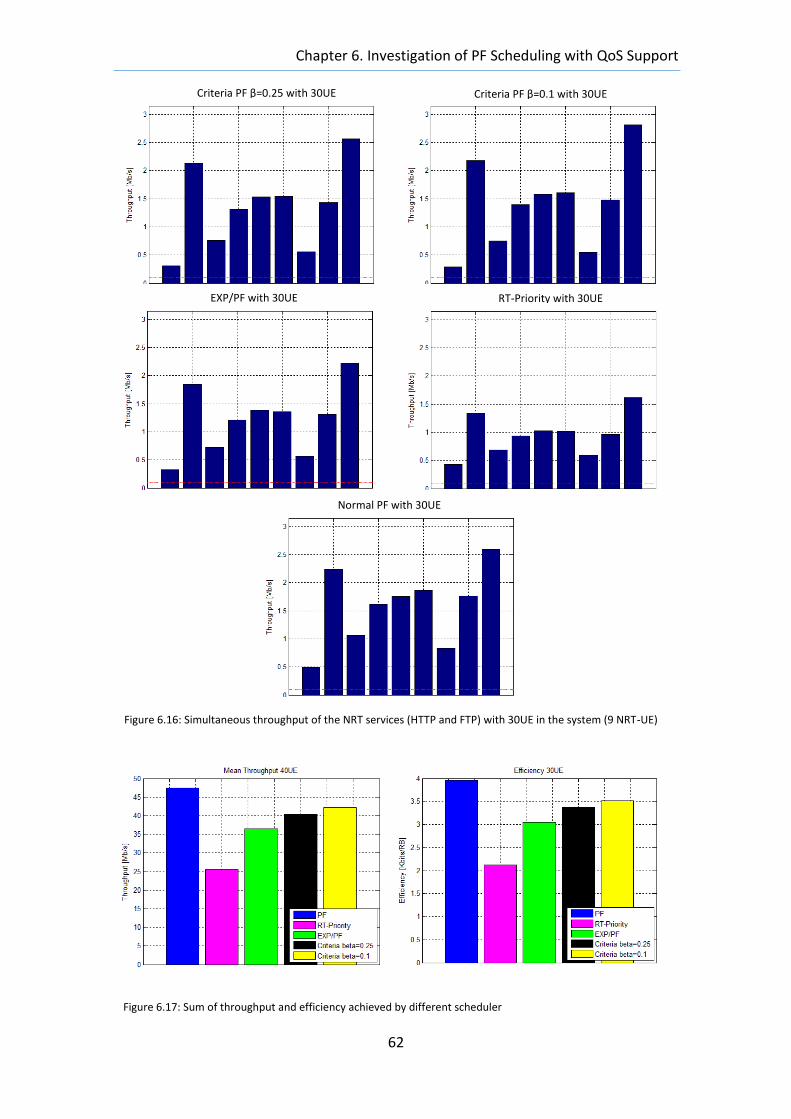
Chapter 6. Investigation of PF Scheduling with QoS Support
62
Figure 6.16: Simultaneous throughput of the NRT services (HTTP and FTP) with 30UE in the system (9 NRT-UE)
Criteria PF β=0.25 with 30UE
RT-Priority with 30UE EXP/PF with 30UE
Normal PF with 30UE
Criteria PF β=0.1 with 30UE
Figure 6.17: Sum of throughput and efficiency achieved by different scheduler
63
Chapter 7
Conclusions
7.1 Conclusion
The overall objective of this thesis is to design an energy-efficient packet scheduling
algorithm in the LTE Uplink. The main goal of this scheduler is to fulfil the expectations
of as many users in the system as possible, taking into account the QoS requirements of
their respective applications and in addition, avoiding energy waste in order to extend
battery life in the User Equipment (UE).
In the first place, an investigation of different allocation policies of general purpose is
carried out, where PF has proved to be a good starting point to develop our scheduler.
Second, an energy-efficient modification is proposed, as energy-efficiency is of special
interest of this thesis. Finally an implementation of different PF-based schedulers in a
traffic-mix scenario is carried out in order to compare in terms of delay, throughput and
energy-efficiency the different scheduler.
In conclusion, the work carried out during the last months has led to the development
of a scheduler that fulfils our requirements because it outperforms the rest of
schedulers considered. In particular our designed Criteria PF scheduler performs a good
throughput, it fulfils the high delay requirements that services such as VoIP and
streaming video and last but not least it outperforms the rest of scheduler in terms of
energy-efficiency. Besides, it meet the criteria presented on subsection 3.1.2, namely
the key points to design a scheduler
Of particular importance is the flexibility that our designed scheduler provides, which
allows operators to specifically match the requirements of its services. The energy-
saving under low-load conditions is also promising because of its practicability and the
enhancements that it provides.
To summarize, it is worth noting that this thesis addresses the energy-saving challenge
which in the oncoming years is going to be even more relevant. There are two main
reason. On the one hand, mobile communications require efficient approaches to
guarantee larger life-time in battery-powered devices. And on the other, the climate
considerations, in essence energy-saving solutions aim to reduce the greenhouse gases
and hence, the global warming.
Chapter 7. Conclusions
64
7.2 Future work: Topics for Future Research
Although that the proposed objectives are already fulfilled further work can be done in order to improve the energy-efficiency or the delay response. In conclusion, taking into account the frame of time available and the number of parameters involved in the scheduling the results are great. Nevertheless, innumerable improvements and adjustments to the involved parameters could be done in order to achieve better results, due to the flexibility that the proposed scheme allows.
There are two topics in the same direction as this thesis of special interest for future research. The first is the DRX/DTX mechanism, which was planned to be addressed but the time was not enough because countless new implementations would have to be done because the whole work of the thesis has been carried out in the Uplink simulator and these parameters should be taken into account in the opposite direction. And a second topic is Coordinated Scheduling, which is quite promising although it is still quite complex.
7.2.1 DRX/DTX Parameters
The main point of this DRX/DTX functionality is to make the terminal to not continuously monitor control channels, allowing it to turn the radio frequency modem in sleep state for long periods, activating it only in certain instants. It can be implemented as a Semi-persistent Scheduling strategy in order to assign a priori a fixed number of resources. For example for the VoIP service, as it is known a priori that it generates a packet each 20ms, we can reserve an amount of resources to transmit this packet every 20ms and the rest of the time the UE stays in a low-power state in order to save worthy energy and increase its life-time.
There are right now several parallel investigations because in the context of the energy-aware solutions, the DRX/DTX mechanism can make countless enhancements.
7.2.2 Coordinated Scheduling
The other proposed topic for future research is the coordinated scheduling.
One limiting aspect for system throughput performance in cellular networks is inter-cell
interference, especially for cell edge users and particularly to LTE, where the frequency
factor reuse is one. In order to reduce this inter-cell interference a coordinated
scheduling among the interconnected base stations would be very useful. It would imply
several restrictions in order to make the allocation decisions because of the variable
available resources, especially for the cell-edge users. Therefore, the inputs for the
scheduler would increase considerably. In addition, in order to allow coordinated
scheduling, communication between neighboring cells is required. If the neighboring
cells are managed by the same eNodeB, a coordinated scheduling strategy can be
followed without the need for standardized signaling. However, where neighboring cells
are controlled by different eNodeBs, standardized signaling is important, especially in
multivendor networks.
65
Bibliography
[1] 3GPP TS 36-Series, http://www.3gpp.org/.
[2a] C. Mehlführer, J. C. Ikuno, M. Šimko, S. Schwarz, M. Wrulich, and M. Rupp, “The
Vienna LTE Simulators - Enabling Reproducibility in Wireless Communications
Research”, EURASIP Journal on Advances in Signal Processing, 2011.
[3] Blumenstein, J., Ikuno, J.C., Prokopec, J. and Rupp, M. “Simulating the long term
evolution uplink physical layer”, ELMAR, 2011 Proceedings
[4] Orange, China Mobile, KPN, NTT DoCoMo, Sprint, T-Mobile, Vodafone, and Telecom
Italia, “R1-070674: LTE Physical Layer Framework for Performance Verification; 3GPP
TSG RAN WG1,” Tech. Rep.
[5] 3GPP Technical Specification 36.213, version 8.4.0, Physical layer procedures,
September 2008.
[6] 3GPP Technical Specification 36.211 Version 8.7.0 Group RAN, “Evolved Universal
Terrestrial Radio Access (E-UTRA), physical channels and modulation”, 2009
[7] 3GPP Technical Specification 36.212 Group RAN, “Evolved Universal Terrestrial
Radio Access (E-UTRA), multiplexing and channel coding”, 2009
[8] S. Schwarz, C Mehlführer, M Rupp, “Calculation of the spatial preprocessing and
link adaption feedback for 3GPP UMTS/LTE”. Proc. IEEE Wireless Advanced, London, UK
(2010)
[9] 3GPP RAN WG1 TR 25.814, “Physical Layer Aspects for Evolved UTRA, (Release 7)”,
V7.1.0, September 2006
[10] Lauridsen, M., Jensen, A.R., Mogensen, P. “Reducing LTE Uplink Transmission
Energy by Allocating Resources” Vehicular Technology Conference (VTC Fall), 2011
IEEE, September 2011
[11] R. Jain, D. Chiu, and W. Hawe, “A Quantitative Measure of Fairness and
Discrimination for Resource Allocation in Shared Computer Systems,” Tech. Rep. TR-
301, DEC, September 1984.
[12] S. Schwarz, C. Mehlführer, and M. Rupp, “Low Complexity Approximate Maximum
Throughput Scheduling for LTE,” in 44th Annual Asilomar Conference on Signals,
Systems, and Computers, Pacific Grove, California, Nov. 2010.
[13] C. H. Papadimitriou and K. Steiglitz, “Combinatorial Optimization: Algorithms and
Complexity”. Dover Pubn Inc, 2000.
[14] H. Kim and Y. Han, “A Proportional Fair Scheduling for Multicarrier Transmission
Systems,” IEEE Communications Letters, vol. 9, no. 3, 2005.
66
[15] Z. Sun, C. Yin, and G. Yue, “Reduced-Complexity Proportional Fair Scheduling for
OFDMA Systems,” in Proc. IEEE International Conference on Communications, Circuits
and Systems, 2006. vol. 2.
[16] R. Basukala; H.A. Mohd Ramh; K. Sandrasegaran, “Performance Analysis of EXP/PF
and M-LWDF in Downlink 3GPP LTE System” First Asian Himalayas International
Conference on Internet, Nov 2009.
[17] J.-H. Rhee, J. M. Holtzman, and D. K. Kim, "Scheduling of Real/Non-real Time
Services: Adaptive EXP/PF Algorithm," in the 57th IEEE Semiannual Vehicular
Technology Conference. vol. 1, 2003, pp. 462-466.
[18] J.-H. Rhee, J. M. Holtzman, and D. K. Kim, "Performance Analysis of the Adaptive
EXP/PF Channel Scheduler in an AMC/TDM System," IEEE Communications Letters, vol.
8, pp. 4978-4980, Aug. 2004.
[19] Erik Dahlman, Stefan Parkvall, and Johan Sköld, “4G LTE/LTE-Advanced for Mobile
Broadband”, 2011
[20] Stefania Sesia, Issam Toufik and Matthew Baker “LTE – The UMTS Long Term
Evolution: From Theory to Practice”, 2009
[21] S. Schwarz, C. Mehlfuhrer and M. Rupp. “Throughput maximizing multiuser
scheduling with adjustable fairness,” IEEE International Conference on Communications
(ICC), Kyoto, pp.1-5, Jun. 2011
[22]Martin Müller, Stefan Schwarz and Markus Rupp. “QoS Investigation of Proportional
Fair Scheduling in LTE Networks “, accepted for publication in IFIP Wireless Days
Conference, 2013
[23] Farooq Khan. “LTE for 4G Mobile Broadband”. Cambridge University Press,
Cambridge, 2009.
[24] Nokia. “DRX parameters in LTE”. R2 071285, 3rd Generation Partnership Project
(3GPP), 2007.
[25] Luis M. Correia, Dietrich Zeller, Ylva Jading, István Gódor, Gunther Auer, Liesbet Van
der Perre, “Challenges and Enabling technologies for Energy Aware Mobile Radio
Networks“, IEEE Communications Magazine, November 2010
[26] Wengerter, C. ; Panasonic R&D Center, Germany ; Ohlhorst, J. ; von Elbwart, A.G.E.
“Fairness and throughput analysis for generalized proportional fair frequency scheduling
in OFDMA”, Vehicular Technology Conference, IEEE 61st (Volume:3 ) . 2005
[27] Chandra S. Bontu, Ed. Illidge “DRX Mechanism for Power Saving in LTE”, IEEE
Communications Magazine, June 2009