Embed Size (px)
Citation preview
CARRAPATEENA PRE-FEASIBILITY STUDY3 SEPTEMBER 2014
“…there are very few projects like Carrapateena which offer the
potential of multi-decade production at low operating costs, with the
demonstrated potential for further discoveries nearby, located relatively
close to all necessary infrastructure and in one of the best and safest
mining jurisdictions in the world. We believe these features will be
highly attractive to potential partners to join with OZ Minerals in
advancing the development of the Carrapateena Project.”
Terry Burgess, Managing Director and CEO, OZ Minerals.

OZ Minerals | 2
DISCLAIMER
This document has been prepared by OZ Minerals Limited (“OZ Minerals”) and consists of written materials/slides for a presentation concerning OZ
Minerals. By viewing/attending this presentation, you agree to be bound by the conditions set out below.
No representation or warranty, express or implied, is made as to the accuracy or completeness of the information, contained in the presentation, or of
the views, opinions and conclusions contained in this material. To the maximum extent permitted by law, OZ Minerals and its related bodies corporate
and affiliates, and its and their respective directors, officers, employees, agents and advisers disclaim any liability (including, without limitation, any
liability arising from fault or negligence) for any loss, liability or damage arising from any use of this material or its contents, including any error or
omission therefrom, or otherwise arising in connection with it.
Forward Looking Statements
This document includes certain forward looking statements. Forward looking statements are often characterised by words such as “plan”, “expect”,
“project”, “intend”, “believe”, “anticipate”, “estimate” and other similar words, or statements that certain events or conditions “may”, “will” or “could”
occur. All statements, other than statements of historical fact included in this document, are forward looking statements. Such statements and
information in this document include, but are not limited to statements regarding mining parameters (including processing rates, and processing plant
feed), concentrate production, estimates of capital costs and operating costs, internal rates of return, net present values, availability and development
of infrastructure, life of mine estimates, annual mining and production estimates and targets, and revenue related assumptions such as commodity
prices and exchange rates. These statements represent current expectations and internal projections of the Company and are based on information
currently available to it. There can be no assurance that these statements will prove to be accurate and actual results and future events could differ
materially from those anticipated in the forward looking statements due to a number of factors, including levels of demand for commodities and
market prices, the ability to produce and transport products profitably, the impact of foreign currency exchange rates on market prices and operating
costs, operational problems, political uncertainty and economic conditions in relevant areas of the world, the actions of competitors and activities by
governmental authorities, such as changes in taxation or regulation.
Given these risks and uncertainties, undue reliance should not be placed on forward-looking statements which speak only as at the date of the
presentation. Subject to any continuing obligations under applicable law or any relevant stock exchange listing rules, OZ Minerals does not undertake
any obligation to publicly release any updates or revisions to any forward looking statements contained in this document, whether as a result of any
change in OZ Minerals’ expectations in relation to them, or any change in events, conditions or circumstances on which any such statement is based.
Certain statistical and other information included in this document is sourced from publicly available third party sources and has not been
independently verified.
All figures are expressed in Australian dollars unless otherwise stated.

OZ Minerals | 3
RESERVE AND RESOURCE COMPLIANCE
STATEMENTS
Carrapateena Mineral Resource estimate
The information set out in the table on page 10 that relates to Carrapateena Mineral Resource estimates as at 30 June 2013 is extracted from the
report entitled “Annual Carrapateena Mineral Resource Update and Mineral Resource Explanatory Notes as at 30 June 2013” which was released to
the market on 28 November 2013 and is available to view on at www.ozminerals.com/operations/resources--reserves.html. The company confirms
that it is not aware of any new information or data that materially affects the information included in the original market announcement and, in the
case of estimates of Mineral Resources, that all material assumptions and technical parameters underpinning the estimates in the relevant market
announcement continue to apply and have not materially changed. The company confirms that the form and context in which the Competent
Person’s findings are presented have not been materially modified from the original market announcement..
Carrapateena Ore Reserve estimate
The information set out in this table on page 10 that relates to Carrapateena Ore Reserve as at 15 August 2014 is extracted from the report entitled
“Carrapateena Ore Reserves Explanatory Notes as at 15 August 2014” which was released to the market on 18 August 2014 and is available to view
on www.ozminerals.com/operations/resources--reserves.html. The company confirms that it is not aware of any new information or data that
materially affects the information included in the original market announcement and, in the case of estimates of Ore Reserves , that all material
assumptions and technical parameters underpinning the estimates in the relevant market announcement continue to apply and have not materially
changed. The company confirms that the form and context in which the Competent Person’s findings are presented have not been materially
modified from the original market announcement.
Khamsin Mineral Resource estimate
The information in this presentation that relates to the Khamsin Mineral Resource as at 23 March 2014 (on page 25) is extracted from the report
entitled “Initial 202 million tonnes at 0.6 percent Copper Resource for Khamsin and Khamsin Mineral Resources Statement as at 23 March 2014”
which was released to the market on 26 May 2014 and is available to view on www.ozminerals.com/operations/resources--reserves.html. The
Company confirms that it is not aware of any new information or data that materially affects the information included in the original market
announcement and, in the case of estimates of Mineral Resources, that all material assumptions and technical parameters underpinning the
estimates in the original market announcement continue to apply and have not materially changed. The Company confirms that the form and
context in which the Competent Person’s findings are presented have not been materially modified from the original market announcement.
Fremantle Doctor Exploration ResultsThe information in this presentation that relates to Fremantle Doctor Exploration Results (on page 26) is extracted from the report entitled “Quarterly
Report for the three months ended 30 June 2014” which was released to the market on 15 July 2014 and is available to view on
http://www.ozminerals.com/investor-information/reports/quartely-reports.html. The Company confirms that it is not aware of any new information
or data that materially affects the information included in the original market announcement. The Company confirms that the form and context in
which the Competent Person’s findings are presented have not been materially modified from the original market announcement. Please refer to the original market announcement for JORC 2012 Table 1 Information.

OZ Minerals | 4
PROJECT HIGHLIGHTSLOW OPERATING COSTS, LONG LIFE, WELL LOCATED
Financial features1
• Projected net cash flow of $8.508 billion (including capital expenditure).
• Net present value of $1.146 billion post tax (at 8 percent real discount rate).
• Internal rate of return of 13 percent.
• Low C1 unit costs averaging US$0.49 cents per payable pound of copper.
Technical features
• Block caving technically feasible.
• Production of a high quality copper-gold concentrate with uranium below typical penalty
levels and no arsenic.
• Average annual production rate of 114,000 tonnes of copper, 117,000 ounces of gold
(at assumed steady state).
• Long mine-life of 24 years based only on Reserves.
Project features
• Low risk jurisdiction for mining.
• Good access to power, water, road, rail and ports.
• Climate and terrain suitable for mining.
• Supportive stakeholders and community.
• Approved Retention Lease in place for development of an exploration decline.1 All figures in Australian dollars unless otherwise stated.

OZ Minerals | 5
PROJECT LOCATIONFAVOURABLE TERRAIN AND CLIMATE FOR MINING
• Flat terrain.
• Low elevation.
• Low rainfall.
• Located outside the Woomera Prohibited
Area.
• 130 kilometres north of Port Augusta.
• 100 kilometres south-east of
Olympic Dam.
• 425 kilometres north-west of Adelaide.
• 250 kilometres south-east of
Prominent Hill.

OZ Minerals | 6
PROJECT LOCATIONWELL PLACED WITH RESPECT TO REGIONAL INFRASTRUCTURE
• Proposed site turn-off from
Stuart Highway approximately 135
kilometres from Port Augusta.
• Proposed site access road from
Stuart Highway ~50 kilometres.
• Water to be supplied by borefield to
be built ~55 kilometres from plant.
• Power via connection to the grid –
50 kilometres transmission line to be
built.
• Transport of concentrates in
containers.
• Haul road to be built to rail siding.
• Concentrate transport to Port
Adelaide via existing railway.
• Fly-in, fly-out service from Adelaide.
Conceptual site layout

OZ Minerals | 7
MINING METHODBLOCK CAVING
Lift OneHeight: 500 metres
Area: 106,500m2
Hydraulic Radius: 57 metres
Cave layout: Teniente
Drawbell spacing: 32m X 17m
Undercutting: Post undercut
Production rate: 12.4Mtpa
Ore Reserves: 110Mt @ 0.9% Cu, 0.5g/t Au
Underground operations
• Fleet of 16 load haul dump loaders.
• Two jaw-gyratory crushers per lift.
• Access via two declines - first developed via
tunnel boring, second by drill and blast.
• Production conveyor to surface.
Lift Two Height: 500 metres
Area: 97,400m2
Hydraulic Radius: 57metres
Cave layout: Teniente
Drawbell spacing: 34m X 17m
Undercutting: Post undercut
Production rate: 12.4Mtpa
Ore Reserves: 160Mt @ 1.0% Cu, 0.4g/t Au

OZ Minerals | 8
PROCESSING PLANTCONVENTIONAL PROCESSING
The metallurgical process proposed for Carrapateena is well-tested and consists of:
• Crushed run of mine ore stockpiling and reclaiming;
• Grinding, classification and pebble crushing;
• Rougher flotation;
• Rougher concentrate regrind;
• Scalping of rougher concentrate to final concentrate;
• Three stages of cleaner flotation;
• Concentrate filtration and storage;
• Tailings thickening and disposal.
PROCESS WATER DAM
ORE STOCKPILEGRINDING
PEBBLE CRUSHER
FLOTATION
CONCENTRATE FILTRATION
CONCENTRATE STORAGE
TAILINGS THICKENER
REAGENTS

OZ Minerals | 9
AktogayAntucoyaBozshakol
Carrapateena
Caserones
Cobre Panama - Phase IConstanciaLas Bambas
Ministro Hales - Phase I
Mount Milligan
Oyu Tolgoi - Phase ISalobo I & II
Sentinel
Sierra Gorda - Phase I
Toromocho - Phase I
Red Chris
0
5,000
10,000
15,000
20,000
25,000
30,000
35,000
40,000
0.00 0.50 1.00 1.50 2.00 2.50
Cap
ital
Inte
nsi
ty (
US
$/t
an
nu
al
Cu
Eq
Pro
du
cti
on
)
C1 Cash Cost (US$/lb Cu)
Low cash costs, competitive capital intensity, globally relevant production*
Bubble size = Copper equivalent annual production
GLOBALLY COMPETITIVEVERY LOW CASH COSTS
Source: Company reports, OZ Minerals
* Major recently developed or in-construction greenfield projects. Capital intensity is total spend to reach first production. Carrapateena capital intensity
includes Feasibility Study costs, other projects do not.

OZ Minerals | 10
FINANCIAL METRICSSIGNIFICANT CASH FLOW GENERATION
Economic assumptions
Copper US$3.20/lb or $7,055/t
Gold US$1,225oz
A$/US$ 0.82
A$ commodities Copper A$3.90/lb~ $8,600/t
Gold $1,493/oz
Sales and marketing assumptions
Copper % payable 96.6% (concentrate grade averages 30-35%)
TC/RC US$80/$0.08
Royalties (net smelter return) 2% for first five years, then 5%
Key financial metrics
Total revenue* A$22,091m
Project capital - pre-production A$2,985m
Total capital – life of project A$4,354m
Total net cash flow A$8,508m
Average C1 cost US$0.49/lb
Internal rate of return 13%
Pre tax net present value at 8% real discount rate A$2,012m
Post tax net present value at 8% real discount rate A$1,146m
* Revenue from copper, gold and silver sales, less TC/RCs, sea freight, and royalties.

OZ Minerals | 11
OPPORTUNITIESTO BE FURTHER ASSESSED
• Extensions to Lift One and Lift Two footprints
and development of ‘Lift Three’.
• Exploitation of the Khamsin deposit or other
regional exploration targets in district.
• Mining fleet automation – potential to reduce
operating labour component.
• Use of ports closer to Carrapateena.
• Incremental increase in plant throughput or a
reduction in equipment sizing.
• Synergies with Prominent Hill e.g. utilising the
Prominent Hill plant by railing ore to
Prominent Hill or relocating the plant.
Cross section of Carrapateena deposit
showing potential extension areas
Potential extension zones
OZ Minerals | 12
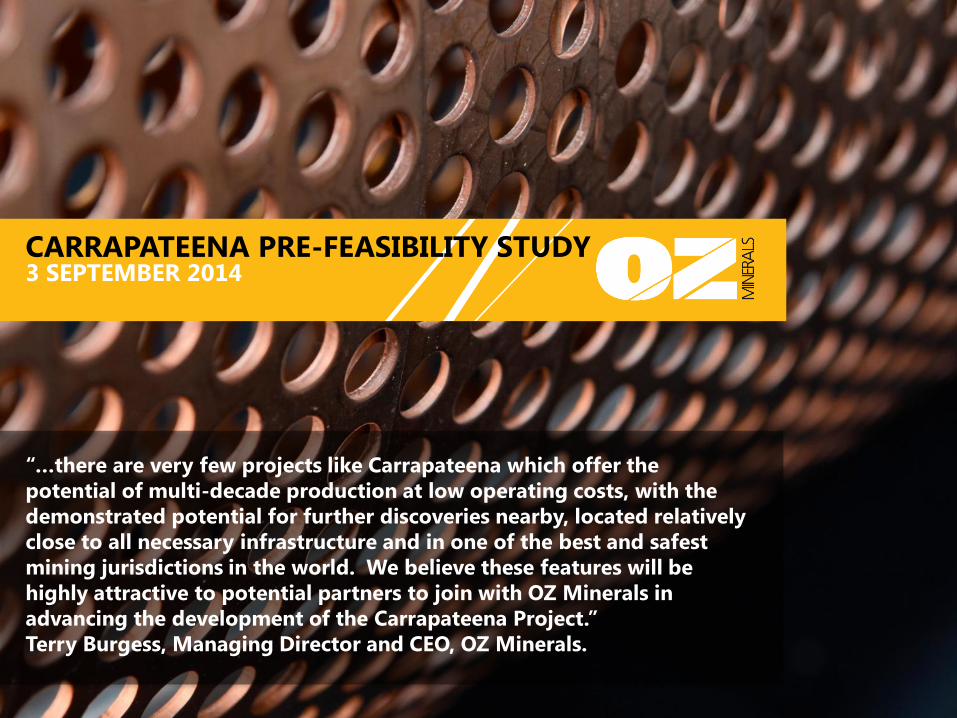
CARRAPATEENA CONCEPTUAL TIMELINE
*Disclaimer - the company has not made a commitment to the schedule which
remains conceptual only. Discussions with third parties interested in participating
in the project continue.
2015 2016 2017 2018 2019 2020 2021 2022 2023
YEAR -6 YEAR -5 YEAR -4 YEAR -3 YEAR -2 YEAR -1 YEAR 1 YEAR 2 YEAR 3
FEASIBILITY
STUDY
TBM – ACCESS
DECLINE
ACCESS AND
GEOTECH
EARLY WORKS
MINE DEVELOPMENT
INFRASTRUCTURE & PROCESS PLANT IMPLEMENTATION
PRE-PRODUCTION PHASE
COMMISSIONING
& PRODUCTION
RAMP-UP
CONCENTRATE
PRODUCTION
CAVING
COMMENCED
MIN
E L
EA
SE
AP
PR
OV
AL
PR
OJE
CT
AP
PR
OV
AL
ST
AR
T O
F M
INE
PR
OD
UC
TIO
N
PR
OJE
CT
CO
MP
LET
ION
BC
1 F
ULL
PR
OD
UC
TIO
N

OZ Minerals | 13
SUMMARYLOW OPERATING COSTS, LONG LIFE, WELL LOCATED
• Pre-Feasibility study completed to a very high standard.
• Deposit suitable for block caving – in line with current global operations and
developments.
• High quality copper concentrate.
• Projected net cash flow of $8.508 billion.
• Net present value of $1.146 billion post tax (at an 8 percent real discount rate).
• Very low operating costs of US$0.49 cents per payable pound.
• Competitive capital intensity.
• Long life.
• Low risk mining jurisdiction.
• Well located with respect to regional infrastructure, terrain and climate.
• Upside opportunities.


![Block Caving [Recuperado]](https://img.dokumen.tips/doc/110x75/55cf8c685503462b138c1152/block-caving-recuperado.jpg)