Embed Size (px)
Citation preview

Type 2 diabetes is associated with lower cognitive performances in a cohort of HIV-infected patients. ANRS CO3 Aquitaine Cohort, Bordeaux, France, 2007-2009
Carole Dufouil (1,2), Laura Richert (1,2), Mathias Bruyand(1,3), Hélène Amieva (1,2), Frédéric-Antoine Dauchy (3), Carine Greib (4), Jean-François Dartigues (1,2,3), Didier Neau (3), François Dabis (1,2,3), Philippe Morlat (1,2,3), Fabrice Bonnet (1,2,3), Geneviève Chêne (1,2,3) and the ANRS CO3 Aquitaine Study Group
(1) INSERM, Bordeaux School of Public Health (ISPED), Centre INSERM U897 & CIC-EC7, F-33000 Bordeaux, France(2) Univ. Bordeaux, ISPED, Centre INSERM U897, F-33000 Bordeaux, France(3) CHU de Bordeaux, F-33000 Bordeaux, France(4) CHU de Bordeaux, F-33000 Pessac, France

Background (1)
HIV-infected patients receiving combination antiretroviral therapy Higher prevalence of vascular risk factors :
hypercholesterolemia, diabetes, smoking Higher risk of cardiovascular morbidity Accelerated/accelerated aging notably of cognitive
functions
Link between cardiovascular risk factors and cognition Well established from studies on population-based
studies on ageing Rarely investigated in HIV-infected cohorts
Background (2)
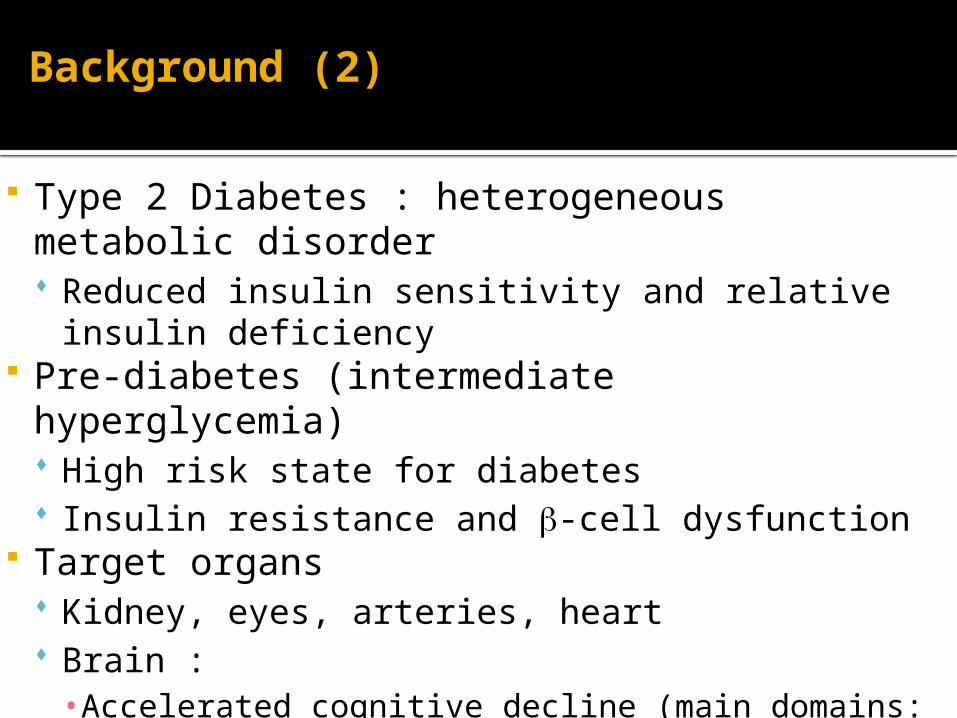
Type 2 Diabetes : heterogeneous metabolic disorder Reduced insulin sensitivity and relative insulin
deficiency Pre-diabetes (intermediate hyperglycemia)
High risk state for diabetes Insulin resistance and b-cell dysfunction
Target organs Kidney, eyes, arteries, heart Brain :• Accelerated cognitive decline (main domains: executive functions, psychomotor speed and attention)• Risk of Alzheimer's disease : 50-100% higher in T2 diabetics
Objectives
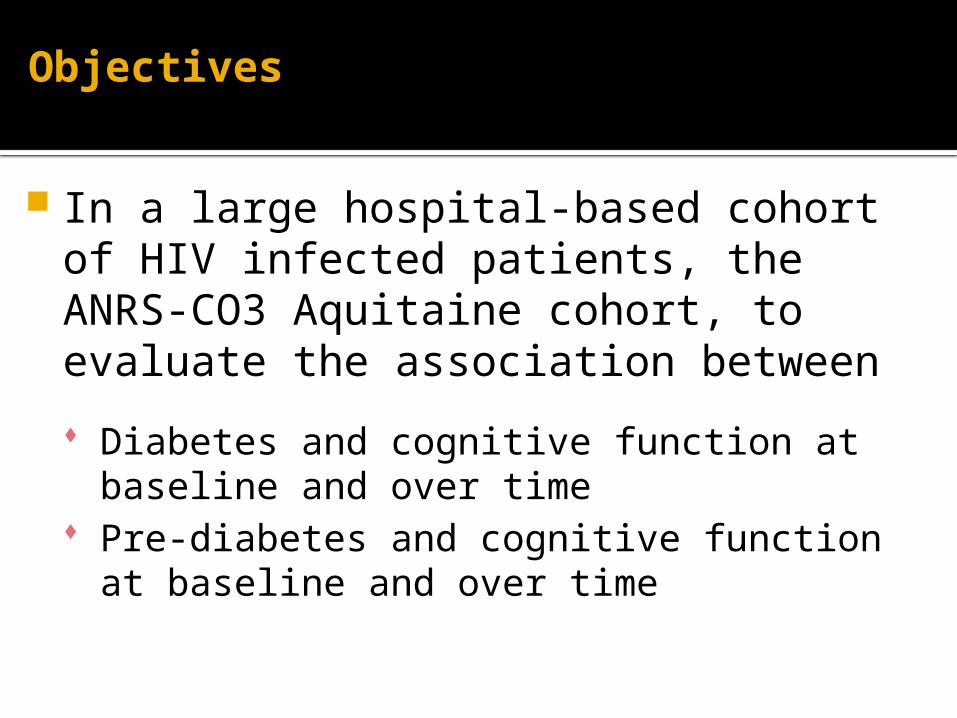
In a large hospital-based cohort of HIV infected patients, the ANRS-CO3 Aquitaine cohort, to evaluate the association between
Diabetes and cognitive function at baseline and over time
Pre-diabetes and cognitive function at baseline and over time
Methods (1)
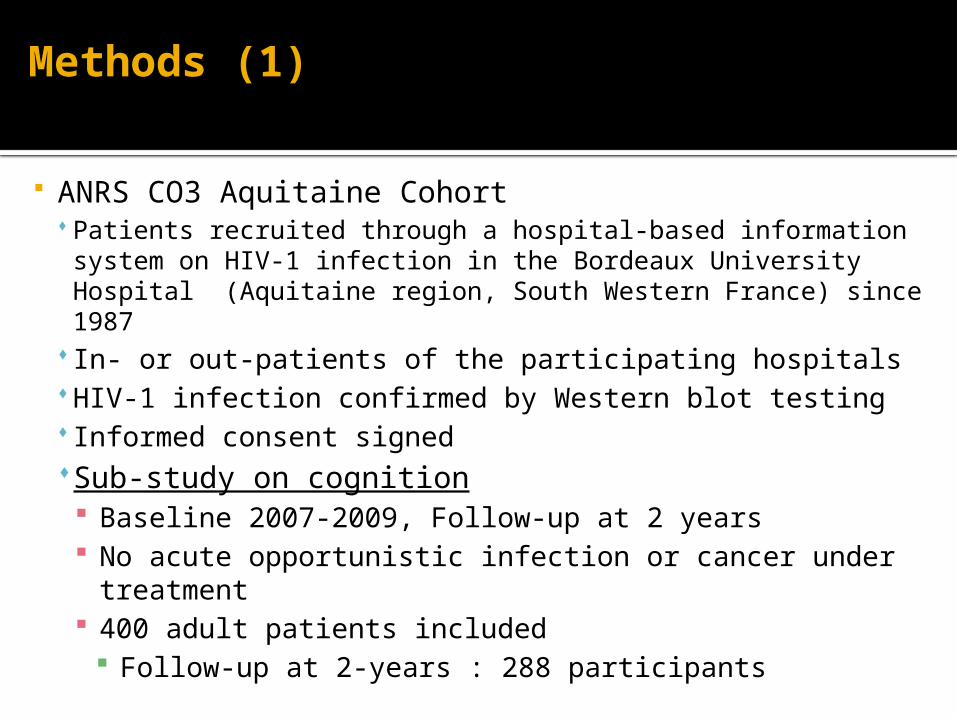
ANRS CO3 Aquitaine Cohort Patients recruited through a hospital-based information system on HIV-1 infection in the Bordeaux University Hospital (Aquitaine region, South Western France) since 1987
In- or out-patients of the participating hospitalsHIV-1 infection confirmed by Western blot testing Informed consent signedSub-study on cognition Baseline 2007-2009, Follow-up at 2 years No acute opportunistic infection or cancer under
treatment 400 adult patients included
Follow-up at 2-years : 288 participants

Methods (2)
Assessment of several cognitive domains "Trail making test" : Attention and executive functions "Digit Symbol Substitution test" : Psychomotor speed "Purdue Pegboard Test" : Manual dexterity and coordination "Rey complex figure test" : Visuospatial abilities "Digit span" : Working memory "Grober & Buschke" : Episodic memory "Isaac Set Test" : Semantic Fluency
Categories for glycaemia status Diabetes : at least two glycaemia >7 mmol/L or at least one
glycaemia >11.1 mmol/L or use of anti-diabetic drug prior inclusion
Impaired glycaemia : at least two measures of glycaemia between 6.1 and 7 mmol/L prior inclusion
Normal : otherwise

Methods (3)
Polytomous logistic regression computed to investigate the association between glycaemia status and neurocognitive impairment categories (Revised research criteria for HIV-associated neurocognitive disorders; Frascati, 2007)
Covariance analysis computed to investigate the association between glycaemia status and Raw cognitive test scores Annualized percentage of change in cognition
Adjusting for age, gender, education, depression, HIV transmission category, CD4+ lymphocytes count, HIV-RNA, exposure to ART (including Stavudine, Didanosine, Indinavir), AIDS stage, and hypertension, hypercholesterolemia, BMI, smoking status
Inverse probability weighting to correct for attrition
Baseline characteristics
Baseline (N=400)
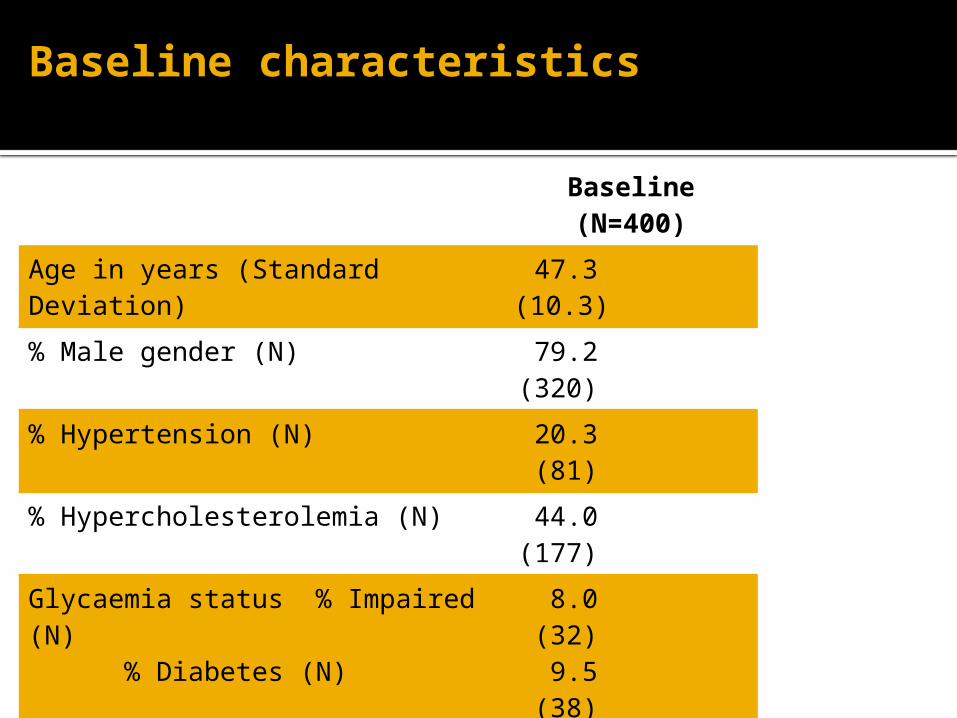
Age in years (Standard Deviation) 47.3(10.3)
% Male gender (N) 79.2(320)
% Hypertension (N) 20.3(81)
% Hypercholesterolemia (N) 44.0(177)
Glycaemia status % Impaired (N)
% Diabetes (N)
8.0(32)9.5
(38)
% On antiretroviral treatment (N) 89.0(356)
% AIDS stage (N) 24.0(96)
% Current HIV-1 RNA level <500 copies/ml
85.0(340)
Median CD4 nadir/mm3 (IQR) 260(154-385)
Median CD4 count/mm3 (IQR) 515(350-700)

Baseline characteristics
- 26 treated - 12 elevated
glyc. levels
Baseline (N=400)
Age in years (Standard Deviation) 47.3(10.3)
% Male gender (N) 79.2(320)
% Hypertension (N) 20.3(81)
% Hypercholesterolemia (N) 44.0(177)
Glycaemia status % Impaired (N)
% Diabetes (N)
8.0(32)9.5
(38)
% On antiretroviral treatment (N) 89.0(356)
% AIDS stage (N) 24.0(96)
% Current HIV-1 RNA level <500 copies/ml
85.0(340)
Median CD4 nadir/mm3 (IQR) 260(154-385)
Median CD4 count/mm3 (IQR) 515(350-700)
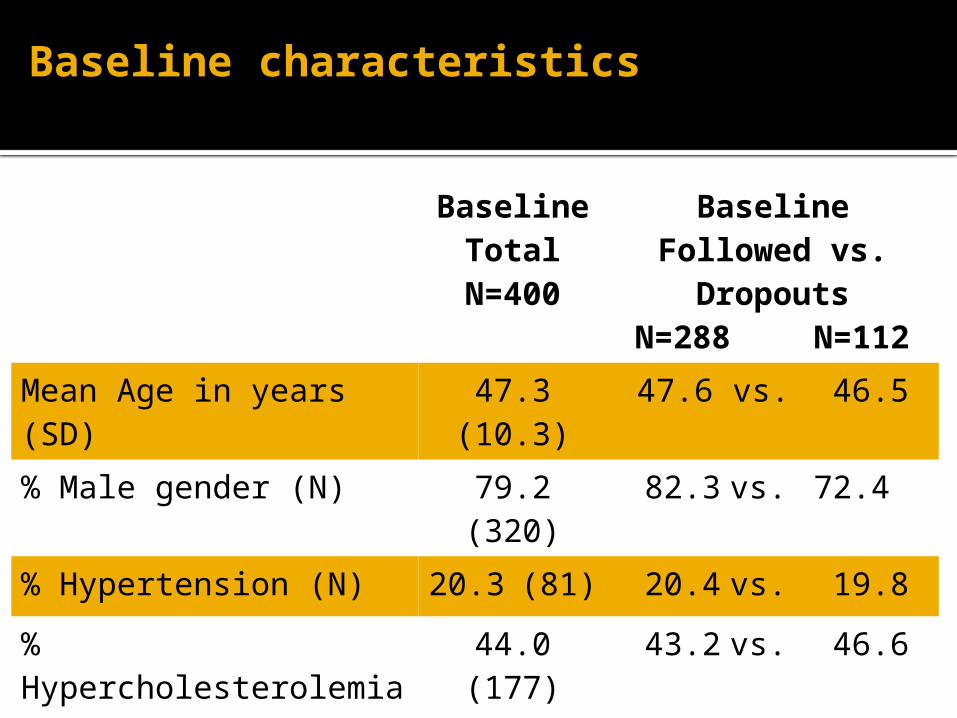
Baseline characteristics
BaselineTotal
N=400
BaselineFollowed vs.
DropoutsN=288
N=112
Mean Age in years (SD) 47.3(10.3)
47.6 vs. 46.5
% Male gender (N) 79.2 (320) 82.3 vs. 72.4
% Hypertension (N) 20.3 (81) 20.4 vs. 19.8
% Hypercholesterolemia (N)
44.0 (177) 43.2 vs. 46.6
Glycaemia status% Impaired (N)% Diabetes (N)
8.0 (32)9.5 (38)
8.3 vs. 7.19.7 vs. 8.9

Glycaemia status according to neurocognitive impairment at baseline
Prevalence of neurocognitive impairment ▪ Asymptomatic neurocognitive disorders (ANI): 21.0%(n=84)▪ Mild neurocognitive disorder (MND): 32.0%(n=126)▪ HIV-associated dementia (HAD): 6.7%(n=27)
NCI CategoriesNormal ANIMND+HADN=163 N=84N=153
GLYCAEMIA STATUS
NORMAL (N=330) 88.5 4.2 7.3
PRE-DIABETES (N=32)
78.6 9.5 11.9
DIABETES (N=38) 77.1 11.8 11.1P=0.44, in multivariable analyses

Trail Making Test (part B)
Performance at Trail Making Test B is measured through a time to perform a task. The higher the time, the worse the performance

Cognitive performances distribution
COGNITIVE TESTS
DISTRIBUTION
Baseline (N=400)Mean (SD)
Trail Making Test B 4.80 (4.63)
Digit Symbol Substitution
44.6 (13.1)
Purdue Pegboard Test 48.7 (2.6)
Rey complex figure test
17.7 (6.5)
Digit Span 4.10 (1.28)
Grober and Buschke 12.3 (2.5)
Isaac Set test 47.3 (9.6)
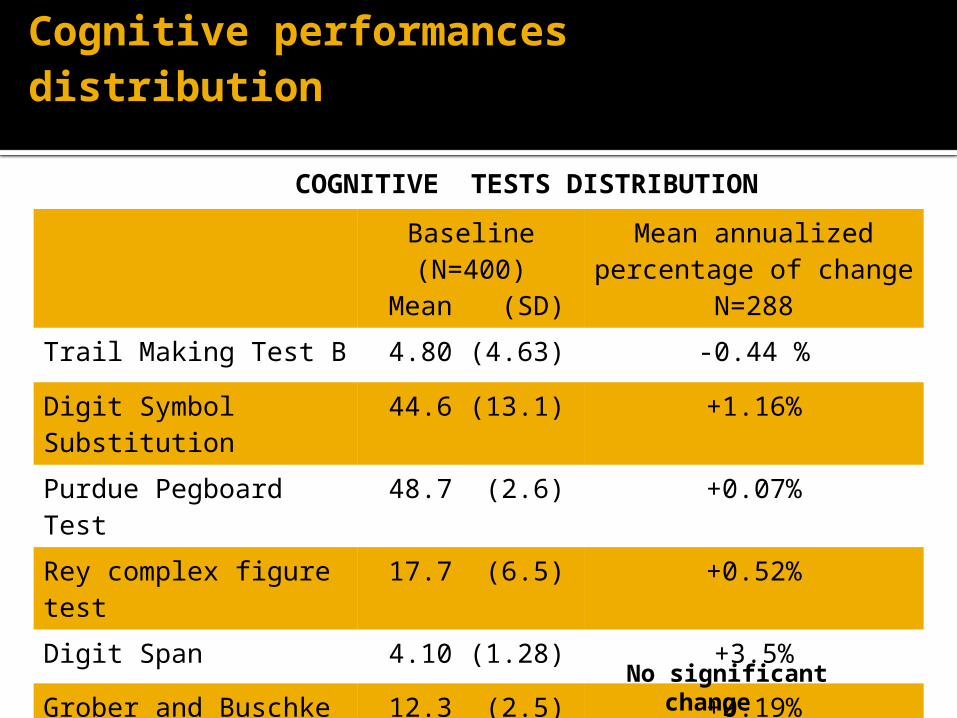
Cognitive performances distribution
COGNITIVE TESTS DISTRIBUTION
Baseline (N=400)
Mean (SD)
Mean annualizedpercentage of change
N=288
Trail Making Test B 4.80 (4.63) -0.44 %
Digit Symbol Substitution
44.6 (13.1) +1.16%
Purdue Pegboard Test 48.7 (2.6) +0.07%
Rey complex figure test
17.7 (6.5) +0.52%
Digit Span 4.10 (1.28) +3.5%
Grober and Buschke 12.3 (2.5) +0.19%
Isaac Set test 47.3 (9.6) +2.02%No significantchange
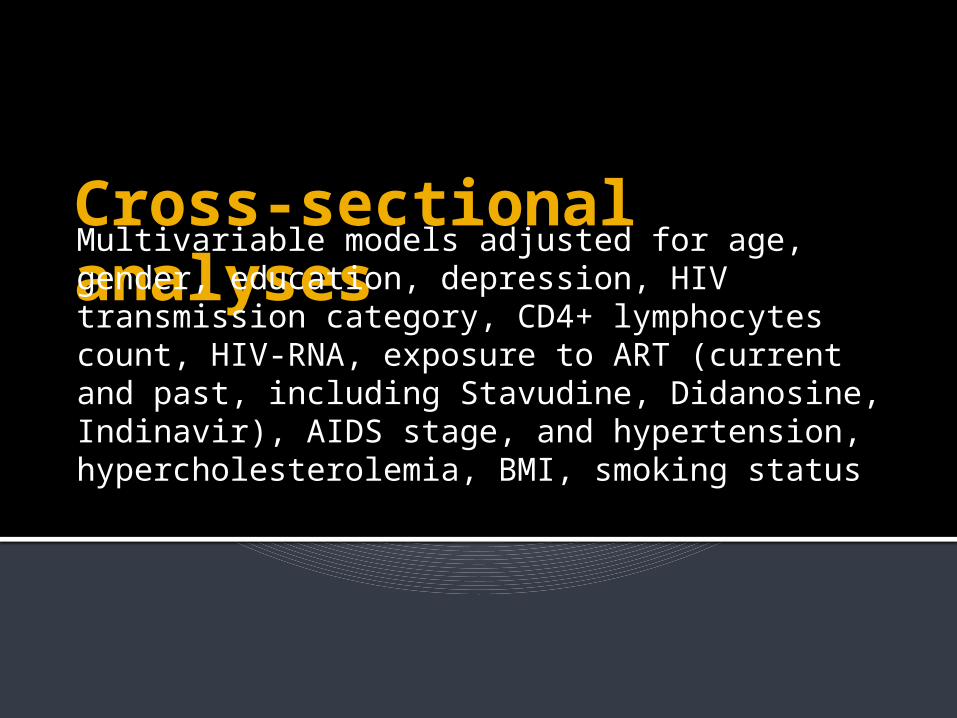
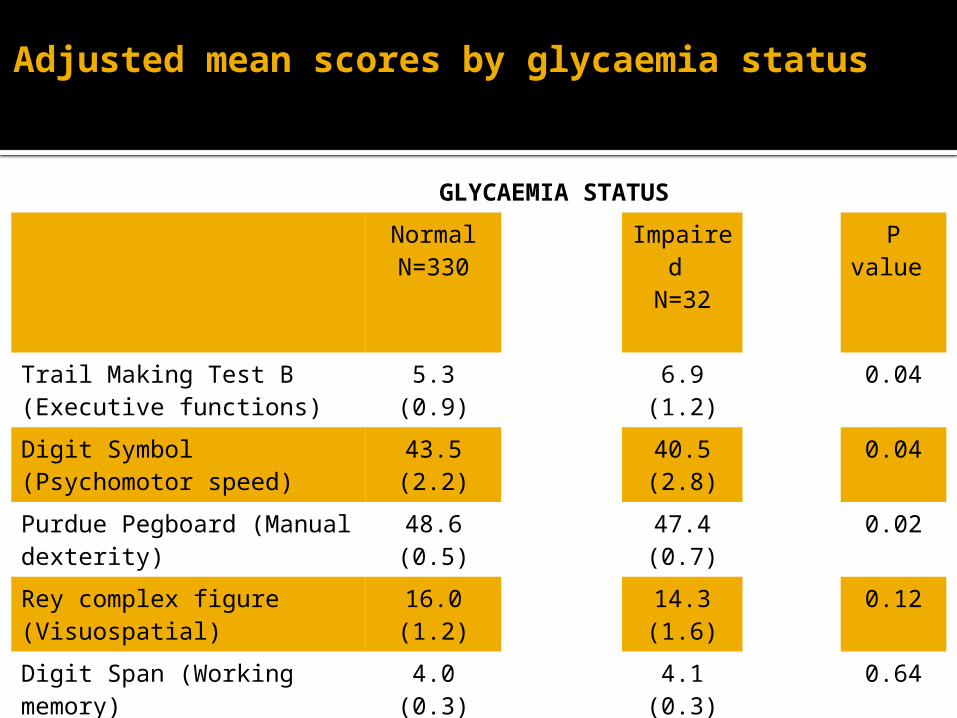
Cross-sectional analysesMultivariable models adjusted for age, gender, education, depression, HIV transmission category, CD4+ lymphocytes count, HIV-RNA, exposure to ART (current and past, including Stavudine, Didanosine, Indinavir), AIDS stage, and hypertension, hypercholesterolemia, BMI, smoking status

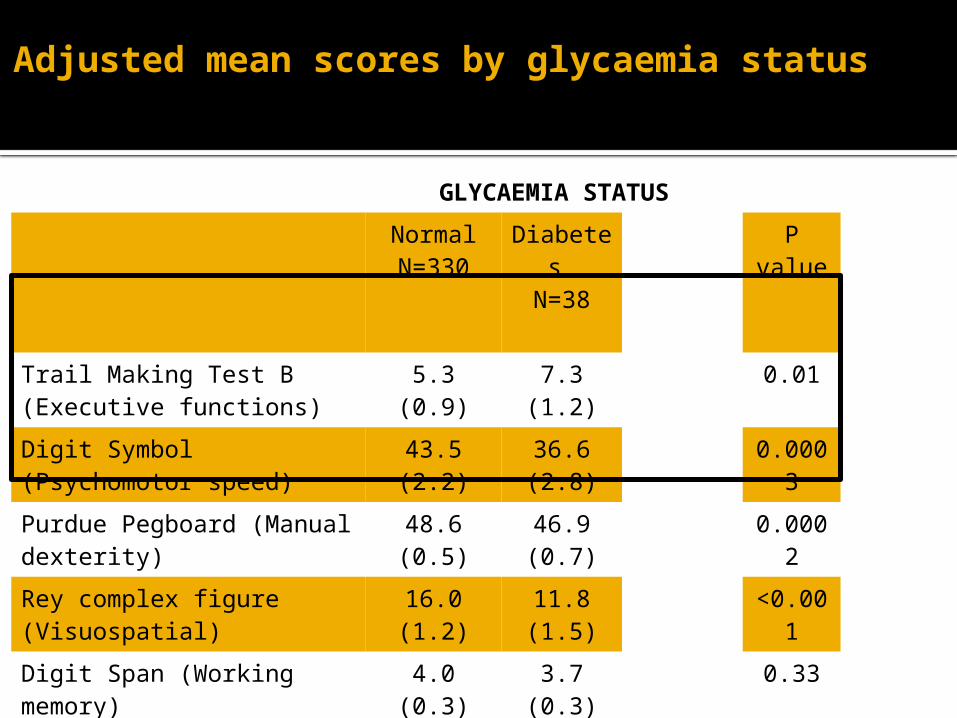
Adjusted mean scores by glycaemia status
GLYCAEMIA STATUS
NormalN=330
Diabetes
N=38
Impaired
N=32
P value
P value
Trail Making Test B (Executive functions)
5.3 (0.9) 7.3 (1.2)
6.9 (1.2)
0.01 0.04
Digit Symbol (Psychomotor speed)
43.5 (2.2)
36.6 (2.8)
40.5 (2.8)
0.0003
0.04
Purdue Pegboard (Manual dexterity)
48.6 (0.5)
46.9 (0.7)
47.4 (0.7)
0.0002
0.02
Rey complex figure (Visuospatial)
16.0 (1.2)
11.8 (1.5)
14.3 (1.6)
<0.001
0.12
Digit Span (Working memory)
4.0 (0.3) 3.7 (0.3)
4.1 (0.3)
0.33 0.64
Grober and Buschke(Episodic memory)
11.7 (0.5)
10.2 (0.6)
11.9 (0.6)
0.0002
0.61
Isaac Set test (Semantic fluency)
45.4 (1.8)
41.7 (2.4)
43.1 (2.4)
0.02 0.04
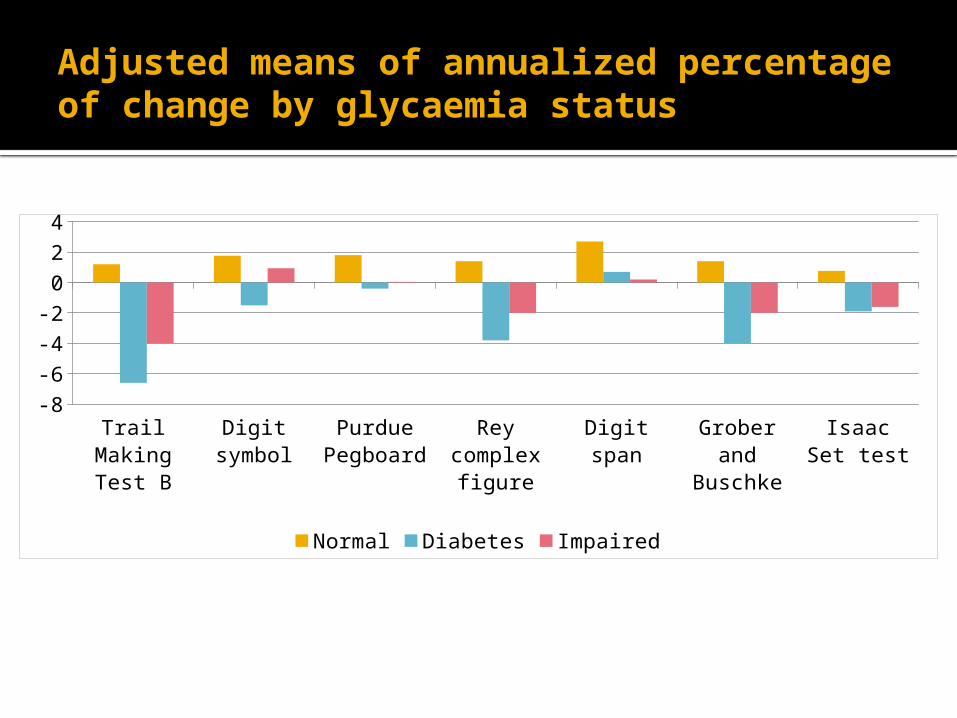
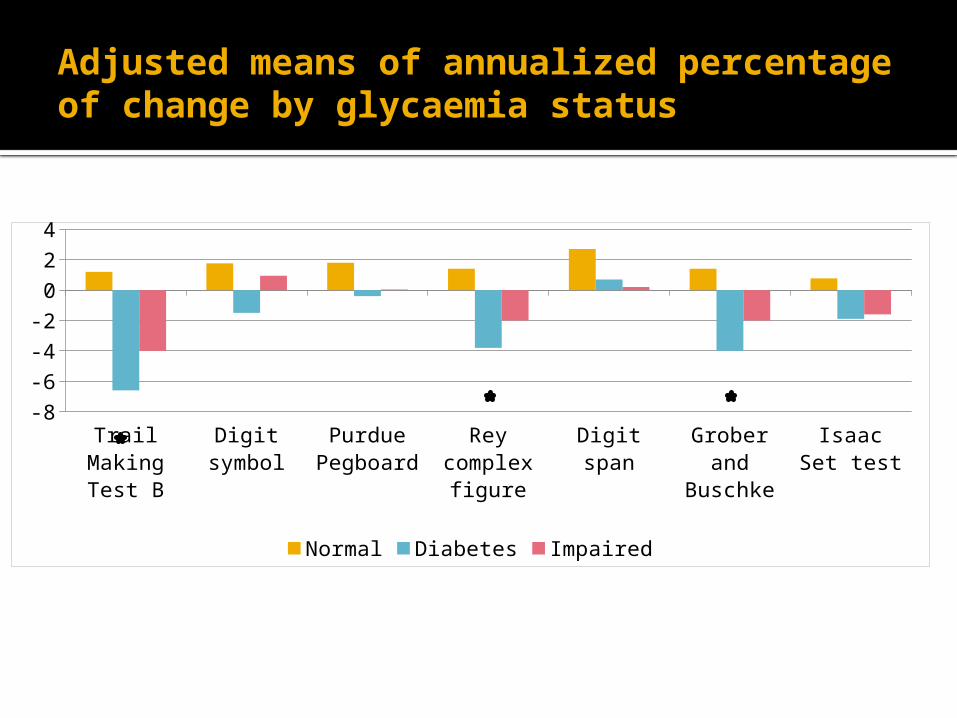
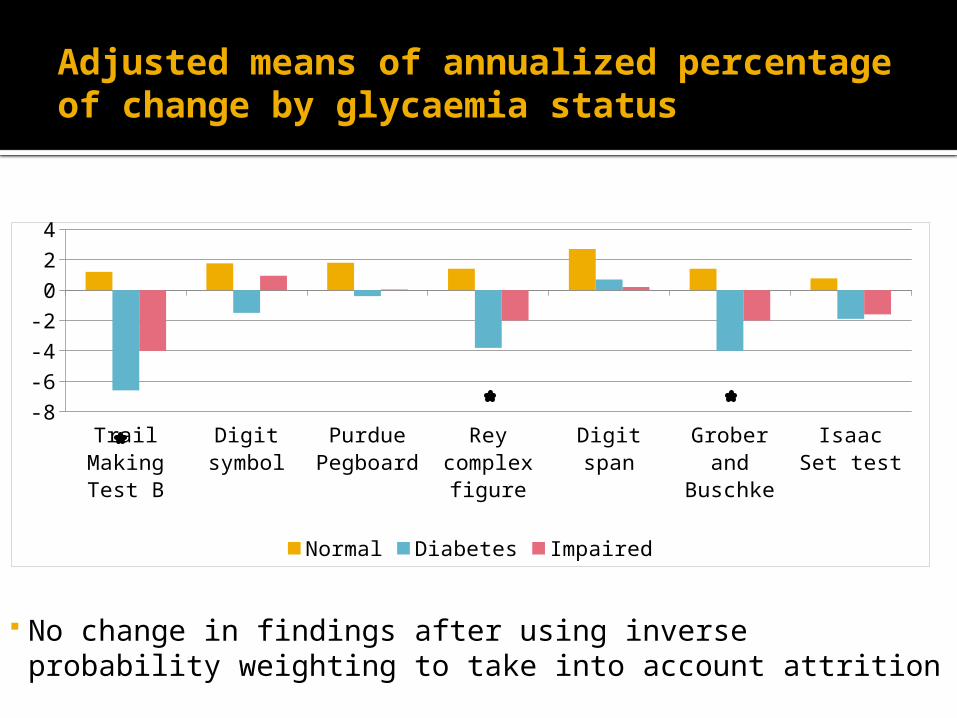
Longitudinal analyses: annualized percentage of changeMultivariable models adjusted for baseline age, gender, education, depression, HIV transmission category, CD4+ lymphocytes count, HIV-RNA, exposure to ART (current and past, incl. Stavudine, Didanosine, Indinavir), AIDS stage, and hypertension, hypercholesterolemia, BMI, smoking status
-8
-4
0
4
Normal Diabetes Impaired
Adjusted means of annualized percentage of change by glycaemia status
Adjusted means of annualized percentage of change by glycaemia status
-8
-4
0
4
Normal Diabetes Impaired
Adjusted means of annualized percentage of change by glycaemia status
-8
-4
0
4
Normal Diabetes Impaired
No change in findings after using inverse probability weighting to take into account attrition
Conclusion & perspectives (1)
In summary Largest study with follow-up available Diabetic patients perform worse on average on cognitive tests
especially those assessing executive functions, attention and psychomotor speed
No association with other cardiovascular risk factors (results not shown)
Not evidenced when all categories of NCI are used
Published findings In HIV patients : Diabetes and dementia (Valcour 2005) Diabetes and NCI in older patients (McCutchan 2012)

Conclusion & perspectives (2)
Potential mechanism Brain Micro- or macro-vascular damages Neuro-Inflammation
Implications for daily clinical practice Detect and control diabetes at the earliest possible stage, Healthy lifestyle, limit prescription of ARV treatment associated
with diabetes
Future analyses Impact of glycaemia control (glycaeted hemoglobin) and change
in glycaemia status Longer neurocognitive follow-up and brain imaging
ANRS CO3 Aquitaine CohortComposition of the Groupe d’Epidémiologie Clinique du Sida en Aquitaine (GECSA):Coordination: F. DabisScientific committee: F. Bonnet, S. Bouchet, F. Dabis, M. Dupon, G. Chêne, H. Fleury, V. Gaborieau, D. Lacoste, D. Malvy, P. Mercié, I. Pellegrin, P. Morlat, D. Neau, JL. Pellegrin, S. Tchamgoué, R. Thiébaut.
Epidemiology and Methodology: M. Bruyand, G. Chêne, F. Dabis, S. Lawson-Ayayi, R. Thiébaut, L. Wittkop.
Infectious Diseases and Internal Medicine:CHU de Bordeaux: P. Morlat (F. Bonnet, N. Bernard, M. Hessamfar, D. Lacoste, MA. Vandenhende) ; M. Dupon (FA. Dauchy, H. Dutronc) ; M. Longy-Boursier (P. Mercié, P. Duffau, J. Roger Schmeltz) ; D. Malvy (T. Pistone, MC Receveur) ; D. Neau (C. Cazanave, A. Ochoa, T. Pistone, MO. Vareil) ; JL. Pellegrin (JF. Viallard, C. Greib, E. Lazaro)CHG d’Arcachon : A. Dupont. CHG de Dax : Y. Gerard, K. André, L. CaunègreCHG de Bayonne : F. Bonnal, S. Farbos, MC. Gemain. CHG de Libourne : J. Ceccaldi, S. TchamgouéCHG de Mont-de-Marsan : S. De Witte, C. Courtault CHG de Pau : E. Monlun, V. GaborieauCHG de Périgueux : P. Lataste, JP. Meraud CHG de Villeneuve-sur-Lot : I. Chossat.
Immunology: JF. Moreau, I. Pellegrin. Virology: H. Fleury, ME. Lafon, B. Masquelier, P. Trimoulet. Pharmacology: D. Breilh, S. Bouchet, M. Molimard, K. Titier. Drug monitoring: F. Haramburu, G. Miremont-Salamé. Data collection and processing: MJ. Blaizeau, M. Decoin, J. Delaune, S. Delveaux, C. D’Ivernois, C. Hanappier, O. Leleux, E. Lenaud, B. Uwamaliya-Nziyumvira, X. Sicard. Computing and Statistical analysis: V. Conte, A. Frosh, S. Geffard, J. Leray, I. Louis, G. Palmer, D. Touchard.
Members of the GECSA-COGLOC Study Group: M. Allard, H. Amieva, M. Auriacombe, S. Auriacombe, E. Bestaven, F. Bonnet, M. Bruyand, M. Campoy, G. Catheline, G. Chêne, G. Coldefy, F. Dabis, J.-F. Dartigues, F.-A. Dauchy, S. Delveaux, P. Dehail, C. Dufouil, C. Greib, C. Lewden, J. Macua, F. Marquant, F. Matharan, P. Mercié, C. Milien, P. Morlat, N. Raoux, L. Richert.