Embed Size (px)
Citation preview
CARMEN for the storage and analysis of rich datasets obtained from 60 and 4,096 channels MEA
recordings of retinal activity
Evelyne Sernagor

Spontaneous activity in the immature retina
• Present during a short developmental window
• Consists of recurring bursts in RGCs, correlated between neighbouring cells, resulting in propagating waves
• Episodes occur every few minutes• Patterns change with development• Important for wiring the visual
system

Retinal waves are believed to drive the wiring of retinal projections
Important wave features
Asynchrony between both eyes
Wave spatial extent
Synchronisation between neighbouring ganglion cells

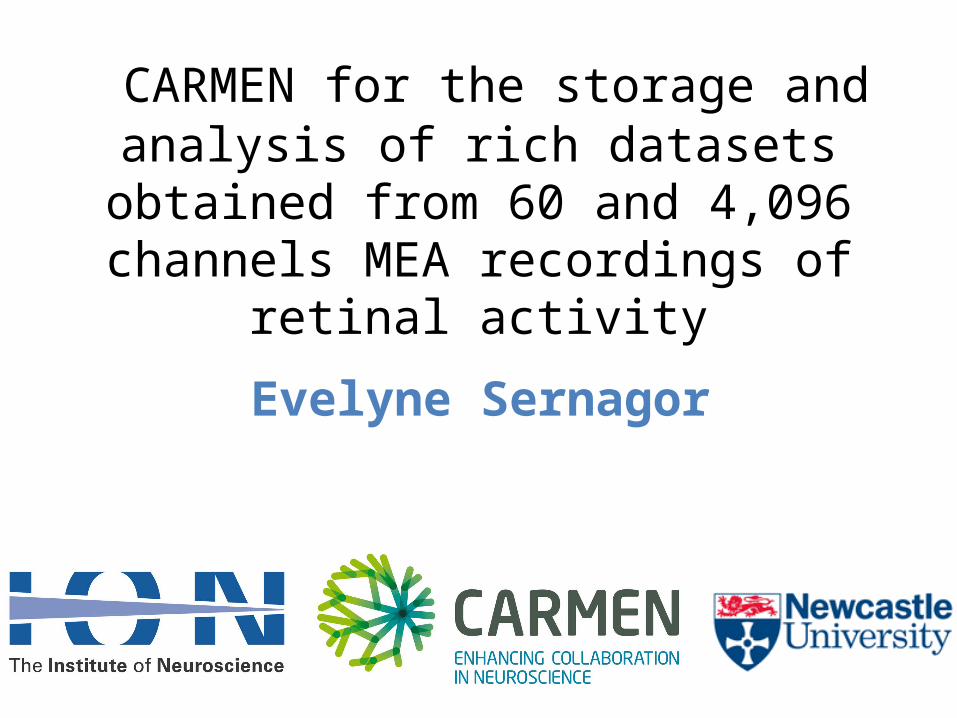
Visualising and characterising retinal waves necessitates techniques to
record neural activity from large cell assemblies in the RGC layer
Multielectrode arrays (MEAs)
.
Sekirnjak C et al. J Neurophysiol 2006;95:3311-3327
©2006 by American Physiological Society

We have made extensive use of 60 channels MEAs (Multichannel Systems)
Electrode diameter 30 mmElectrode centre-to-centre separation 100-200 mm


Data processing from MCS MEA recordings1. Spike threshold detection on all electrodes
2. Ascii files of spike time stamps
3. Burst and wave detection algorithms developed in R by Stephen Eglen and Jennifer Simonotto
Services on the CARMEN portalFourplot Service (Stephen Eglen)Reads data in from all MEA retinal data formats currently on CARMENMEA Movie Calculator ServiceCreates an animated .gif file showing bursting over time on a MEA grid.Burst Analysis Service (Jennifer Simonotto)Takes text file spike times from multi-electrode array data, and computes network and burst characteristics, outputting a pdf with figures showing burst and networkMEA Burst and IBI Cumulative Distribution Calculator ServiceThis service calculates the cumulative distribution functions for burst lengths and inter-burst intervals of spike time series, returning pdfs of the burst length distribution versus burst length, the inter-burst interval distribution versus the interval length, and also returns comma separated variable files for x-y coordinates of the above plots.
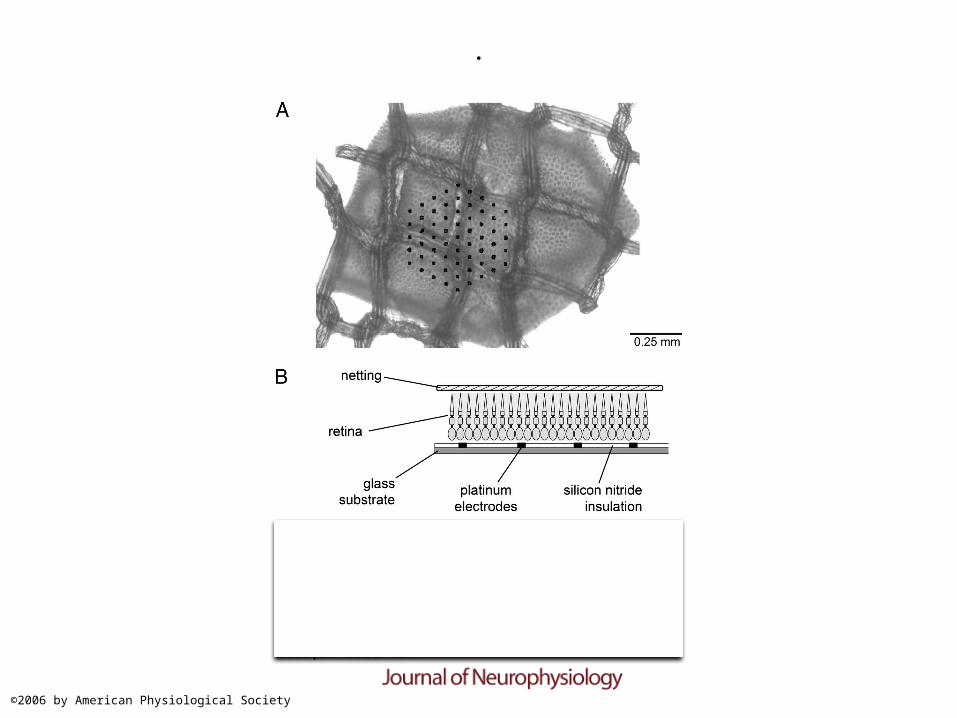
Newcastle
Cambridge
U. WashingtonSeattle
UC Berkeley
UC Santa Cruz
UC Davis
Exchange data and share analytical codes
Perform cross-labs analysis of retinal waves data using CARMEN analytical tools
We have established an international network involving labs investigating retinal waves using MEAs
Edinburgh
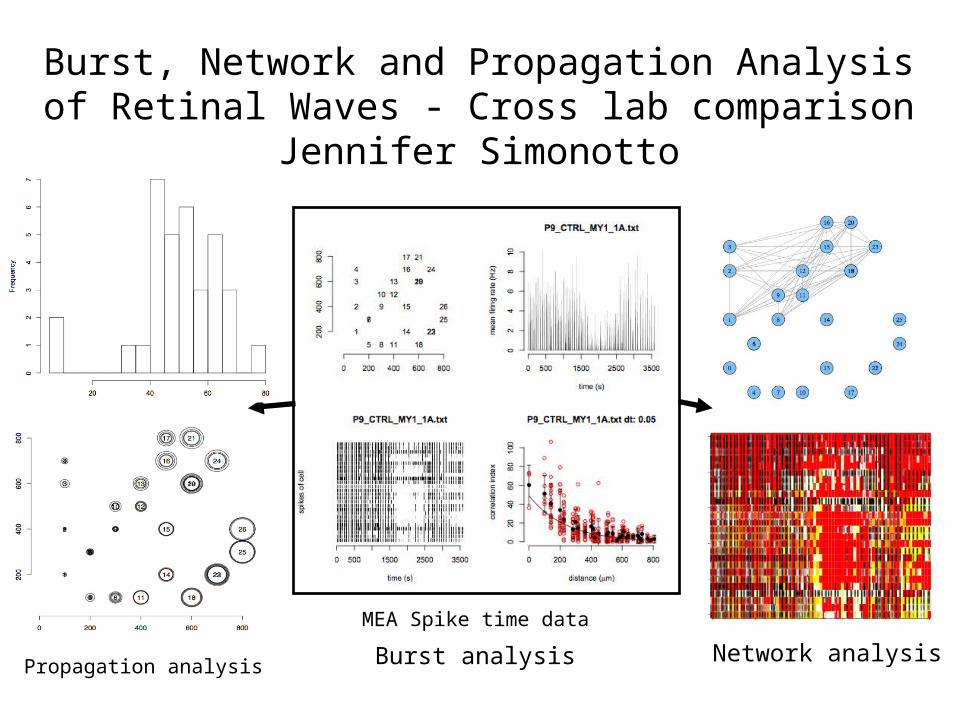
Burst, Network and Propagation Analysis of Retinal Waves - Cross lab comparison
Jennifer Simonotto
Propagation analysis
MEA Spike time data
Network analysisBurst analysis
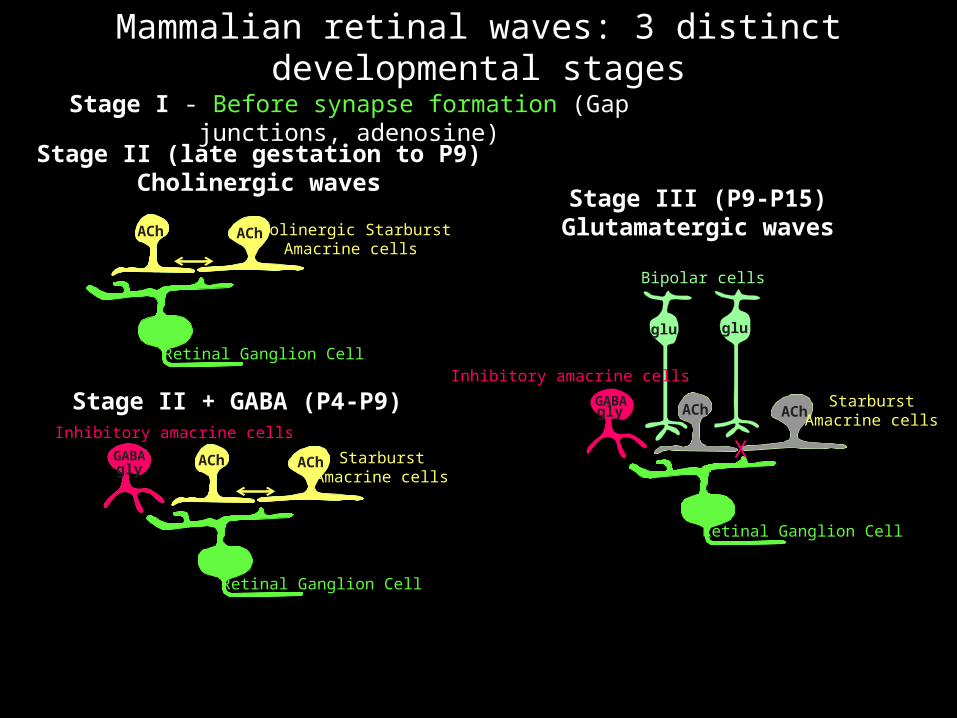
Mammalian retinal waves: 3 distinct developmental stages
Stage I - Before synapse formation (Gap junctions, adenosine)
Bipolar cells
gluglu
GABAgly ACh ACh
Retinal Ganglion Cell
Stage III (P9-P15)Glutamatergic waves
Inhibitory amacrine cells
StarburstAmacrine cells
X
Cholinergic StarburstAmacrine cells
ACh ACh
Retinal Ganglion Cell
Stage II (late gestation to P9)Cholinergic waves
ACh ACh
Retinal Ganglion Cell
GABAgly
Inhibitory amacrine cells
StarburstAmacrine cells
Stage II + GABA (P4-P9)

Despite fundamental developmental changes in network organization, no consistent changes
in wave dynamics have been reported
Possible reasons:
Retinal area viewed is too small
Spatio-temporal resolution of the recordings is not high enough

data management as images
time
Vxy(t)
time
y
x
Vxy(ti) encoded in the pixel color
t0
t1
t2
time
Vxy(t)
time
Vxy(t)
time
y
x
Vxy(ti) encoded in the pixel color
t0
t1
t2
Active Pixel Sensor (APS)
in-pixel▪microelectrode▪ pre-amplifier
on-chip▪ random addressing logic▪ amplifier
implementation of dense MEAs adapted data management and analysis
The Active Pixel Sensor (APS) MEA(collaboration with Luca Berdondini,
Alessandro Maccione and Mauro Gandolfo, IIT)Camera chip
Pixels are metallic electrodes instead of light sensors
4,096 electrodes (64x64 array)
Spatial resolution of 21 mm (el. diameter, 42 mm centre-to-centre) - spatial resolution comparable to neuronal somata in intact networks
Can acquire at full frame rate of 7.8kHz
L. Berdondini, et al., Lab On Chip, 2009.K. Imfeld, et al., IEEE Transactions on Biomedical Engineering , Vol. 55, Issue 8, 2008.L. Berdondini, et al., IEEE-ICECS, 2001

Data acquisition and processing similar to light imager
Each metallic electrode represents one pixel
Activity acquired with a frame grabber
Fast signal acquisition performed as a sequence of frames by encoding extracellular voltage signals as pixels data.
Single microelectrode raw data is reconstructed by combining single pixel data from sequential frames. Activity movies “functional electrophysiological imaging”

Newcastle
Edinburgh Cambridge
IITGenova
U. WashingtonSeattle
UC Berkeley
UC Santa Cruz
UC Davis

Activity moviesRaw signals
2.67
mm
1.6 mV
P5 retina
Visualization based either on signal variance (e.g. within 5ms window) or on electrical potential

Screenshot from BrainWave

Spike detection

The BrainWave developers (Mauro Gandolfo and Alessandro Maccione) are soon going to add a data
export tool directly to CARMEN
Spike time stamps files exported to Matlab

Spikes extraction and visualization of spike trains
P10 retina
Movie of firing ratesR (Stephen Eglen)
Movie of detected wavesBased on burst analysisMatlab (Matthias Hennig)
Raster plot

Spatiotemporal resolution is important!!!!!
Down-sampling to 8x8 electrodes42 mm diameter (2x2 APS channels)240 mm pitch (6 APS channels)
APS64x64 electrodes21 mm diameter40 mm pitch
P3 retina
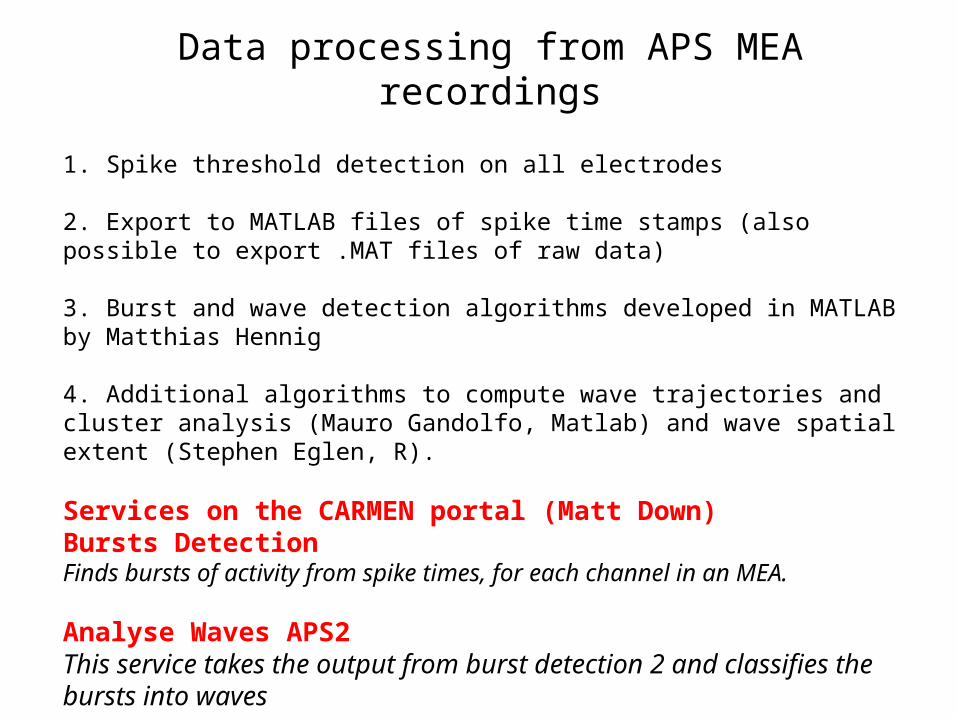
Data processing from APS MEA recordings
1. Spike threshold detection on all electrodes
2. Export to MATLAB files of spike time stamps (also possible to export .MAT files of raw data)
3. Burst and wave detection algorithms developed in MATLAB by Matthias Hennig
4. Additional algorithms to compute wave trajectories and cluster analysis (Mauro Gandolfo, Matlab) and wave spatial extent (Stephen Eglen, R).
Services on the CARMEN portal (Matt Down)Bursts DetectionFinds bursts of activity from spike times, for each channel in an MEA.
Analyse Waves APS2This service takes the output from burst detection 2 and classifies the bursts into waves
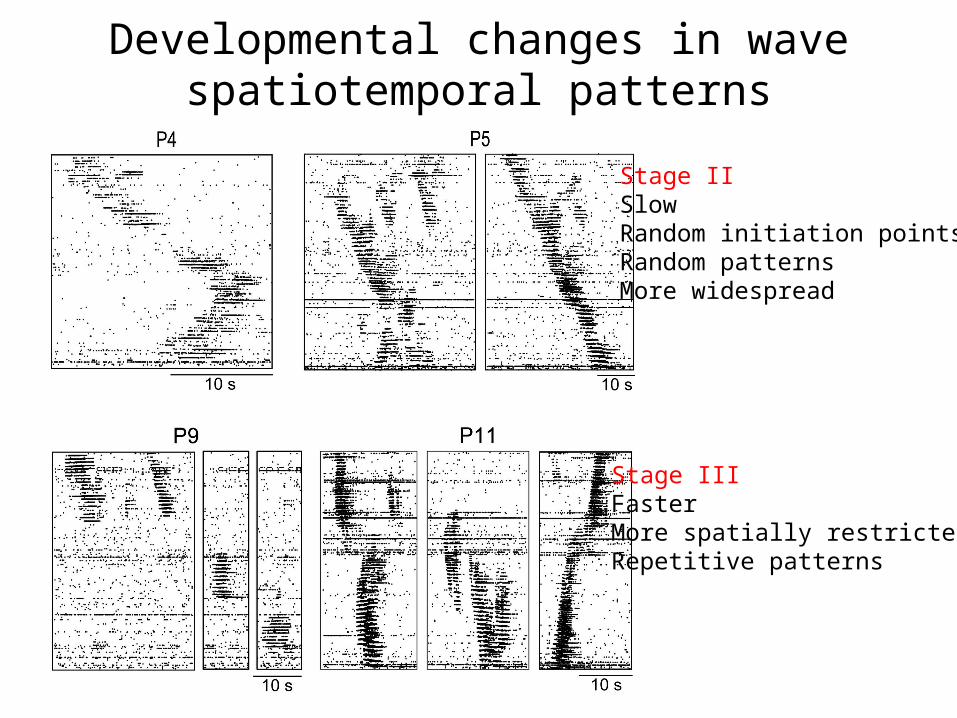
Developmental changes in wave spatiotemporal patterns
Stage IISlowRandom initiation pointsRandom patternsMore widespread
Stage IIIFasterMore spatially restrictedRepetitive patterns

Developmental changes in wave spatiotemporal patterns
1 2 3
1 2 3
1 2 3
P5 0
400
800
Elec
trode
#
P3 0
500
1000
1500
Elec
trode
#
0 100 200 300s
0 100 200 300s
P11
0 100 200 300s
0
500
1000Elec
trode
#
1
2 3
1
2
3
1
2
Thanks to…NewcastleMatt DownJames van CoppenhagenJennifer SimonottoRolando Berlinguer-PalminiPatrick DegenaarChristopher Adams
CambridgeStephen Eglen
EdinburghMatthias Hennig
Funders BBSRC, EPSRC, IIT
CARMENColin IngramTom JacksonMike WeeksMark Jessop
GenovaLuca Berdondini (IIT)Alessandro Maccione (IIT)Mauro Gandolfo (Univ. of Genova)Kilian Imfeld (3Brain, Switzerland)
USA collaborators who made data availableRachel WongMarla FellerLeo ChalupaDavid Feldheim and Alan Litke


![[Evelyne pisier] totalitarisme et for intérieur](https://img.dokumen.tips/doc/110x75/5495ed26ac7959132e8b4fc1/evelyne-pisier-totalitarisme-et-for-interieur.jpg)