Embed Size (px)
DESCRIPTION
Presentation given at the San Diego County Water Authority's Water Planning Meeting on Oct. 25, 2012. To view agenda visit www.sdcwa.org/monthly-board-meeting-20
Citation preview

1
Carlsbad Desalination Project Report on October 2012 Public Workshops
San Diego County Water Authority Water Planning Committee
October 25, 2012 1

Board approved Term Sheet with Poseidon July 2010 Set parameters for major terms and conditions WPA is consistent with the July 2010 Term Sheet
28 Months since approval of Term Sheet Over 30 public meetings regarding the Water Purchase
Agreement and the Project Public input provided throughout the process
Detailed information on project costs and rate impacts presented in October 2011 Presented again in April, June, July, August and October Consistently estimated in the $5-$7 per month residential user
2

Conducted detailed Board workshops and Committee Meetings on WPA Terms and conditions August 9th, September 20th, September 27th Continued in-depth discussion October 25th Received public comment and input at all meetings
In-depth Board Memos and presentations available to the public WPA terms and conditions Project costs and estimated rate impacts
Two open houses & evening meetings in the community Substantial turnout from the public
3

October 2, 2012 San Diego County Water Authority, Kearny Mesa
Attendees Comments/ Questions Support Oppose Neutral
~135 30 22 7 1
4
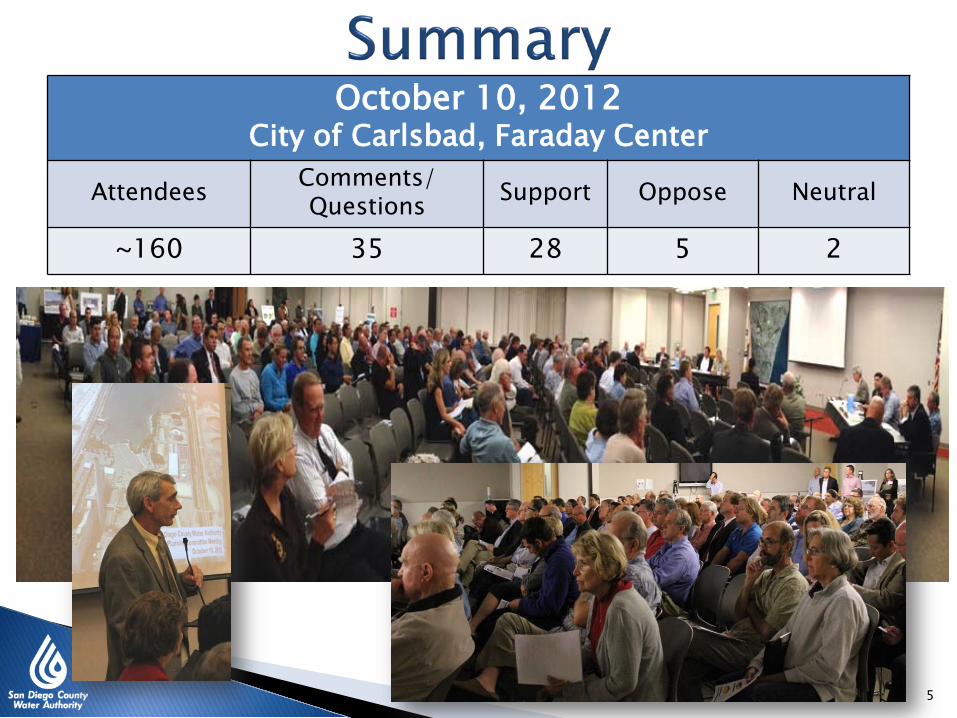
October 10, 2012 City of Carlsbad, Faraday Center
Attendees Comments/ Questions Support Oppose Neutral
~160 35 28 5 2
5

In support: Diversifies water supply portfolio Well vetted Provides jobs Supports tourism and external perception of SD Good for the regional economy
In Opposition: Costly energy / energy intensive Conservation and IPR should be done first Environmental impacts
6

Questions asked during the course of both public meetings Insufficient time to respond during meetings Staff directed to note and respond to Committee
Categorizing Questions from Public WPA terms and conditions Water supply reliability and conservation Cost questions including cost of energy Environmental related questions
7

Recurring Comments from the public Extensive time to implement the project Role of water supply and the project in economic growth and
jobs Prioritization of local water supply development (loading order) Conservation, Recycling, Indirect Potable Reuse and
Desalination last
Detailed responses to questions and comments in October 17, 2012 Memo Will address cost and energy related questions and comments
in item 1-B presentation
8

What is the optimal water supply portfolio?
Many years in development and refinement
Meets our region’s water supply needs
Done in close cooperation with member agencies
Balances reliability with rate payer affordability
Urban Water Management Plan (UWMP) State law – UWMP Act – updated every 5 years Requires a diverse mix of resources, including: Conservation
Recycling Imported water
Local supply development 9
What is the optimal water supply portfolio? (continued)
Regional Water Facilities Master Plan Multi-year study concluded in 2004 Identified opportunities & facilities to meet needs through 2030 Seawater Desalination -- next increment of supply, with: Continued aggressive conservation Water recycling & brackish groundwater project development by
member agencies Articulated in UWMPs of 2000, 2005, 2010 CEQA Certified in 2004 Programmatic Environmental Impact Report
10
Why isn’t the Water Authority doing more for conservation?
Conservation is a core strategy of our supply reliability for more than two decades
800,000 AF conserved since 1991 Water efficient devices 500,000+ toilets, 600,000+ low-flow showerheads
Public outreach programs and campaigns 100,000+ high-efficiency clothes washer rebates WaterSmart Target Program 2012: 11% (70,000 AF) of region’s water use is offset
11
…Water Authority doing more for conservation? (continued)
A leader in legislative advocacy for water conservation Founding member California Urban Water Conservation Council Sponsor: SB1224 - Low flush, adopted in Energy Policy Act of 1992 Support: AB1561 & AB2572 – high efficiency washers & water meters Support: AB2717 & AB1881 – outdoor landscape water use efficiency Support: SBX7-7 “20 by 2020” 20% reduction of water use by 2020
Three Conservation Summits hosted by Water Authority Blueprint for Water Conservation - 2007 Transition to landscape water conservation through behavioral changes
Board’s Water Use Efficiency Policy Principles - April 2012
12

The Carlsbad Desalination plant will degrade the existing environment at Agua Hedionda Lagoon and is environmentally impactive.
Long term stewardship of the lagoon Provided by Encina Power Plant for last 60 years Nurtures white sea bass restoration and other aquaculture activities Assured to continue with the Carlsbad Desalination plant Poseidon required to continue routine dredging of channel and outer lagoon
(which would naturally close) Degradation would occur absent dredging and inflow of fresh ocean water Agua Hedionda Lagoon Foundation is a consistent supporter of the project
13

How do we know the Carlsbad Desalination plant is environmentally responsible desalination?
The Institutions in California responsible for making that determination said it is. City of Carlsbad lead agency for CEQA California State Lands Commission California Coastal Commission State Water Resources Control Board
Decisions of those institutions upheld in California Superior Court and California Appellate Court 14 individual legal challenges
14

The California Coastal Commission is going to make the City [of San Diego] do IPR or upgrade Point Loma to secondary, and the Water Authority needs to understand this.
Roles of California SWRCB and USEPA Charged by US Clean Water Act to grant waivers and define their conditions
Role of City of San Diego Holder of the National Pollutant Discharge Elimination System permit Seeks waiver and agrees to its terms along with 12 Metro System agencies
Role of Coastal Commission Ensures consistency between any potential waiver granted by RWQCB
(thru SWRCB) and the Coastal Zone Management Act
15

1977 amendment to Clean Water Act allowed modification to secondary treatment requirements for ocean dischargers (Section 301 H)
Dischargers had until July 1, 1988 to apply for waiver
City applied for a waiver in 1979 and 1981 and was denied Given until March 1987 to reapply for reconsideration City Council decided to forgo waiver in February 1987
EPA sued the City for non-compliance July 1, 1988 Later joined by Sierra Club
16

City and EPA considered a consent decree to phase in secondary at Point Loma 7 water reclamation plants to beneficially reuse 70,000 AF Upgrade Point Loma to Secondary $2.5 Billion
In 1994 Federal court rejected consent decree and approved revised City proposal “Consumer Alternative” 2 recycled water plants -45 MGD of tertiary treatment capacity
1994 Ocean Pollution Reduction Act (OPRA) allowed City to apply for waiver under certain conditions
17
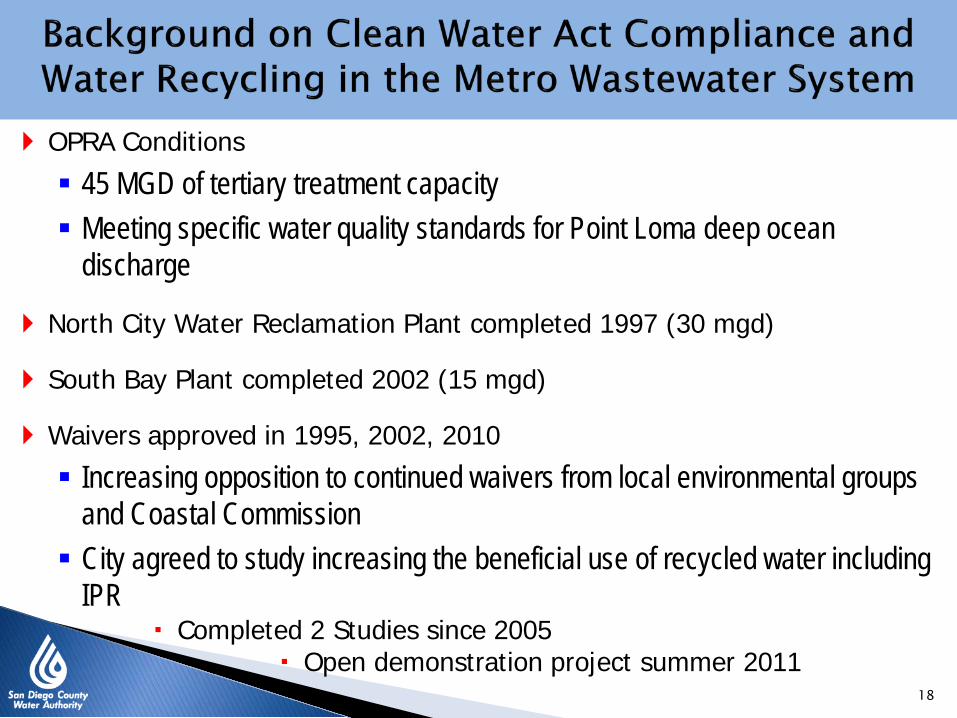
OPRA Conditions
45 MGD of tertiary treatment capacity Meeting specific water quality standards for Point Loma deep ocean
discharge
North City Water Reclamation Plant completed 1997 (30 mgd)
South Bay Plant completed 2002 (15 mgd)
Waivers approved in 1995, 2002, 2010
Increasing opposition to continued waivers from local environmental groups and Coastal Commission City agreed to study increasing the beneficial use of recycled water including
IPR Completed 2 Studies since 2005
Open demonstration project summer 2011
18

IPR & DPR are cheaper than desalination and should be done before any desalination project
Local Supplies are critical to reliability and diversification 2010 UWMP relies on additional 100,000 AF of new local supplies
San Diego Region is limited in local supply options Lack of large groundwater basins and industrial water users
IPR maximizes recycled water use and recycled treatment capacity Not subject to seasonal variations in demand
Seawater Desalination maximizes proximity to Pacific Ocean and regional conveyance
Both are part of diversification Both are cost competitive with other
local supply options 19

0 500 1,000 1,500 2,000 2,500 3,000
Camp Pendleton Desalination
North San Diego County Regional Reuse
City of SD RWS*
Otay River
Mission Basin Narrows
Carlsbad (Poseidon)
$/AF
Brackish Groundwater Recycled / IPR Seawater Desalination
$1,717
$2,086
2,375**
$1,730
$2,340
*Cost range includes wastewater related costs that may reduce the unit cost by up to $600/AF.
$1,900
(100 mgd) (50 mgd)
$2,290
$1,975
$1,628
$1,475
$2,041
** Incentive funding reduced at 2011 value of $275. RWS assumes deduction for incentives on 20 year NPV basis. 20

Costs Point Loma Secondary
Only (NO IPR)
Point Loma Secondary
w IPR Alternatives
Point Loma Advanced
Primary w IPR Alternatives
Indirect Potable
Reuse (IPR)
Capital $0 $1.9 – 2.2 Billion $1.9 – 2.2 Billion
Annual Operations $0 $100-110
Million $100-110 Million
Point Loma
Capital $1.16 Billion
$0 .727 Billion ($123 Million – wet weather demand)
$0.263 Billion
Annual Operations $37 Million $19 Million
($9 Million other) $5.9 Million
Source: Draft Recycled Water Study: IPR costs from Tables 8-3,8-4,8-6, 8-7 , 8-9, 8-10 Point Loma Costs Appendix H, Pages B-6, B-7
21
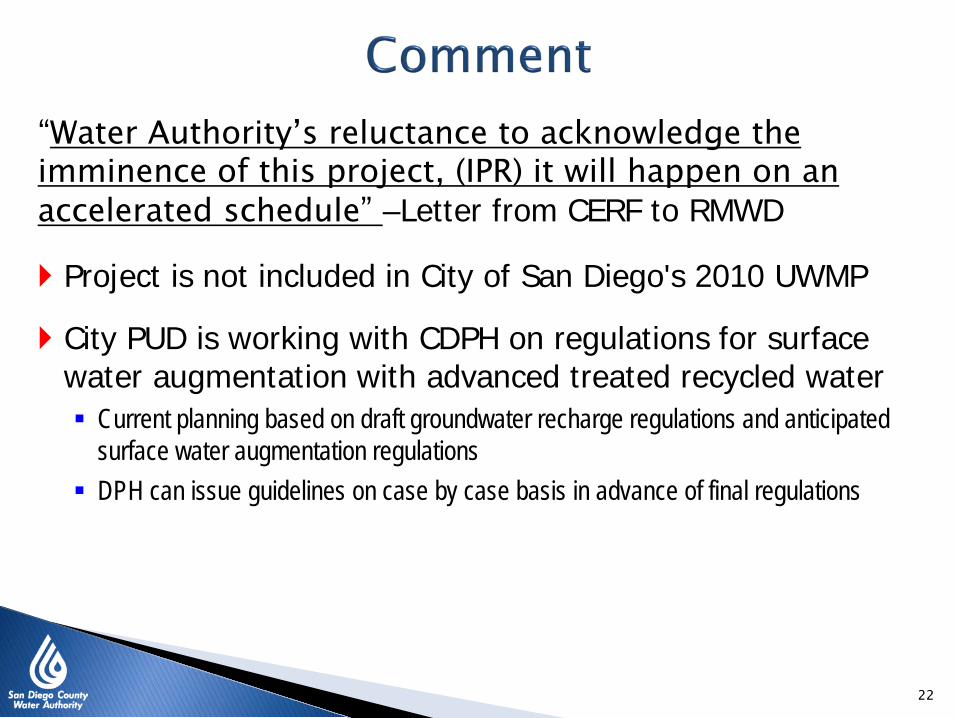
“Water Authority’s reluctance to acknowledge the imminence of this project, (IPR) it will happen on an accelerated schedule” –Letter from CERF to RMWD
Project is not included in City of San Diego's 2010 UWMP
City PUD is working with CDPH on regulations for surface water augmentation with advanced treated recycled water Current planning based on draft groundwater recharge regulations and anticipated
surface water augmentation regulations DPH can issue guidelines on case by case basis in advance of final regulations
22

Project is in the early planning stages Subsequent activities include environmental compliance EIR, permitting, etc. City & Metro agencies decision on Clean Water Act compliance strategy
RWS implementation plan assumes project is built in phases Study includes five integrated reuse alternatives “All proposed plants have startup dates between 2020 and 2035” (RWS, Table
7.2 Footnote)
23

IPR will decrease City of San Diego water purchases, reduce demand and significantly impact the remaining agencies
166 202 221 221 216 167
17 34 93
0
50
100
150
200
250
300
2012 2015 2020 2025 2030 2035 Existing and Projected City of San Diego Demand on SDCWA (Assume 2010 UWMP Projected Local Supplies) Projected IPR Use (City of San Diego 2012 Recycled Water Study)
Thou
sand
Acr
e-Fe
et
24

25
180 270 280 280 280
47 72 97 118
109
118 122 124 126 56 56
56 56 17 34
93 20
20
20
358
231
223 240
211
654
722
790 851
904
0
100
200
300
400
500
600
700
800
900
1000
2015 2020 2025 2030 2035
MWD Imported Supplies
Otay WD Proposed Rosarito Desalination Project
City of SD RWS (IPR)
Proposed Carlsbad Desalination Project
Projected Local Supplies (Verifiable)
Additional Conservation (20% Reduction by 2020)
CR Transfers (QSA Supplies)
Baseline Demands (Includes 56 TAF of Existing Conservation)
Thou
sand
Acr
e-fe
et

26
180 270 280 280 280
47 72 97 118
77
87 90 92 93 56 56
56 56 17 34
93 20
20
20
430
305
302 322
297 694
765
837 901
957
0
100
200
300
400
500
600
700
800
900
1000
2015 2020 2025 2030 2035
MWD Imported Supplies
Otay WD Proposed Rosarito Desalination Project
City of SD RWS (IPR)
Proposed Carlsbad Desalination Project
Projected Local Supplies (Verifiable)
Additional Conservation (20% Reduction by 2020)
CR Transfers (QSA Supplies)
Baseline Demands (Includes 56 TAF of Existing Conservation)
Thou
sand
Acr
e-fe
et
Regional Supply Mix w/ Potential City of SD Indirect Potable Reuse and Otay WD Desalination
(Singe Dry Year)

27
180 270 280 280 280
47 72 97 118
141
152 155 156 158 48 48 48 48 17
34 93
20 20
20
307
185
176 193
163
635
702 768
828 880
0
100
200
300
400
500
600
700
800
900
1000
2015 2020 2025 2030 2035
MWD Imported Supplies
Otay WD Proposed Rosarito Desalination Project
City of SD RWS (IPR)
Proposed Carlsbad Desalination Project
Projected Local Supplies (Verifiable)
Additional Conservation (20% Reduction by 2020)
CR Transfers (QSA Supplies)
Baseline Demands (Includes 56 TAF of Existing Conservation)
Thou
sand
Acr
e-fe
et
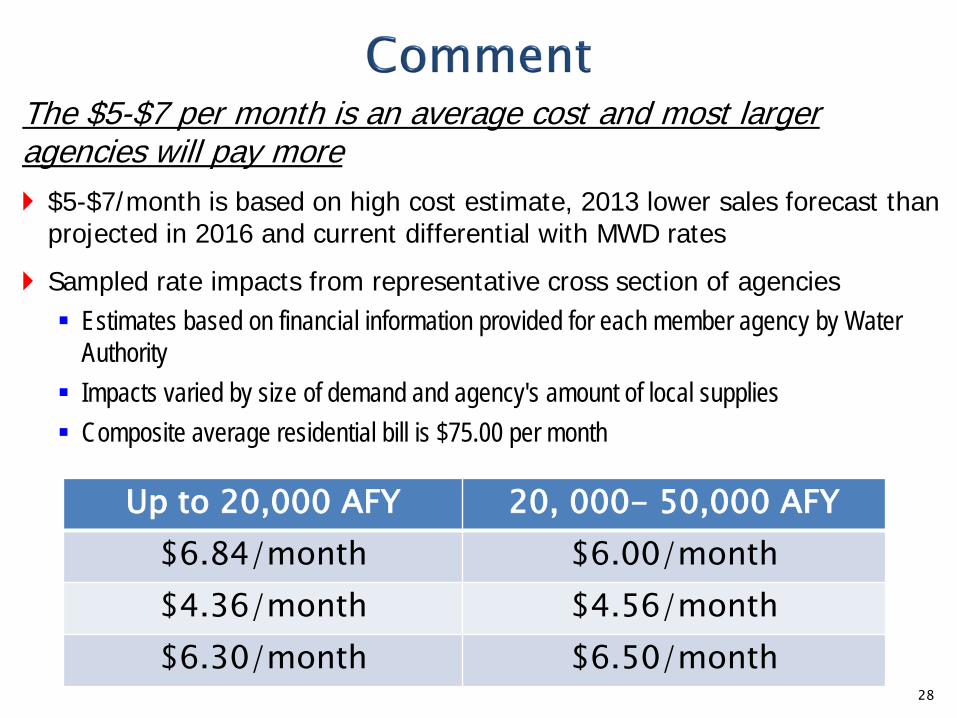
The $5-$7 per month is an average cost and most larger agencies will pay more
Up to 20,000 AFY 20, 000- 50,000 AFY $6.84/month $6.00/month $4.36/month $4.56/month $6.30/month $6.50/month
$5-$7/month is based on high cost estimate, 2013 lower sales forecast than projected in 2016 and current differential with MWD rates
Sampled rate impacts from representative cross section of agencies Estimates based on financial information provided for each member agency by Water
Authority Impacts varied by size of demand and agency's amount of local supplies Composite average residential bill is $75.00 per month
28

29


