Embed Size (px)
Citation preview

HEALTH ECONOMICSHealth Econ. 18: 991–1010 (2009)Published online 6 July 2009 in Wiley InterScience (www.interscience.wiley.com). DOI: 10.1002/hec.1512
CARING FOR MOM AND NEGLECTING YOURSELF? THEHEALTH EFFECTS OF CARING FOR AN ELDERLY PARENT1
NORMA B. COEa,c,� and COURTNEY HAROLD VAN HOUTVENb,c
aCenter for Retirement Research at Boston College, USAbCenter for Health Services Research in Primary Care, Durham Veterans Affairs Medical Center, Department of Medicine,
Division of General Internal Medicine, Duke University Medical Center, USAcNetspar, The Netherlands
SUMMARY
We examine the physical and mental health effects of providing care to an elderly mother on the adult childcaregiver. We address the endogeneity of the selection in and out of caregiving using an instrumental variableapproach, using the death of the care recipient and sibling characteristics. We also carefully control for baselinehealth and work status of the adult child. We explore flexible specifications, such as Arellano–Bond estimationtechniques. Continued caregiving over time increases depressive symptoms and decreases self-rated health formarried women and married men. In addition, the increase in depressive symptoms is persistent for married women.While depressive symptoms for single men and women are not affected by continued caregiving, there is evidence ofincreased incidence of heart conditions for single men, and that these effects are persistent. Robustness checksindicate that these health changes can be directly attributable to caregiving behavior, and not due to a direct effectof the death of the mother. The initial onset of caregiving has modest immediate negative effects on depressivesymptoms for married women and no immediate effects on physical health. Negative physical health effects emerge2 years later, however, suggesting that there are delayed effects on health that would be missed with a short recallperiod. Initial caregiving does not affect health of married men. Published in 2009 by John Wiley & Sons, Ltd.
Received 3 October 2008; Accepted 30 April 2009
JEL classification: I10; J14; D10
KEY WORDS: CES-D; depressive symptoms; heart conditions; elderly parents; informal care
1. INTRODUCTION
For single elderly parents, adult children are by far the most common type of informal care providers,where daughters are more common than sons (Spector et al., 2000). Out of the estimated 5.9 millioncaregivers nationally in 2000, approximately 41% were sons (14.7%) or daughters (26.6%) (Spectoret al., 2000). Because among married persons the spouse is more likely to be the sole caregiver, themajority of those 2.4 million offspring are likely caring for a single parent. Due to differences in lifeexpectancy, mothers are the most likely care recipient among single elderly, primarily due to widowhood(Van Houtven and Norton, 2008). Furthermore, adult children will become an increasingly importantsource of informal care as the baby boomer generation ages, the number of divorcees increases, and thedifferential life expectancy between men and women results in a larger number of widowed elderlywomen. Since adult children are fundamentally different from spousal caregivers, in terms of their age
*Correspondence to: Research Economist, Center for Retirement Research at Boston College, 140 Commonwealth Ave, ChestnutHill, MA 02467, USA. E-mail: [email protected]
1This article is a US Government work and is in the public domain in the USA.
Published in 2009 by John Wiley & Sons, Ltd.
profiles, the competing demands for their time, and the differences in their emotional and financial ties totheir care recipient, understanding the long-term consequences of caregiving is an important policy issue.
This paper tests whether caregiving by adult children has adverse effects on their mental and physicalhealth. The evidence is clear that providing informal care can cause adverse emotional and physicalhealth effects on elderly spousal caregivers, at least in the short term, and even up to 5 years after acaregiving experience (Schulz et al., 2001). Less is known about the care provided by relatively younger–50 – 70- year old on average – and presumably healthier adult children. Using a 12- year panel of data,we consider both the health effects of continuing caregiving over time as well as the initial health effectsupon becoming a caregiver. To examine the persistence of effects, we also examine a 2-year and 4-yearwindow after caregiving occurs.
The decision to provide care to a parent or stop providing care may be endogenous to one’s ownhealth, making estimates of the effects difficult to estimate without bias in observational studies. Weexamine both the start and the end of the caregiving episode. We use death of the care recipient as aninstrument for the end of caregiving. Death of the care recipient serves as a sorting variable that allowsus to compare health effects of caregivers who are still caregiving, caregivers who have stoppedcaregiving, and non-caregivers who have also experienced the death of a mother. To examine the effectsof the initial selection into caregiving, we use sibling and family characteristics as instrumental variables,as has been done in the current literature focusing on the cross-section (Ettner, 1995; Stern, 1995;Heidemann and Stern, 1999; Engers and Stern, 2002; Van Houtven and Norton, 2004; Charles andSevak, 2005; Heitmuller, 2007; Bolin et al., 2007). Controlling for selection in and out of caregivinghelps ensure that our estimates are free of endogeneity bias.
The key contributions of this work are that we carefully control for the endogeneity of informal careand health, we examine whether the health effects of caregiving are fleeting or persistent by using a longpanel of longitudinal data, and we focus on adult children of the elderly, who are the most commonsource of informal care in the United States, for whom the long-term health effects of caregiving are notwell understood.
2. BACKGROUND
Most of the studies on caregiver health effects have been cross-sectional or have used selective samples,either through randomized control trials providing help to caregivers, by examining certain disease typessuch as dementia, or by use of small probability or convenience samples (Hirst, 2004). Providing informalcare can cause adverse emotional and physical health effects on elderly spousal caregivers over the shortterm (Sorensen et al., 2002; Brodaty et al., 2003), primarily by increasing depression risk. More intensivecaregivers (Majerovitz, 1995; Sansoni et al., 2004) and female spousal caregivers (Harwood et al., 1998;Thompson et al., 2004) are particularly prone to experiencing anxiety and depression (Majerovitz, 1995;Sansoni et al., 2004). Others have found that there are blood pressure (Shaw et al., 1999; Grant et al., 2002)and coronary heart disease effects of caregiving (Lee et al., 2003; Mausbach et al., 2007), with blood pressureeffects persisting at least a year after the death of the spousal care recipient (Grant et al., 2002). Anotherstudy found that the health effects of caregiving persisted over time (Schulz and Beach, 1999), with spousalcaregivers under strain facing significantly higher mortality risks up to 5 years after ceasing caregiving.
The longitudinal studies identified controlled initial caregiver health and intensity of the caregiving timeover time, but did not account for endogeneity between informal care and health (Kiecolt-Glaseret al., 1991; Hirst, 2004). Hirst found that duration of caregiving increases psychological distress and thatpsychological distress was highest at the start or at the end of a caregiving episode (Hirst, 2004; Hirst,2005). This study looked at all caregiver types, but did not examine separately the effect on adult children.
Less is known, therefore, about the health effects on adult children caring for a parent. The health effectsmay be different for children compared to spouses, due to differences in age (Clipp and George, 1993), less
N. B. COE AND C. H. VAN HOUTVEN992
Published in 2009 by John Wiley & Sons, Ltd. Health Econ. 18: 991–1010 (2009)
DOI: 10.1002/hec

financial and emotional dependence on the care recipient (Norton and Van Houtven, 2006), and differencesin initial health and time constraints. Adult children are often torn between an obligation to a parent and totheir own careers and families, a dilemma that does not often confront a spousal caregiver. Evidence existsthat adult children showed a significantly higher degree of total caregiver burden, irrespective of age,compared to other related family caregivers (Andren and Elmstahl, 2007). However, this study used a small,non-representative sample and examined the effects over a short window of time.
We know very little about whether emotional or physical health effects of caregiving persist for adultchildren. The time period over which many health outcomes are measured in most studies, 6 months to1 year, fails to capture the full effects because caregivers often have many more years of caregiving infront of them (Thompson et al., 2007) or because health effects are delayed. In addition, once acaregiver ceases being a caregiver, we know little about whether he or she will regain the lost healthstatus. One study showed that non-spouse caregivers experienced feelings of relief after stoppingcaregiving, whereas spouse caregivers tended to experience more negative life changes (Eloniemi-Sulkava et al., 2002).
3. SELECTION
3.1. Selection out
If providing care to an elderly parent has negative health consequences, one must be careful to take intoaccount the selection bias when examining the effects of continued caregiving. Caregivers ceasecaregiving for a variety of reasons, some of which may be due to their own health limitations.Depression, caregiver burden, and other health problems of the caregiver are significant contributingfactors to stopping caregiving (Schulz and Beach, 1999). Most commonly, ceasing caregiving is due todeath or institutionalization of the care recipient (Mittelman et al., 1996). Although institutionalizationis probably an endogenous decision, the death of the care recipient, or at least the exact timing of thedeath, is plausibly exogenous. We use death of the mother to control for the endogeneity of the decisionto stop caregiving.
3.2. Selection in
We know from cross-sectional studies that caregivers tend to be daughters, be poorer, have loweropportunity cost of their time compared to siblings (Dwyer and Coward, 1991), and live closer toparents compared to siblings, including being more likely to co-reside (McGarry, 1998). Less is knownabout how health status affects selecting into caregiving. One must worry that the least healthy child, orthe child with the lowest propensity for work, becomes the caregiver, or conversely that a certainthreshold of health is needed before becoming a caregiver, making it potentially very important tocontrol for initial health and economic endowments to understand the effects of informal care on healthover time.
Another source of potential endogeneity bias comes from selection into caregiving among siblings.Children may act strategically or cooperatively in the decision to become a caregiver (Wolf et al., 1997;Heidemann and Stern, 1999; Pezzin and Schone, 1999; Checkovich and Stern, 2002; Engers and Stern,2002; Neuharth and Stern, 2002; Heitmuller, 2007) and their choice will depend partially on theexpected behavior of siblings. Generally, the more likely siblings are to care for a parent, the less likely achild is to take care of a parent (Checkovich and Stern, 2002). Not considering dependence uponsiblings may also introduce bias. We use sibling and family characteristics immutable to the child tocontrol for the endogeneity of becoming a caregiver.
HEALTH EFFECTS OF CAREGIVING 993
Published in 2009 by John Wiley & Sons, Ltd. Health Econ. 18: 991–1010 (2009)
DOI: 10.1002/hec

4. DATA
We use data from seven waves of the Health and Retirement Survey (HRS) (1992–2004). The HRS is anationally representative sample of the near elderly in the United States (ages 50 to 64 entered thesample initially). The HRS collects information about respondents, their spouses, their siblings, and theparents of respondents and spouses.
4.1. Sample
We examine men and women separately, given their different propensities to provide informal care andtheir different depression prevalence. We further delineate the sample by marital status. Since a marriedadult child has two potential workers within the household, the husband and the wife, joint-householdproduction issues may mean that caregiving has different costs and gains between single and jointhouseholds. We tested this a priori assumption with a Wald test, which confirmed that we could notpool the samples.
We limit the sample to individuals with only a mother alive, since caregiving as an adult child is verydifferent if the father is also a care provider to the mother. We also limit the sample to non-co-residingadult children prior to the start of any caregiving episode, since it is difficult to measure careprovision, or even who is providing care for whom, in co-residing households. We also exclude personswho we do not observe before they begin caregiving, since we cannot ascertain their cohabitation statusprior to the start of caregiving. To be clear, we only examine care to a mother. As such, an HRSrespondent could be providing care to his mother and his wife could be providing care to her motherand both would be considered caregivers. Anyone providing care to a mother-in-law exclusively iscategorized as a non-caregiver.
In order to examine the health effects of continued caregiving, our sample consists of HRSrespondents or their spouses who are caregivers. First, we create a respondent- and spouse-level dataset(N5 74 220), selecting families that had only a mother alive and did not co-reside before the caregivingepisode. We then limit the sample to individuals who provided care at time t5 0. This sample consists of2557 observations in total or 1467 individuals, 1270 married female observations (700 individuals), 347single female observations (204 individuals), 817 married male observations (480 individuals), and 123single male observations (83 individuals).
To examine the health effects of initial selection into caregiving, we create a sample of non-caregivers. This sample consists of 8007 observations (3316 individuals), of which there were 3311married female observations (1391 married females), and 2993 married male observations (1217 marriedmales).2
We also create a family-level data set to construct family-level instruments examine the health effectsof initial caregiving. The family-level data set includes all respondents, their spouses, and their siblings(N5 151 890 person-wave observations). Selecting families that had only the mother alive, who did nothave anyone co-residing with the mother prior to caregiving, and had an HRS respondent who wasobserved in at least two waves, we have 35 778 observations from 1994 to 2002.
4.2. Main measures
4.2.1. Dependent variables. To measure mental health, we use the CES-D8 index (Blazer et al., 1991;Hays et al., 1993). Scores of 4 or 5 and above on this 8-point scale are consistent with probable clinicaldepression. Caregiver physical health is measured using both subjective and objective physical health
2As will be discussed later, the instruments typically used in the literature, and employed here, are weak for the samples of singlemen and single women, thus we exclude singles for the initial caregiving effects.
N. B. COE AND C. H. VAN HOUTVEN994
Published in 2009 by John Wiley & Sons, Ltd. Health Econ. 18: 991–1010 (2009)
DOI: 10.1002/hec

measures (e.g. self-reported health on a 5-point scale ranging from excellent (1) to poor (5), anydiagnosed heart condition, and ever told s/he has high blood pressure). In order to discretize thesubjective health measure, we create a dichotomous variable equal to one if a respondent reports beingin very good or excellent health.
4.2.2. Primary explanatory variables. A discrete measure of caregiving is the main explanatoryvariable of interest. Specifically, the HRS asks,3 ‘Did you spend a total of 100 or more hours(since Previous Wave Interview Month–Year/in the last 2 years) helping your (parents/mother/father)with basic personal activities like dressing, eating, and bathing?’ For those with a yes response,they are next asked, ‘Roughly how many hours did you yourself spend giving such assistance?’Preliminary analysis has raised concerns about the reporting accuracy for hours of assistance, thus,we use only the indicator variable for providing any informal care. This means that we are mixingboth intensive caregivers and occasional caregivers and measuring a lower bound for the healtheffects for the intensive caregivers.
The HRS also asks, ‘Did you spend a total of 100 or more hours (since Previous WaveInterview Month–Year/in the last 2 years) helping your (parents/mother/father) with other thingssuch as household chores, errands, transportation, etc.?’ A caregiver providing either type isconsidered as a caregiver when looking at respondents’ health effects of initial and continuedcaregiving.
5. METHODS
5.1. Model
In order to examine the effect of caregiving on the health of the caregiver, we estimate the followingregression:
Hc;tþ2 ¼ aþ b1Hc;t þ b2Ac;tþ2;t þ b3Xp þ b4Xc þ yt þ m ð1Þ
where H is the health outcome, A is the informal care behavior, Xp are the characteristics of the parent,and Xc are individual (child)-level characteristics. The individual-level characteristics included are age,age squared, number of children, race, being foreign born, educational categories (less than high school,high school, some college, 4-year degree, or higher), and logged net worth. We also include indicatorvariables for having worked full time or part time in the previous interview. The parental variablesinclude education of both parents as proxies for socio-economic status as well as the variables indicatingthe health of the mother, such as whether or not she needs help with activities of daily living or can beleft alone for an hour or more at a time.
This equation is a reduced-form model of the Grossman health production function (Grossman,1972), where health is a function of previous health and health investments. b1 in Equation (1) providesan estimate of the natural rate of health deterioration, and the other control variables affect the healthinvestments one makes. Caregiving might have an effect on the health investments made, if it directlychanges the physical or mental demands, or changes health-seeking behaviors, which in turn will affecthealth. The goal of this paper is to determine the size and the direction of the effect on a caregiver’shealth.
3There are a few changes to this question during the survey. In 1994, the question was asked for about 50 or more hours of careinstead of 100, and for only about the previous 12 months instead of 2 years. We do not adjust the data for these differences.
HEALTH EFFECTS OF CAREGIVING 995
Published in 2009 by John Wiley & Sons, Ltd. Health Econ. 18: 991–1010 (2009)
DOI: 10.1002/hec

5.2. Estimation
Our main analysis focuses on controlling for the endogeneity of caregiving through instrumentalvariable techniques. We explore the difference between linear probability models and non-linear models(probit and Poisson models), depending on the support for the dependent variable.
We also explore more flexible specifications of the model, which allow us to control forindividual specific effects explicitly, e.g. if individuals have a different taste for providing care. If weassume that the unobserved heterogeneity terms are uncorrelated with the explanatory variables, thena random effects estimation procedure is more efficient. It should be also pointed out that bycombining random-effects with IV methods, we relax the previous assumptions for IV and allow forcorrelation among the caregiving variable and time-variant unobservables. If, instead, we allowfor remaining correlation between an individual heterogeneity term and our explanatory variables, afixed-effects model is more appropriate. The combination of IV methods with fixed-effect methodswould also control for possible correlation among caregiving and time-variant unobservables. Sinceour model (Equation 1) also has a lagged-dependent variable, a fixed-effects instrumental variableapproach is unwarranted, since the estimates will be biased (Nickell, 1981). Thus, we explore whetheran Arellano–Bond (A-B) GMM estimator best fits the data.4 A-B, estimators use the two-period(or more) lagged health variable as an instrument for the difference between the lagged healthvariable and current health (addressing the concern that once differencing the model to eliminate thefixed-effect term introduces an endogeneity problem because the first difference in health (healtht minus health t�2) is correlated with the individual specific part of the error term). Forhealth conditions that are changeable over time, A-B may perform better than the first differencedapproach of IV-FE estimation (Arellano and Bond, 1991). Health conditions that are persistent,such as chronic diseases, might be weak instruments due to the lack of variation in the lagged measure.For A-B to be preferred, the deeper lags must be valid instruments. In order to test this, the AR(1)test statistic should be significant, i.e. there is serial correlation between lagged health and currentin health, and the AR(2) test statistic should be insignificant, meaning that there is no second-orderserial correlation. If the error structure does not fit this description, we rely instead on the IVestimates.
5.2.1. Selection out of caregiving. Among current caregivers, continued caregiving is instrumented bythe death of a parent. The validity of the instrument must create a significant exogenous change fromcaregiving to stopping caregiving. We also run a sensitivity test to make sure that the exclusion of ourinstrument is valid, i.e. the death of a parent does not have a direct effect on one’s health (e.g. through abereavement effect) (Van den Berg et al., 2008).
5.2.2. Selection into caregiving. We control for selection into caregiving, based on the previous literatureby using the sibling and family characteristics that are immutable to the individual, created from thefamily-level data set. These include variables, such as number of children in the family, percent of childrenwho are girls, eldest child in the family is a daughter, total number of kids among all siblings, total numberof grand kids, and total number of siblings working in the wave prior to caregiving (varying withinfamily).
4The more flexible models of the error-term structure, combined with dynamic panel data with a lagged-dependent variable, aremuch more difficult in non-linear models. Thus, we limit this analysis to the linear case, and examine how many predictions wehave outside the support of the dependent variable to see if the linear model fits the data sufficiently.
N. B. COE AND C. H. VAN HOUTVEN996
Published in 2009 by John Wiley & Sons, Ltd. Health Econ. 18: 991–1010 (2009)
DOI: 10.1002/hec

6. RESULTS
6.1. Descriptive statistics
Table I presents the descriptive statistics of our two samples, recorded the first time we observe theindividual. The sample of non-caregivers is slightly younger, has fewer children and grandchildren thanthe sample of caregivers, and has lower net worth.
Regarding the outcomes of interest, caregivers havemore depressive symptoms (CES-D8) and have a higherprevalence of heart conditions. On the contrary, non-caregivers have higher reported prevalence of high bloodpressure. Corresponding to the differences in health and age, non-caregivers are more likely to work thancaregivers. Mothers of caregivers are older (conditional on being alive) and more educated than mothers ofnon-caregivers.
6.2. Continued caregiving
6.2.1. The first stage. Table II presents the transition probabilities of caring from one period to the next(2 years later). Of the children providing care for a mother in time t, over half of them stop 2 years later.
Table I. Descriptive statistics of adult children and their families, by caregiver status
Dependent variables Caregivers Non-caregivers
Health measuresDepressive symptoms 1.16 0.27Heart condition 0.09 0.11High blood pressure 0.22 0.36Self-reported very good or excellent health 0.53 0.53Explanatory variablesDemographic characteristicsFemale 0.64 0.55Is an eldest daughter 0.33 0.27Married 0.73 0.75Age 57.69 54.76Education (years) 12.82 12.31Number of children 3.42 3.38Number of grandkids 4.28 2.32Work/wealth measuresFull-time work 0.45 0.51At least part-time work 0.54 0.57Net worth 297 869 249 864Mother’s characteristicsMother needs ADL help 0.30 0.23Mother has doctor diagnosed memory problem 0.04 0.005Mother’s age 87.40 79.55Mother’s education (years) 10.04 9.73Family structure instrument listNumber of girls 1.89 2.23Number of boys 1.64 1.97Eldest child in family is female 0.55 0.53Number of siblings’ kids 6.46 8.04
Table II. Continuing care among caregivers
Cared for mother at time t
Entire sample Mother still alivet12 Mother diest12
Cared for mothert12 45% 52% 0%Did not care for mothert12 55% 48% 100%N 2709 2316 393
HEALTH EFFECTS OF CAREGIVING 997
Published in 2009 by John Wiley & Sons, Ltd. Health Econ. 18: 991–1010 (2009)
DOI: 10.1002/hec

This trend switches among those whose mother is still alive 2 years later – over half of them continue toprovide informal care. However, if the mother dies, there is as expected, a zero percent chance that themother who died will be cared for in the next period. The death of the care recipient acts as animportant switching mechanism from caring to non-caring.
The first stage model5 (Table III) confirms the strength of death of a mother beyond the univariatecase. It is clear that the death of a mother is an important negative predictor of continuing caregiving.For married women (column 1), e.g. an adult child is 55% less likely to continue caregiving if a motherpasses away. The estimates are similar in magnitude for the other subsamples (columns 2–4). The partialF-test statistic is the lowest for single men, but at 16 is statistically significant and comfortably over thethreshold of 10 (Staiger and Stock, 1997). The other subgroups have test statistics with magnitudesranging from 175 to 837 and appear in Table III. While CES-D8 (and the other health measures) aregenerally not significant in the first stage, the Hausman test for endogeneity reveal that, as suspected,health and caregiving are endogenous.
There are other interesting patterns of personal characteristics that affect one’s propensity tocontinue providing care for an elderly mother. Age has a non-linear effect for adult sons, while havingno effect for adult daughters. Married sons and single daughters are responsive to their outside time
Table III. First stage results for continued caregiving
Married women Single women Married men Single men
Mother died �0.5538��� �0.5415��� �0.4628��� �0.3955���
(0.0191) (0.0409) (0.0243) (0.0987)Work full-timet �0.0128 0.0633 �0.1598��� �0.1929
(0.0438) (0.0825) (0.0553) (0.1588)Work at least 0.0073 �0.0546 0.2080��� 0.1336part-timet (0.0406) (0.0820) (0.0542) (0.1589)Number of kidst 0.0062 �0.0294�� 0.0013 0.0088
(0.0062) (0.0147) (0.0084) (0.0212)Age 0.0106 �0.0835 0.1415��� 0.6065���
(0.0303) (0.0578) (0.0424) (0.1331)Age squared �0.0001 0.0007 �0.0012��� �0.0050���
(0.0003) (0.0005) (0.0003) (0.0011)Educ oHS 0.0847� �0.0730 0.1497��� 0.1326
(0.0471) (0.0641) (0.0518) (0.1285)HS degree 0.0366 �0.0253 0.1667��� �0.1584
(0.0531) (0.0876) (0.0559) (0.1467)At least some 0.0573 �0.0351 0.1131� �0.0074College (0.0624) (0.0941) (0.0604) (0.1894)White/Caucasian 0.0559 0.0244 0.0473 �0.2614��
(0.0726) (0.0737) (0.2069) (0.1071)CES-D8 �0.0119 �0.0102 0.0008 �0.0279
(0.0084) (0.0116) (0.0100) (0.0226)Observations 1270 347 817 123R-squared 0.21 0.25 0.17 0.47Year fixed effects X X X XF-test on death variables 837.32��� 175.42��� 361.19��� 16.04���
Note: These regressions also include: log(net worth), education of the mother, education of the father, the number of children age,age squared, work in the previous wave, education categories, race, foreign born and Hispanic indicators, health of the mother,controls for missing values, and wave indicators. The sample is of those providing care in the previous wave, not coresiding beforethe caregiving episode, and with only the mother alive.Robust standard errors in parentheses. �Significant at 10%; ��significant at 5%.
5Since we include the lagged-dependent variable in the regression, we have 16 first-stage regressions (4 subsamples and 4 outcomemeasures). Table III presents the first-stage for the CES-D8 first-stage. The other first-stage regressions, where we control fordifferent health characteristics, are similar in both the magnitude of instrument and the covariates.
N. B. COE AND C. H. VAN HOUTVEN998
Published in 2009 by John Wiley & Sons, Ltd. Health Econ. 18: 991–1010 (2009)
DOI: 10.1002/hec

commitments, with full-time working sons being more likely to stop providing care, as are those singledaughters with more children. Education is a determinant for married individuals, with the lesseducated more likely to continue providing care. Note that these regressions also include parent’seducation and the individual’s net worth (both of which are insignificant) in order to control forsocio-economic status, thus the education finding is not simply a socio-economic effect. Race does notseem to be a determinant of continued caregiving for any of the subgroups except single men, withwhite single men being over 24% more likely to stop caring for their parent than their minoritycounterparts.
6.3. Health effects of continued caregiving
Table IV presents the effects of caregiving on depressive symptoms for married women for allspecifications we have explored. The first two columns present the simple OLS and IV linear models.Since the CES-D8 is a count variable, we also present the results from Poisson and IV Poisson models incolumns 3 and 4. Columns 5 and 6 present random-effects models, while the A-B fixed-effects modelsare in columns 7 and 8.6 We only report the coefficients on the lagged-dependent variable and thecoefficient of interest on caregiving behavior.
The OLS (column 1) estimates suggest that among caregivers, those who continue caregiving report0.24 more depressive symptoms than those who stop caregiving, on average. Once we control for theendogeneity of stopping caregiving (column 2), the estimate increases, suggesting that continuingcaregiving increases the number of depressive symptoms by 0.56 compared to those who stop caregivingdue to the death of their mother.
Since CES-D8 is a count variable and not a continuous one, we also estimated the relationship usinga Poisson model. While the coefficients change a bit, the general story is still the same. Continuedcaregiving and depressive symptoms are correlated and causally linked. If anything, the linear modelunderestimates the causal effect. As one can see from columns 1 and 2, there are very few out-of-supportpredictions when using the linear model.7 Thus we feel that the linear model fit is satisfactory, andcontinue using it when exploring the more flexible models with different assumptions about the errorterms.
In columns 5 and 6 of Table IV, we present the regression results when including a random effect.This assumes an individual error term that is not correlated with our observable characteristics. Whilethe estimates remain stable, the Breusch and Pagan Lagrange-multiplier test clearly does not supportthe need for random effects in this case. Random effects is inconsistent when lagged-dependentvariables are included in the model, and the Hausman test indicates the need for a fixed-effectspecification. As mentioned above, fixed-effect models with lagged-dependent variables suffer from theNickell (1981) bias, and thus we turn to A-B estimation (columns 7 and 8). In column 7, we limit theinstrument for current health to only the two-period lag, and in column 8, we allow for two- and three-period lags to be instruments. The tests on the error structure (AR(1) and AR(2) tests) indicate that theA-B method is appropriate for the data. The results show that this estimation technique yieldsvery similar, although slightly larger, estimates of the effect of continuing caregiving on caregiverdepressive symptoms. Continuing to provide care for a sick mother increases the reported number ofdepressive symptoms by 0.6 compared to caregivers who stop due to the death of the mother. On a base
6Since the A-B estimators require individuals to be observed in at least three waves, the sample sizes decrease. We have done thefull analysis keeping the sample consistent, and it does not materially change the estimates or conclusions of the paper, thus wepresent the OLS and IV results with the largest sample size.
7Much like comparing a linear probability model to a probit or logit model, the number of out of sample predictions is one way tosee the goodness of fit for the linear model. We could transform the CES-D8 variable into one that is bound between 0 and 1simply by dividing by 8, necessitating a logit model, and thus the number of out-of-support predictions seems relevant in this caseas well.
HEALTH EFFECTS OF CAREGIVING 999
Published in 2009 by John Wiley & Sons, Ltd. Health Econ. 18: 991–1010 (2009)
DOI: 10.1002/hec

TableIV
.Resultsformarriedwomen,CES-D
8depressionindex
Linearmodels
Non-linearmodels
Testingdifferenterrorstructures
(1)
(2)
(3)
(4)
(5)
(6)
(7)
(8)
CES-D
8t1
2
OLS
IVPoisson
IVPoisson
OLSRE
IVRE
A-B
with
1lag
A-B
with
2lags
CES-D
8t
0.4492���
0.4525���
0.2386���
0.2890���
0.3346���
0.3753���
0.0652
0.0544
(0.0388)
(0.0387)
(0.0165)
(0.0238)
(0.0289)
(0.0288)
(0.0761)
(0.0686)
Caregivingt1
2,t
0.2414���
0.5569��
0.1900���
0.7054��
0.2208��
0.5721��
0.5997��
0.6071��
(0.0929)
(0.2456)
(0.0721)
(0.3248)
(0.0956)
(0.2468)
(0.2934)
(0.2912)
Observations
1270
1270
1270
1270
1270
1270
1229
1229
Individuals
700
700
700
700
700
700
679
679
Number
ofout-of-support
predictions
216
11
Breush–Paganw2
test
0.24
Hausm
anw2
test
0.000
AR(1)
�7.77
�8.39
P-value
0.00
0.00
AR(2)
0.36
0.30
P-value
0.72
0.76
Note:Theseregressionsalsoincludelog(net
worth),educationofthemother,educationofthefather,thenumber
ofchildrenage,
agesquared,work
inthepreviouswave,
educationcategories,race,foreignborn
andHispanicindicators,healthofthemother,controlsformissingvalues,andwaveindictors.Thesampleisofthose
providingcare
inthepreviouswave,
notcoresidingbefore
thecaregivingepisode,
andwithonly
themother
alive.
Robust
standard
errors
inparentheses.� S
ignificantat10%;��
significantat5%
;��� significantat1%
.
N. B. COE AND C. H. VAN HOUTVEN1000
Published in 2009 by John Wiley & Sons, Ltd. Health Econ. 18: 991–1010 (2009)
DOI: 10.1002/hec

mean of 1.26 points in this subsample, this represents over a 47% increase in baseline depressionsymptoms. It is also very clear that controlling for CES-D8 in the prior wave is an important predictorin our dynamic setting in most cases, with a positive effect of past depressive symptoms on currentdepressive symptoms.
Table V presents the health effects of continued caregiving, showing all of the subsamples separately.Each cell is an estimate of different regressions estimating the effect of continued caregiving on adifferent health outcome for a different subsample. We report the results from the favored estimationstrategy (linear IV or A-B).
We find that continued caregiving has different impacts on three of our groups. Continued caregivingcauses negative health effects for married women compared to those who stop caregiving due to the lossof the mother, as highlighted in Table IV. Besides a 47% increase in baseline depressive symptoms, wealso find a significant decrease in the likelihood of reporting excellent or very good health (10%)compared to caregivers who stop caregiving.
The health effect for married men is mixed. We find increased depressive symptoms among marriedmen, by 0.65 points on the CES-D8. Since the average number of depressive symptoms is even smalleramong this subsample (0.78), this is a large effect, increasing the number of depressive symptoms byover 83%. Yet, contrary to married women, married men who continue to provide care are almost 17%more likely to report themselves in excellent or very good health, compared to those who stopcaregiving due to the death of their mother.
A priori one might expect to see stronger health effects among single persons who continuecaregiving, since they do not have a spouse to help share the burden, yet our results do not indicate thisis the case. Our only significant result is for single men, who are almost 40% more likely to report
Table V. Health effects of continued caregiving
CES-D8 Heart condition High blood pressure Good health
Married womenCare givingt2,t 0.5997�� �0.0440 �0.0135 �0.1020�
(0.2934) (0.0337) (0.0495) (0.0609)N 1229 1270 1270 1270Estimation method A-B (1) IV IV IV
Single womenCare givingt2,t �0.3500 �0.0138 �0.0765 �0.1611
(0.5160) (0.0764) (0.0946) (0.1581)N 347 347 317 317Estimation method IV IV A-B (1) A-B(1)
Married menCare giving t2,t 0.6463�� 0.0446 �0.0009 0.1676��
(0.3063) (0.0489) (0.0663) (0.0848)N 808 817 817 817Estimation method A-B (1) IV IV IV
Single menCare giving t2,t �0.3725 0.3971�� �0.1508 0.0738
(0.7735) (0.1602) (0.1491) (0.2551)N 116 123 116 116Estimation method A-B(1) IV A-B(1) A-B(1)
Note: These regressions also include log(net worth), education of the mother, education of the father, the number of children age,age squared, work in the previous wave, education categories, race, foreign born and Hispanic indicators, health of the mother,controls for missing values, and wave indicators. The sample is of those providing care in the previous wave, not coresiding beforethe caregiving episode, and with only the mother alive.Robust standard errors in parentheses. �Significant at 10%; ��significant at 5%.
HEALTH EFFECTS OF CAREGIVING 1001
Published in 2009 by John Wiley & Sons, Ltd. Health Econ. 18: 991–1010 (2009)
DOI: 10.1002/hec

having a heart condition than those who stop providing care to their mothers. The OLS results aresmaller (11% more likely) but still statistically significant.
6.4. Robustness checks
We would also have liked to classify informal care as intensive versus non-intensive, as others in theliterature have done (Ettner, 1995; Heitmuller, 2007). Because the measure of hours of care is suspect,with many cases falling below the 100 hour threshold respondents were told to use in answering the ‘anycaregiving’ question, we cannot separate intensive and occasional caregivers, as others have done.Instead, we can separate those who help with chores and those who help with personal care, and try toaddress intensity with the assumption that chore help is less intense or demanding. As expected, weestimate larger health effects for personal care and smaller health effects for chore care than when thesemeasures are combined.8 Due to the drop in incidence of caregiving, though, when separating themeasures, we cannot rule out that these are the same as the average effect reported.
In order to test the validity of the exclusion restriction that the death of the mother does not have adirect impact on the health of the adult child, we have run the exact same regressions including the deathof the mother directly in the model instead of as an instrument. This time, however, the sample is limitedto individuals whose mother is alive, whose father is not, who do not co-reside with their mother, andwho are not caregivers. This test assumes that the death of a mother would affect the health of allchildren equally, except through the caregiving channel.9 As Table VI illustrates, we find very few directeffects of the death of the mother among this sample of non-caregivers. For married women, we actuallyfind the reverse effect for depressive symptoms suggesting that our measured effect for caregiving is alower bound. We also find improvements in blood pressure for married men. We take solace in the factthat the estimated coefficients are quite small (a factor of 10 smaller than our caregiving effects), withrelatively small standard errors.
6.5. Interpretation and multiple-hypothesis testing
Given that we test multiple dimensions of health outcomes, it is important to specify if we are testingindividual or multiple hypotheses, and if it is the latter, to adjust the significance levels appropriately.There are four levels of hypotheses about health effects that we could test: (1) all individually, regardlessof any affects on any other health measures, (2) mental health, (3) physical health, and (4) all healthmeasures. For the first and second hypotheses, no adjustments need to be made to the significance levels(since we only have the depression measure for mental health), and the interpretation is as presentedabove. This is our preferred interpretation.
In order to test if there are any effects on physical health from continued caregiving, we have toadjust the significance levels for this joint hypothesis. If the probability of false rejection is to remain at0.10 for this triple-hypothesis test, then we need to adjust individual significance to 0.0345 (Veazie,2006), eliminating the significance of self-reported health effects for both married men and marriedwomen. The results for heart conditions for single men remain significant, even under this morestringent test, thus we can conclude that there are significant effects on physical health for single men. Ifwe test the null hypothesis that there are no health effects at all, one would have to adjust thesignificance tests further to 0.026 to keep the probability of a false positive at 0.10. We can only rejectthis hypothesis for single men.
8Precise coefficients are available from the authors, but not included here.9One could argue that those children with a higher emotional attachment become caregivers, and thus there would be a differentialeffect. Since there is no way to capture the depth of the relationship between a mother and the child empirically, the assumption ofequal effects, while potentially strong, will have to suffice.
N. B. COE AND C. H. VAN HOUTVEN1002
Published in 2009 by John Wiley & Sons, Ltd. Health Econ. 18: 991–1010 (2009)
DOI: 10.1002/hec

6.6. Persistence of the effects
In order to gauge the importance of the health impacts of caregiving, it is important to know if thesehealth effects are temporary or persistent. We test for persistence by testing for health effects another 2years after we observe a person providing informal care. Recall that the reference group is individualsthat provided care in time t5 0, and stopped in time t5 2 due to the death of the mother, and now weare comparing health outcomes at t5 4. We present the results in Table VII.
Although the effects on self-reported health appear short lived, we find that the depressive effect formarried women and the heart conditions for single men who continue caregiving are persistent.Continuing to care at time t5 2 increases the depressive symptoms for married women by 0.65 points(on an 8-point scale) 2 years later, which is similar in magnitude to the immediate effect. The increase inthe probability of reporting a heart condition increases to 0.61 when measured at time t5 4, comparedto 0.40 at time t5 2. Although the estimate of the depressive effect for married men is quantitativelysmaller than the earlier estimate, the model is not precise enough for us to determine if the depressioneffects for married men diminish over a longer time period or not. Our sample becomes too small toestimate effects 4 years after caregiving stopped (t5 6).
6.7. Initial caregiving
6.7.1. The first stage. The individual significance of the instruments and partial F statistics in Table VIII(column 1) show the performance of the identification for each subsample examined. The family
Table VI. Testing the direct health effects of mother’s death
Heath Measuret12
CES-D8 Heart condition High blood pressure Good health
Married womenMother diedt2,t �0.2196� 0.0002 0.0075 0.0030
(0.1292) (0.0148) (0.0214) (0.0338)N 1507 1567 1567 1507Specification A-B (2) OLS OLS-RE A-B (1)
Single womenMother diedt2,t �0.1176 0.0056 0.0545 0.0167
(0.2546) (0.0216) (0.0340) (0.0525)N 522 522 583 522Specification A-B (1) A-B (1) OLS A-B (1)
Married menMother diedt2,t 0.0285 0.0083 �0.0369� �0.0173
(0.0969) (0.0184) (0.0191) (0.0293)N 1813 1870 1866 1810Specification A-B (1) OLS OLS A-B (1)
Single menMother diedt2,t 0.0543 �0.0037 0.0111 0.0708
(0.3199) (0.0460) (0.0630) (0.0790)N 219 234 234 219Specification A-B (1) OLS OLS A-B (1)
Note: These regressions also include: log(net worth), education of the mother, education of the father, the number of children age,age squared, work in the previous wave, education categories, race, foreign born and Hispanic indicators, health of the mother,controls for missing values, and wave indicators. The sample is of those adult children who never provide care during the1992–2004 observation window, not coresiding, and with only the mother alive.Robust standard errors in parentheses. �Significant at 10%; ��significant at 5%; ���significant at 1%.
HEALTH EFFECTS OF CAREGIVING 1003
Published in 2009 by John Wiley & Sons, Ltd. Health Econ. 18: 991–1010 (2009)
DOI: 10.1002/hec

structure characteristics provide strong identification for married women and married men, but not forsingles. For single women and single men, the individual instruments are significant predictors ofproviding any care at the 5% level, but partial F statistics are nevertheless below the desired value of 10(Staiger and Stock, 1997). We focus our discussion of results on the two subsamples where we have astrongly identified system, namely married women and married men.
6.7.2. Detection of endogeneity. Contrary to our expectations, endogeneity did not exist for selectioninto caregiving. Examining the first stage regressions in more detail (Table IX), the lack of endogeneitybecomes less surprising in one aspect, because initial health status is not a significant predictor ofinformal care in most cases. Only high blood pressure and having a heart condition in the past wave areassociated with a significant increase in the likelihood of being a caregiver for married men (and this ismarginally significant at the 10% level).
6.7.3. Additional specification tests. We examined A-B models to address unobserved heterogeneity ininitial caregiving. For both one- and two-lagged A-B models, specification tests indicated that they werenot appropriate. In addition, for the high blood pressure and heart condition outcomes, linear modelspredicted too frequently (over 25% of the time) outside of the unit interval, hence we present probitmodels for these two outcomes. For excellent or very good health, we report linear results for ease ofinterpretation, because the linear models fit the data well for this health outcome.
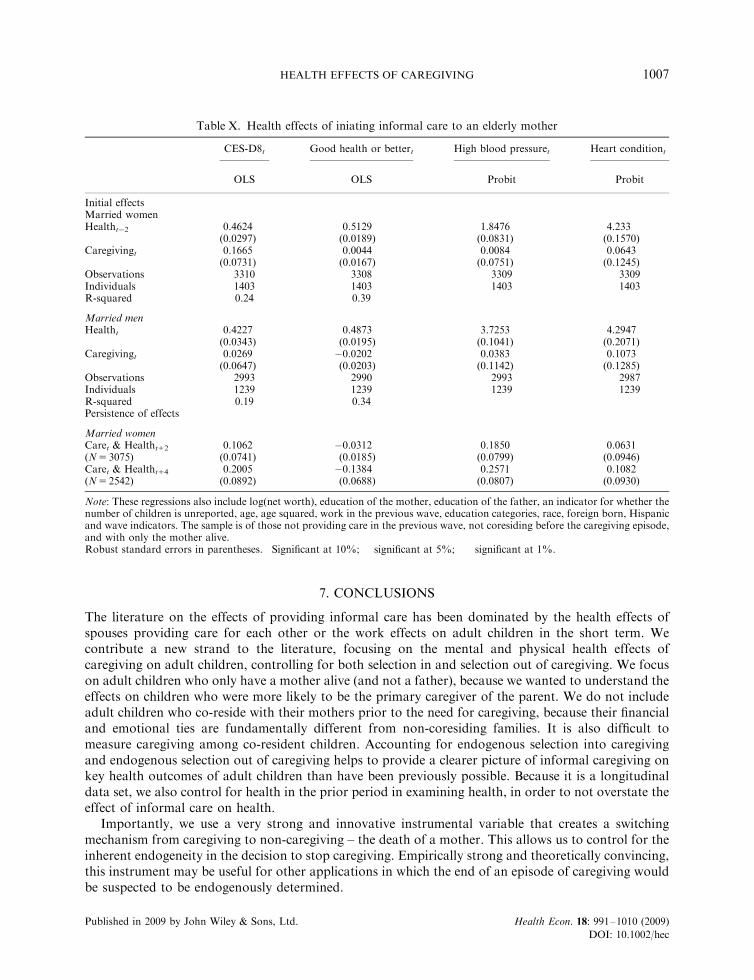
6.7.4. Health effects. Table X presents the health effects of beginning to provide care for one’s mother.We find a significant increase in depressive symptoms for married women upon initial caregiving
Table VII. Longer-term health effects (2 years out)
CES-D8 Heart condition High blood pressure Good health
Married womenCare givingt2,t 0.6498�� �0.0192 �0.0422 �0.1059
(0.3149) (0.0418) (0.0677) (0.0777)N 996 996 996 996Estimation method IV IV IV IV
Single womenCare givingt2,t �0.0999 �0.0905 �0.2269 0.0637
(0.7149) (0.0884) (0.1520) (0.1155)N 258 258 258 258Estimation method IV IV IV IV
Married menCare givingt2,t 0.5777 �0.0877 �0.0190 �0.0820
(0.3577) (0.0881) (0.1029) (0.1160)N 632 632 632 632Estimation method IV IV IV IV
Single menCare givingt2,t �0.2385 0.6076�� �0.1058 �0.0730
(0.9005) (0.2529) (0.2540) (0.3320)N 89 89 83 83Estimation method IV IV A-B(1) A-B(1)
Note: These regressions also include: log(net worth), education of the mother, education of the father, the number of children age,age squared, work in the previous wave, education categories, race, foreign born, and Hispanic indicators, health of the mother,controls for missing values, and wave indicators. The sample is of those providing care in the previous wave, not coresiding beforethe caregiving episode, and with only the mother alive.Robust standard errors in parentheses. �Significant at 10%; ��significant at 5%; ���significant at 1%.
N. B. COE AND C. H. VAN HOUTVEN1004
Published in 2009 by John Wiley & Sons, Ltd. Health Econ. 18: 991–1010 (2009)
DOI: 10.1002/hec

(column 1 of Table IX). Although significant, the magnitude is small, or a 0.17 points increase in theCES-D8 score. Considering mean values on the CES-D8 of 1.16 among caregivers and 0.27 among non-caregivers, however, 0.17 represents a 15% increase in the mean score.10 There are no other significantinitial health effects of initial caregiving among married women and no significant health effects ofinitial caregiving on married men (Table X).
6.7.5. Persistence of the effects. Examining health effects 2 years after the start of caregiving (caregivingfor the first time in t5 0 and health in t5 2) shows more numerous negative health effects for marriedwomen (Table X, lower panel). Here, the relevant comparison group is persons who were not caregiving
Table VIII. First stage: selection into caregiving for the first time
Family1 structure
Single menNumber of boys �0.032���
(0.012)F(1, 227) 7.4���
Obs 447R-squared 0.10
Married menNumber of girls �0.0158���
(0.0045)F(1, 1531) 12.35���
Obs 3668R-squared 0.05
Single womenNumber of boys �0.0186��
(0.0072)F(1, 553) 6.69��
Obs 1255R-squared 0.07
Married womenNumber of girls �0.0204���
(0.0047)F(1, 140) 18.76���
Obs 3309R-squared 0.07
Note: The sample is of those not providing care in the previous wave, not coresidingbefore the caregiving episode, and with only the mother alive.1Adult child-level regressions also include lagged health, log(net worth), age, agesquared, work in the previous wave, education categories, race, foreign born, Hispanicindicators, mother and father’s education, mother’s health, and wave indicators. Eachfirst stage regression controls for a single measure of lagged health. Here, we highlightthe first stage regressions that controlled for lagged self-rated health because it isrepresentative of all.Robust standard errors in parentheses. �Significant at 10%; ��significant at 5%;���significant at 1%.
10For initial caregiving, if one only separates the sample by personal care and chore care providers, then the effects for marriedwomen on depressive symptoms is stronger for personal care and slightly smaller for chore care, reflecting that personal care islikely more intensive. There are no other significant effects for married women when you separate the measure by personal careand chores. We prefer to report both types of care as the measure of informal care in the paper, since it shows the overallcommitment to informal care.
HEALTH EFFECTS OF CAREGIVING 1005
Published in 2009 by John Wiley & Sons, Ltd. Health Econ. 18: 991–1010 (2009)
DOI: 10.1002/hec

in time t5 0. There is a 3 percentage point (12%) lower likelihood of being in excellent or very goodhealth ( po0.10) for caregivers compared to noncaregivers and a 3 percentage point (15%) higherlikelihood of having high blood pressure (marginal effects calculated from probit estimates in Table X).The null effects for married men also persist. Examining 4 years out, caregiving’s effects on healthbecomes even stronger (Table X). For example, married women caregivers 4 years out have a nearly 14percentage point reduction in the likelihood of being in at least very good health compared to marriedwomen non-caregivers ( po0.05). The chance of having high blood pressure also increasesby 5 percentage points (a 63% predicted chance for caregivers compared to a 58% predicted chancefor non-caregivers). The depressive symptom effect reappears for married women 4 years out,with caregivers having a 0.20 points increase in their CES-D8 score. There are still no effects formarried men.
If we adjust the significance levels in order to test multiple hypotheses, we can reject all four nullhypotheses that (1) there are no long-term health effects individually, (2) there are no long-term(4-years) depressive symptom effects, (3) there are no long-term physical health effects, and (4) there areno long-term health effects (4-years) for the subsample of married women.
Table IX. First stage results for initial caregiving
Married women Married men
Goodhealtht�2
Heartconditiont�2
High bloodpressuret�2
Goodhealtht�2
Heartconditiont�2
High bloodpressuret�2
Number of girls �0.0202��� �0.0204��� �0.0203��� �0.0197��� �0.0195��� �0.0195���
(0.0047) (0.0047) (0.0047) (0.0050) (0.0050) (0.0050)Health last wave �0.0064 �0.0211 �0.0230 �0.0212 0.0624� �0.0487
(0.0161) (0.0258) (0.0254) (0.0158) (0.0230) (0.0346)Full-time work last wave �0.0030 �0.0033 �0.0039 �0.0502 �0.0503 0.0617�
(0.0254) (0.0253) (0.0258) (0.0342) (0.0342) (0.0162)Part-time work last wave �0.0223 �0.0239 �0.0034 0.0638� 0.0214 0.0206
(0.0258) (0.0271) (0.0173) (0.0345) (0.0344) (0.0345)Age 0.0081� 0.0080� 0.0081� �0.0025 �0.0025 �0.0025
(0.0047) (0.0047) (0.0047) (0.0038) (0.0038) (0.0038)Age squared 0.2224�� 0.2209�� 0.2230�� �0.0055 �0.0056 �0.0040
(0.0971) (0.0973) (0.0973) (0.0706) (0.0708) (0.0712)Number of kids �0.0047�� �0.0046�� �0.0047�� 0.0004 0.0002 0.0003
(0.0021) (0.0021) (0.0021) (0.0014) (0.0014) (0.0014)Missing kids �0.0309 �0.0320 �0.0309 0.0105 0.0088 0.0107
(0.0288) (0.0288) (0.0288) (0.0299) (0.0299) (0.0299)Number of grand kids 0.0969��� 0.0978��� 0.0977��� 0.0265 0.0273 0.0270
(0.0231) (0.0231) (0.0231) (0.0195) (0.0196) (0.0196)Missing grand kids �0.1269 �0.1260 �0.1261 �0.0368 �0.0359 �0.0390
(0.1223) (0.1218) (0.1228) (0.0576) (0.0576) (0.0587)Mom needs help 0.0223 0.0225 0.0223 0.0381� 0.0391� 0.0383�
(0.0284) (0.0284) (0.0284) (0.0224) (0.0225) (0.0225)Missing mom needs help 0.0072��� 0.0072��� 0.0073��� �0.0022 �0.0019 �0.0022
(0.0022) (0.0022) (0.0022) (0.0024) (0.0024) (0.0024)Mom can be �0.0011 �0.0012 �0.0012 0.0034 0.0032 0.0033Left alone (0.0028) (0.0028) (0.0028) (0.0025) (0.0025) (0.0025)Observations 3267 3268 3268 2990 2991 2991R-squared 0.07 0.07 0.07 0.06 0.06 0.06
Note: Regressions also include lagged health, log(net worth), age, age squared, work in the previous wave, education categories,race, foreign-born, and Hispanic indicators, mother and father’s education, mother’s health, variables for missing values, andwave indicators. The sample is of those not providing care in the previous wave, not coresiding before the caregiving episode, andwith only the mother alive.Robust standard errors in parentheses. �Significant at 10%; ��significant at 5%; ���significant at 1%.
N. B. COE AND C. H. VAN HOUTVEN1006
Published in 2009 by John Wiley & Sons, Ltd. Health Econ. 18: 991–1010 (2009)
DOI: 10.1002/hec
7. CONCLUSIONS
The literature on the effects of providing informal care has been dominated by the health effects ofspouses providing care for each other or the work effects on adult children in the short term. Wecontribute a new strand to the literature, focusing on the mental and physical health effects ofcaregiving on adult children, controlling for both selection in and selection out of caregiving. We focuson adult children who only have a mother alive (and not a father), because we wanted to understand theeffects on children who were more likely to be the primary caregiver of the parent. We do not includeadult children who co-reside with their mothers prior to the need for caregiving, because their financialand emotional ties are fundamentally different from non-coresiding families. It is also difficult tomeasure caregiving among co-resident children. Accounting for endogenous selection into caregivingand endogenous selection out of caregiving helps to provide a clearer picture of informal caregiving onkey health outcomes of adult children than have been previously possible. Because it is a longitudinaldata set, we also control for health in the prior period in examining health, in order to not overstate theeffect of informal care on health.
Importantly, we use a very strong and innovative instrumental variable that creates a switchingmechanism from caregiving to non-caregiving – the death of a mother. This allows us to control for theinherent endogeneity in the decision to stop caregiving. Empirically strong and theoretically convincing,this instrument may be useful for other applications in which the end of an episode of caregiving wouldbe suspected to be endogenously determined.
Table X. Health effects of iniating informal care to an elderly mother
CES-D8t Good health or bettert High blood pressuret Heart conditiont
OLS OLS Probit Probit
Initial effectsMarried womenHealtht�2 0.4624��� 0.5129��� 1.8476��� 4.233���
(0.0297) (0.0189) (0.0831) (0.1570)Caregivingt 0.1665�� 0.0044 0.0084 0.0643
(0.0731) (0.0167) (0.0751) (0.1245)Observations 3310 3308 3309 3309Individuals 1403 1403 1403 1403R-squared 0.24 0.39
Married menHealtht 0.4227��� 0.4873��� 3.7253��� 4.2947���
(0.0343) (0.0195) (0.1041) (0.2071)Caregivingt 0.0269 �0.0202 0.0383 0.1073
(0.0647) (0.0203) (0.1142) (0.1285)Observations 2993 2990 2993 2987Individuals 1239 1239 1239 1239R-squared 0.19 0.34Persistence of effects
Married womenCaret & Healtht12 0.1062 �0.0312� 0.1850�� 0.0631(N5 3075) (0.0741) (0.0185) (0.0799) (0.0946)Caret & Healtht14 0.2005�� �0.1384�� 0.2571��� 0.1082(N5 2542) (0.0892) (0.0688) (0.0807) (0.0930)
Note: These regressions also include log(net worth), education of the mother, education of the father, an indicator for whether thenumber of children is unreported, age, age squared, work in the previous wave, education categories, race, foreign born, Hispanicand wave indicators. The sample is of those not providing care in the previous wave, not coresiding before the caregiving episode,and with only the mother alive.Robust standard errors in parentheses. �Significant at 10%; ��significant at 5%; ���significant at 1%.
HEALTH EFFECTS OF CAREGIVING 1007
Published in 2009 by John Wiley & Sons, Ltd. Health Econ. 18: 991–1010 (2009)
DOI: 10.1002/hec

We find different health effects of caregiving depending on the duration of caregiving,with key differences between caregivers who continue caregiving and initial caregivers. We findeffects for three out of four subgroups of adult children; only the health of single women appears to beunaffected.
We find that continued caregiving leads to a 47% increase in the depression index for married women(CES-D8) and an 83% increase for married men. We find that there is persistence in the depressivesymptoms effect for women, where it is still significant and negative 2 years later. Although the meanCES-D8 score of these samples is below the clinical cut off for probable depression at a score exceeding4 or 5, a half-point increase in the CES-D8 score is large in magnitude. Single men caregivers alsoexperience an increase in the probability of reporting heart conditions.
For initial caregivers, there is a significant but small increase, by 15%, in depressive symptomsfor married women immediately and no health effects for married men. Examining health outcomes 2years later shows that negative physical health effects are delayed for married women – there is asmall but significant decrease in the likelihood of being in very good or excellent health and asignificant increase in the likelihood of having high blood pressure. Furthermore, health effects formarried women persist up to 4 years out for these two categories and the effects on depressive symptomsbecome larger.
In the analysis of initial selection into caregiving, we find that although the instrumental variables onfamily structure are useful in describing the cross-section of caregivers, which has also been found inother cross-sectional studies, they are not successful in all subgroups when examining the dynamicswithin a family, particularly for single men and single women. Increased sample sizes for single men andwomen may help the performance of the instruments. Future work should turn to creating time-varyinginstruments to identify initial selection into caregiving in the dynamic setting. This would help usunderstand whether our null effects for singles were due to true null effects, sample size limitations, orweak identification in the dynamic setting.
Beyond these important health effects, future studies should focus on how the health effects and timeburden of caregiving translate into larger wealth effects. Many studies have examined a snapshot ofshort-term work effects (Ettner, 1995; Lo Sasso and Johnson, 2004; Crespo, 2006; Heitmuller, 2007;Heitmuller and Inglis, 2007), along with one longitudinal study on work outcomes (McGarry, 2003). Itis well documented that health declines can lead to early retirement (for example, Currie and Madrian,1999). Thus, considering broader wealth measures, such as early retirement, pension accrual and networth change over time, possibly due in part to increased expenditures on health care from caregiverhealth effects, are critical to understanding the full impact of caregiving on the informal caregiver.Understanding the health effects is an important step in completing the puzzle on the net benefits ofinformal caregiving to society.
ACKNOWLEDGEMENTS
Work on this paper was supported by the Network on the Study of Pensions, Aging and Retirement(Netspar) (Coe/Van Houtven), John A. Hartford Foundation Pilot Studies Grant through DukeUniversity’s Center for the study of Aging and Human Development (Coe/Van Houtven) and the MarieCurie Incoming International Fellowship (Coe). Part of it was completed while Van Houtven was avisiting assistant professor at Tilburg University. We thank Liliana Pezzin, Alberto Holly, ThomasLufkin, Ezra Golberstien, Tom van Ourti, Pilar Garcia Gomez, Frank Windemijer, Gema Zamarro,Edward C. Norton, and two anonymous reviewers for helpful comments on an earlier draft of thepaper. The opinions and conclusions expressed are solely those of the authors and do not represent theopinions or policy of the Center for Retirement Research at Boston College.
N. B. COE AND C. H. VAN HOUTVEN1008
Published in 2009 by John Wiley & Sons, Ltd. Health Econ. 18: 991–1010 (2009)
DOI: 10.1002/hec

Conflict of interest disclosures: None
REFERENCES
Andren S, Elmstahl S. 2007. Relationships between income, subjective health and caregiver burden in caregivers ofpeople with dementia in group living care: a cross-sectional community-based study. International Journal ofNursing Studies 44: 435–446.
Arellano M, Bond SR. 1991. Some tests of specification for panel data: Monte Carlo evidence and an application toemployment equations. Review of Economic Studies 58: 277–297.
Blazer D, Burchett B, Service C, George LK. 1991. The association of age and depression among the elderly: anepidemiologic exploration. Journal of Gerontology 46: M210–M215.
Bolin K, Lindgren B, Lundborg P. 2007. Informal and formal care among single-living elderly in Europe. HealthEconomics, Forthcoming.
Brodaty H, Green A, Koschera A. 2003. Meta-analysis of psychosocial interventions for caregivers of people withdementia. Journal of the Americal Geriatrics Society 51: 657–664.
Charles KK, Sevak P. 2005. Can family caregiving substitute for nursing home care? Journal of Health Economics24: 1174–1190.
Checkovich TJ, Stern S. 2002. Shared caregiving responsibilities of adult siblings with elderly parents. Journal ofHuman Resources 37: 441–478.
Clipp EC, George LK. 1993. Dementia and cancer: a comparison of spouse caregivers. Gerontologist 33: 534–541.Crespo L. 2006. Parental caregiving and work employment status of mid-life European women. Departamento de
Fundamentos del Analisis Economico, University of Alicante, Campus San Vicente del Raspeig, 03080 Alicante,Spain.
Currie J, Madrian BC. 1999. Health, health insurance and the labor market. In Handbook of Labor Economics,Ashenfelter OC, Card D (eds), vol. 3. Elsevier: 3309–3416.
Dwyer JW, Coward RT. 1991. A multivariate comparison of the involvement of adult sons versus daughters in thecare of impaired parents. Journal of Gerontology 46: S259–S269.
Eloniemi-Sulkava U, Rahkonen T, Suihkonen M, Halonen P, Hentinen M, Sulkava R. 2002. Emotional reactionsand life changes of caregivers of demented patients when home caregiving ends. Aging and Mental Health6: 343–349.
Engers M, Stern S. 2002. Long-term care and family bargaining. International Economic Review 43: 1–41.Ettner SL. 1995. The impact of ‘parent care’ on female labor supply decisions. Demography 32: 63–80.Grant I, Adler KA, Patterson TL, Dimsdale JE, Ziegler MG, Irwin MR. 2002. Health consequences of Alzheimer’s
caregiving transitions: effects of placement and bereavement. Psychosomatic Medicine 64: 477–486.Grossman M. 1972. On the concept of health capital and the demand for health. The Journal of Political Economy
80: 223–255.Harwood DG, Barker WW, Cantillon M, Loewenstein DA, Ownby R, Duara R. 1998. Depressive symptomatology
in first-degree family caregivers of Alzheimer disease patients: a cross-ethnic comparison. Alzheimer DiseaseAssociation Disorders 12: 340–346.
Hays JC, Blazer DG, Gold DT. 1993. CES-D: cutpoint or change score? Journal of the American Geriatric Society41: 344–345.
Heidemann B, Stern S. 1999. Strategic play among family members when making long-term care decisions. Journalof Economic Behavior and Organizations 40: 29–57.
Heitmuller A. 2007. The chicken or the egg? Endogeneity in labour market participation of informal carers inEngland. Journal of Health Economics 26: 536–559.
Heitmuller A, Inglis K. 2007. The earnings of informal carers: Wage differentials and opportunity costs. Journal ofHealth Economics 26: 821–841.
Hirst M. 2004. Health Inequalities and Informal Care: End of Project Report. Social Policy Research Unit,University of York, York, pp. 1–53.
Hirst M. 2005. Carer distress: a prospective, population-based study. Social Science and Medicine 61: 697–708.Kiecolt-Glaser JK, Dura JR, Speicher CE, Trask OJ, Glaser R. 1991. Spousal caregivers of dementia victims:
longitudinal changes in immunity and health. Psychosomatic Medicine 53: 345–362.Lee S, Colditz GA, Berkman LF, Kawachi I. 2003. Caregiving and risk of coronary heart disease in U.S. women:
a prospective study. American Journal of Preventive Medicine 24: 113–119.Lo Sasso A, Johnson R. 2004. Family support of the elderly and female labor supply: tradeoffs among caregiving,
financial transfers, and work. In The Family in an Ageing Society, Harper S (ed.). Oxford University Press,pp. 114–142.
HEALTH EFFECTS OF CAREGIVING 1009
Published in 2009 by John Wiley & Sons, Ltd. Health Econ. 18: 991–1010 (2009)
DOI: 10.1002/hec

Majerovitz SD. 1995. Role of family adaptability in the psychological adjustment of spouse caregivers to patientswith dementia. Psychology Aging 10: 447–457.
Mausbach BT, Patterson TL, Rabinowitz YG, Grant I, Schulz R. 2007. Depression and distress predict time tocardiovascular disease in dementia caregivers. Health Psychology 26: 539–544.
McGarry K. 1998. Caring for the elderly: the role of adult children. In: Inquiries in the Economics of Aging.Wise DA (ed.). The University of Chicago Press, pp. 133–163.
McGarry K. 2003. Does caregiving affect work? Evidence based on prior labor force experience. In Health CareIssues in the United States and Japan, Wise D (ed.). University of Chicago Press.
Mittelman MS, Ferris SH, Shulman E, Steinberg G, Levin B. 1996. A family intervention to delay nursing homeplacement of patients with Alzheimer disease. A randomized controlled trial. Journal of American MedicalAssociation 276: 1725–1731.
Neuharth T, Stern S. 2002. Shared caregiving responsibilities of adult siblings with elderly parents. Journal ofHuman Resources 37: 441–478.
Nickell S. 1981. Biases in Dynamic Models with Fixed Effects. Econometrica 49: 1417–1426.Norton E, Van Houtven C. 2006. Inter-vivos transfers and exchange. Southern Economic Journal 73.Pezzin LE, Schone BS. 1999. Intergenerational household formation, female labor supply and informal caregiving:
A Bargaining Approach. Journal of Human Resources 34: 475–503.Sansoni J, Vellone E, Piras G. 2004. Anxiety and depression in community-dwelling, Italian Alzheimer’s disease
caregivers. International Journal of Nursing Practice 10: 93–100.Schulz R, Beach SR. 1999. Caregiving as a risk factor for mortality: the caregiver health effects study. Journal of the
Amercian Medical Association 282: 2215–2219.Schulz R, Beach SR, Lind B, Martire LM, Zdaniuk B, Hirsch C, Jackson S, Burton L. 2001. Involvement in
caregiving and adjustment to death of a spouse: findings from the caregiver health effects study. Journal of theAmerican Medical Association 285: 3123–3129.
Shaw WS, Patterson TL, Ziegler MG, Dimsdale JE, Semple SJ, Grant I. 1999. Accelerated risk of hypertensiveblood pressure recordings among Alzheimer caregivers. Journal of Psychosomatic Research 46: 215–217.
Sorensen S, Pinquart M, Duberstein P. 2002. How effective are interventions with caregivers? An updated meta-analysis. Gerontologist 42: 356–372.
Spector WD, Fleischman JA, Pezzin LE, Spillman BC. 2000. The characteristics of long-term care users. Agency forHealthcare Research and Policy, Rockville, Md.
Staiger D, Stock JH. 1997. Instrumental variables regression with weak instruments. Econometrica 65: 557–586.Stern S. 1995. Estimating family long-term care decisions in the presence of endogenous child characteristics.
Journal of Human Resources 30: 551–580.Thompson CA, Spilsbury K, Hall J, Birks Y, Barnes C, Adamson J. 2007. Systematic review of information and
support interventions for caregivers of people with dementia. BMC Geriatrics 7: 18.Thompson RL, Lewis SL, Murphy MR, Hale JM, Blackwell PH, Acton GJ, Clough DH, Patrick GJ, Bonner PN.
2004. Are there sex differences in emotional and biological responses in spousal caregivers of patients withAlzheimer’s disease? Biological Research for Nursing 5: 319–330.
Van den Berg G, Lindeboom M, Lundborg P. 2008. Bereavement, Health, and Mortality among the ElderlyManuscript.
Van Houtven C, Norton E. 2004. Informal Care and Elderly Health Care Use. Journal of Health Economics 23:1159–1180.
Van Houtven C, Norton E. 2008. Informal care and medicare expenditures: testing for heterogeneous treatmenteffects. Journal of Health Economics 27: 134–156.
Veazie PJ. 2006. When to combine hypotheses and adjust for multiple tests. Health Service Research 41: 804–818.Wolf DA, Freedman V, Soldo BJ. 1997. The division of family labor: care for elderly parents. The Journals of
Gerontology, Series B 52B: 102–109.
N. B. COE AND C. H. VAN HOUTVEN1010
Published in 2009 by John Wiley & Sons, Ltd. Health Econ. 18: 991–1010 (2009)
DOI: 10.1002/hec