Embed Size (px)
Citation preview

Submitted to: World Bank
Caribbean Regional Electricity Generation, Interconnection, and Fuels Supply Strategy Final Report
Submitted By: March 2010
The Power of Experience
Pub
lic D
iscl
osur
e A
utho
rized
Pub
lic D
iscl
osur
e A
utho
rized
Pub
lic D
iscl
osur
e A
utho
rized
Pub
lic D
iscl
osur
e A
utho
rized
Pub
lic D
iscl
osur
e A
utho
rized
Pub
lic D
iscl
osur
e A
utho
rized
Pub
lic D
iscl
osur
e A
utho
rized
Pub
lic D
iscl
osur
e A
utho
rized

Caribbean Regional Electricity Generation, Interconnection, and Fuels Supply Strategy – Final Report i
Contents
Section Page
Section 1 Executive Summary 1-1 1.1 Introduction .................................................................................................................. 1-1 1.2 Approach ...................................................................................................................... 1-6 1.3 Load Forecast ............................................................................................................... 1-6 1.4 Fuel Supply .................................................................................................................. 1-9 1.5 Project and Technology Analysis .............................................................................. 1-10 1.6 Regional Strategies .................................................................................................... 1-25 1.7 Country Summaries ................................................................................................... 1-26 1.8 Recommendations ...................................................................................................... 1-42
Section 2 Introduction 2-1 2.1 Background .................................................................................................................. 2-1 2.2 Study Team .................................................................................................................. 2-2
Section 3 Approach 3-1 3.1 Approach ...................................................................................................................... 3-1 3.2 Brief Description of Study Steps ................................................................................. 3-1
Section 4 Data 4-1 4.1 Data Collection Process ............................................................................................... 4-1
Section 5 Existing and Planned Generation, Summary of Transmission 5-1 5.1 Existing and Planned Generation Plants ...................................................................... 5-1 5.2 Existing Transmission Systems ................................................................................. 5-14 5.3 Description and Analysis of Power Generation Market ............................................ 5-14
Section 6 Load Forecast 6-1 6.1 Load Forecasting Approach ......................................................................................... 6-1 6.2 Current Demand and Electricity Forecast by Country ................................................. 6-1 6.3 Regional Load Forecast ............................................................................................. 6-15
Section 7 Fuel Supply 7-1 7.1 Existing Fuel Supply .................................................................................................... 7-1 7.2 Potential Fuel Supply Options ..................................................................................... 7-2 7.3 Fuel Storage Options .................................................................................................. 7-23 7.4 Fuel Prices and Projections ........................................................................................ 7-27
Section 8 Generation Technologies and Expansion Options 8-1 8.1 Regional Overview ...................................................................................................... 8-1 8.2 Fossil Fuel Technologies – Costs and Performance .................................................... 8-4 8.3 Renewable Energy Technologies – Power Plant Costs and Performance ................. 8-11 8.4 Renewable Technologies – Resource Availability .................................................... 8-32 8.5 Upgrade and Retrofit of Existing Units ..................................................................... 8-38 8.6 Renewable Energy Projects ....................................................................................... 8-39
Section 9 Submarine Cables and Interconnection Options 9-1 9.1 Overview of Submarine Cables ................................................................................... 9-1 9.2 Existing/Proposed Sub-regional Interconnection Options ......................................... 9-12 9.3 Northern Ring Interconnection .................................................................................. 9-36
Contents
Caribbean Regional Electricity Generation, Interconnection, and Fuels Supply Strategy – Final Report ii
Section 10 Study Analytical Approach 10-1 10.1 Overview of Analytical Procedures ........................................................................... 10-1 10.2 Screening Analysis Approach .................................................................................... 10-1 10.3 Approach for Developing Scenarios .......................................................................... 10-5 10.4 Power System Expansion Planning and Analysis Approach ..................................... 10-6
Section 11 Screening Analysis Results 11-1 11.1 Fossil Fuels ................................................................................................................ 11-1 11.2 Screening Curves for Individual Islands .................................................................... 11-5 11.3 The Impact of CO2 “Costs” ..................................................................................... 11-20
Section 12 Scenarios 12-1 12.1 Base Case Scenario .................................................................................................... 12-1 12.2 Fuel Scenario ............................................................................................................. 12-2 12.3 Interconnection/Renewable Scenario ......................................................................... 12-2 12.4 Integrated Scenario .................................................................................................... 12-3
Section 13 Scenario Analysis Results 13-1 13.1 Base Case Scenario Summary ................................................................................... 13-2 13.2 Fuel Scenario ............................................................................................................. 13-6 13.3 Interconnection/Renewable Scenario ......................................................................... 13-9 13.4 Integrated Scenario .................................................................................................. 13-13
Section 14 Study Results Evaluation 14-1 14.1 Comparison of Scenario Results ................................................................................ 14-1 14.2 Recommended Development Scenario ...................................................................... 14-4
Section 15 Conclusions and Recommendations 15-1 15.1 Conclusions ................................................................................................................ 15-1 15.2 Recommendations ...................................................................................................... 15-6
Attachment A provides detailed scenario analysis results Attachment B provides a discussion of submarine power cable reliability Attachment C provides a discussion of submarine power cable repair procedures

Contents
Caribbean Regional Electricity Generation, Interconnection, and Fuels Supply Strategy – Final Report iii
Table Page
Acronyms and Abbreviations ...................................................................................................... viii Table 1-1 Net Peak Demand Load Forecast (MW) ..................................................................... 1-7 Table 1-2 Net Generation Forecast (GWh) .................................................................................. 1-8 Table 1-3 Fuel Prices Based on Yearly Demand 2014-2028 ....................................................... 1-9 Table 1-4 Scenario NPV Cost Differences - Base Case Minus Other Scenario Costs (million
US$) ................................................................................................................................... 1-26 Table 5-1 Fuels, Fuel Types, and Where the Fuel Prices Apply ................................................. 5-2 Table 5-2 Existing Generating Units ........................................................................................... 5-3 Table 5-3 Planned Generating Units ............................................................................................ 5-9 Table 5-4 Transmission System Frequency and Highest Voltages ........................................... 5-14 Table 6-1 Summary Load Forecast for Antigua and Barbuda ..................................................... 6-2 Table 6-2 Summary Load Forecast for Barbados ........................................................................ 6-3 Table 6-3 Summary Load Forecast for Dominica ....................................................................... 6-4 Table 6-4 Summary Load Forecast for Dominican Republic ...................................................... 6-5 Table 6-5 Summary Load Forecast for Grenada .......................................................................... 6-6 Table 6-6 Summary Load Forecast for Haiti ............................................................................... 6-7 Table 6-7 Summary Load Forecast for Jamaica .......................................................................... 6-8 Table 6-8 Summary Load Forecast for St. Kitts .......................................................................... 6-9 Table 6-9 Summary Load Forecast for Nevis ............................................................................ 6-10 Table 6-10 Summary Load Forecast for St. Lucia ..................................................................... 6-11 Table 6-11 Summary Load Forecast for St. Vincent and Grenadines ....................................... 6-12 Table 6-12 Summary Load Forecast for Martinique ................................................................. 6-13 Table 6-13 Summary Load Forecast for Guadeloupe ................................................................ 6-14 Table 6-14 Net Peak Demand Load Forecast (MW) ................................................................. 6-16 Table 6-15 Net Generation Forecast (GWh) .............................................................................. 6-17 Table 7-1 Fuels Used by Country ................................................................................................ 7-1 Table 7-2 Pipeline Transportation Costs – All Islands Connected .............................................. 7-9 Table 7-3 Pipeline Transportation Costs – St. Lucia Not Connected ........................................ 7-10 Table 7-4 Pipeline Transportation Costs – St. Lucia and Guadeloupe Not Connected ............. 7-10 Table 7-5 Pipeline Transportation Costs – Barbados is Only Island Connected ....................... 7-11 Table 7-6 Mid-scale LNG Comparison ..................................................................................... 7-17 Table 7-7 Regional Petroleum Consumption ............................................................................ 7-25 Table 7-8 Summary of Economic Analysis ............................................................................... 7-26 Table 7-9 Transportation Cost Parameters ................................................................................ 7-28 Table 7-10 EIA US Fuel Prices, $/GJ ........................................................................................ 7-30 Table 7-11 Fuel Prices Based on Yearly Demand 2014-2028 ................................................... 7-30 Table 7-12 Yearly Prices for Fuels for Caribbean Power Plants ............................................... 7-31 Table 8-1 Typical Performance and Cost Estimates for Conventional Coal Plants .................... 8-5 Table 8-2 Typical Performance And Cost Estimates for CFB Plants .......................................... 8-6 Table 8-3 Typical Performance and Cost Estimates for Simple Cycle Combustion Turbines .... 8-7 Table 8-4 Typical Performance And Cost Estimates for Combined Cycle Plants ...................... 8-9 Table 8-5 Typical Performance And Cost Estimates for Diesel Engines .................................. 8-10 Table 8-6 Wind Class and Corresponding Wind Speed and Wind Power ................................ 8-13 Table 8-7 Typical Performance And Cost Estimates for Wind Turbines .................................. 8-15

Contents
Caribbean Regional Electricity Generation, Interconnection, and Fuels Supply Strategy – Final Report iv
Table 8-8 Typical Performance And Cost Estimates for Geothermal Plants ............................ 8-19 Table 8-9 Typical Performance And Cost Estimates for Small Hydro Plants ........................... 8-20 Table 8-10 Typical Performance And Cost Estimates for Solar Trough Plants ........................ 8-27 Table 8-11 Typical Performance And Cost Estimates for PV Systems ..................................... 8-30 Table 8-12 Typical Performance And Cost Estimates for Biomass and LFG Plants ................ 8-31 Table 8-13 Renewable Resource Estimate for the Caribbean Region ....................................... 8-36 Table 9-1 List of Some of the World’s Major AC Submarine Cable Links ................................ 9-4 Table 9-2 List of Some of the World’s Major DC Submarine Cable Links ................................ 9-6 Table 9-3 Submarine Cable Project Costs ................................................................................... 9-9 Table 9-4 Proposed Submarine Cable Interconnections ............................................................ 9-13 Table 9-5 Cost Comparison – Nexans Estimates and Historical Formula ................................. 9-15 Table 9-6 Basic Data and Cost Estimates for Submarine Cable Interconnections .................... 9-37 Table 11-1 Added Cost of Fuels Based on CO2 Cost of US$50/tonne ................................... 11-21 Table 11-2 Impact of CO2 Costs on Fuel Costs ...................................................................... 11-21 Table 13-1 Base Case Production Cost Summary (Million 2009 US$) .................................... 13-5 Table 13-2 Base Case Investment Cost Summary (Million 2009 US$) .................................... 13-5 Table 13-3 Fuel Scenario Production Cost Summary (Million 2009 US$) ............................... 13-8 Table 13-4 Fuel Scenario Investment Cost Summary (Million 2009 US$)............................... 13-8 Table 13-5 Interconnection/Renewable Scenario Production Cost Summary (Million 2009 US$)
.......................................................................................................................................... 13-11 Table 13-6 Interconnection/Renewable Scenario Investment Cost Summary (Million 2009 US$)
.......................................................................................................................................... 13-11 Table 13-7 Interconnection/Renewable Scenario Interconnection Cost Summary (Million 2009
US$) ................................................................................................................................. 13-12 Table 13-8 Integrated Scenario Production Cost Summary (Million 2009 US$) .................... 13-15 Table 13-9 Integrated Scenario Investment Cost Summary (Million 2009 US$) ................... 13-15 Table 13-10 Integrated Scenario Interconnection Cost Summary (Million 2009 US$) .......... 13-16 Table 14-1 Scenario NPV Cost Comparison (Million US$) ..................................................... 14-1 Table 14-2 Scenario NPV Cost Differences - Base Case Minus Other Scenario Costs (Million
US$) ................................................................................................................................... 14-2 Table 14-3 Investment Requirement, 2009 US$ Million, by Scenario ...................................... 14-5 Table 14-4 Production Cost Summary, 2009 US$ Million, by Scenario................................... 14-6 Table 15-1 Fuel Prices Based on Yearly Demand 2014-2028 ................................................... 15-1 Table 15-1 Scenario NPV Cost Differences - Base Case Minus Other Scenario Costs (Million
US$) ................................................................................................................................... 15-6

Contents
Caribbean Regional Electricity Generation, Interconnection, and Fuels Supply Strategy – Final Report v
Figure Page
Figure 1-1 Caribbean Regional Map ............................................................................................ 1-3 Figure 1-2 Countries Included in the Study ................................................................................. 1-4 Figure 1-3 Other Relevant Countries Addressed in the Study ..................................................... 1-5 Figure 1-4 Fossil LCL for Dominican Republic ........................................................................ 1-11 Figure 1-5 Other Options for Dominican Republic ................................................................... 1-12 Figure 1-6 Eastern Caribbean Gas Pipeline (ECGP) Proposed Route ....................................... 1-14 Figure 1-7 Dominica Interconnections ...................................................................................... 1-16 Figure 1-8 Nevis – Puerto Rico and Nevis – US Virgin Islands Interconnections .................... 1-17 Figure 1-9 Saba – St. Maarten Interconnection ......................................................................... 1-18 Figure 1-10 Haiti – Dominican Republic Interconnection ........................................................ 1-19 Figure 1-11 United States (Florida) – Cuba Interconnection ..................................................... 1-20 Figure 1-12 Northern Ring Set of Interconnections .................................................................. 1-21 Figure 1-13 Northern Ring Interconnections Alternative .......................................................... 1-22 Figure 1-14 Distillate LCL vs. Renewable Energy Options ...................................................... 1-24 Figure 1-15 Barbados LCL vs. Renewable Energy Options ...................................................... 1-24 Figure 7-1 Coal Transportation Costs .......................................................................................... 7-5 Figure 7-2 LNG Transportation Costs ....................................................................................... 7-16 Figure 7-3 CNG Transportation Costs ....................................................................................... 7-22 Figure 8-1 Existing Generation Technologies ............................................................................. 8-1 Figure 8-2 Capital Cost Estimate for Power Projects in US ........................................................ 8-3 Figure 8-3 Wind Turbine Components ..................................................................................... 8-14 Figure 8-4 Output Profile – Wind Speed vs. kW output for Gamesa G58 Turbine .................. 8-15 Figure 8-5 Flash Steam Geothermal Power Plant Schematic .................................................... 8-18 Figure 8-6 Parabolic Trough Collector Plant ............................................................................. 8-21 Figure 8-7 10 MW Solar 2 Project near Barstow, CA ............................................................... 8-22 Figure 8-8 Ausra and Sky Fuel CLFR Lay Outs ....................................................................... 8-24 Figure 8-9 Parabolic Dish with Stirling Engine ......................................................................... 8-25 Figure 8-10 Two Tank Thermal Storage System ....................................................................... 8-26 Figure 8-11 Typical PV Solar Module....................................................................................... 8-29 Figure 8-12 Typical PV System Configuration ......................................................................... 8-29 Figure 8-13 Least Cost Line for Distillate Fuel ......................................................................... 8-42 Figure 8-14 Distillate LCL vs. Renewable Energy Options ...................................................... 8-43 Figure 8-15 Fossil Least Cost Line for Dominica and Nevis with No Geothermal .................. 8-47 Figure 8-16 Fossil Least Cost Line for Dominica and Nevis vs. Geothermal ........................... 8-48 Figure 9-1 3-Core XLPE Submarine Cable ................................................................................. 9-2 Figure 9-2 Photograph of a Sample of the 525 kV Vancouver Island Cable .............................. 9-3 Figure 9-3 Transmission Cable System Selection Criteria for Various Cable Types and
Capacities (Courtesy of Prysmian Cables and Systems). .................................................... 9-8 Figure 9-4 HV DC MI-IRC Cable ............................................................................................. 9-10 Figure 9-5 Correlation Between Cable Length and Cost (2009 $) ........................................... 9-11 Figure 9-6 Correlation between Cost per MW/MVA and Length ............................................. 9-14 Figure 9-7 Fossil Least Cost Line for St. Kitts vs. Geothermal Plant / Submarine Interconnection
............................................................................................................................................ 9-16 Figure 9-8 Fossil Least Cost Line for Martinique with No Geothermal .................................... 9-18

Contents
Caribbean Regional Electricity Generation, Interconnection, and Fuels Supply Strategy – Final Report vi
Figure 9-9 Fossil Least Cost Line for Martinique and Guadeloupe vs. Geothermal Plant / Submarine Interconnection at 100 MW Each .................................................................... 9-19
Figure 9-10 Fossil Least Cost Lines for Martinique and Guadeloupe vs. Geothermal Plant / Submarine Interconnection at 50 MW Each ...................................................................... 9-20
Figure 9-11 Fossil Least Cost Line for Guadeloupe with No Geothermal ................................ 9-21 Figure 9-12 Fossil Least Cost Lines for Guadeloupe vs. Geothermal Plant / Submarine
Interconnection at 100 MW ............................................................................................... 9-22 Figure 9-13 Fossil Least Cost Line for Guadeloupe vs. Geothermal Plant / Submarine
Interconnection at 50 MW ................................................................................................. 9-23 Figure 9-14 HFO Steam Plant for Puerto Rico vs. Fossil Fuel Options for Florida and
Interconnection at 400MW ................................................................................................ 9-24 Figure 9-15 Fossil Fuel Option for USVI vs. Geothermal Plant / Submarine Interconnection . 9-25 Figure 9-16 Fossil Fuel Option for Sint Maarten vs. Geothermal plant / Submarine
Interconnection at 100MW ................................................................................................ 9-27 Figure 9-17 Fossil Fuel Option for Cuba vs. Fossil Plants / Submarine Interconnection at 400
MW .................................................................................................................................... 9-28 Figure 9-18 Fossil Fuel Option for Haiti vs. Fossil Plants / Land Interconnection at 130 MW 9-30 Figure 9-19 Dominica Interconnections .................................................................................... 9-31 Figure 9-20 Nevis – Puerto Rico and Nevis – US Virgin Islands Interconnections .................. 9-32 Figure 9-21 Saba – St. Maarten Interconnection ....................................................................... 9-33 Figure 9-22 Haiti – Dominican Republic Interconnection ........................................................ 9-34 Figure 9-23 United States (Florida) – Cuba Interconnection ..................................................... 9-35 Figure 9-24 Northern Ring Set of Interconnections .................................................................. 9-39 Figure 9-25 Northern Ring Interconnections Alternative .......................................................... 9-40 Figure 10-1 Cost Representation for Screening Analysis Method ............................................ 10-2 Figure 10-2 Illustrative Development of Least Cost Line (LCL) .............................................. 10-3 Figure 10-3 Least Cost Line Plus Renewable Energy Resources .............................................. 10-4 Figure 11-1 Screening Curves for Distillate-fueled Technologies ............................................ 11-2 Figure 11-2 Distillate vs. HFO Cost Comparison ...................................................................... 11-3 Figure 11-3 Screening Curves for Coal-fueled Technologies ................................................... 11-5 Figure 11-4 Fossil LCL and Wind for Antigua and Barbuda, Grenada, and St. Vincent and the
Grenadines ......................................................................................................................... 11-6 Figure 11-5 Fossil LCL for Barbados ........................................................................................ 11-7 Figure 11-6 Other Options for Barbados ................................................................................... 11-8 Figure 11-7 Fossil LCL for Dominican Republic ...................................................................... 11-9 Figure 11-8 Other Options for Dominican Republic ............................................................... 11-10 Figure 11-9 Fossil LCL for Guadeloupe .................................................................................. 11-11 Figure 11-10 Other Options for Guadeloupe ........................................................................... 11-12 Figure 11-11 Fossil LCL for Haiti ........................................................................................... 11-13 Figure 11-12 Other Options for Haiti ...................................................................................... 11-14 Figure 11-13 Fossil LCL for Jamaica ...................................................................................... 11-15 Figure 11-14 Other Options for Jamaica ................................................................................. 11-16 Figure 11-15 Fossil LCL for Martinique ................................................................................. 11-17 Figure 11-16 Other Options for Martinique............................................................................. 11-18 Figure 11-17 Fossil LCL for St. Lucia..................................................................................... 11-19 Figure 11-18 Other Options for St. Lucia ................................................................................ 11-20
Contents
Caribbean Regional Electricity Generation, Interconnection, and Fuels Supply Strategy – Final Report vii
Figure 11-19 CO2 Cost Impact on Islands Using Only Distillate ........................................... 11-22 Figure 11-20 CO2 Cost Impact on Islands with Coal on Fossil LCL ...................................... 11-23 Figure 11-21 CO2 Cost Impact on Islands with Gas on Fossil LCL ....................................... 11-25 Figure 11-22 CO2 Cost Impact on Country with Lowest Non-gas Fuel Prices ...................... 11-26

Contents
Caribbean Regional Electricity Generation, Interconnection, and Fuels Supply Strategy – Final Report viii
Acronyms and Abbreviations
ABS American Bureau of Shipping AC Alternating current ADO Automotive diesel oil APC Antigua Power Company APUA Antigua Public Utility Authority ASME American Society of Mechanical Engineers Aus Australia BL&P Barbados Light and Power BPD Barrels per day CC, CCGT Combined cycle gas turbine CFB Circulating fluidized bed CHP Combined heat and power CLFR Compact linear Fresnel reflector CNG Compressed natural gas CO Carbon monoxide CO2 Carbon dioxide Cogen Cogeneration CSP Concentrating solar power CT Combustion turbine DC Direct current DNV Det Norske Veritas DOMLEC Dominica Electricity Services Limited DR Dominican Republic ECGP Eastern Caribbean Gas Pipeline ECGPC Eastern Caribbean Gas Pipeline Company EDF, EdF Electricite de France EDH, EdH Electricite d'Haiti EGS Engineered geothermal systems EHV Extra high voltage EIA Energy Information Administration EIR Environmental impact report EPR Ethylene-propylene- rubber EPRI Electric Power Research Institute ESMAP Energy Sector Management Assistance Program ESP Electrostatic precipitator FGD Flue gas desulfurization Fin Finland FSRU Floating Storage and Re-gasification Units Ger Germany GJ Gigajoule GP Gas pipeline GRENLEC Grenada Energy Services Ltd. GT Gas turbine
Contents
Caribbean Regional Electricity Generation, Interconnection, and Fuels Supply Strategy – Final Report ix
GWH, GWh Gigawatt-hour HDR Hot dry rocks HFO Heavy fuel oil HHV Higher heating value HPFF High pressure fluid filled HRSG Heat recovery steam generator HTF Heat transport fluid HV High voltage Hz Hertz (cycles per second) IBRD International Bank for Reconstruction and Development IC Internal combustion ICGPL Intra Caribbean Gas Pipeline Limited IDA International Development Association ISO International Organization for Standardization JPS Jamaica Public Service kcmil Thousand circular mils kg Kilogram kJ Kilojoule km Kilometer kV Kilovolt kW Kilowatt kWh Kilowatt-hour LCL Least cost line LFG Landfill gas LHV Lower heating value LNG Liquefied natural gas LSD Low speed diesel LUCELEC St. Lucia Electricity Services Ltd. m Meter MEM Ministry of Energy and Mining (Jamaica) MI Mass-impregnated MI-IRC MI cable with and integral return conductor MMBTU Million British Thermal Units MMscf Million standard cubic feet MMscfd Million standard cubic feet per day mm2 Square millimeters MOU Memorandum of understanding MPa Megapascal (1 MPa = pressure about equal to 145 pounds/square
inch) mph Miles per hour MSD Medium speed diesel Mt Metric ton Muni Municipal MVA Megavolt-ampere MW Megawatt MWe Megawatts electric

Contents
Caribbean Regional Electricity Generation, Interconnection, and Fuels Supply Strategy – Final Report x
MWt Megawatts thermal NGC National Gas Company of Trinidad & Tobago NL Netherlands Nor Norway NOx Nitrogen oxide (NO or NO2) NPV Net present value NREL National Renewable Energy Laboratory O&M Operations and maintenance PC Pulverized coal PV Photovoltaic ROC Republic of China ROV Remotely operated vehicle SCFF Self-contained, fluid-filled SCGT Simple cycle gas turbine SCR Selective catalytic reduction SEGS Solar electric generating system SNCR Selective non-catalytic reduction SOx Sulfur dioxide and sulfur trioxide SSD Slow speed diesel Swe Sweden TES Thermal energy storage TOR Terms of Reference UK United Kingdom USA United States of America US DOE United States Department of Energy USVI United States Virgin Islands V Volt VINLEC St. Vincent Electricity Service Ltd. VSC Voltage source control W Watt WIPC West Indies Power Company XLP Special cross-linked polymeric insulated DC cables XLPE Cross-linked polyethylene 3/c XLPE 3-core XLPE cable (i.e., each of the three phases is in one of three
separate conductors within a common armor) yr Year

Caribbean Regional Electricity Generation, Interconnection, and Fuels Supply Strategy – Final Report 1-1
Section 1 Executive Summary
1.1 INTRODUCTION
The objective of this Caribbean Regional Electricity Generation, Interconnection, and Fuels Supply Strategy (the Study) is to analyze the availability of technically and financially sound regional and sub-regional energy solutions for power generation rather than specific energy solutions for each Caribbean country.
The energy solutions involve new fuels or fuel transport modes (pipeline gas, CNG, LNG, coal), new energy resources for power generation (primarily wind and geothermal), and new electrical interconnections among islands, none of which are presently interconnected. The immediate goal of studying these areas was to reduce the Caribbean islands’ dependence on high price imported distillate and HFO. A related goal was that solutions would emerge that reduced costs, reduced environmental impacts, and increased the integration of the Caribbean islands. The entire Caribbean region is presented on Figure 1-1.
We note at the outset that we have identified no truly regional energy solutions, not even one covering the nine countries of primary emphasis mentioned in the second paragraph below. We have identified and analyzed, to varying degrees of detail, 11 submarine cable electrical interconnections between two countries and one land-based interconnection. Some of these two-country sub-regional interconnections are part of larger schemes involving three or more countries. The only sub-regional fuel project the Study evaluated was the five-country Eastern Caribbean Gas Pipeline (ECGP). Schemes involving LNG or CNG implicitly or explicitly rely on some common facilities when more than one country is a user, but in that sense they are not different from the current delivery modes for distillate and heavy fuel oil (HFO) and were analyzed on a country-by-country basis.
It is interesting that the goal of reducing dependence on high price imported oil products and the goal of reducing environmental impacts and increasing the integration of the region turned out to be complementary. The most direct benefit of an interconnection comes when one country has a source of low cost power and its neighbor does not. The three lowest cost resources for operation at capacity factors above about 30% are renewables: geothermal, wind (including the cost of backup generation), and small hydro. This assumes that high quality sites can be identified and acquired. Geothermal is the source of generation and drives the benefits for many of the interconnections. Thus geothermal on a local and sub-regional basis, and wind on a local basis, provide a path toward a less oil-dependent, lower cost, lower environmental impact, more sustainable future.
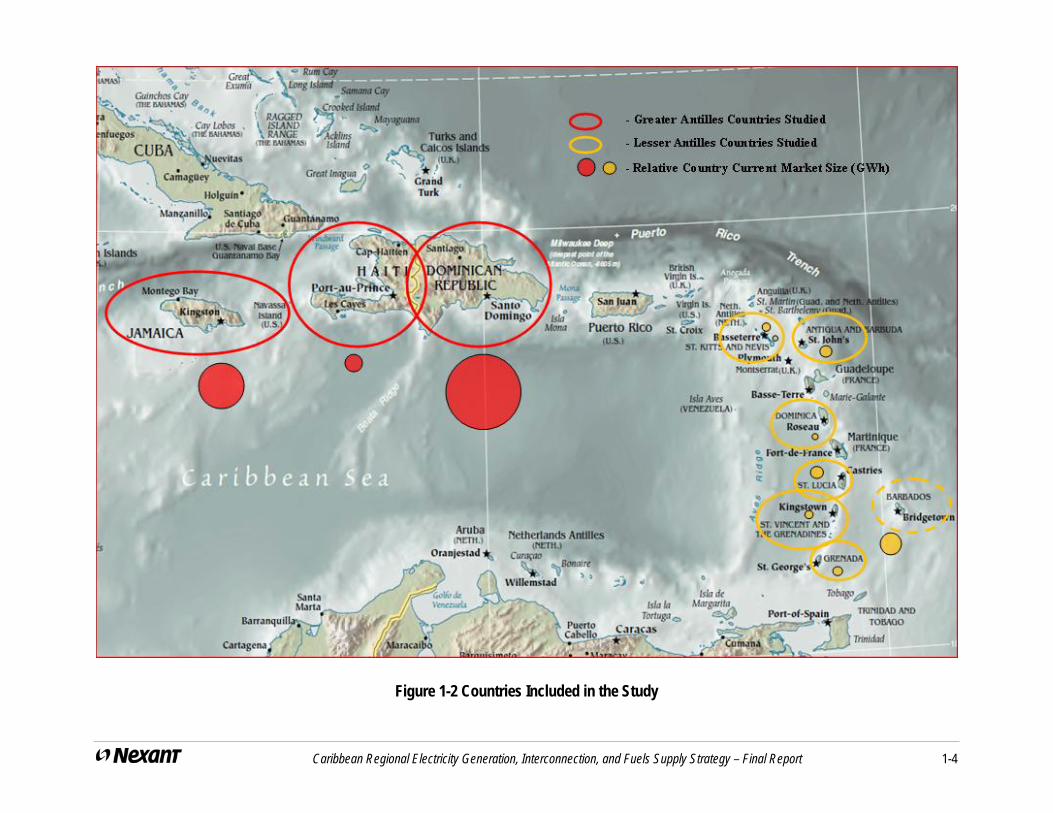
The primary emphasis of the Study is on the nine countries in the Caribbean eligible for support from the International Development Association (IDA) and/or the International Bank for Reconstruction and Development (IBRD). Those countries are presented, together with their relative electricity market share, on Figure 1-2. These nine include:

Caribbean Regional Electricity Generation, Interconnection, and Fuels Supply Strategy – Final Report 1-2
Six small countries in the Lesser Antilles: St. Lucia, St. Vincent and the Grenadines, Grenada, Antigua and Barbuda, St. Kitts and Nevis, and Dominica, total combined population about 600,000
Three countries located on two of the four islands in the Greater Antilles: Haiti and the Dominican Republic, both on the island Hispaniola, and Jamaica, total population about 22,000,000
The Study also considered other relevant countries, presented on Figure 1-3, that might be part of a regional energy solution. In addition to the nine countries mentioned above, we visited or obtained significant data on Barbados1, Trinidad and Tobago, and Martinique; somewhat less on Guadeloupe; and cursory information on Puerto Rico, Sint Maarten, and Cuba. We also obtained cursory information on power generation in Florida.
1 Barbados was addressed in more details as par of the Eastern Caribbean Gas Pipeline project analysis.

Caribbean Regional Electricity Generation, Interconnection, and Fuels Supply Strategy – Final Report 1-3
Figure 1-1 Caribbean Regional Map
Caribbean Regional Electricity Generation, Interconnection, and Fuels Supply Strategy – Final Report 1-4
Figure 1-2 Countries Included in the Study

Caribbean Regional Electricity Generation, Interconnection, and Fuels Supply Strategy – Final Report 1-5
Figure 1-3 Other Relevant Countries Addressed in the Study

Caribbean Regional Electricity Generation, Interconnection, and Fuels Supply Strategy – Final Report 1-6
1.2 APPROACH
Our approach included the following main steps:
Collect the foundation data needed to conduct the work
Prepare a peak and energy demand forecast for each country and the Study countries as a whole
Forecast fuel costs for all fuels used, including pipeline gas, LNG, CNG, and coal
Estimate fuel transportation costs for each fuel to each country and determine effective fuel price
Determine the performance and cost parameters of all existing power generation units
Determine the performance and cost parameters of power generation units suitable for meeting future demand
Evaluate the cost and performance parameters for power generation from renewable energy, and estimate the availability of renewable energy resources
Evaluate submarine cable technology
Identify and evaluate submarine cable and land-based transmission interconnections
Develop scenarios that include a range of approaches to regional power generation, and combine the most attractive components in an proposed scenario
Report on and present the results (such as in this report)
1.3 LOAD FORECAST
Tables 1-1 and 1-2 provides peak and energy demand forecasts for each country / island and for the region as a whole.

Caribbean Regional Electricity Generation, Interconnection, and Fuels Supply Strategy – Interim Report 1-7
Table 1-1 Net Peak Demand Load Forecast (MW)
YearAntigua
and Barbuda
Barbados DominicaDominican Republic
Grenada Haiti Jamaica St. Kitts Nevis St. LuciaSt. Vincent
and Grenadines
Martinique Guadeloupe Total
2009 54 170 15 2,353 31 226 680 29 10 56 27 242 250 4,142
2010 57 176 15 2,447 33 237 707 30 10 58 28 247 256 4,302
2011 60 182 16 2,544 34 249 736 31 11 61 30 255 263 4,472
2012 63 188 16 2,640 36 261 767 32 11 63 32 263 269 4,643
2013 65 195 17 2,727 38 274 799 33 12 65 35 272 276 4,808
2014 67 201 17 2,803 40 288 832 35 13 68 37 281 284 4,965
2015 69 208 18 2,896 42 303 867 36 13 70 40 290 291 5,143
2016 71 216 18 2,992 45 318 904 37 14 73 42 297 298 5,324
2017 73 223 19 3,091 47 334 943 38 15 76 45 303 305 5,512
2018 75 231 19 3,194 50 350 983 40 16 79 48 310 313 5,708
2019 77 239 20 3,300 52 368 1,026 41 17 82 52 317 321 5,911
2020 80 247 20 3,409 55 386 1,071 43 18 85 55 324 329 6,121
2021 82 256 21 3,522 58 405 1,116 44 19 88 59 331 337 6,339
2022 85 265 21 3,638 61 426 1,165 46 20 91 63 339 346 6,565
2023 87 274 22 3,758 64 447 1,214 47 21 95 68 346 354 6,798
2024 90 284 22 3,882 68 469 1,267 49 23 98 72 354 363 7,041
2025 92 294 23 4,010 72 493 1,322 51 24 102 77 362 372 7,293
2026 95 304 24 4,143 75 517 1,379 52 25 106 83 370 381 7,555
2027 98 314 24 4,280 80 543 1,439 54 27 110 88 378 391 7,827
2028 101 325 25 4,421 84 570 1,502 56 29 114 94 387 400 8,109
Growth Rate
3.3% 3.5% 2.7% 3.4% 5.4% 5.0% 4.3% 3.5% 5.9% 3.8% 6.9% 2.5% 2.5% 3.6%

Caribbean Regional Electricity Generation, Interconnection, and Fuels Supply Strategy – Interim Report 1-8
Table 1-2 Net Generation Forecast (GWh)
YearAntigua
and Barbuda
Barbados DominicaDominican Republic
Grenada Haiti Jamaica St. Kitts Nevis St. LuciaSt. Vincent
and Grenadines
Martinique Guadeloupe Total
2009 318 1,039 87 12,638 198 660 4,490 161 60 345 156 1,575 1,663 23,391
2010 315 1,073 89 13,142 209 726 4,674 166 67 356 167 1,620 1,720 24,322
2011 312 1,107 91 13,663 220 799 4,865 171 74 367 178 1,672 1,775 25,295
2012 410 1,143 94 14,179 232 878 5,066 175 82 378 191 1,727 1,832 26,387
2013 422 1,180 96 14,646 244 966 5,277 180 86 390 204 1,783 1,888 27,363
2014 434 1,218 99 15,054 257 1,063 5,494 186 90 402 218 1,840 1,947 28,303
2015 447 1,258 101 15,554 270 1,169 5,726 191 94 415 233 1,900 2,003 29,362
2016 461 1,298 104 16,070 285 1,286 5,974 196 99 428 249 1,938 2,060 30,448
2017 475 1,340 106 16,601 300 1,415 6,232 202 103 442 266 1,978 2,117 31,576
2018 489 1,384 109 17,154 316 1,556 6,497 208 107 455 284 2,018 2,174 32,751
2019 503 1,428 112 17,724 333 1,712 6,777 214 111 470 304 2,058 2,233 33,979
2020 519 1,475 114 18,309 350 1,883 7,073 220 115 484 325 2,100 2,284 35,252
2021 534 1,522 117 18,914 369 1,977 7,376 226 119 500 348 2,142 2,337 36,483
2022 550 1,572 120 19,539 389 2,076 7,696 233 124 515 372 2,186 2,390 37,761
2023 567 1,622 123 20,184 409 2,180 8,024 239 129 531 397 2,230 2,445 39,082
2024 583 1,675 126 20,851 431 2,289 8,370 246 134 548 425 2,275 2,501 40,454
2025 600 1,729 129 21,539 454 2,403 8,734 253 139 565 454 2,321 2,559 41,881
2026 618 1,785 133 22,251 478 2,523 9,114 261 145 583 485 2,368 2,618 43,361
2027 636 1,843 136 22,986 504 2,650 9,510 268 150 601 519 2,416 2,679 44,897
2028 654 1,902 139 23,745 530 2,782 9,924 276 156 620 555 2,465 2,741 46,490
Growth Rate
3.9% 3.2% 2.5% 3.4% 5.3% 7.9% 4.3% 2.9% 5.2% 3.1% 6.9% 2.4% 2.7% 3.7%

Caribbean Regional Electricity Generation, Interconnection, and Fuels Supply Strategy – Final Report 1-9
1.4 FUEL SUPPLY
The forecast levelized price of distillate over 2014-2028, the assumed study period for the new projects being considered, is US$22.45/GJ. Each country except Dominica has at least one lower cost fuel option, and many countries have more than one. Table 1-3 provides the comparative prices. Distillate, LNG, and pipeline gas can be compared directly because they can fuel the same generators. Coal fuels generators with higher capital costs and higher heat rates, which must be taken into account in comparing fuel options. The prices of all fuels except distillate vary from country to country because they include transportation costs that vary.
Table 1-3 Fuel Prices Based on Yearly Demand 2014-2028
Country
Fuels Selected in Addition to Coal and
Distillate
Levelized Fuel Price, US$/GJ Fuel
Selected Coal Distillate Antigua and Barbuda None N/A 12.31 22.45 Barbados Pipeline Gas 7.39 7.77 22.45 Dominica Distillate only N/A N/A 22.45 Dominican Republic LNG 8.73 4.19 22.45 Grenada None N/A 12.31 22.45 Guadeloupe Pipeline Gas 10.88 7.77 22.45 Haiti LNG 12.73 7.77 22.45 Jamaica LNG 10.16 4.85 22.45 Jamaica North LNG 10.90 4.85 22.45 Martinique Pipeline Gas 8.99 7.77 22.45 St. Kitts and Nevis None N/A 12.31 22.45 St. Lucia Pipeline Gas 10.49 9.04 22.45 St. Vincent and Grenadines
None N/A 12.31 22.45
Coal is an optional fuel for every country except Dominica, where preliminary analysis showed it to be more costly than distillate on a US$/GJ basis.
Table 1-3 shows the following:
Every country except Dominica has at least one fuel option lower in price than distillate
Pipeline gas is the lowest cost natural gas option for every country reached by the ECGP: Barbados, Martinique, St. Lucia, and Guadeloupe
Coal is the only optional fuel for Antigua and Barbuda, Grenada, St. Kitts and Nevis, and St. Vincent and Grenadines
LNG is the lowest cost natural gas option for Dominican Republic, Haiti, Jamaica, and Jamaica North

Caribbean Regional Electricity Generation, Interconnection, and Fuels Supply Strategy – Final Report 1-10
CNG was considered and was the lowest cost gas option for several countries, but for those countries was always higher in cost than distillate and therefore does not appear in Table 15-1. It was considerably lower than distillate for some countries, but was more costly than LNG in those countries.
Though not studied in the same detail as the other fuel options, mid-scale LNG may provide an economically attractive option for some countries.
1.5 PROJECT AND TECHNOLOGY ANALYSIS
Screening analysis is an approach to comparing the costs of different technologies to determine the least cost technology across the range of annual capacity factors:
Uses simplified representations of generation costs to help identify least cost generating technologies
Plots annual cost in $/kW-year vs. capacity factor for a set of power plant and/or fuel options
The cost in $/kW-yr can also be easily expressed in cents/kWh, which are also of interest but are curved and somewhat harder to interpret than the straight lines in $/kW-yr
Annual cost is sum of:
Annualized investment-related costs based on initial capital investment, discount rate, and plant lifetime
Fixed annual operation and maintenance (O&M)
Variable cost (includes fuel cost and variable O&M costs) per kWh times capacity factor times hours per year
Selects lowest cost resources at each capacity factor, producing the “least-cost line” for that set of resources
1.5.1 Isolated Countries / Islands
Figure 1-4 illustrates the screening analysis approach. It presents the Fossil Least Cost Line (Fossil LCL) that applies for the Dominican Republic. The word “Fossil” means that only fossil fueled generation is included in determining the LCL. The scale in $/kW-yr for the solid lines is on the left, the scale in cents/kWh for the dotted lines is on the right. The Fossil LCL comprises 50 MW GT on LNG for capacity factors of zero through 20%, the 300 MW CC on LNG for capacity factors from 25% through 40%, and the conventional coal plant for capacity factors from 45% through 90%. In other words, the generation expansion plan based on this analysis would include gas turbines for peaking duty, combined cycles for mid-range duty, and conventional coal for base load duty.
In order to achieve the Fossil LCL the Dominican Republic would have to undertake large capital investments for expansion related to coal and LNG transportation, and for coal plants themselves. This may pose a challenge, even if the desire to do so exists. LNG is preferable for application at lower capacity factors, coal for application at higher capacity factors. The scenario analysis provides more information on which is preferable overall, if doing both is not feasible.

Caribbean Regional Electricity Generation, Interconnection, and Fuels Supply Strategy – Final Report 1-11
Figure 1-5 expands upon Figure 1-4 by adding wind, small hydro, and fossil options to the graph of Figure 1-1. The small hydro line coincidentally overlaps with the wind with backup line at capacity factors from 30% to 40%. Wind with backup, which is typically a better comparison than wind without backup, is now marginally economic at the capacity factors where it might operate at a good site. Wind with backup simply adds the full cost of operation of a 50 MW gas turbine at 5% capacity factor to the costs of wind without backup, which also adds 5% to the capacity factor.
Figure 1-5 also illustrates what might occur if neither coal nor LNG is available for future generation for the Dominican Republic. The periwinkle line represents the cost of a 300 MW HFO-fueled steam plant. Without expanded supplies of LNG or coal, costs will more than triple at high capacity factors.
Dominican Republic has under construction or planned considerable new small hydro and wind generation. Figure 1-5 illustrates the desirability of such an approach where good sites can be identified.
0
500
1,000
1,500
2,000
2,500
0% 10% 20% 30% 40% 50% 60% 70% 80% 90%
Capacity Factor, %
An
nu
al C
ost
, $/k
W-y
ear
0
10
20
30
40
50
60
70
80
Co
st, U
S c
en
ts/k
Wh
Fossil Least Cost Line, US/kW-yr50 MW GT LNG US$/kW-yr300 MW CC LNG US$/kW-yr300 MW Conv Coal, US$/kW-yrFossil LCL, US cents/kWh
Figure 1-4 Fossil LCL for Dominican Republic

Caribbean Regional Electricity Generation, Interconnection, and Fuels Supply Strategy – Final Report 1-12
0
500
1,000
1,500
2,000
2,500
0% 10% 20% 30% 40% 50% 60% 70% 80% 90%
Capacity Factor, %
An
nu
al C
ost
, $/
kW-y
ear
0
10
20
30
40
50
60
70
80
Co
st, U
S c
en
ts/k
Wh
Fossil Least Cost Line, US/kW-yr1.5 MW Wind US$/kW-yr1.5 MW Wind w/Backup US$/kW-yr300 MW ST HFO DR US$/kW-yrSmall Hydro US$/kW-yrFossil LCL, US cents/kWh
Figure 1-5 Other Options for Dominican Republic
The bullets below summarize the least cost technology/fossil fuel combination by country as determined by screening analysis. This considers the countries and islands as isolated systems. For some countries, imports via submarine cable (to be discussed later) provide a lower cost solution. We eliminated the technology/fuel combinations that were least cost at only one annual capacity factor, such as zero or 90%. Scenario analysis generally supports these conclusions, though multiple fuels were not used as much.
Individual Countries
Antigua and Barbuda, Grenada, and St. Vincent and Grenadines: 10 MW MSD on distillate for peaking and mid-range duty, and the coal-fueled CFB for base load duty
Coal-fueled CFB is only marginally more economic than distillate fueled medium speed diesels (MSD) plants; CO2 costs of US$50/tonne would make the distillate-fueled units more economic than the coal-fueled units
Dominica, St. Kitts, and Nevis: 5 MW MSD on distillate for peaking, mid-range, and base load duty
St. Kitts and Nevis are fortunate that a geothermal resource sufficient to serve all their demand has been confirmed and is in the process of development. For Dominica it seems highly probable that a geothermal resource sufficient to serve at least local demand will be confirmed and developed. None of these islands may not need to install any new distillate-fueled generation.
Dominican Republic: 50 MW GT on LNG for peaking duty, 300 MW CC on LNG for mid-range duty, and 300 MW conventional coal plant for base load duty
Caribbean Regional Electricity Generation, Interconnection, and Fuels Supply Strategy – Final Report 1-13
The Dominican Republic already has an LNG terminal and coal-fueled power plants. Scenario analysis shows that coal is preferred if only one fuel can be selected for future additions. However, incorporating CO2 costs in the analysis would compromise coal’s advantage. With the Dominican Republic’s large demand, expanding the use of both fuels may be feasible, even if new facilities are needed.
Haiti: 20 MW LSD on LNG for peaking, mid-range, and base load duty.
LNG provides very large benefits but requires significant up-front capital expenditures
Jamaica and Jamaica North: 50 MW GT on LNG for peaking duty, 20 MW LSD on LNG for mid-range duty, and 50 MW coal-fueled CFB base load duty
Today Jamaica and Jamaica North have neither fuel. It seems unlikely that they would want to develop both fuels. If only one is to be developed, LNG is preferred, and its advantage would increase if CO2 costs are incorporated in the analysis.
We emphasize that for some countries, imports via submarine cable provide a lower cost solution. This is addressed in the next subsection.
Sub-regional Gas Market
The ECGP links the markets of the four countries and provides the benefits of economies of scale compared to individual development.
Barbados, Guadeloupe, Martinique, and St. Lucia: 20 MW GT on pipeline gas for peaking duty and 20 MW LSD on pipeline gas for mid-range and base load duty
For all four countries the pipeline gas is less than half as costly as distillate. For all but St. Lucia, LNG is more costly than pipeline gas but significantly less costly than distillate.
The low gas price reduces the benefits of renewables and for Martinique and Guadeloupe makes importing geothermal power from Dominica via submarine cable marginal.
Figure 1-6 illustrates the ECGP gas connections among the countries.

Caribbean Regional Electricity Generation, Interconnection, and Fuels Supply Strategy – Final Report 1-14
Figure 1-6 Eastern Caribbean Gas Pipeline (ECGP) Proposed Route
1.5.2 Sub-regional Electricity Markets
The first three bullets below show the interconnections studied with greatest emphasis. All the interconnections were submarine cables except the Dominican Republic – Haiti link noted in the bottom bullet. The interconnections are presented in Figures 1-7 to 1-13. For each interconnection we note its capacity in MW, length in km, cost per kW for interconnection and related facilities only, source of export power, and economic attractiveness.

Caribbean Regional Electricity Generation, Interconnection, and Fuels Supply Strategy – Final Report 1-15
Nevis – St. Kitts, 50 MW submarine cable capacity, 5 km submarine cable length, US$328/kW (interconnection and related facilities only), geothermal power export, highly economic
Dominica – Martinique, 100 MW, 70 km, US$588/kW (interconnection and related facilities only), geothermal power export, marginally economic if displaced fuel is gas from ECGP, more economic if displaced fuel is higher cost
Dominica – Guadeloupe, 100 MW, 70 km, US$588/kW (interconnection and related facilities only), geothermal power export, moderately economic if displaced fuel is gas from ECGP, more economic if displaced fuel is higher cost
Nevis – Puerto Rico, 400 MW, 400 km, US$1,791/kW (interconnection and related facilities only), geothermal power export, highly economic if displaced fuel is HFO, not economic if displaced fuel is LNG
Nevis – US Virgin Islands, 80 MVA, 320 km, US$3,541/kW (interconnection and related facilities only), geothermal power export, only marginally economic even though the displaced fuel is distillate
Saba – St. Maarten, 100 MW, 60 km, US$528/kW (interconnection and related facilities only), geothermal power export, highly economic if displaced fuel is distillate and St. Maarten can accept 100 MW
United States (Florida) – Cuba, 400 MW, 400 km, US$1,791/kW (interconnection and related facilities only), export from coal-fueled steam plant or gas-fueled combined cycle, highly economic if displaced fuel is HFO
Dominican Republic – Haiti, 250 MW, 563 km, US$1,899/kW (interconnection and related facilities only), land interconnection, export from HFO fueled steam plant, not economic unless export is from lower cost unit/fuel combination
We also developed basic data and cost estimates for four potential interconnections that might form part of a “Northern Ring”, a conceptual set of interconnections in the northern Caribbean, potentially linking Florida – Cuba – Haiti – Dominican Republic – Puerto Rico – Nevis, or some subset of those areas. The Northern Ring interconnections not covered above include:
Puerto Rico – Dominican Republic, 400 MW, 150 km, US$705/kW (interconnection and related facilities only)
Haiti – Cuba, 400 MW, 200 km, US$705/kW (interconnection and related facilities only)
Haiti – Jamaica, 400 MW, 250 km, US$998/kW (interconnection and related facilities only)
Florida – Haiti, 400 MW, 1,100 km, US$3,488/kW (interconnection and related facilities only
We did not conduct economic analysis on these four interconnections. The cost per kW for the three shorter interconnections is in what might be an economically viable range if the sending country had low power costs and the importing country’s displaced fuel was distillate, HFO, or crude. The Florida – Haiti interconnection appears to be outside that range. Costs for the middle

Caribbean Regional Electricity Generation, Interconnection, and Fuels Supply Strategy – Final Report 1-16
islands would involve their sharing some of the costs of interconnections closer to the low-cost source, making favorable economics more difficult to achieve.
Figure 1-7 Dominica Interconnections

Caribbean Regional Electricity Generation, Interconnection, and Fuels Supply Strategy – Final Report 1-17
Figure 1-8 Nevis – Puerto Rico and Nevis – US Virgin Islands Interconnections

Caribbean Regional Electricity Generation, Interconnection, and Fuels Supply Strategy – Final Report 1-18
Figure 1-9 Saba – St. Maarten Interconnection

Caribbean Regional Electricity Generation, Interconnection, and Fuels Supply Strategy – Final Report 1-19
Figure 1-10 Haiti – Dominican Republic Interconnection

Caribbean Regional Electricity Generation, Interconnection, and Fuels Supply Strategy – Final Report 1-20
Figure 1-11 United States (Florida) – Cuba Interconnection

Caribbean Regional Electricity Generation, Interconnection, and Fuels Supply Strategy – Final Report 1-21
Figure 1-12 Northern Ring Set of Interconnections

Caribbean Regional Electricity Generation, Interconnection, and Fuels Supply Strategy – Final Report 1-22
Figure 1-13 Northern Ring Interconnections Alternative
Caribbean Regional Electricity Generation, Interconnection, and Fuels Supply Strategy – Final Report 1-23
1.5.3 Renewable Energy
Wind, geothermal, small hydro, and biomass technology/fuel combinations have the potential, at a good site, to be considerably less costly than distillate fueled power generation. The three lowest cost resources for operation at capacity factors above about 30% are renewables: geothermal, wind (including the cost of backup generation), and small hydro. This assumes that high quality sites can be identified and acquired. Solar PV and solar trough CSP are not competitive for bulk power generation. There are many small solar PV installations in Martinique due to subsidies, and solar PV is competitive for off-grid locations. If a lower cost fuel such as pipeline gas were the competitive fuel, the advantage of the renewable technology would be less.
Figure 1-14 compares renewable technologies to the Distillate LCL that results when distillate is the only fuel available. The scale in $/kW-yr for the solid lines is on the left, the scale in cents/kWh for the dotted lines is on the right. The Distillate LCL, in blue, represents the benefit of a renewable energy option. Its generation would displace generation at a cost along that line. Where a renewable energy option’s line is below the blue line, there is a net benefit. It reduces costs elsewhere that are more than its own costs. Where it is above the blue line, it represents a net cost.
Most of the renewable technologies are shown at a range of capacity factors they might reasonably achieve at a good site. Geothermal is also based on a good site, and is shown over the entire capacity factor range because it is not limited by resource availability once the resource has been defined. Wind with backup simply adds the full cost of operation of a 20 MW LSD at 5% capacity factor to the costs of wind without backup, which also adds 5% to the capacity factor. Biomass costs assume that biomass costs the same as export coal in the US.
Figure 1-14 shows that all but two of the renewable energy technologies have the potential, at a good site, to be considerably less costly than distillate fueled power generation. Solar PV and solar trough with six hour storage are above the Distillate LCL. If a lower cost fuel such as pipeline gas were the competitive fuel, the advantage of the renewable technology would be less and might disappear.
Figure 1-15 compares renewable technologies to the Fossil LCL for Barbados, which has the lowest cost gas fuel of any of the countries studied. The renewable technologies offer much smaller net benefits, small hydro and wind with storage are marginally economic, biomass is not economic, and the technologies that were not economic before are less competitive.

Caribbean Regional Electricity Generation, Interconnection, and Fuels Supply Strategy – Final Report 1-24
0
500
1,000
1,500
2,000
2,500
0% 10% 20% 30% 40% 50% 60% 70% 80% 90%
Capacity Factor, %
An
nu
al C
ost,
$/k
W-y
ear
0
10
20
30
40
50
60
70
80
Co
st, U
S c
ents
/kW
h
Distillate LCL, US$/kW-yr1.5 MW Wind Turbine1.5 MW Wind w/BackupCommercial PV 500 kW20 MW GeothermalSmall HydroBiomassSolar Trough 6 hr StorageDistillate LCL, US cents/kWh
Figure 1-14 Distillate LCL vs. Renewable Energy Options
0
500
1,000
1,500
2,000
0% 10% 20% 30% 40% 50% 60% 70% 80% 90%
Capacity Factor, %
An
nu
al C
ost
, $/k
W-y
ear
0
10
20
30
40
50
60
Co
st,
US
ce
nts
/kW
h
Fossil Least Cost Line, US/kW-yr1.5 MW Wind Turbine1.5 MW Wind w/BackupSolar Trough 6 hr StorageSeries6Commercial PV 500 kW20 MW GeothermalSmall HydroBiomassFossil LCL, US cents/kWh
Figure 1-15 Barbados LCL vs. Renewable Energy Options

Caribbean Regional Electricity Generation, Interconnection, and Fuels Supply Strategy – Final Report 1-25
1.5.4 CO2 Costs
If a tax or similar levy were attributed to each tonne of CO2 emissions, the cost of using fuels would increase. This would open wider the economic window for technologies that produce lower or no CO2 emissions. However, all the countries today primary fuel is distillate and/or HFO, so the window is already quite wide. We investigated the impact if a cost of US$50/tonne were attributed to CO2 emissions.
At US$50/tonne, the effective price of fuels would increase in a range from US$2.52 for distillate to US$4.41 for coal, representing increases ranging from 15% for distillate to 91% for the lowest cost coal for the Study islands.
In the bullets below we measure the impact of CO2 costs by how technology choices change when it is applied.
Countries with small demand: The fuel prices are high even when coal fuels some of the least-cost generation.
For Antigua and Barbuda, Grenada, and St. Vincent and Grenadines, the preferred fuel would switch from coal to distillate.
The renewable energy resources that were economic before are now somewhat more economic, and those that were not economic edge closer to being competitive.
Countries with medium or high demand. The fuels are much less expensive than distillate and therefore the displaced generation is lower in cost, narrowing the economic window for alternatives.
For the Dominican Republic, Jamaica, and Jamaica North, incorporating CO2 costs in the analysis would probably eliminate coal’s advantage over LNG or increase LNG’s advantage over coal.
With no CO2 cost the renewables that were economic for the islands with small demand are still economic, though in some cases only marginally so. Incorporating CO2 costs makes renewables more competitive.
1.6 REGIONAL STRATEGIES
For all Study countries combined, costs including fuel savings from exports and interconnection costs were:
US$31,985 million for the Base Case Scenario
US$29,424 million for the Fuel Scenario
US$29,415 million for the Interconnection/Renewable Scenario
US$27,619 million for the Integrated Scenario
Table 1-4 presents cost differences among Scenarios by system as well as differences in Scenario total costs. The Fuel Scenario and Interconnection/Renewable Scenarios both reduce costs by about US$2.5 billion compared to the Base Case. The Integrated Scenario reduces costs by

Caribbean Regional Electricity Generation, Interconnection, and Fuels Supply Strategy – Final Report 1-26
about US$ 4.3 billion, showing that the Integrated Scenario captures most of the individual benefits of each of the other two Scenarios.
Table 1-4 Scenario NPV Cost Differences - Base Case Minus Other Scenario Costs (million US$)
Fuel Scenario
Interconnection/ Renewable Scenario
IntegratedScenario
Antigua and Barbuda 12 20 31
Barbados 906 39 912
Dominica 0 604 10
Dominican Republic 444 350 721
Grenada 32 17 45
Haiti 433 76 476
Jamaica 500 138 628
St. Kitts 0 159 159
Nevis 0 1,135 1,135
St. Lucia 216 18 221
St. Vincent and Grenadines 18 14 29
Total 2,561 2,570 4,365
The costs of the interconnections and the fuel savings from the exports of geothermal power are attributed to Dominica and Nevis. All numbers in Table 15-2 have positive values (except for zeros for Dominica, St. Kitts, and Nevis for the Fuel Scenario), meaning that each Scenario and each country in each Scenario provides cost savings compared to the Base Case.
1.7 COUNTRY SUMMARIES
Each country summary below presents paragraphs on:
Overview
Current and Forecast Load
Fossil Fuel Options
Renewable Generation Potential
Development Scenarios (development plans for the Base Case Scenario, the Fuel Scenario, the Interconnection/Renewable Scenario, and the Integrations Scenario)
Discussion of Country Results
1.7.1 Antigua and Barbuda
Overview: Antigua Public Utility Authority (APUA) is responsible for the power generation, transmission, and distribution of electricity in Antigua and Barbuda. APUA purchases most of the power from Antigua Power Company (APC), a private company. Antigua and Barbuda

Caribbean Regional Electricity Generation, Interconnection, and Fuels Supply Strategy – Final Report 1-27
currently rely exclusively on diesel for power generation. Efforts are underway to convert some of the diesel engines to HFO as an alternate fuel.
Current and Forecast Load: The country’s 2009 peak demand is just over 50 MW, with net generation of over 300 GWh. By 2028 peak demand is projected to increase to around 100 MW, with net generation increasing to around 650 GWh (increase rate of 3.9% per year). Losses in the transmission and distribution system are projected to decrease from over 30% in 2009 to around 10% by 2028.
Fossil Fuel Options: Imported coal was considered as an alternative fuel. Due to the location and electricity demand on the island, the Study did not find natural gas to be an economically viable fuel option.
Renewable Generation Potential: Wind is the most promising renewable resource for Antigua and Barbuda. A 2008 Energy Engineering Corp. report indicated that up to 400 MW of wind power can be developed on the islands, primarily on Barbuda. Solar PV potential is estimated at 27 MW of installed capacity, but bulk power development would not be economic based on current estimates.
Development Scenarios: All four Study Scenarios assumed that the committed system additions of the Casada Gardens units will be installed during 2011-2013. With those unit additions, system reserve margin requirements would be satisfied until 2019. During 2020-2028 the system demand growth will require building additional generation units.
For the Base Case Scenario, new unit additions are assumed to be 10 MW medium speed diesel units using distillate oil. By 2028 the system will need another 30 MW (3 x 10 MW units) to meet the required capacity.
For the Fuel Scenario, coal-fueled circulating fluidized bed (CFB) plants are marginally more economic than distillate fueled medium speed diesels (MSD) plants; new unit additions are assumed to be 10 MW CFB units using imported coal. CO2 costs of US$50/tonne would make the distillate-fueled units more economic than the coal-fueled units. Conventional (large-scale) LNG is more costly than either (distillate or coal) option. Though not studied in the same detail as the other fuel options, mid-scale LNG may provide an economically attractive option. By 2028 the system will need another 30 MW (3 x 10 MW units) to meet the required capacity. The Fuel Scenario results show that the introduction of coal provides net present worth savings of US$12 million compared to the Base Case Scenario.
The Interconnection/Renewable Scenario assumed development of new diesel units as in the Base Case Scenario, with the addition of 14 MW of new wind units. This assumes that sites with good winds and low development costs can be identified and acquired. There is no electrical interconnection. The Interconnection/Renewable Scenario results show that the introduction of wind generation provides net present worth savings of US$20 million compared to the Base Case Scenario.
The Integrated Scenario assumed new generation units are 10 MW CFB units, as in the Fuel Scenario, and the addition of 14 MW of new wind units, as in the Interconnection/Renewable Scenario. The Integrated Scenario results show that including both coal as a fuel and wind

Caribbean Regional Electricity Generation, Interconnection, and Fuels Supply Strategy – Final Report 1-28
generation provides combined savings of US$31 million over the Base Case Scenario. The Integrated Scenario results show savings close to the sum of the savings of other two Scenarios.
Discussion of Country Results
Adding coal-fueled CFB technology reduces net present worth costs by US$12 million compared to the Base Case Scenario, with a cost advantage compared to distillate-fueled MSD technology ranging from 2% at 55% capacity factor to 10% at 80% capacity factor. That cost advantage disappears if costs of US$50/tonne are attributed to CO2 emissions.
Conventional LNG is more costly than distillate, but mid-scale LNG might be a viable fuel option, justifying a more detailed analysis.
Development of wind generation reduces net present worth costs by US$20 million compared to the Base Case Scenario, assuming that sites with good winds and low development costs can be identified and acquired. With that assumption wind is much lower in cost than distillate fueled generation. Small hydro and biomass would also be economic, if good sites can be identified. The benefits are relatively unaffected by the choice of fuel for the country’s fossil units.
1.7.2 Barbados
Overview: Barbados Light and Power (BL&P), a private company, is responsible for power generation, transmission, and distribution of electricity in Barbados. Existing installed generation of around 240 MW, mostly comprising of low and medium speed diesel units, substantially exceeds peak demand and provides a comfortable reserve margin. BL&P is looking to diversify its fuel mix which is mostly dependent on imported oil products.
Current and Forecast Load: The country’s 2008 peak demand was 164 MW, with net generation of over 1,000 GWh. By 2028 peak demand is projected to double to around 325 MW, with net generation increasing to around 1,900 GWh (increase rate of 3.5% per year).
Fossil Fuel Options: Natural gas, delivered as LNG or through the Eastern Caribbean Gas Pipeline (ECGP), and imported coal were considered as alternative fuel options. Due to the location and electricity demand on the island, the Study found natural gas delivered through ECGP to be the most economically attractive fuel option.
Renewable Generation Potential: No studies on country-specific overall wind and solar potential are available. We estimated Barbados wind potential to be at least 10 MW based on an already approved project. Solar PV potential is estimated at 26 MW of installed capacity, but bulk power development would not be economic based on current estimates.
Development Scenarios: All four Scenarios assumed that the committed system additions of the nine 16 MW Trent units will be installed. The first six units were added during 2011-2013 while the next three units were added when required to match the load growth. All Trent unit additions would satisfy reserve margin requirements until 2025. During 2026-2028 the Barbados system will require new capacity additions.

Caribbean Regional Electricity Generation, Interconnection, and Fuels Supply Strategy – Final Report 1-29
For the Base Case Scenario, new additions are assumed to be 20 MW low speed diesel units using distillate oil. By 2028 the system will need another 40 MW (2 x 20 MW units) to meet the required capacity.
For the Fuel Scenario, assumed system additions are the same as for the Base Case Scenario. The difference is that in this scenario most existing and all new units are assumed to use natural gas as a fuel, supplied through the ECGP. The Fuel Scenario shows that the introduction of ECGP natural gas provides net present worth savings of US$906 million compared to the Base Case Scenario..
For the Interconnection/Renewable Scenario, most assumed system additions are the same as for the Base Case Scenario. The difference in this Scenario is the addition of 45 MW of new wind units. This assumes that sites with good winds and low development costs can be identified and acquired. There is no electrical interconnection. The Interconnection/Renewable Scenario shows that the introduction of wind generation provides net present worth savings of US$39 million compared to the Base Case Scenario.
For the Integrated Scenario, the availability of natural gas is assumed, as in the Fuel Scenario, combined with the addition of 45 MW of new wind units, as in the Interconnection/Renewable Scenario. The Integrated Scenario results show net present worth savings of US$912 million over the Base Scenario, only slightly more than for the Fuel Scenario.
Discussion of Country Results
Barbados has four fossil fuel options that offer significant economic benefits compared to continued reliance on oil products: natural gas via the ECGP, LNG, CNG, and coal. By far the most attractive is the ECGP option, which provides net present worth savings of $906 million compared to the Base Case Scenario. Its cost per kWh compared to distillate fueled generation ranges from less than half at 20% capacity factor to less than 40% at 80% capacity factor.
If the ECGP does not materialize, the other fuel options should be considered. They would offer significant savings compared to distillate, though not as dramatic as ECGP gas offers.
Development of wind generation reduces Interconnection/Renewable Scenario net present worth costs by US$39 million compared to the Base Case Scenario, assuming that sites with good winds and low development costs can be identified and acquired. However, when ECGP gas is available, as is assumed in the Integrated Scenario, adding wind generation increases savings by only US$6 million. Wind is only marginally economic, as would be small hydro if good sites can be identified, but biomass would be marginally uneconomic. This illustrates the high dependence of wind generation savings on the assumed fuel supply option, and the possibility that wind generation penetration might be limited to only a few of the best wind sites.
1.7.3 Dominica
Overview: Dominica Electricity Services Limited (DOMLEC) is a sole producer responsible for the power generation, transmission, and distribution of electricity in Dominica. Existing installed generation, comprising high and medium speed diesel units and hydro units, exceeds peak

Caribbean Regional Electricity Generation, Interconnection, and Fuels Supply Strategy – Final Report 1-30
demand by 35% providing a comfortable reserve margin. Dominica is looking to diversify its fuel mix, which is mostly dependent on imported oil products.
Current and Forecast Load: The country’s current peak demand is around 15 MW, with net generation of around 90 GWh. By 2028 peak demand is projected to increase to 25 MW, with net generation increasing to around 150 GWh (increase rate of 2.5% per year).
Fossil Fuel Options: Due to the low electricity demand on the island, the least-cost fuel is distillate because the fixed costs associated with all other fuels produce higher unit costs in US$/GJ.
Renewable Generation Potential: Based on the ongoing assessment of potential at the Watton Waven field in central Dominica, and West Indies Power’s exploration in the Soufriere area, geothermal potential is estimated to be adequate to supply 100 MW of geothermal power plants. Drilling of the first three slim (exploratory) wells is scheduled to start in June 2010 in the Soufriere area near the southern coast. Solar PV potential is estimated at 45 MW of installed capacity, but bulk power development would not be economic based on current estimates. Dominica also has small-size hydro and wind potential.
Development Scenarios: Starting in 2012 Dominica will require new capacity additions.
For the Base Case Scenario, new additions are assumed to be 5 MW medium speed diesel units using distillate oil. By 2028 the system will need another 15 MW (3 x 5 MW units) to meet the required capacity. Dominica does not have a potentially less expensive fossil fuel option.
The Interconnection/Renewable Scenario assumes the addition of a 20 MW geothermal unit in 2012 to satisfy local needs. It also assumes submarine cable electrical interconnections with Martinique and Guadeloupe, and the addition of two 92.5 MW units in 2014 to support exports to those two countries. The results show large benefits of geothermal development in this Scenario, with net present worth savings of US$604 million compared with the Base Case Scenario.
The Integrated Scenario assumed assumes the same geothermal additions as in the Interconnection/Renewable Scenario. The key is the assumed fuel savings due to energy exports to Martinique and Guadeloupe. The Integrated Scenario assumes construction of the ECGP and natural gas deliveries to those two countries, so fuel savings on Martinique and Guadeloupe are reduced because the imports are replacing lower cost natural gas (rather than distillate) based generation. The Integrated Scenario result shows combined savings of only US$10 million, demonstrating that savings are highly dependent on the assumed fuel supply option for Martinique and Guadeloupe. Savings of US$10 million is considerably less than the savings from the much smaller supply to Dominica alone.
Discussion of Country Results:
Because its low demand means that no fossil fuel options appear economic compared to distillate, geothermal development is particularly important for Dominica. It seems probable that a geothermal resource at least large enough to serve Dominica’s demand will be confirmed. This would be the most important result from the country’s point of view, as it would insulate the

Caribbean Regional Electricity Generation, Interconnection, and Fuels Supply Strategy – Final Report 1-31
country from the high price of distillate, and the uncertainty associated with variation in that price over time. It would also reduce CO2 emissions.
Considering the low cost of power of geothermal power, wind generation is only marginally economic compared to geothermal for domestic consumption on Dominica. Small hydro also would be marginally economic if good sites can be identified, but biomass would be marginally uneconomic.
Confirmation of a resource sufficient to serve exports to Martinique and/or Guadeloupe is less certain. The benefits of such development are also less certain. Almost US$600 million in savings when distillate is the displaced fuel disappear when ECGP gas is assumed to be the displaced fuel. Martinique and Guadeloupe have another fossil fuel option, LNG, with lower cost than distillate. In the Fuel Scenario, LNG would provide significant savings compared to the Base Case Scenario, though less than the savings with ECGP gas. It is not clear how much the savings would be in the Integrated Scenario, but they would be higher than US$10 million.
It is clear that more detailed analysis of the Martinique and Guadeloupe systems would be required to determine the desirability of developing geothermal power on Dominica for export to those countries. That will depend on the fuel supply (continuing with distillate, ECGP, LNG) they select as well as factors such as costs and the number of units that could be converted to natural gas.
1.7.4 Dominican Republic
Overview: Prior to 1997 all the generation, transmission, and distribution assets of the Dominican Republic (DR) were owned by the state owned company CDE. In 1997 a capitalization process divided the three entities and the stocks of the companies were sold t private investors. Now the DR has eleven different private thermal power generating companies and a government owned hydroelectric entity, Empresa de Generación Hidroeléctrica Dominicana (EGEHID). AES Dominica, the largest thermal power generator, is owned by AES an international utility company. Other generation companies are La Empresa Generadora de Electricidad Haina (EGE Haina), Generadora Palamara La Vega (GPLV), La Compañía De Electricidad De San Pedro De Macorís (CESPM) and five smaller companies. There are three private and one public distribution companies and a public owned transmission company.
Current and Forecast Load: The country’s 2008 peak demand was 2,168 MW, with net generation of over 11,600 GWh, making it by far the largest power market of all studied countries. By 2028 peak demand is projected to double to over 4,400 MW, with net generation increasing to around 23,750 GWh (increase rate of 3.4% per year).
Fossil Fuel Options: Today the DR has power plants using coal and natural gas derived from LNG, but most of its existing generation uses HFO. Expanding the use of coal and LNG offers the potential to reduce costs and were considered as alternative fuel options.
Renewable Generation Potential: The government enacted a law in 2007 defining goals for future renewable energy development. The goal is to have 25% renewable energy by 2025. About 350 MW of wind projects have already been approved. In addition, there is significant additional wind potential based on provisional studies. There are also estimates of 2,899 MW of

Caribbean Regional Electricity Generation, Interconnection, and Fuels Supply Strategy – Final Report 1-32
solar PV projects, but these would not be economic based on current estimates. Construction is under way, or contracts have been signed, for 356 MW of new hydro plants. In addition, several hundred MW of new hydro projects are in different stages of development.
Development Scenarios: In 2010 and 2011, installation of already committed hydro and wind resources will add enough new capacity to cover the short-term load growth in all Scenarios. Starting in 2012 the Dominican Republic system will require new capacity additions.
For the Base Case Scenario, new additions are assumed to be 300 MW combined cycle units using LNG, with a few additions of 50 MW GT units to cover peaking generation. Results of the analysis show that by 2028 the system will need another 2,400 MW (8 x 300 MW) of CC units and 100 MW of GT units.
For the Fuel Scenario, new additions are assumed to be coal based units. The first additions are planned (Montecristi and Haltillo-Azua) units, followed by generic 300 MW conventional coal units using imported coal. This Scenario again includes additions of 50 MW GT units to supply peaking generation. The results of the analysis show that by 2028 the system will need another 2,400 MW (8 x 300 MW) of coal units and 100 MW of GT units. The Fuel Scenario results show that the introduction of coal provides net present worth savings of US$444 million compared to the Base Case Scenario.
The Interconnection/Renewable Scenario assumes the addition of renewable energy resources. There is no electrical interconnection. Most assumed generation is the same as in the Base Case Scenario, but the “Renewable Scenario” includes the addition of 540 MW of new wind units (30 MW each year starting in 2011). This Scenario does not include interconnection with Haiti, which separate analysis determined not to be economic. The Interconnection/Renewable Scenario shows potential savings of US$350 million from introduction of wind generation only.
The Integrated Scenario assumed system additions are the same as in the Fuel Scenario with the addition of new wind units as in the Interconnection/Renewable Scenario. This Scenario shows combined savings of including the coal and wind options. The Integrated Scenario results show savings of US$721 million or about 90% of the sum of savings from the other two Scenarios.
Discussion of Country Results:
The Dominican Republic now uses a wider range of fuels than any other country, and has significant renewable resource options. It can expand its use of coal and LNG while adding wind and hydro. The Fuel Scenario results indicate that using coal instead of LNG (used in the Base Case Scenario) provides savings of US$444 million. The cost advantage of coal compared to LNG ranges from 1% at 45% capacity factor to 18% at 80% capacity factor, and disappears if costs of US$50/tonne are attributed to CO2 emissions.
As with Barbados, the relatively low fuel cost makes renewable generation economically less attractive. Wind generation is only marginally economic. Small hydro would be marginally economic if good sites can be identified, but biomass would be marginally uneconomic.

Caribbean Regional Electricity Generation, Interconnection, and Fuels Supply Strategy – Final Report 1-33
1.7.5 Grenada
Overview: Grenada Energy Services Ltd. (GRENLEC) is a private energy provider that owns all the generation and transmission facilities in Grenada, Carriacou, and Petit Martinique. GRENLEC’s installed generation, mostly low speed diesels, exceeds 2008 peak demand by about 81%, providing a comfortable reserve margin. Most of the generating units were installed after 2002 and are relatively efficient. The diversification of the fuel/energy mix and the use of alternative energy sources are two critical strategic objectives.
Current and Forecast Load: The country’s peak demand is around 30 MW, with net generation of around 190 GWh. By 2028 peak demand is projected to increase significantly to around 84 MW, with net generation increasing to around 530 GWh (increase rate of 5.3% per year).
Fossil Fuel Options: Imported coal was considered as an alternative fuel. Due to the location and electricity demand on the island, the Study did not find natural gas to be an economically viable fuel option.
Renewable Generation Potential: Wind is the most promising renewable resource for Grenada. Initial wind measurements and project installations are underway. Grenada is also encouraging small photovoltaic installations. Solar PV potential is estimated at 21 MW of installed capacity, but bulk power development would not be economic based on current estimates. Grenada’s geothermal potential is estimated at 400 MW, but there appears to be no exploration under way and no development planned.
Development Scenarios: Grenada will require new capacity addition starting in 2013.
For the Base Case Scenario, new additions are assumed to be 10 MW medium speed diesel units using distillate oil. By 2028 the system will need another 70 MW (7 x 10 MW units) to cover projected load growth.
For the Fuel Scenario, new unit additions are assumed to be 10 MW CFB units using imported coal. Conventional (large-scale) LNG is more costly than either (distillate or coal) option. Though not studied in the same detail as the other fuel options, mid-scale LNG may provide an economically attractive option. By 2028 the system will need an additional 70 MW (7 x 10 MW units) to cover projected load growth. The Fuel Scenario results show that the introduction of coal provides net present worth savings of US$32 million compared to the Base Case Scenario.
For the Interconnection/Renewable Scenario, most assumed new generation units are the same as in the Base Case. The difference in this scenario is the addition of 12 MW of new wind units. This assumes that sites with good winds and low development costs can be identified and acquired. There is no electrical interconnection. The Interconnection/Renewable Scenario results show that the introduction of wind generation provides net present worth savings of US$17 million compared to the Base Case Scenario.
The Integrated Scenario assumed system additions are the same as in the Fuel Scenario with the addition of new wind units as in the Interconnection/Renewable Scenario. The Integrated Scenario results show that including both coal as a fuel and wind generation provides combined

Caribbean Regional Electricity Generation, Interconnection, and Fuels Supply Strategy – Final Report 1-34
savings of US$44 million over the Base Case Scenario. The Integrated Scenario results show savings close to the sum of the savings of other two Scenarios.
Discussion of Country Results
Adding coal-fueled CFB technology reduces net present worth costs by US$12 million compared to the Base Case Scenario, with a cost advantage compared to distillate-fueled MSD technology ranging from 2% at 55% capacity factor to 12% at 90% capacity factor. That cost advantage disappears if costs of US$50/tonne are attributed to CO2 emissions.
Conventional LNG is more costly than distillate, but mid-scale LNG might be a viable fuel option, justifying a more detailed analysis.
Development of wind generation reduces net present worth costs by US$20 million compared to the Base Case Scenario, assuming that sites with good winds and low development costs can be identified and acquired. With that assumption wind is much lower in cost than distillate fueled generation. Small hydro and biomass would also be economic, if good sites can be identified. The benefits are relatively unaffected by the choice of fuel for the country’s fossil units.
1.7.6 Haiti
Overview: Electricité de Haiti (Electricity of Haiti) has the monopoly for electricity generation, transmission, and distribution in the country. EDH grid consists of five isolated areas, of which the Metropolitan including Port au Prince is by far the largest, with 80% of total demand. Only about 12% of the country is electrified. Generation, transmission, and distribution facilities are old and need rehabilitation. Operational capacity of generating units is only about 155 MW. About half of all demand may not be served due to load shedding.
Current and Forecast Load: The country’s 2008 unconstrained peak demand was estimated at 215 MW, but due to load shedding net generation was only around 600 GWh. With the assumption that the economic conditions will improve and generation resources will over time catch up with demand, by 2028 unconstrained peak demand is projected to increase to around 570 MW with net generation increasing to around 2,800 GWh (increase rate of 5% per year for peak demand and 7.9% for energy generation).
Fossil Fuel Options: LNG and imported coal were considered as alternative fuels. The analysis found LNG to be the economically preferred fuel option.
Renewable Generation Potential: Wind is the most promising renewable resource for Haiti. A Study of wind at three sites was conducted with good results. Haiti also has untapped resources of at least 50 MW in small hydro projects. Solar PV potential is estimated at 1,654 MW of installed capacity, but bulk power development would not be economic based on current estimates.
Development Scenarios: Haiti’s power system is already short of generation resources in 2009. We calculated that the already committed resources and an additional 80 MW of low speed diesel units (4 x 20 MW) will need to be built during 2009 just to meet the existing demand.

Caribbean Regional Electricity Generation, Interconnection, and Fuels Supply Strategy – Final Report 1-35
For the Base Case Scenario, new unit additions are assumed to be 20 MW low speed diesel units using distillate oil. Starting in 2010 the system will need another 20 MW (in some years 40 MW) in new units each year to cover projected load growth. By 2028 the system will need to install a total of 540 MW of diesel units.
For the Fuel Scenario, assumed system additions are the same as for the Base Case Scenario. The difference is that in this scenario all new units will be using natural gas as a fuel. Natural gas will be supplied starting in 2014 from a new LNG terminal. The Fuel Scenario results show that the introduction of LNG provides net present worth savings of US$433 million compared to the Base Scenario. Though not studied in the same detail as the other fuel options, mid-scale LNG may also provide an economically attractive option.
The Interconnection/Renewable Scenario assumed generation is the same as in the Base Case Scenario, but includes the addition of 81 MW of new wind generation. This assumes that sites with good winds and low development costs can be identified and acquired. There is no electrical interconnection. The Interconnection/Renewable Scenario results show that the introduction of wind generation provides net present worth savings of US$76 million compared to the Base Case Scenario.
The Integrated Scenario assumed system additions are the same as in the Fuel Scenario with the addition of new wind units as in the Interconnection/Renewable Scenario. The Integrated Scenario results show that including both LNG as a fuel and wind generation provides combined savings of US$476 million over the Base Case Scenario. The results show that 55% of the wind savings in the Interconnection/Renewable Scenario appear in the Integrated Scenario.
The results of separate analysis which studied only interconnection and exports from Dominican Republic to Haiti show, on a net present worth basis, system cost in Dominican Republic increased by US$322 million when HFO fuels the exported generation while system cost in Haiti decreased by US$556 million. The total savings are thus US$235 million. This was compared with the net present worth costs of building and operating the transmission line calculated at US$242 million. The total cost increases outweighed the potential benefits and therefore a transmission interconnection was not included in the Interconnection/Renewable Scenario or the Integrated Scenario. Only if LNG fuels the exported generation, which seems unlikely, does the interconnection become economically attractive.
Discussion of Country Results:
The poor condition and inadequate amount of generation in Haiti make all near-term additions highly cost effective until an adequate reserve margin is established.
LNG is much less costly than distillate, leading to the savings of US$433 million. Coal is only slightly more expensive than LNG, and would also provide large savings compared to distillate, but becomes significantly less economic when costs of US$50/tonne are attributed to CO2 emissions.
Development of wind generation in the Interconnection/Renewable Scenario reduces net present worth costs by US$76 million compared to the Base Case Scenario, assuming that sites with good winds and low development costs can be identified and acquired. In the Integrated

Caribbean Regional Electricity Generation, Interconnection, and Fuels Supply Strategy – Final Report 1-36
Scenario, because it is displacing lower cost LNG rather than distillate, wind is less attractive but is still economic. Small hydro would also be economic, and biomass would be marginally economic, if good sites can be identified.
The land-based interconnection with Dominican Republic appears to be not economic. The main issue is the high cost of the fuel (HFO) assumed to supply the export generation. Because of its length, the terrain, and the relatively low amount of power being transmitted, the interconnection itself is costly despite being on land.
1.7.7 Jamaica
Overview: Jamaica Public Service (JPS) is the sole distributor of electricity in Jamaica. It is a vertically integrated company involved with generation, transmission, and distribution of electricity. It also buys power from four independent power producers in Jamaica. The government has reorganized the energy department under the Ministry of Energy and Mining (MEM). They set energy policy and have recently issued a draft of the new energy policy. The main focus is on developing energy diversity, since currently 95% of power is generated by petroleum products. The ministry has been having extensive negotiations with major users of fuel, gas suppliers and foreign partners to help develop a natural gas industry in Jamaica.
Current and Forecast Load: The country’s 2008 peak demand was 622 MW, with net generation of over 4,100 GWh. By 2028 peak demand is projected to increase to around 1,500 MW, with net generation increasing to around 10,000 GWh (increase rate of 4.3% per year).
Fossil Fuel Options: Natural gas, delivered as LNG, and imported coal were considered as alternative fuel options.
Renewable Generation Potential: Wind is the most promising renewable resource for Jamaica. Detailed engineering is under way to expand Wigdon Wind Farm by 18 MW. Jamaica also has limited potential for small hydro and biomass development. The current resource plan includes development of an estimated 20 MW municipal waste project in Kingston. Solar PV potential is estimated at 650 MW of installed capacity, but bulk power development would not be economic based on current estimates.
Development Scenarios: During the next four years, until 2014, we assumed that the planned resources, including the Kingston, Hunts Bay, Windalco, Jamalco, and Wigton units, will be built to cover the load growth. If those resources are built, Jamaica will require new capacity additions starting in 2015.
For the Base Case Scenario, new additions are assumed to be 100 MW conventional coal units using imported coal. The results of the analysis show that by 2028 the system will need another 1,100 MW (11 x 100 MW units) to cover projected load growth.
For the Fuel Scenario, starting in 2015 new additions are assumed to be 100 MW combined cycle units using natural gas supplied from two new LNG terminals, one on the southern side of the island and one on the northern. Natural gas will become available during 2014 and by 2014 about 450 MW in existing units are also assumed to be converted to use natural gas. Though not studied in the same detail as the other fuel options, mid-scale LNG may provide an economically

Caribbean Regional Electricity Generation, Interconnection, and Fuels Supply Strategy – Final Report 1-37
attractive option. The results of the analysis show that by 2028 the system will need another 1,100 MW (11 x 100 MW units) to cover projected load growth. The Fuel Scenario results show that the introduction of LNG provides net present worth savings of US$500 million compared to the Base Case Scenario.
The Interconnection/Renewable Scenario assumed system unit additions are the same as for the Base Case Scenario. The difference is the addition of 219 MW of wind generation by 2028. This assumes that sites with good winds and low development costs can be identified and acquired. There is no electrical interconnection. The Interconnection/Renewable Scenario results show that the introduction of wind generation provides net present worth savings of US$138 million compared to the Base Case Scenario.
The Integrated Scenario assumed system additions are the same as in the Fuel Scenario with the addition of new wind units as in the Interconnection/Renewable Scenario. The Integrated Scenario results show that including both LNG as a fuel and wind generation provides combined savings of US$628 million over the Base Case Scenario. The Integrated Scenario results show savings close to the sum of the savings of other two Scenarios.
Discussion of Country Results:
The Base Case Scenario assumes that the infrastructure to deliver and generate with coal will be put in place. If this does not occur, the other Scenarios’ benefits would be much larger.
Coal-fueled generation is less costly than LNG, but only at mid to high capacity factors. LNG has the advantage that in the Fuel Scenario it can displace HFO in existing plants as well as the new coal generation added in the Base Case Scenario. Replacing new coal generation in the Base Case Scenario with LNG in the Fuel Scenario, and displacing HFO use in existing plants, leads to the savings of US$500 million. Coal becomes significantly less economic when costs of US$50/tonne are attributed to CO2 emissions.
Development of wind generation in the Interconnection/Renewable Scenario reduces net present worth costs by US$138 million compared to the Base Case Scenario, assuming that sites with good winds and low development costs can be identified and acquired. Wind is economic, as would be small hydro if good sites can be identified. The benefits are relatively unaffected by the choice of fuel for the country’s fossil units.
1.7.8 St. Kitts and Nevis
Overview: The two islands have distinct utility structures. The electricity service in St. Kitts is provided by a department of the St. Kitts Government. All generation is by slow and medium speed diesel units. A plan is underway to convert some of the units to HFO. The Nevis Electricity Co. Ltd. is a stand-alone Government entity supplying power to Nevis. All of Nevis generation is also by slow and medium speed diesel units.
Current and Forecast Load: Current peak demand for both islands is less than 40 MW, with net generation of around 200 GWh. By 2028 peak demand is projected to increase to 85 MW, with net generation increasing to around 430 GWh (increase rate of 3.6% per year, with rates of 2.9% per year for St. Kitts and 5.2% per year for Nevis)

Caribbean Regional Electricity Generation, Interconnection, and Fuels Supply Strategy – Final Report 1-38
Fossil Fuel Options: Imported coal was considered as an alternative fuel. Due to the location and electricity demand on the island, the Study did not find natural gas to be an economically viable fuel option.
Renewable Generation Potential: Nevis has significant geothermal resources estimated to support development of 300 MW in geothermal power plants. Production drilling of two production wells and one injector on Nevis is scheduled to begin June/July 2010, with the 10MW Nevis plant due to be on line in the first half of 2011. A 30 MW plant on Nevis, to serve demand on St. Kitts, is in late stages of planning. The islands also have potential to develop small 4-5 MW wind farms. Solar PV potential is estimated at 16 MW of installed capacity, but bulk power development would not be economic based on current estimates.
Development Scenarios: Starting in 2012 St. Kitts will require new capacity additions. For the Base Case Scenario, new additions are assumed to be 5 MW medium speed diesel units using distillate oil. By 2028 the system will need another 35 MW (7 x 5 MW units) to cover projected load growth.
Starting in 2011 Nevis will require new capacity additions. For the Base Case Scenario, new additions are assumed to be 5 MW medium speed diesel units using distillate oil. By 2028 the system will need another 25 MW (5 x 5 MW units) to cover projected load growth.
Neither St. Kitts nor Nevis has an alternative, potentially less expensive, fossil fuel option to be used for the Fuel Scenario.
Interconnection/Renewable Scenario assumes that Nevis will be interconnected with St. Kitts by 2011 and the two 20 MW geothermal units at Nevis will supply 30 MW for St. Kitts and 10 MW for Nevis. No new generation units will be built on St. Kitts. Additionally, this scenario assumes two 200 MW geothermal units will be built on Nevis in 2014 to supply Puerto Rico. A submarine cable connecting Nevis and Puerto Rico is also assumed to be completed by 2014. The St. Kitts results show net present worth savings of US$159 million compared with the Base Scenario, as the result of interconnection and geothermal development on Nevis. These saving are much higher than the increased costs of US$100 million on Nevis associated with serving St. Kitts load. Interconnection of St. Kitts and Nevis and geothermal development of Nevis to serve both islands is clearly a cost effective option. Further large potential benefits with net present worth savings of over US$1 billion on Nevis are the result of additional geothermal development, interconnection, and exports of energy to Puerto Rico.
The Integrated Scenario assumes the same interconnection with Nevis by 2011 and no new generation units built on St. Kitts, as in the Interconnection/Renewable Scenario.
Discussion of Country Results:
Because their low demand means that no fossil fuel options appear economic compared to distillate, geothermal development on Nevis is particularly important for St. Kitts and Nevis. It seems highly probable that a geothermal resource of at least 40 MW will be developed, based on exploratory well and signed contracts. This would be the most important result from the country’s point of view, as it would insulate the country from the high price of distillate, and the

Caribbean Regional Electricity Generation, Interconnection, and Fuels Supply Strategy – Final Report 1-39
uncertainty associated with variation in that price over time. It would also reduce CO2 emissions.
Considering the low cost of power of geothermal power, wind generation is only marginally economic compared to geothermal for domestic consumption on St. Kitts and Nevis. Small hydro also would be marginally economic if good sites can be identified, but biomass would be marginally uneconomic.
Development of a resource sufficient to serve exports to Puerto Rico is less certain, but West Indies Power indicates that exploration data supports at least 300 MW. The very large benefits associated with the development of 400 MW for export to Puerto Rico are based on the exports displacing HFO in Puerto Rico, which seem reasonable because HFO is the main fuel today.
1.7.9 St. Lucia
Overview: St. Lucia Electricity Services Ltd. (LUCELEC) is responsible for the power generation, transmission, and distribution of electricity on St. Lucia. Existing installed generation of around 75 MW, comprising of diesel units, exceeds peak demand and provides a comfortable reserve margin. LUCELEC is looking to diversify its fuel mix, which is mostly dependent on imported oil products. The utility has adequate tariffs, reasonable regulation, and a strong financial position.
Current and Forecast Load: The country’s 2008 peak demand was 54 MW, with net generation of over 350 GWh. By 2028 peak demand is projected to increase around 115 MW, with net generation increasing to around 650 GWh (increase rate of 3.2%).
Fossil Fuel Options: Natural gas, delivered as LNG or through the ECGP, and imported coal were considered as alternative fuel options. Due to the location and electricity demand on the island, the Study found natural gas delivered through the ECGP to be the most economical fuel option.
Renewable Generation Potential: Wind is the most promising renewable resource for St. Lucia. LUCELEC is pursuing a wind farm on land they already own and are starting measurement on several promising sites. St. Lucia also has rooftop solar PV installations at many locations. Solar PV potential is estimated at 36 MW of installed capacity, but bulk power development would not be economic based on current estimates. There was significant geothermal exploration in the 1970s – 1980s, but the wells did not produce much steam. There appears to be some geothermal potential, but the rights to the resource for a long time were and may still be tied up with a developer.
Development Scenarios: Starting in 2010 St. Lucia will require new capacity additions.
For the Base Case Scenario, new additions are assumed to be 20 MW low speed diesel units using distillate oil. By 2028 the system will need another 80 MW (4 x 20 MW units) to meet the required capacity.
For the Fuel Scenario, assumed system additions are the same as for the Base Case Scenario. The difference is that in this scenario most existing and all new units will be using natural gas as

Caribbean Regional Electricity Generation, Interconnection, and Fuels Supply Strategy – Final Report 1-40
a fuel. Natural gas will be supplied through the ECGP. Fuel Scenario results show that the introduction of ECGP gas provides net present worth savings of US$216 million compared to the Base Case Scenario.
The Interconnection/Renewable Scenario assumes system additions are the same as for the Base Case Scenario. The difference is the assumed addition by 2028 of 18 MW of wind generation. This assumes that sites with good winds and low development costs can be identified and acquired. There is no electrical interconnection. The Interconnection/Renewable Scenario results show that the introduction of wind generation provides net present worth savings of US$18 million compared to the Base Case Scenario.
The Integrated Scenario assumed system additions are the same as in the Fuel Scenario with the addition of new wind units as in the Interconnection/Renewable Scenario. Similar to the Barbados results, the Integrated Scenario net present worth savings of US$221 million or only US$5 million higher than the Fuels Scenario, showing that savings from wind generation are much smaller when the assumed displaced fuel is low cost gas rather than high cost distillate.
Discussion of Country Results:
St. Lucia has two fossil fuel options that offer significant economic benefits compared to continued reliance on oil products: natural gas via the ECGP and coal. By far the more attractive is the ECGP option, which in the Fuel Scenario provides net present worth savings of $216 million compared to the Base Case Scenario. Its cost per kWh compared to distillate fueled generation ranges from less than half at 20% capacity factor to less than 40% at 80% capacity factor.
If the ECGP does not materialize, the coal option should be considered. It would offer significant savings compared to distillate, though not as dramatic as ECGP gas offers. ECGP gas could displace distillate in existing units as well as fuel new units.
Development of wind generation reduces Interconnection/Renewable Scenario net present worth costs by US$18 million compared to the Base Case Scenario, assuming that sites with good winds and low development costs can be identified and acquired. However, when ECGP gas is available, as is assumed in the Integrated Scenario, adding wind generation increases savings by only US$5 million. Wind is only marginally economic, as would be small hydro if good sites can be identified, but biomass would be marginally uneconomic. This illustrates the high dependence of wind generation savings on the assumed fuel supply option, and the possibility that wind generation penetration might be limited to only a few of the best wind sites.
1.7.10 St. Vincent and the Grenadines
Overview: St. Vincent Electricity Service Ltd. (Vinlec) is a state owned corporation responsible for the power generation, transmission, and distribution of electricity on the islands. Existing installed generation of around 58 MW, mostly comprising low and medium speed diesel and small hydro units, exceeds peak demand and provides a comfortable reserve margin. The St. Vincent Government’s goal is to provide 20% of electricity from renewable resources. The Canouan Island has generating capacity of 2.5 MW and remaining islands have much smaller generating capacity.

Caribbean Regional Electricity Generation, Interconnection, and Fuels Supply Strategy – Final Report 1-41
Current and Forecast Load: The country’s 2008 peak demand was around 25 MW, with net generation of around 150 GWh. By 2028 peak demand is projected to increase to around 95 MW, with net generation increasing to around 550 GWh (increase rate of 6.9% per year).
Fossil Fuel Options: Imported coal was considered as an alternative fuel. Due to the location and electricity demand on the island, the Study did not find natural gas to be an economically viable fuel option.
Renewable Generation Potential: Wind and expansion of small hydro are the most promising renewable resources. The country announced its first 2 MW wind farm development, for Canouan Island. There appears to be some geothermal potential, but the rights to the resource are tied up with a developer. Solar PV potential is estimated at 23 MW of installed capacity, but bulk power development would not be economic based on current estimates.
Development Scenarios: St. Vincent and Grenadines will require new capacity additions starting in 2017.
For the Base Case Scenario, new additions are assumed to be 10 MW medium speed diesel units using distillate oil. By 2028 the system will need another 70 MW (7 x 10 MW units) to cover projected load growth.
For the Fuel Scenario, coal-fueled circulating fluidized bed (CFB) plants are marginally more economic than distillate fueled medium speed diesels (MSD) plants; new unit additions are assumed to be 10 MW CFB units using imported coal. CO2 costs of US$50/tonne would make the distillate-fueled units more economic than the coal-fueled units. Conventional (large-scale) LNG is more costly than either (distillate or coal) option. Though not studied in the same detail as the other fuel options, mid-scale LNG may provide an economically attractive option. By 2028 the system will need another 70 MW (7 x 10 MW units) to meet the required capacity. The Fuel Scenario results show that the introduction of coal provides net present worth savings of US$18 million compared to the Base Case Scenario.
The Interconnection/Renewable Scenario assumed system additions are the same as for the Base Case Scenario. The difference is the assumed addition of 14 MW by 2028 of wind generation. This assumes that sites with good winds and low development costs can be identified and acquired. There is no electrical interconnection. The Interconnection/Renewable Scenario results show that the introduction of wind generation provides net present worth savings of US$14 million compared to the Base Case Scenario.
The Integrated Scenario assumed system additions are the same as in the Fuel Scenario with the addition of new wind units as in the Interconnection/Renewable Scenario. The Integrated Scenario results show that including both coal as a fuel and wind generation provides combined savings of US$29 million over the Base Case Scenario. The Integrated Scenario results show savings close to the sum of the savings of other two Scenarios.
Discussion of Country Results
Adding coal-fueled CFB technology reduces net present worth costs by US$12 million compared to the Base Case Scenario, with a cost advantage compared to distillate-fueled MSD technology

Caribbean Regional Electricity Generation, Interconnection, and Fuels Supply Strategy – Final Report 1-42
ranging from 2% at 55% capacity factor to 12% at 90% capacity factor. That cost advantage disappears if costs of US$50/tonne are attributed to CO2 emissions.
Conventional LNG is more costly than distillate, but mid-scale LNG might be a viable fuel option, justifying a more detailed analysis.
Development of wind generation reduces net present worth costs by US$20 million compared to the Base Case Scenario, assuming that sites with good winds and low development costs can be identified and acquired. With that assumption wind is much lower in cost than distillate fueled generation. Small hydro and biomass would also be economic, if good sites can be identified. The benefits are relatively unaffected by the choice of fuel for the country’s fossil units.
1.8 RECOMMENDATIONS
Based on the more detailed system analysis summarized in Table 1-4, we recommend the projects included in the Integrated Scenario as a basis for future more detailed analysis and development. The Integrated Scenario analysis showed that introducing new fuels and developing geothermal-based power over interconnections provide the most benefits and both could be part of the power system development. One exception was found to be the geothermal development on Dominica for exports to Martinique and Guadeloupe. Benefits of this option are large when distillate is the displaced fuel, but disappear when the ECGP is assumed to be built.
The focus of this Study was on the economics as determined by annual cost of power for individual fuel supply and technology sets, and total net present value analysis for the four Scenarios. There are financial, institutional, and other barriers to achieving the least-cost economic solution, including:
The capital investments required to obtain the economic benefits may be beyond the financing capability of some utilities
Uncertainty in the input parameters, especially fuel price forecasts, means any course of action has a level of risk that may deter capital investment
Development of electrical interconnections or the ECGP will require agreement among many parties, such as the utilities, private power producers, regulators, gas suppliers, and governments. This makes development more difficult, time-consuming, and costly.
Utilities or countries may be concerned about relying on another utility or country for power or gas critical to its operations
Environmental and economic regulation may prevent some projects or fuel choices from materializing
Some countries suffer from a combination of issues that unfortunately are common in developing countries:
Inadequate tariff levels
High technical and non-technical losses
Deteriorating equipment

Caribbean Regional Electricity Generation, Interconnection, and Fuels Supply Strategy – Final Report 1-43
Load shedding
This Study provides a relatively high level overview of the fuels, generation technologies, and interconnection projects considered. In some cases we have identified marginal net benefits, in others multiple parties need to agree, in still others the utility might need to choose among several attractive alternatives. Much more detailed project-specific work would need to be completed to resolve uncertainties before proceeding with any major facility. Each of the main subject areas merits further support, but we suggest priority for the following.
1) Gas Pipeline
The ECGP provides the most economic fuel for each island it reaches. The number of parties potentially involved (ECGPC, gas suppliers, utilities, regulators, financial institutions) suggest the need for support over a range of areas.
2) Geothermal Power Generation / Submarine Cable Projects
The Nevis – St. Kitts link is highly economic and not technically challenging. The benefits of the Dominica – Martinique and Dominica – Guadeloupe links are large when distillate is the displace fuel but disappear or become much smaller when pipeline gas or other low-cost fuel is available. In other words, the ECGP and Dominica links are competitors and may be mutually exclusive. Other links (Nevis – Puerto Rico, United States (Florida) – Cuba also offer potentially large benefits but have larger uncertainties.
3) Renewable Energy
The primary uncertainty with wind and geothermal power generation is identifying sites where the resource is good and site development costs are not a barrier. The expected potential for both wind and geothermal is large. Assisting in identifying such sites might be the most cost-effective method of fostering development.

Caribbean Regional Electricity Generation, Interconnection, and Fuels Supply Strategy – Interim Report 2-1
Section 2 Introduction
2.1 BACKGROUND
The objective of this Caribbean Regional Electricity Generation, Interconnection, and Fuels Supply Strategy (the Study) is to analyze the availability of technically and financially sound regional and sub-regional energy solutions for power generation rather than specific energy solutions for each Caribbean country.
The countries of the Caribbean region face crucial energy challenges. Paramount among them is to manage their high dependence on oil (and oil products) that fuel their domestic economies, in particular the power sectors. Most countries’ power plants rely primarily or entirely on imported diesel and heavy fuel oil (HFO). Most have small and fragmented power systems and there are no existing interconnections. Some regional projects, such as the Eastern Caribbean Gas Pipeline (ECGP), have been proposed but not yet materialized.
Customers in the Caribbean countries already face some of the highest electricity tariffs worldwide, and their governments are increasingly concerned about the environmental burden of the current power generation, especially in tourist-driven economies. There are alternatives to nearly exclusive use of diesel and heavy fuel oil for power generation. Liquefied natural gas (LNG), compressed natural gas (CNG), and pipeline natural gas may be economically and financially viable. Agricultural wastes, coal, and petroleum coke may also be viable options for fueling power generation. Geothermal, solar, wind, and hydro power plants exist in the Caribbean today and expansion of those renewable energy options may be feasible. Finally, development of submarine cable electrical interconnections among the countries would enable them to share lower cost resources, provide mutual support, gain economies of scale in power plants and systems, and obtain the benefits of power pools generally.
The World Bank identified an assessment of the possibilities for developing regional/sub-regional energy supply markets for power generation as an important component of energy security planning work by the individual countries in the Caribbean. Accordingly the Study focuses on scenarios in which two or more countries share resources or activities. The Study also emphasizes renewable energy resources, not necessarily shared among countries.
In April 2009 the World Bank contracted with Nexant to conduct this Study. Nexant subcontracted with Power Delivery Consultants, Inc. for its expertise in submarine cables. Our main counterparts in the region are the Caribbean Electric Utility Service Corporation (CARILEC), in St. Lucia, and many of the electric utilities in the region.
The primary emphasis of the Study is on the nine countries in the Caribbean eligible for support from the International Development Association (IDA) and/or the International Bank for Reconstruction and Development (IBRD). These nine include:
Six small countries in the Lesser Antilles: St. Lucia, St. Vincent and the Grenadines, Grenada, Antigua and Barbuda, St. Kitts and Nevis, and Dominica, total combined population about 600,000

Caribbean Regional Electricity Generation, Interconnection, and Fuels Supply Strategy – Interim Report 2-2
Three countries located on two of the four islands in the Greater Antilles: Haiti and the Dominican Republic, both on the island Hispaniola, and Jamaica, total population about 22,000,000
The Study also considered other relevant countries that might be part of a regional energy solution. In addition to the nine countries mentioned above, we visited or obtained significant data on Barbados, Trinidad and Tobago, and Martinique; somewhat less on Guadeloupe; and cursory information on Puerto Rico, Sint Maarten, and Cuba.
The Study’s Terms of Reference (TOR) specify that the Study team prepare in sequence an Inception Report following initial field work, a Draft Final Report, and a Final Report. Nexant delivered the Inception Report on 5 June 2009.At the World Bank’s request, the Draft Final Report has been re-named the Interim Report, which was delivered on 30 November 2009.
This Final Report is revised to include comments received from the World Bank and other reviewers.
2.2 STUDY TEAM
As specified in the TOR, the Study Team includes the following individuals and specialties. The Study Team’s combined experience exceeds 175 person-years.
Peter Hindley, Power Generation Expert and Team Leader, from Nexant
Bruce Degen, Natural Gas Expert (CNG, LNG, pipeline, and other fuels), from Nexant
Graham Lawson, Power Transmission/Submarine Interconnection Expert, from Power Delivery Consultants
Babul Patel, Renewable Expert (hydro, solar, geothermal, wind), from Nexant
Miljenko Bradaric, Financial/Economic Expert, from Nexant.

Caribbean Regional Electricity Generation, Interconnection, and Fuels Supply Strategy – Final Report 3-1
Section 3 Approach
3.1 APPROACH
Nexant’s approach addressed each of the major parts listed in the Study’s TOR, which the World Bank had organized into six key elements. Nexant organized the work into six Activities covering these six key elements, plus an initial Activity (Data Collection) and an Activity covering deliverables (Reporting and Presentations).
Activity 1 – Data Collection
Activity 2 – Description and Analysis of Current Power Generation Market
Activity 3 – Electricity Supply and Demand Analysis
Activity 4 – Pipeline Gas, LNG, CNG and Coal
Activity 5 – Renewable Energy (Hydro, Geothermal, Solar and Wind)
Activity 6 – Electricity Generation, Transmission and Interconnections
Activity 7 – Identification and Assessment of Viable Regional/sub-regional Energy Solutions
Activity 8 – Reporting and Presentations
3.2 BRIEF DESCRIPTION OF STUDY STEPS
3.2.1 Activity 1 – Data Collection
Section 4 provides more detail on the approach to data collection.
3.2.2 Activity 2 – Description and Analysis of Current Power Generation Market
The focus of Activity 2 is on the current power generation market, including assessing the upgrading of existing units and assessing regional fuel storage facilities for existing units.
The major components of a power generation market are demand, supply, and fuels. Section 6 covers current demand, describes our approach to forecasting future demand, and provides the results. The data collection process provided the basic data on existing and planned generation contained in Section 5, which also contains a more detailed summary description of the power generation market. Section 7 describes our approach to, and the results from, assessing fuel supply, fuel pricing, and fuel storage issues. Section 8 describes our approach to assessing the upgrade of existing units.
3.2.3 Activity 3 – Electricity Supply and Demand Analysis
There are two elements to this Activity:
Review data on historical demand and existing demand forecasts and prepare regional/sub-regional power demand analysis.

Caribbean Regional Electricity Generation, Interconnection, and Fuels Supply Strategy – Final Report 3-2
Review data on existing supply (generation) and plans for new generation and prepare regional/sub-regional power supply analysis
As noted above, Section 6 covers current demand, describes our approach to forecasting future demand, and provides the results. As noted above, the data collection process provided the basic data on existing and planned generation contained in Section 5. Section 7 describes our approach to, and the results from, assessing fuel supply, fuel pricing, and fuel storage issues. Section 8 describes generation technologies and generation expansion options. The screening analysis described in Section 11 provides an initial evaluation of technologies and fuels that might be part of long-term supply (generation expansion) plans. The scenario analysis described in Section 12 provides our approach to establishing long-term supply plans for four scenarios.
3.2.4 Activity 4 – Pipeline Gas, LNG, CNG and Coal
Section 7 describes our approach to, and the results from, assessing fuel supply and fuel pricing for the Eastern Caribbean Gas Pipeline (ECGP), LNG, CNG, and coal.
3.2.5 Activity 5 – Renewable Energy (Hydro, Geothermal, Solar and Wind)
Activity 5 has four main components:
Assessment of renewable energy potential
Assessment of relevant renewable technologies and their and costs
Review and assessment of existing/proposed sub-regional renewable energy projects
Identification of regional/sub-regional renewable energy solutions to meet future power demand.
Section 8 describes our approach and the results for each of the first three items. Section 12 describes our approach to scenario analysis, which addresses the fourth bullet. Sections 13 and 14 provide the results from the analysis.
3.2.6 Activity 6 – Electricity Generation, Transmission and Interconnections
Activity 6 has three main components:
Assessment of power generation applications and technologies
Review and assessment of selected project analyses provided by regional utilities/organizations involving interconnections
Review of submarine transmission cable technologies and costs and assessment of interconnections among islands
Section 8 provides our approach to, and results for, the first bullet’s assessment of fossil fuel as well as renewable technologies. All proposed projects involving interconnections included geothermal power generation and submarine cable interconnection. Section 9 describes our approach to, and results for, the second bullet’s review and assessment of those projects, which also provides the review of submarine cable technologies of the third bullet. One

Caribbean Regional Electricity Generation, Interconnection, and Fuels Supply Strategy – Final Report 3-3
interconnection (Haiti – Dominican Republic) is neither a submarine cable nor proposed by a regional organization. Section 9 also provides our assessment of that interconnection.
3.2.7 Activity 7 – Identification and Assessment of Viable Regional/sub-regional Energy Solutions
As per TOR, Activity 7 has three main components:
Development of a regional/sub-regional energy supply plan using submarine cables
Development of a regional/sub-regional energy supply plan emphasizing new fuels and renewable
Provide more detailed technical advice on the most promising pipeline of the above-bulleted plans and provide project-specific advice on important issues
Section 12 describes our approach to scenario analysis, which addresses the first two bullets bullet. Section 13 provides the results from the analysis. Section 14 describes our approach to, and the results for, the third bullet.
3.2.8 Activity 8 – Reporting and Presentations
Three reports and a presentation comprise the Study’s deliverables. All reports will be delivered in electronic format only. An electronic file containing the presentation will also be delivered.
The Inception Report was the first report and was delivered on June 5, 2009.
The Interim Report, originally titled the Draft Final Report, was the second report and was delivered on November 30, 2009.
This Final Report is the third report. It differs from the Interim Report primarily in addressing the comments received from the World Bank and other reviewers.
A dissemination visit to deliver a Presentation covering the Study and its results to relevant governments and regional bodies is planned following the delivery of the Final Report.

Caribbean Regional Electricity Generation, Interconnection, and Fuels Supply Strategy – Final Report 4-1
Section 4 Data
4.1 DATA COLLECTION PROCESS
Our work in each activity area was data-driven and relied on basic data. Data collection included the following main steps:
The World Bank provided considerable information at the start of the Study
Prepared and delivered data request for utilities, with a goal to acquire data on their generation and transmission systems, fuel, plans, etc.
Visited each utility during the kick-off mission and later visits to collect and discuss data
Followed up to fill holes in data
Collected data from publicly available sources such as the Energy Information Administration, Electric Power Research Institute, utilities’ web sites, the United States Department of Energy, the National Energy Research Laboratory, etc.
Contacted vendors for price and performance information
Used information from previous Nexant studies and related work
The objective of the kick-off mission was to initiate the Study by visiting CARILEC headquarters in St. Lucia and utilities and other organizations in nine countries. The goals for the meetings were to have face-to-face discussions of the issues, and to collect whatever data was available at that time. Three Teams, each consisting of one representative from Nexant and one from the World Bank, conducted the Mission:
Team A: Franz Gerner from the World Bank and Peter Hindley from Nexant visited St. Lucia, Martinique, and Dominica
Team B: Michael Levitsky from the World Bank and Babul Patel from Nexant visited Antigua, St. Kitts and Nevis, and St. Vincent and the Grenadines
Team C: Alan Townsend from the World Bank and Bruce Degan from Nexant visited Trinidad and Tobago, Barbados, and Grenada
Before and as a part of arranging the kick-off mission meetings, the World Bank distributed a Questionnaire and Data Entry Template to request the data needed to conduct the Study. Attachment A provides those two documents.
The focus of the Study is on the nine Caribbean International Development Association (IDA) and International Bank for Reconstruction and Development (IBRD) countries, but will also address other relevant countries if they are part of a regional energy solution. Of the nine countries visited during the kick-off mission, six are IDA/IBRD countries with a combined population of 600,000; the three that are not are Martinique (a department of France), Trinidad and Tobago, and Barbados. The three IDA/IBRD countries visited later are Dominican Republic, Haiti, and Jamaica, all in the Greater Antilles, with a combined population of about

Caribbean Regional Electricity Generation, Interconnection, and Fuels Supply Strategy – Final Report 4-2
22,000,000 that dwarfs the 600,000 combined population of the other six, all in the Lesser Antilles. We also visited the Cayman Islands during a later trip.
The Teams met with the electric utilities and many other relevant organizations. Attachment D summarizes the meetings, organizations, and people met in each country.

Caribbean Regional Electricity Generation, Interconnection, and Fuels Supply Strategy – Final Report 5-1
Section 5 Existing and Planned Generation, Summary of Transmission
5.1 EXISTING AND PLANNED GENERATION PLANTS
Table 5-2 lists existing generating units for which data was provided. Table 5-3 lists planned and other candidate units. Where data was missing, we filled in holes with representative values depending on the fuel, any de-ratings, age, and other factors.
For the existing units, the column titled “# of Identical Units” means just that. For the planned and candidate units, a number greater than zero means the unit is “committed”. Committed projects are those projects not yet operational that are sufficiently far along in planning or construction that they are assumed to be built. This means that they are not subject to displacement by other planned or optional resources. If the number zero appears in that column, it means the unit is not committed, but one or more such units can be added to the generation expansion plan if necessary.
The abbreviations used in Tables 5-2 and 5-3 have the following meanings:
Abbreviations for Plant Technologies
MSD - medium speed diesel LSD - slow speed diesel Wind ST - steam turbine CC - combined cycle GT - simple cycle gas turbine HY – hydro Geo – geothermal PV - solar photovoltaics CFB - circulating fluidized bed CvCoal - conventional coal Cogen - cogeneration, must-take
Abbreviations of Fuel Types
D – Distillate H – HFO R - Renewable (Hydro, Solar, Wind) G – Geothermal C – Coal N - Natural Gas L – LNG DL - Distillate/Natural Gas HL - HFO/Natural Gas

Caribbean Regional Electricity Generation, Interconnection, and Fuels Supply Strategy – Final Report 5-2
Table 5-1 Fuels, Fuel Types, and Where the Fuel Prices Apply
Name of Fuel Fuel Type Areas Where Prices Apply Distillate D All Study Countries HFO H All Study Countries LNG Dom Rep L Dominican Republic LNG Haiti L Haiti LNG Jam L Jamaica GP Barb N Barbados GP Mart N Martinique GP StL N St. Lucia GP Guad N Guadeloupe Coal 10&20MW C Antigua and Barbuda, Grenada, St. Vincent and
Grenadines Coal 25MW C St. Lucia Coal 25&50MW C Barbados, Guadeloupe, Haiti, Martinique Coal 100&200MW C Jamaica Coal 200&500MW C Dominican Republic Geo G Geothermal for all Study Countries Wind R Wind for all Study Countries Solar R PV and CSP for all Study Countries Hydro R Hydro for all Study Countries

Caribbean Regional Electricity Generation, Interconnection, and Fuels Supply Strategy – Final Report 5-3
Table 5-2 Existing Generating Units
NameTech-nology
Unit Name-
plate Net Capacity
(MW)
Unit Current Net
Capacity, MW (May
Be Derated)
# of Iden-tical Units
Plant Current
Net Capac-
ity (MW)
Fuel (Primary)
Fuel Type
Heat Rate @ Max
Capac for Thermal
Units (kJ/kWh)
O&M Cost (US$ per
MWh)
O&M Cost (US$
per kW-yr)
Planned Main-
tenance Rate (%)
Forced Outage
Rate (%)
Capacity Factor, %, (for Hydro,
Renew-ables, Must-
run)
Retire-ment
Year if any (end of year)
Avail-able Year
(begin-ning of year)
Over-night
Capital Cost (2009
$/kW)
Antigua and Barbuda - ExistingAPC (Pant) MSD 5.00 3.75 4 15.00 Distillate D 9,000 5.0 35 15% 10%APC Blk Pine LSD 6.50 6.00 2 12.00 Distillate D 8,000 4.0 40 13% 7%APC Blk Pine LSD 7.50 7.00 2 14.00 Distillate D 8,000 4.0 40 13% 7%APC Blk Pine LSD 17.00 0.00 1 0.00 Distillate D 8,000 4.0 30 12% 8%Baker MSD 5.10 4.00 1 4.00 Distillate D 9,000 5.0 35 15% 10%APC Jt Vent MSD 17.00 17.00 1 17.00 Distillate D 8,000 4.0 30 12% 8%Victor LSD 13.00 4.00 2 8.00 Distillate D 8,500 5.0 40 15% 10%WIOC MSD 5.20 0.00 2 0.00 Distillate D 15,000 20.0 50 20% 20%Aggreko Rental MSD 1.00 1.00 13 13.00 Distillate D 10,000 6.0 40 15% 10%Barbuda MSD 3.60 3.60 2 7.20 Distillate D 9,000 5.0 35 13% 9%
90.20 << Total Existing Generation, MWBarbados - ExistingSpring Garden LSD 12.80 12.50 2 25.00 Distillate D 8,000 4.0 40 13% 7% 1982Spring Garden LSD 13.40 13.20 1 13.20 Distillate D 8,000 4.0 40 13% 7% 1986Spring Garden LSD 13.40 13.20 1 13.20 Distillate D 8,000 4.0 40 13% 7% 1990Spring Garden LSD 30.50 30.50 2 61.00 Distillate D 7,895 4.0 40 13% 7% 2003Spring Garden ST 20.00 20.00 2 40.00 HFO H 12,000 6.0 25 11% 11% 1976Sewall GT 43.00 43.00 2 86.00 Distillate D 12,000 6.0 8 5% 5%
238.40 << Total Existing Generation, MWDominica - ExistingHydro – three plants HY 7.60 5.00 1 5.00 Hydro R 10.0 70 10% 5% 50% < AssumedThermal – two plants MSD 4.00 4.00 4 16.00 Distillate D 10,000 10.0 40 15% 15%
21.00 << Total Existing Generation, MW

Caribbean Regional Electricity Generation, Interconnection, and Fuels Supply Strategy – Final Report 5-4
NameTech-nology
Unit Name-
plate Net Capacity
(MW)
Unit Current Net
Capacity, MW (May
Be Derated)
# of Iden-tical Units
Plant Current
Net Capac-
ity (MW)
Fuel (Primary)
Fuel Type
Heat Rate @ Max
Capac for Thermal
Units (kJ/kWh)
O&M Cost (US$ per
MWh)
O&M Cost (US$
per kW-yr)
Planned Main-
tenance Rate (%)
Forced Outage
Rate (%)
Capacity Factor, %, (for Hydro,
Renew-ables, Must-
run)
Retire-ment
Year if any (end of year)
Avail-able Year
(begin-ning of year)
Over-night
Capital Cost (2009
$/kW)
Dominican Republic - ExistingAES Dominica
Andres CC 319.00 290.00 1 290.00G Dom Rep L 8,139 3.0 30 6% 6% 2003Itabo ST 128.00 128.00 1 128.0000&500MW C 11,642 4.0 30 11% 6% 1984Itabo ST 132.00 101.00 1 101.0000&500MW C 11,642 8.0 35 13% 8% 1984Los Mina GT 118.00 118.00 2 236.00G Dom Rep L 13,252 6.0 20 5% 5% 1996Itabo GT 34.50 34.50 1 34.50 Distillate D 12,857 7.0 9 6% 6% 1998Higuamo GT 34.50 0.00 0 0.00 Distillate D 12,857 20.0 65 20% 20% 1998
HainaHaina ST 54.00 50.00 2 100.00 HFO H 12,721 4.0 30 12% 7%Haina ST 84.90 72.00 1 72.00 HFO H 12,000 5.0 35 13% 8%San Pedro ST 33.00 33.00 1 33.00 HFO H 12,721 3.0 30 11% 6%Puerto Plata ST 27.60 27.60 1 27.60 HFO H 12,721 3.0 30 11% 6%Puerto Plata ST 39.00 39.00 1 39.00 HFO H 12,721 3.0 30 11% 6%Haina GT 100.00 100.00 1 100.00 Distillate D 11,803 6.0 8 5% 5%Barahona ST 53.60 45.60 1 45.60 00&500MW C 12,857 6.0 35 13% 8%Sultana DE LSD 17.00 11.33 9 102.00 HFO H 8,219 8.0 40 15% 12% 2001
CESPMCESPM. CC 100.00 100.00 3 300.00 Distillate D 7,826 3.0 30 6% 6%San Felipe CC 185.00 185.00 1 185.00 Distillate D 9,677 4.0 35 7% 7%
GPLV 2.9 36 12% 6%Palamara LSD 107.00 107.00 1 107.00 HFO H 8,858 5.0 40 14% 8%La Vega LSD 87.50 87.50 1 87.50 HFO H 8,918 5.0 40 14% 8%
IPPSCEPP LSD 18.70 16.50 1 16.50 HFO H 9,618 5.0 40 14% 8%CEPP LSD 58.10 50.00 1 50.00 HFO H 9,618 5.0 40 14% 8%Seaboard LSD 43.00 43.00 1 43.00 HFO H 9,254 5.0 40 14% 8%Seaboard LSD 73.30 73.30 1 73.30 HFO H 8,592 5.0 40 14% 8%Monte Rio LSD 100.00 100.00 1 100.00 HFO H 8,372 5.0 40 14% 8%Metaldom LSD 42.00 42.00 1 42.00 HFO H 8,996 5.0 40 14% 8%Laesa LSD 31.60 31.60 1 31.60 HFO H 12,000 5.0 40 14% 8%Maxon LSD 30.00 30.00 1 30.00 Distillate D 10,087 4.0 35 13% 7%Falconbridge ST 66.00 12.00 3 36.00 HFO H 12,483 5.0 35 13% 8%EGEHID (State-owned hydro company)Reservoir Hydro HY 387.10 387.10 1 387.10 Hydro R 5.0 40 7% 7% 37%Non Reser Hydro HY 85.20 85.20 1 85.20 Hydro R 5.0 40 7% 7% 37%
2,883 << Total Existing Generation, MW

Caribbean Regional Electricity Generation, Interconnection, and Fuels Supply Strategy – Final Report 5-5
NameTech-nology
Unit Name-
plate Net Capacity
(MW)
Unit Current Net
Capacity, MW (May
Be Derated)
# of Iden-tical Units
Plant Current
Net Capac-
ity (MW)
Fuel (Primary)
Fuel Type
Heat Rate @ Max
Capac for Thermal
Units (kJ/kWh)
O&M Cost (US$ per
MWh)
O&M Cost (US$
per kW-yr)
Planned Main-
tenance Rate (%)
Forced Outage
Rate (%)
Capacity Factor, %, (for Hydro,
Renew-ables, Must-
run)
Retire-ment
Year if any (end of year)
Avail-able Year
(begin-ning of year)
Over-night
Capital Cost (2009
$/kW)
Grenada - ExistingQueens Park LSD 5.50 5.50 3 16.50 Distillate D 9,000 11.0 26 16% 9%Queens Park LSD 8.00 8.00 2 16.00 Distillate D 9,000 11.0 26 16% 9%Queens Park LSD 8.00 8.00 2 16.00 Distillate D 9,000 11.0 26 16% 9%
48.50 << Total Existing Generation, MWHaiti - ExistingVarreau PAP EDH MSD 17.00 8.50 4 34.00 Distillate D 9,000 5.0 40 15% 10%Carrefour PAP EDH MSD 8.00 4.00 6 24.00 Distillate D 9,000 5.0 40 15% 10%Peligre PAP EDH HY 18.00 9.00 3 27.00 Hydro R 30%Varreau PAP Sogener IPPs MSD 2.00 1.00 20 20.00 Distillate D 11,000 15.0 40 15% 12% ^^ Assumed 30% cap factorCarrefour PAP IPP MSD 2.00 1.00 10 10.00 Distillate D 11,000 15.0 40 15% 12%Thermal in Provinces MSD 4.00 2.00 18 36.00 Distillate D 11,000 15.0 40 15% 12%Hydro in Provinces HY 2.00 1.00 4 4.00 Hydro R 10.0 80 10% 10% 30%
155.00 << Total Existing Generation, MW ^^ Assumed 30% cap factor

Caribbean Regional Electricity Generation, Interconnection, and Fuels Supply Strategy – Final Report 5-6
NameTech-nology
Unit Name-
plate Net Capacity
(MW)
Unit Current Net
Capacity, MW (May
Be Derated)
# of Iden-tical Units
Plant Current
Net Capac-
ity (MW)
Fuel (Primary)
Fuel Type
Heat Rate @ Max
Capac for Thermal
Units (kJ/kWh)
O&M Cost (US$ per
MWh)
O&M Cost (US$
per kW-yr)
Planned Main-
tenance Rate (%)
Forced Outage
Rate (%)
Capacity Factor, %, (for Hydro,
Renew-ables, Must-
run)
Retire-ment
Year if any (end of year)
Avail-able Year
(begin-ning of year)
Over-night
Capital Cost (2009
$/kW)
Jamaica - ExistingJPS OwnedOld Harbour ST 33.00 28.60 1 28.60 HFO H 13,433 3.0 30 11% 6% 2014 1968Old Harbour ST 60.00 57.00 1 57.00 HFO H 13,433 3.0 30 11% 6% 2022 1970Old Harbour ST 68.50 61.80 1 61.80 HFO H 13,433 3.0 30 11% 6% 2024 1972Old Harbour ST 68.50 65.10 1 65.10 HFO H 13,433 3.0 30 11% 6% 1973Hunts Bay ST 68.50 65.10 1 65.10 HFO H 13,433 3.0 30 11% 6% 2026 1976Hunts Bay GT 22.50 21.40 1 21.40 Distillate D 14,754 6.0 9 5% 5% 1974Hunts Bay GT 33.00 32.10 0 0.00 Distillate D 14,754 6.0 9 5% 5% 1993Rockfort LSD 20.00 17.30 2 34.60 HFO H 9,626 5.0 40 14% 8% 2020 1985Bogue GT 22.80 21.40 1 21.40 Distillate D 14,400 6.0 9 5% 5% 1974Bogue GT 18.50 13.90 3 41.70 Distillate D 16,744 8.0 15 8% 8% 1990-92Bogue GT 20.50 19.90 2 39.80 Distillate D 13,333 6.0 9 5% 5% 2001-2002Bogue CC 111.00 111.00 1 111.00 Distillate D 8,845 6.0 16 5% 5% 2003
IPPSJEP OwnedJEP Barge 1 MSD 9.30 9.20 8 73.60 HFO H 8,571 5.0 40 14% 8% 1996JEP Barge 2 MSD 12.50 12.40 4 49.60 HFO H 8,571 5.0 40 14% 8% 2006JPPC Owned LSD 30.00 30.00 2 60.00 HFO H 8,372 5.0 40 14% 8% 2015 1999Jamalco Cogen 11.00 11.00 1 11.00 HFO H 9,499 15.0 25 12% 7% 15%Alumina Producers 150.00 0.00 5.0 40 14% 8%Sugar 23.50 0.00Wigton Wind 20.00 7.00 1 7.00 Wind R 4.0 35 5% 9% 78% < Based on 47.7 GWH
HY 23.00 20.40 1 20.40 Hydro R 4.0 40 6% 6%769.10 << Total Existing Generation, MW

Caribbean Regional Electricity Generation, Interconnection, and Fuels Supply Strategy – Final Report 5-7
NameTech-nology
Unit Name-
plate Net Capacity
(MW)
Unit Current Net
Capacity, MW (May
Be Derated)
# of Iden-tical Units
Plant Current
Net Capac-
ity (MW)
Fuel (Primary)
Fuel Type
Heat Rate @ Max
Capac for Thermal
Units (kJ/kWh)
O&M Cost (US$ per
MWh)
O&M Cost (US$
per kW-yr)
Planned Main-
tenance Rate (%)
Forced Outage
Rate (%)
Capacity Factor, %, (for Hydro,
Renew-ables, Must-
run)
Retire-ment
Year if any (end of year)
Avail-able Year
(begin-ning of year)
Over-night
Capital Cost (2009
$/kW)
Martinique - Existing 8000.0
Bellefontaine MSD 20.00 20.00 10 200.00 Distillate D 8,000 4.0 30 12% 8%2011-2013 1984-96
Bellefontaine GT 23.00 23.00 1 23.00 Distillate D 11,900 6.0 8 5% 5% 1993Pointe de Carrieres LSD 43.00 43.00 2 86.00 Distillate D 7,800 5.0 40 14% 8% 1997-98Pointe de Carrieres GT 20.00 8.00 1 8.00 Distillate D 11,900 6.0 10 6% 6% 2010 1981Pointe de Carrieres GT 20.00 20.00 2 40.00 Distillate D 11,900 6.0 8 5% 5% 1990SARA 16 GWH/yr Cogen 4.50 4.50 1 4.50 Distillate D 8,300 15.0 25 12% 7% 41% 16 GWH 1997MV/UIOM 30 GWH/yr MW 4.00 4.00 1 4.00 Muni O 14,400 8.0 40 11% 6% 86% 30 GWH 2002SIDEC/Galion GT 40.00 40.00 1 40.00 Distillate D 11,100 6.0 8 5% 5% 2007Rooftop solar PV 0.05 0.05 120 6.00 Solar R 4.5 50 2% 4% 16% <EDF #Thru 2008Ferme éolienne du Wind 1.00 1.00 1 1.00 Wind R 2.3 25 4% 8% 18% < EDF #Thru 2008
412.50 << Total Existing Generation, MWSt. Kitts - ExistingStation A LSD 6.10 6.10 1 6.10 Distillate D 7,900 5.0 35 13% 9%Station A LSD 7.90 7.90 1 7.90 Distillate D 7,900 5.0 35 13% 9%Station B MSD 4.40 4.40 2 8.80 Distillate D 8,400 5.0 35 13% 9%Station C MSD 3.60 3.60 2 7.20 Distillate D 8,400 5.0 35 13% 9%Station C MSD 3.50 3.50 1 3.50 Distillate D 8,400 5.0 35 13% 9%New Units LSD 4.00 4.00 2 8.00 Distillate D 7,900 5.0 35 13% 9%
33.50 << Total Existing Generation, MWNevis - Existing#2 & #3 MSD 0.92 0.92 2 1.84 Distillate D 8,800 10.0 45 15% 10% 1983, 1985#4, #6 MSD 2.20 2.20 2 4.40 Distillate D 8,600 8.0 40 15% 10% 1989, 1997#5, #7 MSD 2.50 2.50 2 5.00 Distillate D 8,600 8.0 40 15% 10% 1996, 2000#8 MSD 2.70 2.70 1 2.70 Distillate D 8,600 8.0 40 15% 10% 2003
13.94 << Total Existing Generation, MW

Caribbean Regional Electricity Generation, Interconnection, and Fuels Supply Strategy – Final Report 5-8
NameTech-nology
Unit Name-
plate Net Capacity
(MW)
Unit Current Net
Capacity, MW (May
Be Derated)
# of Iden-tical Units
Plant Current
Net Capac-
ity (MW)
Fuel (Primary)
Fuel Type
Heat Rate @ Max
Capac for Thermal
Units (kJ/kWh)
O&M Cost (US$ per
MWh)
O&M Cost (US$
per kW-yr)
Planned Main-
tenance Rate (%)
Forced Outage
Rate (%)
Capacity Factor, %, (for Hydro,
Renew-ables, Must-
run)
Retire-ment
Year if any (end of year)
Avail-able Year
(begin-ning of year)
Over-night
Capital Cost (2009
$/kW)
St. Lucia - ExistingCul de Sac MSD 6.00 6.00 2 12.00 Distillate D 8,500 5.0 35 13% 9% 1990 / NACul de Sac MSD 6.30 6.30 1 6.30 Distillate D 8,500 5.0 35 13% 9% 1994 / NACul de Sac MSD 9.30 9.30 4 37.20 Distillate D 8,300 5.0 35 13% 9% 1998 / NACul de Sac MSD 10.20 10.30 2 20.60 Distillate D 8,300 5.0 35 13% 9% 2007 / NA
Rooftop solar PV 0.01 0.01 10 0.10 4.5 50 2% 4% 16% < EDF #Thru 200876.20 << Total Existing Generation, MW
St. Vincent and the Grenadines - ExistingSt. Vincent MSD 12.10 12.00 1 12.00 Distillate D 8,300 5.0 35 13% 9% NASt. Vincent HY 3.67 2.50 1 2.50 Hydro 10.0 70 10% 5% 30% Est 1951Lowmans Bay LSD 17.40 17.40 2 34.80 Distillate D 7,800 4.0 40 13% 7% 2005Bequia MSD 2.90 2.90 1 2.90 Distillate D 8,600 8.0 40 15% 10%Union Island MSD 1.27 1.27 2 2.54 Distillate D 9,000 8.0 40 15% 10% 1974Canouan MSD 3.10 3.10 1 3.10 Distillate D 8,600 8.0 40 15% 10% 1994Mayreay MSD 0.18 0.18 1 0.18 Distillate D 10,200 10.0 45 15% 10% 2003
58.02 << Total Existing Generation, MW

Caribbean Regional Electricity Generation, Interconnection, and Fuels Supply Strategy – Final Report 5-9
Table 5-3 Planned Generating Units
NameTech-nology
Unit Name-
plate Net Capacity
(MW)
Unit Current Net
Capacity, MW (May
Be Derated)
# of Iden-tical Units
Plant Current
Net Capac-
ity (MW)
Fuel (Primary)
Fuel Type
Heat Rate @ Max
Capac for Thermal
Units (kJ/kWh)
O&M Cost (US$ per
MWh)
O&M Cost (US$
per kW-yr)
Planned Main-
tenance Rate (%)
Forced Outage
Rate (%)
Capacity Factor, %, (for Hydro,
Renew-ables, Must-
run)
Retire-ment
Year if any (end of year)
Avail-able Year
(begin-ning of year)
Over-night
Capital Cost (2009
$/kW)
Antigua and Barbuda - NewCasada Gardens MSD 5.00 5.00 6 30.00 Distillate D 8,000 3.6 29 12% 8% 2011 45010 MW MSD MSD 10.00 10.00 0 0.00 Distillate D 7,800 3.4 28 12% 8% 2012 450
10 MW CFB CFB 10.00 10.00 0 0.00Coal
10&20MW C 10,300 2.9 36 10% 10% 2013 2,550Wind Wind 1.50 1.50 0 0.00 Wind R N/A 2.3 25 4% 8% 32% 2014 1,250PV PV 0.50 0.50 0 0.00 Solar R N/A 4.2 50 2% 4% 15% 2014 5,200
30.00 << Total Committed New Plants, MWBarbados - NewTrent LSD 16.00 16.00 2 32.00 Distillate D 7,676 3.6 29 12% 8% N/A N/A 2012 450Trent LSD 16.00 16.00 2 32.00 Distillate D 7,676 3.6 29 12% 8% N/A N/A 2013 450Trent LSD 16.00 16.00 1 16.00 Distillate D 7,676 3.6 29 12% 8% N/A N/A 2015 450Trent LSD 16.00 16.00 4 64.00 Distillate D 7,676 3.6 29 12% 8% N/A N/A 2012 450Trent CC 30.00 30.00 2 60.00 Distillate D 9,000 1.8 28 4% 4% N/A N/A 2013 1,05020 MW LSD LSD 20.00 20.00 0 0.00 Distillate D 7,400 2.9 36 12% 6% N/A N/A 2014 48020 MW LSD LSD 20.00 20.00 0 0.00 GP Barb N 7,400 2.9 36 12% 6% N/A N/A 2014 480Wind Wind 1.50 1.50 0 0.00 Wind R N/A 2.3 25 4% 8% 32% N/A 2014 1,250PV PV 0.50 0.50 0 0.00 Solar R N/A 4.2 50 2% 4% 15% N/A 2014 5,200
204.00 << Total Committed New Plants, MWDominica - New5 MW MSD MSD 5.00 5.00 0 0.00 Distillate D 8,000 3.6 29 12% 8% 2014 450Geo 20 MW Geo 20.00 20.00 0 0.00 Geo G N/A 2.6 73 10% 10% 80% 2014 2,800Geo 100 MW Geo 100.00 100.00 0 0.00 Geo G N/A 2.6 68 10% 10% 80% 2014 2,604Wind Wind 1.50 1.50 0 0.00 Wind R N/A 2.3 25 4% 8% 32% 2014 1,250PV PV 0.50 0.50 0 0.00 Solar R N/A 4.2 50 2% 4% 15% 2014 5,200
0.00 << Total Committed New Plants, MW

Caribbean Regional Electricity Generation, Interconnection, and Fuels Supply Strategy – Final Report 5-10
NameTech-nology
Unit Name-
plate Net Capacity
(MW)
Unit Current Net
Capacity, MW (May
Be Derated)
# of Iden-tical Units
Plant Current
Net Capac-
ity (MW)
Fuel (Primary)
Fuel Type
Heat Rate @ Max
Capac for Thermal
Units (kJ/kWh)
O&M Cost (US$ per
MWh)
O&M Cost (US$
per kW-yr)
Planned Main-
tenance Rate (%)
Forced Outage
Rate (%)
Capacity Factor, %, (for Hydro,
Renew-ables, Must-
run)
Retire-ment
Year if any (end of year)
Avail-able Year
(begin-ning of year)
Over-night
Capital Cost (2009
$/kW)
Dominican Republic - NewPinalto HY 50.00 50.00 1 50.00 Hydro R 3.2 32 5% 5% 33% ? 2009 2,500Palomino HY 100.00 100.00 1 100.00 Hydro R 3.2 32 5% 5% 17% ? 2009 2,500Hatillo et al HY 17.00 17.00 1 17.00 Hydro R 3.2 32 5% 5% 83% 0 2,500Las Placetas HY 87.00 87.00 1 87.00 Hydro R 3.2 32 5% 5% 43% 2010 2,500Arbonito HY 45.00 45.00 1 45.00 Hydro R 3.2 32 5% 5% 32% 2011 2,500Hondo Valle et al HY 57.00 57.00 1 57.00 Hydro R 3.2 32 5% 5% 44% ? 2,500TBD HY 159.00 159.00 0 0.00 Hydro R 3.2 32 5% 5% 28% 2,500TBD HY 57.00 57.00 0 0.00 Hydro R 3.2 32 5% 5% 38% 2,500TBD HY 405.00 405.00 0 0.00 Hydro R 3.2 32 5% 5% 24% 2,500Montafongo,Bani Wind 50.00 50.00 1 50.00 Wind R 2.3 25 4% 8% 29% 1,250El Norte Wind 50.00 50.00 1 50.00 Wind R 2.3 25 4% 8% 29% 1,250
Montecristi ST 305.00 305.00 0 0.00
Coal 200&500M
W C 9,103 1.9 25 10% 5% 2014 2,000
Haltillo-Azua ST 305.00 305.00 0 0.00
Coal 200&500M
W C 9,103 1.9 25 10% 5% 2016 2,000
50 MW GT GT 50.00 50.00 0 0.00LNG Dom
Rep N 10,500 4.4 15 4% 4% 2014 450
300 MW CC CC 300.00 300.00 0 0.00LNG Dom
Rep D 7,600 1.5 24 4% 4% 2014 950
300 MW ConvCoal CvCoal 300.00 300.00 0 0.00
Coal 200&500M
W N 9,103 1.9 25 10% 5% 2014 2,000Wind Wind 1.50 1.50 0 0.00 Wind R N/A 2.3 25 4% 8% 32% 2014 1,250PV PV 0.50 0.50 0 0.00 Solar R N/A 4.2 50 2% 4% 15% 2014 5,200
456.00 << Total Committed New Plants, MW

Caribbean Regional Electricity Generation, Interconnection, and Fuels Supply Strategy – Final Report 5-11
NameTech-nology
Unit Name-
plate Net Capacity
(MW)
Unit Current Net
Capacity, MW (May
Be Derated)
# of Iden-tical Units
Plant Current
Net Capac-
ity (MW)
Fuel (Primary)
Fuel Type
Heat Rate @ Max
Capac for Thermal
Units (kJ/kWh)
O&M Cost (US$ per
MWh)
O&M Cost (US$
per kW-yr)
Planned Main-
tenance Rate (%)
Forced Outage
Rate (%)
Capacity Factor, %, (for Hydro,
Renew-ables, Must-
run)
Retire-ment
Year if any (end of year)
Avail-able Year
(begin-ning of year)
Over-night
Capital Cost (2009
$/kW)
Grenada - New10 MW MSD MSD 10.00 10.00 0 0.00 Distillate D 7,800 3.4 28 12% 8% 2014 450
10 MW CFB CFB 10.00 10.00 0 0.00Coal
10&20MW C 10,300 2.9 36 10% 10% 2014 2,550Wind Wind 1.50 1.50 0 0.00 Wind R N/A 2.3 25 4% 8% 32% 2014 1,250PV PV 0.50 0.50 0 0.00 Solar R N/A 4.2 50 2% 4% 15% 2014 5,200
0.00 << Total New Plants, MWHaiti - NewE-Power LSD 30.00 30.00 1 30.00 Distillate D 7,800 2.9 36 12% 6% 2010 480Gov of Brazil HY 15.00 15.00 2 30.00 N/A R 3.2 32 5% 5% 30% 2013 2,50020 MW LSD LSD 20.00 20.00 0 0.00 Distillate D 7,400 2.9 36 12% 6% 2014 48020 MW LSD LSD 20.00 20.00 0 0.00 LNG Haiti N 7,400 2.9 36 12% 6% 2014 480Wind Wind 1.50 1.50 0 0.00 Wind R N/A 2.3 25 4% 8% 32% 2014 1,250PV PV 0.50 0.50 0 0.00 Solar R N/A 4.2 50 2% 4% 15% 2014 5,200
60.00 << Total Committed New Plants, MWJamaica - NewKingston LSD 11.40 11.40 6 68.40 Distillate D 7,692 2.9 36 12% 6% 2010-11 480
Hunts Bay Petcoke ST 120.00 120.00 1 120.00
Coal 100&200M
W C 10,909 2.0 27 10% 5% 2012 2,200
Windalco Cogen 60.00 60.00 2 120.00
Coal 100&200M
W C 7,000 2.0 27 10% 5% 40% Est 2011-201 2,200Jamalco Cogen 85.00 85.00 1 85.00 Distillate D 10,909 1.8 28 4% 4% 40% Est 2012 1,050Wigton Wind 2.00 2.00 9 18.00 Wind R N/A 2.3 25 4% 8% 32% 0.00 2014 1,250
50 MW GT GT 50.00 50.00 0 0.00 LNG Jam D 10,500 4.4 15 4% 4% 2014 450100 MW CC CC 100.00 100.00 0 0.00 LNG Jam D 7,893 1.8 28 4% 4% 2014 1,05050 MW GT GT 50.00 50.00 0 0.00 Distillate D 10,500 4.4 15 4% 4% 2014 450
100 MW ConvCoal CvCoal 100.00 100.00 0 0.00
Coal 100&200M
W C 9,224 2.0 27 10% 5% 2014 2,200Wind Wind 1.50 1.50 0 0.00 Wind R N/A 2.3 25 4% 8% 32% 2014 1,250PV PV 0.50 0.50 0 0.00 Solar R N/A 4.2 50 2% 4% 15% 2014 5,200
411.40 << Total Committed New Plants, MW

Caribbean Regional Electricity Generation, Interconnection, and Fuels Supply Strategy – Final Report 5-12
NameTech-nology
Unit Name-
plate Net Capacity
(MW)
Unit Current Net
Capacity, MW (May
Be Derated)
# of Iden-tical Units
Plant Current
Net Capac-
ity (MW)
Fuel (Primary)
Fuel Type
Heat Rate @ Max
Capac for Thermal
Units (kJ/kWh)
O&M Cost (US$ per
MWh)
O&M Cost (US$
per kW-yr)
Planned Main-
tenance Rate (%)
Forced Outage
Rate (%)
Capacity Factor, %, (for Hydro,
Renew-ables, Must-
run)
Retire-ment
Year if any (end of year)
Avail-able Year
(begin-ning of year)
Over-night
Capital Cost (2009
$/kW)
Martinique - New
SIDEC/Galion CFB 34.00 34.00 1 34.00Coal
25&50MW C 10,300 2.5 30 10% 10% 2,000Rooftop solar PV 0.01 0.01 7200 36.00 N/A R 4.5 50 2% 4% 16% From existing 5,800Ferme éolienne du Vauclin Wind 1.00 1.00 39 39.00 N/A R 2.3 25 4% 8% 21% From existing 1,250
20 MW LSD LSD 20.00 20.00 0 0.00 Distillate D 7,400 2.9 36 12% 6% 2014 48020 MW LSD LSD 20.00 20.00 0 0.00 GP Mart N 7,400 2.9 36 12% 6% 2014 480Wind Wind 1.50 1.50 0 0.00 Wind R N/A 2.3 25 4% 8% 32% 2014 1,250PV PV 0.50 0.50 0 0.00 Solar R N/A 4.2 50 2% 4% 15% 2014 5,200
109.00 << Total Committed New Plants, MWSt. Kitts - New5 MW MSD MSD 5.00 5.00 0 0.00 Distillate D 8,000 3.6 29 12% 8% 2014 450Wind Wind 1.50 1.50 0 0.00 Wind R N/A 2.3 25 4% 8% 32% 2014 1,250PV PV 0.50 0.50 0 0.00 Solar R N/A 4.2 50 2% 4% 15% 2014 5,200
0.00 << Total Committed New Plants, MWNevis - New5 MW MSD MSD 5.00 5.00 0 0.00 Distillate D 8,000 3.6 29 12% 8% 2014 450Geo 20 MW Geo 20.00 20.00 0 0.00 Geo G N/A 2.6 73 10% 10% 80% 2014 2,800Geo 100 MW Geo 100.00 100.00 0 0.00 Geo G N/A 2.6 68 10% 10% 80% 2014 2,604Wind Wind 1.50 1.50 0 0.00 Wind R N/A 2.3 25 4% 8% 32% 2014 1,250PV PV 0.50 0.50 0 0.00 Solar R N/A 4.2 50 2% 4% 15% 2014 5,200
0.00 << Total Committed New Plants, MW

Caribbean Regional Electricity Generation, Interconnection, and Fuels Supply Strategy – Final Report 5-13
NameTech-nology
Unit Name-
plate Net Capacity
(MW)
Unit Current Net
Capacity, MW (May
Be Derated)
# of Iden-tical Units
Plant Current
Net Capac-
ity (MW)
Fuel (Primary)
Fuel Type
Heat Rate @ Max
Capac for Thermal
Units (kJ/kWh)
O&M Cost (US$ per
MWh)
O&M Cost (US$
per kW-yr)
Planned Main-
tenance Rate (%)
Forced Outage
Rate (%)
Capacity Factor, %, (for Hydro,
Renew-ables, Must-
run)
Retire-ment
Year if any (end of year)
Avail-able Year
(begin-ning of year)
Over-night
Capital Cost (2009
$/kW)
St. Lucia - New20 MW LSD LSD 20.00 20.00 0 0.00 Distillate D 7,400 2.9 36 12% 6% 2014 48020 MW LSD LSD 20.00 20.00 0 0.00 GP StL N 7,400 2.9 36 12% 6% 2014 480Wind Wind 1.50 1.50 0 0.00 Wind R N/A 2.3 25 4% 8% 32% 2014 1,250PV PV 0.50 0.50 0 0.00 Solar R N/A 4.2 50 2% 4% 15% 2014 5,200
0.00 << Total Committed New Plants, MWSt. Vincent and the Grenadines - New10 MW MSD MSD 10.00 10.00 0 0.00 Distillate D 7,800 3.4 28 12% 8% 2014 450
10 MW CFB CFB 10.00 10.00 0 0.00Coal
10&20MW C 10,300 2.9 36 10% 10% 2014 2,550Wind Wind 1.50 1.50 0 0.00 Wind R N/A 2.3 25 4% 8% 32% 2014 1,250PV PV 0.50 0.50 0 0.00 Solar R N/A 4.2 50 2% 4% 15% 2014 5,200
0.00 << Total Committed New Plants, MW

Caribbean Regional Electricity Generation, Interconnection, and Fuels Supply Strategy – Final Report 5-14
5.2 EXISTING TRANSMISSION SYSTEMS
A review of the transmission systems in the various countries is not an important part of this Study. The frequency and highest voltage of the transmission systems, as shown in Table 5-4, are useful in estimating the costs of submarine cable installations.
Table 5-4 Transmission System Frequency and Highest Voltages
Country Frequency, Hertz Highest Transmission Voltage, kV Antigua and Barbuda 60 69 Barbados 50 69, one line built for 132 but
operating at lower voltage Cuba 60 220 Dominica 50 11 Dominican Republic 60 138 Grenada 50 33 Guadeloupe 50 63 (assumed) Haiti 60 115 Jamaica 50 138 Martinique 50 63 Puerto Rico 60 230 St. Kitts 60 11 Nevis 60 11 St. Lucia 50 66 St. Vincent and the Grenadines
50 33
Trinidad and Tobago 60 220 5.3 DESCRIPTION AND ANALYSIS OF POWER GENERATION MARKET
The power generation market in the Caribbean consists nearly exclusively of regulated utilities selling power and energy to end-use customers. There are no existing interconnections and therefore no trade among countries. Some independent power producers (IPPs) exist and sell to the local utility and some customer-level PV installations also sell to the local utility. In some countries self-generation exists as an economic way to meet industrial demand or to supply power in the event of load shedding. Attachment E provides brief country summaries for all of the main Study countries.
Table 5-2 and 5-3 summarize the power generation in each country and show the fuels used. The predominant form of generation is distillate-fueled diesel engines. The Dominican Republic and Jamaica have substantial capacity in HFO-fueled steam plants, and some HFO-fueled diesel

Caribbean Regional Electricity Generation, Interconnection, and Fuels Supply Strategy – Final Report 5-15
plants. There are a few distillate-fueled gas turbines and combined cycles, some hydro exists especially in the Dominican Republic, and there are small amounts of wind, solar PV, and other technologies. The Dominican Republic uses both coal and LNG as fuels, but relies mainly on HFO.
Section 6 provides demand forecasts for each country and the study region as a whole. The region is forecast to grow at a rate of 3.6% per year (peak MW) and 3.7% per year (energy GWH) through 2028, leading to nearly doubling the 2009 values by 2028. Individual country growth rates range from 2.4% per year to 7.9% per year.
The common critical challenge each country faces is dependence on high priced liquid fuels for most or all of its generation. The fundamental problem is lack of domestic resources, or at least currently developed domestic resources. Only Trinidad and Tobago has significant fossil fuel resources, both oil and natural gas. Section 7 discusses fuel and presents fuel price forecasts. The forecasts show no relief from high prices over the Study period, though current prices are lower than those in the recent past.
If demand doubles by 2028 the problems associated with relying on high priced liquid fuels will increase in proportion. However, as the results presented in this report demonstrate, high prices for liquid fuels open an economic window of opportunity for other fuels and technologies. Natural gas delivered by pipeline, or as LNG, and coal provide less costly generation in many countries. Geothermal and wind are attractive wherever the combination of a good resource and available site can be found.
Another technical issue is that the small demand in most of the Study countries means that high reserve margins must be maintained to provide satisfactory reliability. Increasing demand will mitigate this to some extent, as will interconnections, if they are developed.
Some countries suffer from a combination of issues that unfortunately are common in developing countries:
Inadequate tariff levels
High technical and non-technical losses
Deteriorating equipment
Load shedding
Addressing these circumstances is probably the greatest challenge.

Caribbean Regional Electricity Generation, Interconnection, and Fuels Supply Strategy – Final Report 6-1
Section 6 Load Forecast
6.1 LOAD FORECASTING APPROACH
During the data collection process, we received at least some electricity demand data from all countries. In many cases the data was not complete or the load forecast did not cover the entire planning period. The Study team reviewed the available historical data and forecasts to assure that the forecasts reflect current estimate and the consistency with the recent demand growth.
In the process, we made many adjustments and additions to create a complete set of load data needed for the analysis. This section presents available historical demand data and our electricity load forecasts for each country or isolated island.
6.2 CURRENT DEMAND AND ELECTRICITY FORECAST BY COUNTRY
6.2.1 Antigua and Barbuda
Table 6-1 presents historical loads for the years 2007 and 2008 and forecast loads until the year 2028 for Antigua and Barbuda. The load data is based on Antigua Public Utility Authority (APUA) recent annual and planning documents. Peak demand growth is forecast at around 3.3% per year during 2009-2023. T&D losses are projected to decrease significantly from 38% in 2007 to around 10% after 2011.
We extended the forecast until 2028 using the growth rate for the last year of the APUA forecast. We also kept the same loss rate after 2011.

Caribbean Regional Electricity Generation, Interconnection, and Fuels Supply Strategy – Final Report 6-2
Table 6-1 Summary Load Forecast for Antigua and Barbuda
YearNet Generation,
GWHCustomer load,
GWHPeak Demand,
MWSystem T&D
Losses, % of GWHLoad
Factor
2007 318.2 196.1 51.4 38% 70.7%2008 317.0 221.9 52.9 30% 68.4%
2009 318.3 254.7 54.4 20% 66.8%2010 314.6 267.4 57.1 15% 62.9%2011 312.0 280.8 60.0 10% 59.4%2012 409.6 368.6 63.0 10% 59.4%2013 421.9 379.7 64.9 10% 59.4%2014 434.3 390.9 66.8 10% 59.4%2015 447.3 402.6 68.8 10% 59.4%2016 460.9 414.8 70.9 10% 59.4%2017 474.6 427.1 73.0 10% 59.4%2018 488.9 440.0 75.2 10% 59.4%2019 503.2 452.9 77.4 10% 59.4%2020 518.8 466.9 79.8 10% 59.4%2021 534.4 481.0 82.2 10% 59.4%2022 550.0 495.0 84.6 10% 59.4%2023 566.6 510.0 87.2 10% 59.4%2024 583.2 524.9 89.7 10% 59.4%2025 600.2 540.2 92.3 10% 59.4%2026 617.7 556.0 95.0 10% 59.4%2027 635.8 572.2 97.8 10% 59.4%2028 654.3 588.9 100.6 10% 59.4%
Forecast
Historical

Caribbean Regional Electricity Generation, Interconnection, and Fuels Supply Strategy – Final Report 6-3
6.2.2 Barbados
Table 6-2 presents historical loads for 2004-2008 and forecast loads until the year 2028 for Barbados. The historical load data is based on Barbados Light and Power annual reports. Load growth is forecast at 3.2% for energy and 3.5% for peak load following the last 4 years’ trend. T&D losses are projected to remain at 6.3%, recorded in 2008.
Table 6-2 Summary Load Forecast for Barbados
Year Net Generation, GWH
Customer load, GWH
Peak Demand, MW
System T&D Losses, % of GWH
Load Factor
2004 896 834 143 7.0% 71.6%2005 953 888 154 6.9% 70.7%2006 976 906 157 7.2% 71.0%2007 1003 944 162 5.9% 70.5%2008 1011 947 164 6.3% 70.3%
2009 1039 977 170 6.3% 69.9%2010 1073 1009 176 6.3% 69.7%2011 1107 1042 182 6.3% 69.6%2012 1143 1075 188 6.3% 69.4%2013 1180 1110 195 6.3% 69.2%2014 1218 1146 201 6.3% 69.0%2015 1258 1183 208 6.3% 68.9%2016 1298 1221 216 6.3% 68.7%2017 1340 1261 223 6.3% 68.5%2018 1384 1302 231 6.3% 68.4%2019 1428 1344 239 6.3% 68.2%2020 1475 1387 247 6.3% 68.0%2021 1522 1432 256 6.3% 67.9%2022 1572 1478 265 6.3% 67.7%2023 1622 1526 274 6.3% 67.6%2024 1675 1576 284 6.3% 67.4%2025 1729 1627 294 6.3% 67.2%2026 1785 1679 304 6.3% 67.1%2027 1843 1733 314 6.3% 66.9%2028 1902 1789 325 6.3% 66.7%
Forecast
Historical
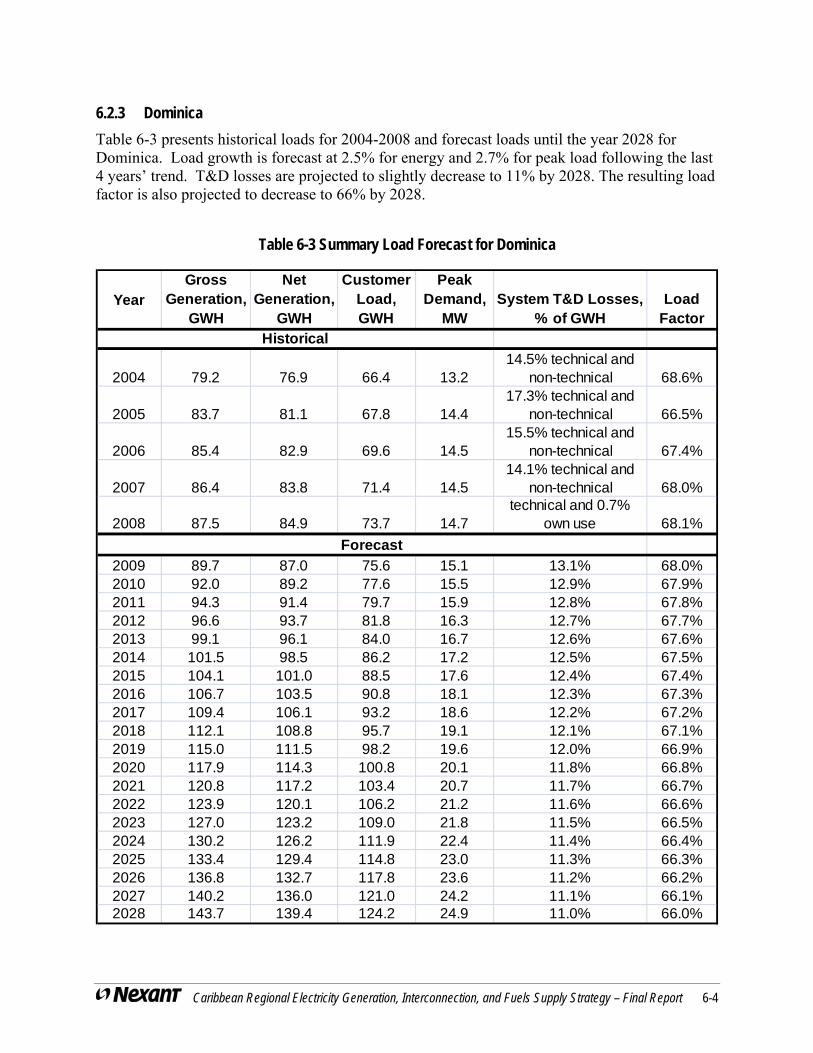
Caribbean Regional Electricity Generation, Interconnection, and Fuels Supply Strategy – Final Report 6-4
6.2.3 Dominica
Table 6-3 presents historical loads for 2004-2008 and forecast loads until the year 2028 for Dominica. Load growth is forecast at 2.5% for energy and 2.7% for peak load following the last 4 years’ trend. T&D losses are projected to slightly decrease to 11% by 2028. The resulting load factor is also projected to decrease to 66% by 2028.
Table 6-3 Summary Load Forecast for Dominica
YearGross
Generation, GWH
Net Generation,
GWH
Customer Load, GWH
Peak Demand,
MWSystem T&D Losses,
% of GWHLoad
Factor
2004 79.2 76.9 66.4 13.214.5% technical and
non-technical 68.6%
2005 83.7 81.1 67.8 14.417.3% technical and
non-technical 66.5%
2006 85.4 82.9 69.6 14.515.5% technical and
non-technical 67.4%
2007 86.4 83.8 71.4 14.514.1% technical and
non-technical 68.0%
2008 87.5 84.9 73.7 14.7technical and 0.7%
own use 68.1%
2009 89.7 87.0 75.6 15.1 13.1% 68.0%2010 92.0 89.2 77.6 15.5 12.9% 67.9%2011 94.3 91.4 79.7 15.9 12.8% 67.8%2012 96.6 93.7 81.8 16.3 12.7% 67.7%2013 99.1 96.1 84.0 16.7 12.6% 67.6%2014 101.5 98.5 86.2 17.2 12.5% 67.5%2015 104.1 101.0 88.5 17.6 12.4% 67.4%2016 106.7 103.5 90.8 18.1 12.3% 67.3%2017 109.4 106.1 93.2 18.6 12.2% 67.2%2018 112.1 108.8 95.7 19.1 12.1% 67.1%2019 115.0 111.5 98.2 19.6 12.0% 66.9%2020 117.9 114.3 100.8 20.1 11.8% 66.8%2021 120.8 117.2 103.4 20.7 11.7% 66.7%2022 123.9 120.1 106.2 21.2 11.6% 66.6%2023 127.0 123.2 109.0 21.8 11.5% 66.5%2024 130.2 126.2 111.9 22.4 11.4% 66.4%2025 133.4 129.4 114.8 23.0 11.3% 66.3%2026 136.8 132.7 117.8 23.6 11.2% 66.2%2027 140.2 136.0 121.0 24.2 11.1% 66.1%2028 143.7 139.4 124.2 24.9 11.0% 66.0%
Forecast
Historical

Caribbean Regional Electricity Generation, Interconnection, and Fuels Supply Strategy – Final Report 6-5
6.2.4 Dominican Republic
Table 6-4 presents historical loads for 2003-2008 and forecast loads until the year 2028 for Dominican Republic. Load growth is forecast at 3.4% for energy and peak load following the last 4 years’ trend. For developing the demand forecast we used the 2009- 2002 low scenario peak demand numbers from the 2006-2020 generation planning study. This demand forecast is consistent with the recent peak demand growth.
The GWH net generation forecast was developed using the 2008 actual generation and load factor values. Forecast generation values are similar to the generation numbers from the National Energy Commission 2008 forecast.
Table 6-4 Summary Load Forecast for Dominican Republic
YearNet Generation,
GWHPeak Demand,
MWLoad
Factor
2003 10,396 1,934 61.4%2004 8,868 2,115 47.9%2005 9,823 1,761 63.7%2006 10,709 2,083 58.7%2007 11,180 2,100 60.8%2008 11,644 2,168 61.3%
2009 12,638 2,353 61.3%2010 13,142 2,447 61.3%2011 13,663 2,544 61.3%2012 14,179 2,640 61.3%2013 14,646 2,727 61.3%2014 15,054 2,803 61.3%2015 15,554 2,896 61.3%2016 16,070 2,992 61.3%2017 16,601 3,091 61.3%2018 17,154 3,194 61.3%2019 17,724 3,300 61.3%2020 18,309 3,409 61.3%2021 18,914 3,522 61.3%2022 19,539 3,638 61.3%2023 20,184 3,758 61.3%2024 20,851 3,882 61.3%2025 21,539 4,010 61.3%2026 22,251 4,143 61.3%2027 22,986 4,280 61.3%2028 23,745 4,421 61.3%
Forecast
Historical

Caribbean Regional Electricity Generation, Interconnection, and Fuels Supply Strategy – Final Report 6-6
6.2.5 Grenada
Table 6-5 presents partial historical loads for 2004-2008 and forecast loads until the year 2028 for Grenada. The historical load data is based on GRENLEC annual reports. Load growth is forecast at 5.3% for energy and 5.4% for peak load following the increase from 2007 to 2008. T&D losses are projected to remain at the 9.1% recorded in 2008.
Table 6-5 Summary Load Forecast for Grenada
Year Net Generation, GWH
Customer load, GWH
Peak Demand, MW
System T&D Losses, % of GWH
Load Factor
2004 135.9 125.5 7.7%2005 147.3 131.6 10.7%2006 167.2 151 9.7%2007 178.7 165.2 27.89 7.6% 73.1%2008 189.8 172.5 29.39 9.1% 73.7%
2009 198.2 181.7 31.0 9.1% 73.1%2010 208.8 191.3 32.6 9.1% 73.0%2011 219.9 201.5 34.4 9.1% 73.0%2012 231.5 212.2 36.2 9.1% 72.9%2013 243.9 223.5 38.2 9.1% 72.9%2014 256.8 235.4 40.2 9.1% 72.8%2015 270.5 247.9 42.4 9.1% 72.8%2016 284.8 261.0 44.7 9.1% 72.8%2017 300.0 274.9 47.1 9.1% 72.7%2018 315.9 289.5 49.6 9.1% 72.7%2019 332.7 304.9 52.3 9.1% 72.6%2020 350.4 321.1 55.1 9.1% 72.6%2021 369.0 338.2 58.1 9.1% 72.5%2022 388.6 356.2 61.2 9.1% 72.5%2023 409.3 375.1 64.5 9.1% 72.5%2024 431.1 395.0 68.0 9.1% 72.4%2025 454.0 416.0 71.6 9.1% 72.4%2026 478.1 438.2 75.5 9.1% 72.3%2027 503.5 461.4 79.5 9.1% 72.3%2028 530.3 486.0 83.8 9.1% 72.2%
Forecast
Historical

Caribbean Regional Electricity Generation, Interconnection, and Fuels Supply Strategy – Final Report 6-7
6.2.6 Haiti
Table 6-6 presents historical loads for 2001-2008 and forecast loads until the year 2028 for Haiti. The historical load data is based on partial actual and interpolated values. Net generation in GWH is based on several years of actual generation data, while the peak demand is estimated as the unconstrained value (i.e., taking into account estimated load shedding and increasing demand accordingly). The relatively high portion of suppressed demand resulted in a very low load factor.
Unconstrained peak demand growth is forecast at 5% per year during 2009-2028 based on our discussions with EDH. Generation forecast is estimated to grow at a higher 10% rate to account for the current suppressed demand. After 2020, when generation is forecast to be able to supply most of the suppressed demand, both peak demand and net generation in GWH are forecast to grow at the same 5% rate. T&D losses, including a very high portion of non-technical losses, are projected to decrease from close to 50% to about 29% by 2028.
Table 6-6 Summary Load Forecast for Haiti
YearNet
Generation, (actual) GWH
Customer load, (est.)
GWH
Peak Demand, (unconstrained)
MW
Losses, (Actual incl. non-technical)
% of GWH
Load Factor
2001 602 282 150 53.2% 45.8%2002 550 271 152 50.8% 41.3%2003 538 247 154 54.0% 39.8%2004 527 248 157 53.0% 38.3%2005 520 250 161 52.0% 36.8%2006 549 269 177 51.0% 35.3%2007 579 290 195 50.0% 33.8%2008 600 306 215 49.0% 31.9%
(est.) (est.)
2009 660 343 226 48.0% 33.4%2010 726 385 237 47.0% 35.0%2011 799 432 249 46.0% 36.6%2012 878 483 261 45.0% 38.4%2013 966 542 274 44.0% 40.2%2014 1063 606 288 43.0% 42.1%2015 1169 679 303 42.0% 44.1%2016 1286 759 318 41.0% 46.2%2017 1415 849 334 40.0% 48.4%2018 1556 950 350 39.0% 50.7%2019 1712 1062 368 38.0% 53.1%2020 1883 1187 386 37.0% 55.7%2021 1977 1266 405 36.0% 55.7%2022 2076 1350 426 35.0% 55.7%2023 2180 1440 447 34.0% 55.7%2024 2289 1534 469 33.0% 55.7%2025 2403 1635 493 32.0% 55.7%2026 2523 1742 517 31.0% 55.7%2027 2650 1856 543 30.0% 55.7%2028 2782 1976 570 29.0% 55.7%
Historical
Forecast

Caribbean Regional Electricity Generation, Interconnection, and Fuels Supply Strategy – Final Report 6-8
6.2.7 Jamaica
Table 6-7 presents partial historical loads for 2004-2008 and forecast loads until the year 2028 for Jamaica. The historical load data is based on JPS annual reports. The forecast is based on the Evaluation of Generation Expansion Options and Tariff Impact Assessment Study done by the Office of Utilities Regulation in 2007. Load growth is forecast at 4.3% for both energy and peak load. T&D losses are projected to be reduced from a high 23% in 2008 to about 13% in 2028.
Table 6-7 Summary Load Forecast for Jamaica
YearNet Generation,
GWHCustomer load,
GWHPeak Demand,
MWSystem T&D
Losses, % of GWHLoad
Factor
2004 3,717 3,000 605 19.3% 70.2%2005 3,878 3,055 616 21.2% 71.9%2006 4,046 3,121 626 22.9% 73.8%2007 4,079 3,131 629 23.2% 74.0%2008 4,123 3,179 622 22.9% 75.7%
2009 4,490 3,485 680 22.4% 75.4%2010 4,674 3,650 707 21.9% 75.4%2011 4,865 3,824 736 21.4% 75.4%2012 5,066 4,008 767 20.9% 75.4%2013 5,277 4,201 799 20.4% 75.4%2014 5,494 4,401 832 19.9% 75.4%2015 5,726 4,616 867 19.4% 75.4%2016 5,974 4,845 904 18.9% 75.4%2017 6,232 5,085 943 18.4% 75.4%2018 6,497 5,334 983 17.9% 75.4%2019 6,777 5,598 1,026 17.4% 75.4%2020 7,073 5,878 1,071 16.9% 75.4%2021 7,376 6,167 1,116 16.4% 75.4%2022 7,696 6,473 1,165 15.9% 75.4%2023 8,024 6,789 1,214 15.4% 75.4%2024 8,370 7,123 1,267 14.9% 75.4%2025 8,734 7,476 1,322 14.4% 75.4%2026 9,114 7,847 1,379 13.9% 75.4%2027 9,510 8,236 1,439 13.4% 75.4%2028 9,924 8,644 1,502 12.9% 75.4%
Historical
Forecast

Caribbean Regional Electricity Generation, Interconnection, and Fuels Supply Strategy – Final Report 6-9
6.2.8 St. Kitts and Nevis
Table 6-8 presents partial historical loads for 2005-2008 and forecast loads until the year 2028 for St. Kitts. Table 6-9 presents partial historical loads for 2008 and forecast until the year 2028 for Nevis. The historical load data is based on the St. Kitts Electricity Department 2009 report and the Utrecht University pre-feasibility study of electrical interconnection for St. Kitts and Nevis. Load growth for St. Kitts is forecast at 2.9% for energy and 3.5% for peak load following the last 4 years’ trend.
Table 6-8 Summary Load Forecast for St. Kitts
YearNet Generation,
GWHPeak Demand,
MWLoad
Factor
2005 123.7 22.5 62.8%2006 130.9 23.9 62.6%2007 141.2 25.3 63.7%2008 150.9 26.8 64.2%
2009 161.2 29.0 63.4%2010 165.8 30.0 63.0%2011 170.6 31.1 62.6%2012 175.4 32.2 62.2%2013 180.5 33.3 61.8%2014 185.7 34.5 61.4%2015 191.0 35.7 61.0%2016 196.5 37.0 60.6%2017 202.1 38.3 60.2%2018 207.9 39.6 59.9%2019 213.9 41.0 59.5%2020 220.0 42.5 59.1%2021 226.3 44.0 58.7%2022 232.8 45.6 58.3%2023 239.5 47.2 58.0%2024 246.4 48.8 57.6%2025 253.4 50.6 57.2%2026 260.7 52.4 56.8%2027 268.2 54.2 56.5%2028 275.9 56.1 56.1%
Historical
Forecast

Caribbean Regional Electricity Generation, Interconnection, and Fuels Supply Strategy – Final Report 6-10
Load growth for Nevis is forecast to increase at a rate of 11.2% until 2012, 4.6% between 2012 and 2016, and 3.9% until 2020. After 2020 the forecast was extended using the growth rates experienced from 2019 to 2020. The resulting 2009-2028 growth rate is calculated at 5.9%.
Table 6-9 Summary Load Forecast for Nevis
YearNet Generation,
GWHPeak Demand,
MWLoad
Factor
2008 54.0 9.0 68.5%
2009 60.0 9.5 71.9%2010 66.7 10.1 75.4%2011 74.2 10.7 79.1%2012 82.5 11.3 83.0%2013 86.3 12.0 82.0%2014 90.2 12.7 80.9%2015 94.3 13.5 79.9%2016 98.7 14.3 78.8%2017 102.5 15.1 77.3%2018 106.5 16.0 75.8%2019 110.6 17.0 74.3%2020 115.0 18.0 72.9%2021 119.4 19.1 71.5%2022 124.1 20.2 70.1%2023 128.9 21.4 68.8%2024 133.9 22.7 67.4%2025 139.2 24.0 66.1%2026 144.6 25.5 64.8%2027 150.2 27.0 63.6%2028 156.1 28.6 62.4%
Historical
Forecast
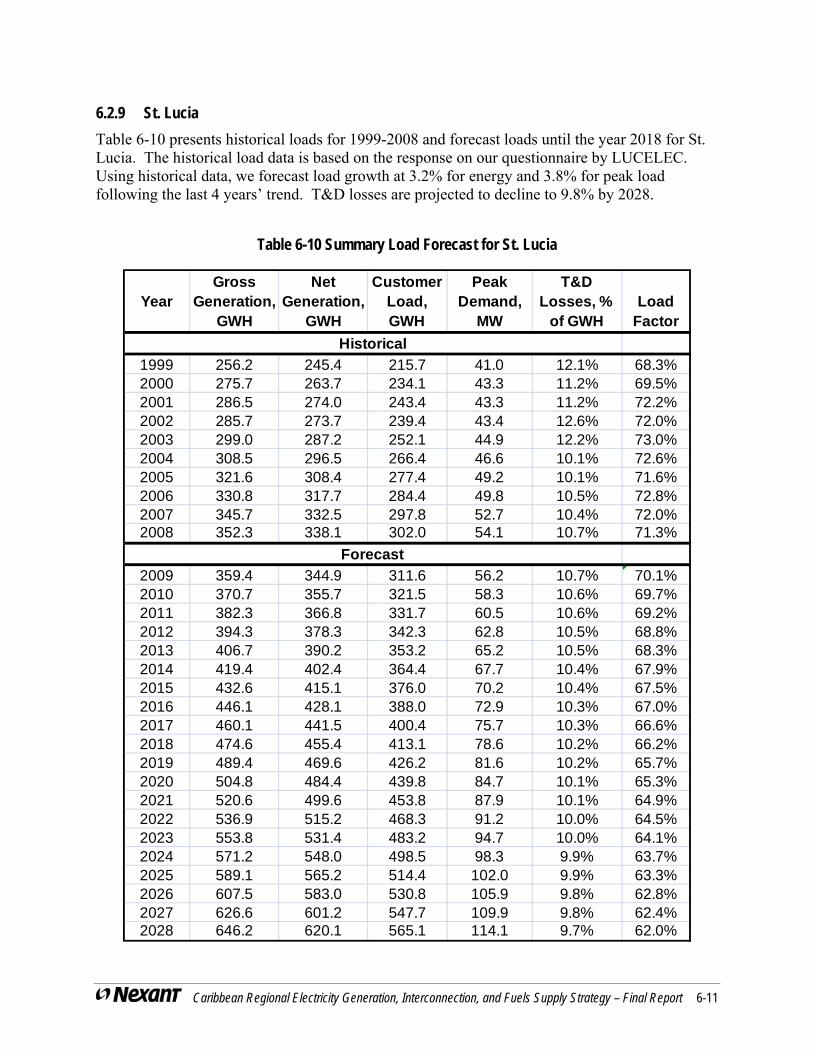
Caribbean Regional Electricity Generation, Interconnection, and Fuels Supply Strategy – Final Report 6-11
6.2.9 St. Lucia
Table 6-10 presents historical loads for 1999-2008 and forecast loads until the year 2018 for St. Lucia. The historical load data is based on the response on our questionnaire by LUCELEC. Using historical data, we forecast load growth at 3.2% for energy and 3.8% for peak load following the last 4 years’ trend. T&D losses are projected to decline to 9.8% by 2028.
Table 6-10 Summary Load Forecast for St. Lucia
YearGross
Generation, GWH
Net Generation,
GWH
Customer Load, GWH
Peak Demand,
MW
yT&D
Losses, % of GWH
Load Factor
1999 256.2 245.4 215.7 41.0 12.1% 68.3%2000 275.7 263.7 234.1 43.3 11.2% 69.5%2001 286.5 274.0 243.4 43.3 11.2% 72.2%2002 285.7 273.7 239.4 43.4 12.6% 72.0%2003 299.0 287.2 252.1 44.9 12.2% 73.0%2004 308.5 296.5 266.4 46.6 10.1% 72.6%2005 321.6 308.4 277.4 49.2 10.1% 71.6%2006 330.8 317.7 284.4 49.8 10.5% 72.8%2007 345.7 332.5 297.8 52.7 10.4% 72.0%2008 352.3 338.1 302.0 54.1 10.7% 71.3%
2009 359.4 344.9 311.6 56.2 10.7% 70.1%2010 370.7 355.7 321.5 58.3 10.6% 69.7%2011 382.3 366.8 331.7 60.5 10.6% 69.2%2012 394.3 378.3 342.3 62.8 10.5% 68.8%2013 406.7 390.2 353.2 65.2 10.5% 68.3%2014 419.4 402.4 364.4 67.7 10.4% 67.9%2015 432.6 415.1 376.0 70.2 10.4% 67.5%2016 446.1 428.1 388.0 72.9 10.3% 67.0%2017 460.1 441.5 400.4 75.7 10.3% 66.6%2018 474.6 455.4 413.1 78.6 10.2% 66.2%2019 489.4 469.6 426.2 81.6 10.2% 65.7%2020 504.8 484.4 439.8 84.7 10.1% 65.3%2021 520.6 499.6 453.8 87.9 10.1% 64.9%2022 536.9 515.2 468.3 91.2 10.0% 64.5%2023 553.8 531.4 483.2 94.7 10.0% 64.1%2024 571.2 548.0 498.5 98.3 9.9% 63.7%2025 589.1 565.2 514.4 102.0 9.9% 63.3%2026 607.5 583.0 530.8 105.9 9.8% 62.8%2027 626.6 601.2 547.7 109.9 9.8% 62.4%2028 646.2 620.1 565.1 114.1 9.7% 62.0%
Forecast
Historical

Caribbean Regional Electricity Generation, Interconnection, and Fuels Supply Strategy – Final Report 6-12
6.2.10 St. Vincent and Grenadines
Table 6-11 presents historical loads for 2002 - 2007 and forecast loads until the year 2028. The historical load data is based on a 2007 audit report provided by St. Vincent Electricity Services. Based on six years of historical data, we estimated the load growth for 2008 and the rest of the planning at 6.9% for both energy and peak load. T&D losses are projected to remain at 8.7% during the entire planning period.
Table 6-11 Summary Load Forecast for St. Vincent and Grenadines
YearNet
Generation, GWH
Customer Load, GWH
Peak Demand,
MW
System T&D Losses, % of
GWHLoad
Factor
2002 100.2 89.8 18.6 10.4% 61.5%2003 105.3 95.4 18.6 9.3% 64.6%2004 116.9 106.5 20.7 8.9% 64.6%2005 127.5 116.4 22.5 8.2% 64.7%2006 130.4 118.5 23.2 9.1% 64.2%2007 137.5 125.5 23.2 8.7% 67.7%2008 145.8 134.1 24.8 8.7% 67.1%
2009 155.9 143.4 26.5 8.7% 67.1%2010 166.7 153.3 28.3 8.7% 67.1%2011 178.2 163.9 30.3 8.7% 67.1%2012 190.5 175.2 32.4 8.7% 67.1%2013 203.7 187.3 34.6 8.7% 67.1%2014 217.8 200.3 37.0 8.7% 67.1%2015 232.8 214.1 39.6 8.7% 67.1%2016 248.9 228.9 42.3 8.7% 67.1%2017 266.1 244.7 45.2 8.7% 67.1%2018 284.5 261.6 48.4 8.7% 67.1%2019 304.1 279.7 51.7 8.7% 67.1%2020 325.1 299.0 55.3 8.7% 67.1%2021 347.6 319.7 59.1 8.7% 67.1%2022 371.6 341.8 63.2 8.7% 67.1%2023 397.3 365.4 67.6 8.7% 67.1%2024 424.8 390.6 72.2 8.7% 67.1%2025 454.1 417.6 77.2 8.7% 67.1%2026 485.5 446.5 82.6 8.7% 67.1%2027 519.0 477.3 88.3 8.7% 67.1%2028 554.9 510.3 94.4 8.7% 67.1%
Forecast
Historical

Caribbean Regional Electricity Generation, Interconnection, and Fuels Supply Strategy – Final Report 6-13
6.2.11 Martinique
Table 6-12 presents partial historical loads for 1999-2008 and forecast loads until the year 2028 for Martinique. The historical load data is based on EDF’s 2007 investment plan, updated in 2008. The 2009-2020 load growth rate is forecasted at 2.7%. This forecast was extended until 2028 using the growth rate from 2019 t0 m2020. The resulting planning period growth is about 2.5%.
Table 6-12 Summary Load Forecast for Martinique
YearNet Generation,
GWHPeak Demand,
MWLoad factor
1999 1110 181 70.0%2000 1161 189 70.1%2001 1241 197 71.9%2002 1271 201 72.2%2003 1338 210 72.7%2004 1382 218 72.4%2005 1448 226 73.1%2006 1485 228 74.4%2007 14882008 1530 237 73.7%
2009 1,575 242 74.3%2010 1,620 247 74.9%2011 1,672 255 74.9%2012 1,727 263 74.8%2013 1,783 272 74.8%2014 1,840 281 74.8%2015 1,900 290 74.8%2016 1,938 297 74.6%2017 1,978 303 74.5%2018 2,018 310 74.3%2019 2,058 317 74.1%2020 2,100 324 74.0%2021 2142 331 73.8%2022 2186 339 73.7%2023 2230 346 73.5%2024 2275 354 73.4%2025 2321 362 73.2%2026 2368 370 73.0%2027 2416 378 72.9%2028 2465 387 72.7%
Forecast
Historical

Caribbean Regional Electricity Generation, Interconnection, and Fuels Supply Strategy – Final Report 6-14
6.2.12 Guadeloupe
Table 6-13 presents partial historical loads for 1999-2008 and forecast loads until the year 2028 for Guadeloupe. The historical load data and forecast is based on EDF’s 2009 medium load forecast and investment plan for the 2009-2025 period. Load growth is forecast at 2.7% for energy and 2.5% for peak demand. This forecast was extended until 2028 using the growth rate from 2024 to 2025.
Table 6-13 Summary Load Forecast for Guadeloupe
YearNet Generation,
GWHPeak Demand,
MWLoad factor
1999 1,167 188 70.9%2000 1,219 193 72.1%2001 1,286 203 72.3%2002 1,323 206 73.3%2003 1,386 218 72.6%2004 1,450 225 73.6%2005 1,500 236 72.6%2006 1,537 235 74.7%2007 1,609 241 76.2%2008 1,612 242 76.0%
2009 1,663 250 75.9%2010 1,720 256 76.7%2011 1,775 263 77.0%2012 1,832 269 77.7%2013 1,888 276 78.1%2014 1,947 284 78.3%2015 2,003 291 78.6%2016 2,060 298 78.9%2017 2,117 305 79.2%2018 2,174 313 79.3%2019 2,233 321 79.4%2020 2,284 329 79.2%2021 2,337 337 79.2%2022 2,390 346 78.9%2023 2,445 354 78.8%2024 2,501 363 78.7%2025 2,559 372 78.5%2026 2,618 381 78.4%2027 2,679 391 78.3%2028 2,741 400 78.2%
Historical
Forecast

Caribbean Regional Electricity Generation, Interconnection, and Fuels Supply Strategy – Final Report 6-15
6.3 REGIONAL LOAD FORECAST
Table 6-14 presents the Caribbean countries’ net peak demand forecasts for 2009 – 2028. Table 6-15 presents the corresponding net energy generation requirements. “Net generation” means the inputs to the transmission system at the generating units.
From 2009 to 2028, combined peak demand is projected to increase by 95.8%, nearly doubling and corresponding to an annual rate of 3.6%. Energy demand is projected to increase slightly more, by 98.8%, also nearly doubling and corresponding to an annual growth rate of 3.7%. With some variations, and generally higher growth rates for smaller systems, load growth is relatively evenly distributed throughout the region.

Caribbean Regional Electricity Generation, Interconnection, and Fuels Supply Strategy – Final Report 6-16
Table 6-14 Net Peak Demand Load Forecast (MW)
YearAntigua
and Barbuda
Barbados DominicaDominican Republic
Grenada Haiti Jamaica St. Kitts Nevis St. LuciaSt. Vincent
and Grenadines
Martinique Guadeloupe Total
2009 54 170 15 2,353 31 226 680 29 10 56 27 242 250 4,142
2010 57 176 15 2,447 33 237 707 30 10 58 28 247 256 4,302
2011 60 182 16 2,544 34 249 736 31 11 61 30 255 263 4,472
2012 63 188 16 2,640 36 261 767 32 11 63 32 263 269 4,643
2013 65 195 17 2,727 38 274 799 33 12 65 35 272 276 4,808
2014 67 201 17 2,803 40 288 832 35 13 68 37 281 284 4,965
2015 69 208 18 2,896 42 303 867 36 13 70 40 290 291 5,143
2016 71 216 18 2,992 45 318 904 37 14 73 42 297 298 5,324
2017 73 223 19 3,091 47 334 943 38 15 76 45 303 305 5,512
2018 75 231 19 3,194 50 350 983 40 16 79 48 310 313 5,708
2019 77 239 20 3,300 52 368 1,026 41 17 82 52 317 321 5,911
2020 80 247 20 3,409 55 386 1,071 43 18 85 55 324 329 6,121
2021 82 256 21 3,522 58 405 1,116 44 19 88 59 331 337 6,339
2022 85 265 21 3,638 61 426 1,165 46 20 91 63 339 346 6,565
2023 87 274 22 3,758 64 447 1,214 47 21 95 68 346 354 6,798
2024 90 284 22 3,882 68 469 1,267 49 23 98 72 354 363 7,041
2025 92 294 23 4,010 72 493 1,322 51 24 102 77 362 372 7,293
2026 95 304 24 4,143 75 517 1,379 52 25 106 83 370 381 7,555
2027 98 314 24 4,280 80 543 1,439 54 27 110 88 378 391 7,827
2028 101 325 25 4,421 84 570 1,502 56 29 114 94 387 400 8,109
Growth Rate
3.3% 3.5% 2.7% 3.4% 5.4% 5.0% 4.3% 3.5% 5.9% 3.8% 6.9% 2.5% 2.5% 3.6%

Caribbean Regional Electricity Generation, Interconnection, and Fuels Supply Strategy – Final Report 6-17
Table 6-15 Net Generation Forecast (GWh)
YearAntigua
and Barbuda
Barbados DominicaDominican Republic
Grenada Haiti Jamaica St. Kitts Nevis St. LuciaSt. Vincent
and Grenadines
Martinique Guadeloupe Total
2009 318 1,039 87 12,638 198 660 4,490 161 60 345 156 1,575 1,663 23,391
2010 315 1,073 89 13,142 209 726 4,674 166 67 356 167 1,620 1,720 24,322
2011 312 1,107 91 13,663 220 799 4,865 171 74 367 178 1,672 1,775 25,295
2012 410 1,143 94 14,179 232 878 5,066 175 82 378 191 1,727 1,832 26,387
2013 422 1,180 96 14,646 244 966 5,277 180 86 390 204 1,783 1,888 27,363
2014 434 1,218 99 15,054 257 1,063 5,494 186 90 402 218 1,840 1,947 28,303
2015 447 1,258 101 15,554 270 1,169 5,726 191 94 415 233 1,900 2,003 29,362
2016 461 1,298 104 16,070 285 1,286 5,974 196 99 428 249 1,938 2,060 30,448
2017 475 1,340 106 16,601 300 1,415 6,232 202 103 442 266 1,978 2,117 31,576
2018 489 1,384 109 17,154 316 1,556 6,497 208 107 455 284 2,018 2,174 32,751
2019 503 1,428 112 17,724 333 1,712 6,777 214 111 470 304 2,058 2,233 33,979
2020 519 1,475 114 18,309 350 1,883 7,073 220 115 484 325 2,100 2,284 35,252
2021 534 1,522 117 18,914 369 1,977 7,376 226 119 500 348 2,142 2,337 36,483
2022 550 1,572 120 19,539 389 2,076 7,696 233 124 515 372 2,186 2,390 37,761
2023 567 1,622 123 20,184 409 2,180 8,024 239 129 531 397 2,230 2,445 39,082
2024 583 1,675 126 20,851 431 2,289 8,370 246 134 548 425 2,275 2,501 40,454
2025 600 1,729 129 21,539 454 2,403 8,734 253 139 565 454 2,321 2,559 41,881
2026 618 1,785 133 22,251 478 2,523 9,114 261 145 583 485 2,368 2,618 43,361
2027 636 1,843 136 22,986 504 2,650 9,510 268 150 601 519 2,416 2,679 44,897
2028 654 1,902 139 23,745 530 2,782 9,924 276 156 620 555 2,465 2,741 46,490
Growth Rate
3.9% 3.2% 2.5% 3.4% 5.3% 7.9% 4.3% 2.9% 5.2% 3.1% 6.9% 2.4% 2.7% 3.7%

Caribbean Regional Electricity Generation, Interconnection, and Fuels Supply Strategy – Final Report 7-1
Section 7 Fuel Supply
Section 7.1 provides an overview of the existing fuel supply to Study islands. Section 7.2 discusses potential fuel supply options for liquid and solid fuels, and the estimated costs of delivery to Study countries. Section 7.3 describes potential natural gas fuel delivery systems, and the estimated costs of delivery to Study countries. Section 7.4 addresses fuel storage. Section 7.5 explains our approach to fuel pricing and provides fuel price forecasts for the different fuels.
7.1 EXISTING FUEL SUPPLY
For most of the Study countries the fuel supply is either distillate or heavy fuel oil, as Table 7-1 shows.
Table 7-1 Fuels Used by Country
Current Fuels for Thermal Power Generation
Country Distillate Heavy Fuel
Oil Natural
Gas Coal Other Antigua & Barbuda X X Barbados X X X Bagasse Dominica X Dominican Republic X X X X 20% by
Hydro Grenada X Haiti X X Jamaica X X Bagasse Martinique X X St. Kitts X X Nevis X St. Lucia X St. Vincent and the Grenadines
X X
Trinidad and Tobago X Except in Trinidad, most of the liquid fuels used are imported. Some liquid fuels come from Venezuela through the Petro Caribe agreements and others from refineries in Aruba, Curacao, Surinam, and St. Croix. The Dominican Republic has two small refineries that produce products for the domestic market but also fuel oils for the power generation industry. Jamaica has a refinery which imports crude oil and produces some liquid fuels for power generation plus diesel, gasoline, and aviation fuels for domestic consumption. Martinique has a small refinery

Caribbean Regional Electricity Generation, Interconnection, and Fuels Supply Strategy – Final Report 7-2
that produces heavy fuel oil for power generation in Martinique and Guadeloupe as well as products for domestic consumption. These refineries provide competition with the international oil companies to keep a lid on prices of imported liquid fuels. Barbados actually produces a small amount of crude oil and sends it to Trinidad for processing. Barbados also produces a small amount of natural gas which is used for domestic consumption as well as power generation. Trinidad is the major producer of natural gas as well as crude oil and petroleum products. All its electric generation is with natural gas.
There are several power generating units in the Dominican Republic that are coal fired steam generators. These plants also use petroleum coke as a fuel from time to time as the pricing conditions warrant. Guadeloupe has two coal fired steam generators that also burn bagasse and provide a quarter of the country’s electricity production.
Section 7-5 discusses fuel prices in detail, but here we will note that distillate, HFO, natural gas, and coal are internationally traded products with 2008 average prices for deliveries to US power shown in the bullets below. Caribbean prices for the liquid fuels would be somewhat higher due to higher transportation costs. Caribbean prices for the other fuels would increase even more because they will need more costly facilities to be able to receive the fuel. These prices demonstrate that for the most part the Caribbean islands today rely on the highest price fuels, which is of course part of the reason for this Study, and why an important part of the work is to estimate the delivered cost of the other fuels.
Distillate: $18.70/GJ
HFO: $13.52/GJ
Natural gas: $9.01/GJ
Coal: $1.91/GJ
Coal for exports: $3.01/GJ (Note – not for deliveries to US power plants)
7.2 POTENTIAL FUEL SUPPLY OPTIONS
7.2.1 Liquid Fuels
7.2.1.1 Distillate
We use the terms distillate and diesel interchangeably, indicating a refined product capable of being used in diesel engines and gas turbines. This is currently the preferred fuel from an environmental standpoint in the absence of natural gas, which produces fewer air emissions. Many of the existing diesel engines in the smaller islands are designed for using this fuel. However, it is the most expensive fuel, significantly more costly than heavy fuel oil (HFO).
7.2.1.2 HFO
This fuel is preferred by many of the poorer countries because of the lower cost. However, many of the diesel engines have to be designed to handle this fuel as there can be more maintenance required due to contaminants such as metals and coke. In addition, it is more polluting and is banned in many areas near resorts because of this characteristic. Countries such as Grenada use

Caribbean Regional Electricity Generation, Interconnection, and Fuels Supply Strategy – Final Report 7-3
only diesel, whereas other nations such as Jamaica are trying to phase out heavy fuel oil from an environmental policy point of view.
7.2.2 Solid Fuels
7.2.2.1 Coal
Introduction
Coal has been used in the Dominican Republic as fuel for four different steam power plants at Barahona. The coal is primarily from Colombia, but some has been purchased from the United States through a general coal purchase agreement. There is a bulk material receiving capable of offloading 1,600 tons/hr. Two of the four coal fired steam plants produce the least costly power in the Dominican Republic (other than hydroelectric power), and the third coal plant produces the sixth least costly power in the country.
The main drawback with coal fuel is higher air emissions (including CO2) than other fuels. In addition, new coal-fueled power plants have much higher initial capital costs than other generators such as diesel or gas turbine-based units. Coal also cannot be used as an alternate fuel in diesel generators or gas turbines.
There are also pulverized coal power plants in Guadeloupe and Puerto Rico. There are two coal plants in Guadeloupe which burn both coal and bagasse. Recently another bagasse/coal plant has come on line in Guadeloupe. Coal is imported to the Dominican Republic through general purchase agreements with companies that buy the coal and provide the shipping. At the end of 2008 the price (in $/GJ) of coal was 60% the price of HFO, 44% the price of LNG and 31% the price of distillate. These are just the cost of the fuels at their export locations. For the islands without any coal import facilities or power plants that can handle coal, transitioning to coal becomes much more expensive in relation to liquid fuels since the cost of a coal terminal that is only used a few times a year must be incurred as well as the new coal plant that will need to conform to the environmental standards of the country.
Economics
Coal for the Caribbean consumption is available from Colombia, Venezuela and the United States. The Dominican Republic, the main user of coal in the Caribbean, purchases most of its coal from Colombia although some can come from Venezuela and United States. Coal is transported from these countries in dry bulk carriers that are in the Handymax class of ships. The typical load is 30,000 to 50,000 tonnes. Transportation costs have been developed for coal that are added to the price of coal FOB Colombia or US to determine the price of coal delivered to the individual Study islands. The variable transportation cost includes the daily charter rate plus crew costs, fuel, tugs, insurance, and port fees. The fixed costs will be the cost of a coal import terminal if one is not available plus the O&M cost of the terminal. Except for larger coal consumers, the major transportation cost is the coal import terminal. For small power plants, the terminal is used infrequently. It is assumed that the coal import terminal would be located at the power plant. Figure 7-1 shows coal transportation costs for a range of power plant sizes,

Caribbean Regional Electricity Generation, Interconnection, and Fuels Supply Strategy – Final Report 7-4
assuming fuel heat content of 27,900 GJ/kg, a heat rate of 11,800 kJ/kWh, and a 75% capacity factor.
Analysis
The advantages of coal are as follows:
It is less expensive than liquid fuels on a $/GJ basis
The price is more stable than liquid fuels and there are more suppliers than LNG
Colombian coal is high quality with low sulfur (<1%), moisture and ash
The disadvantages of coal are as follows:
The fuel is not compatible with existing non coal fired power generation facilities. Any new use has to include a new coal fired power plant.
Large investment for coal import terminals if they cannot be used for other bulk materials.
The largest carbon imprint of all fuels
Sulfur, NOx and particulate emissions higher than other fuels

Caribbean Regional Electricity Generation, Interconnection, and Fuels Supply Strategy – Final Report 7-5
Coal Transportation Cost
0.00
2.00
4.00
6.00
8.00
10.00
12.00
0 50 100 150 200 250 300 350
Power Plant Size, MW
Co
al T
ran
spo
rtat
ion
Co
st,
$/G
J
Coal to Eastern Caribbean Islands
Coal to Jamaica & Dominican Republic
Figure 7-1 Coal Transportation Costs

Caribbean Regional Electricity Generation, Interconnection, and Fuels Supply Strategy – Final Report 7-6
7.2.2.2 Petroleum Coke
Introduction
Although the majority of the petroleum coke produced in the world is used in the metallurgical and cement industries, a considerable portion is used in power generation where it competes with steam coal. This fuel has been used as an alternative to coal in the DR coal fired power plants under the same coal purchase agreement. In Jamaica, the Petroleum Company of Jamaica (Petrojam) plans to install a Delayed Coking unit to convert the heavy part of the crude to diesel and lighter distillate products plus petroleum coke. This will eliminate the use of heavy fuel oil as a power plant fuel source. Jamaica Public Service would like to build a power plant next door to utilize the byproduct petroleum coke. Petroleum coke generally has a higher heating value than coal, lower volatiles but higher sulfur. The high sulfur levels limit the sources of supply of this fuel in order to meet the local environmental standards. Venezuela produces substantial amounts of petroleum coke as a byproduct of processing their heavy crude oil. Petroleum coke can be used in power plants similar to conventional or circulating fluidized bed steam coal fired power plants.
Economics
The application that appears most economic in the Caribbean is proposed JPS power plant adjacent to the Petrojam refinery where a proposed new Delayed Coker is planned. Being adjacent to the fuel supply, the only transportation cost will be to convey the coke to the next door power plant. This is beneficial for both the refinery and the power plant as it eliminates transportation expenses. There may still be a need for a coke/coal terminal in case the coke production and the power generation requirements do not match such that there is an excess or shortfall of petroleum coke.
If petroleum coke is to be used elsewhere similar transportation costs as coal will apply.
Analysis
The advantages of petroleum coke
It can often be substituted for coal as a fuel in existing pulverized coal boilers, or used in purpose-built conventional and circulating fluidized bed steam power plants.
The disadvantage of petroleum coke
Not widely used in the Caribbean so arranging deliveries will be more difficult than coal
It has different properties of ash and sulfur so may not be compatible with all existing coal fired boilers
Generally higher in sulfur than Colombian coal
7.2.3 Natural Gas Delivery Systems
7.2.3.1 Eastern Caribbean Gas Pipeline (ECGP) and Other Potential Gas Pipeline Options
Introduction

Caribbean Regional Electricity Generation, Interconnection, and Fuels Supply Strategy – Final Report 7-7
The initial pipeline concept was proposed in 2002 by the prime minister of Trinidad and Tobago. Intra Caribbean Gas Pipeline Limited (ICGPL) was formed to promote this pipeline. The current ownership is 40.5% Guardian Holdings, 40.5% Trinidad & Tobago Unit Trust Corp, 10% National Gas Company of Trinidad & Tobago (NGC), and 9% ICGPL. This partnership is now Eastern Caribbean Gas Pipeline Company (ECGPC). The initial section is to be a 180 mile 10 inch pipeline from Tobago to northwest of Barbados with a small offshore lateral to the main power plant. The second section is a 120 mile 10 inch line from Barbados to Martinique with a side spur to St. Lucia. The third section is a 172 mile 8 inch line from Martinique to Guadeloupe. The pipeline is designed to send 50 MMscfd to Barbados and 100 MMscfd combined gas to Martinique, Guadeloupe and St. Lucia. This pipeline reaches depths of 5,300 ft between Tobago and Barbados and 5600 ft of depth near Martinique. An initial mapping survey was performed in 2004 by Doris Engineering (now Doris Engineering of France, a well-regarded deep-water engineering and project management firm) who developed a capital cost estimate of $550 million for the project. This cost was updated in 2008 to $800 million. Since the last cost update, many of the costs have come down and the ECGPC feels it is now closer to $675 million.
Technical Feasibility
The pipeline appears to be technically feasible since the Blue Stream pipeline across the Black Sea was deeper, longer and consisted of two 24 inch lines. Because of the hurricane season, each of the pipeline sections must be completed from the end of November to the beginning of June. This is 6 months or approximately 180 days. The S-lay barges can average approximately 2.5 miles/day. For the longest leg of 180 miles this works out to be 75 days, well under the allowable time window. The larger J-lay barges as used in the Blue Stream project have a lay speed about 60 to 70% of the S-lay, or 1.5 miles/day, which works out to 125 days which is also within the allowable time window. This allows for any weather delays or overcoming unforeseen obstacles that may be encountered. The ultra deep pipeline construction technology has made enormous progress in the past 10 years as offshore oil exploration and production has reached depths in excess of 8,000 feet. Submarine pipeline repairs are possible at these depths with remotely operated vehicles (ROVs) in case damage is done to the pipeline during installation.
There are still some risks that were identified in the original study performed by Doris Engineering in 2004. There are some tectonic areas that have been avoided by abandoning the routes to Grenada and St. Vincent. There are also some steep slopes off the shores of Martinique that may require rerouting, which could add additional pipeline length to avoid these areas. It could also mean an additional onshore pipeline in Martinique instead of an offshore leg. However, these risks can be overcome when a High Resolution Seabed survey is conducted prior to detailed engineering. This will allow identification of an acceptable routing.
Other Issues
NGC is committed to building a 12 inch pipeline from the eastern gas fields of Trinidad up to Tobago. They have purchased the pipe but have delayed construction until 2010. Currently the Trinidad government is willing to commit 30 MMscfd of gas to Barbados as long as it is only used for power generation and not to produce basic chemicals such as methanol and ammonia. Currently the Barbados government is deciding whether to endorse the pipeline. The previous government favored the pipeline, but the new government is revisiting the various natural gas options.
Caribbean Regional Electricity Generation, Interconnection, and Fuels Supply Strategy – Final Report 7-8
The commitment of Guadeloupe and Martinique to participate in the pipeline is uncertain at this point. ECGPC is the project developer of the offshore pipelines to Martinique and Guadeloupe, with Monplaisir Energy in Martinique being responsible for promoting the pipeline and its benefits to the local and French authorities. Monplasir Energy has obtained backing from the French government who want to reduce the subsidies provided to their high-electricity-cost territories. Customers in French islands already pay for electricity at same rates as Parisians; the difference between the cost of producing electricity in the islands and the customer revenues is a government subsidy. The incentive to switch to gas from distillate or HFO is in reducing the subsidy as well as reducing CO2 emissions. The French lending arm CDC has acknowledged the importance of this project and is willing to offer its help with the project. The trade department of the Martinique government has been involved in discussions with Trinidad and Tobago’s ministry of energy who have in principle offered to facilitate securing the 100 MMscfd of gas needed for the French territories. There is also interest from various commercial groups in Martinique and Guadeloupe who are willing to commit to certain quantities of gas contingent on a price. There have also been discussions with Trinidad gas producers, but no commitment has been made yet.
Economics
Preliminary independent cost estimates indicate that the capital costs ECGPC are using are reasonable. The pipeline sizes were verified by conducting a hydraulic simulation of the entire pipeline system. To verify the capital costs, quotes were obtained from Japanese pipe suppliers as well as pipe coating installers. Daily rates for S Lay barges, tugs and supply boats were obtained and added to crew and fuel costs. Additional costs were obtained for horizontal shore drilling and pipe trenching. The initial gas conditioning and compression plant costs were developed using a commercial cost estimating program. The variable costs of the pipeline are based on the compression requirements which were assumed to be electric motor driven compressors with power purchased from Trinidad and Tobago. In additional there would be operating and maintenance costs for the pipeline, gas conditioning and compression stations in Tobago as well as at metering stations at the various islands.
The ECGPC will not be purchasing the gas from the Trinidad gas producers. It is only going to charge the final customers for the transportation costs. The economics of this option as well as any other natural gas option will depend on the price of gas that the final customers can negotiate from the Trinidad gas producers. Currently Trinidad has several tiers of natural gas pricing depending on use of the gas. The highest price is for the LNG production where it gets world indexed prices. The lowest price is for the residential customers and is quite low. The next level is for industrial and commercial customers and varies by type of industry. The next level is for the industrial chemical producers who make methanol, ammonia, and other chemicals. This price varies with the world commodity prices and is possibly 75% of the LNG spot market price.
We based the price of gas at the input to the pipeline on our estimates of the price of gas as input to the LNG facilities, as described in more detail in Section 7.5. In brief, this is the landed price of LNG in the US less losses of 9.1% and gasification costs of $1.42/GJ.
How the pipeline transportation costs will be distributed among the various islands will be ultimately determined by negotiations between the pipeline company and the individual islands. There are several ways to distribute the fixed and variable costs. For this evaluation, the fixed

Caribbean Regional Electricity Generation, Interconnection, and Fuels Supply Strategy – Final Report 7-9
costs for each of the individual legs were multiplied by the maximum volume of gas to each island divided by the total volume of gas using that section of pipeline. This was done for each section of pipeline. This was then added up and each islands contribution was determined. This resulted in 11% of the capital cost allocated to the Barbados, 26% to Martinique, 16% to St. Lucia and 47% to Guadeloupe. In addition, costs unique to each island are added to the common costs.
With this pricing model the transportation costs for gas to each country for 2014, 2020, and 2028 are shown in Table 7-2. We assumed 15 year life and real (without inflation) cost of capital of 10% per year. Transportation costs were also determined assuming all islands shared a common price taking the total cost and dividing it by the corresponding total volume of gas transported each year. This is included in the last column in Table 7-2.
The pipeline is designed to be able to supply 2028 demand. Most of its costs are fixed annual costs that do not depend on demand. Therefore, the unit costs in $/GJ are highest in 2014, which has the lowest demand and spreads the fixed costs over the smallest number of GJ. They decline between 2014 and 2020, and 2020 and 2028, as demand increases. This is true for Tables 7-3 through 7-5 as well.
The unit costs increase with pipeline length, with costs lowest for Barbados, then steadily increasing for Martinique, St. Lucia (longer pipeline even though closer to Barbados), and Guadeloupe.
Table 7-2 Pipeline Transportation Costs – All Islands Connected
Transportation Costs, $/GJ, Based On
Segment Costs and Usages Common
Price to All
Year Barbados Martinique St. Lucia Guadeloupe All Islands
2014 2.28 4.08 6.73 9.15 4.84
2020 2.03 3.59 5.63 5.58 3.88
2028 1.58 3.07 4.47 4.73 3.21
We also looked at the cost of gas if one or more sections of pipeline are not built. Table 7-3 shows the transportation costs if the pipeline section to St. Lucia is not built. The last column shows the cost if the costs were evenly distributed to each island. The unit costs for the three connected islands are somewhat higher than when all four islands are connected, as some economies of scale are lost.

Caribbean Regional Electricity Generation, Interconnection, and Fuels Supply Strategy – Final Report 7-10
Table 7-3 Pipeline Transportation Costs – St. Lucia Not Connected
Transportation Costs, $/GJ, Based On
Segment Costs and Usages Common
Price to All
Year Barbados Martinique St. Lucia Guadeloupe All Islands
2014 2.45 4.34 N/A 9.57 4.94
2020 2.18 3.82 N/A 5.84 3.94
2028 1.69 3.27 N/A 4.94 3.28
Table 7-4 shows the transportation costs if the pipeline sections to both St. Lucia and Guadeloupe are not built. The last column shows the cost if the costs were evenly distributed to Barbados and Martinique. These prices are higher still that when three or all four islands are connected.
Table 7-4 Pipeline Transportation Costs – St. Lucia and Guadeloupe Not Connected
Transportation Costs, $/GJ, Based On
Segment Costs and Usages Common
Price to All
Year Barbados Martinique St. Lucia Guadeloupe All Islands
2014 3.18 6.00 N/A N/A 4.79
2020 2.83 5.27 N/A N/A 4.22
2028 2.20 4.51 N/A N/A 3.47
Table 7-5 shows the transportation costs if the pipeline was built only to Barbados, but its section was sized for a future expansion to the other islands. These prices are highest of all. If the pipeline were re-optimized for service to Barbados only, the prices shown would fall significantly. Similar statements regarding re-optimization would apply for Tables 7-3 and 7-4, though the impact on prices would be less.

Caribbean Regional Electricity Generation, Interconnection, and Fuels Supply Strategy – Final Report 7-11
Table 7-5 Pipeline Transportation Costs – Barbados is Only Island Connected
Transportation Costs, $/GJ, Based On
Segment Costs and Usages Common
Price to All
Year Barbados Martinique St. Lucia Guadeloupe All Islands
2014 6.38 N/A N/A N/A N/A
2020 5.66 N/A N/A N/A N/A
2028 4.40 N/A N/A N/A N/A
Analysis
The advantages of the pipeline over the other options are as follows:
The gas supply is not affected by weather or breakdowns in the shipping component.
The only likely gas interruption scenario would be a failure of the feed gas compressors. This can be avoided by having sufficient compressor spare capacity. For the capital cost it is assumed that either three 50% compressors or two 100% compressors would be provided. In addition, the pipeline via linepacking constitutes a storage vessel and the entire pipeline can hold up to 275 MMscf of gas at full pressure and normally around 150 MMscf. The only catastrophic failure would be a pipeline break due to a subsurface seismic event. Even this event is repairable with the submarine technology available today
Another advantage is that there is no visual impact offshore as the pipeline approach will be horizontally drilled and be hidden from view except during construction.
Very small onshore footprint. Only gas metering and pigging equipment.
Solves the fuel diversity problem for several islands.
Is expandable to other islands north of Guadeloupe by installation of compressor stations on Barbados and northward.
Operating cost is predictable as it is mainly the operation of the compression stations. With a dry sweet gas corrosion should be minimal.
The financing for the project can be provided by the pipeline company
Potential disadvantages of the pipeline include:
The economics are improved with more users connected to the pipeline. As more parties are involved, the complexity of the project increases. It may be difficult getting commitments from all the islands in a timely manner. Many agreements must be put in place before financial close and beginning of detailed engineering such as:
- Gas supply contracts with producers and users
- Approval from government entities

Caribbean Regional Electricity Generation, Interconnection, and Fuels Supply Strategy – Final Report 7-12
- Agreements with other groups within each island who need to commit to take a fixed quantity of gas.
- Reasonable price guarantees to get users to commit.
A catastrophic failure such as a line break caused by a submarine seismic event or overstress at an unsupported span could temporarily or permanently shutdown the pipeline. Even this event is repairable with the submarine technology available today. ROVs can go to these depths, cut out pipe and weld new pipe in place. The goal of detailed submarine pipeline mapping phase of the project will be to minimize the potential risks that can pose extra stress on the pipeline.
Most of the capital cost has to be spent at the beginning of the project when the demand is much less than the ultimate demand. Early year unit costs in $/GJ are relatively high.
If the pipe became corroded throughout, it would have to be abandoned. There should be little risk of internal corrosion of the pipeline as the natural gas is dry, sulfur free and non-corrosive. The Fusion Bonded Epoxy coating, along with the pipeline being buried, should prevent external corrosion to the pipeline. The pipe will be inspected by use of smart pigs which will monitor pipe thickness such that mitigating steps can be made in the unlikely event that corrosion is detected.
7.2.3.2 LNG Option for the Caribbean Region
Introduction
Currently Trinidad is the largest exporter of LNG to the United States and one of the largest LNG exporters in the world. It also exports LNG to two of the islands in the Caribbean. In Penuelas, Puerto Rico the LNG terminal supports a 540 MW power plant plus a desalination plant. In Andres, Dominican Republic, the LNG terminal supports a 310 MW power plant. Both of these facilities are designed to accommodate large 140,000 cubic meter LNG tankers. They both have long jetties to handle the deep draft of the large LNG tankers. Both of these systems were constructed in the early 2000s when the cost of LNG systems hadn’t increased to the level it did in the mid 2000s.
There has been talk of other LNG liquefaction plants being built in Colombia and Venezuela, but there is currently no firm commitment to build any of these plants. The assumption is that these options are far in the future and therefore they are not considered for this study.
LNG Markets
LNG is the best option to transport large amounts of gas long distances. There is very little experience with shipping small quantities short or medium distances. Most of the LNG ship manufacturers are geared to building large tankers in the 135,000 to 250,000 cubic meter size to service the long transport distances. The majority of large isolated gas resources in Australia, the Persian Gulf, and South East Asia are long distances from the major markets in Asia, Europe, and United States. The potential markets in the Caribbean for LNG are for small quantities at short to medium distances. There is very little experience building small LNG ships or barges and a limited number of shipyards are outfitted to produce these vessels. Getting reliable cost

Caribbean Regional Electricity Generation, Interconnection, and Fuels Supply Strategy – Final Report 7-13
data for these vessels is difficult because of the limited experience. Finding a shipyard to construct one at fair price will be difficult if it has a backlog of the larger world class size LNG tankers.
One of the problems with the Caribbean islands is that the larger ones with reasonable potential natural gas demands lack any internal gas pipeline system. They also have power plants spread around the islands. Therefore to deliver LNG to all the power plants would require the added cost of a pipeline distribution system. Unless the economics justified developing the pipeline system, the LNG market would be limited to the largest individual power plant or to power plants that are not too far apart. This reduces the market considerably and increases the unit gas delivery cost since the unloading terminal costs are not too sensitive to quantity of LNG delivered.
Obviously LNG was attractive for Puerto Rico and Dominican Republic when those two countries built their LNG receiving terminals. They were both associated with a large power plant complex situated adjacent to the terminal. For the rest of the Caribbean probably the only good candidates are Jamaica, Guadeloupe, Martinique, and Barbados. In the future, Cuba would be a prime candidate. The other markets are too small as the infrastructure of receiving terminals and storage is expensive and overwhelms any savings from gas displacing distillate of HFO.
Caribbean LNG Experience
AES Dominica has had good experience with LNG at their Andres facility. They receive a shipment approximately every 45 days. The gas cost covers shipping, which is arranged by BP. Their gas contract is based on taking a minimum gas volume per year. The price is indexed with a floor and a ceiling. They have experienced no safety incidents and weather hasn’t affected their ability to generate power. The electricity generated by their combined cycle power plant is one of the cheapest in the Dominican Republic next to hydroelectric and coal. The location of the re-gasification terminal is at the end of a peninsula distant from any residential areas. Tropical storms have not limited their ability to accept LNG.
From the Andres Terminal there is a 34 km pipeline that transports natural gas to two power plants that can generate 240 MW. There are also plans for an additional pipeline to other power plants as well as an LNG truck loading facility. They hope to expand the user base to industries that will eventually be fed by a future pipeline system.
Economics
Some preliminary cost evaluations were performed based on leasing existing LNG carriers and transporting to the islands where the LNG would be regasified on Floating Storage and Re-gasification Units (FSRU) permanently moored to a purpose-built jetty. One of the assumptions made is that the LNG would come from an existing facility and would not require a new stand-alone liquefaction plant. This improves the economics since it takes advantage of the economies of scale of world size LNG facilities already located in Trinidad. If a new facility were required along with its supporting utilities and infrastructure, none of the islands would be economic with LNG. The quantity of LNG required for the biggest demand is less than 8 % of the LNG production capacity in Trinidad and currently only 75% of the capacity is committed to long term contracts. Therefore no costs of new purpose-built liquefaction facilities were included and

Caribbean Regional Electricity Generation, Interconnection, and Fuels Supply Strategy – Final Report 7-14
it was assumed that the LNG storage and wharfs would be available at the Trinidad loading site. It was assumed that the LNG price FOB Trinidad would be similar to the price delivered to the US gulf coast, and that this cost included both the price of the gas supplied and the costs associated with the existing facilities.
The transportation cost of the LNG was developed based on leasing existing 130,000 cubic meter LNG carriers as needed to take a ship load to islands as needed similar to the current shipments to the Dominican Republic. There are currently many of these carriers idle as LNG demand has been reduced and many more LNG carriers ordered during the past few years are being delivered. This may not last but some of the new LNG carriers are in the 200,000 + cubic meter size and are more economic for the long hauls from gas producers in Australia and the Middle East to users in Asia and Europe. A total of 54 new LNG ships were delivered in 2008, bringing the world fleet size to 300.
The transportation costs for LNG were developed by estimating variable and fixed annual costs. The variable costs including a daily chartering rate for LNG carriers and other variable costs such as fuel, crew, insurance and tugs. An estimate for the yearly cost of a re-gasification vessel was obtained by one of the shipping companies to get an annual fixed cost that was independent of the amount of gas delivered. There are several companies that are taking older 135,000 cubic meter LNG carriers and adding modular re-gasification facilities on board as well as installing loading arms to transfer LNG from the transit carrier to the moored re-gasification vessel. These vessels have multiple months of storage for islands like Jamaica and others, but it is cheaper to convert these older ships than build a new one from scratch that had a smaller storage capacity. The cost of a purpose-built jetty was developed and a yearly amortization was calculated. Other costs that were unique to each island were developed such as pipelines to the power plants and other potential users. Figure 7-2 shows the LNG transportation costs for a range of power plant sizes, assuming gas demands based on a heat rate of 8,850 kJ/kWh and a plant capacity factor of 75%.
Analysis
The main advantages of LNG are the following:
LNG transport has a 45 year history of safety and no major incidents have occurred that resulted in a major loss of containment of LNG cargoes.
The storage available at the re-gasification facility provides continuous backup during hurricane season. Sufficient time exists prior to hurricanes to schedule deliveries to assure adequate storage during hurricanes such that no fuel switching is required.
A floating LNG Storage and Re-gasification Unit (FSRU) will have less environmental impact than an onshore based system. This negates some of the normal objections to siting of LNG re-gasification facilities. It can be built in less than 2 years and at a much lower cost than a land based facility.
The main disadvantages of LNG are the following:
It is questionable whether the demand on many of the islands is sufficient to justify the fixed costs of LNG facilities

Caribbean Regional Electricity Generation, Interconnection, and Fuels Supply Strategy – Final Report 7-15
These islands have many environmentally sensitive areas onshore and offshore so locating the unloading and storage areas will require added expense and available locations may be limited.
There is a negative public perception about LNG where a large quantity of volatile material is stored. The experience of the west coast and east coasts of the US are good examples of public resistance when attempting to locate LNG re-gasification terminals.
LNG terminals require a deep water berth which may be limited in these islands.
The FSRUs are fairly new, but several have been put in service this past year and the carriers have been in operating for over thirty years. Extra costs may be required to moor these in hurricane susceptible locations

Caribbean Regional Electricity Generation, Interconnection, and Fuels Supply Strategy – Final Report 7-16
LNG Transportation Costs
-
2
4
6
8
10
12
14
16
18
20
22
24
26
28
30
32
34
36
38
0 100 200 300 400 500 600 700 800
Power Generation, MW
Eastern Caribbean Islands
Jamaica
LN
G T
ran
spo
rtat
ion
Co
st,
$/G
j-H
HV
Basis- 75% Power Plant Utilization
Figure 7-2 LNG Transportation Costs

Caribbean Regional Electricity Generation, Interconnection, and Fuels Supply Strategy – Final Report 7-17
7.2.3.3 Mid-Scale LNG Option for the Caribbean Region
The delivery of the Interim Report permitted a developer of “mid-scale” LNG facilities and services to become aware of this Study. Mid-scale refers to systems designed for about 100,000 to 1,000,000 tonnes of LNG per year throughput, enough to serve power generation of 100 to 1,000 MW. The developer approached Nexant and provided information on their approach, which is tailored to the smaller markets that exist on many of the Study islands. The systems relevant to this Study would include a mid-scale carrier of 4,000 – 50,000 cubic meters, much smaller than the large tankers in the 135,000 to 250,000 cubic meter size discussed in the previous subsection. Storage and regasification facilities would be scaled from 5,000 to 80,000 cubic meters (about two to four weeks average gas send out) for the specific demands of each customer. The devloper indicates that its “right-sized” systems compensate for the loss of economies of scale with larger carriers and other facilities.
The developer provided cost data that can be used to compare with the transportation costs of other fuels. To make a consistent comparison, we adjusted their numbers to include the on-shore gas distribution facilities we assumed were needed to move gas to different power plants, as we had done for the other gas options. We then calculated the costs per GJ for each location. The resulting values indicated that, following the same procedures as previously, the mid-scale LNG option could produce the lowest cost fuel / generation technology combination for five locations. Table 7-6 shows the locations, the mid-scale LNG price, the previous lowest cost fuel, and the previous lowest cost fuel price. The fuel prices are levelized values over the period 2014-2028. On the three smaller islands, coal priced at 12.31 $/GJ is lower in price than mid-scale LNG, but the higher equipment cost and higher heat rates make the cost of power generation slightly higher for the coal-based technology than mid-scale LNG. On the two larger islands, mid-scale LNG price is about 10-20% lower than the large-scale LNG price.
Table 7-6 Mid-scale LNG Comparison
Antigua and
Barbuda Grenada St. Vincent & Grenadines Haiti
Jamaica North
Mid-scale LNG
Price, $/GJ 19.42 17.25 18.40 10.73 9.82
Generation Technology
10 MW MSD
10 MW MSD
10 MW MSD 20 MW LSD
20 MW LSD
Previous Fuels Distillate, coal
Distillate, coal
Distillate, coal LNG LNG
Previous Fuel Price, $/GJ
22.45, 12.31
22.45, 12.31
22.45, 12.31 12.73 10.90
Generation Technology
10 MW MSD, 10 MW CFB
10 MW MSD, 10 MW CFB
10 MW MSD, 10 MW CFB
20 MW LSD
20 MW LSD

Caribbean Regional Electricity Generation, Interconnection, and Fuels Supply Strategy – Final Report 7-18
The developer indicates that it plans to provide the LNG infrastructure as a service. The customer defines the scope of service, and the developer provides design, financing, fabrication, commissioning and operation of equipment to meet service scope. The arrangements would provide contractual certainty with respect to cost of service and operations. Contract length would be 15 – 25 years with fixed quarterly payments commencing at start of operations and escalating at reference inflation index. Payment would be based on pre-agreed availability and performance criteria. The customer will be responsible for gas procurement.
Mid-scale, or as other developers refer to it, small-scale LNG systems have been developed in Norway, where the current market is 120,000 tonnes per year. One developer’s 300,000 tonnes per year liquefaction plant is due to become operational in 2010 in Stavanger, Norway.
Analysis
The main advantages of mid-scale LNG are the following:
Similar advantages to the larger scale LNG facilities discussed in the previous subsection.
Based on the cost figures provided by the developer, mid-scale LNG could provide the most economically attractive option in some locations, especially for islands with smaller demand.
The technology involves smaller versions of more commonly used large facilities with proven track records
The developer proposes to finance the infrastructure facilities and offer the services on a fixed price basis
The main disadvantages of mid-scale LNG are the following:
Some similar disadvantages to the larger scale LNG facilities discussed in the previous subsection, though to a lesser degree: not applicable to the smallest islands, environmental issues, public perception of safety, cost of mooring in hurricane susceptible locations
Because the technology is smaller in scale than the commonly used equipment, Nexant was unable to verify or suggest revisions to the cost information presented
Several factors may lead to increased costs:
Most LNG loading facilities are used by much larger carriers and may be unwilling to reserve space for the smaller mid-scale carriers on a regular basis. It may be necessary to develop separate docking facilities, with associated costs, to serve the smaller carriers. No costs for separate docking facilities are included.
The costs for the current mid-scale LNG system include minimal (one to two weeks) storage. Additional storage will increase the LNG unit price.
If demand increases rapidly the initial LNG carriers may have to be replaced with larger vessels, or larger vessels purchased initially.

Caribbean Regional Electricity Generation, Interconnection, and Fuels Supply Strategy – Final Report 7-19
Vessels will be purpose built for these markets, each having to be designed for the specific application. The large scale LNG analysis was based on chartering existing LNG vessels and using existing retired large vessels to convert to Floating Storage and Regasification Units (FSRU).
Our preliminary analysis indicates that mid-size LNG could be a viable fuel option for some islands, justifying a more detailed analysis.
7.2.3.4 CNG Option for the Caribbean Region
All of the Caribbean islands would like to diversify their fuel mix as well as reduce carbon emissions. One way to accomplish this is by substituting natural gas for petroleum liquids. Trinidad, Venezuela, and Colombia are the main suppliers of natural gas at this time, but Trinidad is the only country which has a well-developed natural gas industry which is exporting its gas. Trinidad exports its natural gas in large quantities to markets as distant as Europe. Clearly, for producing large gas quantities and transporting it long distances, LNG is the most economic method. However, for smaller quantities and shorter distances Compressed Natural Gas (CNG) has the potential to be the most cost effective option. There has been interest in CNG marine transport in the Caribbean since the mid 1980s, with several projects proposed but none implemented.
CNG Development
CNG has been used for transportation vehicles since the 1960s, but it was based on overland pipelines to get the gas to the CNG filling stations. The idea of marine transport of CNG has been around since the 1960s with designs that were proposed to shipping agencies such as the American Bureau of Shipping (ABS) for certification. These early designs depended on multiple storage vessels stacked on a ship and based on American Society of Mechanical Engineers (ASME) codes used in oil refinery construction. This resulted in very costly systems that were never economic. In the 1990s several parties convinced the certification agencies that pipeline codes could be used to design the high pressure containers. This reduced the weight of steel required per unit of gas stored. Because of the increased activity in getting stranded gas to markets there are now several groups that have developed novel designs for CNG marine transportation. Each is trying to provide the lowest cost containment per unit of gas. Some systems utilize refrigeration to increase the gas density such that the same quantity of gas can be stored at a lower pressure. Other designs utilize miles of coiled pipe that have simpler fabrication and fewer connections. Another system utilizes composite materials other than steel, while other systems use composite wrapped steel which reduces the thickness of the steel. Some have proposed a refrigerated pressurized liquefied gas to increase the weight of gas per volume. Several of these designs have been approved by the certification agencies ABS and Det Norske Veritas (DNV) and are ready to be used in a commercial design. However, there has been no commercial CNG marine vessel built worldwide at this time.
CNG Prospects in the Caribbean
Most of the CNG transportation systems that have been proposed lately are self propelled ships designed to deliver large quantities (500-800 MMscf) of gas short distances. The smallest of these vessels can deliver 50 MMscf of gas. Almost all the promoters of these systems propose a

Caribbean Regional Electricity Generation, Interconnection, and Fuels Supply Strategy – Final Report 7-20
shuttle system whereby one vessel is loading, one vessel is unloading, and one or more vessels are in transit depending on the distance from the supplier to the unloading facility. Therefore, at least three vessels are required. There is normally limited on-site storage at the customers unloading facility, so the vessel unloads at the normal gas consumption rate to the power plant and waits until the ship in transit arrives. Almost all of the equivalent natural gas demands for the Caribbean islands are below 25 MMscf per day (MMscfd) and most are below 10 MMscfd. For the ship CNG options, the fixed cost do not decrease much below about 50 MMscfd, meaning that the unit cost of gas delivered increases as daily volumes decline. Nevertheless, CNG could still be beneficial for all parties depending on the price differential between what the power utility can negotiate for gas and what it is paying for distillate or fuel oil. This leaves islands such as Jamaica, Martinique, Guadeloupe, Dominican Republic, and possibly Haiti as the best candidates. Barbados is also a candidate since it is quite close to Trinidad (less than one day distant).
Economics
The promoters of the CNG transportation systems also want to operate with a take or pay transportation tariff. They can provide the capital to buy the ships and the loading and unloading facilities and in turn charge a unit rate with a minimum yearly charge to deliver the gas. As with the pipeline option, the gas contract is between the final customer and the gas producer. The economics are dependant on the gas price and how it varies with known indexes such as Henry Hub and the expected petroleum prices. We have received some confidential economics from some of the CNG systems and it appears that there are some niche markets where CNG is competitive with other gas delivery systems. The most attractive markets have short transportation distances delivering large volumes of gas.
The transportation cost of CNG was developed by assuming the gas was contained in pipeline pipe at high pressure and transported in purpose-built ships. For a given CNG ship storage capacity, a weight of steel was estimated based on pipe wall thickness calculated using pipeline codes which have been approved by the certification agencies ABS and DNV. Ship cost and propulsion requirements were estimated based on the volume and weight of the containers plus the gas. The number of ships required was based on distance from gas producers to the gas users, the speed of the ships, and the loading/unloading times and mooring/unmooring times at each end of the transportation cycle. This assumes that as a vessel finishes unloading an arriving fully loaded vessel is ready to begin unloading. The cost of a loading terminal consisting of dehydration and compression equipment was estimated using a commercial cost estimating program. The cost of a loading jetty was estimated assuming it had to accommodate a deep draft vessel with a pipeline from shore with loading arms. At the unloading facility there is a similar jetty with unloading arms, a pipeline to shore and equipment on shore to control the gas temperature. These are the fixed costs. The variable costs consist of the cost of the compression along with its operating, maintenance, insurance and tax costs. The shipping variable costs consist of fuel, crew, insurance, tugs, port fees and maintenance costs.
For delivery to countries in the Eastern Caribbean, it was assumed that the gas originated in Trinidad. For delivery to the northern countries such as Jamaica, Haiti and Dominican Republic, the gas originated in Colombia or Venezuela since the distances from there were the shortest. The CNG costs that were developed were in a reasonably close agreement with the confidential
Caribbean Regional Electricity Generation, Interconnection, and Fuels Supply Strategy – Final Report 7-21
costs supplied by some of the CNG developers. CNG was cheaper than the other natural gas options in both Grenada and St. Vincent. However, in these two countries, liquid fuels were the cheapest. CNG was not the least cost natural gas option for any of the countries in the northern Caribbean.
Figure 7-3 shows the CNG transportation costs for a range of power plant sizes, assuming gas demands based on a heat rate of 8,850 kJ/kWh and a plant capacity factor of 75%.
Analysis
The main advantages of CNG are the following:
The financing can be provided by the CNG promoter
The CNG investment can be spread over future years as expansion, when needed, can be accomplished by adding additional CNG vessels or switching them to larger vessels.
If dehydration and compression plant is barge mounted, it can be redeployed to another gas source.
Some of the designs have been approved by international ship classification agencies ABS and DNV
The disadvantages of CNG are the following:
On-site storage is expensive so fuel switching is required during weather delays and planned and unplanned shutdowns. If no on-site storage is available or if two docking berths with the required manifolds are not included, fuel switching may be required each time a CNG ship connects and disconnects.
There are no commercial CNG marine transportation systems in operation worldwide today. So there will be the usual problems associated with operating a first of a kind system.
Small countries may be reluctant to be the first users of first of a kind technologies.
There are more safety and security concerns of the public with storing very high pressure gases dockside.
More trips are required in and out of the loading and unloading terminals than LNG. If the harbors have restricted operating hours, this would result in more vessels required and an underutilization of the vessels
When high pressure gas is depressurized during unloading, overcooling of the gas due to auto-refrigeration must be controlled to protect the downstream piping and equipment.

Caribbean Regional Electricity Generation, Interconnection, and Fuels Supply Strategy – Interim Report 7-22
CNG Transportation Cost vs MW & Shipping Distance
0
2
4
6
8
10
12
14
16
18
0 100 200 300 400 500 600 700 800
Power Generation, MW
CN
G T
ran
spo
rtat
ion
Co
st, $
/Gj-
HH
V
1100 Nautical Miles
600 Nautical Miles220 Nautical Miles
Basis 75% Power Plant Utilization
Figure 7-3 CNG Transportation Costs
Caribbean Regional Electricity Generation, Interconnection, and Fuels Supply Strategy – Final Report 7-23
7.3 FUEL STORAGE OPTIONS
7.3.1 Introduction
For many of the islands in the Caribbean, the petroleum fuel demand is too small to get the same bulk pricing as the larger markets. Delivery costs are higher per unit when the delivered quantities are smaller. Many of the islands have limited storage which makes them susceptible to shortages in the event of interruptions due to a scarcity of petroleum tankers, major weather events, or worldwide oil supply shortages. Fuel deliveries may go to larger markets first in the event of fuel shortages. Having larger regional/sub-regional storage facilities may offer a solution to a more secure and cheaper fuel supply to these islands. To assure fuel security, a three month supply is preferred. To achieve this security, there will be costs for additional storage facilities as well as for interest on the cost of the increased inventory.
Another factor that existed for some time is that the major oil companies located storage facilities next to large power plants and those power plants were dependent on the oil companies for their supplies. Having regional storage adds more flexibility to the power plants to obtain their liquid fuel supplies.
The larger islands and groups of islands have existing refineries which process crude and store petroleum products such as gasoline, jet fuel, diesel, and heavy fuel oil for domestic consumption and store imported petroleum products above what they refine. Some of the storage is at the refineries and other storage is at the power generation facilities. Because Jamaica, Haiti, and Dominican Republic are remote from the smaller islands in the Eastern Caribbean, they would not be a part of a regional storage solution.
7.3.2 Existing Storage
In the eastern Caribbean countries there are already four centralized storage facilities that serve as transshipment storage facilities for delivery to nearby islands. In St. Lucia, Hess Oil operates a 9 million barrel storage facility at Cul de Sac that handles both crude and petroleum products. Several years ago Hess entered into discussions with the Venezuelan oil company PDVSA to store crude and petroleum products for delivery to other countries with Petro-Caribe agreements. In St. Lucia, LUCELEC also has three weeks of storage at its Cul de Sac power plant.
In Antigua the West Indies Oil Company (WIOC) has 200,000 barrels of storage at the location where they used to have a refinery. WIOC has an agreement with PDVSA to lease some of its storage to deliver to neighboring islands. Half the storage is for PDVSA and the other half is for Antigua and Barbuda. Currently due to limited storage in Antigua, a tanker may only deliver a fraction of its shipping storage capacity if no other islands have deliveries scheduled. This can significantly increase the shipping cost.
In Martinique, there is a 17,000 barrel per day refinery that supplies finished products for Martinique as well as the other French islands. There is crude oil storage capacity of 1 million barrels which is for two months of operation of the refinery. In addition, there is an additional 503,000 barrels of storage for finished products for domestic consumption as well as for delivery to other islands. Guadeloupe also has its own storage of 630,000 barrels of finished products which is 45 days of storage. Martinique has sometimes in the past rented storage space in St.

Caribbean Regional Electricity Generation, Interconnection, and Fuels Supply Strategy – Final Report 7-24
Lucia for refined products when the refinery was being revamped to make the latest specification of refined products.
There is a fourth regional storage and transshipment facility owned by NuStar Energy in St. Eustatius (Netherland Antilles) which has 13 million barrels of storage for crude oil and other refined petroleum products. NuStar leases 5 million barrels to a major oil producer which receives the crude in large crude carriers where it can be transferred to smaller crude carriers for further distribution in the region. Much of the remaining storage is leased to other parties for use as transshipment storage of distillate and residual fuels. The facility includes a 25,000 barrels per day (BPD) atmospheric topping unit. NuStar operates a bunkering service that delivers bunker fuel to cruise ships and other marine vessels in the region. They also have tugs to help to facilitate mooring at their facilities. This is a potential candidate for regional and sub-regional storage that is already in place. PDVSA has also had discussion with NuStar about leasing storage at their facility.
Whether these facilities could be part of a regional storage facility would require further discussions with these operators.
7.3.3 Economics
If larger tankers can be used to transport products, delivery costs per unit of fuel can be reduced as long as additional storage can be provided. A Handymax size product tanker in the Caribbean can transport 300,000 barrels of products. Compared to a tanker that holds 100,000 barrels, this would reduce the shipping cost by over half. However to handle this larger load an additional 200,000 barrels of tankage must be provided. In addition, interest must be paid on the cost of the additional inventory. Three different regional storage options were evaluated based on islands that are within 130 nautical miles of each other. The assumption is that a large tanker would deliver crude from one of the four large Caribbean refineries to a regional storage facility and then be shipped by smaller tanker or barge to each individual island. The four large refiners are Valero’s Aruba refinery, PDVSA’s Curacao refinery, Hess’s St. Croix refinery and Petrotrin’s Trinidad refinery. These are all approximately 500 nautical miles from the four potential regional storage facilities.
The first scenario is expanding the facility in Antigua to serve Nevis, St. Kitts, Barbuda, and St. Maarten. These are all within 87 nautical miles from Antigua. If 200,000 barrels is added, the shipping costs can be reduced from $3.2 million per year to $1.3 million per year. However, $8.4 million is required to develop the storage facilities. After amortizing the new tankage and adding interest on the cost of the additional inventory, the cost exceeds the shipping costs savings of using a larger delivery ship. This scenario is marginally unattractive although with a smaller incremental tankage it could be considered.
The second scenario is expanding the facility in St. Lucia to serve Dominica, Grenada, and St. Vincent and the Grenadines. These islands are within 130 nautical miles of St. Lucia. If 200,000 barrels are added, the shipping cost is reduced from $3.9 million to $1.9 million. As in the first scenario, $8.4 million is required to develop the storage facilities. After amortizing the new tankage and adding interest on the cost of the additional inventory, the cost is less than the shipping costs savings of using a larger ship. Thus having additional storage in St. Lucia is

Caribbean Regional Electricity Generation, Interconnection, and Fuels Supply Strategy – Final Report 7-25
economic as there is a potential savings of approximately $130,000/year (see Table 7-8). Since there already is sufficient tankage in St. Lucia, this is the logical place for regional storage.
The third scenario is expanding of expanding tankage in Martinique to serve the French island of Guadeloupe. This facility is not necessary since there already is sufficient tankage here to handle the large ships which carry upwards of 800,000 barrels. In addition, the other French territory, Guadeloupe, has product storage equivalent to two months’ supply and is large enough to be supplied by large product tankers. No additional storage is needed there.
Table 7-7 summarizes regional petroleum consumption for the three scenarios. Table 7-8 provides details on the analysis summarized in the text above.
Table 7-7 Regional Petroleum Consumption
Countries
2008 Oil Consumption,
Barrels/day
Storage for 1 Month
Consumption, Barrels
Storage for Annual
Consumption, Barrels
Scenario 1- Storage Terminal at Antigua Antigua & Barbuda 4,560 136,680 1,664,400 St. Kitts & Nevis 980 29,400 357,700 Montserrat 530 15,900 193,450 Total 181,980 2,215,550
Scenario 2 Regional Storage at St Lucia Dominica 850 25,530 310,250 Grenada 2,200 66,000 803,000 St. Lucia 2,800 84,000 1,022,000 St. Vincent 1,600 48,000 584,000 Total 223,530 2,719,250
Scenario 3 Regional Storage at Martinique
Guadeloupe 14,800 444,000 5,402,000 Martinique 16,080 482,400 5,869,200 Total 926,400 11,271,200

Caribbean Regional Electricity Generation, Interconnection, and Fuels Supply Strategy – Final Report 7-26
Table 7-8 Summary of Economic Analysis
Martinique
Storage Antigua Storage
St. Lucia Storage
Total Yearly Consumption, Million Barrels 11.27 2.21 2.72
Fixed Cost Additional 200,000 Barrel Storage Tanks, Million US$
N/A – Adequate Today
8.4 8.4
Variable Costs 100,000 Barrel Small Tanker Delivery Cost@$1.43/BBL, Million US$/yr
N/A 3.15 3.89
300,000 Barrel Handimax Tanker Delivery Cost @$0.66/BBL, Million US$/yr
N/A 1.51 1.85
Tanker Savings, Million US$/yr N/A 1.66 2.04 Storage O&M Cost N/A 0.08 0.08 Insurance Cost N/A 0.08 0.08 Interest on 200,000 BBLs Inventory, Million US$/yr
N/A 0.75 0.75
Storage Tank Amortization, Million US$/yr N/A 0.99 0.99 Yearly Savings , Million US$/yr N/A -0.25 0.13
7.3.4 Conclusions
Almost all the countries in the Eastern Caribbean have signed the Petro-Caribe agreements. In these agreements the countries get a base price for the refined products based on an index. The countries then pay for shipping costs. By having sufficient storage, the maximum size ship can be used to deliver the refined products to the regional storage facility. This minimizes the cost to the regional storage facility. PDVSA also provides one or two months of free financing so interest on inventories may apply. However, how long this arrangement will last is unknown. There is still the cost of transshipping the products to each individual island and the economics of this depend on the storage at each individual island although the distances are within 10 hours of transit time. To properly optimize the regional storage, a detailed look at individual storage at each island is required and the cost to transship from the regional storage facilities to each island.
The most cost effective system to maximize the existing storage is to have some coordinated purchase and products delivery system whereby a large vessel was to call on all the islands and deliver sufficient products to fill each islands storage while starting with a full vessel load of products. This may result in some islands skipping shipments during some delivery schedules or it may require that some islands have additional storage to fill out the deliveries. Currently the small islands such as Antigua/Barbuda, St. Kitts/Nevis, Montserrat, Dominica, Grenada, St.

Caribbean Regional Electricity Generation, Interconnection, and Fuels Supply Strategy – Final Report 7-27
Lucia, and St. Vincent consume a total of approximately 400,000 barrels per month. This is sufficient for a large ship to deliver 300,000 barrels every three weeks. As long as each island has three weeks storage, they could all take advantage of the reduced shipping costs of a large tanker. If Barbados were added they could take advantage of a 700,000 barrel tanker. If they all had two months storage they could take advantage of the reduced cost of a 800,000 barrel tanker. This would require coordination and agreements from many parties.
The key player in all of this petroleum storage and supply is PDVSA, which is part owner of two of the four major refineries in the region and also has shown interest in being part owners of the storage in several of the islands. This may limit what can be done with regional storage facilities.
There are also non-economic advantages of large regional storage such as the ability to get products from nearby when there is a major worldwide shortage of oil or when there are short term spikes in oil prices. Like the US Strategic Petroleum Reserve, products could be withdrawn from a regional storage facility in the event of a short time crisis as long as it didn’t last more than a few months. These products could be placed in the regional storage facilities when the oil prices were low. However, it is difficult to define exactly when prices are “low” or “high” until after the fact, and there would still be the inventory cost.
7.4 FUEL PRICES AND PROJECTIONS
The objective of the fuel price analysis was to determine the prices for different fuels and then select the fuels for each country to be used in screening and scenario analysis.
The general basis for all prices was the March 2009 EIA report on fuel supply, prices, and other parameters, Report #:DOE/EIA-0383(2009). Those historical and forecast prices were expressed in 2007 US$ and in $/Million BTU. We converted these prices to 2009 $/GJ by multiplying them by the ratio of the 2009 GDP deflator to the 2007 deflator (1.035577), and to $/GJ by dividing using the number of GJ per million BTU (1.0546).
We based our prices on deliveries for Electric Power of Distillate, HFO, Natural Gas, and Steam Coal, and Coal for Exports. Table 7-10 presents the resulting forecast prices after the adjustments mentioned in the paragraph above. We modified these prices to reflect expected prices in the Caribbean.
We related the liquid fuel prices to the Caribbean based on the ratio of LUCELEC distillate import prices over 2001 – 2008 to the US price, a factor of 1.12. The yearly range was 1.07 to 1.15.
We related the price of LNG Imports from January 2005 through June 2009 to US natural gas deliveries to electric power, a factor of 0.998306. We assumed that that price would apply to the Caribbean islands, plus the costs and losses of the at-island re-gasification facilities.
We assumed that gas sold to be liquefied to LNG was sold at a price below the received price in the US, so that the costs and losses of gasification and transport to the US could be accounted for. From an earlier Nexant study we estimated these costs to be $1.50/million BTU and the losses to be 9.1% of the input gas.

Caribbean Regional Electricity Generation, Interconnection, and Fuels Supply Strategy – Final Report 7-28
We assumed that the cost of pipeline gas at the islands would be equal to the calculated input gas price for LNG, as describe in a bullet above, plus the cost of the pipeline and related facilities.
We assumed that the cost of CNG at the islands would be equal to the calculated input gas price for LNG, as describe in a bullet above, plus the cost of transportation and related facilities.
We assumed that the price of coal at the islands would be equal to the Coal for Exports price, plus the cost of transportation and related facilities. This price correlates well with the price of coal FOB Colombia, Puerto Bolivar, which is also a source of supply.
In Section 7.2 we estimated the capital and O&M cost of the transportation and related facilities for coal, CNG, LNG, and pipeline gas. We separately determined the fixed costs that did not vary with the amount of fuel transported for the range of interest, and the variable costs that did. In all cases fixed annual costs (typically for capital improvements) were a major component of the total cost of transportation. By adding the transportation costs to the basic fuel price, we obtained the cost of fuel at the islands’ power plants.
Except for pipeline gas, Section 7.2 does not calculate a fuel price for each island separately. Instead we estimated costs for several combinations of demand and distance from the source to an island. The graphs in Figures 7-1 (coal), 7-2 (LNG) and 7-3 (CNG) show the price as a function of the amount of fuel transported, as expressed by the amount of power demand in MW at 75% capacity factor. Only for CNG was the distance from the source to the island a major factor, and only Figure 7-3 presents cost results for three different distances: 220, 600, and 1,100 nautical miles.
In each case we developed equations to represent the relationships expressed in the graphs of Figures 7-1, 7-2, and 7-3. There are separate equations for coal, LNG, and three equations for CNG, one each for 220, 600, and 1,100 nautical miles. In each case the equation is of the form
Cost of transportation in US$ = X + Y * MW
Cost of transportation in US$/GJ = (X + Y * MW) / GJ transported
Table 7-9 presents the values of X and Y for each case.
Table 7-9 Transportation Cost Parameters
Case X Y Coal 8,920,000 20,500 LNG 62,350,000 18,000 CNG 220 Nautical Miles 62,300,000 140,000 CNG 600 Nautical Miles 70,000,000 230,000 CNG 1,100 Nautical Miles 85,000,000 307,000

Caribbean Regional Electricity Generation, Interconnection, and Fuels Supply Strategy – Final Report 7-29
We assumed that the fuels would be available starting in 2014, and used throughout a 15 year (through 2028) study period. We sized the facilities to accommodate the 2028 demand.
Gas can replace distillate or HFO in existing power plants, with some conversion cost. For gas, for most islands the 2028 demand assumed 85% of total generation was from gas at a heat rate of 8,400 BTU/kWh. We used a smaller percentage for some islands with significant existing generation from non-liquid fuels or other factors that would reduce gas demand.
Coal cannot replace the liquid fuels in existing facilities, so the demand for coal is limited by the demand increase through 2028 and the other power plants that could come on line by then. For each island we estimated the demand that could be served by coal by 2028.
The actual demand each year before 2028 is less than in 2028, meaning the cost of transportation will be higher because the fixed costs are spread over fewer GJ.
The goal was to select fuels for further analysis that are lower in price than distillate and therefore offered the possibility of reducing costs in screening and scenario analysis. Based on two rounds of analysis we selected the lowest cost gas option (CNG, LNG, or pipeline), coal (except on Dominica), and distillate as the fuels to be used in screening and scenario analysis. Table 7-11 presents the fuels for each country and their levelized costs including the impact of lower demand in the years before 2028. Every country except Dominica has at least one fuel lower in price than distillate, and Dominica has the possibility of geothermal power, not shown in this fossil-fuel analysis.
Screening analysis used only the levelized values. Scenario analysis used the yearly values presented in Table 7-12. Those analyses include other cost factors, not just the fuel prices.
Observations
The EIA US price for HFO from 2006 through 2008 (not shown) averaged 60% of the distillate price. The forecast 2009 price is 54% of distillate. The HFO price levelized over 2009 – 2028 is 88% of distillate and is 90% in 2028. The EIA therefore forecasts a large reduction in the premium paid for distillate compared to HFO. If this change does not occur, the incentive to switch from distillate to HFO will remain.
The prices for natural gas delivered via pipeline or as LNG in the Caribbean are based on the EIA forecast of the price of natural gas in the US, plus transportation costs. The US price for natural gas levelized over the study period is 37% of the comparable price of distillate. In the Caribbean, the levelized price of pipeline natural gas to (for example) St. Lucia is 51% of the comparable distillate price. These relatively low percentages are consistent with historical data. However, if the price of natural gas relative to distillate rises the benefit of natural gas will be reduced accordingly.

Caribbean Regional Electricity Generation, Interconnection, and Fuels Supply Strategy – Final Report 7-30
Table 7-10 EIA US Fuel Prices, $/GJ
Prices in 2009 dollars per GJ 2009 2010 2011 2012 2013 2014 2015 2016 2017 2018 2019 2020 2021 2022 2023 2024 2025 2026 2027 2028
Electric Power
Distillate 14.34 14.81 15.96 17.55 18.07 18.90 19.54 19.73 19.77 19.85 20.01 20.08 20.23 20.43 20.37 20.65 20.90 21.12 21.42 21.94
HFO 7.86 12.97 14.21 15.77 16.49 17.31 17.86 18.03 18.11 18.17 18.30 18.22 18.41 18.58 18.55 18.72 18.91 19.07 19.39 19.71
Natural Gas 6.21 6.47 6.43 6.58 6.48 6.50 6.59 6.69 6.82 7.00 7.14 7.02 6.83 6.92 6.99 7.32 7.59 7.85 8.09 8.29
Steam Coal 1.88 1.86 1.87 1.88 1.89 1.90 1.91 1.89 1.88 1.88 1.88 1.88 1.88 1.89 1.90 1.91 1.92 1.94 1.95 1.96Coal for Exports 3.34 3.24 3.25 3.33 3.35 3.39 3.43 3.48 3.50 3.53 3.50 3.46 3.48 3.52 3.52 3.51 3.47 3.46 3.41 3.34
Table 7-11 Fuel Prices Based on Yearly Demand 2014-2028
Country Fuels Selected in Addition to
Coal and Distillate Levelized Fuel Price, US$/GJ
Fuel Selected Coal Distillate Antigua and Barbuda None N/A 12.31 22.45 Barbados Pipeline Gas 7.39 7.77 22.45 Dominica Distillate only N/A N/A 22.45 Dominican Republic LNG 8.73 4.19 22.45 Grenada None N/A 12.31 22.45 Guadeloupe Pipeline Gas 10.88 7.77 22.45 Haiti LNG 12.73 7.77 22.45 Jamaica LNG 10.16 4.85 22.45 Jamaica North LNG 10.90 4.85 22.45 Martinique Pipeline Gas 8.99 7.77 22.45 St. Kitts and Nevis None N/A 12.31 22.45 St. Lucia Pipeline Gas 10.49 9.04 22.45 St. Vincent and Grenadines None N/A 12.31 22.45

Caribbean Regional Electricity Generation, Interconnection, and Fuels Supply Strategy – Final Report 7-31
Table 7-12 Yearly Prices for Fuels for Caribbean Power Plants
FUEL
Levelized
2009-2028
Levelized
2014-2028
Year 2009 2010 2011 2012 2013 2014 2015 2016 2017 2018 2019 2020 2021 2022 2023 2024 2025 2026 2027 2028
Distillate 16.06 16.59 17.87 19.65 20.24 21.17 21.89 22.10 22.14 22.24 22.41 22.49 22.65 22.88 22.81 23.13 23.41 23.66 24.00 24.57 20.41 22.45
HFO 8.81 14.53 15.91 17.66 18.46 19.39 20.00 20.20 20.28 20.35 20.50 20.40 20.62 20.81 20.77 20.96 21.18 21.36 21.71 22.07 17.87 20.46
LNG Dom Rep 9.09 9.15 8.94 8.94 8.72 8.62 8.61 8.62 8.67 8.78 8.84 8.66 8.42 8.45 8.48 8.77 9.00 9.21 9.42 9.59 N/A 8.73
LNG Haiti 16.06 16.59 17.87 19.65 20.24 14.27 13.77 13.36 13.06 12.86 12.65 12.24 11.79 11.64 11.49 11.63 11.73 11.82 11.91 11.98 N/A 12.73
LNG Jam 16.06 16.59 17.87 19.65 20.24 12.05 11.16 10.59 10.23 10.04 9.88 9.52 9.15 9.07 9.00 9.21 9.38 9.55 9.71 9.84 N/A 10.16
LNG Jam North 16.06 16.59 17.87 19.65 20.24 11.42 11.24 11.10 11.01 11.00 10.96 10.69 10.36 10.31 10.25 10.48 10.65 10.80 10.96 11.07 N/A 10.90
GP Barb 16.06 16.59 17.87 19.65 20.24 7.18 7.21 7.25 7.32 7.44 7.51 7.36 7.13 7.17 7.20 7.48 7.70 7.91 8.11 8.27 N/A 7.39
GP Mart 16.06 16.59 17.87 19.65 20.24 8.81 8.83 8.86 8.93 9.04 9.11 8.95 8.72 8.75 8.76 9.04 9.25 9.45 9.64 9.79 N/A 8.98
GP StL 16.06 16.59 17.87 19.65 20.24 10.41 10.41 10.43 10.47 10.57 10.62 10.44 10.20 10.21 10.21 10.47 10.67 10.85 11.03 11.17 N/A 10.49
GP Guad 16.06 16.59 17.87 19.65 20.24 10.91 10.89 10.88 10.90 10.98 11.01 10.81 10.55 10.55 10.53 10.77 10.96 11.13 11.30 11.42 N/A 10.88
Coal 10&20MW N/A N/A N/A N/A N/A 14.96 14.25 13.64 13.08 12.59 12.10 11.64 11.28 10.98 10.67 10.37 10.07 9.81 9.54 9.25 N/A 12.31
Coal 25MW N/A N/A N/A N/A N/A 8.96 9.00 9.06 9.08 9.11 9.08 9.03 9.05 9.10 9.10 9.08 9.05 9.04 8.98 8.91 N/A 9.04
Coal 25&50MW N/A N/A N/A N/A N/A 8.96 8.65 8.40 8.15 7.94 7.69 7.45 7.29 7.18 7.04 6.89 6.73 6.60 6.45 6.28 N/A 7.77
Coal 100&200MW N/A N/A N/A N/A N/A 5.11 5.06 5.03 4.98 4.94 4.85 4.76 4.73 4.74 4.70 4.65 4.58 4.54 4.46 4.36 N/A 4.85
Coal 200&500MW 4.36 4.21 4.18 4.21 4.20 4.21 4.23 4.25 4.25 4.26 4.21 4.16 4.16 4.19 4.18 4.15 4.10 4.08 4.02 3.94 4.21 4.19
YEARLY PRICES FOR FUELS FOR CARIBBEAN POWER PLANTS, US$/GJ
First 4 Rows Below Apply to New Coal Plants from 2014. DR Existing Plant Uses Coal from 2009.
Distillate Prices Apply for 2009 - 2013 for Existing and New Plants That Eventually Will Use Gas
The countries for which the fuel prices apply are: Distillate and HFO, all countries; LNG Dom Rep, Dominican Republic; LNG Jam, Jamaica; LNG Jam North, Jamaica North Coast; GP Barb, Barbados; GP Mart, Martinique; GP StL, St. Lucia; Guad, Guadeloupe; Coal 10&20MW, Antigua and Barbuda, Grenada, and St. Vincent and Grenadines; Coal 25MW, St. Lucia; Coal 25&50MW, Barbados, Guadeloupe, Haiti, and Martinique; Coal 100&200MW, Jamaica and Jamaica North; Coal 200&500MW, Dominican Republic

Caribbean Regional Electricity Generation, Interconnection, and Fuels Supply Strategy – Final Report 8-1
Section 8 Generation Technologies and Expansion Options
Section 8.1 is an overview of the regional types of generating plants. In Sections 8.2 and 8.3 we provide descriptions of, and cost and performance estimates for, a range of fossil-fueled and renewable energy technologies that offer potential benefits to the Study islands. Section 8.4 addresses the availability of renewable energy resources in the Study islands. Section 8.5 covers the upgrade and retrofit of existing units. Section 8.6 reviews and assesses existing and proposed renewable energy projects.
8.1 REGIONAL OVERVIEW
The Caribbean region’s primary fuels for electrical power generation are the oil-based products distillate and HFO. Coal and natural gas fuel a limited amount of generation in the Dominican Republic and natural gas fuels some generation in Barbados and Trinidad and Tobago. Therefore the main Caribbean generation technologies used today can burn those fuels. Figure 8-1 shows the distribution of generation technologies in the nine main Study countries plus Barbados and Martinique. The values shown are the current net capacities, in MW, including the impact of any capacity reductions for technical or other reasons. Distillate and natural gas fueled gas turbines and combined cycles provide 32% of the total, of which more than two-thirds is fueled by distillate. Distillate and HFO fueled medium and low speed diesel engines (MSD and LSD) supply 36% of the capacity. Steam turbines provide 19% of the capacity, of which more than two-thirds is fueled by HFO, with the remainder using coal. Hydro contributes 11% of the total, with wind, photovoltaic, municipal waste, and cogeneration (Other) combined amounting to about 1%.
Existing Generation Technologes, MW
886
692
9001115
650
551 47Comb Cyc
Gas Turb
Stm Turb
LSD
MSD
Hydro
Other
Figure 8-1 Existing Generation Technologies

Caribbean Regional Electricity Generation, Interconnection, and Fuels Supply Strategy – Final Report 8-2
Altogether 71% of the installed generation capacity is fueled with distillate and/or HFO. Natural gas supplies 11%, coal 6%, hydro 11%, and “Other” 1%. In other words, the highest price fuels are by far the main sources of generation.
Given this dependence on high-priced liquid fuels, the diversification of the fuel mix and use of renewable resources offers the potential to lower costs and reduce emissions.
One of the main goals of the Study is to investigate the feasibility for expansion in the use of potentially less expensive non-liquid fuels, specifically natural gas and coal, and renewable energy resources. All these resources except coal will be less polluting than the liquid fuels. As the results will show, some of the renewable energy resources will also be less expensive than the liquid fuels, as will the use of coal and natural gas for some islands.
Figure 8-2 illustrates the range of capital costs for various fossil and renewable energy power generation options potentially suitable for the Caribbean. Nexant’s estimates are based on studies from the Electric Power Research Institute (EPRI), the United States Department of Energy (US DOE), the National Energy Research Laboratory (NREL), and the World Bank, and recent project announcements.
The costs are based on US conditions and were not adjusted in attempt to make them Caribbean-specific. We would expect Caribbean equipment costs to be about the same and labor costs less; site-related costs could be higher or lower.
The abbreviations in Figure 8-2 have the following meanings:
PV - photovoltaic
CSP - concentrating solar power
CFB – circulating fluidized bed

Caribbean Regional Electricity Generation, Interconnection, and Fuels Supply Strategy – Final Report 8-3
Small Wind
Large Wind
CSP
PV Commercial
Geothermal
Biomass
Land Fill/Bio Gas
Gas Turbine
NG Combined Cycle
Coal
Small DieselLarge Diesel
PV Residential (aggregated)
CFB
0
1,000
2,000
3,000
4,000
5,000
6,000
7,000
8,000
0.1 1 10 100 1000
$/kW
Capacity MW
Capital Cost vs. MW for Generation Technologies
Figure 8-2 Capital Cost Estimate for Power Projects in US

Caribbean Regional Electricity Generation, Interconnection, and Fuels Supply Strategy – Final Report 8-4
8.2 FOSSIL FUEL TECHNOLOGIES – COSTS AND PERFORMANCE
The bullet list below presents the fossil technologies we included in our evaluation. We considered capacity ranges that included small units that would be appropriate for the islands with low demand.
Pulverized coal (PC) fired steam plant: 100 - 750 MW
Coal fired circulating fluidized bed (CFB) plant: 10 - 50 MW
Simple cycle combustion gas turbine (CGT) plant: 10 - 100 MW
Combined cycle gas turbine (CCGT) plant: 100 - 300 MW
Low and medium speed (LSD, MSD) gas and distillate fueled diesel engines: 5 - 50 MW
The study did not examine integrated gasification combined cycle (IGCC) plants due to higher costs and lack of experience with IGCC plants are currently in operation. Similarly, HFO fueled boiler steam plants were not included, as HFO can also be used in low or medium speed diesel engines more cost effectively.
8.2.1 Pulverized Coal Fired Steam Plant
PC plants are the most common electricity generation unit throughout the world. The PC plants normally use bituminous coal, sub-bituminous coal, or lignite as fuel. They can also use petroleum coke, oil shale, or tar sands as fuel. The fuel is pulverized before being ignited. The non-combustible matter in the fuel is ash which is removed as fly ash from the flue gas, and bottom ash which is removed from the bottom of the furnace. There are many variations in the design of a PC boiler, but the overall concept is the same. Variations in the design may include front wall-fired vs. opposed wall-fired vs. tangentially-fired, all indicating how the burners are arranged in the boiler. Other alternative arrangements include cyclones and turbo, grate, cell or wet-bottom arrangement of the boiler; NOx emissions control through low NOx burners, over fire air, and further NOx reduction using selective catalytic reduction (SCR) or selective non-catalytic reduction (SNCR); control of particulates, accomplished through dry electrostatic precipitator (ESP), wet ESP or bag filters (bag houses); and type of SOx removal using wet or dry flue gas desulfurization (FGD) method.
PC boilers used in power generation are normally classified based on the steam conditions (pressure and temperature) entering the steam turbine. PC plants designed to have steam conditions below pressure at the critical point of water (about 22.1 MPa-abs or about 3,200 pounds per square inch) but above the saturation temperature of steam (374 ° C or 705 ° F) are referred to as subcritical PC plants, while plants designed above this critical point are referred to as supercritical. Typical design steam conditions for sub critical plants are: 16.7 MPa/538° C for main steam and 538° C for reheat steam. Typical supercritical plant steam design conditions are: pressure >24.2 MPa and with main and reheat steam temperatures at 565° C. Ultra supercritical boilers generate steam at pressure >30 MPa and temperature >565° C.
The steam generated in the PC boiler is used to drive a steam turbine generator. The turbine exhaust is condensed in a condenser and fed back to the PC boiler to make steam. This closed

Caribbean Regional Electricity Generation, Interconnection, and Fuels Supply Strategy – Final Report 8-5
steam boiler feedwater cycle is also referred to as Rankine cycle. The heat removed from the condensing steam in the condenser is rejected through a cooling tower, through once through cooling with cooling water from a lake, river, ocean, or in an air cooled condenser similar to radiator cooling.
Typical efficiency of a subcritical coal fired power plant is in the range of 33-35%, whereas supercritical power plant efficiency is in the range of 37-40%.
Table 8-1 lists performance and cost data for typical subcritical and supercritical coal plants.
Table 8-1 Typical Performance and Cost Estimates for Conventional Coal Plants
Plant Type >> Conventional Coal Plant
Plant Parameters Units 100 MW PC Coal Plant
300 MW PC Coal Plant
750 MW PC Coal Plant
(SC) Plant Rating Net MWe 100 300 750 Plant Capacity Factor (typical)
% 60-80% 65-75% 70-80%
Fuel Type Coal/lignite Coal/lignite Coal/lignite
Plant Heat Rate (rounded) kJ/kWh 9,700 9,550 9,400 CO2 Emissions Mt/MWh 0.88 0.87 0.87 Planned Maintenance Rate % 10% 10% 10% Forced Maintenance Rate % 5% 5% 5% Plant Life yr 30 30 30
Cost Estimates Year of Estimate yr 2009 2009 2009 Capital Cost $/kW 2,200 2,000 1,800 Fixed O&M Cost (range) $/kW-yr 25-35 20-30 20-30 Fixed O&M Cost (point) $/kW-yr 27 25 24 Variable O&M Cost (range)
$/MWh 1.5-2.5 1.5-2.5 1.5-2.5
Variable O&M Cost (point)
$/MWh 2 1.9 1.8
8.2.2 Circulating Fluidized Bed Boiler
Circulating fluidized bed (CFB) combustion is a combustion technology where the solid fuel is suspended on upward-blowing jets of air during the combustion process. The result is a turbulent mixing of gas and solids. The tumbling action, much like a bubbling fluid, provides more effective fuel combustion reactions and heat transfer. CFB plants are more flexible than conventional PC plants in that they can be fired using a variety of solid fuel types and sizes and also have the flexibility of using fuels which are difficult to burn using conventional PC

Caribbean Regional Electricity Generation, Interconnection, and Fuels Supply Strategy – Final Report 8-6
technology. Another advantage of CFB plants is the possibility of achieving a low emission of nitrogen oxides (NOx) during combustion and the possibility of removing sulfur in the fuel in a simple manner, before it can convert to sulfur dioxide (SOx), by using limestone as bed material.
The steam produced in a CFB boiler is subcritical and the steam cycle is similar to a subcritical PC boiler plant. The efficiency of CFB plant is similar to PC plant, about 33%. Table 8-2 lists typical cost and performance data for three CFB plant capacities.
Table 8-2 Typical Performance And Cost Estimates for CFB Plants
Plant Type >> Coal fired CFB
Plant Parameters Units 10 MW
CFB 25 MW
CFB 50 MW
CFB Plant Rating Net MWe 10 25 50 Plant Capacity Factor (typical) % 60-80% 60-80% 60-80%
Fuel Type Coal/ Waste Coal/ Coke
Plant Heat Rate (rounded) kJ/kWh 10,500 10,300 10,000 CO2 Emissions Mt/MWh 0.95 0.93 0.91 Planned Maintenance Rate % 10% 10% 10% Forced Maintenance Rate % 10% 10% 10% Plant Life yrs 30 30 30
Cost Estimates Year of Estimate yr 2009 2009 2009 Capital Cost $/kW 2550 2000 1800 Fixed O&M Cost (range) $/kW-yr 30-45 30-40 25-30 Fixed O&M Cost (point) $/kW-yr 35 35 27 Variable O&M Cost (range) $/MWh 3-5 2-4 2-4 Variable O&M Cost (point) $/MWh 4 3 3
8.2.3 Simple Cycle Combustion Turbine
A gas turbine, also called a combustion turbine, is a rotary engine that extracts energy from a flow of combustion gas. It has an air compressor coupled to a turbine, and a combustion chamber in-between. Energy is added to the gas stream in the combustor, where air is mixed with fuel and ignited. Combustion increases the temperature, velocity and volume of the gas flow. This is directed through a nozzle over the turbine blades, spinning the turbine and powering the compressor and delivering excess energy to the generator. Energy is extracted in the form of shaft power, compressed air and thrust, in any combination, and used to power aircraft, trains, ships, generators, and even tanks.
Gas turbines are described thermodynamically by the Brayton cycle, in which air is compressed isentropically (constant entropy), combustion occurs at constant pressure, and expansion over the turbine occurs isentropically back to the starting pressure.

Caribbean Regional Electricity Generation, Interconnection, and Fuels Supply Strategy – Final Report 8-7
As with all cyclic heat engines, higher combustion temperature means greater efficiency. The limiting factor is the ability of the steel, nickel, ceramic, or other materials that make up the engine to withstand heat and pressure. Most turbines also try to recover exhaust heat, which otherwise is wasted energy. Recuperators are heat exchangers that pass exhaust heat to the compressed air, prior to combustion.
Mechanically, gas turbines are considerably less complex than internal combustion piston engines due to fewer moving part: the shaft/compressor/turbine/alternative-rotor assembly. However, the required precision manufacturing for components and temperature resistant alloys necessary for high efficiency often makes the construction of a combustion turbine more complicated.
The principal environmental concerns associated with gas-fired combustion turbines are emissions of nitrogen oxides (NOx) and carbon monoxide (CO). Fuel oil operation may produce sulfur dioxide. Nitrogen oxide abatement is accomplished by use of “dry low-NOx” combustors and a selective catalytic reduction system. CO emissions are typically controlled by use of an oxidation catalyst. No special controls for particulates and sulfur oxides are used since only trace amounts are produced when operating on natural gas.
The efficiency of combustion turbine depends on compressor pressure ratio, gas firing temperature, and if any of the exhaust heat is recovered. Typical efficiencies of the simple cycle gas turbines range from 28-35%. The LMS100™ system combines frame and aeroderivative gas turbine technology for gas fired power generation. This new gas turbine provides cyclic capability without maintenance impact, high simple cycle efficiency, fast starts, high availability and reliability, but at higher capital cost. The unique feature of LMS100 is the use of inter-cooling within the compression section of the gas turbine, leveraging technology that has been used extensively in the gas and air compressor industry. Table 8-3 list typical performance and cost estimates for simple cycle gas turbines, including the new LMS100.
Table 8-3 Typical Performance and Cost Estimates for Simple Cycle Combustion Turbines
Plant Type >> Simple Cycle Combustion Gas Turbine
Plant Parameters Units 20 MW GT 50 MW GT LMS 100
Plant Rating Net MWe 20 50 100 Plant Capacity Factor (typical) % 10% 10% 20-40% Fuel Type NG / Distillate/Diesel Plant Heat Rate (rounded) (HHV)
kJ/kWh 11,900 11,100 8,900
CO2 Emissions Mt/MWh 0.54 0.51 0.41 Planned Maintenance Rate % 4% 4% 4% Forced Maintenance Rate % 4% 4% 4% Plant Life yrs 30 30 30
Cost Estimates Year of Estimate yr 2009 2009 2009

Caribbean Regional Electricity Generation, Interconnection, and Fuels Supply Strategy – Final Report 8-8
Plant Type >> Simple Cycle Combustion Gas Turbine
Plant Parameters Units 20 MW GT 50 MW GT LMS 100
Capital Cost $/kW 500-700 450-650 700-800 Fixed O&M Cost (range) $/kW-yr 15-20 15-20 10-20 Fixed O&M Cost (point) $/kW-yr 17 17 15 Variable O&M Cost (range) $/MWh 5 4 2-4 Variable O&M Cost (point) $/MWh 5 4 3
8.2.4 Combined Cycle Combustion Gas Turbine
In a combined cycle gas turbine (CCGT) plant, a gas turbine generator generates electricity and the waste heat in the exhaust gas is used to make steam to generate additional electricity via a steam turbine; this last step enhances the efficiency of electricity generation.
A combined-cycle gas turbine power plant consists of one or more gas turbine generators equipped with heat recovery steam generators to capture heat from the gas turbine exhaust. Steam produced in the heat recovery steam generators ((HSRGs) powers a steam turbine generator to produce additional electric power. Use of the otherwise wasted heat in the turbine exhaust gas results in high thermal efficiency compared to other combustion based technologies. Combined-cycle plants currently entering service can achieve 48 -50% efficiency (on HHV basis) in converting the chemical energy in the natural gas into electricity. Additional efficiency can be gained in combined heat and power (CHP) applications or cogeneration by bleeding steam from the heat recovery steam generator, steam turbine, or turbine exhaust to serve direct thermal loads.
A single-train combined-cycle plant consists of one gas turbine generator, a heat recovery steam generator, and a steam turbine generator (“1 x 1” configuration). Using “FA-class” combustion turbines - the most common technology in use for large combined-cycle plants - this configuration can produce about 270 megawatts at reference standard (International Organization for Standardization, or ISO) conditions. Increasingly common are plants with two or even three gas turbine generators and heat recovery steam generators feeding a single, proportionally larger steam turbine generator. Larger plant sizes result in economies of scale for construction and operation, and designs using multiple combustion turbines provide improved part-load efficiency. A 2 x 1 configuration using FA-class technology will produce up to 540 megawatts at ISO conditions.
Advantage of combined cycle plant is that additional peaking capacity can be obtained by use of various power augmentation features at nominal additional cost, such as inlet air chilling and duct firing (direct combustion of natural gas in the heat recovery steam generator). For example, an additional 20 to 50 megawatts can be gained from a single-train plant by use of duct firing. Though the incremental thermal efficiency of duct firing is lower than that of the base combined-cycle plant, the incremental cost is low and the additional electrical output can be valuable during peak load periods.

Caribbean Regional Electricity Generation, Interconnection, and Fuels Supply Strategy – Final Report 8-9
Gas turbines can operate on either gaseous or liquid fuels. Pipeline natural gas is the fuel of choice because of historically low and relatively stable prices, deliverability and low air emissions. Distillate fuel oil can be used as a backup fuel, however, its use for this purpose has become less common in recent years because of additional emissions of sulfur oxides, deleterious effects on catalysts for the control of nitrogen oxides and carbon monoxide, the periodic testing required to ensure proper operation on fuel oil, and increased turbine maintenance associated with fuel oil operation. It is now more common to ensure fuel availability by securing firm gas transportation.
As with combustion turbines, the principal environmental concerns associated with gas-fired combined-cycle gas turbines are emissions of nitrogen oxides (NOx) and carbon monoxide (CO); and emission abetment is achieved through SCR for the NOx and an oxidation catalyst for the CO.
Fairly significant quantities of water are required for cooling the steam condenser and may be an issue in arid areas. Water consumption can be reduced by use of dry (closed-cycle) cooling, though with cost and efficiency penalties. Gas-fired combined-cycle plants produce less carbon dioxide per unit energy output than other fossil fuel technologies because of the relatively high thermal efficiency of the technology and the high hydrogen-carbon ratio of methane (the primary constituent of natural gas).
Because of high thermal efficiency, low initial cost, high reliability, relatively low gas prices, and low air emissions, combined-cycle gas turbines have been the new resource of choice for bulk power generation. Other attractive features include significant operational flexibility, the availability of relatively inexpensive power augmentation for peak period operation and relatively low carbon dioxide production.
Table 8-4 lists typical performance and cost data for combined cycle plant.
Table 8-4 Typical Performance And Cost Estimates for Combined Cycle Plants
Plant Type >> Combined Cycle GT
Plant Parameters Units 100 MW
Comb Cycle 300 MW
Comb Cycle
Plant Rating Net MWe 100 300 Plant Capacity Factor (typical) % 40-80% 40-80%
Fuel Type NG / Distillate/Diesel
Plant Heat Rate (rounded) (HHV) kJ/kWh 8,000-8,300 7,800-8,000 CO2 Emissions Mt/MWh 0.38 0.37 Planned Maintenance Rate % 4% 4% Forced Maintenance Rate % 4% 4% Plant Life yrs 30 30
Cost Estimates Year of Estimate yr 2009 2009

Caribbean Regional Electricity Generation, Interconnection, and Fuels Supply Strategy – Final Report 8-10
Plant Type >> Combined Cycle GT
Plant Parameters Units 100 MW
Comb Cycle 300 MW
Comb Cycle
Capital Cost $/kW 1,000-1,250 950-1,100 Fixed O&M Cost (range) $/kW-yr 25-35 20-30 Fixed O&M Cost (point) 30 25 Variable O&M Cost (range) $/MWh 2-3 2 Variable O&M Cost (point) $/MWh 2 2
8.2.5 Medium and Low Speed Internal Combustion Engines
Diesel and gas engines (both characterized as internal combustion [IC] engines) can accommodate power generation needs over a wide size range, from few kW to large marine size engine with capacity up to 50 MW. Advantages of IC engines are low initial cost, modularity, ease of installation and reliability. This has led to their extensive use in power generation, and is preferred source for electricity generation in a small island grid set-up. .
A typical configuration is an engine/generator set, where diesel or gas fired engines similar to engines used in the transportation sector are deployed in a stationary application for power generation. In many countries, slower speed diesel engines burning heavier and more polluting oils (for example, residual oil or mazout) are used.
A diesel generator includes the core diesel engine (prime mover) and generator, and some auxiliary equipment such as equipment to support fuel-feed, air intake and exhaust, cooling, lubrication, and starting.
A diesel generator has an efficiency of 35-45 percent, and can use a range of low-cost fuels, including light oil, heavy oil, residual oil and even palm or coconut oil, in addition to diesel. However, since the diesel equipment is heavier than a gasoline engine generator, it is mostly deployed in stationary applications. A diesel engine also has a wide capacity range, with grid connected base load engines, capacity range from 0.5 MW to 50 MW. Table 8-5 lists typical performance and cost data for diesel engine generators.
Table 8-5 Typical Performance And Cost Estimates for Diesel Engines
Plant Type >>Medium Speed
Diesel Low Speed
Diesel
Plant Parameters Units 5 MW MSD
10 MW MSD
20 MW LSD
Plant Rating Net MWe 5 10 20 Plant Capacity Factor (typical) % 40-60% 40-60% 60-75% Fuel Type NG/FO/ HFO NG/FO/ HFOPlant Heat Rate (rounded) kJ/kWh 8,400 8,200 7,800 CO2 Emissions Mt/MWh 0.56 0.57 0.53

Caribbean Regional Electricity Generation, Interconnection, and Fuels Supply Strategy – Final Report 8-11
Plant Type >>Medium Speed
Diesel Low Speed
Diesel
Plant Parameters Units 5 MW MSD
10 MW MSD
20 MW LSD
Planned Maintenance Rate % 12% 12% 12% Forced Maintenance Rate % 8% 8% 6% Plant Life yrs 30 30 30
Cost Estimates Year of Estimate yr 2009 2009 2009 Capital Cost $/kW 450-600 450-600 480-550 Fixed O&M Cost (range) $/kW-yr 25-35 25-35 20-30 Fixed O&M Cost (point) 30 30 25 Variable O&M Cost (range) $/MWh 4-7 3-6 3-6 Variable O&M Cost (point) $/MWh 6 5 5
8.3 RENEWABLE ENERGY TECHNOLOGIES – POWER PLANT COSTS AND PERFORMANCE
For the Study, we limited our evaluation to gird connected utility scale commercially ready renewable technologies. The bullet list below presents the renewable energy technologies we included in our evaluation.
Wind turbines
Geothermal
Small and mini hydro (<30 MW)
Solar photovoltaic (PV) and concentrating solar thermal power (CSP)
Biomass power (including biogas/landfill gas and municipal waste)
The following sections briefly describe each of these technologies and summarize their cost and performance parameters. Figure 8-2 includes estimated capital cost ranges for renewable energy power plants as well as fossil fuel based plants.
Far more so than for the fossil fuel based plants, renewable energy power plant costs are site-specific. One can bring fossil fuel to locations where no fossil resources exist. Geothermal and hydro resources exist only in certain locations and cannot be transported economically. The wind blows and the sun shines everywhere, but the locations where their intensity is high enough for economic exploitation for power generation are limited. Biomass and municipal waste have relatively low energy density, with a limited range over which they can be transported economically. Landfill gas is typically available in small quantities at specific sites and is not suitable for transportation.
Therefore we emphasize that the cost and performance estimates presented below are based on plants built at sites where the resource is good and site development is not unusually expensive.

Caribbean Regional Electricity Generation, Interconnection, and Fuels Supply Strategy – Final Report 8-12
Where applicable, we have presented a range of cost and performance parameters as well as a selected point for economic evaluation of the renewable option.
8.3.1 Wind Turbines
Wind turbines are used to generate electricity from the kinetic power of the wind. Historically they were more frequently used as a mechanical device to turn machinery. There are two main kinds of wind generators, those with a vertical axis, and those with a horizontal axis. Horizontal-axis wind turbines typically either have two or three blades. These three-bladed wind turbines are operated "upwind," with the blades facing into the wind and the supporting tower downwind from the turbine.
Utility-scale turbines range in size from 100 kilowatts to as large as several megawatts. Larger turbines are grouped together into wind farms, which can be used to generate large amounts of electricity both onshore and offshore. Wind resource evaluation is a critical element in projecting turbine performance at a given site. The energy available in a wind stream is proportional to the cube of its speed, which means that doubling the wind speed increases the available energy by a factor of eight. Furthermore, the wind resource itself is seldom a steady, consistent flow. It varies with the time of day, season, height above ground, and type of terrain.
In general, annual average wind speeds of 5 meters per second (11 miles per hour) are required for grid-connected applications. Wind power class 2 (Annual average wind speeds of 3 to 4 m/s or 7-9 mph may be adequate for non-connected electrical and mechanical applications such as battery charging and water pumping. Wind resources exceeding this speed are available on many Caribbean Islands.
Wind power density is a useful way to evaluate the wind resource available at a potential site. The wind power density, measured in watts per square meter, indicates how much energy is available at the site for conversion by a wind turbine. Classes of wind power density for two standard wind measurement heights are listed in Table 8-6. Selection of wind turbine size will depend on wind resources available for the location.
For example, a wind power class 3 site has annual average wind speed of 6.4 – 7.0 m/s at 50 m hub height. When those wind speeds are applied to the Gamesa wind turbine performance curve in Figure 8-4, the 850 kW wind turbine would produce of 250 to 280 kW, or corresponding to 29% to 33% of capacity. Of course, wind speeds will vary from 0 m/s to over 25 m/s and corresponding wind turbine output will vary from 0 to 850 kW. Because of the cubic relationship of wind speed to wind energy, having a range of wind speeds that average (say) 7.0 m/s tends to produce higher average output than having the average wind speed all the time. At typical average wind speeds, output increases more when wind speed increases by 1.0 m/s than output decreases when wind speed decreases 1.0 m/s. However, output is limited by the maximum capacity of the wind turbine, which has an opposing effect.
Thus, the wind power class provide a guideline for sizing the wind turbine and an estimate for annual power output and capacity factor for a given site. Wind power class 3 and higher are available on many Caribbean Islands, making these islands suitable for wind power development.

Caribbean Regional Electricity Generation, Interconnection, and Fuels Supply Strategy – Final Report 8-13
Selection of wind turbine size will depend on the wind resources available for the location. Wind resources are classified based on wind speed. Table 8-6 provides wind class and wind power associated with the corresponding wind speed at 10 m and 50 m hub height.
Table 8-6 Wind Class and Corresponding Wind Speed and Wind Power
Wind Power Class
Speed, m/s @ 10 m
Wind Power Density, W/m2)
Speed, m/s @ 50 m
Wind Power Density, W/m2)
1 <4.4 <100 <5.6 <200 2 4.4 - 5.1 100 - 150 5.6 - 6.4 200 - 300 3 5.1 -5.6 150 - 200 6.4 - 7.0 300 - 400 4 5.6 - 6.0 200 - 250 7.0 - 7.5 400 - 500 5 6.0 -6.4 250 - 300 7.5 - 8.0 500 - 600
6 6.4 - 7.0 300 - 400 8.0 - 8.8 600 - 800 7 >7.0 >400 >8.8 >800
Figure 8-3 shows internals of a typical utility scale wind turbine.
The major parts of the wind turbine and its functions are:
Anemometer: Measures the wind speed and transmits wind speed data to the controller.
Blades: Most turbines have either two or three blades. Wind blowing over the blades causes the blades to "lift" and rotate.
Brake: A disc brake, which can be applied mechanically, electrically, or hydraulically to stop the rotor in emergencies.
Controller: The controller starts up the machine at wind speeds of about 8 to 16 miles per hour (mph) and shuts off the machine at about 55 mph. Turbines do not operate at wind speeds above about 55 mph because they might be damaged by the high winds.
Gear box: Gears connect the low-speed shaft to the high-speed shaft and increase the rotational speeds from about 30 to 60 rotations per minute (rpm) to about 1000 to 1800 rpm, the rotational speed required by most generators to produce electricity. The gear box is a costly (and heavy) part of the wind turbine and engineers are exploring "direct-drive" generators that operate at lower rotational speeds and don't need gear boxes.
Generator: Usually an off-the-shelf induction generator that produces 60-cycle AC electricity.
High-speed shaft: Drives the generator.
Low-speed shaft: The rotor turns the low-speed shaft at about 30 to 60 rotations per minute.

Caribbean Regional Electricity Generation, Interconnection, and Fuels Supply Strategy – Final Report 8-14
Figure 8-3 Wind Turbine Components 2
Nacelle: The nacelle sits atop the tower and contains the gear box, low- and high-speed shafts, generator, controller, and brake. Some nacelles are large enough for a helicopter to land on.
Pitch: Blades are turned, or pitched, out of the wind to control the rotor speed and keep the rotor from turning in winds that are too high or too low to produce electricity.
Rotor: The blades and the hub together are called the rotor.
Tower: Towers are made from tubular steel (shown here), concrete, or steel lattice. Because wind speed increases with height, taller towers enable turbines to capture more energy and generate more electricity.
Wind direction: This is an "upwind" turbine, so-called because it operates facing into the wind. Other turbines are designed to run "downwind," facing away from the wind.
Wind vane: Measures wind direction and communicates with the yaw drive to orient the turbine properly with respect to the wind.
Yaw drive: Upwind turbines face into the wind; the yaw drive is used to keep the rotor facing into the wind as the wind direction changes. Downwind turbines don't require a yaw drive; the wind blows the rotor downwind.
Yaw motor: Powers the yaw drive.
Typical output from a large wind turbine is presented in Figure 8-4.
2 Energy Efficiency and Renewable Energy, US DOE - http://www1.eere.energy.gov/windandhydro/wind_how.html#e

Caribbean Regional Electricity Generation, Interconnection, and Fuels Supply Strategy – Final Report 8-15
Gamesa G58 850 kW
0
100
200
300
400
500
600
700
800
900
0 5 10 15 20 25m/s
kW
Figure 8-4 Output Profile – Wind Speed vs. kW output for Gamesa G58 Turbine3
Table 8-7 provides typical performance and cost data for wind turbines.
Table 8-7 Typical Performance And Cost Estimates for Wind Turbines
Plant Type >>Small Wind
Turbine Large Wind
Turbine
Plant Parameters Units 0.5 MW 1.5 MW Plant Rating Net MWe 0.5 1.5 Plant Capacity Factor (range) % 20-25% 25-32% Plant Capacity Factor (point) % 25% 32% Plant Heat Rate (rounded) kJ/kWh N/A N/A Fuel Type None None CO2 Emissions Mt/MWh 0 0 Planned Maintenance Rate % 4% 4% Forced Maintenance Rate % 8% 8% Plant Life yrs 30 30
Cost Estimates Year of Estimate yr 2009 2009 Capital Cost $/kW 1,600-2,000 1,250-1,500 Fixed O&M Cost (range) $/kW-yr 40-70 25-40 Fixed O&M Cost (point) $/kW-yr 55 35 Variable O&M Cost (range) $/MWh 3-5 2-3 Variable O&M Cost (point) $/MWh 4 2
3 Gamesa (Spain) http://www.gamesa.es/en

Caribbean Regional Electricity Generation, Interconnection, and Fuels Supply Strategy – Final Report 8-16
8.3.2 Geothermal Power Plants
Geothermal energy is energy derived from the natural heat of the earth. The earth’s temperature varies widely, and geothermal energy is usable for a wide range of temperatures from room temperature to well over 200° C. For commercial use, a geothermal reservoir capable of providing hot water and steam resources on a consistent basis is necessary. Geothermal reservoirs are generally classified as being either low temperature (<150° C) or high temperature (>150° C). Generally speaking, the high temperature reservoirs are the ones suitable for, and sought out for commercial production of electricity. Geothermal reservoirs are found in “geothermal systems” which are regionally localized, geologic settings, where the earth’s naturally occurring heat flow is near enough to the earth’s surface to bring steam or hot water to the surface.
Two primary types of geothermal resources commercially developed are:
1. Naturally occurring hydrothermal resources Hydrothermal reservoirs consist of hot water and steam found in relatively shallow reservoirs, ranging from a few hundred to as much as 3,000 m in depth. Hydrothermal resources are the current focus of geothermal development because they are relatively inexpensive to exploit. A hydrothermal resource is inherently permeable, which means that fluids can flow from one part of the reservoir to another, and can also flow into and from wells that penetrate the reservoir. In hydrothermal resources, water descends to considerable depth in the crust where it is heated. The heated water then rises until it becomes either trapped beneath impermeable strata, forming a bounded reservoir, or reaches the surface as a hot spring or steam vent. The rising water brings heat from the deeper parts of the earth to locations relatively near the surface.
2. Engineered geothermal systems A second type of geothermal resource is the engineered geothermal systems (EGS), sometimes referred to as “Hot Dry Rocks (HDR).” These resources are found relatively deep in masses of rock that contain little or no steam, and are not very permeable. They exist in geothermal gradients, where the vertical temperature profile changes are greater than average (>50°C/km). A commercially attractive EGS would involve prospecting for hot rocks at depths of 4,000 m or more. To exploit the EGS resource, a permeable reservoir must be created by hydraulic fracturing, and water must be pumped through the fractures to extract heat from the rock. Most of the EGS/HDR projects to date have been essentially experimental; but there is future commercial potential.
Commercial exploitation of geothermal systems is constrained by two factors:
Geothermal exploration, as with most resource extraction ventures, is inherently risky. Geothermal power systems are difficult to plan because what lies beneath the ground is only poorly understood at the onset of development. It may take significant work to prove that an adequate resource exists in a particular field, and many exploration efforts have failed altogether.
Both exploration and development require substantial specialized technical capacity and financial commitment.

Caribbean Regional Electricity Generation, Interconnection, and Fuels Supply Strategy – Final Report 8-17
Technology Description
Dry Steam: When resources produce pure steam, the steam drives a turbine and generates power. However, these resources are rare; only few such fields have been discovered to date. The only commercially developed steam field in the United States is The Geysers, located in Northern California, which began the commercial production of electricity in 1960. A condenser cools the steam to water, which passes through a cooling tower and then back as cooled water to the condenser, and finally the remaining water is injected into the reservoir.
Flash Steam: Geothermal reservoirs that contain hot, pressurized water are much more common and provide energy for all US geothermal power production except The Geysers. Flash steam power plants use resources that are typically hotter than 200ºC. Before fluids enter the plant, the pressure of the fluid is reduced until it begins to boil, or flash. This process produces both steam and water. The steam subsequently is used to drive the turbine. The steam may be condensed as described above and be injected back into the reservoir. Figure 8-5 is schematic of flash steam power plant at Bouillante, Guadeloupe, which cools the steam with sea water and returns the condensed steam, sea water, and other water streams to the ocean.
Binary Cycle: This rapidly expanding technology uses geothermal resources with temperatures as low as 90°C. Rather than flashing the geothermal fluid to produce steam, this type of power plant uses heat exchangers to transfer the heat of the water to another working fluid that vaporizes at lower temperatures. This vapor drives a turbine to generate power, after which it is condensed and circulated back to the heat exchangers. This type of geothermal plant has superior environmental characteristics compared to the others because the hot water (which tends to contain dissolved salts and minerals) is never exposed to the atmosphere before it is injected back into the reservoir. Binary power plants were introduced in the mid-1980s.

Caribbean Regional Electricity Generation, Interconnection, and Fuels Supply Strategy – Final Report 8-18
Figure 8-5 Flash Steam Geothermal Power Plant Schematic4
Large geothermal plants can generally operate as base-loaded facilities with capacity factors comparable to or higher than conventional generation (90 percent CF). Binary plants in mini-grid applications will have lower capacity factors (30-70 percent), due mainly to limitations in local demand.
Because they operate in a closed-loop mode, binary plants have no appreciable emissions, except for very slight leakages of hydrocarbon working fluids. Some emissions of H2S are possible (no more than 0.015 kg/MWh), but H2S removal equipment can easily eliminate any problem. CO2 emissions are small enough to make geothermal power a low CO2 emitter relative to fossil fuel plants.
Table 8-8 provides typical performance and cost data for geothermal power plants.
4 Eastern Caribbean Geothermal Energy Project – Roseau, Dominica – March 2007; ADEME (French Agency for Environment and Energy
Management) Renewable Energy Division

Caribbean Regional Electricity Generation, Interconnection, and Fuels Supply Strategy – Final Report 8-19
Table 8-8 Typical Performance And Cost Estimates for Geothermal Plants
Plant Type >> Geothermal
Plant Parameters Units 5-80 MW Plant Rating Net MWe 20 Plant Capacity Factor (typical] % 80% Fuel Type None Plant Heat Rate (rounded) kJ/kWh N/A CO2 Emissions Mt/MWh 0 Planned Maintenance Rate % 10% Forced Maintenance Rate % 10% Plant Life yrs 30
Cost Estimates Year of Estimate yr 2009 Capital Cost $/kW 2,800-3,400 Fixed O&M Cost (range) $/kW-yr 70-90 Fixed O&M Cost (point) $/kW-yr 80 Variable O&M Cost (range) $/MWh 3-5 Variable O&M Cost (point) $/MWh 4
8.3.3 Hydro Power Plants
Hydro power plants convert the potential and kinetic energy of water into electricity. Hydro power plants include those operated as part of pumped storage facilities.
Although the introduction of low volume continuous flow systems have made this technology readily applicable in small streams, poor agricultural practices and inadequate forest management techniques have reduced the potential use of this energy source, as flows in rivers and streams in many islands of the Caribbean have been reduced. With the exception of the larger Caribbean countries that still have some rivers of note, only Dominica, and to a lesser extent Saint Vincent and the Grenadines, may be able to exploit this energy source economically.
At present, grid connected hydroelectricity is generated in Dominica, the Dominican Republic, Haiti, Jamaica, and Saint Vincent.
Table 8-9 provides typical performance and cost data for small hydro power plants.

Caribbean Regional Electricity Generation, Interconnection, and Fuels Supply Strategy – Final Report 8-20
Table 8-9 Typical Performance And Cost Estimates for Small Hydro Plants
Plant Type >> Small Hydro
Plant Parameters Units Plant Rating Net MWe 30 Plant Capacity Factor (typical) % 50%
Fuel Type Renewable
Plant Heat Rate (rounded) kJ/kWh N/A CO2 Emissions Mt/MWh 0 Planned Maintenance Rate % 5% Forced Maintenance Rate % 5% Plant life yrs 30
Cost Estimates Year of Estimate yr 2009 Capital Cost $/kW 2000-2800 Fixed O&M Cost (range) $/kW-yr 30-50 Fixed O&M Cost (point) $/kW-yr 40 Variable O&M Cost (range) $/MWh 3-5 Variable O&M Cost (point) $/MWh 4
8.3.4 Concentrating Solar Power (CSP) Plant
The four commercially available CSP technologies are:
Parabolic Troughs
Central Receiver
Compact Linear Fresnel Reflectors (CLFR)
Dish Stirling Engine
We provide below brief descriptions of these technologies.
Parabolic Trough Technology
Parabolic trough plants use a field of linear parabolic collectors to redirect, and concentrate, sunlight on a tube receiver located at the focal line of the parabolic mirrors. Each collector, which has a nominal width and length of 5-5.7 m and 50-150 m, respectively, tracks the sun by rotation about a horizontal axis. The receiver is a stainless steel tube, to which is applied a selective surface ceramic coating to reduce radiation and reflective losses. The receiver tube is also enclosed in an evacuated glass jacket to reduce convection losses. The nominal solar concentration ratio for a trough is 80. The heat transport fluid is a synthetic oil mixture of diphenyl oxide/ether and biphenyl, which has a maximum operating temperature of 390-395 °C. A conventional steam generator produces live steam at nominal conditions of 100 bar and 385-

Caribbean Regional Electricity Generation, Interconnection, and Fuels Supply Strategy – Final Report 8-21
375 °C. For the Rankine cycle reheat steam can also be produced at a similar temperature range of 385-375 °C. Figure 8-6 shows the layout of parabolic troughs at SEGS VII plant at Kramer Junction, CA.
Figure 8-6 Parabolic Trough Collector Plant
Nine parabolic trough plants, with design parameters similar to those described above and with a combined output of 354 MWe, are currently in operation in southern California. These plants are called Solar Electric Generation Station (also referred to as SEGS I through SEGS IX) and range in size from 14 MWe to 80 MWe.
Central Receiver CSP Plant
Central receiver plants use a field of large mirrors (heliostats) to redirect, and concentrate, sunlight on a heat exchanger (receiver) located at the top of a tower. The heliostat, each of which has nominal reflector area from 6 m2 to 100 m2, is dependent on tower height and receiver capacity. The heliostats focus on the receiver and track the sun by a combination of rotations about vertical and horizontal axes. The heliostats are arranged in a roughly circular layout around the tower, such that when viewed from the top of the tower, the heliostats field mimics the shape of a large parabolic bowl. The receiver is composed of 16 to 24 flat panels, located side-by-side to form a cylinder. The geometry of the heliostats, and their placement in the field, are such that the flux from the sun is concentrated by a factor of 750 to 1,000 at the surface of the receiver. The heat transport fluid (HTF) for the plant can be water or a mixture of sodium nitrate and potassium nitrate, or air, CO2, or synthetic oil. However, water and molten salt seem to be preferred HTF from both practical application and cost.
If water is used as HTF, it is converted directly to steam and superheated in a superheater section of the receiver to 450-550 °C. If molten salt is used as HTF, the liquid salt is pumped from a cold storage tank up the tower to the receiver, where it is heated from an inlet temperature of about 288 °C to an outlet temperature of about 566 °C. The salt is returned to a hot storage tank; from

Caribbean Regional Electricity Generation, Interconnection, and Fuels Supply Strategy – Final Report 8-22
here, it is pumped through a steam generator, and then returned to the cold storage tank. The steam generator produces steam at nominal conditions of 125 bar and 540 °C, and reheat steam also at a temperature of 540 °C. Figure 8-7 shows the general layout of a central receiver system.
Figure 8-7 10 MW Solar 2 Project near Barstow, CA
Several central receiver demonstration projects have been built and tested in the United States, France, Spain, and Japan and Israel over the past 30 years. Receiver coolants have included water/steam, compressed air, sodium and potassium nitrate salt. The most recent, and largest, central receiver project built to date was the 10 MWe Solar Two project in Barstow, California. Plant startup was initiated in 1995, and the operation and test period was concluded in 1999. The design used a binary nitrate salt mixture as the receiver coolant, the thermal storage medium, and the steam generator heat transport fluid.
Only two central receiver projects have been in commercial operation in Spain, PS-10 (10 MW tower) and PS-20 (20 MW tower); interest in the concept continues because commercial central receiver plants should provide energy at a cost perhaps 20 percent below that of a commercial trough project. The reasons for this assumption by many associated with central receiver development are as follows:
The peak working fluid temperature in a central receiver plant is 566 °C, as opposed to 393 °C in a parabolic trough field. The higher fluid temperatures translate into a Rankine (steam) cycle efficiency of about 3-5 percentage points higher than that of a parabolic trough plant (33-37% vs. 37-41%).
The nitrate salt should be less expensive than oil, and the temperature rise across the receiver is a favorable 278 °C. This allows for a less expensive thermal storage system, which provides an economical means for extending the annual capacity factor of the plant to values as high as 70 percent. In contrast, the temperature rise across a parabolic trough

Caribbean Regional Electricity Generation, Interconnection, and Fuels Supply Strategy – Final Report 8-23
field is on the order of 105 °C, which leads to a more expensive thermal storage system and limits the means for extending the capacity factor beyond about 55 percent.
The capital cost of a heliostat field and receiver, on a $ per annual MWt basis, should be about 15 percent lower than that of a parabolic trough field. Mirrors and heliostat structure are simpler and easy to construct compared to elaborate design of parabolic trough, but cost of large central receiver and tower can be significant. Overall, the consensus of technical experts is that the central receiver plant should cost less.
In the United States, central receiver technology has not developed commercially beyond the demonstration plant stage because a minimum plant size of perhaps 100 MWe is required to provide electric energy at a cost below that of a parabolic trough plant. However, construction of a 100 MWe plant will require the successful operation of a receiver with a rating of 250 to 300 MWt, which is at least an order of magnitude greater in capacity than the largest receiver built to date. To validate such a receiver, a central receiver project will require a capital investment of $300 to $500 million and few commercial ventures are willing to take this risk, unless incentives or guarantees are provided by vendors and suppliers.
Compact Linear Fresnel Reflector (CLFR) Technology
The compact linear Fresnel reflector array system is linear like a parabolic trough collector, but it has some major differences over troughs which allow significant cost reductions, such as a long focal length which allows elastically bent flat standard glass reflector to be used.
The array technology promoted by Ausra is of the linear Fresnel type and was originally developed at the University of Sydney (Mills and Morrison, 1999). It is called the Compact Linear Fresnel Reflector (CLFR) technology. In this approach, ground level reflector rows aim solar beam radiation at a downward facing receiver mounted on multiple elevated parallel tower lines. The technology is innovative in that it allows reflectors to have choice of two receivers so that a configuration can be chosen which offers minimal mutual blocking of adjacent reflectors and minimum ground usage. However, there are also many supporting engineering innovations in the commercial product, including highly rigid space frame mirror supports with 360° rotation capability, long horizontal direct steam generation cavity receivers, and array fine tracking control electronics. Ausra, the promoters of CLFR array design is planning to incorporate high volume production elements to reduce engineering cost.
Figures 8-8 shows the Ausra and Sky Fuel CLFR lay out concept.
Although some of the cost advantages of the CLFR array system over the current trough technology are easily recognized and can be implemented, the general issue of overall stand-alone solar plant design are not addressed well enough to develop performance and cost model.

Caribbean Regional Electricity Generation, Interconnection, and Fuels Supply Strategy – Final Report 8-24
Figure 8-8 Ausra and Sky Fuel CLFR Lay Outs
Parabolic Dish with Stirling Engine
Parabolic dishes use a group of segmented mirrors to redirect and concentrate sunlight on a cavity receiver located at the focal point of the dish. The average concentration ratio at the aperture of the receiver is 3,000:1, and the peak concentration is about 12,500:1. The high concentration ratios permit the use of a small receiver, which reduces the receiver convection and radiation losses. As might be expected, the high ratios also dictate the use of a robust mirror support structure and an accurate drive mechanism.
The receiver cavity is lined with metal tubes. Hydrogen, at a nominal pressure of 300 bar, is both the receiver coolant and the working fluid in the Stirling engine. The hydrogen is heated to about 700 °C in the receiver; it then passes to a kinematic Stirling engine, where it expands to perform mechanical work. Heat is rejected from the engine through a hydrogen-to-air heat exchanger. The cooled hydrogen is returned to the engine, where it is compressed, and it then passes back to the receiver to be reheated. With today’s limited commercial market, the capacities of the reflector and the receiver are determined by the sizes of the existing engines; i.e., a 36 m2 dish is used with a 9 kWe Solo Kleinmotoren engine, and a 88 m2 dish is used with a 25 kWe Kokums engine. The optimum commercial power rating is believed to be in the range of 25 kWe to 35 kWe based on the practicalities of meeting stringent pointing accuracy requirements on large structures subjected to moderately high wind loads.
Several receiver designs have been tested over the past 25 years. The goal of the receiver designs is to accommodate the low cycle fatigue inherent in the daily thermal cycles, and to tolerate the large temperature gradients within the cavity when the centroid of the concentrated solar beam does not align properly with the center of the aperture. Tested designs include the following: sodium heat pipes, with the sodium condensing on several small hydrogen cooled condensers; sodium pool boiler, with the sodium condensing on one remote hydrogen cooled condenser; and a cavity lined with nickel alloy tubes, cooled by compressed hydrogen. The sodium cooled designs were perhaps the best engineering solution, as very large heat transfer rates could be established, and the receiver could readily accommodate the inevitable off-center

Caribbean Regional Electricity Generation, Interconnection, and Fuels Supply Strategy – Final Report 8-25
flux distributions. However, the required receiver geometries proved too complex to fabricate at a reasonable cost. As a result, the tubed receiver has been found to offer the best combination of reliability, manufacturing feasibility, and cost.
In concert with the receiver development, several reflector designs have been tested in the United States and in Europe, including the following two:
A stretched metal membrane concept, using two thin membranes stretched across the front and the back of a metal support ring. A partial vacuum, drawn between the two membranes, pushed the front (and the back) membrane into a pseudo-parabolic dish shape. Concepts using one large, and numerous small rings, have been tested. Reflectors materials have included thick glass mirrors, thin glass mirrors, and silvered polymers. Drives have included both orthogonal drives located at the center of the reflector, and rim drives located at the periphery of the reflector.
Various combinations of steel trusses and structural mirror gore designs, all with orthogonal drives located at the center of the reflector.
The currently favored approach is perhaps the oldest: a conventional steel truss structure supporting metal gores with a thin glass silver mirror reflector. A representative design is illustrated in Figure 8-9.
Figure 8-9 Parabolic Dish with Stirling Engine
The current generation of dish/engine designs offers the following performance characteristics: design point solar-to-electric conversion efficiency of about 30 percent; annual solar-to-electric conversion efficiency of 23 percent; and an annual capacity factor for a site in the Mojave Desert of 25 percent.

Caribbean Regional Electricity Generation, Interconnection, and Fuels Supply Strategy – Final Report 8-26
Solar Thermal Energy Storage
A distinct advantage of solar thermal power plants compared with other renewable energies, such as PV and wind, is the possibility of using relatively cheap storage systems that store the thermal energy itself. Storing electricity is much more expensive. With thermal energy storage (TES), the system can collect energy in order to shift its delivery to a later time, or to smooth out the plant output during intermittently cloudy weather conditions. Hence, the operation of a solar thermal power plant can be extended beyond periods of no solar radiation without the need to burn fossil fuel. Times of mismatch between energy supply by the sun and energy demand can be reduced.
Figure 8-10 shows the layout of a solar parabolic trough plant with thermal energy storage.
Hot Salt Tank
Cold Salt Tank
Oil-to-SaltHeat
Exchanger
Solar FieldSolar
Superheater
SteamGenerator
SolarPreheater
SolarReheater
ExpansionVessel
SteamTurbine
Condenser
FeedwaterHeaters
Deaerator
Boiler(optional)
Fuel
Figure 8-10 Two Tank Thermal Storage System
The principle options for using TES in a solar thermal system highly depend on the daily and yearly variation of radiation and on the electricity demand profile. The main options are:
Buffering
Delivery period displacement
Delivery period extension
Yearly averaging
The goal of a buffer is to smooth out transients in the solar input caused by passing clouds, which can significantly affect operation of a solar electric generating system (SEGS) plant.
Delivery period displacement requires the use of a larger storage capacity. The storage shifts some or all of the energy collected during periods with sunshine to a later period with higher electricity demand or tariffs. The typical size of TES system ranges from 3 to 6 hours of full load operation.

Caribbean Regional Electricity Generation, Interconnection, and Fuels Supply Strategy – Final Report 8-27
The TES increases the solar fraction and requires larger solar fields than a system without storage. Yearly averaging of electricity production requires much larger TES and solar fields.
A key issue in the design of a thermal energy storage system is its thermal capacity - the amount of energy that it can store and provide. However, selection of the appropriate system depends on many cost-benefit considerations.
Table 8-10 provides typical performance and cost data for solar trough plants with and without storage.
Table 8-10 Typical Performance And Cost Estimates for Solar Trough Plants
Plant Type >> Solar CSP Solar CSP
Plant Parameters Units Solar CSP CSP w 6 Hr
Storage
Plant Rating Net MWe 50 50 Plant Capacity Factor (typical) % 16% 24%
Fuel Type None None
Plant Heat Rate (rounded) kJ/kWh N/A N/A CO2 Emissions Mt/MWh 0 0 Planned Maintenance Rate % 8% 8% Forced Maintenance Rate % 5% 5% Plant Life yrs 30 30
Cost Estimates Year of Estimate yr 2009 2009 Capital Cost $/kW 3,200-3,600 4,200-4,500 Fixed O&M Cost (range) $/kW-yr 50-60 70-80 Fixed O&M Cost (point) $/kW-yr 56 74 Variable O&M Cost (range) $/MWh 8-12 8-10 Variable O&M Cost (point) $/MWh 10 9
8.3.5 Solar PV
The photovoltaic process converts solar energy directly into electricity. Photovoltaic cells are made from materials that are neither insulators nor conductors of electricity – “semi-conductors” – such as silicon. The electrons in a semiconductor material have a defined range of energy levels, or bands, partially filled with electrons, creating a negative charge. Electrons move down an external circuit in the form of light-generated electricity: the “photovoltaic effect.”
Current PV cells convert 10-16% of the incident energy of sunlight to electricity. Some of the new materials and improvements in cell design promises to increase the conversion efficiency to 20-30% range. PV cell size determines the amount of current and power it is capable of

Caribbean Regional Electricity Generation, Interconnection, and Fuels Supply Strategy – Final Report 8-28
producing, at most about 0.5 Volts (V). Number of these cells can be connected in series to make a PV module. Typical PV module output can range between 20 -175 Watts (W). PV modules can themselves be connected together to make arrays that could potentially supply few kW to several MW of power. The residential system output is normally in the range of 250 W to 2 kW; where as commercial systems normally are sized for 2.5 kW to 20 kW.
Technology Description and Status
A PV cell consists of two or more thin layers of semi-conducting material. Most commonly used semi conducting material is silicon. When the silicon is exposed to light, electrical charges are generated which can be conducted away by metal contacts as direct current (DC). The electrical output from a single cell is small, so multiple cells are connected together and encapsulated (usually behind glass) to form a module or panel. The PV module is the principal building block of a PV system and any number of modules can be connected together to give the desired electrical output. PV equipment has no moving parts and as a result requires minimal maintenance.
Mono-crystalline Silicon Cells - Made using cells saw-cut from a single cylindrical crystal of silicon, this is the most efficient of the photovoltaic (PV) technologies. The principal advantage of mono-crystalline cells is their high efficiencies, typically around 15-20%, but the manufacturing process required to produce mono-crystalline silicon is complicated, resulting in higher costs than other technologies.
Multi-crystalline Silicon Cells - Made from cells cut from an ingot of melted and recrystallized silicon. In the manufacturing process, molten silicon is cast into ingots of polycrystalline silicon; these ingots are then saw-cut into very thin wafers and assembled into complete cells, creating a granular texture. Multi-crystalline cells are cheaper to produce than mono-crystalline ones, due to the simpler manufacturing process. However, they tend to be less efficient, with average efficiencies of around 12-14%.
Thick-film Silicon - Another multi-crystalline technology where the silicon is deposited in a continuous process onto a base material giving a fine grained, sparkling appearance. Like all crystalline PV, this is encapsulated in a transparent insulating polymer with a tempered glass cover and usually bound into an aluminum frame.
Amorphous Silicon - Amorphous silicon cells are composed of silicon atoms in a thin homogenous layer rather than a crystal structure. Amorphous silicon absorbs light more effectively than crystalline silicon, so the cells can be thinner. For this reason, amorphous silicon is also known as a "thin film" PV technology. Amorphous silicon can be deposited on a wide range of substrates, both rigid and flexible, which makes it ideal for curved surfaces and "fold-away" modules. Amorphous cells are, however, less efficient than crystalline based cells, with typical efficiencies of around 6%, but they are easier and therefore cheaper to produce. Their low cost makes them ideally suited for many applications where high efficiency is not required and low cost is important.

Caribbean Regional Electricity Generation, Interconnection, and Fuels Supply Strategy – Final Report 8-29
Other Thin Films - A number of other promising materials such as cadmium telluride (CdTe) and copper indium diselenide (CIS) are now being used for PV modules. The attraction of these technologies is that they can be manufactured by relatively inexpensive industrial processes in comparison to crystalline silicon technologies, yet they typically offer higher module efficiencies than amorphous silicon.
PV Module - Since output from individual cell is small with maximum voltage less than 0.5 V, number of cells is put together in series to form a PV module. Figure 8-11 show the general arrangement of a typical PV module.
Figure 8-11 Typical PV Solar Module
Typical PV System Configuration - The components typically required in a grid-connected small PV system for household or small commercial installations are illustrated in Figure 8-12 below.
Figure 8-12 Typical PV System Configuration

Caribbean Regional Electricity Generation, Interconnection, and Fuels Supply Strategy – Final Report 8-30
Other components in a typical grid-connected PV system are the array mounting structure and the various cables and switches needed to ensure that the PV generator can be isolated both from the building and from the grid.
Table 8-11 provides performance and cost data for the residential and commercial size PV systems.
Table 8-11 Typical Performance And Cost Estimates for PV Systems
Plant Type >>Residential
PV Commercial
PV
Plant Parameters Units 2 kW PV 500 kW PV
Plant Rating Net MWe 0.002 0.5 Plant Capacity Factor % 14-16% 15-18% Fuel Type None None Plant Heat Rate (rounded) kJ/kWh N/A N/A CO2 Emissions Mt/MWh 0 0 Planned Maintenance Rate % 2% 2% Forced Maintenance Rate % 4% 4% Plat Life Yrs 20 20
Cost Estimates Year of Estimate yr 2009 2009 Capital Cost $/kW 5,800-7,500 5,200-7,200 Fixed O&M Cost (range) $/kW-yr 40-60 40-60 Fixed O&M Cost (point) $/kW-yr 50 50 Variable O&M Cost (range) $/MWh 5 4 Variable O&M Cost (point) $/MWh 4-6 3-5
8.3.6 Biomass Plant
Biomass Resources: Biomass fuels are defined as non-fossil, carbon-based materials having the capability of being harnessed for energy. Essentially stored solar energy, biomass fuels fall into five general categories:
Wood: Forestry wood; wood residues; milling residues; waste from logging operations.
Agricultural Residues: Waste cellulose from farming operations or food processing, including: Bagasse; nuts and shells; rice husk; straw
Energy Crops: Agricultural crops and trees grown specifically for energy production (Miscanthus, Reed canary grass, eucalyptus)
Waste: Municipal solid waste (MSW); refuse-derived fuel; source separated organic waste; tire-derived fuel; vegetable, garden, and fruit waste; landfill gas. Dry animal waste, primarily from poultry, can be burned directly for heat and power. Wet manure can be digested to produce biogas.

Caribbean Regional Electricity Generation, Interconnection, and Fuels Supply Strategy – Final Report 8-31
Biofuels: Liquid fuels like ethanol and biodiesel are primarily used in transportation applications, but could also be burned to produce electricity
Solid Biomass
Biomass is defined as any plant matter used directly as fuel or converted into other forms before combustion.
Gas from Biomass
Biogas is derived principally from the anaerobic fermentation of biomass and solid wastes and combusted to produce heat and/or power. Included in this category are landfill gas and sludge gas (sewage gas and gas from animal slurries) and other biogas.
A second source of biogas is thermal gasification of biomass. Included here is the production of synthesis gas, either for subsequent combustion or for conversion to transportation fuels, hydrogen, fertilizers or chemicals (or a combination of these).
Table 8-12 lists performance and cost data for the biomass and landfill gas (LFG) based power plants.
Table 8-12 Typical Performance And Cost Estimates for Biomass and LFG Plants
Plant Type >> Biomass Plant
Plant Parameters Units Biomass LFG and Biogas
Plant Rating Net MWe 30 5 Plant Capacity Factor % 60% 40%
Fuel Type Biomass LFG
Plant Heat Rate (rounded) kJ/kWh 14,400 12,700 CO2 Emissions Mt/MWh 0 (0.05)1
Planned Maintenance Rate % 15% 15% Forced Maintenance Rate % 10% 10% Plant Life Yrs 30 302
Cost Estimates Year of Estimate yr 2009 2009 Capital Cost $/kW 2000 1000 Fixed O&M Cost (range) $/kW-yr 40-45 35-40 Fixed O&M Cost (point) $/kW-yr 42 37 Variable O&M Cost (range) $/MWh 4-6 4-6 Variable O&M Cost (point) $/MWh 4 5
Note 1: LFG can take credit for eliminating methane gas emissions from natural decomposition of biomass and other waste. Note 2: Plant life will depend on if the site is active or not active. At a not active site, LFG generation will decay in less than five years.
Caribbean Regional Electricity Generation, Interconnection, and Fuels Supply Strategy – Final Report 8-32
8.4 RENEWABLE TECHNOLOGIES – RESOURCE AVAILABILITY
In contrast to fossil fuels, renewable energy resources provide an inexhaustible supply of energy. The major sources of renewable energy for the Caribbean are solar, wind, biomass, hydro, and geothermal. For this study, only commercially demonstrated technology is evaluated, hence ocean and wave energy resources were not evaluated.
As noted at the start of Section 8.3, renewable energy power plant costs are site-specific. Just as power plant costs depend on the quality of the available energy resource, how much energy can be considered available depends on the cost of the power plants. The power plant costs are based on plants built at sites where the resource is good and site development is not unusually expensive. We estimate the amount of renewable resource energy available considering the cost of power from each of the technologies.
For example, we know that the sun shines everywhere in the Caribbean. However, frequent loud cover limits the hours of bright sunlight. The transient nature of clouds make it difficult to design a CSP plant without some storage as CSP technology concentrates direct solar insolation. Transient clouds pose a lesser problem for PV, which can also utilize diffused radiation, but reduces the annual energy PV plants can generate. Combining this with the capital cost of the PV plant, PV is not economically competitive at present with other technologies for central station power generation, as the screening analysis of Section 11 illustrates. CSP is closer to being economically competitive compared to distillate fueled power plants, but both PV and CSP would need some degree of fossil backup, the costs of which are not included. Therefore the size of the solar resource available for both PV and CSP could be considered to be zero.
Nevertheless, Martinique has six MW of installed PV capacity, primarily as residential rooftop facilities selling to the utility at a rate mandated by the government, 400 Euros per MWH. The utility expects another 30 MW in the near future. Clearly, subsidies such as high feed-in tariffs for purchases of renewable energy, favorable tax treatment, and others can provide sufficient incentive to generate significant development. In addition, because PV is a proven, commercially available technology, some people choose to install PV on their rooftops even though it costs more than utility-supplied energy.
The renewable technologies used for power generation consist of wind turbines, geothermal power plants, hydro turbines, biomass based gasifiers or steam boilers, landfill gas and biogas generators, concentrating solar thermal power plants, and solar photovoltaic power generation.
8.4.1 Wind
The wind patterns in the Caribbean are dominated by the northeast trade winds, and are a persistent feature of the region. The trade winds blow throughout the year, disturbed only at intervals during the summer by tropical disturbances and in winter by eastward moving Atlantic depressions. This wind pattern provides Caribbean islands the potential for a significant increase in wind powered electricity production. A number of wind farm projects are being implemented, making wind potentially the fastest growing renewable energy technology in the region over the next two decades.

Caribbean Regional Electricity Generation, Interconnection, and Fuels Supply Strategy – Final Report 8-33
Demonstration projects have been built such as the installation of a 120 kW vertical axis wind turbine in Antigua, and an 85 kW horizontal axis turbine in Montserrat. After these, other demonstration projects were considered for Barbados, Curacao and Jamaica.
Wind turbines for grid electricity generation are presently operational in four Caribbean islands — Cuba, Curacao, Guadeloupe and Jamaica. The wind turbines on Montserrat have recently been put out of operation by volcanic activity on the island. Four countries have had wind turbines installed that are no longer operational: Antigua, Barbados, Montserrat, and Trinidad and Tobago.
The potential for wind power in the Caribbean is relatively large. For example, a study conducted by NREL (D. Elliot, Dominican Republic Resource Atlas Development, NREL CP-500-2732) for Dominican Republic estimates that there is approximately 460 km2 area within DR with excellent wind generation potential at an estimated value of 6.9 MW/km2 for a total of 3,200 MW. Similarly, a study sponsored by APUA (Wind Energy Survey Antigua and Barbuda, Energy Engineering Corporation, November 2008) indicated that in Barbuda, the “Highlands” area offers the most promising wind farm site. At 33 meters above sea level, this plateau of 38 km2 can support 400 MW of wind turbines, generating 900 GWh per year, with little visual impact because the area is five km from population centers.
It should be noted that wind is site dependent, and it is essential that detailed wind measurements should be conducted at potential sites to arrive at more accurate projections of the feasibility of economic wind power development in the region.
8.4.2 Geothermal
The islands of Saba and St. Eustatius (Statia) of the Netherlands Antilles, St. Kitts and Nevis, Montserrat, Dominica, St. Lucia, St. Vincent and the Grenadines, and the French territories, Guadeloupe and Martinique, form part of the of the active volcanic arc of the Caribe Oriental and the Lesser Antilles.
From Saba in the north to St. Vincent in the south, active volcanoes and surface hydrothermal manifestations exist on each of the islands. In the cases of Dominica and St. Lucia, intense surface hydrothermal activity marks the presence of high enthalpy geothermal systems: 230 degrees Celsius at Wotten Waven in Dominica (presently being evaluated by the French agency AFD) and 300 degrees Celsius at La Soufrière-Qualibou in St. Lucia.
The thermal energy available in these volcanic islands makes them of interest for geothermal exploration. Estimates of geothermal resource availability vary from 450 MW to several thousand MW estimated by the Seismic Research Center at University of West Indies (Erouscilla P. Joseph, Seismic Research Unit, University of West Indies, St. Augustine).
A small geothermal plant was installed in Guadeloupe in 1986 and was renovated and upgraded to 15 MW by 2004.

Caribbean Regional Electricity Generation, Interconnection, and Fuels Supply Strategy – Final Report 8-34
8.4.3 Solar PV and CSP
The US DOE estimate for average solar radiation in the Caribbean region is 200-300 W/m2 or approximately 2.2 -3.6 kWh/m2-day. NREL’s is consistent: 200-300 W/m2 of solar insolation or about 2.5-3.2 kWh/m2-day of power production in the region. (In the southwest US, 6-7 kWh/m2-day of power generation might be achieved).
PV is a proven commercial technology already being used in many applications, but not yet unsubsidized central station power generation.
PV can generate from diffuse as well as direct normal insolation (DNI). PV panels can be installed on roof tops and other building structures, under those circumstances eliminating the need for undeveloped land, and is suitable for distributed (i.e., non grid connected or small scale) generation. No definitive studies of solar power development for the Caribbean region have been conducted, so Nexant developed its own estimate for the potential for PV generation. For a PV resource availability estimate, Nexant used the NREL estimate of solar insolation and power production. Nexant also used NREL methodology of assuming that 1% of the land area of the island is used for residential and commercial buildings. We estimate power generation potential from PV by assuming that PV panels can be installed on 10% of the roofs of these buildings, and those panels can achieve an average capacity factor of 15%. Nexant applied this scenario to estimate potential generation from PV for each island in the study, producing the values shown in Table 8-13. We emphasize that these values refer to resource availability, not current economic potential. Due to the high cost of PV power, significant penetration of PV generation in the region will require incentives such as tax credits or high feed-in tariffs.
Due to tropical weather and cloud cover in the region, a CSP plant may not be practical solution for the islands. With a lower level of direct normal insolation (DNI), Nexant estimates that approximately 6-7.5 acres of land will be required per MW of a CSP plant. A CSP plant needs to be at least 15-20 MW to achieve reasonable economies of scale, which would require 90 – 150 acres (36 – 60 hectares) per plant. It may be difficult to locate enough single parcels of this size to support significant penetration, especially on the smaller islands.
8.4.4 Hydro Turbines, Biomass, Landfill Gas
Small Hydro Power Plants
Hundreds of MW of hydro has already been developed in the Caribbean, and more is planned, especially in the Dominican Republic. The best geographical areas for exploiting small-scale hydro power are those where there is both steady river flows and elevation differences. The hill areas of countries with high year-round rainfall, such as the Caribbean islands, provide such an environment. Low-head turbines have been developed for small-scale exploitation of rivers where there is a small head but sufficient flow to provide adequate power. Hydro is highly site-specific and, as for wind, it is essential that detailed studies be conducted at potential sites to arrive at more accurate projections of the feasibility of economic hydro development.
Biomass and LFG

Caribbean Regional Electricity Generation, Interconnection, and Fuels Supply Strategy – Final Report 8-35
Biomass includes wood, agricultural waste, energy crops, and municipal waste. Biomass can be used as fuel in direct combustion, and gasification, and can be supplemented with conventional coal in power generation. Biomass generation can provide base load operation where a year-round supply of fuel is available. The Caribbean region does have biomass resources, however, no projects are in the pipeline and definitive estimates of power generation potential are not available. Currently, MSW disposal sites in the Caribbean do not have means to collect LFG generated. Large cities with land fill disposal should consider modification of existing land fill sites to collect and utilize LFG.
As with wind and small hydro, biomass power generation potential is highly site-specific and it is essential that detailed studies be conducted at potential sites to arrive at more accurate projections of the feasibility of economic hydro development.

Caribbean Regional Electricity Generation, Interconnection, and Fuels Supply Strategy – Final Report 8-36
Table 8-13 Renewable Resource Estimate for the Caribbean Region
Resource Wind Geothermal Hydro Solar PV Biomass Total
Country MW GWH/
MW GWH/
MW GWH/
MW GWH/
MW GWH/
MW GWH/
yr yr yr yr yr yr
Antigua and Barbuda 400 870 ‐ ‐ 27 30 ‐ 427 900
Barbados 10 20 ‐ ‐ 26 30 ‐ 36 50
Dominica ‐ 100 700 8 50 45 50 ‐ 153 800
Dominican Republic 3,200 7,000 ‐ 210 1,470 2,899 3,800 ‐ 6309 12270
Grenada 11 20 400 2,800 ‐ 21 20 0.5 2 432.5 2842
Guadeloupe 15 30 30 210 ‐ 98 120 ‐ 143 360
Haiti 10 20 ‐ 50 350 1,654 2,170 ‐ 1714 2540
Jamaica 70 150 ‐ 22 150 650 850 40 210 782 1360
St. Kitts and Nevis 5 10 300 2,100 ‐ 16 20 20 100 341 2230
St. Lucia ‐ 25 170 ‐ 36 40 ‐ 61 210
St. Vincent / Grenadines 2 4 ‐ 5 30 23 30 ‐ 30 64
Saba Island ‐ 400 2,800 ‐ ‐ ‐ ‐ 400 2800
Total 3,773 8,224 1,255 8,780 295 2,050 5,803 7,560 61 312 11,187 26,926
Notes: Highlighted cells are Nexant derived estimates from different sources. Others numbers are as quoted in the references listed
below. Solar PV - Nexant estimate based on US Government study of covering 0.1% land with PV and 200-300 W/m2 solar
insolation. The blank cells in Table 8-13 indicate that sufficient and credible information is lacking, and Nexant could not estimate the
available resources. A blank does NOT mean that that resource does not exist in that country.

Caribbean Regional Electricity Generation, Interconnection, and Fuels Supply Strategy – Final Report 8-37
References: Guadeloupe - wind Carilec 2002;
http://www.carilec.org/Presentations/RE_Conf_2002/Specifity%20of%20Wind%20Market%20in%20Caribbean%20Islands.pdf
Jamaica Wind Power Study, Renewable Energy Systems Ltd, UK Ministry for Public Works, Transportation and Communications, Bureau of Mines and Energy Electricity of Haiti; Haiti
Energy Sector Development Plan, 2007 – 2017: November 2006. http://www.bme.gouv.ht/energie/National_Energy_Plan_Haiti_Revised20_12_2006VM.pdf
Database of Geothermal Resources in Latin American & the Caribbean, Liz Battocletti of Bob Lawrence & Associates, Inc. for Sandia National Laboratories under Contract No. AS-0989. February 1999. http://www.bl-a.com/ECB/PDFFiles/GeoResLAC.pdf
Geothermal Energy Potential in the Caribbean Region, Erouscilla P. Joseph, Seismic Research Unit, University of the West Indies, St. Augustine, Trinidad, 2008. http://www.un.org/esa/sustdev/sids/2008_roundtable/presentation/energy_joseph.pdf
ENERGY SUSTAINABILITY IN LATIN AMERICA AND THE CARIBBEAN: THE SHARE OF RENEWABLE SOURCES, ECLAC/UNEP (Economic Commission for Latin America and the Caribbean/United Nations Environment Programme) (2001); http://www.eclac.org/publicaciones/xml/3/13413/Lcl.1966i.pdf
Grenada Biomass Ref - “THE REGIONAL HIGH LEVEL SEMINAR ON EXPANDING SUSTAINABLE BIOENERGY EXPANDING SUSTAINABLE BIOENERGY OPPORTUNITIES IN THE CARIBBEAN REGION, Al Binger, On behalf of the Technical Centre for Agricultural Cooperation and the Inter America Institute for Cooperation in Agriculture, August 2007; http://www.agriculture.gov.gy/agroenergy%20presentation/24%20Al%20Binger.pdf
Wind Study for Grenlec http://www.gtz.de/de/dokumente/grenlec2008-en-country-case-study-caricom-grenada.pdf

Caribbean Regional Electricity Generation, Interconnection, and Fuels Supply Strategy – Final Report 8-38
8.5 UPGRADE AND RETROFIT OF EXISTING UNITS
A power generating unit may suffer from poor performance in the form of inability to reach rated capacity, degraded efficiency, too many outages, and reduced expected life due to one or more of the above. One might characterize addressing these shortcomings as refitting. Performance could also be improved by taking steps to increase its rated capacity or efficiency or through other steps that could be characterized as upgrading.
The technical benefits of upgrading/refitting existing oil/diesel fired generation capacity can come from increased capacity in MW, higher reliability, increased energy output, increased efficiency, increased operating flexibility, the need for less maintenance, extended lifetime, and/or the ability to use a wider range of fuels. Increased energy output can come from a combination of one or more of the above factors.
The technical benefits could be assessed as the increase from a unit’s current performance. The costs of achieving those benefits include the capital costs, any change in maintenance costs (could be a benefit), and any change in fuel costs (could be a benefit) associated with, for example, the fuel necessary to support increased output.
The economic benefits from increased capacity and energy output come from the “avoided cost” that otherwise would be incurred to provide a similar amount of capacity and energy. As a simplistic example, suppose a particular upgrading/refitting project added 10 MW capacity to a unit, and produced added energy output equivalent to a capacity factor of 40%. One might assume that the added capacity and energy from the improved unit meant that a 10 MW new diesel unit operating at 40% capacity factor did not have to be built and run. Under that assumption the economic benefit would be the costs that otherwise would have been incurred by building and operating the 10 MW diesel. This economic benefit could be compared to the costs of the upgrading/refitting project discussed in the paragraph above.
To evaluate the benefits more accurately would require at least system simulations and possibly a least cost generation planning exercise. Whether the cost of undertaking such work would be justified depends on circumstances, but is less likely when the improvements affect small units. Simplistic estimates often may be the best approach.
Quantifying the estimated benefits and costs requires information such as the following:
The capital cost of making the improvement
Impact of the improvement on capacity, efficiency, reliability, remaining life, and suitable fuels
Remaining life of the unit
Operating capacity factor of the unit over its remaining life with and without the improvement
Efficiency of the unit at its operating points with and without the improvement
Fuel cost over the remaining lifetime
Maintenance cost over the remaining life with and without the improvement

Caribbean Regional Electricity Generation, Interconnection, and Fuels Supply Strategy – Final Report 8-39
The capital cost of the new unit that otherwise would be needed to provide the capacity, and its salvage value at the end of the remaining life of the improved unit
The efficiency, fuel cost, and maintenance costs of the unit(s) that would otherwise provide the additional energy generated by the improved unit
The Caribbean utilities provided considerable information on the capacity, fuels, and efficiency of their existing, as summarized in Table 5-2. We received relatively little information on their condition, and the specific information we received was for units in excellent condition. Some utilities provided verbal information that some of their units were in poor condition.
However, we received no information on specific shortcomings of existing units or the potential for upgrades. That being the case, we of course also received no information on the improved technical performance, nor on the costs of addressing the shortcomings. Accordingly, we were unable to assess the option and associated costs and benefits of upgrading/refitting existing oil/diesel fired generation capacity to meet future regional/sub-regional demand.
8.6 RENEWABLE ENERGY PROJECTS
The Caribbean region has some existing renewable energy plants, the utilities’ generation expansion plans specify additional plants, and other projects not in their plans have been proposed.
8.6.1 Existing Renewable Projects:
Hydro
The actual capacity of hydro plants may vary due to river flow, annual rain fall, and degradation in reservoir capacity as well as technical issues. The installed hydro power plant capacity in the region (nameplate rating, current rating if different) is shown below.
Dominica 7.6 MW, 5.0 MW in three plants
Dominican Republic 472 MW in numerous run-of-river and reservoir plants
Haiti 62 MW, 31 MW in one major and several smaller plants
Jamaica 23 MW, 20.4 MW
St. Vincent 3.67 MW, 2.50 MW
Guadeloupe 9.4 MW in 13 units
Wind
The installed wind power plant capacity in the region (nameplate rating, current rating if different) is shown below.
Dominican Republic 100 MW in two 50 MW wind farms

Caribbean Regional Electricity Generation, Interconnection, and Fuels Supply Strategy – Final Report 8-40
Jamaica 20 MW, 7 MW wind farm at Wigton, Manchester
Guadeloupe 25 MW installed capacity at 13 wind farms
Martinique 1 MW installed capacity at Ferme Éolienne du Vauclin wind farm
Geothermal
The installed geothermal power plant capacity in the region (nameplate rating, current rating if different) is shown below.
Guadeloupe 4.7+11 = 15 MW Bouillante 1 (1986) and 2 (2004) units in operation
Biomass
The installed biomass power plant capacity in the region (nameplate rating, current rating if different) is shown below.
Guadeloupe Coal and bagasse provide the fuel for three plants
Martinique 4 MW municipal waste
Solar PV
The installed solar PV power plant capacity in the region (nameplate rating, current rating if different) is shown below.
Martinique EDF buys 6 – 10 MW rooftop solar PV from many locations. French law says EDF need accept only 30% of intermittent power generation (wind, solar PV)
St. Lucia LUCELEC buys 0.1 MW of rooftop solar PV power from many locations
8.6.2 Planned Renewable Projects
The utilities include significant expansion of renewable energy in their plans. We received little data on the cost and performance of those projects, but below we present some general results. Hydro, biomass, and landfill gas are highly economic in some circumstances but site-specific and have limited resource availability in the Caribbean. Solar PV has a large resource for potential exploitation but is expensive. Geothermal and wind are also highly site specific, but we know that they can be economic and have large resource availability in the Caribbean.
The evaluation of planned and proposed (Section 8.6.3) renewable projects is conducted using screening analysis. Section 11 describes the details of the screening analysis approach. Here we offer a condensed summary. Screening analysis:
Uses simplified representations of generation costs to help identify least cost generating technologies
Plots annual cost in $/kW-year vs. capacity factor for a set of power plant and/or fuel options

Caribbean Regional Electricity Generation, Interconnection, and Fuels Supply Strategy – Final Report 8-41
The cost in $/kW-yr can also be easily expressed in cents/kWh, which are also of interest but are curved and somewhat harder to interpret than the straight lines in $/kW-yr
Annual cost is sum of:
Annualized investment-related costs based on initial capital investment, discount rate, and plant lifetime
Fixed annual operation and maintenance (O&M)
Variable cost (includes fuel cost and variable O&M costs) per kWh times capacity factor times hours per year
Selects lowest cost resources at each capacity factor, producing the “least-cost line” for that set of resources
Section 11 provides evaluations of each island based on the cost of fossil fuels there, against which we compare the cost of generation from renewable energy. Below we present more general results based on the assumption that distillate is the fuel against which renewable energy options competes.
Figure 8-13 presents the Distillate LCL, which shows the lowest cost that can be obtained from a distillate-fueled power plant at each capacity factor from zero to 90%. The representative technology options are 20 MW simple cycle gas turbines and 20 MW low speed diesel engines. The scale in $/kW-yr for the solid lines is on the left, the scale in cents/kWh for the dotted lines is on the right.

Caribbean Regional Electricity Generation, Interconnection, and Fuels Supply Strategy – Final Report 8-42
0
500
1,000
1,500
2,000
2,500
0% 10% 20% 30% 40% 50% 60% 70% 80% 90%
Capacity Factor, %
An
nu
al C
ost,
$/k
W-y
ear
0
10
20
30
40
50
60
70
80
Co
st, U
S c
ents
/kW
h
20 MW LSD Dist, US$/kW-yr
20 MW GT Dist, US$/kW-yr
Distillate LCL, US$/kW-yr
Distillate LCL, US cents/kWh
Figure 8-13 Least Cost Line for Distillate Fuel
Figure 8-13 shows that the 20 MW gas turbine is lowest in cost at zero capacity factor and the 20 MW low speed diesel is least cost at capacity factors above zero. Whether a utility would want to install gas turbines for such limited use is uncertain.
Figure 8-14 compares renewable energy options to the Distillate LCL when distillate is the fuel. The scale in $/kW-yr for the solid lines is on the left, the scale in cents/kWh for the dotted lines is on the right. The Distillate LCL, in blue, represents the benefit of a renewable energy option. Its generation would displace generation at a cost along that line. Where a renewable energy option’s line is below the blue line, there is a net benefit. It reduces costs elsewhere that are more than its own costs. Where it is above the blue line, it represents a net cost.
Most of the renewable technologies are shown at a range of capacity factors they might reasonably achieve at a good site. Geothermal is also based on a good site, and is shown over the entire capacity factor range because it is not limited by resource availability once the resource has been defined. Wind with backup simply adds the full cost of operation of a 20 MW LSD at 5% capacity factor to the costs of wind without backup, which also adds 5% to the capacity factor. Biomass costs assume that biomass costs the same as export coal in the US.

Caribbean Regional Electricity Generation, Interconnection, and Fuels Supply Strategy – Final Report 8-43
0
500
1,000
1,500
2,000
2,500
0% 10% 20% 30% 40% 50% 60% 70% 80% 90%
Capacity Factor, %
An
nu
al C
ost
, $/k
W-y
ear
0
10
20
30
40
50
60
70
80
Co
st,
US
cen
ts/k
Wh
Distillate LCL, US$/kW-yr1.5 MW Wind Turbine1.5 MW Wind w/BackupCommercial PV 500 kW20 MW GeothermalSmall HydroBiomassSolar Trough 6 hr StorageDistillate LCL, US cents/kWh
Figure 8-14 Distillate LCL vs. Renewable Energy Options
Figure 8-14 shows that all but two of the renewable energy technologies have the potential, at a good site, to be considerably less costly than distillate fueled power generation. Solar PV and solar trough with six hour storage are above the Distillate LCL. If a lower cost fuel such as pipeline gas were the competitive fuel, the advantage of the renewable technology would be less and might disappear.
Although we do not have adequate data to analyze specific projects, the analysis summarized in Figure 8-14 indicates that all the projects planned by the utilities have the potential to be economic except the Solar PV planned for Martinique. That technology is heavily subsidized there through high feed-in tariffs for residential PV-generated power, which explains why more PV is expected there.
Hydro
Dominica Upgrading of existing hydro facilities is DOMLEC’s #2 priority, after geothermal. Considerable hydro potential exists, but costs may be high and no further development is planned.
Dominican Republic Construction is under way or contracts have been signed for 356 MW of new hydro plants. In addition, 159 MW of hydro projects to produce 390 GWH/yr are in final

Caribbean Regional Electricity Generation, Interconnection, and Fuels Supply Strategy – Final Report 8-44
designs, 57 MW of hydro projects to produce 188 GWH/yr have had feasibility studies, and 405 MW of hydro projects to produce 850 GWH/yr have had pre-feasibility studies.
Haiti Rehabilitation of the entire main existing hydro plant (Peligere) is planned. The Government of Brazil is developing a 30 MW hydro plant not far from the existing Peligere plant.
St. Vincent An engineering study for micro hydro 500 kW – 2 MW is planned.
Expansion of existing hydro plant to addition of 2 MW at South Rivers and Richmond
Wind
Antigua & Barbuda Feasibility studies have been undertaken for a 4-5 MW wind farm on Antigua and an up to 400 MW wind farm on Barbuda
Barbados Approved 10 MW wind farm development at Lamberts St. Lucy, as part of a joint development with new diesel engines
Dominica DOMLEC has leased land for a wind farm and will take wind measurements
Dominica: Has identified 9 wind sites and developers are proceeding with 7 wind sites.
Dominican Republic 350 MW of wind power plants have been approved and are awaiting financing. Provisional studies have identified an additional 1,200 MW potential
Grenada Two sites have wind monitoring equipment installed.
Haiti A study of wind at three sites has been conducted and found good results after 6 months at two of them. They want to study other sites
Jamaica Detailed engineering is under way to expand Wigdon Wind Farm by 18 MW
Martinique Expansion of existing Ferme Éolienne du Vauclin wind farm to 40 MW is planned by 2020. French law
St. Lucia LUCELEC is pursuing a wind farm on land they already own. They have anemometers at 10 meters that indicate average wind speeds of 7.5 meters/second when the wind is blowing, which is most of the time. 40 meter anemometers are planned for the near future. LUCELEC believes it can accept only about 30% intermittent generation, given its demand structure.
St. Vincent Announced a 2 MW wind farm for Canouan Island
Geothermal

Caribbean Regional Electricity Generation, Interconnection, and Fuels Supply Strategy – Final Report 8-45
Dominica West Indies Power (Dominica) Ltd. (WIPD) signed a Geothermal Resources Exploration and Development Agreement with the Government of Dominica in 2008, granting them the rights to explore for and develop the geothermal resources located near Soufriere in southern Dominica.. Drilling of the first three slim (exploratory) wells is scheduled to start in June 2010 in the Soufriere area near the southern coast. DOMLEC’s first priority for new generation is a 10 – 15 MW geothermal plant. The French AFD agency has been undertaking a comprehensive assessment of the geothermal potential at the Watton Waven field in central Dominica for some time.
Nevis In 2009 West Indies Power (Nevis) Ltd. (WIPN) was issued a Geothermal Resource Concession by the Nevis Island Administration (NIA) and signed a 25 year Power Purchase Agreement (PPA) with the Nevis Electricity Company Ltd. (NEVLEC). NEVLEC signed a 25 year Power Purchase Agreement (PPA) with WIPN for the supply of 10MW’s of electrical power. Production drilling of two production wells and one injector on Nevis is scheduled to begin June/July 2010, with the 10MW Nevis plant due to be on line in the first half of 2011. In March 2010 West Indies Power signed a mandate agreement with the Bank of Nova Scotia for the financing of a 10 MW geothermal power plant and later to arrange financing for a 30 MW geothermal power plant both of which will be installed on Nevis. Once a Power Purchase Agreement and other required documents are signed by the St Kitts Government, Scotiabank will arrange financing for an additional 30MW geothermal power plant which will supply energy to the St Kitts Electricity Department via a submarine cable from Nevis.
Third party experts confirmed that the geothermal reservoir on Nevis has the potential to produce over 300MW. Discussions are underway to supply the Virgin Islands and Puerto Rico with geothermal power from Nevis via submarine cables.
St. Kitts Discussions are underway between WIP and St. Kitts Electricity and several hotels to supply St. Kitts with 50MW of geothermal power from Nevis via a 3 mile HV AC submarine cable.
St. Lucia There was significant ($40 million) geothermal exploration in the 1970s – 1980s, but the wells did not produce much steam. The geothermal resource is tied up with a long-term license without use or lose provisions and the Canadian developer (UNEC) has done little in the years since signing. LUCELEC has actively negotiated with the developer but a power purchase agreement (PPA) has not been agreed.
St. Vincent There appears to be some geothermal potential but the rights to the resource may be tied up with a developer who has done little
Biomass
Bahamas, Cayman Islands, Surinam Electric utilities from these three countries mentioned an interest in electric power from waste, with the primarily motivation of disposing of the waste rather than power generation
Dominican Republic A 1 MW biomass demo plant is planned for Bonao. The DR also plans a 4,000 Bbl/month biodiesel plant

Caribbean Regional Electricity Generation, Interconnection, and Fuels Supply Strategy – Final Report 8-46
Jamaica Announced plan to develop an estimated 20 MW municipal waste to energy project in Kingston
Solar PV
Martinique EDF expects another 20 MW in the near future and to reach a total of 42 MW by 2020.
St. Lucia LUCELEC is several months into a study of customer solar PV with “grid storage” (buy/sell arrangements)
8.6.3 Proposed Renewable Projects
When distillate fueled power generation is the alternative, the economic window for other generation options is large. Economically attractive hydro, wind, and biomass plants can be developed on a site-by-site basis. In fact, these technologies have all been implemented in other countries where generation less costly than distillate is the alternative.
Geothermal projects are the largest and most advanced of the renewable energy projects proposed. All of the proposed regional/sub-regional renewable energy projects include geothermal power generation. Geothermal power plants have several desirable characteristics:
Proved commercial technology
Lowest cost of power at high capacity factors
Low enough in cost of power to make transmission to other islands via submarine cable feasible
Steady output (not intermittent)
Low emissions
Cost effective at relatively low capacity
Where a good geothermal resource exists in the Caribbean, geothermal power generation is the technology of choice for supplying local demand. The geothermal resource is essentially proven in Nevis. In the other countries where Table 8-13 shows significant potential, the indications are good but the resource is not proven.
The section below provides an evaluation involving geothermal power that applies to two countries. Most of the proposed geothermal projects involve submarine cable interconnections. For that reason we provide their evaluation in Section 9.3, which deals with interconnections in general.
8.6.3.1 Dominica and Nevis
In both Dominica and Nevis, the least-cost fuel is distillate because the fixed costs associated with all other fuels produces high unit costs (above distillate) when demand is so low. The least cost technology is a 5 MW medium speed diesel. Figure 8-15 shows the least-cost line (Fossil

Caribbean Regional Electricity Generation, Interconnection, and Fuels Supply Strategy – Final Report 8-47
LCL) for those two countries when geothermal is not an option. The scale in $/kW-yr for the solid lines is on the left, the scale in cents/kWh for the dotted lines is on the right.
This is the simplest situation. The only technology considered is the 5 MW MSD, and the only fuel considered is distillate. (If HFO were used, the costs would be slightly lower, but the difference is insignificant for the purpose here.) The least cost line (LCL) is simply the cost curve for the 5 MW MSD. The figure uses the term “Fossil LCL” because all the resources comprising the LCL are fossil-fueled. Figure 8-14 also shows the cost in US cents/kWh, which is slightly 20.4 US cents/kWh at 80% capacity factors.
0
500
1,000
1,500
2,000
2,500
0% 10% 20% 30% 40% 50% 60% 70% 80% 90%
Capacity Factor, %
An
nu
al C
ost
, $/k
W-y
ear
0
10
20
30
40
50
60
70
80
Co
st
US
cen
ts/k
Wh
Fossil LCL Dom Nevis US$/kW-yr
5 MW MSD Dist Dom Nevis US$/kW-yr
Fossil LCL Dom Nevis US cents/kWh
5 MW MSD Dist Dom Nevis US cents/kWh
Figure 8-15 Fossil Least Cost Line for Dominica and Nevis with No Geothermal
The LCL rises quickly because of the high fuel cost. At zero capacity factor the annual cost is $82/kW-year, representing the sum of annualized investment costs and fixed O&M costs. The annual fixed cost is the same at all capacity factors. At 80% capacity factor the annual cost is $1,366/kW-year. The impact of high fuel cost is impressive.
Figure 8-16 compares the cost of geothermal generation to the Fossil LCL. The scale in $/kW-yr for the solid lines is on the left, the scale in cents/kWh for the dotted lines is on the right. The Fossil LCL, in blue, represents the benefit of the geothermal plant. Its generation would displace generation at a cost along the blue line. Where the geothermal plant’s line is below the blue line, there is a net benefit. It reduces costs elsewhere that are more than its own costs. Where it is above the blue line, it represents a net cost.

Caribbean Regional Electricity Generation, Interconnection, and Fuels Supply Strategy – Final Report 8-48
The smallest geothermal plant for which we estimated costs is 20 MW, used here. The plants for Nevis and Dominica would probably be 10 MW. The cost per kW of a smaller plant would be expected to be somewhat higher. The line showing annual cost in $/kW-year is nearly flat because the fuel cost is zero. The capital cost of developing the geothermal resource (wells, etc.) is included in the capital cost of the plant. The cost is only US$388/kW-year and 5.5 US cents/kWh at 80% capacity factor, far below the corresponding values for the Fossil LCL at 80% capacity factor. The geothermal plant is lower in cost at capacity factors above about 18%. Typically geothermal plants run in a base load mode, at high capacity factors.
The net benefit of the geothermal plant is represented by the how far below the Fossil LCL the Geothermal line falls. In other words, the net benefit of the geothermal plant is the cost avoided by the geothermal plant less the geothermal plant’s cost. The net benefit is about 15 US cents/kWh at 80% capacity factor, less at lower capacity factors until breakeven at about 18% capacity factor.
If the geothermal costs were twice the estimate above, perhaps due to the smaller plant size, higher return on investment, or any other reason, the cost of 11 US cents/kWh at 80% capacity factor would still be far below the cost of power generated from distillate.
0
500
1,000
1,500
2,000
2,500
0% 10% 20% 30% 40% 50% 60% 70% 80% 90%
Capacity Factor, %
An
nu
al C
ost
, $/
kW-y
ear
0
10
20
30
40
50
60
70
80
Co
st U
S c
ents
/kW
h
Fossil LCL Dom Nevis US$/kW-yr20 MW Geo Dom Nevis US$/kW-yr1.5 MW Wind Turbine1.5 MW Wind w/BackupFossil LCL Dom Nevis US cents/kWh20 MW Geo Dom Nevis US cents/kWh
Figure 8-16 Fossil Least Cost Line for Dominica and Nevis vs. Geothermal
With geothermal power available, the resource mix would include geothermal for service above 18% capacity factor and MSD diesels for service at capacity factors below 18%.

Caribbean Regional Electricity Generation, Interconnection, and Fuels Supply Strategy – Final Report 8-49
Geothermal appears highly likely to provide a sufficient resource to supply all the generation for Nevis, and likely to provide a sufficient resource to supply all the generation for Dominica. If those fail, and good wind sites are identified, wind too can supply energy at lower cost than the Fossil LCL. Other renewable energy options, not shown, might also be able to contribute lower cost energy.
For both Dominica and Nevis, the size of the geothermal power plant compared to the island’s demand is an important issue. For both islands, the plant may be designed to serve 100% of the island’s demand at the time of installation, less (in Dominica’s case) the generation expected from its existing hydro system.
No power plant is available for service 100% of the time. The utilities would need to plan for 100% backup of the geothermal plant from other resources. Initially this could be their existing distillate-fueled generators. Eventually it might be necessary to build new plants to serve primarily as backup. The requirements for spinning and operating reserves would increase. These increases in reserve requirements impose an economic burden not accounted for in the analysis above, but incorporating them would not reverse the economic advantages shown.

Caribbean Regional Electricity Generation, Interconnection, and Fuels Supply Strategy – Final Report 9-1
Section 9 Submarine Cables and Interconnection Options
9.1 OVERVIEW OF SUBMARINE CABLES
9.1.1 Introduction
The state of the art in submarine cable technology is briefly reviewed in the following sections of this report with the objective of providing background on the types of submarine power cable currently available and their ranges of application in terms of voltage, power transmission capacity, maximum transmission distance and maximum water depth, etc. This information will assist in the development of a regional / sub-regional energy supply plan for the Caribbean based on interconnectivity using submarine power cables and an assessment of the benefits that can be derived from a co-ordination of the individual electrical utilities energy supply plans.
Power cable systems can be organized into three general categories, namely:
Self-contained cables
Pipe-type cables
Gas insulated lines
Only self-contained cables are generally used in submarine cable applications. As the name implies this type of cable has external protection (metal sheath, polymeric jacket, and armor wires) applied as an integral part of the cable construction as opposed to pipe-type and gas-insulated types where the cable cores are drawn into pre-installed steel or aluminum pipes.
Within the self-contained category several types can be identified according to the insulating material employed as follows:
Extruded dielectric cables with cross-linked polyethylene or ethylene-propylene- rubber insulation (XLPE and EPR cables, respectively). These cables are mainly used in AC applications up to and including the highest transmission voltages (500 kV AC for XLPE and 138 kV for EPR) though a modified grade of XLPE is in use in DC applications at the lower voltage up to and including 150 kV DC.
Paper or laminated paper-polypropylene tape insulation impregnated with a low viscosity dielectric fluid (typically dodecylbenzene) which is pressurized to improve its dielectric strength (self-contained, fluid-filled or SCFF cables). These cables are in use in AC and DC applications up to and including 500 kV AC and 500 kV DC.
Paper tape insulated cables impregnated with a very high viscosity dielectric fluid which is substantially non-draining and which unlike SCFF cables is not pressurized (mass-impregnated or MI cables). MI cables are only suitable for use at relatively low AC voltages (69 kV AC) but are used extensively at all DC voltage levels up to and including 500 kV DC.
A review of worldwide submarine cable service experience in AC applications is presented in Section 9.1.2; DC applications are covered in Section 9.1.3. A summary is provided in Section

Caribbean Regional Electricity Generation, Interconnection, and Fuels Supply Strategy – Final Report 9-2
9.1.4 of transmission distances, voltages and power transmission capacities for both AC and DC cable types, and Section 9.1.5 provides comments on submarine cable project costs.
9.1.2 AC Submarine Cable Applications
There are many thousands of kilometers of medium voltage (≤ 69 kV) submarine cables installed worldwide. These are mainly of the extruded dielectric type with both XLPE and EPR being employed. XLPE medium voltage cables have a lead sheath and a polymer over-sheath or jacket, while EPR cables are generally of the “wet design” type which means that the EPR insulation is in contact with the sea water. An example of this design is the 44 km long 46 kV AC 3-core Nantucket Island Cable installed in 2004 between the Massachusetts mainland and Nantucket Island.
In the HV and EHV voltage ranges - that is from 110 kV and upwards - AC submarine cable links in the order of 10 km or more are dominated by the self-contained, fluid-filled cable type (SCFF). XLPE cables, on the other hand, have seen application at voltages up to and including 150 kV and are just beginning to be applied in the 230 kV to 420 kV voltage range. Up to a voltage of 150 kV, submarine cables have, in general, a three-core configuration to facilitate circuit installation in one operation, thereby reducing the costs of burial and/or other means of protection against mechanical damage. For higher voltages, the cable design is typically single core. Figure 9-1 shows a sample of the submarine cable connecting the islands of Sardinia (Italy) and Corsica (France). The cable connection is 15 km long, laid at a depth of 75 meters, and buried in the seabed. At the shore ends, additional protective cast iron shells have been applied. The cable weight is 75 kg/m in air and 48 kg/m in water, and the overall diameter is 207 mm. The cable is rated 150 kV for the transmission of 150 MVA, the copper conductors’ cross-sectional area is 400 mm2. A fiber optic element has been placed in the cable interstices for data and signal transmission.
Figure 9-1 3-Core XLPE Submarine Cable

Caribbean Regional Electricity Generation, Interconnection, and Fuels Supply Strategy – Final Report 9-3
Similar cables have been used for the connection of large off-shore wind farms in the European North Sea, as indicated in the list of some of the major AC submarine cable links presented in Table 9-1. The following details for some of the more significant links are provided to supplement the data contained in the table:
Mallorca-Menorca, 1973: The longest (42 km) SCFF AC submarine cable link ever installed. The 90-m-deep link was designed for both 132 kV AC and 200 kV DC operation.
Vancouver Island, 1984: This double-circuit, 325-m-deep link using SCFF cable continues to hold the world record for the highest voltage (525 kV) and power transmission capacity (1,200 MW/circuit). The 30 + 8 km long route places this link among the longest AC EHV transmission cable links ever installed.
Karlskrona, 1986: The first use of XLPE cables in an HV submarine cable application.
Long Island Sound, 1991: The 20-km submarine portion of this 345 kV, 750 MVA interconnection consists of four SCFF cables, with one being kept as a spare for use in case of failure on one of the energized phases. The cable is the largest and most heavily armored single core AC submarine cable ever manufactured with a diameter of 170 mm and a mass of 83.5 kg/m.
Gulf of Aqaba, 1997: The 13-km link consists of three 420 kV cables plus a spare. The transmission capacity is 550 MW. Cables were laid in a maximum water depth of 840 m, which is considered to be close to the limit for SCFF cables, although a sea trial for this project was successfully carried out at a 900-m water depth.
Isle of Man, United Kingdom, 2000: The world's longest HV AC submarine cable is the Isle of Man—UK Mainland link, which is 105 km, XLPE insulated, and 90 kV. Single-core flexible factory-installed splices were spaced at intervals of 5-7 km.
Norway-Gossen Island, 2007: The world’s highest voltage AC XLPE submarine cable system is 3.2 km long, 200 m deep, and 420 kV. (See Figure 9-2)
Figure 9-2 Photograph of a Sample of the 525 kV Vancouver Island Cable

Caribbean Regional Electricity Generation, Interconnection, and Fuels Supply Strategy – Final Report 9-4
Table 9-1 List of Some of the World’s Major AC Submarine Cable Links
Name of Link Date
Volt-age (kV)
Power (MW)
Conduc-tor
(mm2)
Cable Length (km)
Max. Water
Depth (m)
Cable Type
Long Island USA
1970 138 300 600 kcmil
7 x 19 60 SCFF
Mallorca-Menorca Spain
1973 132 80 500 4 x 42 90 SCFF
Long Island USA
1977 345 600 2,500 kcmil
3 x 2.1 30 HPFF
Prince Edward Is. Canada
1977 138 200 3 x 240 3/C x 14 30 SCFF
Vancouver Is. Canada
1984 525 1,200 1,600 4 x 39 400 SCFF
Karlskrona Sweden
1986 145 300 500 3 x 7 N/A XLPE
Labuan-Beaufort (Malaysia)
1989 132 77 3 x 190 3/C x 15 N/A SCFF
South Padre Is. USA
1991 138 250 380 3 x 14 1.5 XLPE
Long Island USA
1991 345 750 2,000 4 x 13 35 SCFF
Negros-Cebu Philippines
1993 138 85 300 4 x 18 60 SCFF
Leyte-Cebu Philippines
1995 230 200 630 4 x 32.5 280 SCFF
Penang Island Malaysia
1996 275 1,000 800 6 x 14 20 SCFF
Spain-Morocco 1997 400 700 800 4 x 26 630 SCFF Gulf of Aqaba Egypt-Jordan
1997 420 550 1,000 4 x 13 840 SCFF
Isle of Man (UK) 2000 90 40 3 x 300 3/C x 105
40 XLPE
Galveston Island USA
2001 138 200 3 x 630 3/C x 4.6 <15 XLPE
Horns Rev Denmark
2002 150 215 3 x 630 1 x 21 <20 XLPE
Seas Roedsand Denmark
2003 132 200 3 x 760 1 x 22 <20 XLPE
Sardinia-Corsica 2005 150 150 3 x 400 1 x 15 75 XLPE Norway-Gossen Is. 2007 420 1000 N/A 4 x 3.2 200 XLPE LIRC Long Island USA1
2008 138 450 3 x 800 3 x 20 60 XLPE
1 Replacement for the SCFF cables installed in 1970.

Caribbean Regional Electricity Generation, Interconnection, and Fuels Supply Strategy – Final Report 9-5
9.1.3 DC Submarine Cable Applications
Three types of submarine power cable can be considered for high-voltage, direct-current (HV DC) operation, namely:
Self-contained, fluid-filled cables (SCFF cables)
Self-contained, mass-impregnated cables (MI cables)
Self-contained, solid dielectric cables (XLPE and EPR cables)
As already mentioned in Section 9.1.1 of this report, the first two cable types in the above list both have insulation consisting of paper tapes impregnated with a dielectric fluid, but are distinguished either by the type of impregnant or by the use of a fluid-pressurizing system. In the case of the SCFF cables, a low-viscosity synthetic fluid - usually dodecylbenzene - is maintained under pressure by oil-pumping stations placed at one or both cable ends while MI cables employ a oil-based high-viscosity non-pressurized compound.
The use of HV DC solid dielectric cables has been delayed due to complications with insulation design, which are caused by the build-up of space charges in the insulation and their subsequent distortion of the electrical stress distribution. This phenomenon manifests itself in a significant reduction in the DC and impulse electric strength of the insulation when the temperature increases and a 30 - 40% decrease in the DC electric strength when the polarity is reversed. Recent progress in the development of modified XLPE using special “functional groups” has been successful in solving the space-charge problem. As a result, the first modified-XLPE HV DC submarine cable link (the 150 kV DC, 330 MW Cross Sound Cable Link) was installed in Long Island Sound in 2002. Another modified-XLPE submarine cable link was commissioned in 2006. This link between Finland and Estonia, a distance of some 75 km, will also operate at 150 kV DC and transport 350 MW of power.
Table 9-2 lists the majority of important HV DC submarine cable links in service worldwide at the present. As can be seen by referring to this table, the total installed cable length is about 3,000 km, and the total service experience can be summarized as approximately 52,000 km-years. Other significant conclusions include the following:
MI cables account for approximately 80% of the entire installed cable length.
SCFF cables are only used for relatively short routes (a few 10s of km).
The state of the art in long-length MI cable technology is the 450 kV, 700 MW, 580-km Norway to Netherlands link in the North Sea.
The state of the art in depth of laying is the 1,000 m depth, but a 1,650 m depth project at the voltage of 500 kV is in progress.
The 150 kV, 330 MW Cross Sound cable system is the first DC submarine cable system to operate with the relatively new voltage source control (VSC) converter technology (Apland et al. 1998).

Caribbean Regional Electricity Generation, Interconnection, and Fuels Supply Strategy – Final Report 9-6
Table 9-2 List of Some of the World’s Major DC Submarine Cable Links
Name of Link Date Volt-age (kV)
Power (MW)
Conduc-tor
(mm2)
Cable Length (km)
Max. Water
Depth (m)
Cable Type
Gotland 1 Sweden
1956 100 20 90 100 160 MI
Italy – Sardinia 1965 200 200 340 2 x 118 450 MI
Konti-Skan 1 1965 285 300 630 64 80 MI
Vancouver Is. 1 Canada
1969 300 470 400 3 x 27 200 MI
Skaggerak 1,2 1976 263 500 800 2 x 125 600 MI
Vancouver Is. 2 1976 300 370 400 2 x 35 200 MI
Hokkaido- Honshu Japan
1980 250 300 600 2 x 42 290 SCFF
Gotland 2,3 Sweden
1983 150 320 800 2 x 100 160 MI
Cross-Channel 2 UK-France
1986 270 2,000 900 8 x 50 55 MI
Konti-Skan 2,3 Denmark-Germany
1988 285 600 1,200 2 x 64 80 MI
Fenno-Skan Sweden-Finland
1989 400 500 1,200 200 117 MI
Cook Strait 2 New Zealand
1991 350 1,500 1,400 3 x 40 300 MI
Skagerrak 3 Norway-Denmark
1993 350 500 1,400 125 500 MI
Cheju (Korea) 1993 180 300 800 2 x 96 160 MI
Baltic Cable Sweden-Germany
1994 450 600 1,600 250 60 MI
Sweden - Poland 1999 450 600 1,600 253 90 MI
KII Japan 2000 500 2,800 3,000 4 x 49 70 SCFF
Italy - Greece 2001 400 500 1,250 160 1000 MI
Moyle (UK) 2001 250 500 1,000 2 x 55 100 MI
Cross Sound (USA)5
2002 150 330 1,300 2 x 42 40 XLPE
5 First HV DC Light Submarine Cable System.
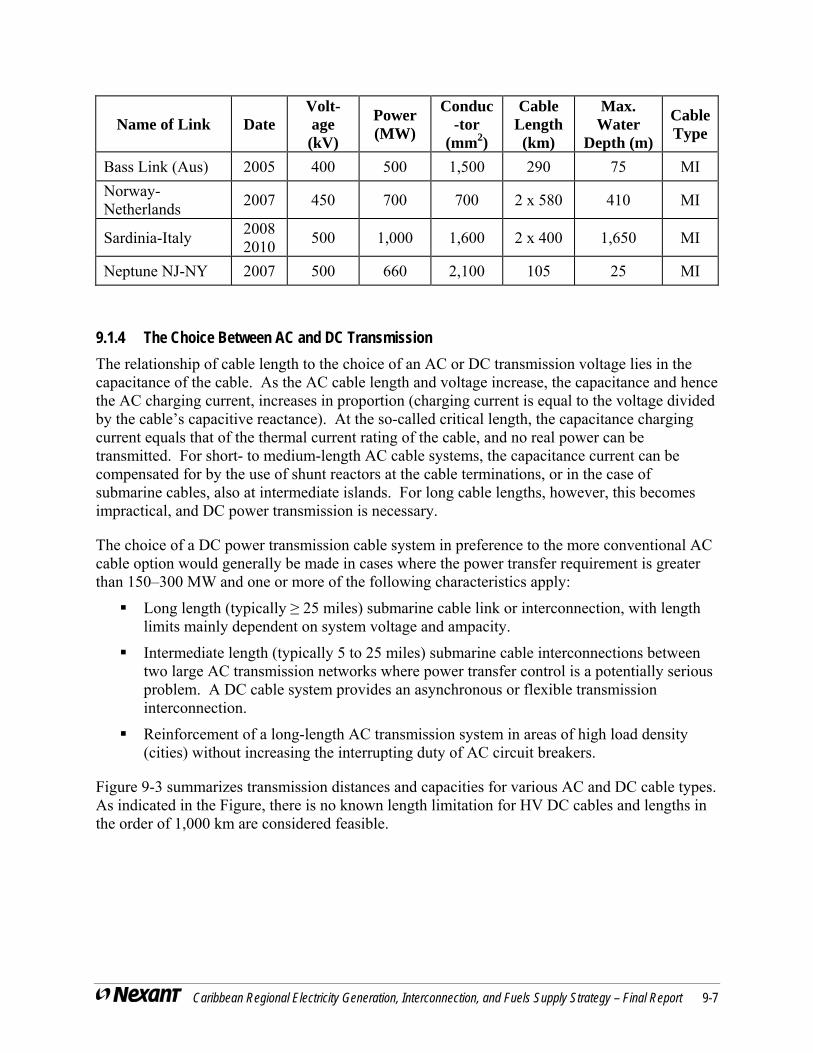
Caribbean Regional Electricity Generation, Interconnection, and Fuels Supply Strategy – Final Report 9-7
Name of Link Date Volt-age (kV)
Power (MW)
Conduc-tor
(mm2)
Cable Length (km)
Max. Water
Depth (m)
Cable Type
Bass Link (Aus) 2005 400 500 1,500 290 75 MI
Norway-Netherlands
2007 450 700 700 2 x 580 410 MI
Sardinia-Italy 2008 2010
500 1,000 1,600 2 x 400 1,650 MI
Neptune NJ-NY 2007 500 660 2,100 105 25 MI
9.1.4 The Choice Between AC and DC Transmission
The relationship of cable length to the choice of an AC or DC transmission voltage lies in the capacitance of the cable. As the AC cable length and voltage increase, the capacitance and hence the AC charging current, increases in proportion (charging current is equal to the voltage divided by the cable’s capacitive reactance). At the so-called critical length, the capacitance charging current equals that of the thermal current rating of the cable, and no real power can be transmitted. For short- to medium-length AC cable systems, the capacitance current can be compensated for by the use of shunt reactors at the cable terminations, or in the case of submarine cables, also at intermediate islands. For long cable lengths, however, this becomes impractical, and DC power transmission is necessary.
The choice of a DC power transmission cable system in preference to the more conventional AC cable option would generally be made in cases where the power transfer requirement is greater than 150–300 MW and one or more of the following characteristics apply:
Long length (typically ≥ 25 miles) submarine cable link or interconnection, with length limits mainly dependent on system voltage and ampacity.
Intermediate length (typically 5 to 25 miles) submarine cable interconnections between two large AC transmission networks where power transfer control is a potentially serious problem. A DC cable system provides an asynchronous or flexible transmission interconnection.
Reinforcement of a long-length AC transmission system in areas of high load density (cities) without increasing the interrupting duty of AC circuit breakers.
Figure 9-3 summarizes transmission distances and capacities for various AC and DC cable types. As indicated in the Figure, there is no known length limitation for HV DC cables and lengths in the order of 1,000 km are considered feasible.

Caribbean Regional Electricity Generation, Interconnection, and Fuels Supply Strategy – Final Report 9-8
Figure 9-3 Transmission Cable System Selection Criteria for Various Cable Types and Capacities (Courtesy of Prysmian Cables and Systems).
9.1.5 Submarine Cable Project Costs
Table 9-3 provides submarine cable projects costs for a number of HV AC and HV DC submarine cable links either already in service or under construction since 2006.
In most cases the costs refer only to the supply and installation of the submarine cable. The asterisks against UK-Ireland and Norned Projects indicate that the converter costs are included, while the Delma Island Project included a significant quantity of associated land cable of a different cable type. The key to the cable types listed is as follows.
MI: Mass-Impregnated paper insulated cable; MI-IRC: MI cable with and integral return conductor (Figure 9-4) SCFF: Self-contained, dielectric-fluid filled cable XLPE: Conventional cross-linked polyethylene insulated cable 3/c XLPE: Three core XLPE XLP: Special cross-linked polymeric insulated DC cables
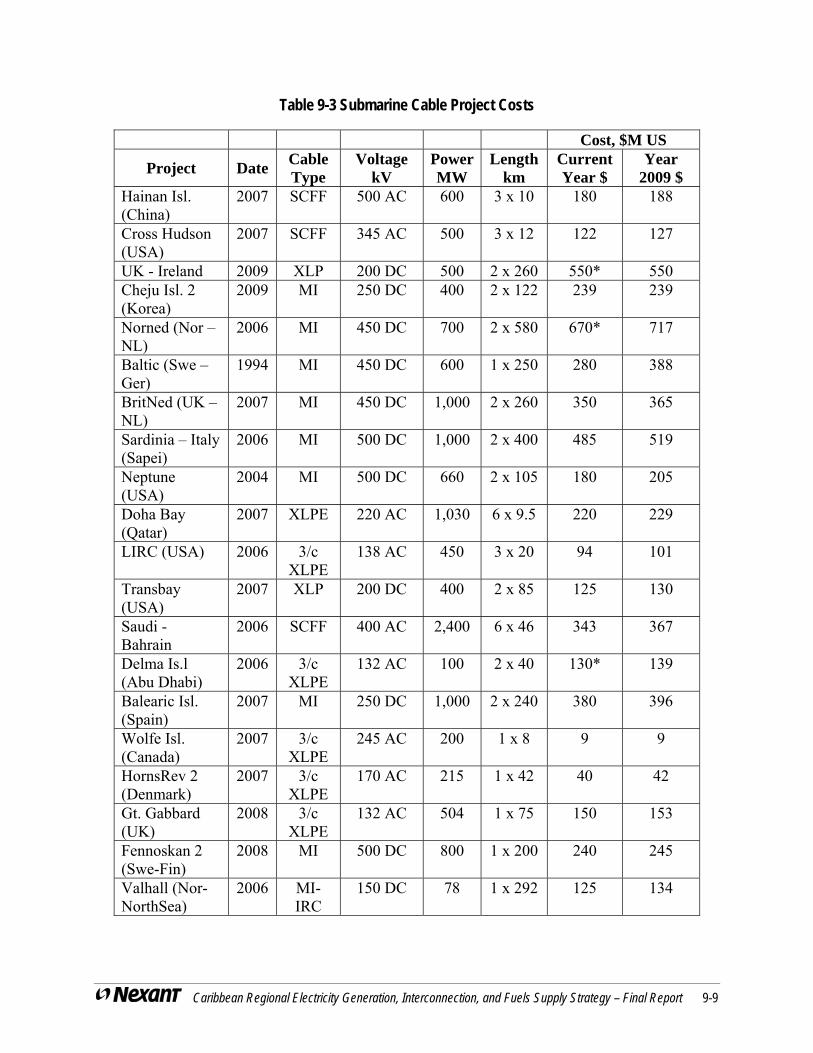
Caribbean Regional Electricity Generation, Interconnection, and Fuels Supply Strategy – Final Report 9-9
Table 9-3 Submarine Cable Project Costs
Cost, $M US
Project Date Cable Type
Voltage kV
Power MW
Lengthkm
Current Year $
Year 2009 $
Hainan Isl. (China)
2007 SCFF 500 AC 600 3 x 10 180 188
Cross Hudson (USA)
2007 SCFF 345 AC 500 3 x 12 122 127
UK - Ireland 2009 XLP 200 DC 500 2 x 260 550* 550 Cheju Isl. 2 (Korea)
2009 MI 250 DC 400 2 x 122 239 239
Norned (Nor – NL)
2006 MI 450 DC 700 2 x 580 670* 717
Baltic (Swe – Ger)
1994 MI 450 DC 600 1 x 250 280 388
BritNed (UK – NL)
2007 MI 450 DC 1,000 2 x 260 350 365
Sardinia – Italy (Sapei)
2006 MI 500 DC 1,000 2 x 400 485 519
Neptune (USA)
2004 MI 500 DC 660 2 x 10⁵ 180 205
Doha Bay (Qatar)
2007 XLPE 220 AC 1,030 6 x 9.5 220 229
LIRC (USA) 2006 3/c XLPE
138 AC 450 3 x 20 94 101
Transbay (USA)
2007 XLP 200 DC 400 2 x 85 125 130
Saudi - Bahrain
2006 SCFF 400 AC 2,400 6 x 46 343 367
Delma Is.l (Abu Dhabi)
2006 3/c XLPE
132 AC 100 2 x 40 130* 139
Balearic Isl. (Spain)
2007 MI 250 DC 1,000 2 x 240 380 396
Wolfe Isl. (Canada)
2007 3/c XLPE
245 AC 200 1 x 8 9 9
HornsRev 2 (Denmark)
2007 3/c XLPE
170 AC 215 1 x 42 40 42
Gt. Gabbard (UK)
2008 3/c XLPE
132 AC 504 1 x 75 150 153
Fennoskan 2 (Swe-Fin)
2008 MI 500 DC 800 1 x 200 240 245
Valhall (Nor-NorthSea)
2006 MI-IRC
150 DC 78 1 x 292 125 134

Caribbean Regional Electricity Generation, Interconnection, and Fuels Supply Strategy – Final Report 9-10
Figure 9-4 HV DC MI-IRC Cable
Note the concentric copper conductor in Figure 9-4. This conductor carries the return current which is generally carried either in the sea/ground (ex. Baltic Cable) or in a separate return cable (ex. Neptune Cable). Nexans introduced the integral return concept in 2001 and it has been used in two projects (Moyle and Valhall Cables).
An attempt was made to correlate the variation of the costs presented in Table 9-3 with both power rating and cable length. Expressing the cost (in 2009 $) per MW as a linear function of the route length using the following equation, namely:
Cost per MW = 2009 $US (230,000 + 850 x Route Length in km)
provided a reasonable representation of most of the data. Exceptions included the three projects marked with the asterisks in Table 9-3 (as expected, because of the converter costs and cost of associated land cable not included in the other projects) plus the Cheju Island and the Valhall HV DC Projects with, respectively, extremely high and extremely low costs.
Figure 9-5 presents the data and graph used to establish the equation above. The dark pink data points are AC cable projects and the dark blue are DC cable projects. The Figure shows that all the longer cables are DC and all the shorter cables are AC. Although a larger data set would show some overlap, there are fundamental reasons for this result:
The high cost of converter stations for DC cables makes them uncompetitive for short distances
AC cables are not used for long distances because the capacitance charging current increases linearly with length and eventually consumes all of the available real current rating

Caribbean Regional Electricity Generation, Interconnection, and Fuels Supply Strategy – Final Report 9-11
0
200
400
600
800
1000
1200
1400
1600
1800
0 50 100 150 200 250 300 350 400 450
Submarine Route Length (km)
Co
st
per
MW
in k
$ U
S1
2
3
Figure 9-5 Correlation Between Cable Length and Cost (2009 $)
As can be seen from the Figure 9-5, points 1 through 3 lie far outside the general pattern.
Point 1: the Valhall Project is a DC link to an offshore oil rig. Nexans, the suppliers, agree that the link is extremely expensive given the very low power requirement, but said that for environmental reasons the rig was not allowed to burn oil or gas for power generation, so BP had no option but to source power from the nearest land (Norway).
Point 2, the Cheju Island 2 Project in Korea’s high cost is probably explained by the fact that the Korean manufacturer is a new player in the submarine cable field having recently commissioned a new submarine cable plant. This project is their first and, as a result, their price probably included a high fixed cost relating to the cost of the new plant.
Point 3, the Wolfe Island Project cost is very low and the reason is not clear. However, this is a world first for a 245 kV 3-core XLPE submarine cable. The short length ~8 km is ideal for the launch of a new product and this may be the reason for the relatively low price.
The remaining scatter in the data points is remarkably low considering the diversity of cable types, site conditions etc. The formula can be considered a useful guide in estimating submarine cable project costs and in assessing supplier bids.

Caribbean Regional Electricity Generation, Interconnection, and Fuels Supply Strategy – Final Report 9-12
9.1.6 Depth Limitations and Spurs
9.1.6.1 Depth Limitations
Depth limitations are of special interest in the Caribbean, which generally is deep and has numerous deep trenches. Depth limitations are mainly concerned with cable mass in relation to the tensile strength of the cable. In order to lay, and perhaps more important to retrieve a cable for repair, the strength of the cable material must be sufficient to support the weight of the length of the cable between the ocean floor and the surface (less its buoyancy). In other words, a cable must be strong enough to support the weight of a length of cable equal to the depth in which it is being place. It cannot be placed at greater depths than its strength can support. As a guideline, the maximum depth for AC cables is 1,000 m, whereas for DC cables it is 1,500 m.
For example, Prysmian opted for an aluminum conductor for the deep water portion (1,650 m) of the SAPEI (Sardinia – Italy) Project in order to reduce the tensile load on the cable. They retained the standard copper conductor for the shallower water. Copper conductor was used for the entire GRITA Project including the deep water (1,000 m) portion.
9.1.6.2 Spurs
With submarine cables, it is not feasible to have a main line carrying bulk power with spurs spliced into the main line and delivering smaller amounts of power to a series of islands along the main line’s length. Cable splices need to be flexible especially for laying in deep water. Flexible means that the diameter of the splice is approximately equal to that of the cable itself. Splicing and laying such a spur is beyond current technology.
Interconnecting several islands can be accomplished by going from island to island, with terminals on each island, or by delivering (for example) all the power to a single central island. Submarine cables from the central island would connect separately to one or more islands in the region.
9.1.7 Submarine Cable Reliability and Repair Procedures
Attachments B and C provide information on Submarine Power Cable Reliability and Submarine Power Cable Repair Procedures, respectively.
9.2 EXISTING/PROPOSED SUB-REGIONAL INTERCONNECTION OPTIONS
Most of the sub-regional interconnection projects involve geothermal power generation but were not reviewed in Section 8.6 as part of the review of renewable projects. The review presented in Section 9.3 focuses on the economic feasibility of the projects. Section 9.2.1 provides a technical review of most of those projects.
The only interconnection project that is not both renewable and does not involve a submarine interconnection is a land-based line from Haiti to Dominican Republic whose primary objective is to provide Haiti access to lower fuel cost fossil-fueled generation resources in the Dominican Republic. Section 9.2.3 provides an economic review of that project.
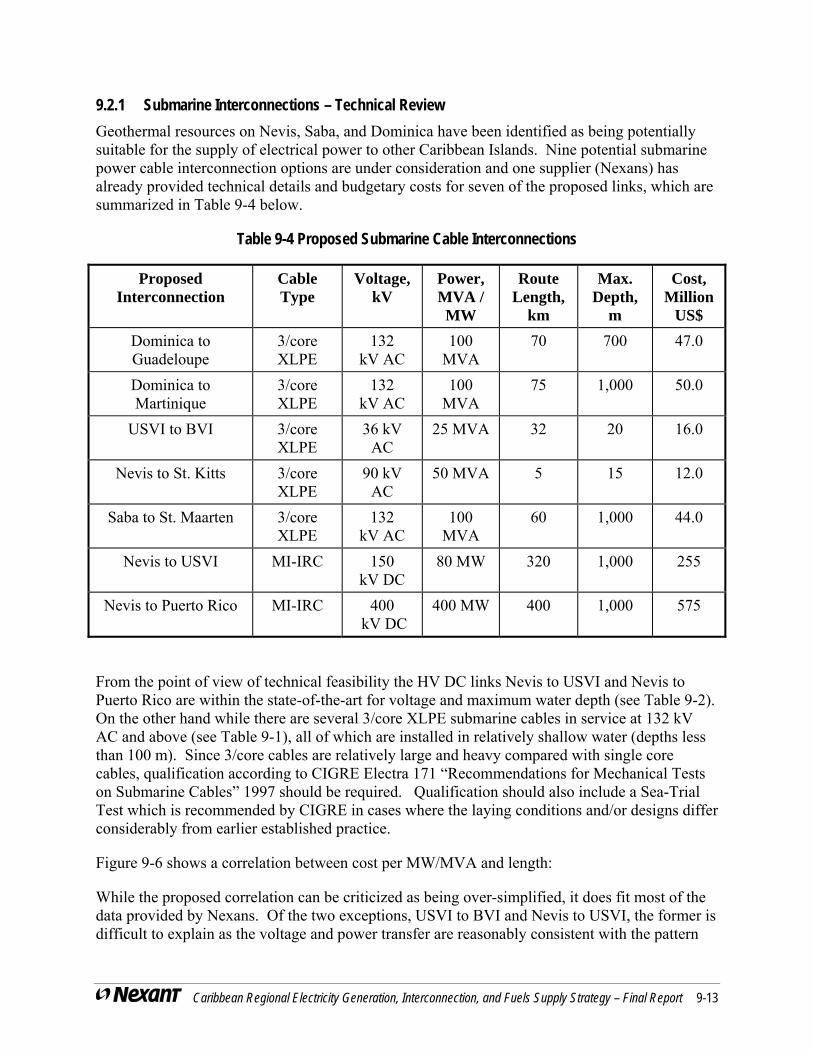
Caribbean Regional Electricity Generation, Interconnection, and Fuels Supply Strategy – Final Report 9-13
9.2.1 Submarine Interconnections – Technical Review
Geothermal resources on Nevis, Saba, and Dominica have been identified as being potentially suitable for the supply of electrical power to other Caribbean Islands. Nine potential submarine power cable interconnection options are under consideration and one supplier (Nexans) has already provided technical details and budgetary costs for seven of the proposed links, which are summarized in Table 9-4 below.
Table 9-4 Proposed Submarine Cable Interconnections
Proposed Interconnection
Cable Type
Voltage, kV
Power, MVA / MW
Route Length,
km
Max. Depth,
m
Cost, Million
US$
Dominica to Guadeloupe
3/core XLPE
132 kV AC
100 MVA
70 700 47.0
Dominica to Martinique
3/core XLPE
132 kV AC
100 MVA
75 1,000 50.0
USVI to BVI 3/core XLPE
36 kV AC
25 MVA 32 20 16.0
Nevis to St. Kitts 3/core XLPE
90 kV AC
50 MVA 5 15 12.0
Saba to St. Maarten 3/core XLPE
132 kV AC
100 MVA
60 1,000 44.0
Nevis to USVI MI-IRC 150 kV DC
80 MW 320 1,000 255
Nevis to Puerto Rico MI-IRC 400 kV DC
400 MW 400 1,000 575
From the point of view of technical feasibility the HV DC links Nevis to USVI and Nevis to Puerto Rico are within the state-of-the-art for voltage and maximum water depth (see Table 9-2). On the other hand while there are several 3/core XLPE submarine cables in service at 132 kV AC and above (see Table 9-1), all of which are installed in relatively shallow water (depths less than 100 m). Since 3/core cables are relatively large and heavy compared with single core cables, qualification according to CIGRE Electra 171 “Recommendations for Mechanical Tests on Submarine Cables” 1997 should be required. Qualification should also include a Sea-Trial Test which is recommended by CIGRE in cases where the laying conditions and/or designs differ considerably from earlier established practice.
Figure 9-6 shows a correlation between cost per MW/MVA and length:
While the proposed correlation can be criticized as being over-simplified, it does fit most of the data provided by Nexans. Of the two exceptions, USVI to BVI and Nevis to USVI, the former is difficult to explain as the voltage and power transfer are reasonably consistent with the pattern

Caribbean Regional Electricity Generation, Interconnection, and Fuels Supply Strategy – Final Report 9-14
provided by the other HV AC cable links. The 80 MW power transmission capacity in the case of the latter interconnection is clearly very low and the relatively high cost per MW may have resulted from the need to over design the cable from an electrical viewpoint (i.e. by employing larger conductor sizes) in order to strengthen the mechanical design to cater for the high laying tension due to the 1000 m water depth. Nexans has been asked to comment but at the time of writing no response has been received.
Nexans have also suggested two other interconnections, namely Nevis to Antigua (75 km, 25 MVA) and St. Vincent to Barbados (170 km, 50 MVA). Nevis to Antigua will certainly be an HV AC interconnection and St. Vincent to Barbados an HV DC interconnection. Without more detailed information these interconnections appear to fit the unit costs developed for the USVI to BVI and Nevis to USVI, respectively. Using these unit costs to provide best estimates of the probable costs of these interconnections results in the following figures:
Nevis to Antigua: US$37.5 million
St. Vincent to Barbados: US$85 million
Figure 9-6 Correlation between Cost per MW/MVA and Length
Cost Comparison
In Section 9.1.5, based on historical cost data we developed a formula relating the cost per MW of a submarine cable system to its length:
Cost per MW = 2009 $US (230,000 + 850 x Route Length in km)
Table 9-5 shows the resulting costs when that formula is applied to the interconnections proposed by Nexans.

Caribbean Regional Electricity Generation, Interconnection, and Fuels Supply Strategy – Final Report 9-15
Table 9-5 Cost Comparison – Nexans Estimates and Historical Formula
Proposed Interconnection
Power, MVA / MW
Route Length,
km
Max. Depth,
m
Estimated Cost, US$ Million
Nexans Formula
Dominica to Guadeloupe
100 MVA
70 700 47 29.0
Dominica to Martinique
100 MVA
75 1,000 50 29.4
USVI to BVI 25 MVA 32 20 16 6.4
Nevis to St. Kitts 50 MVA 5 15 12 11.7
Saba to St. Maarten 100 MVA
60 1,000 44 28.1
Nevis to USVI 80 MW 320 1,000 255 40.2
Nevis to Puerto Rico 400 MW 400 1,000 575 228.0
In one case the estimate produced by the historical formula is about the same as the Nexans estimate. In every other case the estimate produced by the historical formula is significantly less. Nexans estimates are based on information specific to the project in question and are current, whereas the historical formula is based on a range of situations and data going back to 1994. It is not surprising that the estimates differ. Nevertheless, it appears that the Nexans estimates at least do not understate the costs of the submarine interconnections, and therefore do not overestimate the benefits of delivering power over the cables.
9.2.2 Evaluation – Submarine Cable Interconnections
9.2.2.1 St. Kitts
The Fossil LCL for St. Kitts is the same as for Dominica and Nevis (Section 8.6.3) and will be used here as well. A 10 MW MSD might be justified, but the difference is insignificant.
To supply geothermal power to St. Kitts requires a submarine cable, the costs of which are included in the costs shown in Figure 9-7. The scale in $/kW-yr for the solid lines is on the left, the scale in cents/kWh for the dotted lines is on the right. The Fossil LCL, in blue, represents the benefit of the geothermal plant / submarine cable project. Its generation would displace generation at a cost along the blue line. Where the project’s line is below the blue line, there is a net benefit. It reduces costs elsewhere that are more than its own costs. Where it is above the blue line, it represents a net cost.

Caribbean Regional Electricity Generation, Interconnection, and Fuels Supply Strategy – Final Report 9-16
The geothermal capacity of 50 MW is enough to serve 40 MW of load of the St. Kitts utility and some hotels now not part of the grid, plus some room for growth. The submarine cable, including substations at both ends, adds $533/kW to the capital cost, $2 million per year to O&M, and 1% to losses. This increases the capital cost by only 19%. The annual cost at 80% capacity factor increases to$493/kW-year and 7.0 cents/kWh, still far below the Fossil LCL.
The net benefits – the difference between the Fossil LCL and the geothermal plant / submarine cable line – are only slightly smaller than the net benefits for Dominica and Nevis. The net benefit is 13.6 US cents/kWh at 80% capacity factor, less at lower capacity factors until breakeven at about 23% capacity factor. Typically geothermal plants run in a base load mode, at high capacity factors.
0
500
1,000
1,500
2,000
2,500
0% 10% 20% 30% 40% 50% 60% 70% 80% 90%
Capacity Factor, %
An
nu
al C
ost,
$/k
W-y
ear
0
10
20
30
40
50
60
70
80
Co
st, U
S c
ents
/kW
h
Fossil LCL St K US$/kW-yr
50 MW 5 kmGeo Nevis Exp US$/kW-yr1.5 MW Wind US$/kW-yr
1.5 MW Wind w/Backup US$/kW-yr
Fossil LCL St K US cents/kWh50 MW 5 km Geo Nevis Exp US cents/kWh
Figure 9-7 Fossil Least Cost Line for St. Kitts vs. Geothermal Plant / Submarine Interconnection
Geothermal appears highly likely to provide a sufficient resource to supply all the generation for both Nevis and St. Kitts. If that fails, and good wind sites are identified, wind too can supply energy at lower cost than the Fossil LCL. Other renewable energy options, not shown, might also be able to contribute lower cost energy.
The discussion of the need for backup of the geothermal power plant in Section 8.6.3 on Nevis and Dominica applies to St. Kitts as well – the plant and submarine cable are designed to serve 100% of the demand. The conclusion is the same –increases in reserve requirements impose an

Caribbean Regional Electricity Generation, Interconnection, and Fuels Supply Strategy – Final Report 9-17
economic burden not accounted for in the analysis above, but incorporating them would not reverse the economic advantages shown.
Figure 9-19 presents conceptual map for Dominica – Martinique and Dominica – Guadeloupe interconnections. Since geothermal resource on Dominica would replace local generation on Martinique and Guadeloupe, our analysis was expanded to include potential fuel and generation resources for those two islands.
9.2.2.2 Martinique
Distillate fuels virtually all of Martinique’s generation today. If Martinique were limited to distillate as a fuel source, its Fossil LCL would be not much different from those for Dominica, Nevis, and St. Kitts.
However, Martinique has four alternative fuels with considerably lower prices than distillate: CNG, LNG, pipeline gas, and coal. Pipeline gas from Tobago via Barbados provides the lowest price among those four. Figure 9-8 shows the Fossil LCL for Martinique assuming pipeline gas is available. Although we did not prepare a resource plan for Martinique, we felt we have enough information to identify what the Fossil LCL would be. The scale in $/kW-yr for the solid lines is on the left, the scale in cents/kWh for the dotted lines is on the right. The technologies are 20 MW gas turbines for 0% and 5% capacity factor, and 20 MW LSD for 10% capacity factor and above. As a practical matter it may not be economic to use gas turbines for such limited application.
With pipeline gas available, the costs at 80% capacity factor for Martinique are US$604/kW-year and 8.6 US cents/kWh. The costs are far below the distillate-based costs for Dominica, Nevis, and St. Kitts: $1,429/kW-yr and 20.4 US cents/kWh.
Martinique is much farther from Dominica than St. Kitts is from Nevis, so the cost of submarine cables to that island is higher. We first use 100 MW as the size of the geothermal power plants and the submarine cables. This may be more than Martinique is willing to accept, because that makes its largest contingency about 93 MW (100 MW less losses), much higher (for example) than today’s 43 MW in Martinique. This might require Martinique to maintain 93 MW (50 MW additional) of spinning or other operating reserves.
The submarine cable, including substations at both ends, adds $783/kW to the capital cost, $2 million per year to O&M, and 7.5% to losses. The increase in capital cost is 28%. In other words, the geothermal/submarine cable costs are higher and the costs of the alternatives – the Fossil LCLs – are lower.

Caribbean Regional Electricity Generation, Interconnection, and Fuels Supply Strategy – Final Report 9-18
0
500
1,000
1,500
2,000
2,500
0% 10% 20% 30% 40% 50% 60% 70% 80% 90%
Capacity Factor, %
An
nu
al C
ost,
$/k
W-y
ear
0
10
20
30
40
50
60
70
80
Co
st, U
S c
ents
/kW
h
Fossil LCL Mart, US$/kW-yr
20 MW GT GP Mart US$/kW-yr
20 MW LSD GP Mart US$/kW-yr
Fossil LCL Mart, US cents/kWh
Figure 9-8 Fossil Least Cost Line for Martinique with No Geothermal
Figure 9-9 compares the cost of the geothermal plant / submarine cable project to the Fossil LCLs. The scale in $/kW-yr for the solid lines is on the left, the scale in cents/kWh for the dotted lines is on the right. The geothermal project is still lower in cost than the Fossil LCL at capacity factors above 63%. At 80% capacity factor the geothermal and submarine cable option costs 7.1 cents/kWh, compared to Fossil LCL costs of 8.6 cents/kWh.
Thus, the net benefits – the difference between the Fossil LCL and the geothermal plant / submarine cable line – are much smaller than the net benefits for Dominica, Nevis, and St. Kitts.
The gas pipeline has the benefit that it could supply most or all of an island’s existing power plants. In other words it could reduce costs in existing plants as well as new plants, and over the entire range of capacity factors. For both the gas pipeline and geothermal plant / submarine cable cases, storage of distillate would be required at power plants to cover outages of the pipeline or its gas inputs, or outages of the cable or the geothermal plant.
Figure 9-9 also shows that wind projects at good sites can be economic even when low-cost gas is available. Other renewable energy options (not shown) might also be economic if good sites can be found.

Caribbean Regional Electricity Generation, Interconnection, and Fuels Supply Strategy – Final Report 9-19
0
500
1,000
1,500
2,000
2,500
0% 10% 20% 30% 40% 50% 60% 70% 80% 90%
Capacity Factor, %
An
nu
al C
ost
, $/k
W-y
ear
0
10
20
30
40
50
60
70
80
Co
st,
US
cen
ts/k
Wh
Fossil LCL Mart, US$/kW-yr100 MW 75 km Geo Dom Expo US$/kW-yr1.5 MW Wind US$/kW-yr1.5 MW Wind w/Backup US$/kW-yrFossil LCL Mart, US cents/kWh100 / 75 Geo Dom Exp US cents/kWh
Figure 9-9 Fossil Least Cost Line for Martinique and Guadeloupe vs. Geothermal Plant / Submarine Interconnection at 100 MW Each
We also evaluated another case in order to estimate the impact of sizing the cables for 50 MW rather than 100 MW, which would mitigate the impact of the larger single contingency on reserve requirements. We assumed that the submarine cable’s capital cost at 50 MW would be 67% of the 100 MW costs, not 50%.
Figure 9-10 shows the impact of this change. The scale in $/kW-yr for the solid lines is on the left, the scale in cents/kWh for the dotted lines is on the right. The geothermal project’s costs are below the Martinique Fossil LCL above 75% capacity factor. The net benefits are small for Martinique.
Martinique is blessed with multiple options, including geothermal energy via submarine cable. It is unclear whether it would be beneficial to implement more than one. Each option has uncertainties that will need to be addressed before making a decision. Of course, the costs and other parameters of each option have uncertainty bands that further work will help reduce. In addition other issues will affect the choices available, such as whether enough countries, especially Barbados, choose to proceed with the gas pipeline, or the size of the geothermal resource in Dominica. What is clear is that displacing distillate offers very large economic benefits that widen the window of opportunity.

Caribbean Regional Electricity Generation, Interconnection, and Fuels Supply Strategy – Final Report 9-20
0
500
1,000
1,500
2,000
2,500
0% 10% 20% 30% 40% 50% 60% 70% 80% 90%
Capacity Factor, %
An
nu
al C
ost
, $/k
W-y
ear
0
10
20
30
40
50
60
70
80
Co
st, U
S c
ents
/kW
h
Fossil LCL Mart, US$/kW-yr
50 MW 75 km Geo Dom Exp US$/kW-yr
Fossil LCL Mart, US cents/kWh
50 / 75 Geo Dom Exp US cents/kWh
Figure 9-10 Fossil Least Cost Lines for Martinique and Guadeloupe vs. Geothermal Plant / Submarine Interconnection at 50 MW Each
9.2.2.3 Guadeloupe
The discussion for Guadeloupe is similar to that for Martinique. Like Martinique, Guadeloupe is primarily dependent on dependent on distillate, but to a lesser degree; it has three plants fueled by coal and bagasse and a 20 MW geothermal plant. They have roughly the same demand and are similar in other respects as well. If Guadeloupe were limited to distillate as a fuel source, its Fossil LCL would be not much different from those for Dominica, Nevis, and St. Kitts.
However, Guadeloupe has four alternative fuels with considerably lower prices than distillate: CNG, LNG, pipeline gas, and coal. Pipeline gas from Tobago via Barbados and Martinique provides the lowest price among those four. Figure 9-11 shows the Fossil LCL for Guadeloupe assuming pipeline gas is available. Although we did not prepare a resource plan for Guadeloupe, we felt we have enough information to identify what the Fossil LCL would be. The scale in $/kW-yr for the solid lines is on the left, the scale in cents/kWh for the dotted lines is on the right. The technologies are 20 MW gas turbines for 0% and 5% capacity factor, and 20 MW LSD for 10% capacity factor and above.

Caribbean Regional Electricity Generation, Interconnection, and Fuels Supply Strategy – Final Report 9-21
With pipeline gas available, the costs at 80% capacity factor for Guadeloupe are US$708/kW-year and 8.2 US cents/kWh. The costs are above the corresponding values for Martinique: US$604/kW-year and 10.1 US cents/kWh. Guadeloupe’s higher gas cost (levelized US$10.88/GJ vs. US$8.98 for Martinique) causes the increase.
0
500
1,000
1,500
2,000
2,500
0% 10% 20% 30% 40% 50% 60% 70% 80% 90%
Capacity Factor, %
An
nu
al C
ost
, $/
kW-y
ear
0
10
20
30
40
50
60
70
80
Co
st, U
S c
ents
/kW
h
Fossil LCL Guad, US$/kW-yr
20 MW GT GP Guad US$/kW-yr
20 MW LSD GP Guad US$/kW-yr
Fossil LCL Guad, US cents/kWh
Figure 9-11 Fossil Least Cost Line for Guadeloupe with No Geothermal
The geothermal power plant / submarine cable costs are nearly the same for Guadeloupe as for Martinique. Figure 9-9 compares the cost of the geothermal plant / submarine cable project to the Fossil LCL. The scale in $/kW-yr for the solid lines is on the left, the scale in cents/kWh for the dotted lines is on the right. The geothermal project is lower in cost than the Fossil LCL at capacity factors above about 52%. At 80% capacity factor the geothermal power plant / submarine cable project costs 7.1 US cents/kWh, compared to Fossil LCL costs of 10.1 cents/kWh for Guadeloupe.
Thus, the net benefits – the difference between the Fossil LCL and the geothermal plant / submarine cable line – are significantly larger than for Martinique. The higher gas cost makes the economic window larger. The wind projects are also more economic than for Martinique, though the impact is less at the lower capacity factors for the wind projects.

Caribbean Regional Electricity Generation, Interconnection, and Fuels Supply Strategy – Final Report 9-22
0
500
1,000
1,500
2,000
2,500
0% 10% 20% 30% 40% 50% 60% 70% 80% 90%
Capacity Factor, %
An
nu
al C
ost
, $/
kW-y
ear
0
10
20
30
40
50
60
70
80
Co
st, U
S c
ents
/kW
h
Fossil LCL Guad, US$/kW-yr
100 MW 75 km Geo Dom Expo US$/kW-yr
1.5 MW Wind US$/kW-yr
1.5 MW Wind w/Backup US$/kW-yr
Fossil LCL Guad, US cents/kWh
100 / 75 Geo Dom Exp US cents/kWh
Figure 9-12 Fossil Least Cost Lines for Guadeloupe vs. Geothermal Plant / Submarine Interconnection at 100 MW
We also evaluated the case where the geothermal power plant / submarine cable project was sized for 50 MW rather than 100 MW. We assumed that the submarine cable’s capital cost at 50 MW would be 67% of the 100 MW costs, not 50%.
Figure 9-13 shows the impact of this change. The scale in $/kW-yr for the solid lines is on the left, the scale in cents/kWh for the dotted lines is on the right. The geothermal / submarine cable project’s costs are below the Fossil LCL at capacity factors above 62%. The net benefits are reduced but still sizeable.

Caribbean Regional Electricity Generation, Interconnection, and Fuels Supply Strategy – Final Report 9-23
0
500
1,000
1,500
2,000
2,500
0% 10% 20% 30% 40% 50% 60% 70% 80% 90%
Capacity Factor, %
An
nu
al C
ost
, $/k
W-y
ear
0
10
20
30
40
50
60
70
80
Co
st, U
S c
en
ts/k
Wh
Fossil LCL Guad, US$/kW-yr
50 MW 75 km Geo Dom Exp US$/kW-yr
Fossil LCL Guad, US cents/kWh
50 / 75 Geo Dom Exp US cents/kWh
Figure 9-13 Fossil Least Cost Line for Guadeloupe vs. Geothermal Plant / Submarine Interconnection at 50 MW
9.2.2.4 Nevis – Puerto Rico
Puerto Rico was not among the countries studied in detail. Nexans provided cost and performance estimates for a 400 MW HV DC, 400 km submarine cable from Nevis to Puerto Rico. Figure 9-20 presents conceptual map for this interconnection. Here we provide a scoping-level evaluation of that potential project. Figure 9-11 compares the cost of power from a project that includes 400 MW of geothermal generation in Nevis and the submarine cable and related facilities to two potential alternatives in Puerto Rico. The scale for the solid lines is on the left, the scale for the dotted lines is on the right. There is no Fossil LCL because we did not prepare a resource plan for Puerto Rico. Instead, we compare the cost of the geothermal / submarine cable project to two specific resources.
Puerto Rico already has an LNG terminal and might be able to build another, so one option is a 400 MW combined cycle using LNG-derived natural gas priced the same as it would be in the Dominican Republic. However, the more likely scenario is that the imports from Nevis will replace HFO, because most of the power plants in Puerto Rico are HFO-fueled steam plants. We assume that the steam plants capital and annual fixed O&M costs are 67% of those for a conventional coal-fueled power plant, and that the HFO-fueled plant has a heat rate of 10,600 kJ/kWh.

Caribbean Regional Electricity Generation, Interconnection, and Fuels Supply Strategy – Final Report 9-24
Figure 9-14 shows that the geothermal plant / submarine cable project is considerably lower in cost that the HFO fueled steam plant, but higher in cost than the LNG-derived natural gas option except at the highest capacity factors. The scale in $/kW-yr for the solid lines is on the left, the scale in cents/kWh for the dotted lines is on the right.
0
500
1,000
1,500
2,000
2,500
0% 10% 20% 30% 40% 50% 60% 70% 80% 90%
Capacity Factor, %
An
nu
al C
ost
, $/k
W-y
ear
0
10
20
30
40
50
60
70
80
Co
st, U
S c
en
ts/k
Wh
400 MW CC LNG PR US$/kW-yfr
4x100 MW 400 km Geo Nevis Exp US$/kW-yr
356 MW ST HFO PR US$/kW-yr
4x100 MW Geo Nevis Exp US cents/kWh
400 MW CC LNG PR US cents/kWh
356 MW ST HFO PR US cents/kWh
Figure 9-14 HFO Steam Plant for Puerto Rico vs. Fossil Fuel Options for Florida and Interconnection at 400MW
Because most of Puerto Rico’s generation is HFO fueled steam plants, the HFO line seems more appropriate to use as a source of benefits. Using that approach, the net benefits – the difference between the HFO fueled steam plant and the geothermal plant / submarine cable line – are about the same as the net benefits for Dominica, Nevis, and St. Kitts. HFO is less costly than distillate, but the steam plants have higher heat rates than the LSD units on the smaller islands. The net benefit is about 14.5 US cents/kWh at 80% capacity factor, less at lower capacity factors until breakeven at about 26% capacity factor.
9.2.2.5 Nevis – US Virgin Islands (USVI)
The US Virgin Islands was not among the countries studied in detail. Nexans provided cost and performance estimates for a 80 MW HV DC, 320 km submarine cable from Nevis to Puerto Rico. Here we provide a scoping-level evaluation of that potential project, presented on the map

Caribbean Regional Electricity Generation, Interconnection, and Fuels Supply Strategy – Final Report 9-25
on Figure 9-20. Figure 9-15 compares the cost of power from a project that includes 80 MW of geothermal generation in Nevis and the submarine cable and related facilities to what might be its alternative in the USVI, a 5 MW LSD fueled with distillate. There is no Fossil LCL because we did not prepare a resource plan for USVI. Instead, we compare the cost of the geothermal / submarine cable project to the 5 MW LSD. The scale for the solid lines is on the left, the scale for the dotted lines is on the right.
Figure 9-15 shows that the geothermal plant / submarine cable project provides small benefits and then only at high capacity factors. The scale in $/kW-yr for the solid lines is on the left, the scale in cents/kWh for the dotted lines is on the right. It is interesting that a long, expensive submarine cable moving a relatively small amount of power still is marginally competitive compared to distillate-fueled power generation. Geothermal power generation is so much less costly that transportation costs well in excess of the geothermal power cost do not completely compromise its economic advantage. Some of the assumptions may overstate the costs of the submarine cable. For example, we assume losses of 100 watts per meter, the same as for all the other submarine cable cases. However, in this case that amounts to 32 MW cable losses out of 80 MW at the sending end. The cable might be re-optimized to reduce losses without increasing cost proportionally.
0
500
1,000
1,500
2,000
2,500
0% 10% 20% 30% 40% 50% 60% 70% 80% 90%
Capacity Factor, %
An
nu
al C
ost
, $/k
W-y
ear
0
10
20
30
40
50
60
70
80
Co
st,
US
cen
ts/k
Wh
80 MW 320 km Geo Nevis Exp US$/kW-yr
5 MW MSD Dist USVI US$/kW-yr
80 MW 320 km Geo Nevis Exp US cents/kWh
5 MW MSD Dist USVI US cents/kWh
Figure 9-15 Fossil Fuel Option for USVI vs. Geothermal Plant / Submarine Interconnection

Caribbean Regional Electricity Generation, Interconnection, and Fuels Supply Strategy – Final Report 9-26
9.2.2.6 Saba – Sint Maarten
Neither Saba nor Sint Maarten was among the countries studied in detail. Nexans provided cost and performance estimates for a 100 MW, 60 km submarine cable from Saba to Sint Maarten. Here we provide a scoping-level evaluation of that potential project which assumes that the demand in Sint Maarten is sufficient to support 100 MW. Figure 9-21 presents conceptual map for this interconnection. Saint Martin, which shares the same island with Sint Maarten, operates at 50 Hz instead of Sint Maarten’s 60 Hz, so there would be complications to try to combine their demand.
Figure 9-16 compares the cost of power from a project that includes 100 MW of geothermal generation in Nevis and the submarine cable and related facilities to one potential alternative in Sint Maarten: 20 MW distillate fueled LSDs. The scale in $/kW-yr for the solid lines is on the left, the scale in cents/kWh for the dotted lines is on the right.
Figure 9-16 shows that the geothermal plant / submarine cable project is considerably lower in cost that the distillate fueled LSD at high capacity factors, and is lower in cost above a capacity factor of about 24%.
The net benefits – the difference between the distillate fueled LSD and the geothermal plant / submarine cable line – are somewhat less than net benefits for Dominica, Nevis, and St. Kitts. The 20 MW LSD in Sint Maarten has slightly lower costs than the 5 MW MSD used in the other islands, and the addition of the submarine cable costs increase the cost of the combined project, both of which reduce the net benefits. The net benefit is a little over 12 cents/kWh at 80% capacity factor, less at lower capacity factors until breakeven at about 24% capacity factor.

Caribbean Regional Electricity Generation, Interconnection, and Fuels Supply Strategy – Final Report 9-27
0
500
1,000
1,500
2,000
2,500
0% 10% 20% 30% 40% 50% 60% 70% 80% 90%
Capacity Factor, %
An
nu
al C
ost
, $/k
W-y
ear
0
10
20
30
40
50
60
70
80
Co
st, U
S c
en
ts/k
Wh
20 MW LSD Dist StM US$/kW-yr
100 MW 60 km Geo Saba Exp US$/kW-yr
100 / 60 Geo Saba Exp US cents/kWh
20 MW LSD Dist StM US cents/kWh
Figure 9-16 Fossil Fuel Option for Sint Maarten vs. Geothermal plant / Submarine Interconnection at 100MW
9.2.2.7 United States – Cuba
Neither Cuba nor the United States were among the countries studied in detail. Nexans provided cost and performance estimates for a 400 MW HV DC, 400 km submarine cable from Nevis to Puerto Rico with a maximum depth of 1,000 meters. Figure 9-23 presents conceptual map for this interconnection. The parameters for that submarine cable are identical to a cable from Florida to Cuba. The source of generation in the US would not be geothermal, however. In this case it is not clear which fuel and technology would be the source of the generation sent to Cuba. Natural gas and coal fuel most of the generation in Florida, so we will investigate both of those. The natural gas price is the average price for US power plants. Florida imports all its coal from other states, so the coal priced used is the average price for coal for exports, even though that price in the EIA data refers to exports to other countries. The natural gas fuels combined cycles with parameters similar to a 100 MW plant, but with a heat rate of 8,500 kJ/kWh. The coal fuels a conventional coal steam plant with parameters similar to a 300 MW plant, but with a heat rate of 10,000 kJ/kWh.
Nearly all the power plants in Cuba are crude oil or HFO-fueled steam turbine-based plants. We use the parameters for the same HFO-fueled steam plant as for Puerto Rico. We size the plant in Cuba at 356 MW because losses reduce deliveries from Florida to that amount.

Caribbean Regional Electricity Generation, Interconnection, and Fuels Supply Strategy – Final Report 9-28
Figure 9-17 shows that the both combinations of fossil plant in the US / submarine cable are considerably lower in cost that the HFO fueled steam plant in Cuba. The scale in $/kW-yr for the solid lines is on the left, the scale in cents/kWh for the dotted lines is on the right.
0
500
1,000
1,500
2,000
2,500
0% 10% 20% 30% 40% 50% 60% 70% 80% 90%Capacity Factor, %
An
nu
al C
ost
, $/k
W-y
ear
0
10
20
30
40
50
60
70
80
Co
st, U
S c
en
ts/k
Wh
400 MW Coal US Exp US$/kW-yr
356 MW ST HFO Cuba US$/kW-yr
400 MW CC Gas US Exp US$/kW-yr
400 MW Coal US Exp US cents/kWh
400 MW CC Gas US Exp US cents/kWh
356 MW ST HFO Cuba US cents/kWh
Figure 9-17 Fossil Fuel Option for Cuba vs. Fossil Plants / Submarine Interconnection at 400 MW
The net benefit of the coal plant is 13 US cents/kWh at 80% capacity factor, less at lower capacity factors until breakeven at about 23% capacity factor. The net benefit of the gas plant is 15.4 US cents/kWh at 80% capacity factor, less at lower capacity factors until breakeven at close to zero capacity factor. Breakeven is at a low capacity factor because the capital costs of the power plants are about the same.
9.2.3 Evaluation - Land Interconnection, Haiti and Dominican Republic
This is the only project added by Nexant; all the others involve geothermal power generation and submarine cables and were developed by West Indies Power and Nexans (submarine cable supplier).
The interconnection is a 563 km 110 kW line between Port-au-Prince and Santo Domingo. Figure 9-22 presents conceptual map for this interconnection. The line’s normal rating is about

Caribbean Regional Electricity Generation, Interconnection, and Fuels Supply Strategy – Final Report 9-29
250 MW, but the demand served in Haiti averages 130 MW over the study period. The line’s cost, including substations and related facilities at each end, is US$246 million, about US$435,000 per km and US$1,890 per kW served. Assumed O&M cost is 2% of investment per year.
In Haiti the displaced fuel is distillate used in a 20 kW LSD, but with a heat rate of 9,500 kJ/kWh to reflect the poor condition of many of the existing units in Haiti. The fuels evaluated as candidates to generate power for export in the Dominican Republic are HFO, which is the prevalent fuel for power generation in the DR, and natural gas from LNG. The DR has an existing LNG terminal with spare capacity and might build another if needed. The HFO is used in a 300 MW steam plant at a heat rate of 10,600 kJ/kWh, reflecting the likelihood that DR would export its relatively costly power rather than its lowest cost power. Another reason for using this as the source of the delivered is that the DR may not proceed with expansion of its ability to import coal or LNG. If the DR were willing to export power from one of its lower cost generation sources and expands its LNG facilities, the export power could be from natural gas used in a 100 MW combined cycle with a heat rate of 8,000 kJ/kWh.
Figure 9-18 compares the cost of the displaced generation in Haiti to the cost of the delivered generation from the DR. The scale in $/kW-yr for the solid lines is on the left, the scale in cents/kWh for the dotted lines is on the right. If the source of the power from DR is from HFO, the costs exceed the benefits of displacing distillate-based generation in Haiti. HFO is less costly than distillate, but the cost of the interconnection overcomes that advantage. If the source of the power from DR is from natural gas, there are net benefits of 9.6 US cents/kWh at 80% capacity factor, less at lower capacity factors until breakeven at 27% capacity factor.
Assuming that the HFO-based generation would be the candidate for export, the combination of generation and interconnection offers no net benefit. Part of the problem is the relatively high cost of the interconnection. Its cost in $/km is well below any of the submarine cable cases and only slightly below the USVI – British Virgin Islands link (not studied here). However, its cost in $/kW is well above any of the submarine cable cases except Nevis – USVI, and $/kW is what counts in the calculations of cost/kW-yr and cost/kWh. The cost advantage of HFO over distillate is small in comparison.

Caribbean Regional Electricity Generation, Interconnection, and Fuels Supply Strategy – Final Report 9-30
0
500
1,000
1,500
2,000
2,500
0% 10% 20% 30% 40% 50% 60% 70% 80% 90%
Capacity Factor, %
An
nu
al C
ost
, $/k
W-y
ear
0
10
20
30
40
50
60
70
80
Co
st, U
S c
en
ts/k
Wh
20 MW LSD Dist Haiti US$/kW-yr
100 MW CC LNG DR Exp US$/kW-yr
300 MW ST HFO DR Exp US$/kW-yr
20 MW LSD Dist Haiti US cents/kWh
100 MW CC LNG DR Exp US cents/kWh
300 MW ST HFO DR Exp US cents/kWh
Figure 9-18 Fossil Fuel Option for Haiti vs. Fossil Plants / Land Interconnection at 130 MW
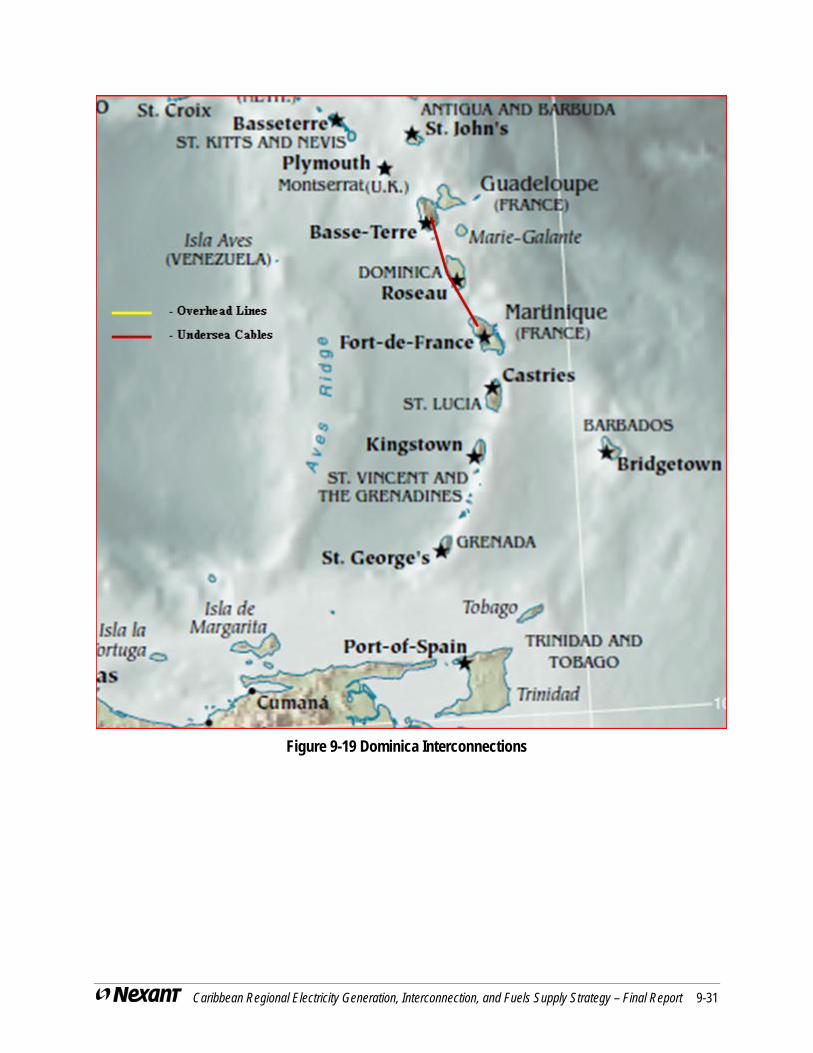
Caribbean Regional Electricity Generation, Interconnection, and Fuels Supply Strategy – Final Report 9-31
Figure 9-19 Dominica Interconnections

Caribbean Regional Electricity Generation, Interconnection, and Fuels Supply Strategy – Final Report 9-32
Figure 9-20 Nevis – Puerto Rico and Nevis – US Virgin Islands Interconnections

Caribbean Regional Electricity Generation, Interconnection, and Fuels Supply Strategy – Final Report 9-33
Figure 9-21 Saba – St. Maarten Interconnection

Caribbean Regional Electricity Generation, Interconnection, and Fuels Supply Strategy – Final Report 9-34
Figure 9-22 Haiti – Dominican Republic Interconnection

Caribbean Regional Electricity Generation, Interconnection, and Fuels Supply Strategy – Final Report 9-35
Figure 9-23 United States (Florida) – Cuba Interconnection
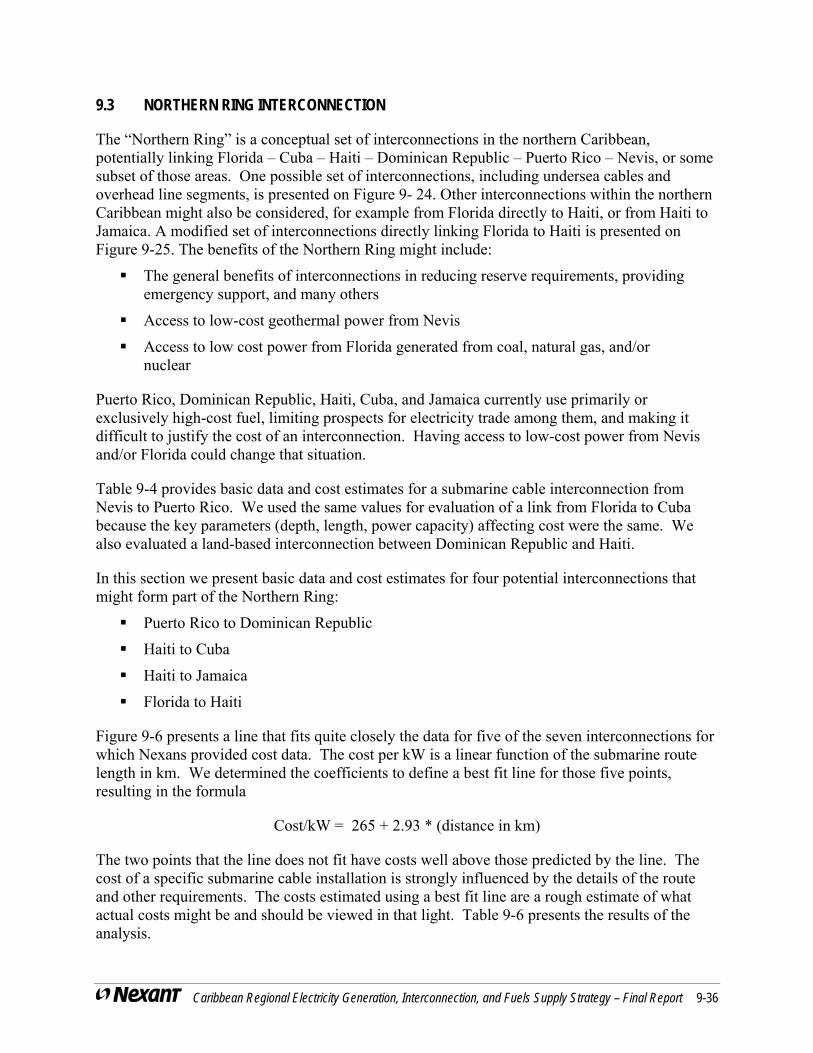
Caribbean Regional Electricity Generation, Interconnection, and Fuels Supply Strategy – Final Report 9-36
9.3 NORTHERN RING INTERCONNECTION
The “Northern Ring” is a conceptual set of interconnections in the northern Caribbean, potentially linking Florida – Cuba – Haiti – Dominican Republic – Puerto Rico – Nevis, or some subset of those areas. One possible set of interconnections, including undersea cables and overhead line segments, is presented on Figure 9- 24. Other interconnections within the northern Caribbean might also be considered, for example from Florida directly to Haiti, or from Haiti to Jamaica. A modified set of interconnections directly linking Florida to Haiti is presented on Figure 9-25. The benefits of the Northern Ring might include:
The general benefits of interconnections in reducing reserve requirements, providing emergency support, and many others
Access to low-cost geothermal power from Nevis
Access to low cost power from Florida generated from coal, natural gas, and/or nuclear
Puerto Rico, Dominican Republic, Haiti, Cuba, and Jamaica currently use primarily or exclusively high-cost fuel, limiting prospects for electricity trade among them, and making it difficult to justify the cost of an interconnection. Having access to low-cost power from Nevis and/or Florida could change that situation.
Table 9-4 provides basic data and cost estimates for a submarine cable interconnection from Nevis to Puerto Rico. We used the same values for evaluation of a link from Florida to Cuba because the key parameters (depth, length, power capacity) affecting cost were the same. We also evaluated a land-based interconnection between Dominican Republic and Haiti.
In this section we present basic data and cost estimates for four potential interconnections that might form part of the Northern Ring:
Puerto Rico to Dominican Republic
Haiti to Cuba
Haiti to Jamaica
Florida to Haiti
Figure 9-6 presents a line that fits quite closely the data for five of the seven interconnections for which Nexans provided cost data. The cost per kW is a linear function of the submarine route length in km. We determined the coefficients to define a best fit line for those five points, resulting in the formula
Cost/kW = 265 + 2.93 * (distance in km)
The two points that the line does not fit have costs well above those predicted by the line. The cost of a specific submarine cable installation is strongly influenced by the details of the route and other requirements. The costs estimated using a best fit line are a rough estimate of what actual costs might be and should be viewed in that light. Table 9-6 presents the results of the analysis.

Caribbean Regional Electricity Generation, Interconnection, and Fuels Supply Strategy – Final Report 9-37
Table 9-6 Basic Data and Cost Estimates for Submarine Cable Interconnections
PR- DRHaiti - Cuba
Haiti - Jamaica
Florida - Haiti
Max Depth, Meters 400 >1,000 >1,000 >1,000Length, Km 150 200 250 1,100
Voltage350 kV HVDC
350 kV HVDC
350 kV HVDC
350 kV HVDC
MW at Sending End 400 400 400 400Cable Loss Rate, Watts/meter 40 40 40 40Cable Losses, MW 6.0 8.0 10.0 44.0Output After Cable Losses, MW 394.0 392.0 390.0 356.0Output After Losses, % of Output Before Losses 98.5% 98.0% 97.5% 89.0%Losses in Each Converter or Inverter Station, % 0.5% 0.5% 0.5% 0.5%
Combined Losses in Two Stations, MW 4.0 4.0 4.0 3.8Output After Cable & Station Losses, MW 390.0 388.0 386.1 352.2
Cable System Cost Based on Nexans Correlation, US$ Million 282 340 399 1,395Cost/km, US$ Million 1.88 1.70 1.60 1.27Cost/kW Sending End, US$ 705 851 998 3,488Combined Cost of Converter and Inverter Station @US$150/kW Each, US$ Million 120 120 120 120Combinced Cost of AC Faciliites at Two DC Stations, US$ Million 22 22 22 22Combined Cost of Substations and Related Facilities, US$ Million 142 142 142 142Total Cost of Cable System and Stations, US$ Million 423 482 541 1,537Total Cost of Cable System and Stations, $/kW Sending End 1,058 1,205 1,351 3,842Total Cost of Cable System and Stations, $/km Sending End 2,822 2,410 2,162 1,397
Annual Sub Cable O&M at 3% of Investment, Million $/yr, Min $2 Million 8.5 10.2 12.0 41.9Annual O&M in $/kW-year Sending End 21.1 25.5 29.9 104.6
Max Voltage, Sending End System 220 115 115 220Max Voltage, Receiving End System 138 220 138 115Frequency, Sending End System 60 60 60 60Frequency, Receiving End System 60 60 50 60
Parameters
Project

Caribbean Regional Electricity Generation, Interconnection, and Fuels Supply Strategy – Final Report 9-38
The only straightforward interconnection is the one between Puerto Rico and the Dominican Republic. The depths are modest and relatively steady across the route, and the distance between the islands is the least of the four. For the other three interconnections, it was not possible to determine a route with maximum depth less than 1,500 meters. The areas between Haiti and Cuba, between Haiti and Jamaica, and offshore the north coast of Cuba (where the cable between Florida and Haiti would have to cross) have extensive undersea canyons and ridges that make determining the exact depths over a route difficult. The costs assume that reasonable routes with maximum depths close to 1,000 meters can be found.
We sized each interconnection at 400 MW and 350 kV, the capacity and voltage already used for the Nevis – Puerto Rico and Florida – Cuba submarine interconnections. A realistic Northern Ring probably would have larger interconnections between the low-cost end points, with interconnections getting progressively smaller towards the center. The state of the art in HV DC submarine cables is 500 kV DC. Higher voltages tend to improve economics and to be used as power levels and distances increase, which might apply for some of the Northern Ring interconnections. This would also help with installations in very deep water because the conductor sizes and hence cable weights would be reduced.
For the Northern Ring to make economic sense, each country along the series of interconnections would take off some of the power flowing. As a hypothetical and extremely simplistic example, Cuba might receive 1,000 MW from Florida, keep 400 MW, and deliver 600 MW to Haiti. Haiti would keep 200 MW and deliver 400 to the DR. Each country would pay a proportional share of all interconnections serving it. Importers and exports would share the costs. DR would be responsible for 400/1,000 = 40% of the importers’ share of the link between Florida and Cuba, 400/600 = 67% of the importers’ share of the link between Cuba and Haiti, and 100% of the importers’ share of the link between Haiti and DR. Unit costs would obviously be higher for the middle islands.
The land-based transmission systems within the countries would have to be strengthened to move power across the country to the next converter or invert station. The costs shown in Table 9-6 do not include any costs associated with strengthening the land-based transmission systems within the countries.
The cost per kW for the three shorter interconnections is in what might be an economically viable range if the sending country had low power costs and the importing country’s displaced fuel was distillate, HFO, or crude. The Florida – Haiti interconnection appears to be outside that range. Because costs for the middle islands would involve their sharing some of the costs of interconnections closer to the low-cost source, making favorable economics more difficult to achieve.

Caribbean Regional Electricity Generation, Interconnection, and Fuels Supply Strategy – Final Report 9-39
Figure 9-24 Northern Ring Set of Interconnections
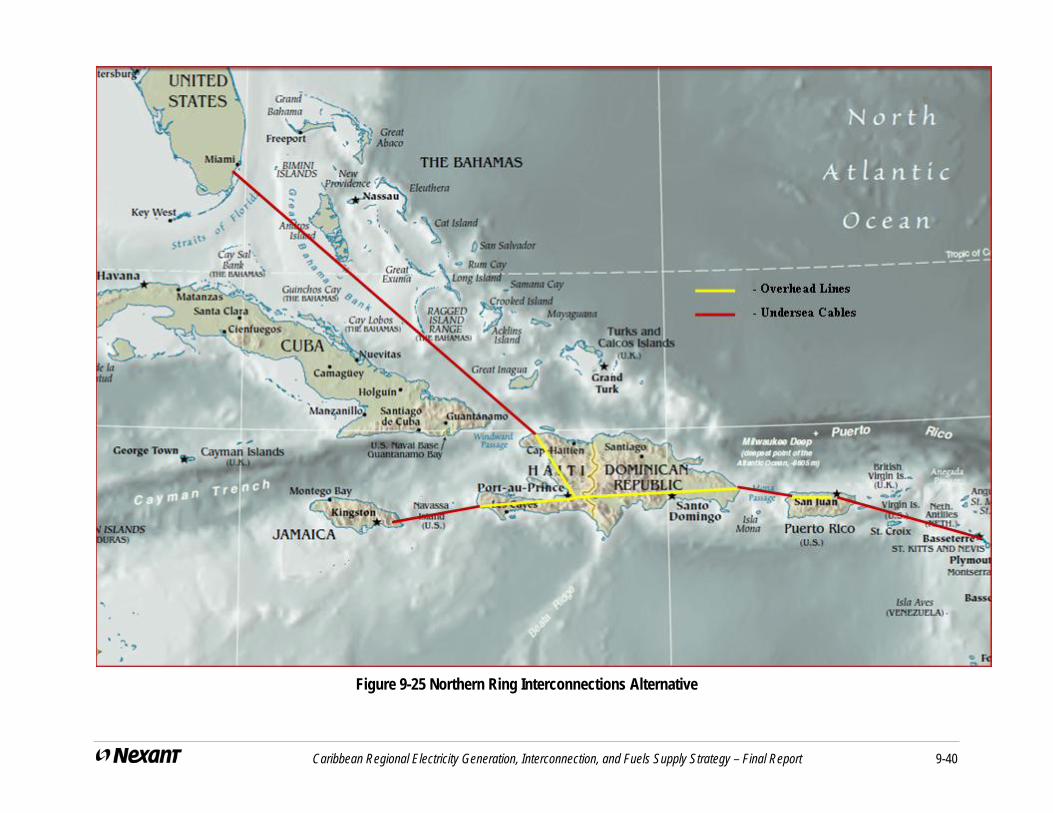
Caribbean Regional Electricity Generation, Interconnection, and Fuels Supply Strategy – Final Report 9-40
Figure 9-25 Northern Ring Interconnections Alternative

Caribbean Regional Electricity Generation, Interconnection, and Fuels Supply Strategy – Final Report 10-1
Section 10 Study Analytical Approach
10.1 OVERVIEW OF ANALYTICAL PROCEDURES
The Study includes three main analytical procedures:
Determining fuel prices for different fuels / fuel delivery mechanisms at each island of primary interest in the Study. Section 7 addresses this issue.
Screening analysis to determine the optimum set of fuel and technology for each island and each potential interconnection. This is addressed in Section 8.6 for renewable energy projects in general and Nevis and Dominica in particular, in Section 9.2 for submarine cable and land-based interconnections, and Section 11 for the individual islands.
Scenario analysis to determine the optimum set of resources (fossil fuels, renewable energy power generation, and interconnections) for the set of main Study islands. This is addressed in Sections 12, 13, and 14.
10.2 SCREENING ANALYSIS APPROACH
Screening curve analysis is based on a spreadsheet analysis of the following power plant parameters: heat rate (fuel efficiency), capital cost, operating and maintenance cost, fuel cost, and estimated costs for transmission upgrades.
The screening curve method combines simplified representations of generation costs and system load projections to help identify the optimum mix of generating technologies. The basic approach is to construct cost curves for each technology and then to match the points of intersection with corresponding load points to determine the competitiveness of each technology and the most cost-effective operating regimes and capacities for each technology. The technique captures the major tradeoffs between capital costs, operating costs, and level of use for proposed types of new generating units. This method recognizes, for example, that the low capital/lower efficiency characteristics of combustion turbines are preferable to high capital/higher efficiency characteristics of combined cycle units for applications requiring small amounts of annual generation. Most important, this method requires only minimal technical and analytical inputs while it quickly eliminates very uncompetitive technologies and provides simplified estimates of optimal technology mixes.
The screening curve method expresses the total annual energy production cost for a generating unit, including all capital-related and operating expenses, as a function of the capacity factor. The following equation defines how the cost curves are developed for this approach:
Total cost = (annualized fixed costs) + (variable cost X capacity factor X hours per year).
Figure 10-1 presents this equation graphically with fixed costs represented by the vertical axis intercept and variable costs shown as the slope of the line. The scale in $/kW-yr for the solid line is on the left, the scale in cents/kWh for the dotted line is on the right. Fixed costs are annualized capital-related costs and annual O&M costs that do not change with the annual kWh production
Caribbean Regional Electricity Generation, Interconnection, and Fuels Supply Strategy – Final Report 10-2
of the unit. For example, if the unit cost to build one kW of generating capacity is $500, and the plant's life is 30 years, and a constant capital charge of $60 per kW-year is sufficient to recover all capital-related costs (including depreciation, return, taxes, and insurance) on a net present value basis, then the levelized fixed charge rate is 0.12 (60/500). Fixed O&M costs are expressed in $/kW-year and are the same at all capacity factors. So, as an example, if fixed O&M cost is 7 $/kW-year then stating point, or intercept with vertical axis would be at 67 $/kW.
Variable costs are fuel costs and variable O&M costs that do vary with the kWh output of the unit, such as consumables. Typically, the variable costs expressed in $/kWh are known or can be calculated. The variable cost component of total annual energy product cost at a given capacity factor is the variable cost in $/kWh times the hours per year of operation. The capacity factor times 8,760, the number of hours in the year, gives the hours per year of operation. If we continue with our numerical example, if fuel and variable O&M costs add up to 30 $/MWh or 3 cents/kWh, then for each kWh produced costs go up 3 cents. We calculated costs for the range of capacity factors up to 90%, not 100%, because planned and unplanned maintenance make it extremely difficult to exceed 90% capacity factor on a regular basis.
0
500
1,000
1,500
2,000
2,500
0% 10% 20% 30% 40% 50% 60% 70% 80% 90%
Capacity Factor, %
An
nu
al C
ost
, $/k
W-y
ear
0
10
20
30
40
50
60
70
80
Co
st, U
S c
ents
/kW
hExample, US$/kW-yr
Example, US cents/kWh
Figure 10-1 Cost Representation for Screening Analysis Method
Figure 10-2 presents screening analysis results showing comparisons among generic technologies: coal-fueled steam plants, distillate-fueled gas turbines, and gas-fueled combined

Caribbean Regional Electricity Generation, Interconnection, and Fuels Supply Strategy – Final Report 10-3
cycles. The results are strictly illustrative and do not represent analysis of any specific data from or for the Caribbean countries.
0
500
1,000
1,500
2,000
2,500
0% 10% 20% 30% 40% 50% 60% 70% 80% 90%
Capacity Factor, %
An
nu
al C
ost, $
/kW
-yea
Gas Turbine, US$/kW-yrCombined Cycle, US$/kW-yrConv Coal, US$/kW-yrLeast Cost Line, US$/kW-yr
Figure 10-2 Illustrative Development of Least Cost Line (LCL)
Annual cost curve comparisons can determine which generation resource will serve system load at the lowest cost at each specific capacity factor. In this example, simple cycle distillate fueled gas turbines are the lowest cost generation from zero to 15% capacity factor, gas-fueled combined cycles are least cost from 15% to 55% capacity factor, and conventional coal fired steam plants are least cost from 55% to 90% capacity factor. The blue line is the least cost line and shows by the colors in the square data point markers which resource is on the LCL at each capacity factor.
The assumption is that there is no practical limit on fuels for those technologies and those resources can be added to the extent needed and generate across the range of capacity factors.

Caribbean Regional Electricity Generation, Interconnection, and Fuels Supply Strategy – Final Report 10-4
On the other hand, renewable resources such as wind and solar photovoltaic can generate only at a limited range of capacity factors because their energy input is intermittent. This means they are not as reliable as fuel-based technologies in meeting load when needed, and the power system must add other capacity as reserve. For wind especially there is usually a limited amount (i.e. available sites with adequate wind) of capacity that could be added to the system. Figure 10-3 illustrates how these resources appear when they are added to the chart. In our example, wind turbines are the lowest cost resource at 15% to 30% capacity factor range, while PV resources are not competitive at any capacity factors. The lowest-cost generation development plan in this illustrative example will likely include a combination of conventional coal steam plants for base-load operation, wind turbines and combined cycles for mid-range operation, and simple cycle gas turbines to meet system peaking requirements.
0
500
1,000
1,500
2,000
2,500
0% 10% 20% 30% 40% 50% 60% 70% 80% 90%
Capacity Factor, %
An
nu
al C
ost, $
/kW
-yea
Least Cost Line, US$/kW-yr
Wind, US$/kW-yr
Solar PV, US$/kW-yr
Figure 10-3 Least Cost Line Plus Renewable Energy Resources

Caribbean Regional Electricity Generation, Interconnection, and Fuels Supply Strategy – Final Report 10-5
10.3 APPROACH FOR DEVELOPING SCENARIOS
Our approach in developing scenarios, i.e., different supply and interconnection plans, was structured to allow economic evaluation of possible individual country options, and also to take full advantage of the regional opportunities of different fuel and interconnection options and increased development of renewable generation. In building energy supply scenarios we relaxed constraints to capture the economic benefits through mechanisms such as:
Remove fuel supply constraints
Add interconnections
The most economic set of supply options and power plants was built considering all feasible power plants, fuel options and the loads
The timing of the initial operation was selected to provide the most economic plan
Scenarios which provide full benefits of integration because the interconnected sub-region was treated as a single entity for planning and operations
Following those rules we developed regional/sub-regional supply plans addressing the following key strategic issues:
How to develop integrated, flexible, and economically optimal development plans for fuel supply, power generation, and transmission for the region?
What is the optimal regional mix of generation technologies and resources?
What are the timing, size, possible location, and operational role of recommended fuel supply and regional generation and interconnection additions?
What are the cost, financing and other implications associated with the regional development plan?
Scenarios were developed taking into account the results of the screening analysis. In building each scenario, screening analysis results were used to limit and define available fuel and resources options for each island. The number of scenarios required was defined by the ability to capture key development options for each country.
Our approach was to first develop a reference case, called the Base Case Scenario, which comprises either existing utilities’ development plans or a continuing business as usual approach to planning. Generation resources were added to each system when they were needed to meet load growth plus reserve margin requirement. This Scenario was used for cost comparisons with other scenarios.
Second scenario was developed to analyze different fuel options, which we call the Fuel Scenario. This Scenario includes options for expanding availability of natural gas (including the Eastern Caribbean Gas Pipeline), LNG and coal to the region. We selected and added fuel and the technologies options based on their availability and ranking from the fuel and screening analysis.

Caribbean Regional Electricity Generation, Interconnection, and Fuels Supply Strategy – Final Report 10-6
The third Scenario assumes the combined addition of submarine cable interconnections transmitting geothermal power generation and addition of the most attractive new renewable generating resources. We call this Scenario the Interconnection/Renewable Scenario.
Finally, we developed a Scenario which combines the benefits of expanded fuel options and interconnections and renewable generation. We call this Scenario the Integrated Scenario. This Scenario was built to show the costs and potential benefits of combining fuels options with transmission integration and renewable generation options.
The Scenarios are described in more details in Section 12.
10.4 POWER SYSTEM EXPANSION PLANNING AND ANALYSIS APPROACH
Our power system planning approach included all the typically required steps:
Gather the necessary data
Establish the planning criteria
Define the existing generation and transmission systems
Prepare load forecast for the entire system based on the individual load forecasts of all utilities
Determine the cost and availability of power plant fuels
Determine options for new generation and interconnections
Develop scenarios to assist in evaluating important development issues
Establish and analyze the Base Case development plans
Establish and analyze scenarios or alternative development plans
Compare the costs and other characteristics of the Base Case and alternative scenarios
With the load forecast and other data in hand, the first analytical step was to conduct a screening curve analysis of generating options. Screening analysis is described in more detail in Section 11. Based on the results of screening analysis, we conducted a more accurate system expansion and production simulation analysis. This more detailed system analysis step involved comparison of scenarios using yearly expansion and production simulation analysis. The analysis was based on extensive inputs about the existing system, future conditions, and characteristics of new power plants, described in earlier sections.
To conduct the system analysis we developed a spreadsheet based model that simulates the operation of the generation system over the entire 2009 – 2028 study period. The model calculates supply/demand balances for the planning period based on the electric demand forecast and the expected future production from existing and planned resources. Electric capacity and energy supply/demand balances are prepared for each year.
On the demand side, the capacity balance used peak demand and calculated required reserve margin based on the capacity reliability criteria (i.e., reserve margin). Reserve margin is a relatively simple approach for determining system reliability and the need for new generation

Caribbean Regional Electricity Generation, Interconnection, and Fuels Supply Strategy – Final Report 10-7
resources. Reserve margin is dependent on the system size, so our model used three different levels of reserve margin dependent on the size of the system: reserve margin of 35% for systems up to 150 MW in peak demand, 30% for systems up to 600 MW and 25% for larger systems. These values compare well with the planning reserve margins used by utilities in the region. Each county plan was developed to meet the set reserve margin reliability criteria. The supply/demand comparison indicated the required capacity additions by year and by country. All resources, except for wind, are assumed to contribute to the reserve margin with their full net capacity. Capacity of generators used for power exports are not contributing to the reserve margin of the exporting or importing islands. Wind generation was also assumed to have no contribution to the reserve margin. So power exports and wind development did not affect resource development plans and benefits are based only on energy generation savings.
After developing the capacity balance, the model calculated the energy balance from available resources. Energy production for each unit was developed taking into account the type of unit, unit operating costs (e.g. fuel and O&M costs), forced and maintenance outage rates, and the limit on energy production typical for renewable units.
A discounted cost analysis, using economic costs, was developed to evaluate selected combinations of resource additions and interconnection options. The discounted cost analysis covered the entire planning period, taking into account salvage value for all investments done during the planning period. The salvage value was calculated based on the in-service year using the straight line depreciation and a 30 year life for all generation and transmission project, other than for diesel units, for which we assumed a 20 year useful life.
This total discounted cost formed the basis for cost comparisons between Scenarios. The analysis was based on a 10% discount rate, applied to the costs expressed in constant 2009 US$. This rate is considered representative for financing future generation and interconnection projects in the region.

Caribbean Regional Electricity Generation, Interconnection, and Fuels Supply Strategy – Final Report 11-1
Section 11 Screening Analysis Results
The primary objective of this section is to present screening curves that illustrate the least cost resources for each country under different circumstances. The least cost resources for a country may include geothermal power imported from another country via submarine cable or power plants served by fuels not presently available at most islands, such as LNG, CNG, pipeline gas, and coal. Section 11.2 provides these screening curves. Section 11.1 provides some foundation information on fossil fuels.
11.1 FOSSIL FUELS
11.1.1 Distillate
Figure 11-1 shows screening curves for distillate-fueled technologies, including:
20 MW and 50 MW simple cycle gas turbine (GT)
100 MW and 300 MW combined cycles (CC)
5 MW medium speed diesel (MSD) and 20 MW low speed diesel (LSD)
Figure 11-1 shows that:
The larger plant of each type is slightly less costly
The GT are lowest in cost at zero capacity factor, but become more costly than the other technologies by 5% capacity factor
The MSD and LSD are slightly lower in cost than the CC
We did not include the 10 MW MSD because the figure is already crowded; its line would fall between the other two diesels.
Although the results indicate that the 20 MW LSD is slightly lower in cost than the 300 MW CC, large combined cycles are being built around the world and there are few if any installations of LSD approaching 300 MW at single site. Using a rough guideline that the largest unit should be no more than 20% of peak demand, in developing resource plans and least-cost curves we will use LSD or MSD for the islands with lower demand and the combined cycles where their size is justified.

Caribbean Regional Electricity Generation, Interconnection, and Fuels Supply Strategy – Final Report 11-2
0
500
1,000
1,500
2,000
2,500
0% 10% 20% 30% 40% 50% 60% 70% 80% 90%
Capacity Factor, %
An
nu
al C
ost
, $/k
W-y
ear
20 MW LSD Dist, US$/kW-yr20 MW GT Dist, US$/kW-yr100 MW CC Dist, US$/kW-yr300 MW CC Dist, US$/kW-yr
5 MW MSD Dist, US$/kW-yr50 MW GT Dist, US$/kW-yr
Figure 11-1 Screening Curves for Distillate-fueled Technologies
11.1.2 Distillate vs. HFO
Distillate is more widely used than HFO, but is also more costly. HFO is not suitable for GT and CC, and is more polluting and harder on the machines. Figure 11-2 shows the cost impact of using distillate and HFO in a 5 MW MSD and in a 20 MW LSD.
The HFO lines appear to fall only slightly below the distillate lines. However, the economic advantage is significant – at 80% capacity factor, about US$107/kW-yr and US cents 1.6/kWh. Where it can be used the economic advantage is clear. The choice of distillate or HFO is essentially a policy matter that might be decided on the basis of emissions, esthetics, or other issues.
There has been a significant economic incentive to use HFO in recent years, which probably has contributed to the desire expressed by some Caribbean utilities to move to HFO. According to the EIA historical data and forecast, from 2006 – 2008 distillate price (in 2009 US$) delivered to US power plants exceeded the comparable HFO price by US$5.59/GJ and 60%. In our analysis Caribbean prices are 12% higher, but the ratio is the same. The EIA forecast for 2009 was to exceed by US$6.48/GJ and 82%. EIA’s long-term forecast showed much less difference. Levelized over the period 2014 – 2028, the difference in the forecast was for distillate to exceed HFO by US$1.84/GJ and 10%. Figure 11-2 is based on the 2014 – 2028 levelized values for distillate and HFO in the Caribbean. If recent historical differences turn out to be maintained, the cost advantage of HFO would increase proportionally.

Caribbean Regional Electricity Generation, Interconnection, and Fuels Supply Strategy – Final Report 11-3
0
500
1,000
1,500
2,000
2,500
0% 10% 20% 30% 40% 50% 60% 70% 80% 90%
Capacity Factor, %
An
nu
al C
ost
, $/k
W-y
ear
20 MW LSD Dist
20 MW LSD HFO
5 MW MSD Dist
5 MW MSD HFO
Figure 11-2 Distillate vs. HFO Cost Comparison
11.1.3 Coal
For distillate and HFO, the same price applies for each island. Analysis of the use of coal as a fuel is complicated by the fact the price of coal varies among the islands because the cost of delivery to the island varies. The smaller the island’s demand for coal, the higher the price because the fixed costs of the coal delivery system are spread over fewer GWH. Four different coal prices apply:
Dominica has such small demand that coal is not a practical option there.
“Coal 10&20MW” applies to islands where the coal demand is sufficient only for 10 MW of capacity in 2014 and 20 MW in 2028. The levelized price over 2014 – 2028 is US$12.31/GJ. The countries where this applies are Antigua and Barbuda, Grenada, and St. Vincent and Grenadines.
“Coal 25MW” applies to islands where the coal demand is sufficient only for 25 MW of capacity in both 2014 and 2028. The levelized price over 2014 – 2028 is US$9.04/GJ. This price applies only in St. Lucia.
“Coal 25&50MW” applies to islands where the coal demand is sufficient only for 25 MW of capacity in 2014 and 50 MW 2028. The levelized price over 2014 – 2028 is

Caribbean Regional Electricity Generation, Interconnection, and Fuels Supply Strategy – Final Report 11-4
US$7.77/GJ. The countries where this applies are Barbados, Guadeloupe, Haiti, and Martinique.
“Coal 100&200MW” applies to islands where the coal demand is sufficient only for 100 MW of capacity in 2014 and 200 MW in 2028. The levelized price over 2014 – 2028 is US$4.36/GJ. This price applies only in Jamaica.
“Coal 200&500MW” applies to islands where the coal demand is sufficient only for 200 MW of capacity in 2014 and 500 MW in 2028. The levelized price over 2014 – 2028 is US$4.19/GJ. This price applies only in Dominican Republic
The technology options help untangle this complication. For islands with smaller demand for coal, only small capacity machines are suitable to remain below a size 20% or less of peak demand.
Figure 11-3 shows screening curves for the coal-fueled technologies bulleted below using the highest coal price, Coal 10&20MW. The highest coal price does not apply to the larger plant sizes because they would be used only in places where high peak demand would bring lower coal costs. The objective of using the same fuel price was to gain a better understanding of the relative costs of the technologies. The screening curves for the individual islands will use the fuel costs specific to each island.
10, 25, and 50 MW circulating fluidized bed (CFB) steam plants
100 MW and 300 MW conventional coal steam plants
Figure 11-3 shows that:
The larger plant of each type is slightly less costly
The 300 MW conventional coal plant and 50 MW CFB plant are virtually identical in cost
The 10 MW CFB is more costly than the other options, all of which are close in cost

Caribbean Regional Electricity Generation, Interconnection, and Fuels Supply Strategy – Final Report 11-5
0
500
1,000
1,500
2,000
2,500
0% 10% 20% 30% 40% 50% 60% 70% 80% 90%
Capacity Factor, %
An
nu
al C
ost
, $/k
W-y
ear
100 MW Conv Coal Plant Coal 10&20MW
300 MW Conv Coal Plant Coal 10&20MW
10 MW CFB Coal 10&20MW
25 MW CFB Coal 10&20MW
50 MW CFB Coal 10&20MW
Figure 11-3 Screening Curves for Coal-fueled Technologies
11.2 SCREENING CURVES FOR INDIVIDUAL ISLANDS
11.2.1 Antigua and Barbuda, Grenada, and St. Vincent and the Grenadines
Figure 11-4 presents the Fossil Least-Cost Curve (LCL) that applies for three countries with the same technology choices and fuel prices, and roughly the same demand: Antigua and Barbuda, Grenada, and St. Vincent and the Grenadines. The scale in $/kW-yr for the solid lines is on the left, the scale in cents/kWh for the dotted lines is on the right. Distillate and coal were the potentially economic fuels; CNG and LNG prices were above distillate. The Fossil LCL comprises the 20 MW GT on distillate for zero capacity factor, the 10 MW MSD on distillate for capacity factors from 5% to 50%, and the coal-fueled CFB for capacity factors from 55% to 90%.
It is questionable whether it would be worthwhile to install a GT that operated for so few hours per year. The coal plant offers clear benefits, but would require significantly more up-front capital for both the plant and the coal transportation facilities than the distillate-based MSD. In addition, a coal plant has more environmental issues than a distillate-fueled plant.
Figure 11-4 also shows that wind is lowest in cost at the capacity factors where it might operate at a good site. Wind with backup simply adds the full cost of operation of a 10 MW MSD at 5%

Caribbean Regional Electricity Generation, Interconnection, and Fuels Supply Strategy – Final Report 11-6
capacity factor to the costs of wind without backup, which also adds 5% to the capacity factor. Other renewable energy plants might also contribute, if good sites can be found.
0
500
1,000
1,500
2,000
2,500
0% 10% 20% 30% 40% 50% 60% 70% 80% 90%
Capacity Factor, %
An
nu
al C
ost
, $/k
W-y
ear
0
10
20
30
40
50
60
70
80
Co
st, U
S c
en
ts/k
Wh
10 MW MSD Dist US$/kW-yr10 MW CFB Coal 10&20MW US$/kW-yrFossil Least Cost Line, US/kW-yr20 MW GT Dist US$/kW-yr1.5 MW Wind US$/kW-yr1.5 MW Wind w/Backup US$/kW-yrFossil LCL, US cents/kWh
Figure 11-4 Fossil LCL and Wind for Antigua and Barbuda, Grenada, and St. Vincent and the Grenadines
11.2.2 Barbados
Figure 11-5 presents the Fossil LCL that applies for Barbados. The scale in $/kW-yr for the solid lines is on the left, the scale in cents/kWh for the dotted lines is on the right. The Fossil LCL comprises the 20 MW GT on pipeline gas for capacity factor of zero and 5% and a 20 MW LSD on pipeline gas for capacity factors from 10% through 90%.
Because it is closer to Tobago, the source of the gas pipeline, than the other countries being served by the pipeline, Barbados has the lowest cost gas of any country. Its Fossil LCL is lower than any other country’s. This is good for the country but makes it harder for other technologies to compete.

Caribbean Regional Electricity Generation, Interconnection, and Fuels Supply Strategy – Final Report 11-7
0
500
1,000
1,500
2,000
2,500
0% 10% 20% 30% 40% 50% 60% 70% 80% 90%
Capacity Factor, %
An
nu
al C
ost
, $/k
W-y
ear
0
10
20
30
40
50
60
70
80
Co
st, U
S c
en
ts/k
WhFossil Least Cost Line, US/kW-yr
20 MW GT GP US$/kW-yr
20 MW LSD GP US$/kW-yr
Fossil LCL, US cents/kWh
Figure 11-5 Fossil LCL for Barbados
Figure 11-6 illustrates this point. It adds wind and some fossil options to the graph of Figure 11-5. Wind with backup, which is typically a better comparison than wind without backup, is now marginally economic at the capacity factors where it might operate at a good site. Wind with backup simply adds the full cost of operation of a 20 MW LSD at 5% capacity factor to the costs of wind without backup, which also adds 5% to the capacity factor.
Figure 11-6 also illustrates what might occur if pipeline gas were not available for Barbados. The orange line represents the cost of a distillate-fueled 20 MW LSD plant. The green line represents the cost of a coal-fueled 25 MW CFB plant. The lines based on natural gas derived from CNG or LNG would approach the 25 MW CFB line at high capacity factors. Without the gas pipeline, costs will increase by about 50%, or much more if distillate is the only fuel available.

Caribbean Regional Electricity Generation, Interconnection, and Fuels Supply Strategy – Final Report 11-8
0
500
1,000
1,500
2,000
2,500
0% 10% 20% 30% 40% 50% 60% 70% 80% 90%
Capacity Factor, %
An
nu
al C
ost
, $/k
W-y
ear
0
10
20
30
40
50
60
70
80
Co
st, U
S c
en
ts/k
Wh
Fossil Least Cost Line, US/kW-yr
1.5 MW Wind Turbine
1.5 MW Wind w/Backup
25 MW CFB Coal 25&50MW US$/kW-yr
20 MW LSD Dist
Fossil LCL, US cents/kWh
Figure 11-6 Other Options for Barbados
11.2.3 Dominica and Nevis
Section 8.6.3 deals with renewable energy and addresses Dominica and Nevis.
11.2.4 Dominican Republic
Section 9.2 deals with interconnections and addresses Haiti and the Dominican Republic, but the feasibility of the interconnection is questionable. Here we evaluate the DR as an isolated system.
Today the DR has power plants using coal and natural gas derived from LNG, but most of its existing generation uses HFO. Expanding the use of coal and LNG offers the potential to reduce costs. The DR has the largest demand of any of the main islands studied, which reduces the costs of natural gas delivered by CNG or LNG, or coal, by spreading the fixed costs over more GJ. Nevertheless the price of the lowest cost gas alternative (LNG) is about $2/GJ more than the price of pipeline gas delivered to Barbados. DR coal is about $3.50/GJ less costly than coal for Barbados.
Figure 11-7 presents the Fossil LCL that applies for the DR. The scale in $/kW-yr for the solid lines is on the left, the scale in cents/kWh for the dotted lines is on the right. The Fossil LCL comprises the 50 MW GT on LNG for capacity factors of zero through 20%, the 300 MW CC on

Caribbean Regional Electricity Generation, Interconnection, and Fuels Supply Strategy – Final Report 11-9
LNG for capacity factors from 25% through 40%, and the conventional coal plant for capacity factors from 45% through 90%.
In order to achieve the Fossil LCL the DR would have to undertake large capital investments for expansion related to coal and LNG transportation, and for coal plants themselves. This may pose a challenge, even if the desire to do so exists. LNG is preferable for application at lower capacity factors, coal for application at higher capacity factors. The scenario analysis provides more information on which is preferable overall, if doing both is not feasible.
0
500
1,000
1,500
2,000
2,500
0% 10% 20% 30% 40% 50% 60% 70% 80% 90%
Capacity Factor, %
An
nu
al C
ost
, $/k
W-y
ear
0
10
20
30
40
50
60
70
80
Co
st, U
S c
en
ts/k
Wh
Fossil Least Cost Line, US/kW-yr50 MW GT LNG US$/kW-yr300 MW CC LNG US$/kW-yr300 MW Conv Coal, US$/kW-yrFossil LCL, US cents/kWh
Figure 11-7 Fossil LCL for Dominican Republic
Figure 11-8 adds wind, small hydro, and fossil options to the graph of Figure 11-7. The small hydro line coincidentally overlaps with the wind with backup line at capacity factors from 30% to 40%. Wind with backup, which is typically a better comparison than wind without backup, is now marginally economic at the capacity factors where it might operate at a good site. Wind with backup simply adds the full cost of operation of a 50 MW gas turbine at 5% capacity factor to the costs of wind without backup, which also adds 5% to the capacity factor.
Figure 11-8 also illustrates what might occur if neither coal nor LNG is available for future generation for the DR. The periwinkle line represents the cost of a 300 MW HFO-fueled steam plant. The capital and fixed O&M costs are assumed to be 67% of those of a 300 MW

Caribbean Regional Electricity Generation, Interconnection, and Fuels Supply Strategy – Final Report 11-10
conventional coal plant. Without expanded supplies of LNG or coal, costs will more than triple at high capacity factors.
DR has under construction or planned considerable new small hydro and wind generation. Figure 11-8 illustrates the desirability of such an approach where good sites can be identified.
0
500
1,000
1,500
2,000
2,500
0% 10% 20% 30% 40% 50% 60% 70% 80% 90%
Capacity Factor, %
An
nu
al C
ost
, $/k
W-y
ear
0
10
20
30
40
50
60
70
80
Co
st, U
S c
en
ts/k
Wh
Fossil Least Cost Line, US/kW-yr1.5 MW Wind US$/kW-yr1.5 MW Wind w/Backup US$/kW-yr300 MW ST HFO DR US$/kW-yrSmall Hydro US$/kW-yrFossil LCL, US cents/kWh
Figure 11-8 Other Options for Dominican Republic
11.2.5 Guadeloupe
Section 9.2 deals with interconnections and addresses Guadeloupe and Martinique. Here we evaluate Guadeloupe as an isolated system, though its Fossil LCL is based on pipeline gas.
Figure 11-9 presents the Fossil LCL that applies for Guadeloupe. The scale in $/kW-yr for the solid lines is on the left, the scale in cents/kWh for the dotted lines is on the right. The Fossil LCL comprises the 20 MW GT on pipeline gas for capacity factors of zero and 5%, and the 20 MW LSD on pipeline gas for capacity factors above 5%.

Caribbean Regional Electricity Generation, Interconnection, and Fuels Supply Strategy – Final Report 11-11
0
500
1,000
1,500
2,000
2,500
0% 10% 20% 30% 40% 50% 60% 70% 80% 90%
Capacity Factor, %
An
nu
al C
ost
, $/k
W-y
ear
0
10
20
30
40
50
60
70
80
Co
st,
US
ce
nts
/kW
h
Fossil Least Cost Line, US/kW-yr20 MW LSD GP Guad US$/kW-yr20 MW GT GP Guad US$/kW-yrFossil LCL, US cents/kWh
Figure 11-9 Fossil LCL for Guadeloupe
Figure 11-10 adds wind and fossil options to the graph of Figure 11-9. Wind with backup, which is typically a better comparison than wind without backup, is now marginally economic at the capacity factors where it might operate at a good site. Wind with backup simply adds the full cost of operation of a 20 MW GT fueled with pipeline gas at 5% capacity factor to the costs of wind without backup, which also adds 5% to the capacity factor.
Figure 11-10 also illustrates what might occur if neither pipeline gas nor the geothermal power plant / submarine cable interconnection project is available for future generation for Guadeloupe. The orange line with diamonds represents the cost of a 20 MW LSD fueled by LNG. Its slope is steeper than the Fossil LCL, which above 5% capacity factor is based on the same technology but uses higher priced LNG rather than pipeline gas. The green line is based on a 25 MW CFB using coal. It slowly approaches the Fossil LCL; its lower cost coal fuel price advantage slightly outweighs its heat rate disadvantage. The orange line without diamonds is based on the most expensive fuel, distillate, in a 20 MW LSD.
Guadeloupe is fortunate to have these options available. At 80% capacity factor, the gas pipeline provides power at 10.1 US cents/kWh. Comparable values for the coal and LNG are 11.7 US cents/kWh and 12.5 US cents/kWh respectively, whereas for distillate the value is 19.1 US cents/kWh.

Caribbean Regional Electricity Generation, Interconnection, and Fuels Supply Strategy – Final Report 11-12
0
500
1,000
1,500
2,000
2,500
0% 10% 20% 30% 40% 50% 60% 70% 80% 90%
Capacity Factor, %
An
nu
al C
ost
, $/k
W-y
ear
0
10
20
30
40
50
60
70
80
Co
st
US
Ce
nts
/kW
h
Fossil Least Cost Line, US/kW-yr20 MW LSD Dist US$/kW-yr25 MW CFB Coal 25&50MW US$/kW-yr20 MW LSD LNG Guad US$/kW-yr1.5 MW Wind Turbine1.5 MW Wind w/BackupFossil LCL, US cents/kWh
Figure 11-10 Other Options for Guadeloupe
11.2.6 Haiti
Section 9.2 deals with interconnections and addresses Haiti and the Dominican Republic, but the feasibility of the interconnection is questionable. Here we evaluate Haiti as an isolated system.
Haiti has some existing and planned hydro plants, but most of its existing generation is MSD fueled by distillate.
Figure 11-11 presents the Fossil LCL that applies for Haiti. The scale in $/kW-yr for the solid lines is on the left, the scale in cents/kWh for the dotted lines is on the right. The Fossil LCL comprises the 20 MW GT on LNG for a capacity factor of zero, the 20 MW LSD LNG for capacity factors from 5% through 85%, and the 25 MW coal-fueled CFB for 90% capacity factor.
It is questionable whether it would be worthwhile to install a GT that operated for so few hours per year, or a coal plant that offers limited benefits and then only when operating at a very high capacity factor. Assuming the LNG transportation facilities are built, adding coal transportation facilities and the coal plant itself would require significantly more up-front capital. In addition, a coal plant has more environmental issues than a distillate-fueled plant.

Caribbean Regional Electricity Generation, Interconnection, and Fuels Supply Strategy – Final Report 11-13
0
500
1,000
1,500
2,000
2,500
0% 10% 20% 30% 40% 50% 60% 70% 80% 90%
Capacity Factor, %
An
nu
al C
ost
, $/
kW-y
ear
0
10
20
30
40
50
60
70
80
Co
st,
US
ce
nts
/kW
hFossil Least Cost Line, US/kW-yr
20 MW GT LNG US$/kW-yr
20 MW LSD LNG US$/kW-yr
25 MW CFB Coal 25&50MW US$/kW-yr
Fossil LCL, US cents/kWh
Figure 11-11 Fossil LCL for Haiti
Figure 11-12 adds wind, small hydro, and fossil options to the graph of Figure 11-11. The small hydro line coincidentally overlaps with the wind with backup line at capacity factors from 30% to 40%. Wind with backup, which is typically a better comparison than wind without backup, is now marginally economic at the capacity factors where it might operate at a good site. Wind with backup simply adds the full cost of operation of a 20 MW gas turbine at 5% capacity factor to the costs of wind without backup, which also adds 5% to the capacity factor.
Figure 11-12 also illustrates what might occur if neither coal nor LNG is available for future generation for Haiti. The orange line represents the cost of a 20 MW LSD on distillate. Without expanded supplies of LNG or coal, costs will increase by 65% at high capacity factors.
Haiti has plans for a 30 MW hydro facility and is collecting wind data to identify potentially economic wind sites. Figure 11-12 illustrates the desirability of such an approach where good sites can be identified.

Caribbean Regional Electricity Generation, Interconnection, and Fuels Supply Strategy – Final Report 11-14
0
500
1,000
1,500
2,000
2,500
0% 10% 20% 30% 40% 50% 60% 70% 80% 90%
Capacity Factor, %
An
nu
al C
ost
, $/
kW-y
ear
0
10
20
30
40
50
60
70
80
Co
st,
US
ce
nts
/kW
h
Fossil Least Cost Line, US/kW-yr20 MW LSD Dist US$/kW-yr1.5 MW Wind US$/kW-yr1.5 MW Wind w/Backup US$/kW-yrSmall Hydro US$/kW-yrFossil LCL, US cents/kWh
Figure 11-12 Other Options for Haiti
11.2.7 Jamaica
Figure 11-13 presents the Fossil LCL that applies for Jamaica. The scale in $/kW-yr for the solid lines is on the left, the scale in cents/kWh for the dotted lines is on the right. The Fossil LCL comprises the 50 MW GT on LNG for capacity factor from zero to 10%, the 20 MW LSD on LNG for capacity factors from 15% through 45%, and the 50 MW coal-fueled CFB for capacity factors from 50% to 90%.
In order to achieve the Fossil LCL the DR would have to undertake large capital investments for expansion related to coal and LNG transportation, and for coal plants themselves. This may pose a challenge, even if the desire to do so exists. LNG is preferable for application at lower capacity factors, coal for application at higher capacity factors. The scenario analysis provides more information on which is preferable overall, if doing both is not feasible. Assuming the LNG transportation facilities are built, adding coal transportation facilities and the coal plant itself would require significantly more up-front capital. In addition, a coal plant has more environmental issues than a distillate-fueled plant.

Caribbean Regional Electricity Generation, Interconnection, and Fuels Supply Strategy – Final Report 11-15
0
500
1,000
1,500
2,000
2,500
0% 10% 20% 30% 40% 50% 60% 70% 80% 90%
Capacity Factor, %
An
nu
al C
ost
, $/
kW-y
ear
0
10
20
30
40
50
60
70
80
Co
st,
US
ce
nts
/kW
h
Fossil Least Cost Line, US/kW-yr
20 MW LSD LNG US$/kW-yr
50 MW CFB Coal 100&200MW US$/kW-yr
50 MW GT LNG US$/kW-yr
Fossil LCL, US cents/kWh
Figure 11-13 Fossil LCL for Jamaica
Figure 11-14 adds wind and fossil options to the graph of Figure 11-13. Wind with backup, which is typically a better comparison than wind without backup, is now marginally economic at the capacity factors where it might operate at a good site. Wind with backup simply adds the full cost of operation of a 20 MW gas turbine at 5% capacity factor to the costs of wind without backup, which also adds 5% to the capacity factor.
Figure 11-14 also illustrates what might occur if neither coal nor LNG is available for future generation for Jamaica. The orange line represents the cost of a 20 MW LSD on distillate. Without expanded supplies of LNG or coal, costs will more than double at high capacity factors.
Jamaica has plans for new wind facilities. Figure 11-14 illustrates the desirability of such an approach where good sites can be identified.

Caribbean Regional Electricity Generation, Interconnection, and Fuels Supply Strategy – Final Report 11-16
0
500
1,000
1,500
2,000
2,500
0% 10% 20% 30% 40% 50% 60% 70% 80% 90%
Capacity Factor, %
An
nu
al C
ost
, $/
kW-y
ear
0
10
20
30
40
50
60
70
80
Co
st,
US
ce
nts
/kW
h
Fossil Least Cost Line, US/kW-yr
20 MW LSD Dist US$/kW-yr
1.5 MW Wind Turbine
1.5 MW Wind w/Backup US$/kW-yr
Fossil LCL, US cents/kWh
Figure 11-14 Other Options for Jamaica
11.2.8 Jamaica North
Jamaica’s demand is concentrated in two areas: the southern coast around Hunts Bay, and around Montego Bay on the northern coast. The two areas are separated by a mountain range and it would be expensive to connect the two areas by gas pipeline. The results in the section above are based on serving 60% of Jamaica’s demand, roughly that in the southern area. This section is based on serving the northern area, about 30% of demand. Bogue is the existing power plant serving that area. The results are nearly identical because the only difference comes from a difference in the price of natural gas derived from LNG: levelized 2014-2028 US$10.90/GJ for Jamaica North compared to US$10.16 for the southern coast. The calculated coal price is the same for both locations.
The results show significant economic benefits to developing LNG in the north as well as the south, though no comparison of this option compared to the cost of a gas pipeline from the south was conducted. The discussions of the Fossil LCL, comparison of other options to the Fossil LCL, and the consequences of developing neither coal nor LNG facilities is similar to the discussion in the section above and will not be repeated here. Figures presenting the results also differ insignificantly from Figures 11-13 and 11-14 and will not be repeated here.

Caribbean Regional Electricity Generation, Interconnection, and Fuels Supply Strategy – Final Report 11-17
11.2.9 Martinique
Section 9.2 deals with interconnections and addresses Guadeloupe and Martinique. Here we evaluate Martinique as an isolated system, though its Fossil LCL is based on pipeline gas.
Figure 11-15 presents the Fossil LCL that applies for Martinique. The scale in $/kW-yr for the solid lines is on the left, the scale in cents/kWh for the dotted lines is on the right. The Fossil LCL comprises the 20 MW GT on pipeline gas for capacity factors of zero and 5% and the 20 MW LSD on pipeline gas for capacity factors of 10% and above.
0
500
1,000
1,500
2,000
2,500
0% 10% 20% 30% 40% 50% 60% 70% 80% 90%
Capacity Factor, %
An
nu
al C
ost
, $/
kW-y
ear
0
10
20
30
40
50
60
70
80
Co
st,
US
ce
nts
/kW
hFossil Least Cost Line, US/kW-yr
20 MW GT GP US$/kW-yr
20 MW LSD GP US$/kW-yr
Fossil LCL, US cents/kWh
Figure 11-15 Fossil LCL for Martinique
Figure 11-16 adds wind and fossil options to the graph of Figure 11-15. Wind with backup, which is typically a better comparison than wind without backup, is now marginally economic at the capacity factors where it might operate at a good site. Wind with backup simply adds the full cost of operation of a 20 MW LSD on pipeline gas at 5% capacity factor to the costs of wind without backup, which also adds 5% to the capacity factor.
Figure 11-16 also illustrates what might occur if neither pipeline gas nor the geothermal power plant / submarine cable interconnection project is available for future generation for Martinique. The orange line represents the cost of a 20 MW LSD fueled by LNG. Its slope is steeper than

Caribbean Regional Electricity Generation, Interconnection, and Fuels Supply Strategy – Final Report 11-18
the Fossil LCL, which above 5% capacity factor is based on the same technology but uses higher priced LNG rather than pipeline gas. The green line is based on a 25 MW CFB using coal. It nearly parallels the Fossil LCL about US$110-150/kW-yr above it. The green line is based on a 25 MW CFB using coal. It slowly diverges from the Fossil LCL; its heat rate disadvantage slightly outweighs its lower cost coal fuel price advantage. The green line is based on the most expensive fuel, distillate, in a 20 MW LSD.
Martinique is fortunate to have these options available. At 80% capacity factor, the gas pipeline provides power at 8.5 US cents/kWh. Comparable values for the coal and LNG are 11.7 US cents/kWh and 11.5 US cents/kWh, whereas for distillate the value is 19.1 US cents/kWh.
0
500
1,000
1,500
2,000
2,500
0% 10% 20% 30% 40% 50% 60% 70% 80% 90%
Capacity Factor, %
An
nu
al C
ost
, $/
kW-y
ear
0
10
20
30
40
50
60
70
80
Co
st,
US
ce
nts
/kW
h
Fossil Least Cost Line, US/kW-yr20 MW LSD Dist US$/kW-yr25 MW CFB Coal 25&50MW US$/kW-yr20 MW LSD LNG Mart US$/kW-yr1.5 MW Wind Turbine1.5 MW Wind w/BackupFossil LCL, US cents/kWh
Figure 11-16 Other Options for Martinique
11.2.10 St. Kitts
Section 9.2 deals with interconnections and addresses St. Kitts.
11.2.11 St. Lucia
Figure 11-17 presents the Fossil LCL that applies for St. Lucia. The scale in $/kW-yr for the solid lines is on the left, the scale in cents/kWh for the dotted lines is on the right. The Fossil LCL comprises the 20 MW GT on pipeline gas for capacity factor of zero and 5% and a 20 MW

Caribbean Regional Electricity Generation, Interconnection, and Fuels Supply Strategy – Final Report 11-19
LSD on pipeline gas for capacity factors from 10% through 90%. In contrast to some of the other islands, coal is too expensive to become part of the Fossil LCL when pipeline gas is available, though it is well below distillate in price. Both CNG and LNG are above distillate in price.
0
500
1,000
1,500
2,000
2,500
0% 10% 20% 30% 40% 50% 60% 70% 80% 90%
Capacity Factor, %
An
nu
al C
ost
, $/
kW-y
ear
0
10
20
30
40
50
60
70
80
Co
st,
US
ce
nts
/kW
hFossil Least Cost Line, US/kW-yr
20 MW LSD GP US$/kW-yr
20 MW GT GP US$/kW-yr
Fossil LCL, US cents/kWh
Figure 11-17 Fossil LCL for St. Lucia
Figure 11-18 adds wind and fossil options to the graph of Figure 11-13. Wind with backup, which is typically a better comparison than wind without backup, is now marginally economic at the capacity factors where it might operate at a good site. Wind with backup simply adds the full cost of operation of a 20 MW gas turbine at 5% capacity factor to the costs of wind without backup, which also adds 5% to the capacity factor.
Figure 11-18 also illustrates what might occur if neither pipeline gas nor coal are available for future generation for St. Lucia. The orange line represents the cost of a 20 MW LSD on distillate. That technology and fuel combination almost doubles the cost. The green line represents the cost of a 25 MW CFB on coal, which adds about a third to the cost. New fuel options substantially decrease the costs of power generation in St. Lucia.
St. Lucia is collecting wind data to determine the feasibility of developing wind generation. Figure 11-18 illustrates the desirability of such an approach where good sites can be identified.

Caribbean Regional Electricity Generation, Interconnection, and Fuels Supply Strategy – Final Report 11-20
0
500
1,000
1,500
2,000
2,500
0% 10% 20% 30% 40% 50% 60% 70% 80% 90%
Capacity Factor, %
An
nu
al C
ost
, $/
kW-y
ear
0
10
20
30
40
50
60
70
80
Co
st.
, U
S c
en
ts/k
Wh
Fossil Least Cost Line, US/kW-yr20 MW LSD Dist US$/kW-yr25 MW CFB Med Hi Coal1.5 MW Wind US$/kW-yr1.5 MW Wind w/Backup US$/kW-yrFossil LCL, US cents/kWh
Figure 11-18 Other Options for St. Lucia
11.3 THE IMPACT OF CO2 “COSTS”
The results presented thus far have not addressed climate change issues. The vast majority of power generation in the Caribbean is from fossil fuels that produce greenhouse gas emissions, especially CO2. One approach to incorporating the impact of CO2 emissions is to attribute a cost to each tonne of such emissions. This might be viewed as a tax or the cost of a license to emit. The cost would provide a disincentive for CO2 emissions and might generate revenues for the government imposing the cost. The resulting higher cost of fossil fuels would open wider the economic window for technologies that produce lower or no CO2 emissions.
The objective of this subsection is to evaluate the impact on power generation in the Caribbean of attributing a cost of $50/tonne to CO2 emissions. The focus is on the potential impact on the relative attractiveness of power generation technologies.
The US Department of Energy calculated coefficients relating CO2 emissions to fuels based on typical heat content and chemical composition. Using those coefficients, Table 11-1 shows the added cost of CO2 emissions for the main fuels used assuming a CO2 cost of $50/tonne. Table 11-2 shows the impact of the added cost of CO2 emissions on the fuel prices.

Caribbean Regional Electricity Generation, Interconnection, and Fuels Supply Strategy – Final Report 11-21
Table 11-1 Added Cost of Fuels Based on CO2 Cost of US$50/tonne
Coal Natural
Gas / LNG Distillate HFO Emission Coefficient, kg CO2/GJ
88.2 50.3 69.4 74.8
Added Cost per GJ if CO2 Cost = $50/tonne
4.41 2.52 3.47 3.74
Table 11-2 Impact of CO2 Costs on Fuel Costs
Fuel
Cost, $/GJ, Levelized 2014-2028
% Increase
Fuel Price
Added Cost Due to CO2 Emissions
Total Cost
Distillate 22.45 3.47 25.92 15% HFO 20.46 3.74 24.20 18% Natural Gas 7.00 2.52 9.52 36% Coal for US Power Plants 1.90 4.41 6.31 232% Coal for Export 3.47 4.41 7.88 127% LNG Dom Rep 8.73 2.52 11.25 29% LNG Haiti 12.73 2.52 15.25 20% LNG Jam 10.16 2.52 12.68 25% LNG Jam North 10.90 2.52 13.42 23% GP Barb 7.39 2.52 9.91 34% GP Mart 8.98 2.52 11.50 28% GP StL 10.49 2.52 13.01 24% GP Guad 10.88 2.52 13.40 23% Coal 10&20MW 12.31 4.41 16.72 36% Coal 25MW 9.04 4.41 13.45 49% Coal 25&50MW 7.77 4.41 12.18 57% Coal 100&200MW 4.85 4.41 9.26 91% Coal 200&500MW 4.19 4.41 8.60 105%
Table 11-1 shows that costs for CO2 emissions for fossil fuels ranges from US$2.52/GJ to US$4.41/GJ. Renewable energy resources typically would have zero CO2 cost. Table 11-2 shows that the percentage increases are below 20% for the liquid fuels, below 40% for natural gas, and from 36% to 232% for coal. The percentage increase for the liquid fuels is low because the fuel price itself is high. For natural gas, the moderate fuel price and low cost for CO2 produce moderate percentage increases. The coal fuel price is low in some cases, which

Caribbean Regional Electricity Generation, Interconnection, and Fuels Supply Strategy – Final Report 11-22
combined with the highest CO2 costs gives high percentage increases. Where coal transportation costs are high, the coal fuel price is higher and the percentage increases are moderate.
The impact on technology choices may be different on each island, depending on technology limitations as well as fuel costs. The subsections below provide results for islands covering a range of circumstances.
11.3.1 Distillate Only
Today distillate is used on and in this Study has the same price on every one of the main Study islands, and distillate and HFO are the predominant fuels used. This Study shows that other fuels and power generation sources could be lower cost in the future, but until that happens the liquid fuels will continue to be the alternative to renewable energy resources. Considering the costs of all fuel options, distillate remains the least cost fuel for Nevis, St. Kitts, and Dominica.
0
500
1,000
1,500
2,000
2,500
0% 10% 20% 30% 40% 50% 60% 70% 80% 90%
Capacity Factor, %
An
nu
al C
ost
, $/k
W-y
ear
0
10
20
30
40
50
60
70
80
Co
st, U
S c
ents
/kW
h
Distillate LCL, US$/kW-yr1.5 MW Wind Turbine1.5 MW Wind w/BackupCommercial PV 500 kW20 MW GeothermalSmall HydroBiomassSolar Trough 6 hr StorageDistillate LCL CO2 $50, US$/kW-yrDistillate LCL, US cents/kWhDistillate LCL CO2 $50, US cents/kWh
Figure 11-19 CO2 Cost Impact on Islands Using Only Distillate
Figure 11-19 illustrates the impact of a CO2 cost of US$50/tonne on the Distillate LCL on those islands. The figure is similar to Figure 8-13, with the addition of a Distillate LCL based on a CO2 cost of US$50/tonne. The scale in $/kW-yr for the solid lines is on the left, the scale in cents/kWh for the dotted lines is on the right.

Caribbean Regional Electricity Generation, Interconnection, and Fuels Supply Strategy – Final Report 11-23
The higher fuel price did not affect the technology choices, which remain GT for a capacity factor of zero and a MSD for capacity factor of 5% and above. However, at the 80% capacity factor point the CO2 cost adds 14% to the total cost of power, consistent with the increase in distillate cost of 15%. The renewable energy resources that were below the Distillate LCL before are now somewhat more economic, and PV and the Solar Trough with storage edge closer to being competitive
11.3.2 Coal on the Fossil LCL
Coal is on the Fossil LCL on three islands with low demand, though greater demand than on Nevis, St. Kitts, and Nevis. Those three islands are Antigua and Barbuda, Grenada, and St. Vincent and the Grenadines. The coal fuel price is the same on all three islands. The other fuels are not competitive.
0
500
1,000
1,500
2,000
2,500
0% 10% 20% 30% 40% 50% 60% 70% 80% 90%
Capacity Factor, %
An
nu
al C
ost
, $/k
W-y
ear
0
10
20
30
40
50
60
70
80
Co
st,
US
ce
nts
/kW
h
Fossil LCL CO2 $50, US/kW-yr1.5 MW Wind US$/kW-yr1.5 MW Wind w/Backup US$/kW-yrFossil LCL CO2 0, US/kW-yrSolar Trough 6 hr StorageCommercial PV 500 kW20 MW GeothermalBiomassSmall HydroFossil LCL CO2 $50, US cents/kWhFossil LCL CO2 0, US cents/kWh
Figure 11-20 CO2 Cost Impact on Islands with Coal on Fossil LCL
Figure 11-20 illustrates the impact of the CO2 cost of US$50/tonne on the Fossil LCL on those islands. The scale in $/kW-yr for the solid lines is on the left, the scale in cents/kWh for the dotted lines is on the right. The Fossil LCLs with and without the CO2 cost are both included. The same technologies appear on the lines: GT on distillate at zero % capacity factor, MSD on distillate, and CFB using coal.

Caribbean Regional Electricity Generation, Interconnection, and Fuels Supply Strategy – Final Report 11-24
The GT is least cost only at zero % capacity factor for both Fossil LCL. With no CO2 cost the MSD is least cost from 5% to 50% capacity factor and the CFB on coal is least cost from 55% through 90% capacity factor. The net savings of the CFB – its cost subtracted from the cost of the MSD – is noticeable over the higher capacity factors. When the CO2 cost is included, the CFB using coal is least cost only at 85% and 90% capacity factors, with the net savings virtually zero. At the 80% capacity factor point the CO2 cost adds 26% to the total cost of power, consistent with the increase in coal cost of 36%.
As was the case for the distillate-only islands, the renewable energy resources that were below the Fossil LCL before are now somewhat more economic, and PV and the Solar Trough with storage edge closer to being competitive. The difference is more pronounced at higher capacity factors, with CO2 cost increasing the total cost of power by 26% at the 80% capacity factor point in the coal case compared to 14% in the distillate-only case.
11.3.3 Gas on the Fossil LCL
Both the above cases involve islands with low demand and high costs. When gas from the gas pipeline is available, Fossil LCL values are noticeably lower. Figure 11-21 illustrates the impact of the CO2 cost of US$50/tonne on the Fossil LCL for Barbados, the island with the lowest Fossil LCL. The scale in $/kW-yr for the solid lines is on the left, the scale in cents/kWh for the dotted lines is on the right. The Fossil LCLs with and without the CO2 cost are both included. The same technologies appear on the lines: GT on pipeline gas at zero % and 5% capacity factors and MSD on pipeline gas for capacity factors of 10% and above.
Note that the scales on Figure 11-21 are different than those on other similar figures. This was done to separate the lines to make them more visible.
As was the case for the distillate-only and coal cases, the renewable energy resources that were below the Fossil LCL before are now somewhat more economic, and PV and the Solar Trough with storage edge closer to being competitive. However, in this case the renewable energy technologies have much less benefit compared to the Fossil LCLs, and wind with storage is marginally competitive, especially when the CO2 cost is not applied.
The difference between the two LCLs is more pronounced at higher capacity factors, with CO2 cost increasing the total cost of power by 27%, consistent with the increase in gas cost of 34%.

Caribbean Regional Electricity Generation, Interconnection, and Fuels Supply Strategy – Final Report 11-25
0
500
1,000
1,500
2,000
0% 10% 20% 30% 40% 50% 60% 70% 80% 90%
Capacity Factor, %
An
nu
al C
os
t, $
/kW
-yea
r
0
10
20
30
40
50
60
Co
st,
US
ce
nts
/kW
h
Fossil LCL CO2 $50, US/kW-yr1.5 MW Wind Turbine1.5 MW Wind w/BackupFossil LCL CO2 $0, US/kW-yrSolar Trough 6 hr StorageCommercial PV 500 kWBiomass20 MW GeothermalSmall HydroFossil LCL CO2 $50, US cents/kWhFossil LCL CO2 $0, US cents/kWh
Figure 11-21 CO2 Cost Impact on Islands with Gas on Fossil LCL
11.3.4 Lowest Price non-Gas Fuels
The Dominican Republic is the only main Study country that currently uses either coal or LNG, and it uses both. It has by far the highest demand of any Study country, which gives it the lowest cost fuels apart from pipeline gas.
Figure 11-22 illustrates the impact of the CO2 cost of US$50/tonne on the Fossil LCL for DR. The scale in $/kW-yr for the solid lines is on the left, the scale in cents/kWh for the dotted lines is on the right. The Fossil LCLs with and without the CO2 cost are both included. Before the CO2 cost is added, the Fossil LCL comprises the 50 MW GT on LNG for capacity factors of zero through 20%, the 300 MW CC on LNG for capacity factors from 25% through 40%, and the conventional coal plant for capacity factors from 45% through 90%. After applying the CO2 cost, the Fossil LCL comprises the 50 MW GT on LNG for capacity factors from zero through 15% and the 300 MW CC for capacity factors from 20% through 90%. The conventional coal plant does not enter the Fossil LCL.
Note that the scales on Figure 11-22 are different than those on other similar figures. This was done to separate the lines to make them more visible.

Caribbean Regional Electricity Generation, Interconnection, and Fuels Supply Strategy – Final Report 11-26
As was the case for the gas case, the renewable energy resources that were below the Fossil LCL before are now somewhat more economic, and PV and the Solar Trough with storage edge closer to being competitive. The renewable energy technologies have much less benefit compared to the Fossil LCLs, and wind with storage is marginally competitive, especially when the CO2 cost is not applied.
The difference between the two LCLs is more pronounced at higher capacity factors, with CO2 cost increasing the total cost of power by 47%, consistent with the increase in coal cost of 105%. The increase in coal cost put LNG-derived gas on the Fossil LCL at high capacity factors, losing the advantage that coal offered before.
0
500
1,000
1,500
2,000
0% 10% 20% 30% 40% 50% 60% 70% 80% 90%
Capacity Factor, %
An
nu
al C
os
t, $
/kW
-yea
r
0
10
20
30
40
50
60
Co
st,
US
ce
nts
/kW
h
Fossil LCL CO2 $50, US$/kW-yr1.5 MW Wind US$/kW-yr1.5 MW Wind w/Backup US$/kW-yrSmall Hydro US$/kW-yrCommercial PV 500 kWBiomass20 MW GeothermalSolar Trough 6 hr StorageFossil LCL CO2 0, US$/kW-yrFossil LCL CO2 $50, US cents/kWhFossil LCL CO2 0, US cents/kWh
Figure 11-22 CO2 Cost Impact on Country with Lowest Non-gas Fuel Prices
11.3.5 Summary
The results are consistent with what one would expect. Costs increase and plants with the largest increase in cost due to CO2 costs dispatch less or leave the Fossil LCL. Renewable energy technologies become relatively more attractive. However, most of the renewable technologies are highly attractive to begin with for islands with high cost Fossil LCLs. For the cases with lower Fossil LCLs the advantages of renewable energy options was much less. In these circumstances a CO2 cost might encourage greater development.

Caribbean Regional Electricity Generation, Interconnection, and Fuels Supply Strategy – Final Report 12-1
Section 12 Scenarios
The Study scenarios are based on the analysis of the generation and fuel supply options and also based on the results of the screening analysis. The goal of the preliminary fuel and screening analysis was to define and screen a number of options, so that scenario analysis could include development only of options that passed the earlier tests.
The full system analysis included a Base Case Scenario and three Scenarios with changed parameters designed to evaluate the impact of specific types of changes. The three Scenarios are: Fuel Scenario, Interconnection/Renewable Scenario, and Integrated Scenario. The Scenarios were designed to address the range of potential development options, resulting in a well defined and limited number of analysis runs.
12.1 BASE CASE SCENARIO
In developing the Base Case Scenario we used, where available, country development plans and related data. We had to identify and resolve data gaps and in many cases develop or extend development plans to cover the entire planning period, resolve any inconsistencies, and in general create complete plans.
The Base Case Scenario assumption, for most countries, was that the generation development will continue to be based on the exiting fuel and generation technology options (i.e., business as usual scenario). For most countries this implies continued development of diesel units using distillate fuel. Exceptions were the larger power systems in Dominican Republic and Jamaica with the existing, or planned, coal and LNG fuel options. For the Dominican Republic we used LNG and for Jamaica we used imported coal as the Base Case fuel options.
Several countries have generating units that are already under construction, or far enough along in development, to be considered committed from the planning perspective. Those units were added to the generation plans in the same year in all scenarios, so their assumed additions do not impact scenario results.
Also the Base Case Scenario did not assume additional fuel options, renewable generation, or any interconnections. This was done on purpose to assure that we can account for all benefits of those options when developing subsequent scenarios.
The size of assumed power plant additions was based on the technology, fuel options, and the size of the system for all scenarios.
Individual country development costs were then merged to develop Base Case costs for the entire region. These Base Case costs were used as the staring point for comparison with other Scenarios.

Caribbean Regional Electricity Generation, Interconnection, and Fuels Supply Strategy – Final Report 12-2
12.2 FUEL SCENARIO
The Fuel Scenario assumption, for many countries, was that the generation development could be based on an alternate, and potentially less expensive, fuel and generation technology options. Fuels were selected based on the fuel analysis results, and country by country this scenario assumes:
Imported coal for Antigua and Barbuda, Grenada, and St. Vincent and Grenadines.
Natural gas via pipeline for Barbados and St. Lucia
Imported coal for Dominican Republic
LNG for Jamaica
No alternative fuel option was considered for Dominica and St. Kitts and Nevis because preliminary analysis showed that no option offering potentially lower costs was available. The relatively small demand on all these islands means that fixed costs associated with other fuel transportation modes are spread over fewer GJ than on other islands and make the other options more costly than distillate. The Interconnection/Renewable Scenario and Integrated Scenario include geothermal development as the preferred alternative to distillate.
The Fuel Scenario did not assume additional renewable generation or interconnections. This was done on purpose to assure that this scenario accounts only for the costs and benefits associated with selected fuel options.
Individual country development costs were then merged to develop summary Fuel Scenario costs for the entire region, later used for comparison with other Scenarios.
12.3 INTERCONNECTION/RENEWABLE SCENARIO
The Interconnection/Renewable Scenario was developed to analyze the effects of potential renewable and interconnection development options. We combined interconnections and renewable energy development because most of the interconnections involved generating geothermal power in one country and exporting the power to other countries. Based on the screening analysis, the economically attractive renewable generation options included geothermal and wind generation. Country by country this scenario assumes:
Wind development for Antigua and Barbuda, Barbados, Dominican Republic Grenada, Haiti, Jamaica, St. Lucia and St. Vincent and Grenadines.
Geothermal development and cable interconnections for Dominica (with Martinique and Guadeloupe) and for Nevis (with St. Kitts and Puerto Rico)
Transmission interconnection for Dominican Republic with Haiti
Wind generation development was limited to around 15% of the system peak load. This amount was considered adequate to show the potential cost impact. Of course, future development of wind on each island will depend on the availability of good sites for wind generation.

Caribbean Regional Electricity Generation, Interconnection, and Fuels Supply Strategy – Final Report 12-3
The Dominican Republic – Haiti transmission interconnection was the only interconnection case for which the scenario did not include geothermal power development. The scenario analysis had to be done independently using two cases (i.e., two steps). The first step was to analyze the merit of transmission interconnection without renewable generation. The second step was to analyze the addition of renewable generation without the transmission interconnection. All other systems had either a renewable option or a dependent geothermal/interconnection option that could be analyzed with one scenario.
This scenario uses the same fossil fuel options as in the Base Case. This was done so that the scenario results (i.e., differences from the Base Case) account only for the costs and benefits associated with interconnections and renewable generation options.
Individual country development costs were then merged to develop an Interconnection/Renewable Scenario costs for the entire region (including accounting for interconnection costs and energy export benefits), later used for comparison with other Scenarios.
12.4 INTEGRATED SCENARIO
The Integrated Scenario was designed to include beneficial options from all earlier Scenarios (i.e., options showing cost savings) and evaluate the impact of integrated (i.e., combined) development of several options. This Scenario included all development options which showed cost savings from earlier, specialized, Scenario analysis. Analysis of the combined impact is an important step, since it shows the interdependences of development options. An example is the development of a renewable option, which could show significant benefits when replacing high cost distillate generation in the Interconnection/Renewable Scenario, but could have much smaller or no benefits if, in the Integrated Scenario, development also includes lower cost gas via pipeline as the fossil fuel. As for the other Scenarios, individual country development costs were then merged to develop Integrated Scenario costs for the entire region (including accounting for interconnection costs and energy export benefits), later used for comparison with other scenarios and to develop final study conclusions and recommendations.

Caribbean Regional Electricity Generation, Interconnection, and Fuels Supply Strategy – Final Report 13-1
Section 13 Scenario Analysis Results
This section contains summary results of system analysis for the four Scenarios described in Section 12. For each Scenario, the summary results include:
For the Base Case Scenario and the Fuel Scenario, total system production cost and investment cost results
For the Interconnection / Renewable Scenario and the Integrated Scenario, total system production, investment cost, and interconnection cost
For those who are interested in more details, please refer to Attachment A, which provides system analysis results for all four Scenarios by country. For each Scenario, for each country (or island) results are presented in three tables: capacity balance, energy balance, and cost summary tables.
The capacity balance table for each country includes:
Peak Load in MW based on the country load forecast by year
Exports(+)/Imports(-) in MW
Net Capacity in MW for all existing units (capacity decreases if there is assumed unit retirement during the planning period)
Total capacity in MW for existing units
Required Capacity in MW calculated as peak demand increased by the reserve margin requirements (reserve margin requirement applies only to the local demand)
Existing System Surplus(+)/Deficit(-) in MW shows required unit additions (i.e., existing units minus required capacity)
New Capacity in MW shows capacity for each unit assumed to be built during the planning period
Total Capacity in MW shows capacity for all existing and new units
System Surplus(+)/Deficit(-) with Unit Additions in MW shows the overall system capacity surplus (+) or deficit (-) after unit additions
Reserve Margin in % shows the calculated percent of capacity above the peak load.
The energy balance table includes:
Energy in GWh based on the country load forecast by year
Exports(+)/Imports(-) in GWh
Generation in GWh by unit
Total Generation in GWh shows total generation for all existing and new units matching the required energy

Caribbean Regional Electricity Generation, Interconnection, and Fuels Supply Strategy – Final Report 13-2
The cost summary table includes:
Fuel and O&M costs in million US$ by unit including fuel and variable and fixed O&M costs
Production Costs in million US$ shows total system production costs (i.e., fuel and O&M costs)
Investment Costs in million US$ shows total cost for building new generation units
Total System Costs shows a sum of production and investment costs
13.1 BASE CASE SCENARIO SUMMARY
The individual country subsections below summarize the main resource additions for each of them for the Base Case Scenario.
13.1.1 Antigua and Barbuda
For all four Scenarios, assumed committed system additions are six 5 MW Casada Gardens units during 2011-2013. Those unit additions would satisfy reserve margin requirements until 2019.
During 2020-2028 the system will require additional generation units. For the Base Case Scenario, new unit additions are assumed to be 10 MW medium speed diesel units using distillate oil. By 2028 the system will need another 30 MW (3 x 10 MW units) to meet the required capacity.
13.1.2 Barbados
For all four Scenarios, assumed committed system additions are nine 16 MW Trent units. The first six units were added during 2011-2013 while the next three units were added when required to match the load growth. All Trent unit additions would satisfy reserve margin requirements until 2025.
During 2026-2028 the Barbados system will require new capacity additions. For the Base Case Scenario, new additions are assumed to be 20 MW low speed diesel units using distillate oil. By 2028 the system will need another 40 MW (2 x 20 MW units) to meet the required capacity.
13.1.3 Dominica
Starting in 2012 Dominica will require new capacity additions. For the Base Case Scenario, new additions are assumed to be 5 MW medium speed diesel units using distillate oil. By 2028 the system will need another 15 MW (3 x 5 MW units) to meet the required capacity.
13.1.4 Dominican Republic
During the first years, during 2009-2011, installation of the assumed already committed hydro and wind resources will cover the load growth. Starting in 2012 the Dominican Republic will require new capacity additions. For the Base Case Scenario, new additions are assumed to be 300

Caribbean Regional Electricity Generation, Interconnection, and Fuels Supply Strategy – Final Report 13-3
MW combined cycle units using LNG with a few additions of 50 MW GT units to cover peaking generation. Results of the analysis show that by 2028 the system will need another 2,400 MW (8 x 300 MW CC units) and 100 MW of GT units.
13.1.5 Grenada
Grenada will require new capacity addition starting in 2013. For the Base Case Scenario, new additions are assumed to be 10 MW medium speed diesel units using distillate oil. By 2028 the system will need another 70 MW (7 x 10 MW units) to cover projected load growth.
13.1.6 Haiti
Haiti’s power system is already short of generation resources in 2009. We calculated that the already committed resources and additional 80 MW of low speed diesel units (4 x 20 MW) will need to be built during 2009 just to meet the existing demand. Starting in 2010 the system will need another 20 MW, or in some years 40 MW, in new units each year to cover projected load growth. By 2028 the system will need to install a total of 540 MW of diesel units.
13.1.7 Jamaica
During the next four years, until 2014, we assumed that the planned resources, including the Kingston, Hunts Bay, Windalco, Jamalco, and Wigton units, will be built to cover the load growth. If those resources are built, Jamaica will require new capacity additions starting in 2015. For the Base Case Scenario, new additions are assumed to be 100 MW conventional coal units using imported coal. Results of the analysis show that by 2028 the system will need another 1,100 MW (11 x 100 MW units) to cover projected load growth.
13.1.8 St. Kitts and Nevis
Starting in 2012 St. Kitts will require new capacity additions. For the Base Case Scenario, new additions are assumed to be 5 MW medium speed diesel units using distillate oil. By 2028 the system will need another 35 MW (7 x 5 MW units) to cover projected load growth.
Starting in 2011 Nevis will require new capacity additions. For the Base Case Scenario, new additions are assumed to be 5 MW medium speed diesel units using distillate oil. By 2028 the system will need another 25 MW (5 x 5 MW units) to cover projected load growth.
13.1.9 St. Lucia
Starting in 2010 St. Lucia will require new capacity additions. For the Base Case Scenario, new additions are assumed to be 20 MW low speed diesel units using distillate oil. By 2028 the system will need another 80 MW (4 x 20 MW units) to meet the required capacity.
13.1.10 St. Vincent and Grenadines
St. Vincent and Grenadines will require new capacity additions starting in 2017. For the Base Case Scenario, new additions are assumed to be 10 MW medium speed diesel units using

Caribbean Regional Electricity Generation, Interconnection, and Fuels Supply Strategy – Final Report 13-4
distillate oil. By 2028 the system will need another 70 MW (7 x 10 MW units) to cover projected load growth.
13.1.11 Total System Costs
Tables 13-1 and 13-2 present total system production and investment cost (in 2009 US$) results. The Production Cost Summary table also includes a row for fuel savings associated with energy exports outside the modeled region. The costs for supplying those exports are included in the production and investment costs of the exporting country. The Investment Cost Summary table also includes the salvage value for all investments at the end of the planning period. The Base Case assumes no interconnection among islands and thus shows no fuel savings associated for energy exports or interconnection costs.

Caribbean Regional Electricity Generation, Interconnection, and Fuels Supply Strategy – Final Report 13-5
Table 13-1 Base Case Production Cost Summary (Million 2009 US$)
Year 2009 2010 2011 2012 2013 2014 2015 2016 2017 2018 2019 2020 2021 2022 2023 2024 2025 2026 2027 2028
Antigua and Barbuda 48 49 52 74 76 81 86 90 92 95 99 102 106 110 112 117 122 126 131 138
Barbados 163 188 202 223 234 252 268 279 289 299 311 319 331 343 350 364 379 392 407 429
Dominica 13 13 15 15 16 17 19 19 20 21 21 21 22 23 23 24 25 26 27 28
Dominican Republic 1,149 1,458 1,588 1,637 1,729 1,834 1,827 1,907 1,983 1,972 2,061 2,034 2,092 2,176 2,175 2,304 2,361 2,424 2,561 2,647
Grenada 32 35 39 45 47 52 56 58 61 65 68 72 76 80 84 88 94 99 106 114
Haiti 82 94 111 133 151 175 199 222 245 272 301 333 352 374 391 416 442 469 499 535
Jamaica 547 791 888 912 983 987 987 971 1,015 999 1,046 1,020 1,018 991 1,029 960 1,005 942 985 1,003
St. Kitts 23 25 27 30 32 34 37 38 39 40 42 43 45 46 47 49 51 53 56 58
Nevis 9 11 12 15 16 17 19 20 20 21 22 23 24 25 26 27 29 30 32 34
St. Lucia 51 53 58 65 69 74 79 81 84 87 90 93 96 100 103 107 111 116 121 127
St. Vincent and Grenadines 22 25 28 32 35 39 43 47 50 53 57 61 66 71 76 82 89 96 104 113
Fuel Savings (exports) 0 0 0 0 0 0 0 0 0 0 0 0 0 0 0 0 0 0 0 0
Total 2,139 2,740 3,020 3,182 3,389 3,564 3,620 3,732 3,900 3,924 4,118 4,122 4,228 4,338 4,416 4,539 4,708 4,772 5,027 5,226
Table 13-2 Base Case Investment Cost Summary (Million 2009 US$)
Year 2009 2010 2011 2012 2013 2014 2015 2016 2017 2018 2019 2020 2021 2022 2023 2024 2025 2026 2027 2028 Salvage Value
Antigua and Barbuda 0 0 5 5 5 0 0 0 0 0 0 5 0 0 5 0 0 5 0 0 13
Barbados 0 0 14 14 7 0 0 0 0 0 0 7 0 7 7 7 0 10 10 0 45
Dominica 0 0 0 2 0 0 0 0 0 0 0 2 0 0 0 0 0 2 0 0 4
Dominican Republic 0 385 113 428 0 0 285 0 23 285 0 285 0 23 285 0 285 285 0 285 2,040
Grenada 0 0 0 0 5 0 0 5 0 0 5 0 0 5 0 5 0 5 0 5 21
Haiti 38 10 10 10 10 0 10 10 10 10 19 10 10 10 19 10 19 10 19 19 139
Jamaica 0 97 8 272 0 132 220 220 0 220 0 220 220 220 0 440 0 440 0 220 2,160
St. Kitts 0 0 0 2 0 0 2 0 0 2 0 2 0 2 0 0 2 0 2 0 9
Nevis 0 0 2 0 0 0 0 0 2 0 0 0 2 0 0 2 0 0 2 0 7
St. Lucia 0 10 0 0 0 0 0 10 0 0 0 0 10 0 0 0 10 0 0 0 19
St. Vincent and Grenadines 0 0 0 0 0 0 0 0 5 0 5 0 5 0 5 0 5 5 5 0 23
Interconnection Costs 0 0 0 0 0 0 0 0 0 0 0 0 0 0 0 0 0 0 0 0 0
Total 38 501 151 732 26 132 517 244 39 517 28 531 246 266 320 464 321 760 38 529 4,480

Caribbean Regional Electricity Generation, Interconnection, and Fuels Supply Strategy – Final Report 13-6
13.2 FUEL SCENARIO
The individual country subsections below summarize the main resource additions for each of them for the Fuel Scenario.
13.2.1 Antigua and Barbuda
For all four Scenarios, assumed committed system additions are six 5 MW Casada Gardens units during 2011-2013. Those unit additions would satisfy reserve margin requirements until 2019.
During 2020-2028 the system will require additional generation units. For the Fuel Scenario, new unit additions are assumed to be 10 MW CFB units using imported coal. By 2028 the system will need another 30 MW (3 x 10 MW units) to meet the required capacity.
13.2.2 Barbados
For the Fuel Scenario, assumed system additions are the same as for the Base Case Scenario. The difference is that in this scenario most existing and all new units will be using natural gas as a fuel. Natural gas will be supplied through the gas pipeline.
13.2.3 Dominica
Dominica does not have a potentially less expensive fossil fuel option, only a renewable option which will be analyzed in another Scenario. The same results as in the Base Case Scenario apply for Dominica in the Fuel Scenario.
13.2.4 Dominican Republic
During the first years, as in the Base Case Scenario, we assumed buildup of the already committed hydro and wind resources. Starting in 2012 Dominican Republic will require additional generating units. For the Fuel Scenario, new additions are assumed to be coal based units. The first additions are planned (Montecristi and Haltillo-Azua) units, followed by generic 300 MW conventional coal units using imported coal. This Scenario again includes additions of 50 MW GT units to supply peaking generation. Results of the analysis show that by 2028 the system will need another 2,400 MW (8 x 300 MW coal units) and 100 MW of GT units.
13.2.5 Grenada
For the Fuel Scenario, new unit additions are assumed to be 10 MW CFB units using imported coal. By 2028 the system will need an additional 70 MW (7 x 10 MW units) to cover projected load growth.
13.2.6 Haiti
For the Fuel Scenario, assumed system additions are the same as for the Base Case Scenario. The difference is that in this scenario all new units will be using natural gas as a fuel. The assumption is that natural gas will be supplied starting in 2014 from a new LNG terminal.

Caribbean Regional Electricity Generation, Interconnection, and Fuels Supply Strategy – Final Report 13-7
13.2.7 Jamaica
Until 2014 we assumed the same buildup of already planned resources as in the Base Case Scenario. For the Fuel Scenario, starting in 2015 new additions are assumed to be 100 MW combined cycle units using natural gas supplied from two new LNG terminals. Natural gas will become available during 2014 and by 2014 about 450 MW in existing units are also assumed to be converted to use natural gas. Results of the analysis show that by 2028 the system will need another 1,100 MW (11 x 100 MW units) to cover projected load growth.
13.2.8 St. Kitts and Nevis
St. Kitts and Nevis does not have an alternative, potentially less expensive, fossil fuel option, only a renewable option which will be analyzed in another scenario. The same results as in the Base Case Scenario apply for St. Kitts and Nevis in the Fuel Scenario and are not duplicated here.
13.2.9 St. Lucia
For the Fuel Scenario, assumed system additions are the same as for the Base Case Scenario. The difference is that in this scenario most existing and all new units will be using natural gas as a fuel. Natural gas will be supplied through the gas pipeline.
13.2.10 St. Vincent and Grenadines
St. Vincent and Grenadines will again require new capacity addition starting in 2017. For the Fuel Scenario, new unit additions are assumed to be 10 MW CFB units using imported coal. By 2028 the system will need another 70 MW (7 x 10 MW units) to cover projected load growth.
13.2.11 Total System Costs
Tables 13-3 and 13-4 present total system production and investment cost for the Fuel Scenario. The Fuel Scenario assumes no transmission interconnection among islands and thus shows no fuel savings associated for energy exports or interconnection costs. The Investment Cost Summary table also includes the salvage value for all investments at the end of the planning period. The Fuel Scenario assumes no interconnection among islands and thus shows no fuel savings associated for energy exports or interconnection costs.

Caribbean Regional Electricity Generation, Interconnection, and Fuels Supply Strategy – Final Report 13-8
Table 13-3 Fuel Scenario Production Cost Summary (Million 2009 US$)
Year 2009 2010 2011 2012 2013 2014 2015 2016 2017 2018 2019 2020 2021 2022 2023 2024 2025 2026 2027 2028
Antigua and Barbuda 48 49 52 74 76 81 86 90 92 95 99 98 101 104 102 106 109 111 115 119
Barbados 163 188 202 223 234 102 106 110 114 119 124 124 124 128 131 138 146 152 159 166
Dominica 13 13 15 15 16 17 19 19 20 21 21 21 22 23 23 24 25 26 27 28
Dominican Republic 1,149 1,458 1,588 1,587 1,683 1,791 1,717 1,794 1,867 1,803 1,875 1,807 1,876 1,956 1,923 2,008 1,990 1,983 2,064 2,065
Grenada 32 35 39 45 35 51 54 54 56 59 58 60 62 63 65 65 67 68 70 78
Haiti 82 94 111 133 151 140 151 174 188 203 219 234 240 248 255 269 281 296 311 326
Jamaica 547 791 888 912 983 845 868 877 911 923 964 969 980 964 1,000 973 1,029 998 1,057 1,109
St. Kitts 23 25 27 30 32 34 37 38 39 40 42 43 45 46 47 49 51 53 56 58
Nevis 9 11 12 15 16 17 19 20 20 21 22 23 24 25 26 27 29 30 32 34
St. Lucia 51 53 58 65 69 39 40 42 43 44 46 46 47 48 50 52 55 57 60 62
St. Vincent and Grenadines 22 25 28 32 35 39 43 47 48 51 52 55 56 60 61 65 66 69 71 79
Fuel Savings (exports) 0 0 0 0 0 0 0 0 0 0 0 0 0 0 0 0 0 0 0 0
Total 2,139 2,740 3,020 3,132 3,332 3,159 3,139 3,264 3,398 3,379 3,521 3,481 3,578 3,666 3,684 3,776 3,849 3,843 4,019 4,125
Table 13-4 Fuel Scenario Investment Cost Summary (Million 2009 US$)
Year 2009 2010 2011 2012 2013 2014 2015 2016 2017 2018 2019 2020 2021 2022 2023 2024 2025 2026 2027 2028 Salvage Value
Antigua and Barbuda 0 0 5 5 5 0 0 0 0 0 0 26 0 0 26 0 0 26 0 0 66
Barbados 0 0 14 14 7 0 0 0 0 0 0 7 0 7 7 7 0 10 10 0 45
Dominica 0 0 0 2 0 0 0 0 0 0 0 2 0 0 0 0 0 2 0 0 4
Dominican Republic 0 385 113 753 0 0 610 0 23 610 0 610 0 23 600 0 600 600 0 600 3,986
Grenada 0 0 0 0 26 0 0 26 0 0 26 0 0 26 0 26 0 26 0 26 138
Haiti 38 10 10 10 10 0 10 10 10 10 19 10 10 10 19 10 19 10 19 19 139
Jamaica 0 97 8 272 0 132 105 105 0 105 0 105 105 105 0 210 0 210 0 105 1,156
St. Kitts 0 0 0 2 0 0 2 0 0 2 0 2 0 2 0 0 2 0 2 0 9
Nevis 0 0 2 0 0 0 0 0 2 0 0 0 2 0 0 2 0 0 2 0 7
St. Lucia 0 10 0 0 0 0 0 10 0 0 0 0 10 0 0 0 10 0 0 0 19
St. Vincent and Grenadines 0 0 0 0 0 0 0 0 26 0 26 0 26 0 26 0 26 26 26 0 146
Interconnection Costs 0 0 0 0 0 0 0 0 0 0 0 0 0 0 0 0 0 0 0 0 0
Total 38 501 151 1,057 47 132 727 150 60 727 70 762 152 172 677 255 657 908 59 750 5,715
Caribbean Regional Electricity Generation, Interconnection, and Fuels Supply Strategy – Final Report 13-9
13.3 INTERCONNECTION/RENEWABLE SCENARIO
The individual country subsections below summarize the main resource additions for each of them for the Interconnection/Renewable Scenario.
13.3.1 Antigua and Barbuda
Most assumed new generation units are the same as in the Base Case Scenario. The difference is that this Scenario includes the addition of 14 MW of new wind units.
13.3.2 Barbados
For the Interconnection/Renewable Scenario, most assumed system additions are the same as for the Base Case Scenario. The difference in this Scenario is the addition of 45 MW of new wind units.
13.3.3 Dominica
The Interconnection/Renewable Scenario assumes the addition of a 20 MW geothermal unit in 2012 to satisfy local needs, and the addition of two 92.5 MW units in 2014 for exports to Martinique and Guadeloupe. The energy balance table shows corresponding exports of 1,296 GWh starting in 2014.
13.3.4 Dominican Republic
Preliminary analysis had indicated that the impacts of interconnection with Haiti and renewable energy generation should be studied separately. We determined that interconnection with Haiti is not economic, but adding renewable energy is economic. Therefore results for the Dominican Republic assume no interconnection, but do assume the addition of renewable energy resources. Most assumed generation is the same as in the Base Case Scenario, but the “Renewable Scenario” includes the addition of 540 MW of new wind units (30 MW each year starting in 2011).
13.3.5 Grenada
For the Interconnection/Renewable Scenario, most assumed new generation units are the same as in the Base Case. The difference in this scenario is the addition of 12 MW of new wind units.
13.3.6 Haiti
Preliminary analysis had indicated that the impacts of interconnection with the Dominican Republic and renewable energy generation should be studied separately. We determined that interconnection with the Dominican Republic is not economic, but adding renewable energy is economic. Therefore results for Haiti assume no interconnection, but do assume the addition of renewable energy resources. Most assumed generation is the same as in the Base Case Scenario, but the “Renewable Scenario” includes the addition of 81 MW of new wind generation.

Caribbean Regional Electricity Generation, Interconnection, and Fuels Supply Strategy – Final Report 13-10
13.3.7 Jamaica
For this Scenario, most assumed system unit additions are the same as for the Base Case Scenario. The difference is the assumed addition of 219 MW of wind generation by 2028, with the yearly schedule presented in Table 13-86.
13.3.8 St. Kitts and Nevis
This scenario assumes that Nevis will be interconnected with St. Kitts by 2011 and the two 20 MW geothermal units at Nevis will supply 30 MW for St. Kitts and 10 MW for Nevis. No new generation units will be built on St. Kitts. Additionally, this scenario assumes two 200 MW geothermal units will be built at Nevis in 2014 to supply Puerto Rico. A submarine cable connecting Nevis and Puerto Rico is also assumed to be completed by 2014.
13.3.9 St. Lucia
For the Interconnection/Renewable Scenario, most assumed system additions are the same as for the Base Case Scenario. The difference is the assumed addition of 18 MW by 2028 of wind generation.
13.3.10 St. Vincent and Grenadines
For the Interconnection/Renewable Scenario, most assumed system additions are the same as for the Base Case Scenario. The difference is the assumed addition of 14 MW by 2028 of wind generation with the yearly schedule presented in Table 13-98.
13.3.11 Total System Costs
Tables 13-5 to 13-7 present total system production, investment and interconnection cost for the Interconnection/Renewable Scenario. The Production Cost Summary table shows fuel savings associated for energy exports to Martinique, Guadeloupe, and Puerto Rico. The Investment Cost Summary and Interconnection Cost Summary tables show yearly costs associated with building assumed interconnections.
“Renewable Scenario” production and investment cost results are those presented for the Dominican Republic and Haiti, and no interconnection is assumed. The interconnection costs shown for the Dominican Republic – Haiti interconnection are those used in the preliminary analysis that determined that an interconnection was not economic.

Caribbean Regional Electricity Generation, Interconnection, and Fuels Supply Strategy – Final Report 13-11
Table 13-5 Interconnection/Renewable Scenario Production Cost Summary (Million 2009 US$)
Year 2009 2010 2011 2012 2013 2014 2015 2016 2017 2018 2019 2020 2021 2022 2023 2024 2025 2026 2027 2028
Antigua and Barbuda 48 49 52 72 73 77 82 85 88 91 94 97 100 104 106 111 115 120 124 131
Barbados 163 188 202 223 234 251 265 274 282 291 301 307 318 327 333 345 359 370 383 402
Dominica 13 13 15 3 4 25 26 26 27 28 28 29 30 31 31 32 33 34 35 36
Dominican Republic 1,149 1,458 1,578 1,616 1,697 1,790 1,776 1,845 1,820 1,893 1,894 1,941 1,921 1,993 2,059 2,113 2,227 2,283 2,356 2,485
Grenada 32 35 39 43 45 49 53 55 58 61 64 67 71 75 78 83 89 93 100 107
Haiti 82 94 109 129 145 166 188 209 230 254 282 312 329 347 363 385 409 433 460 494
Jamaica 547 791 880 900 963 963 959 939 979 960 1,002 975 971 944 978 912 953 893 933 950
St. Kitts 23 25 17 19 21 22 24 25 26 2 4 5 6 7 8 10 11 13 15 16
Nevis 9 11 3 5 5 41 42 42 43 46 47 48 49 50 50 52 53 54 55 57
St. Lucia 51 53 58 65 68 72 76 78 80 83 85 87 90 93 96 100 104 107 112 118
St. Vincent and Grenadines 22 25 27 32 34 38 41 44 47 50 54 58 62 67 71 77 83 90 97 106
Fuel Savings (exports) 0 0 0 0 0 -725 -748 -755 -758 -757 -763 -761 -768 -775 -774 -782 -790 -797 -809 -824
Total 2,139 2,740 2,980 3,107 3,290 2,770 2,784 2,869 2,923 3,002 3,091 3,164 3,177 3,262 3,402 3,438 3,645 3,693 3,861 4,078
Table 13-6 Interconnection/Renewable Scenario Investment Cost Summary (Million 2009 US$)
Year 2009 2010 2011 2012 2013 2014 2015 2016 2017 2018 2019 2020 2021 2022 2023 2024 2025 2026 2027 2028Salvage Value
Antigua and Barbuda 0 0 5 8 8 4 0 0 0 0 2 5 0 0 6 0 0 5 2 0 23
Barbados 0 0 14 14 7 4 4 4 4 4 4 11 4 11 11 11 4 13 13 4 88
Dominica 0 0 0 56 0 643 0 0 0 0 0 0 0 0 0 0 0 0 0 0 369
Dominican Republic 0 385 150 465 38 38 323 38 345 38 323 38 323 60 38 323 38 323 323 38 2,467
Grenada 0 0 0 4 6 0 2 5 0 2 5 2 0 5 2 5 0 6 0 5 30
Haiti 38 10 15 15 15 6 15 15 15 15 25 15 15 15 25 15 25 15 25 25 211
Jamaica 0 97 26 287 15 147 235 235 15 235 15 235 235 235 15 455 15 455 15 235 2,356
St. Kitts 0 0 0 0 0 0 0 0 0 0 0 0 0 0 0 0 0 0 2 0 2
Nevis 0 0 56 0 0 1,042 0 0 0 56 0 0 2 0 0 2 0 0 2 0 623
St. Lucia 0 10 0 2 2 2 2 11 2 0 2 2 10 2 0 2 10 2 0 2 35
St. Vincent and Grenadines 0 0 2 0 2 0 2 0 6 0 6 0 6 0 6 0 6 5 6 0 35
Interconnection Costs 0 0 18 2 2 1,105 28 28 28 28 28 28 28 28 28 28 28 28 28 28 559
Total 38 501 287 853 95 2,989 610 336 415 378 409 335 623 356 131 840 125 851 417 336 6,797

Caribbean Regional Electricity Generation, Interconnection, and Fuels Supply Strategy – Final Report 13-12
Table 13-7 Interconnection/Renewable Scenario Interconnection Cost Summary (Million 2009 US$)
Year 2009 2010 2011 2012 2013 2014 2015 2016 2017 2018 2019 2020 2021 2022 2023 2024 2025 2026 2027 2028Salvage Value
Dominica - Martinique & Dominica - Guadeloupe 119 4 4 4 4 4 4 4 4 4 4 4 4 4 4 59
Dominican Republic - Haiti 250 5 5 5 5 5 5 5 5 5 5 5 5 5 5 125
Nevis - Puerto Rico 734 17 17 17 17 17 17 17 17 17 17 17 17 17 17 367
Nevis - St. Kitts 18 2 2 2 2 2 2 2 2 2 2 2 2 2 2 2 2 2 7
Total 0 0 18 2 2 1,105 28 28 28 28 28 28 28 28 28 28 28 28 28 28 559

Caribbean Regional Electricity Generation, Interconnection, and Fuels Supply Strategy – Final Report 13-13
13.4 INTEGRATED SCENARIO
The individual country subsections below summarize the main resource additions for each of them for the Integrated Scenario.
13.4.1 Antigua and Barbuda
Assumed new generation units are 10 MW CFB units, as in the Fuel Scenario, and the addition of 14 MW of new wind units, as in the Interconnection/Renewable Scenario. The results show combined system and cost impacts (i.e., savings) of fuel and renewable options.
13.4.2 Barbados
For the Integrated Scenario, the availability of natural gas is assumed, as in the Fuel Scenario, combined with the addition of 45 MW of new wind units, as in the Interconnection/Renewable Scenario. The results show combined system and cost impacts (i.e., savings) of fuel and renewable options.
13.4.3 Dominica
This Scenario assumes the same geothermal additions as in the Interconnection/Renewable Scenario. The key difference from the Interconnection/Renewable Scenario is the assumed fuel saving of energy exports to Martinique and Guadeloupe. The Integrated Scenario assumes construction of a natural gas pipeline serving those two countries, so fuel savings on Martinique and Guadeloupe are reduced because they are replacing lower cost natural gas (rather than distillate) based generation.
13.4.4 Dominican Republic
Assumed system additions are the same as in the Fuel Scenario with the addition of new wind units as in the Interconnection/Renewable Scenario. This Scenario does not assume interconnection with Haiti’s system. The results show combined system and cost impacts (i.e., savings) of fuel and renewable options.
13.4.5 Grenada
Assumed system additions are the same as in the Fuel Scenario with the addition of new wind units as in the Interconnection/Renewable Scenario. Results show combined system and cost impacts (i.e., savings) of fuel and renewable options.
13.4.6 Haiti
Assumed system additions are the same as in the Fuel Scenario with the addition of new wind units as in the Interconnection/Renewable Scenario. Interconnection with the Dominican Republic is assumed not to occur. The results show combined system and cost impacts (i.e., savings) of fuel and renewable options.

Caribbean Regional Electricity Generation, Interconnection, and Fuels Supply Strategy – Final Report 13-14
13.4.7 Jamaica
Assumed system additions are the same as in the Fuel Scenario with the addition of new wind units as in the Interconnection/Renewable Scenario. The results show combined system and cost impacts (i.e., savings) of fuel and renewable options.
13.4.8 St. Kitts and Nevis
This Scenario assumes the same interconnection with Nevis by 2011 and no new generation units built on St. Kitts, as in the Interconnection/Renewable Scenario. The results are the same as in the Interconnection/Renewable Scenario.
Again this scenario assumes that Nevis will be interconnected with St. Kitts by 2011 and the two 20 MW geothermal units at Nevis will supply St. Kitts and Nevis. Additionally, two 200 MW geothermal units will be built at Nevis in 2014 to supply Puerto Rico. The results are the same as in the Interconnection/Renewable Scenario.
13.4.9 St. Lucia
Assumed system additions are the same as in the Fuel Scenario with the addition of new wind units as in the Interconnection/Renewable Scenario. The results show combined system and cost impacts (i.e., savings) of fuel and renewable options.
13.4.10 St. Vincent and Grenadines
Assumed system additions are the same as in the Fuel Scenario with the addition of new wind units as in the Interconnection/Renewable Scenario. The results show combined system and cost impacts (i.e., savings) of fuel and renewable options.
13.4.11 Total System Costs
Tables 13-8 to 13-10 present total system production, investment and interconnection cost for the Integrated Scenario. Production Cost Summary table shows fuel savings associated for energy exports to Martinique, Guadeloupe and Puerto Rico. Investment Cost Summary and Interconnection Cost Summary tables include yearly costs associated with building assumed interconnections.

Caribbean Regional Electricity Generation, Interconnection, and Fuels Supply Strategy – Final Report 13-15
Table 13-8 Integrated Scenario Production Cost Summary (Million 2009 US$)
Year 2009 2010 2011 2012 2013 2014 2015 2016 2017 2018 2019 2020 2021 2022 2023 2024 2025 2026 2027 2028
Antigua and Barbuda 48 49 52 72 73 77 82 85 88 91 94 93 96 99 97 100 103 106 109 113
Barbados 163 188 202 223 234 102 105 108 112 116 120 120 120 123 125 132 139 145 150 157
Dominica 13 13 15 3 4 25 26 26 27 28 28 29 30 31 31 32 33 34 35 36
Dominican Republic 1,149 1,458 1,578 1,567 1,653 1,749 1,669 1,736 1,670 1,732 1,680 1,726 1,787 1,769 1,824 1,811 1,881 1,873 1,945 1,945
Grenada 32 35 39 43 34 49 51 51 53 55 55 56 59 59 61 61 64 64 66 74
Haiti 82 94 109 129 145 133 143 164 177 191 205 220 224 232 238 250 262 275 288 303
Jamaica 547 791 880 900 963 825 843 849 878 888 924 926 935 918 951 924 976 946 1,001 1,050
St. Kitts 23 25 17 19 21 22 24 25 26 2 4 5 6 7 8 10 11 13 15 16
Nevis 9 11 3 5 5 41 42 42 43 46 47 48 49 50 50 52 53 54 55 57
St. Lucia 51 53 58 65 68 38 39 40 41 42 44 44 45 46 47 49 52 54 56 58
St. Vincent and Grenadines 22 25 27 32 34 38 41 44 45 48 49 52 53 56 57 61 62 64 66 74
Fuel Savings (exports) 0 0 0 0 0 -611 -627 -632 -635 -634 -638 -634 -637 -642 -641 -649 -656 -663 -673 -684
Total 2,139 2,740 2,980 3,058 3,234 2,488 2,437 2,541 2,525 2,605 2,610 2,685 2,766 2,747 2,849 2,834 2,980 2,965 3,114 3,200
Table 13-9 Integrated Scenario Investment Cost Summary (Million 2009 US$)
Year 2009 2010 2011 2012 2013 2014 2015 2016 2017 2018 2019 2020 2021 2022 2023 2024 2025 2026 2027 2028 Salvage Value
Antigua and Barbuda 0 0 5 8 8 4 0 0 0 0 2 26 0 0 27 0 0 26 2 0 77
Barbados 0 0 14 14 7 4 4 4 4 4 4 11 4 11 11 11 4 13 13 4 88
Dominica 0 0 0 56 0 643 0 0 0 0 0 0 0 0 0 0 0 0 0 0 369
Dominican Republic 0 385 150 790 38 38 648 38 670 38 648 38 38 660 38 638 38 638 38 638 4,389
Grenada 0 0 0 4 27 0 2 26 0 2 26 2 0 26 2 26 0 27 0 26 147
Haiti 38 10 15 15 15 6 15 15 15 15 25 15 15 15 25 15 25 15 25 25 211
Jamaica 0 97 26 287 15 147 120 120 15 120 15 120 120 120 15 225 15 225 15 120 1,351
St. Kitts 0 0 0 0 0 0 0 0 0 0 0 0 0 0 0 0 0 0 2 0 2
Nevis 0 0 56 0 0 1,042 0 0 0 56 0 0 2 0 0 2 0 0 2 0 623
St. Lucia 0 10 0 2 2 2 2 11 2 0 2 2 10 2 0 2 10 2 0 2 35
St. Vincent and Grenadines 0 0 2 0 2 0 2 0 27 0 27 0 27 0 27 0 27 26 27 0 158
Interconnection Costs 0 0 18 2 2 1,105 28 28 28 28 28 28 28 28 28 28 28 28 28 28 559
Total 38 501 287 1,178 116 2,989 820 242 761 263 776 241 244 862 173 946 146 999 153 842 8,009

Caribbean Regional Electricity Generation, Interconnection, and Fuels Supply Strategy – Final Report 13-16
Table 13-10 Integrated Scenario Interconnection Cost Summary (Million 2009 US$)
Year 2009 2010 2011 2012 2013 2014 2015 2016 2017 2018 2019 2020 2021 2022 2023 2024 2025 2026 2027 2028 Salvage Value
Dominica - Martinique & Dominica - Guadeloupe 119 4 4 4 4 4 4 4 4 4 4 4 4 4 4 59
Nevis - Puerto Rico 734 17 17 17 17 17 17 17 17 17 17 17 17 17 17 367
Nevis - St. Kitts 18 2 2 2 2 2 2 2 2 2 2 2 2 2 2 2 2 2 7
Total 0 0 18 2 2 854 23 23 23 23 23 23 23 23 23 23 23 23 23 23 434

Caribbean Regional Electricity Generation, Interconnection, and Fuels Supply Strategy – Final Report 14-1
Section 14 Study Results Evaluation
14.1 COMPARISON OF SCENARIO RESULTS
This section presents summary cost comparisons of all the scenario results presented in Section 13 and an evaluation of the results. Table 14-1 includes summary Net Present Values (NPVs) of all capital, fuel, and other operating costs for each system and for all scenarios over the entire planning period. The Table also includes the NPV of fuel savings from energy exports to countries not listed (Guadeloupe, Martinique, Puerto Rico), and of interconnection costs. The Total row shows the combined scenario NVP of all costs and savings.
Table 14-1 Scenario NPV Cost Comparison (Million US$)
Base Case Scenario
Fuel Scenario
Interconnection/ Renewable Scenario
IntegratedScenario
Antigua and Barbuda 708 696 688 677
Barbados 2,266 1,360 2,227 1,354
Dominica 157 157 521 521
Dominican Republic 16,357 15,913 16,006 15,636
Grenada 489 458 473 445
Haiti 1,955 1,522 1,878 1,479
Jamaica 8,488 7,988 8,350 7,860
St. Kitts 308 308 149 149
Nevis 188 188 807 807
St. Lucia 670 454 651 448
St. Vincent and Grenadines 400 382 387 372
Fuel Savings (from exports) -3,606 -3,011
Interconnection Costs 884 884
Total 31,985 29,424 29,415 27,619
The results show similarly reduced NPV costs associated with the Fuel and Interconnection/Renewable Scenarios, with the lowest cost for the Interconnected Scenario. In the Interconnection/Renewable Scenario the cost of generation for supplying other regions is included in the total cost for each system. Having these additional costs, Dominica and Nevis total costs significantly increase in the Interconnection/Renewable and Integrated Scenarios. However, the benefits of the interconnections are captured in the Fuel Savings, or in the case of the Nevis-St. Kitts interconnection, in the reduced costs in St. Kitts.

Caribbean Regional Electricity Generation, Interconnection, and Fuels Supply Strategy – Final Report 14-2
Table 14-2 Scenario NPV Cost Differences - Base Case Minus Other Scenario Costs (Million US$)
Fuel Scenario
Interconnection/ Renewable Scenario
IntegratedScenario
Antigua and Barbuda 12 20 31
Barbados 906 39 912
Dominica 0 604 10
Dominican Republic 444 350 721
Grenada 32 17 45
Haiti 433 76 476
Jamaica 500 138 628
St. Kitts 0 159 159
Nevis 0 1,135 1,135
St. Lucia 216 18 221
St. Vincent and Grenadines 18 14 29
Total 2,561 2,570 4,365
Table 14-2 presents cost differences among Scenarios by system as well as differences in Scenario total costs. The costs of the interconnections and the fuel savings from the exports of geothermal power are attributed to Dominica and Nevis. All numbers in Table 14-2 have positive values (except for zeros for Dominica, St. Kitts, and Nevis for the Fuel Scenario), meaning that each Scenario and each country in each Scenario provides cost savings compared to the Base Case. By country results show:
Antigua and Barbuda – The Fuel Scenario savings show that, from a cost perspective, it is beneficial to introduce imported coal as a fuel. The Interconnection/Renewable Scenario shows savings from the introduction of wind generation. The Integrated Scenario shows the combined savings of including the coal and wind options. The Integrated Scenario results show savings close to the sum of the savings of other two Scenarios. This result means that the two scenario options are almost independent (i.e., wind development will not negatively affect the coal option and vice-versa), and that the power system would benefit the most if future development includes both options.
Barbados – The Fuel Scenario shows large savings resulting from form the introduction of the natural gas fuel option. The Interconnection/Renewable Scenario shows savings from introduction of wind generation. The Integrated Scenario results show that savings from wind generation are highly dependent on the assumed fuel supply option. This result means that if most units in Barbados are using less expensive natural gas, the savings from wind development will be greatly reduced (i.e., wind generation will be replacing lower cost natural gas generation) and could provide cost savings for only a few of the best wind sites.
Dominica – Dominica does not have an alternative fossil fuel option. The results however show large benefits of geothermal development in the Interconnection/Renewable Scenario. The

Caribbean Regional Electricity Generation, Interconnection, and Fuels Supply Strategy – Final Report 14-3
Integrated Scenario results show that savings are highly dependent on the assumed fuel supply option for Martinique and Guadeloupe. This result means that if most units in Martinique and Guadeloupe have available less expensive natural gas, the savings from geothermal development will be greatly reduced (i.e., geothermal generation will be replacing lower cost natural gas generation). More detailed analysis of the Martinique and Guadeloupe systems would be required to show if both geothermal and natural gas pipeline options should be developed simultaneously (i.e., dependent on costs and the number of units that could be converted to natural gas).
Dominican Republic – The Fuel Scenario savings show that, from a cost perspective, it is beneficial to introduce imported coal as a fuel. The Interconnection/Renewable Scenario shows savings from introduction of wind generation. The Integrated Scenario shows combined savings of including the coal and wind options. The Integrated Scenario results show savings of about 90% of the sum of the other two Scenarios. This result means that those Scenario options are almost independent (i.e., wind development will not negatively affect coal option and vice-versa), and that the power system would benefit the most if future development includes both options.
Grenada – The Fuel Scenario savings show that, from a cost perspective, it is beneficial to introduce imported coal as a fuel. The Interconnection/Renewable Scenario shows savings from introduction of wind generation. The Integrated Scenario shows combined savings of including the coal and wind options. The Integrated Scenario results show savings close the sum of the other two scenarios. This result means that those scenario options are almost independent (i.e., wind development will not negatively affect coal option and vice-versa), and that the power system would benefit the most if future development includes both options.
Haiti – The Fuel Scenario savings show that, from a cost perspective, it is beneficial to introduce LNG as a fuel. The Interconnection/Renewable Scenario shows savings from the introduction of wind generation. The Integrated Scenario shows combined savings of including the coal and wind options. The Integrated Scenario savings results are close to the sum of the other two Scenarios. This means that those Scenario options are independent enough that wind development will not negatively affect the LNG option and vice-versa, and that the power system would benefit the most if future development includes both options.
Not included in Table 14-2 are the results of separate analysis of benefits of the Haiti-Dominican Republic transmission interconnection. Results with an assumed interconnection and exports from Dominican Republic to Haiti show, on a NPV basis, increased system cost in Dominican Republic by US$322 million and decreased system cost in Haiti of US$556 million. The total savings are thus US$235 million. This number accounts for additional transmission losses for the interconnection. This was compared with the NPV costs of building and operating transmission line calculated at US$242 million. The total cost increases outweighed the potential benefits and therefore a transmission interconnection was not included in the Interconnection/Renewable Scenario or the Integrated Scenario.
Jamaica – The Fuel Scenario savings show that it is beneficial to introduce LNG as a fuel. The Interconnection/Renewable Scenario shows savings from introduction of wind generation. The Integrated Scenario shows combined savings of including the LNG and wind options. The

Caribbean Regional Electricity Generation, Interconnection, and Fuels Supply Strategy – Final Report 14-4
Integrated Scenario results show savings close the sum of saving for the other two Scenarios. This result means that those Scenario options are almost independent (i.e., wind development will not negatively affect the LNG option and vice-versa), and that the system would benefit the most if future development includes both options.
St. Kitts and Nevis – St. Kitts and Nevis do not have alternative fossil fuel option. St. Kitts results however show large benefits resulting from interconnection and geothermal development on Nevis (NPV of US$159 million). These saving are much higher than the increased costs on Nevis associated with serving St. Kitts load (NPV of around US$100 million). So interconnection of St. Kitts and Nevis and geothermal development of Nevis to serve both islands is clearly a cost effective option.
Further large potential benefits on Nevis are the result of additional geothermal development, interconnection, and exports of energy to Puerto Rico.
St. Lucia – The Fuel Scenario shows large savings resulting from the introduction of natural gas as a fuel. The Interconnection/Renewable Scenario shows savings from introduction of wind generation. Similar to the Barbados results, the Integrated Scenario results show that savings from wind generation are highly dependent on the assumed fuel supply option. This result means that if most units on St. Lucia are using less expensive natural gas, the savings from wind development will be greatly reduced (i.e., wind generation will be replacing lower cost natural gas generation). Consequently, only a few of the best wind sites might provide cost savings in this scenario.
St. Vincent and Grenadines – The Fuel Scenario savings show that, from a cost perspective, it is beneficial to introduce imported coal as a fuel. The Interconnection/Renewable Scenario shows savings from the introduction of wind generation. The Integrated Scenario shows combined savings of including the coal and wind options. The Integrated Scenario results show savings close the sum of the other two Scenarios. This result means that those Scenario options are almost independent (i.e., wind development will not negatively affect coal option and vice-versa), and that the system would benefit the most if future development includes both options.
In summary, system analysis results confirm and expand upon the initial screening analysis results.
14.2 RECOMMENDED DEVELOPMENT SCENARIO
Based on the more detailed system analysis, we recommend the projects included in the Integrated Scenario as a basis for future more detailed analysis and development. The Integrated Scenario analysis showed that introducing new fuels and developing geothermal-based power over interconnections provide the most benefits and both could be part of the power system development. One exception was found to be the geothermal development on Dominica for exports to Martinique and Guadeloupe. Benefits of this option are highly dependent on the construction of the natural gas pipeline connecting those two islands with Trinidad and Tobago.

Caribbean Regional Electricity Generation, Interconnection, and Fuels Supply Strategy – Final Report 14-5
14.2.1 Investment Requirement and Financing Evaluation
Table 14-3 provides for each Scenario the undiscounted investment requirements for each country and for the Study countries combined, including the cost of interconnections attributed to the exporting country. The investment requirements are lowest for the Base Case Scenario, increasing by about US$1.7 billion for the Fuel Scenario, US$3.8 billion for the Interconnection/Renewable Scenario, and US$5.5 billion for the Integrated Scenario. Note that the undiscounted 2009 US$ costs in Tables 14-3 and 14-4 are not directly comparable to the NPV values of Tables 14-1 and 14-2 and in the Tables in Section 13.
Table 14-3 Investment Requirement, 2009 US$ Million, by Scenario
Base Case Scenario
Fuel Scenario
Interconnection/ Renewable Scenario
IntegratedScenario
Antigua and Barbuda 27 90 44 107
Barbados 84 84 140 140
Dominica 7 7 818 818
Dominican Republic 2,965 5,525 3,640 6,200
Grenada 32 179 47 194
Haiti 259 259 360 360
Jamaica 2,928 1,663 3,202 1,937
St. Kitts 16 16 2 2
Nevis 11 11 1,913 1,913
St. Lucia 38 38 61 61
St. Vincent and Grenadines 32 179 48 195
Total 6,398 8,050 10,274 11,926
The Fuel, Interconnection/Renewable, and Integrated Scenarios have larger investment requirements because they use capital investment to reduce production costs, overwhelmingly fuel costs. Table 14-4 shows the undiscounted production costs for the four Scenarios. The apparent savings ranges from US$3.7 billion for the Renewable Scenario to US$13.5 billion for Integrated Scenario. In fact those values significantly understate the savings. The production cost savings shown in Table 14-4 cover one to 15 years, depending on when the investment was made. They will continue for an additional 15 to 29 years. Table 14-2 illustrates the NPV cost advantage of the other three scenarios over the Base Case.
Financing an additional US$1.7 billion to US$5.5 billion would be a challenge, not least because funds for capital investment tend to be harder to acquire than funds for day-to-day operations. There are reasons to think that it might be possible to meet the challenge.
The capital investments will reduce overall cash flows in the long run.
In the Interconnection/Renewable and Integrated Scenarios, about 25% of the investment and 50% of the increased investment compared to the Base Case is in the development of geothermal power plants for export and for submarine cable

Caribbean Regional Electricity Generation, Interconnection, and Fuels Supply Strategy – Final Report 14-6
interconnections. It is currently envisioned that these investments will be made by private parties, not the utilities.
Much of the investment increase is in coal-fueled power plants. Some of those are only marginally beneficial compared to LNG. Foregoing some production cost savings to reduce financing requirements might be favored by some utilities.
Other factors add to the challenge:
More than half the investment requirement in the Fuel and Integrated Scenarios is in the Dominican Republic. If that one country is unable to meet its investment needs much of the benefit will not be achieved.
Capital investments associated with new fuels were rolled into the prices of the fuels. Those investments associated with at-island facilities may become the responsibility of the utility.
Overhanging all decision-making regarding future power sector investments is the issue of fuel price forecasts. Will a utility be willing to make significant capital investments to move away from distillate when prices may fall? Will a utility gamble on HFO as an temporizing move with much lower capital investment requirements? On the other hand, continuing with liquid fuels risks the return to $150/BBL oil. There is no way to avoid risk altogether, and controlling risk through diversification or some kind of hedging imposes costs as well. The point is that financing a substantial investment to reduce fuel costs is a risk a utility should balance against the risks of not making the investment, based on its situation and perceptions.
Table 14-4 Production Cost Summary, 2009 US$ Million, by Scenario
Base Case Scenario
Fuel Scenario
Interconnection/ Renewable Scenario
IntegratedScenario
Antigua and Barbuda 1,906 1,809 1,821 1,729
Barbados 6,022 2,951 5,818 2,882
Dominica 410 410 500 500
Dominican Republic 39,919 35,983 37,894 34,203
Grenada 1,370 1,118 1,296 1,061
Haiti 5,796 4,105 5,421 3,865
Jamaica 19,078 18,587 18,392 17,915
St. Kitts 816 816 300 300
Nevis 433 433 761 761
St. Lucia 1,765 1,028 1,676 988
St. Vincent and Grenadines 1,189 1,004 1,123 952
Total 78,704 68,245 75,001 65,155

Caribbean Regional Electricity Generation, Interconnection, and Fuels Supply Strategy – Final Report 14-7
14.2.2 Commercial and Regulatory Issues
Some issues affect only the country where the power is generated and can be dealt with on a country-by-country basis. This includes environmental regulation related to fuels, especially coal, petroleum coke, and HFO. It also includes economic regulation of tariffs and related issues for power produced for the domestic market. This is an important commercial issue as well. Each country’s regulators should address the needs of customers and investors and strike a balance that leaves the utility sound technically and financially.
Another class of regulatory issue is those affecting more than one country. This includes power for export, submarine cables, and the ECGP. It may also affect imported fuels, especially if local costs are part of the price of the fuel. Where one than one country is affected, regulatory harmonization is desirable and may be mandatory for the success of the project in question. Having many countries are involved, such as with the ECGP, adds to the complexity and likely time required to reach a successful conclusion.
Another complication is the potential for separate components of inter-island power or fuel supply. For the export of geothermal power via submarine cable, one private party might own the geothermal power plant in the exporting country while another owns and operates the submarine cable. For the gas pipeline, a separate firm will own and operate the pipeline while another organization will supply the gas. In both these cases contractual structures must be created to guarantee the supply needed by the customers and that allocate risks and responsibilities to the appropriate parties. The needs of all parties would be best served by long-term contracts that guarantee supply to the customer and guarantee a revenue stream to the suppliers.
14.2.3 Security of Supply
More than one utility has expressed concern about relying on another country for power or fuel vital to power generation. A simple technical failure to a pipeline or submarine cable, though unlikely, might be the cause. In addition, supply to one country might be compromised by political unrest in the supplying country, or by retaining contracted fuel or power for the supplying country in the event of shortage. In contrast, distillate and HFO are widely available.
The combination of power plant and submarine cable, or gas supply and gas pipeline, will involve large capital expenses and result in relying on a single or small number of customers for the revenues to cover the investments and other costs. It is essential that the electricity or gas importers be highly credit worthy organizations.
14.2.3.1 On-island Reserve Requirements
All of the Study countries have no interconnections and most have small demands. This leads most to maintain high planning reserve margins to assure reliable service. Reserve margins may be set on a deterministic basis, such as 35%, or a probabilistic basis, such as loss-of-load probability. It would be possible to incorporate power via a submarine cable into such approaches.

Caribbean Regional Electricity Generation, Interconnection, and Fuels Supply Strategy – Final Report 14-8
A problem is that the economics of submarine cables (and some power generation technologies) improve as more power is delivered. This provides an incentive for the supplier to deliver as much power as possible. This can be good for the importer, but may lead to the geothermal plant / submarine cable project delivering significantly more power than any other unit in the importing country’s system. One way to address this situation is to draw a parallel to the way the necessary reserve margin is established today. For example, suppose the reserve margin requirement is explicitly or implicitly 20% of peak demand plus the size of the two largest units. If the largest unit before the submarine cable is 16 MW, and the submarine cable is 50 MW, the new reserve margin requirement can easily be calculated. A more detailed economic analysis than is included in this Study could incorporate the costs of the increased reserve margin using this approach or in another similar approach.
Operating reserves would also need to change. Operating reserves might be on a largest contingency basis. In the case where the largest unit previously was 16 MW but becomes 50 MW, the costs associated with that change could also be incorporated. Both geothermal power generation and submarine cables tend to be highly reliable facilities, which could affect the level of operating reserves carried and the corresponding risk and expected costs of an outage of the cable or generator.

Caribbean Regional Electricity Generation, Interconnection, and Fuels Supply Strategy – Final Report 15-1
Section 15 Conclusions and Recommendations
15.1 CONCLUSIONS
15.1.1 Demand
Regional peak demand is forecast to grow at 3.6% per year from 2009 through 2028, with regional energy demand growing at 3.7% per year for the same period. Both peak and energy demand nearly double by 2028. The range among the countries is 2.5% per year to 7.9% per year. Meeting the growth in demand will pose fuel supply and financial challenges.
15.1.2 Fuels
The forecast levelized price of distillate over 2014-2028 is US$22.45/GJ. Each country except Dominica has at least one lower cost fuel option, and many countries have more than one. Table 15-1 replicates Table 7-11 and provides the comparative prices. Distillate, LNG, and pipeline gas can be compared directly because they can fuel the same generators. Coal fuels generators with higher capital costs and higher heat rates, which must be taken into account in comparing fuel options. The prices of all fuels except distillate vary from country to country because they include transportation costs that vary.
Table 15-1 Fuel Prices Based on Yearly Demand 2014-2028
Country
Fuels Selected in Addition to Coal and
Distillate
Levelized Fuel Price, US$/GJ Fuel
Selected Coal Distillate Antigua and Barbuda None N/A 12.31 22.45 Barbados Pipeline Gas 7.39 7.77 22.45 Dominica Distillate only N/A N/A 22.45 Dominican Republic LNG 8.73 4.19 22.45 Grenada None N/A 12.31 22.45 Guadeloupe Pipeline Gas 10.88 7.77 22.45 Haiti LNG 12.73 7.77 22.45 Jamaica LNG 10.16 4.85 22.45 Jamaica North LNG 10.90 4.85 22.45 Martinique Pipeline Gas 8.99 7.77 22.45 St. Kitts and Nevis None N/A 12.31 22.45 St. Lucia Pipeline Gas 10.49 9.04 22.45 St. Vincent and Grenadines
None N/A 12.31 22.45

Caribbean Regional Electricity Generation, Interconnection, and Fuels Supply Strategy – Final Report 15-2
Coal is an optional fuel for every country except Dominica, where preliminary analysis showed it to be more costly than distillate on a US$/GJ basis.
Table 15-1 shows the following:
Every country except Dominica has at least one fuel option lower in price than distillate
Pipeline gas is the lowest cost natural gas option for every country reached by the ECGP: Barbados, Martinique, St. Lucia, and Guadeloupe
Coal is the only optional fuel for Antigua and Barbuda, Grenada, St. Kitts and Nevis, and St. Vincent and Grenadines
LNG is the lowest cost natural gas option for Dominican Republic, Haiti, Jamaica, and Jamaica North
CNG was considered and was the lowest cost gas option for several countries, but for those countries was always higher in cost than distillate and therefore does not appear in Table 15-1. It was considerably lower than distillate for some countries, but was more costly than LNG in those countries.
Though not studied in the same detail as the other fuel options, mid-scale LNG may provide an economically attractive option for some countries.
15.1.3 Technologies
15.1.3.1 Renewable Energy
Wind, geothermal, small hydro, and biomass technology/fuel combinations have the potential, at a good site, to be considerably less costly than distillate fueled power generation. The three lowest cost resources for operation at capacity factors above about 30% are renewables: geothermal, wind (including the cost of backup generation), and small hydro. This assumes that high quality sites can be identified and acquired. Solar PV and solar trough CSP are not competitive for bulk power generation. There are many small solar PV installations in Martinique due to subsidies, and solar PV is competitive for off-grid locations. If a lower cost fuel such as pipeline gas were the competitive fuel, the advantage of the renewable technology would be less.
15.1.3.2 Fossil Fueled
The bullets below summarize the least cost technology/fossil fuel combination by country as determined by screening analysis. This considers the countries and islands as isolated systems. For some countries, imports via submarine cable provide a lower cost solution. We eliminated the technology/fuel combinations that were least cost at only one annual capacity factor, such as zero or 90%. Scenario analysis generally supports these conclusions, though multiple fuels were not used as much.
Individual Countries
Antigua and Barbuda, Grenada, and St. Vincent and Grenadines: 10 MW MSD on distillate for peaking and mid-range duty, and the coal-fueled CFB for base load duty

Caribbean Regional Electricity Generation, Interconnection, and Fuels Supply Strategy – Final Report 15-3
Coal-fueled CFB is only marginally more economic than distillate fueled medium speed diesels (MSD) plants; CO2 costs of US$50/tonne would make the distillate-fueled units more economic than the coal-fueled units
Dominica, St. Kitts, and Nevis: 5 MW MSD on distillate for peaking, mid-range, and base load duty
St. Kitts and Nevis are fortunate that a geothermal resource sufficient to serve all their demand has been confirmed and is in the process of development. For Dominica it seems highly probable that a geothermal resource sufficient to serve at least local demand will be confirmed and developed. None of these islands may not need to install any new distillate-fueled generation.
Dominican Republic: 50 MW GT on LNG for peaking duty, 300 MW CC on LNG for mid-range duty, and 300 MW conventional coal plant for base load duty
The Dominican Republic already has an LNG terminal and coal-fueled power plants. Scenario analysis shows that coal is preferred if only one fuel can be selected for future additions. However, incorporating CO2 costs in the analysis would compromise coal’s advantage. With the Dominican Republic’s large demand, expanding the use of both fuels may be feasible, even if new facilities are needed.
Haiti: 20 MW LSD on LNG for peaking, mid-range, and base load duty.
LNG provides very large benefits but requires significant up-front capital expenditures
Jamaica and Jamaica North: 50 MW GT on LNG for peaking duty, 20 MW LSD on LNG for mid-range duty, and 50 MW coal-fueled CFB base load duty
Today Jamaica and Jamaica North have neither fuel. It seems unlikely that they would want to develop both fuels. If only one is to be developed, LNG is preferred, and its advantage would increase if CO2 costs are incorporated in the analysis.
Sub-regional Gas Market
The ECGP links the markets of the four countries and provides the benefits of economies of scale compared to individual development.
Barbados, Guadeloupe, Martinique, and St. Lucia: 20 MW GT on pipeline gas for peaking duty and 20 MW LSD on pipeline gas for mid-range and base load duty
For all four countries the pipeline gas is less than half as costly as distillate. For all but St. Lucia, LNG is more costly than pipeline gas but significantly less costly than distillate.
The low gas price reduces the benefits of renewables and for Martinique and Guadeloupe makes importing geothermal power from Dominica via submarine cable marginal.

Caribbean Regional Electricity Generation, Interconnection, and Fuels Supply Strategy – Final Report 15-4
15.1.4 Sub-regional Electricity Markets
The first three bullets below show the interconnections studied with greatest emphasis. All the interconnections were submarine cables except the Dominican Republic – Haiti link noted in the bottom bullet. For each interconnection we note its capacity in MW, length in km, cost per kW for interconnection and related facilities only, source of export power, and economic attractiveness.
Nevis – St. Kitts, 50 MW submarine cable capacity, 5 km submarine cable length, US$328/kW (interconnection and related facilities only), geothermal power export, highly economic
Dominica – Martinique, 100 MW, 70 km, US$588/kW (interconnection and related facilities only), geothermal power export, marginally economic if displaced fuel is gas from ECGP, more economic if displaced fuel is higher cost
Dominica – Guadeloupe, 100 MW, 70 km, US$588/kW (interconnection and related facilities only), geothermal power export, moderately economic if displaced fuel is gas from ECGP, more economic if displaced fuel is higher cost
Nevis – Puerto Rico, 400 MW, 400 km, US$1,791/kW (interconnection and related facilities only), geothermal power export, highly economic if displaced fuel is HFO, not economic if displaced fuel is LNG
Nevis – US Virgin Islands, 80 MVA, 320 km, US$3,541/kW (interconnection and related facilities only), geothermal power export, only marginally economic even though the displaced fuel is distillate
Saba – St. Maarten, 100 MW, 60 km, US$528/kW (interconnection and related facilities only), geothermal power export, highly economic if displaced fuel is distillate and St. Maarten can accept 100 MW
United States (Florida) – Cuba, 400 MW, 400 km, US$1,791/kW (interconnection and related facilities only), export from coal-fueled steam plant or gas-fueled combined cycle, highly economic if displaced fuel is HFO
Dominican Republic – Haiti, 250 MW, 563 km, US$1,899/kW (interconnection and related facilities only), land interconnection, export from HFO fueled steam plant, not economic unless export is from lower cost unit/fuel combination
15.1.5 Multiple New Supply Sources
Some countries are blessed with several attractive options. For example, based on the prices calculated for Martinique and Guadeloupe, pipeline gas, LNG, CNG, coal, and geothermal power via submarine cable from Dominica are all much less costly than distillate-based power generation. For Martinique, the geothermal power / submarine cable project appears to offer some economic benefits even though pipeline gas is available. Considering the fixed investment costs of each and their interaction in reducing the imports of each other, proceeding with more than one expensive new source of fuel or power may be difficult. The same principle applies for all the cases where more than one option appears economic.

Caribbean Regional Electricity Generation, Interconnection, and Fuels Supply Strategy – Final Report 15-5
15.1.6 CO2 Costs
If a tax or similar levy were attributed to each tonne of CO2 emissions, the cost of using fuels would increase. This would open wider the economic window for technologies that produce lower or no CO2 emissions. However, all the countries today primary fuel is distillate and/or HFO, so the window is already quite wide. We investigated the impact if a cost of US$50/tonne were attributed to CO2 emissions.
At US$50/tonne, the effective price of fuels would increase in a range from US$2.52 for distillate to US$4.41 for coal, representing increases ranging from 15% for distillate to 91% for the lowest cost coal for the Study islands.
In the bullets below we measure the impact of CO2 costs by how technology choices change when it is applied.
Countries with small demand: The fuel prices are high even when coal fuels some of the least-cost generation.
For Antigua and Barbuda, Grenada, and St. Vincent and Grenadines, the preferred fuel would switch from coal to distillate.
The renewable energy resources that were economic before are now somewhat more economic, and those that were not economic edge closer to being competitive.
Countries with medium or high demand. The fuels are much less expensive than distillate and therefore the displaced generation is lower in cost, narrowing the economic window for alternatives.
For the Dominican Republic, Jamaica, and Jamaica North, incorporating CO2 costs in the analysis would probably eliminate coal’s advantage over LNG or increase LNG’s advantage over coal.
With no CO2 cost the renewables that were economic for the islands with small demand are still economic, though in some cases only marginally so. Incorporating CO2 costs makes renewables more competitive.
15.1.7 Regional Strategies
For all Study countries combined, costs including fuel savings from exports and interconnection costs were:
US$31,985 million for the Base Case Scenario
US$29,424 million for the Fuel Scenario
US$29,415 million for the Interconnection/Renewable Scenario
US$27,619 million for the Integrated Scenario
Table 15-2 presents cost differences among Scenarios by system as well as differences in Scenario total costs. The Fuel Scenario and Interconnection/Renewable Scenarios both reduce costs by about US$2.5 million compared to the Base Case. The Integrated Scenario reduces

Caribbean Regional Electricity Generation, Interconnection, and Fuels Supply Strategy – Final Report 15-6
costs by about US$ 4.3 million, showing that the Integrated Scenario captures most of the individual benefits of each of the other two Scenarios.
Table 15-1 Scenario NPV Cost Differences - Base Case Minus Other Scenario Costs (Million US$)
Fuel Scenario
Interconnection/ Renewable Scenario
IntegratedScenario
Antigua and Barbuda 12 20 31
Barbados 906 39 912
Dominica 0 604 10
Dominican Republic 444 350 721
Grenada 32 17 45
Haiti 433 76 476
Jamaica 500 138 628
St. Kitts 0 159 159
Nevis 0 1,135 1,135
St. Lucia 216 18 221
St. Vincent and Grenadines 18 14 29
Total 2,561 2,570 4,365
The costs of the interconnections and the fuel savings from the exports of geothermal power are attributed to Dominica and Nevis. All numbers in Table 15-2 have positive values (except for zeros for Dominica, St. Kitts, and Nevis for the Fuel Scenario), meaning that each Scenario and each country in each Scenario provides cost savings compared to the Base Case.
15.2 RECOMMENDATIONS
In Section 14.2, based on the more detailed system analysis, we recommend the projects included in the Integrated Scenario as a basis for future more detailed analysis and development. The Integrated Scenario analysis showed that introducing new fuels and developing geothermal-based power over interconnections provide the most benefits and both could be part of the power system development. One exception was found to be the geothermal development on Dominica for exports to Martinique and Guadeloupe. Benefits of this option are large when distillate is the displaced fuel, but disappear when the ECGP is assumed to be built.
The focus of this Study was on the economics as determined by annual cost of power for individual fuel supply and technology sets, and total net present value analysis for the four Scenarios. There are financial, institutional, and other barriers to achieving the least-cost economic solution, including:
The capital investments required to obtain the economic benefits may be beyond the financing capability of some utilities

Caribbean Regional Electricity Generation, Interconnection, and Fuels Supply Strategy – Final Report 15-7
Uncertainty in the input parameters, especially fuel price forecasts, means any course of action has a level of risk that may deter capital investment
Development of electrical interconnections or the ECGP will require agreement among many parties, such as the utilities, private power producers, regulators, gas suppliers, and governments. This makes development more difficult, time-consuming, and costly.
Utilities or countries may be concerned about relying on another utility or country for power or gas critical to its operations
Environmental and economic regulation may prevent some projects or fuel choices from materializing
Some countries suffer from a combination of issues that unfortunately are common in developing countries:
Inadequate tariff levels
High technical and non-technical losses
Deteriorating equipment
Load shedding
This Study provides a relatively high level overview of the fuels, generation technologies, and interconnection projects considered. In some cases we have identified marginal net benefits, in others multiple parties need to agree, in still others the utility might need to choose among several attractive alternatives. Much more detailed project-specific work would need to be completed to resolve uncertainties before proceeding with any major facility. Each of the main subject areas merits further support, but we suggest priority for the following.
1) Gas Pipeline
The ECGP provides the most economic fuel for each island it reaches. The number of parties potentially involved (ECGPC, gas suppliers, utilities, regulators, financial institutions) suggest the need for support over a range of areas.
2) Geothermal Power Generation / Submarine Cable Projects
The Nevis – St. Kitts link is highly economic and not technically challenging. The benefits of the Dominica – Martinique and Dominica – Guadeloupe links are large when distillate is the displace fuel but disappear or become much smaller when pipeline gas or other low-cost fuel is available. In other words, the ECGP and Dominica links are competitors and may be mutually exclusive. Other links (Nevis – Puerto Rico, United States (Florida) – Cuba also offer potentially large benefits but have larger uncertainties.
3) Renewable Energy
The primary uncertainty with wind and geothermal power generation is identifying sites where the resource is good and site development costs are not a barrier. The expected potential for both wind and geothermal is large. Assisting in identifying such sites might be the most cost-effective method of fostering development.

Caribbean Regional Electricity Generation, Interconnection, and Fuels Supply Strategy – Final Report A-1
Attachment A Scenario Analysis Results
This section provides additional details of the results of system analysis for the four scenarios described in Section 12 and summarized in Section 13 of the main report. It adds results for the individual countries as well as including the same summary tables as Section 13.
Because of the number of tables, we include on the following pages a Table of Contents and list of Tables to help the reader find the items he or she is seeking.

Caribbean Regional Electricity Generation, Interconnection, and Fuels Supply Strategy – Final Report A-2
Section Page
Attachment A Scenario Analysis Results ................................................................................ A-1 A.1 Base Case Scenario Development Plans A-6 A.2 Fuel Scenario A-37 A.3 Interconnection/Renewable Scenario A-60 A.4 Integrated Scenario A-98
Table Page
Table A-1 Antigua and Barbuda Base Case Capacity Balance ................................................ A-10 Table A-2 Antigua and Barbuda Base Case Energy Balance ................................................... A-11 Table A-3 Antigua and Barbuda Base Case Cost Summary (Million 2009 US$) .................... A-11 Table A-4 Barbados Base Case Capacity Balance ................................................................... A-12 Table A-5 Barbados Base Case Energy Balance ...................................................................... A-13 Table A-6 Barbados Base Case Cost Summary (Million 2009 US$) ....................................... A-13 Table A-7 Dominica Base Case Capacity Balance ................................................................... A-14 Table A-8 Dominica Base Case Energy Balance ..................................................................... A-15 Table A-9 Dominica Base Case Cost Summary (Million 2009 US$) ...................................... A-15 Table A-10 Dominican Republic Base Case Capacity Balance ............................................... A-16 Table A-11 Dominican Republic Base Case Energy Balance .................................................. A-18 Table A-12 Dominican Republic Base Case Cost Summary (Million 2009 US$) ................... A-20 Table A-13 Grenada Base Case Capacity Balance ................................................................... A-21 Table A-14 Grenada Base Case Energy Balance ...................................................................... A-22 Table A-15 Grenada Base Case Cost Summary (Million 2009 US$) ...................................... A-22 Table A-16 Haiti Base Case Capacity Balance ......................................................................... A-23 Table A-17 Haiti Base Case Energy Balance ........................................................................... A-24 Table A-18 Haiti Base Case Cost Summary (Million 2009 US$) ............................................ A-24 Table A-19 Jamaica Base Case Capacity Balance .................................................................... A-25 Table A-20 Jamaica Base Case Energy Balance ...................................................................... A-26 Table A-21 Jamaica Base Case Cost Summary (Million 2009 US$) ....................................... A-27 Table A-22 St. Kitts Base Case Capacity Balance ................................................................... A-28 Table A-23 St. Kitts Base Case Energy Balance ...................................................................... A-29 Table A-24 St. Kitts Base Case Cost Summary (Million 2009 US$) ....................................... A-29 Table A-25 Nevis Base Case Capacity Balance ....................................................................... A-30 Table A-26 Nevis Base Case Energy Balance .......................................................................... A-31 Table A-27 Nevis Base Case Cost Summary (Million 2009 US$) ........................................... A-31 Table A-28 St. Lucia Base Case Capacity Balance .................................................................. A-32 Table A-29 St. Lucia Base Case Energy Balance ..................................................................... A-33 Table A-30 St. Lucia Base Case Cost Summary (Million 2009 US$) ...................................... A-33 Table A-31 St. Vincent and Grenadines Base Case Capacity Balance ..................................... A-34 Table A-32 St. Vincent and Grenadines Base Case Energy Balance ....................................... A-35 Table A-33 St. Vincent and Grenadines Base Case Cost Summary (Million 2009 US$) ........ A-35 Table A-34 Base Case Production Cost Summary (Million 2009 US$) .................................. A-36 Table A-35 Base Case Investment Cost Summary (Million 2009 US$) .................................. A-36 Table A-36 Antigua and Barbuda Fuel Scenario Capacity Balance ......................................... A-39

Caribbean Regional Electricity Generation, Interconnection, and Fuels Supply Strategy – Final Report A-3
Table A-37 Antigua and Barbuda Fuel Scenario Energy Balance ........................................... A-40 Table A-38 Antigua and Barbuda Fuel Scenario Cost Summary ............................................. A-40 Table A-39 Barbados Fuel Scenario Capacity Balance ............................................................ A-41 Table A-40 Barbados Fuel Scenario Energy Balance ............................................................... A-42 Table A-41 Barbados Fuel Scenario Cost Summary (Million 2009 US$) ............................... A-42 Table A-42 Dominican Republic Fuel Scenario Capacity Balance .......................................... A-43 Table A-43 Dominican Republic Fuel Scenario Energy Balance ............................................ A-45 Table A-44 Dominican Republic Fuel Scenario Cost Summary (Million 2009 US$) ............. A-47 Table A-45 Grenada Fuel Scenario Capacity Balance ............................................................. A-48 Table A-46 Grenada Fuel Scenario Energy Balance ................................................................ A-49 Table A-47 Grenada Fuel Scenario Cost Summary (Million 2009 US$) ................................. A-49 Table A-48 Haiti Fuel Scenario Capacity Balance ................................................................... A-50 Table A-49 Haiti Fuel Scenario Energy Balance ...................................................................... A-51 Table A-50 Haiti Fuel Scenario Cost Summary (Million 2009 US$) ...................................... A-51 Table A-51 Jamaica Fuel Scenario Capacity Balance .............................................................. A-52 Table A-52 Jamaica Fuel Scenario Energy Balance ................................................................. A-53 Table A-53 Jamaica Fuel Scenario Cost Summary (Million 2009 US$) .................................. A-54 Table A-54 St. Lucia Fuel Scenario Capacity Balance ............................................................. A-55 Table A-55 St. Lucia Fuel Scenario Energy Balance ............................................................... A-56 Table A-56 St. Lucia Fuel Scenario Cost Summary (Million 2009 US$) ................................ A-56 Table A-57 St. Vincent and Grenadines Fuel Scenario Capacity Balance ............................... A-57 Table A-58 St. Vincent and Grenadines Fuel Scenario Energy Balance .................................. A-58 Table A-59 St. Vincent and Grenadines Case Cost Summary (Million 2009 US$) ................. A-58 Table A-60 Fuel Scenario Production Cost Summary (Million 2009 US$) ............................. A-59 Table A-61 Fuel Scenario Investment Cost Summary (Million 2009 US$) ............................. A-59 Table A-62 Antigua and Barbuda Interconnection/Renewable Scenario Capacity Balance .... A-63 Table A-63 Antigua and Barbuda Interconnection/Renewable Scenario Energy Balance ....... A-64 Table A-64 Antigua and Barbuda Interconnection/Renewable Scenario Cost Summary ........ A-64 Table A-65 Barbados Interconnection/Renewable Scenario Capacity Balance ....................... A-65 Table A-66 Barbados Interconnection/Renewable Scenario Energy Balance .......................... A-66 Table A-67 Barbados Interconnection/Renewable Scenario Cost Summary (Million 2009 US$)
........................................................................................................................................... A-66 Table A-68 Dominica Interconnection/Renewable Scenario Capacity Balance ...................... A-67 Table A-69 Dominica Interconnection/Renewable Scenario Energy Balance ......................... A-68 Table A-70 Dominica Interconnection/Renewable Scenario Cost Summary (Million 2009 US$)
........................................................................................................................................... A-68 Table A-71 Dominican Republic Interconnection Scenario Capacity Balance ........................ A-69 Table A-72 Dominican Republic Interconnection Scenario Energy Balance .......................... A-71 Table A-73 Dominican Republic Interconnection Scenario Cost Summary (Million 2009 US$) A-
73 Table A-74 Dominican Republic Renewable Scenario Capacity Balance ............................... A-74 Table A-75 Dominican Republic Renewable Scenario Energy Balance .................................. A-76 Table A-76 Dominican Republic Renewable Scenario Cost Summary (Million 2009 US$) ... A-78 Table A-77 Grenada Interconnection/Renewable Scenario Capacity Balance ......................... A-79 Table A-78 Grenada Interconnection/Renewable Scenario Energy Balance ........................... A-80

Caribbean Regional Electricity Generation, Interconnection, and Fuels Supply Strategy – Final Report A-4
Table A-79 Grenada Interconnection/Renewable Scenario Cost Summary (Million 2009 US$) A-80
Table A-80 Haiti Interconnection Scenario Capacity Balance ................................................. A-81 Table A-81 Haiti Interconnection Scenario Energy Balance .................................................... A-82 Table A-82 Haiti Interconnection Scenario Cost Summary (Million 2009 US$) .................... A-82 Table A-83 Haiti Renewable Scenario Capacity Balance ........................................................ A-83 Table A-84 Haiti Renewable Scenario Energy Balance ........................................................... A-84 Table A-85 Haiti Renewable Scenario Cost Summary (Million 2009 US$) ............................ A-84 Table A-86 Jamaica Interconnection/Renewable Scenario Capacity Balance ......................... A-85 Table A-87 Jamaica Interconnection/Renewable Scenario Energy Balance ............................ A-86 Table A-88 Jamaica Interconnection/Renewable Scenario Cost Summary (Million 2009 US$) . A-
87 Table A-89 St. Kitts Interconnection/Renewable Scenario Capacity Balance ......................... A-88 Table A-90 St. Kitts Interconnection/Renewable Scenario Energy Balance ............................ A-89 Table A-91 St. Kitts Interconnection/Renewable Scenario Cost Summary (Million 2009 US$) A-
89 Table A-92 Nevis Interconnection/Renewable Scenario Capacity Balance ............................. A-90 Table A-93 Nevis Interconnection/Renewable Scenario Energy Balance ............................... A-91 Table A-94 Nevis Interconnection/Renewable Scenario Cost Summary (Million 2009 US$) A-91 Table A-95 St. Lucia Interconnection/Renewable Scenario Capacity Balance ........................ A-92 Table A-96 St. Lucia Interconnection/Renewable Scenario Energy Balance .......................... A-93 Table A-97 St. Lucia Interconnection/Renewable Scenario Cost Summary (Million 2009 US$) A-
93 Table A-98 St. Vincent and Grenadines Interconnection/Renewable Scenario Capacity Balance
........................................................................................................................................... A-94 Table A-99 St. Vincent and Grenadines Interconnection/Renewable Scenario Energy Balance . A-
95 Table A-100 St. Vincent and Grenadines Interconnection/Renewable Scenario Cost Summary
(Million 2009 US$) ........................................................................................................... A-95 Table A-101 Interconnection/Renewable Scenario Production Cost Summary (Million 2009
US$) .................................................................................................................................. A-96 Table A-102 Interconnection/Renewable Scenario Investment Cost Summary (Million 2009
US$) .................................................................................................................................. A-96 Table A-103 Interconnection/Renewable Scenario Interconnection Cost Summary (Million 2009
US$) .................................................................................................................................. A-97 Table A-104 Antigua and Barbuda Integrated Scenario Capacity Balance ............................ A-100 Table A-105 Antigua and Barbuda Integrated Scenario Energy Balance .............................. A-101 Table A-106 Antigua and Barbuda Integrated Scenario Cost Summary ................................ A-101 Table A-107 Barbados Integrated Scenario Capacity Balance ............................................... A-102 Table A-108 Barbados Integrated Scenario Energy Balance ................................................. A-103 Table A-109 Barbados Integrated Scenario Cost Summary (Million 2009 US$) .................. A-103 Table A-110 Dominica Integrated Scenario Capacity Balance .............................................. A-104 Table A-111 Dominica Integrated Scenario Energy Balance ................................................. A-105 Table A-112 Dominica Integrated Scenario Cost Summary (Million 2009 US$) .................. A-105 Table A-113 Dominican Republic Integrated Scenario Capacity Balance ............................. A-106 Table A-114 Dominican Republic Integrated Scenario Energy Balance ............................... A-108

Caribbean Regional Electricity Generation, Interconnection, and Fuels Supply Strategy – Final Report A-5
Table A-115 Dominican Republic Integrated Scenario Cost Summary (Million 2009 US$) A-110 Table A-116 Grenada Integrated Scenario Capacity Balance ................................................ A-111 Table A-117 Grenada Integrated Scenario Energy Balance ................................................... A-112 Table A-118 Grenada Integrated Scenario Cost Summary (Million 2009 US$) .................... A-112 Table A-119 Haiti Integrated Scenario Capacity Balance ...................................................... A-113 Table A-120 Haiti Integrated Scenario Energy Balance ......................................................... A-114 Table A-121 Haiti Integrated Scenario Cost Summary (Million 2009 US$) ......................... A-114 Table A-122 Jamaica Integrated Scenario Capacity Balance ................................................. A-115 Table A-123 Jamaica Integrated Scenario Energy Balance .................................................... A-116 Table A-124 Jamaica Integrated Scenario Cost Summary (Million 2009 US$) .................... A-117 Table A-125 St. Kitts Integrated Scenario Capacity Balance ................................................. A-118 Table A-126 St. Kitts Integrated Scenario Energy Balance ................................................... A-119 Table A-127 St. Kitts Integrated Scenario Cost Summary (Million 2009 US$) .................... A-119 Table A-128 Nevis Integrated Scenario Capacity Balance ..................................................... A-120 Table A-129 Nevis Integrated Scenario Energy Balance ....................................................... A-121 Table A-130 Nevis Integrated Scenario Cost Summary (Million 2009 US$) ........................ A-121 Table A-131 St. Lucia Integrated Scenario Capacity Balance ............................................... A-122 Table A-132 St. Lucia Integrated Scenario Energy Balance .................................................. A-123 Table A-133 St. Lucia Integrated Scenario Cost Summary (Million 2009 US$) ................... A-123 Table A-134 St. Vincent and Grenadines Integrated Scenario Capacity Balance .................. A-124 Table A-135 St. Vincent and Grenadines Integrated Scenario Energy Balance ..................... A-125 Table A-136 St. Vincent and Grenadines Integrated Scenario Cost Summary (Million 2009 US$)
......................................................................................................................................... A-125 Table A-137 Integrated Scenario Production Cost Summary (Million 2009 US$) ................ A-126 Table A-138 Integrated Scenario Investment Cost Summary (Million 2009 US$) ................ A-126 Table A-139 Integrated Scenario Interconnection Cost Summary (Million 2009 US$) ........ A-127

Caribbean Regional Electricity Generation, Interconnection, and Fuels Supply Strategy – Final Report A-6
A.1 BASE CASE SCENARIO DEVELOPMENT PLANS
Tables A-1 to A-33 present system analysis results for the Base Case Scenario by country. For each country (or island) results are presented in three tables: capacity balance, energy balance, and cost summary tables.
The capacity balance table for each country includes:
Peak Load in MW based on the country load forecast by year
Exports(+)/Imports(-) in MW
Net Capacity in MW for all existing units (capacity decreases if there is assumed unit retirement during the planning period)
Total capacity in MW for existing units
Required Capacity in MW calculated as peak demand increased by the reserve margin requirements (reserve margin requirement applies only to the local demand)
Existing System Surplus(+)/Deficit(-) in MW shows required unit additions (i.e., existing units minus required capacity)
New Capacity in MW shows capacity for each unit assumed to be built during the planning period
Total Capacity in MW shows capacity for all existing and new units
System Surplus(+)/Deficit(-) with Unit Additions in MW shows the overall system capacity surplus (+) or deficit (-) after unit additions
Reserve Margin in % shows the calculated percent of capacity above the peak load.
The energy balance table includes:
Energy in GWh based on the country load forecast by year
Exports(+)/Imports(-) in GWh
Generation in GWh by unit
Total Generation in GWh shows total generation for all existing and new units matching the required energy
The cost summary table includes:
Fuel and O&M costs in million 2009 US$ by unit including fuel and variable and fixed O&M costs
Production Costs in million 2009 US$ shows total system production costs (i.e., fuel and O&M costs)
Investment Costs in million 2009 US$ shows total cost for building new generation units
Total System Costs shows a sum of production and investment costs

Caribbean Regional Electricity Generation, Interconnection, and Fuels Supply Strategy – Final Report A-7
Tables A-34 and A-35 present total system production and investment cost results. The Production Cost Summary table also includes fuel savings associated with energy exports outside the modeled region. The costs for supplying those exports are included in the production and investment costs of the exporting country. The Investment Cost Summary table also includes the salvage value for all investments at the end of the planning period.
A.1.1 Antigua and Barbuda
Tables A-1 to A-3 present system analysis results for Antigua and Barbuda. For the Base Case, and other development cases, assumed committed system additions are six 5 MW Casada Gardens units during 2011-2013. Those unit additions would satisfy reserve margin requirements until 2019.
During 2020-2028 the system will require additional generation units. For the Base Case, new unit additions are assumed to be 10 MW medium speed diesel units using distillate oil. By 2028 the system will need another 30 MW (3 x 10 MW units) to meet the required capacity.
A.1.2 Barbados
Tables A-4 to A-6 present system analysis results for Barbados. For the Base Case, and other development cases, assumed committed system additions are nine 16 MW Trent units. The first six units were added during 2011-2013 while the next three units were added when required to match the load growth. All Trent unit additions would satisfy reserve margin requirements until 2025.
During 2026-2028 the Barbados system will require new capacity additions. For the Base Case, new additions are assumed to be 20 MW low speed diesel units using distillate oil. By 2028 the system will need another 40 MW (2 x 20 MW units) to meet the required capacity.
A.1.3 Dominica
Tables A-7 to A-9 present system analysis results for Dominica. Starting in 2012 Dominica will require new capacity additions. For the Base Case, new additions are assumed to be 5 MW medium speed diesel units using distillate oil. By 2028 the system will need another 15 MW (3 x 5 MW units) to meet the required capacity.
A.1.4 Dominican Republic
Tables A-10 to A-12 present system analysis results for Dominica. During the first years, during 2009-2011, installation of the assumed already committed hydro and wind resources will cover the load growth. Starting in 2012 the Dominican Republic will require new capacity additions. For the Base Case, new additions are assumed to be 300 MW combined cycle units using LNG with a few additions of 50 MW GT units to cover peaking generation. Results of the analysis show that by 2028 the system will need another 2,400 MW (8 x 300 MW CC units) and 100 MW of GT units.

Caribbean Regional Electricity Generation, Interconnection, and Fuels Supply Strategy – Final Report A-8
A.1.5 Grenada
Tables A-13 to A-15 present system analysis results for Grenada. Grenada will require new capacity addition starting in 2013. For the Base Case, new additions are assumed to be 10 MW medium speed diesel units using distillate oil. By 2028 the system will need another 70 MW (7 x 10 MW units) to cover projected load growth.
A.1.6 Haiti
Tables A-16 to A-18 present system analysis results for Haiti. Haiti’s power system is already short of generation resources in 2009. So we calculated that the already committed resources and additional 80 MW of low speed diesel units (4 x 20 MW) will need to be built during 2009 just to meet the existing demand. Starting in 2010 the system will need another 20 MW, or in some years 40 MW, in new units each year to cover projected load growth. By 2028 the system will need to install a total of 540 MW of diesel units.
A.1.7 Jamaica
Tables A-19 to A-21 present system analysis results for Jamaica. During the next four years, until 2014, we assumed that the planned resources, including the Kingston, Hunts Bay, Windalco, Jamalco, and Wigton units, will be built to cover the load growth. If those resources are built, Jamaica will require new capacity additions starting in 2015. For the Base Case, new additions are assumed to be 100 MW conventional coal units using imported coal. Results of the analysis show that by 2028 the system will need another 1,100 MW (11 x 100 MW units) to cover projected load growth.
A.1.8 St. Kitts and Nevis
Tables A-22 to A-24 present system analysis results for St. Kitts. Starting in 2012 St. Kitts will require new capacity additions. For the Base Case, new additions are assumed to be 5 MW medium speed diesel units using distillate oil. By 2028 the system will need another 35 MW (7 x 5 MW units) to cover projected load growth.
Tables A-25 to A-27 present system analysis results for Nevis. Starting in 2011 Nevis will require new capacity additions. For the Base Case, new additions are assumed to be 5 MW medium speed diesel units using distillate oil. By 2028 the system will need another 25 MW (5 x 5 MW units) to cover projected load growth.
A.1.9 St. Lucia
Tables A-28 to A-30 present system analysis results for St. Lucia. Starting in 2010 St. Lucia will require new capacity additions. For the Base Case, new additions are assumed to be 20 MW low speed diesel units using distillate oil. By 2028 the system will need another 80 MW (4 x 20 MW units) to meet the required capacity.

Caribbean Regional Electricity Generation, Interconnection, and Fuels Supply Strategy – Final Report A-9
A.1.10 St. Vincent and Grenadines
Tables A-31 to A-33 present system analysis results for St. Vincent and Grenadines. St. Vincent and Grenadines will require new capacity additions starting in 2017. For the Base Case, new additions are assumed to be 10 MW medium speed diesel units using distillate oil. By 2028 the system will need another 70 MW (7 x 10 MW units) to cover projected load growth.
A.1.11 Total System Costs
Tables A-34 to A-35 present total system production and investment costs for the Base Case. The Base Case assumes no interconnection among islands and thus shows no fuel savings associated for energy exports or interconnection costs.

Caribbean Regional Electricity Generation, Interconnection, and Fuels Supply Strategy – Final Report A-10
Table A-1 Antigua and Barbuda Base Case Capacity Balance
Year 2009 2010 2011 2012 2013 2014 2015 2016 2017 2018 2019 2020 2021 2022 2023 2024 2025 2026 2027 2028
Peak Load (MW) 54 57 60 63 65 67 69 71 73 75 77 80 82 85 87 90 92 95 98 101Exports(+)/Imports(-) (MW)
Existing Capacity (MW)APC (Pant) 15 15 15 15 15 15 15 15 15 15 15 15 15 15 15 15 15 15 15 15
APC Blk Pine 26 26 26 26 26 26 26 26 26 26 26 26 26 26 26 26 26 26 26 26Baker 4 4 4 4 4 4 4 4 4 4 4 4 4 4 4 4 4 4 4 4
APC Jt Vent 17 17 17 17 17 17 17 17 17 17 17 17 17 17 17 17 17 17 17 17Victor 8 8 8 8 8 8 8 8 8 8 8 8 8 8 8 8 8 8 8 8WIOC 0 0 0 0 0 0 0 0 0 0 0 0 0 0 0 0 0 0 0 0
Aggreko Rental 13 13 13 13 0 0 0 0 0 0 0 0 0 0 0 0 0 0 0 0Barbuda 7 7 7 7 7 7 7 7 7 7 7 7 7 7 7 7 7 7 7 7
Total Existing (MW) 90 90 90 90 77 77 77 77 77 77 77 77 77 77 77 77 77 77 77 77
Required Capacity (MW) 73 77 81 85 88 90 93 96 99 102 104 108 111 114 118 121 125 128 132 136Existing System Surplus(+)/Deficit(-) (MW) 17 13 9 5 -10 -13 -16 -19 -21 -24 -27 -31 -34 -37 -40 -44 -47 -51 -55 -59
New Capacity (MW)Casada Gardens 0 0 10 20 30 30 30 30 30 30 30 30 30 30 30 30 30 30 30 30
10 MW CFB 0 0 0 0 0 0 0 0 0 0 0 0 0 0 0 0 0 0 0 010 MW MSD 0 0 0 0 0 0 0 0 0 0 0 10 10 10 20 20 20 30 30 30
Wind 0 0 0 0 0 0 0 0 0 0 0 0 0 0 0 0 0 0 0 0
Total Capacity (MW) 90 90 100 110 107 107 107 107 107 107 107 117 117 117 127 127 127 137 137 137
System Surplus(+)/Deficit(-) with Unit Additions (MW) 17 13 19 25 20 17 14 11 9 6 3 9 6 3 10 6 3 9 5 1
Reserve Margin (%) 66% 58% 67% 75% 65% 60.5% 55.8% 51.2% 46.8% 42.6% 38.5% 46.9% 42.6% 38.5% 45.9% 41.8% 37.8% 44.4% 40.3% 36.3%

Caribbean Regional Electricity Generation, Interconnection, and Fuels Supply Strategy – Final Report A-11
Table A-2 Antigua and Barbuda Base Case Energy Balance
Year 2009 2010 2011 2012 2013 2014 2015 2016 2017 2018 2019 2020 2021 2022 2023 2024 2025 2026 2027 2028
Energy (GWh) 318 315 312 410 422 434 447 461 475 489 503 519 534 550 567 583 600 618 636 654
Generation (GWh)
APC (Pant) 49 48 43 50 52 53 55 57 58 60 62 58 60 61 58 60 61 58 60 62
APC Blk Pine 101 100 88 104 107 110 114 117 121 124 128 120 123 127 120 123 127 121 124 128
Baker 13 13 11 13 14 14 15 15 16 16 16 15 16 16 15 16 16 16 16 16
APC Jt Vent 66 65 58 68 70 72 74 77 79 81 84 78 81 83 78 81 83 79 81 84
Victor 27 27 24 28 29 30 31 32 33 34 35 33 34 35 33 34 35 33 34 35
WIOC 0 0 0 0 0 0 0 0 0 0 0 0 0 0 0 0 0 0 0 0
Aggreko Rental 38 37 33 39 0 0 0 0 0 0 0 0 0 0 0 0 0 0 0 0
Barbuda 24 24 21 25 26 27 27 28 29 30 31 29 30 31 29 30 31 29 30 31
Casada Gardens 0 0 34 80 124 128 131 135 139 144 148 139 143 147 139 143 147 139 144 148
10 MW CFB 0 0 0 0 0 0 0 0 0 0 0 0 0 0 0 0 0 0 0 0
10 MW MSD 0 0 0 0 0 0 0 0 0 0 0 47 49 50 95 98 100 143 147 152
Wind 0 0 0 0 0 0 0 0 0 0 0 0 0 0 0 0 0 0 0 0
Total Generation (GWh) 318 315 312 410 422 434 447 461 475 489 503 519 534 550 567 583 600 618 636 654
Table A-3 Antigua and Barbuda Base Case Cost Summary (Million 2009 US$)
Year 2009 2010 2011 2012 2013 2014 2015 2016 2017 2018 2019 2020 2021 2022 2023 2024 2025 2026 2027 2028Fuel and O&M Costs
APC (Pant) 7.8 8.0 7.6 9.7 10.2 11.0 11.6 12.1 12.4 12.8 13.3 12.5 13.0 13.5 12.7 13.2 13.8 13.2 13.8 14.5APC Blk Pine 14.4 14.7 14.0 17.9 18.8 20.2 21.4 22.2 22.9 23.6 24.5 23.1 23.9 24.8 23.4 24.4 25.3 24.3 25.4 26.6
Baker 2.1 2.1 2.0 2.6 2.7 2.9 3.1 3.2 3.3 3.4 3.5 3.3 3.5 3.6 3.4 3.5 3.7 3.5 3.7 3.9APC Jt Vent 9.3 9.4 9.0 11.5 12.1 13.0 13.8 14.4 14.8 15.3 15.8 14.9 15.5 16.0 15.1 15.8 16.4 15.8 16.4 17.3
Victor 4.2 4.3 4.1 5.2 5.5 5.9 6.2 6.5 6.7 6.9 7.1 6.7 7.0 7.2 6.8 7.1 7.4 7.1 7.4 7.8WIOC 0.0 0.0 0.0 0.0 0.0 0.0 0.0 0.0 0.0 0.0 0.0 0.0 0.0 0.0 0.0 0.0 0.0 0.0 0.0 0.0
Aggreko Rental 6.8 7.0 6.6 8.5 0.0 0.0 0.0 0.0 0.0 0.0 0.0 0.0 0.0 0.0 0.0 0.0 0.0 0.0 0.0 0.0Barbuda 3.9 3.9 3.8 4.8 5.1 5.4 5.8 6.0 6.2 6.4 6.6 6.2 6.4 6.7 6.3 6.6 6.8 6.6 6.8 7.2
Casada Gardens 0.0 0.0 5.3 13.5 21.4 23.0 24.4 25.3 26.1 27.0 27.9 26.3 27.3 28.3 26.7 27.8 28.9 27.8 29.0 30.410 MW CFB 0.0 0.0 0.0 0.0 0.0 0.0 0.0 0.0 0.0 0.0 0.0 0.0 0.0 0.0 0.0 0.0 0.0 0.0 0.0 0.010 MW MSD 0.0 0.0 0.0 0.0 0.0 0.0 0.0 0.0 0.0 0.0 0.0 8.8 9.1 9.4 17.8 18.5 19.2 27.7 28.9 30.4
Wind 0.0 0.0 0.0 0.0 0.0 0.0 0.0 0.0 0.0 0.0 0.0 0.0 0.0 0.0 0.0 0.0 0.0 0.0 0.0 0.0Production Cost (million $) 48 49 52 74 76 81 86 90 92 95 99 102 106 110 112 117 122 126 131 138
Investment Costs (million $) 0 0 4.5 4.5 4.5 0 0 0 0 0 0 4.5 0 0 4.5 0 0 4.5 0 0
Total System Costs (million $) 48 49 57 78 80 81 86 90 92 95 99 106 106 110 117 117 122 131 131 138

Caribbean Regional Electricity Generation, Interconnection, and Fuels Supply Strategy – Final Report A-12
Table A-4 Barbados Base Case Capacity Balance
Year 2009 2010 2011 2012 2013 2014 2015 2016 2017 2018 2019 2020 2021 2022 2023 2024 2025 2026 2027 2028
Peak Load (MW) 170 176 182 188 195 201 208 216 223 231 239 247 256 265 274 284 294 304 314 325Exports(+)/Imports(-) (MW)
Existing Capacity (MW)Spring Garden 25 25 25 25 25 25 25 25 25 25 25 25 25 25 25 25 25 25 25 25Spring Garden 13 13 13 13 13 13 13 13 13 13 13 13 13 13 13 13 13 13 13 13Spring Garden 13 13 13 13 13 13 13 13 13 13 13 13 13 13 13 13 13 13 13 13Spring Garden 61 61 61 61 61 61 61 61 61 61 61 61 61 61 61 61 61 61 61 61Spring Garden 40 40 40 40 40 40 40 40 40 40 40 40 40 40 40 40 40 40 40 40
Sewall 86 86 86 86 86 86 86 86 86 86 86 86 86 86 86 86 86 86 86 86
Total Existing (MW) 238 238 238 238 238 238 238 238 238 238 238 238 238 238 238 238 238 238 238 238
Required Capacity (MW) 221 228 236 245 253 262 271 280 290 300 311 322 333 344 356 369 382 395 409 423Existing System Surplus(+)/Deficit(-) (MW) 18 10 2 -6 -15 -23 -33 -42 -52 -62 -72 -83 -94 -106 -118 -130 -143 -157 -170 -185
New Capacity (MW)Trent 0 0 32 64 80 80 80 80 80 80 80 96 96 112 128 144 144 144 144 144
20 MW LSD 0 0 0 0 0 0 0 0 0 0 0 0 0 0 0 0 0 20 40 400 0 0 0 0 0 0 0 0 0 0 0 0 0 0 0 0 0 0 0 0
Wind 0 0 0 0 0 0 0 0 0 0 0 0 0 0 0 0 0 0 0 0
Total Capacity (MW) 238 238 270 302 318 318 318 318 318 318 318 334 334 350 366 382 382 402 422 422
System Surplus(+)/Deficit(-) with Unit Additions (MW) 18 10 34 58 65 57 47 38 28 18 8 13 2 6 10 14 1 7 14 -1
Reserve Margin (%) 40% 36% 49% 61% 64% 58.1% 52.8% 47.6% 42.6% 37.8% 33.2% 35.2% 30.6% 32.3% 33.6% 34.8% 30.2% 32.4% 34.3% 29.8%

Caribbean Regional Electricity Generation, Interconnection, and Fuels Supply Strategy – Final Report A-13
Table A-5 Barbados Base Case Energy Balance
Year 2009 2010 2011 2012 2013 2014 2015 2016 2017 2018 2019 2020 2021 2022 2023 2024 2025 2026 2027 2028
Energy (GWh) 1,039 1,073 1,107 1,143 1,180 1,218 1,258 1,298 1,340 1,384 1,428 1,475 1,522 1,572 1,622 1,675 1,729 1,785 1,843 1,902
Exports(+)/Imports(-) (GWh)
Generation (GWh)
Spring Garden 107 120 106 96 94 97 100 103 107 110 114 111 114 112 109 107 111 108 105 108
Spring Garden 57 63 56 51 49 51 53 54 56 58 60 58 60 59 58 57 59 57 55 57
Spring Garden 57 63 56 51 49 51 53 54 56 58 60 58 60 59 58 57 59 57 55 57
Spring Garden 280 314 278 252 245 253 261 270 279 288 297 289 299 292 286 281 290 282 275 283
Spring Garden 227 162 141 126 120 124 128 132 136 141 145 143 147 144 141 139 143 139 135 141
Sewall 312 349 308 278 270 279 287 297 306 316 326 318 328 320 314 309 318 309 301 310
Trent 0 0 161 290 353 364 375 388 400 413 426 498 514 586 657 725 749 726 707 730
20 MW LSD 0 0 0 0 0 0 0 0 0 0 0 0 0 0 0 0 0 107 209 215
Wind 0 0 0 0 0 0 0 0 0 0 0 0 0 0 0 0 0 0 0 0
Total Generation (GWh) 1039 1073 1107 1143 1180 1218 1258 1298 1340 1384 1428 1475 1522 1572 1622 1675 1729 1785 1843 1902
Table A-6 Barbados Base Case Cost Summary (Million 2009 US$)
Year 2009 2010 2011 2012 2013 2014 2015 2016 2017 2018 2019 2020 2021 2022 2023 2024 2025 2026 2027 2028Fuel and O&M Costs
Spring Garden 16.4 18.9 18.0 17.8 17.8 19.1 20.3 21.1 21.8 22.6 23.5 23.0 23.9 23.6 23.0 22.9 23.9 23.5 23.2 24.4Spring Garden 8.7 10.0 9.5 9.4 9.4 10.1 10.7 11.2 11.5 11.9 12.4 12.1 12.6 12.4 12.2 12.1 12.6 12.4 12.2 12.9Spring Garden 8.7 10.0 9.5 9.4 9.4 10.1 10.7 11.2 11.5 11.9 12.4 12.1 12.6 12.4 12.2 12.1 12.6 12.4 12.2 12.9Spring Garden 40.1 46.1 43.8 43.3 43.3 46.6 49.6 51.6 53.3 55.2 57.3 56.1 58.2 57.5 56.2 56.0 58.4 57.2 56.5 59.6Spring Garden 26.3 30.2 28.7 28.4 28.4 30.6 32.5 33.8 35.0 36.2 37.6 36.8 38.2 37.7 36.9 36.7 38.3 37.6 37.1 39.1
Sewall 62.7 72.3 68.7 67.9 67.9 73.1 77.9 81.1 83.9 86.9 90.4 88.3 91.8 90.6 88.6 88.2 92.0 90.2 89.1 94.0Trent 0.0 0.0 23.6 46.7 58.4 62.8 66.8 69.5 71.8 74.3 77.2 90.6 94.1 108.4 121.1 135.6 141.5 138.7 137.1 144.5
20 MW LSD 0.0 0.0 0.0 0.0 0.0 0.0 0.0 0.0 0.0 0.0 0.0 0.0 0.0 0.0 0.0 0.0 0.0 19.8 39.1 41.2Wind 0.0 0.0 0.0 0.0 0.0 0.0 0.0 0.0 0.0 0.0 0.0 0.0 0.0 0.0 0.0 0.0 0.0 0.0 0.0 0.0
Production Cost (million $) 163 188 202 223 234 252 268 279 289 299 311 319 331 343 350 364 379 392 407 429
Investment Costs (million $) 0 0 14.4 14.4 7.2 0 0 0 0 0 0 7.2 0 7.2 7.2 7.2 0 9.6 9.6 0
Total System Costs (million $) 163 188 216 237 242 252 268 279 289 299 311 326 331 350 357 371 379 401 416 429

Caribbean Regional Electricity Generation, Interconnection, and Fuels Supply Strategy – Final Report A-14
Table A-7 Dominica Base Case Capacity Balance
Year 2009 2010 2011 2012 2013 2014 2015 2016 2017 2018 2019 2020 2021 2022 2023 2024 2025 2026 2027 2028
Peak Load (MW) 15 15 16 16 17 17 18 18 19 19 20 20 21 21 22 22 23 24 24 25Exports(+)/Imports(-) (MW)
Existing Capacity (MW)Hydro – three plants 5 5 5 5 5 5 5 5 5 5 5 5 5 5 5 5 5 5 5 5Thermal – two plants 16 16 16 16 16 16 16 16 16 16 16 16 16 16 16 16 16 16 16 16
Total Existing (MW) 21 21 21 21 21 21 21 21 21 21 21 21 21 21 21 21 21 21 21 21
Required Capacity (MW) 20 21 21 22 23 23 24 24 25 26 26 27 28 29 29 30 31 32 33 34Existing System Surplus(+)/Deficit(-) (MW) 1 0 0 -1 -2 -2 -3 -3 -4 -5 -5 -6 -7 -8 -8 -9 -10 -11 -12 -13
New Capacity (MW)5 MW MSD 0 0 0 5 5 5 5 5 5 5 5 10 10 10 10 10 10 15 15 15
Geo Non-Export 0 0 0 0 0 0 0 0 0 0 0 0 0 0 0 0 0 0 0 0Geo Export 0 0 0 0 0 0 0 0 0 0 0 0 0 0 0 0 0 0 0 0
Wind 0 0 0 0 0 0 0 0 0 0 0 0 0 0 0 0 0 0 0 0
Total Capacity (MW) 21 21 21 26 26 26 26 26 26 26 26 31 31 31 31 31 31 36 36 36
System Surplus(+)/Deficit(-) with Unit Additions (MW) 1 0 0 4 3 3 2 2 1 0 0 4 3 2 2 1 0 4 3 2
Reserve Margin (%) 40% 36% 32% 60% 55% 51.4% 47.4% 43.6% 39.8% 36.2% 32.6% 54.0% 50.0% 46.1% 42.3% 38.6% 35.0% 52.6% 48.7% 44.8%

Caribbean Regional Electricity Generation, Interconnection, and Fuels Supply Strategy – Final Report A-15
Table A-8 Dominica Base Case Energy Balance
Year 2009 2010 2011 2012 2013 2014 2015 2016 2017 2018 2019 2020 2021 2022 2023 2024 2025 2026 2027 2028
Energy (GWh) 87 89 91 94 96 99 101 104 106 109 112 114 117 120 123 126 129 133 136 139
Exports(+)/Imports(-) (GWh)
Generation (GWh)
Hydro – three plants 22 22 22 22 22 22 22 22 22 22 22 22 22 22 22 22 22 22 22 22
Thermal – two plants 65 67 70 50 52 53 55 57 59 61 63 50 51 53 54 56 58 48 50 51
5 MW MSD 0 0 0 22 22 23 24 25 25 26 27 43 44 46 47 48 50 62 64 66
Geo Non-Export 0 0 0 0 0 0 0 0 0 0 0 0 0 0 0 0 0 0 0 0
Geo Export 0 0 0 0 0 0 0 0 0 0 0 0 0 0 0 0 0 0 0 0
Wind 0 0 0 0 0 0 0 0 0 0 0 0 0 0 0 0 0 0 0 0
Total Generation (GWh) 87 89 91 94 96 99 101 104 106 109 112 114 117 120 123 126 129 133 136 139
Table A-9 Dominica Base Case Cost Summary (Million 2009 US$)
Year 2009 2010 2011 2012 2013 2014 2015 2016 2017 2018 2019 2020 2021 2022 2023 2024 2025 2026 2027 2028Fuel and O&M Costs
Hydro – three plants 0.6 0.6 0.6 0.6 0.6 0.6 0.6 0.6 0.6 0.6 0.6 0.6 0.6 0.6 0.6 0.6 0.6 0.6 0.6 0.6Thermal – two plants 12.1 12.8 14.1 11.2 11.9 12.8 13.5 14.1 14.5 15.0 15.6 12.5 13.0 13.5 13.8 14.4 15.0 12.8 13.3 14.0
5 MW MSD 0.0 0.0 0.0 3.6 3.9 4.2 4.4 4.6 4.7 4.9 5.1 8.2 8.5 8.8 9.0 9.4 9.8 12.5 13.0 13.7Geo Non-Export 0.0 0.0 0.0 0.0 0.0 0.0 0.0 0.0 0.0 0.0 0.0 0.0 0.0 0.0 0.0 0.0 0.0 0.0 0.0 0.0
Geo Export 0.0 0.0 0.0 0.0 0.0 0.0 0.0 0.0 0.0 0.0 0.0 0.0 0.0 0.0 0.0 0.0 0.0 0.0 0.0 0.0Wind 0.0 0.0 0.0 0.0 0.0 0.0 0.0 0.0 0.0 0.0 0.0 0.0 0.0 0.0 0.0 0.0 0.0 0.0 0.0 0.0
Production Cost (million $) 13 13 15 15 16 17 19 19 20 21 21 21 22 23 23 24 25 26 27 28
Investment Costs (million $) 0.0 0.0 0.0 2.3 0.0 0.0 0.0 0.0 0.0 0.0 0.0 2.3 0.0 0.0 0.0 0.0 0.0 2.3 0.0 0.0
Total System Costs (million $) 13 13 15 18 16 17 19 19 20 21 21 24 22 23 23 24 25 28 27 28

Caribbean Regional Electricity Generation, Interconnection, and Fuels Supply Strategy – Final Report A-16
Table A-10 Dominican Republic Base Case Capacity Balance
Year Inputs 2009 2010 2011 2012 2013 2014 2015 2016 2017 2018 2019 2020 2021 2022 2023 2024 2025 2026 2027 2028
Peak Load (MW) 2,353 2,447 2,544 2,640 2,727 2,803 2,896 2,992 3,091 3,194 3,300 3,409 3,522 3,638 3,758 3,882 4,010 4,143 4,280 4,421Exports(+)/Imports(-) (MW)
Existing Capacity (MW)Andres 290 290 290 290 290 290 290 290 290 290 290 290 290 290 290 290 290 290 290 290 290
Itabo 128 128 128 128 128 128 128 128 128 128 128 128 128 128 128 128 128 128 128 128 128Itabo 101 101 101 101 101 101 101 101 101 101 101 101 101 101 101 101 101 101 101 101 101
Los Mina 118 236 236 236 236 236 236 236 236 236 236 236 236 236 236 236 236 236 236 236 236Itabo 35 35 35 35 35 35 35 35 35 35 35 35 35 35 35 35 35 35 35 35 35
Higuamo 0 0 0 0 0 0 0 0 0 0 0 0 0 0 0 0 0 0 0 0 0Haina 50 100 100 100 100 100 100 100 100 100 100 100 100 100 100 100 100 100 100 100 100Haina 72 72 72 72 72 72 72 72 72 72 72 72 72 72 72 72 72 72 72 72 72
San Pedro 33 33 33 33 33 33 33 33 33 33 33 33 33 33 33 33 33 33 33 33 33Puerto Plata 28 28 28 28 28 28 28 28 28 28 28 28 28 28 28 28 28 28 28 28 28Puerto Plata 39 39 39 39 39 39 39 39 39 39 39 39 39 39 39 39 39 39 39 39 39
Haina 100 100 100 100 100 100 100 100 100 100 100 100 100 100 100 100 100 100 100 100 100Barahona 46 46 46 46 46 46 46 46 46 46 46 46 46 46 46 46 46 46 46 46 46
Sultana DE 11 102 102 102 102 102 102 102 102 102 102 102 102 102 102 102 102 102 102 102 102CESPM. 100 300 300 300 300 300 300 300 300 300 300 300 300 300 300 300 300 300 300 300 300
San Felipe 185 185 185 185 185 185 185 185 185 185 185 185 185 185 185 185 185 185 185 185 185Palamara 107 107 107 107 107 107 107 107 107 107 107 107 107 107 107 107 107 107 107 107 107La Vega 88 88 88 88 88 88 88 88 88 88 88 88 88 88 88 88 88 88 88 88 88
CEPP 17 17 17 17 17 17 17 17 17 17 17 17 17 17 17 17 17 17 17 17 17CEPP 50 50 50 50 50 50 50 50 50 50 50 50 50 50 50 50 50 50 50 50 50
Seaboard 43 43 43 43 43 43 43 43 43 43 43 43 43 43 43 43 43 43 43 43 43Seaboard 73 73 73 73 73 73 73 73 73 73 73 73 73 73 73 73 73 73 73 73 73
Monte Rio 100 100 100 100 100 100 100 100 100 100 100 100 100 100 100 100 100 100 100 100 100Metaldom 42 42 42 42 42 42 42 42 42 42 42 42 42 42 42 42 42 42 42 42 42
Laesa 32 32 32 32 32 32 32 32 32 32 32 32 32 32 32 32 32 32 32 32 32Maxon 30 30 30 30 30 30 30 30 30 30 30 30 30 30 30 30 30 30 30 30 30
Falconbridge 12 36 36 36 36 36 36 36 36 36 36 36 36 36 36 36 36 36 36 36 36Reservoir Hydro 387 387 387 387 387 387 387 387 387 387 387 387 387 387 387 387 387 387 387 387 387
Non Reser Hydro 85 85 85 85 85 85 85 85 85 85 85 85 85 85 85 85 85 85 85 85 85
Total Existing (MW) 2,883 2,883 2,883 2,883 2,883 2,883 2,883 2,883 2,883 2,883 2,883 2,883 2,883 2,883 2,883 2,883 2,883 2,883 2,883 2,883
Required Capacity (MW) 2,941 3,059 3,180 3,300 3,409 3,504 3,620 3,740 3,864 3,993 4,125 4,261 4,402 4,547 4,698 4,853 5,013 5,179 5,350 5,526Existing System Surplus(+)/Deficit(-) (MW) -58 -176 -297 -417 -526 -621 -737 -857 -981 -1,110 -1,242 -1,378 -1,519 -1,664 -1,815 -1,970 -2,130 -2,296 -2,467 -2,643

Caribbean Regional Electricity Generation, Interconnection, and Fuels Supply Strategy – Final Report A-17
New Capacity (MW)Pinalto 50 50 50 50 50 50 50 50 50 50 50 50 50 50 50 50 50 50 50 50 50
Palomino 100 100 100 100 100 100 100 100 100 100 100 100 100 100 100 100 100 100 100 100 100Hatillo et al 17 0 17 17 17 17 17 17 17 17 17 17 17 17 17 17 17 17 17 17 17
Las Placetas 87 0 87 87 87 87 87 87 87 87 87 87 87 87 87 87 87 87 87 87 87Arbonito 45 0 0 45 45 45 45 45 45 45 45 45 45 45 45 45 45 45 45 45 45
Hondo Valle et al 57 0 0 0 57 57 57 57 57 57 57 57 57 57 57 57 57 57 57 57 57300 MW CC 300 0 0 0 300 300 300 600 600 600 900 900 1,200 1,200 1,200 1,500 1,500 1,800 2,100 2,100 2,400
300 MW ConvCoal 300 0 0 0 0 0 0 0 0 0 0 0 0 0 0 0 0 0 0 0 0Montecristi 305 0 0 0 0 0 0 0 0 0 0 0 0 0 0 0 0 0 0 0 0
Haltillo-Azua 305 0 0 0 0 0 0 0 0 0 0 0 0 0 0 0 0 0 0 0 050 MW GT 50 0 0 0 0 0 0 0 0 50 50 50 50 50 100 100 100 100 100 100 100
Montafongo,Bani,El Norte 50 0 100 100 100 100 100 100 100 100 100 100 100 100 100 100 100 100 100 100 100Wind 2 0 0 0 0 0 0 0 0 0 0 0 0 0 0 0 0 0 0 0 0
Total Capacity (MW) 3,033 3,137 3,182 3,539 3,539 3,539 3,839 3,839 3,889 4,189 4,189 4,489 4,489 4,539 4,839 4,839 5,139 5,439 5,439 5,739
System Surplus(+)/Deficit(-) with Unit Additions (MW) 92 78 2 239 130 35 219 99 25 196 64 228 87 -8 141 -14 126 260 89 213
Reserve Margin (%) 29% 28% 25% 34% 30% 26.3% 32.6% 28.3% 25.8% 31.1% 26.9% 31.7% 27.5% 24.8% 28.8% 24.6% 28.1% 31.3% 27.1% 29.8%

Caribbean Regional Electricity Generation, Interconnection, and Fuels Supply Strategy – Final Report A-18
Table A-11 Dominican Republic Base Case Energy Balance
Year Inputs 2009 2010 2011 2012 2013 2014 2015 2016 2017 2018 2019 2020 2021 2022 2023 2024 2025 2026 2027 2028
Energy (GWh) 12,638 13,142 13,663 14,179 14,646 15,054 15,554 16,070 16,601 17,154 17,724 18,309 18,914 19,539 20,184 20,851 21,539 22,251 22,986 23,745
Exports(+)/Imports(-) (GWh)
Generation (GWh)
Andres 1709 1476 1562 1390 1468 1534 1400 1460 1485 1369 1416 1329 1394 1431 1350 1388 1312 1253 1290 1238
Itabo 1004 820 866 770 803 834 759 789 805 747 784 733 753 772 731 774 751 732 775 765
Itabo 706 583 614 546 569 591 538 559 571 530 556 519 533 546 517 547 531 518 547 539
Los Mina 865 1013 1044 914 948 977 886 921 942 871 905 846 876 898 849 884 845 814 848 821
Itabo 73 164 171 153 158 164 149 155 160 148 156 146 150 154 145 154 149 145 153 152
Higuamo 0 0 0 0 0 0 0 0 0 0 0 0 0 0 0 0 0 0 0 0
Haina 362 410 428 383 399 413 375 390 403 373 391 365 376 385 364 384 372 362 382 375
Haina 267 284 296 263 274 283 257 267 276 256 268 250 257 263 249 263 254 247 261 256
San Pedro 123 138 144 129 134 139 126 131 136 126 132 123 126 129 123 129 125 122 128 126
Puerto Plata 103 116 121 108 112 116 106 110 113 105 110 103 106 108 103 108 105 102 107 106
Puerto Plata 146 163 170 152 159 164 149 155 160 149 156 145 149 153 145 153 148 144 152 149
Haina 237 465 483 431 446 460 419 435 449 417 436 409 420 431 408 431 418 407 429 423
Barahona 302 252 265 236 246 255 232 241 246 229 240 224 230 236 223 236 229 223 236 233
Sultana DE 487 363 370 321 330 338 305 317 326 302 315 294 301 309 292 307 297 288 302 294
CESPM. 1057 1257 1283 1116 1148 1176 1062 1103 1133 1051 1097 1023 1050 1075 1018 1072 1034 1004 1053 1030
San Felipe 515 771 795 701 724 745 676 702 723 671 701 656 674 690 653 690 667 649 683 671
Palamara 523 401 410 357 368 378 341 355 365 338 353 329 338 346 328 345 333 323 339 331
La Vega 425 328 335 292 302 309 280 290 299 277 289 269 277 283 268 282 273 264 278 271
CEPP 75 62 64 56 58 59 54 56 57 53 56 52 53 54 52 54 52 51 54 52
CEPP 226 188 193 169 175 179 162 169 174 161 168 157 161 165 156 165 159 154 162 159
Seaboard 202 161 165 144 149 153 138 144 148 137 143 134 137 140 133 140 135 131 138 135
Seaboard 369 275 281 244 252 258 233 242 249 231 241 224 230 236 223 235 227 220 231 225
Monte Rio 516 377 383 333 343 351 317 329 338 313 327 305 313 320 303 319 308 298 313 305
Metaldom 202 157 161 140 145 149 134 140 144 133 139 130 133 136 129 136 131 127 134 131
Laesa 116 123 128 114 119 123 111 116 120 111 116 108 111 114 108 114 110 107 113 111
Maxon 75 118 122 108 111 115 104 108 111 103 108 101 104 107 101 106 103 100 106 104
Falconbridge 129 144 150 134 139 144 131 136 141 130 137 127 131 134 127 134 130 126 133 131
Reservoir Hydro 1255 1255 1255 1255 1255 1255 1255 1255 1255 1255 1255 1255 1255 1255 1255 1255 1255 1255 1255 1255
Non Reser Hydro 276 276 276 276 276 276 276 276 276 276 276 276 276 276 276 276 276 276 276 276

Caribbean Regional Electricity Generation, Interconnection, and Fuels Supply Strategy – Final Report A-19
Pinalto 143 143 143 143 143 143 143 143 143 143 143 143 143 143 143 143 143 143 143 143
Palomino 150 150 150 150 150 150 150 150 150 150 150 150 150 150 150 150 150 150 150 150
Hatillo et al 0 123 123 123 123 123 123 123 123 123 123 123 123 123 123 123 123 123 123 123
Las Placetas 0 331 331 331 331 331 331 331 331 331 331 331 331 331 331 331 331 331 331 331
Arbonito 0 0 125 125 125 125 125 125 125 125 125 125 125 125 125 125 125 125 125 125
Hondo Valle et al 0 0 0 219 219 219 219 219 219 219 219 219 219 219 219 219 219 219 219 219
300 MW CC 0 0 0 1597 1690 1769 3231 3371 3427 4735 4893 6129 6441 6614 7799 8000 9060 10075 10364 11352
300 MW ConvCoal 0 0 0 0 0 0 0 0 0 0 0 0 0 0 0 0 0 0 0 0
Montecristi 0 0 0 0 0 0 0 0 0 0 0 0 0 0 0 0 0 0 0 0
Haltillo-Azua 0 0 0 0 0 0 0 0 0 0 0 0 0 0 0 0 0 0 0 0
50 MW GT 0 0 0 0 0 0 0 0 226 208 216 202 211 433 409 423 402 385 399 384
Montafongo,Bani,El Norte 0 256 256 256 256 256 256 256 256 256 256 256 256 256 256 256 256 256 256 256
Wind 0 0 0 0 0 0 0 0 0 0 0 0 0 0 0 0 0 0 0 0
Total Generation (GWh) 12638 13142 13663 14179 14646 15054 15554 16070 16601 17154 17724 18309 18914 19539 20184 20851 21539 22251 22986 23745

Caribbean Regional Electricity Generation, Interconnection, and Fuels Supply Strategy – Final Report A-20
Table A-12 Dominican Republic Base Case Cost Summary (Million 2009 US$)
Year 2009 2010 2011 2012 2013 2014 2015 2016 2017 2018 2019 2020 2021 2022 2023 2024 2025 2026 2027 2028Fuel and O&M Costs
Andres 140.2 123.0 127.0 114.0 117.3 121.0 111.0 115.5 118.0 110.6 114.8 106.4 108.4 111.5 105.9 111.9 108.7 106.4 111.5 109.1Itabo 58.8 47.3 49.4 44.7 46.3 48.1 44.2 46.1 46.9 43.9 45.4 42.2 43.3 44.6 42.3 44.3 42.8 41.6 43.2 42.0Itabo 45.0 36.8 38.3 34.7 35.9 37.2 34.3 35.7 36.4 34.1 35.2 32.8 33.6 34.6 32.8 34.4 33.2 32.3 33.5 32.6
Los Mina 114.0 133.6 134.7 118.4 119.9 122.3 111.1 115.5 118.6 111.3 116.2 106.9 107.7 110.7 105.1 112.7 110.6 109.0 115.6 114.0Itabo 16.0 36.4 40.7 40.0 42.6 46.0 43.3 45.4 46.9 43.8 46.2 43.5 45.0 46.6 44.0 47.2 46.3 45.6 48.7 49.2
Higuamo 0.0 0.0 0.0 0.0 0.0 0.0 0.0 0.0 0.0 0.0 0.0 0.0 0.0 0.0 0.0 0.0 0.0 0.0 0.0 0.0Haina 45.0 80.5 91.5 90.5 98.3 106.5 100.0 104.7 108.5 101.2 106.5 99.2 103.0 106.4 100.7 107.0 104.7 102.7 109.9 109.7Haina 32.1 53.4 60.4 59.6 64.6 69.8 65.5 68.6 71.0 66.2 69.7 64.9 67.4 69.5 65.9 69.9 68.4 67.1 71.7 71.5
San Pedro 15.2 26.9 30.6 30.3 32.9 35.7 33.5 35.1 36.4 33.9 35.7 33.2 34.5 35.7 33.8 35.9 35.1 34.4 36.9 36.8Puerto Plata 12.7 22.5 25.6 25.4 27.5 29.8 28.0 29.4 30.4 28.4 29.9 27.8 28.9 29.8 28.2 30.0 29.4 28.8 30.8 30.8Puerto Plata 17.9 31.8 36.2 35.8 38.9 42.2 39.6 41.5 43.0 40.1 42.2 39.3 40.8 42.1 39.9 42.4 41.5 40.7 43.6 43.5
Haina 47.1 94.6 105.6 103.3 109.9 118.6 111.5 116.9 120.8 112.7 118.9 111.9 115.7 119.7 113.0 121.1 118.8 116.9 124.9 126.1Barahona 20.3 16.7 17.5 15.8 16.3 16.9 15.6 16.2 16.5 15.5 16.0 14.9 15.3 15.7 14.9 15.6 15.1 14.7 15.2 14.8
Sultana DE 43.2 50.3 55.4 53.2 56.9 60.7 56.7 59.3 61.0 57.1 59.7 55.7 57.6 59.3 56.3 59.5 58.1 56.9 60.3 59.8CESPM. 145.0 175.9 192.3 184.0 194.4 207.4 194.1 203.0 208.8 195.1 204.6 192.2 198.3 204.7 193.7 206.2 201.6 197.9 209.9 210.0
San Felipe 88.6 133.4 147.2 142.7 151.1 162.1 152.3 159.4 164.2 153.5 161.4 151.9 156.9 162.0 153.3 163.6 160.3 157.6 167.7 168.6Palamara 47.7 57.9 64.1 62.0 66.4 71.1 66.5 69.5 71.6 67.0 70.1 65.4 67.7 69.8 66.2 70.0 68.4 67.0 71.2 70.7La Vega 39.0 47.6 52.8 51.0 54.7 58.5 54.8 57.2 59.0 55.2 57.8 53.9 55.8 57.5 54.5 57.7 56.3 55.2 58.7 58.2
CEPP 7.4 9.6 10.7 10.4 11.2 12.0 11.2 11.8 12.1 11.3 11.9 11.1 11.5 11.8 11.2 11.9 11.6 11.4 12.1 12.0CEPP 22.3 29.1 32.4 31.5 33.9 36.4 34.1 35.6 36.7 34.3 36.0 33.6 34.8 35.9 34.0 36.0 35.2 34.5 36.7 36.5
Seaboard 19.2 24.2 26.9 26.0 27.9 29.9 28.0 29.3 30.2 28.2 29.6 27.6 28.6 29.5 27.9 29.6 28.9 28.3 30.1 29.9Seaboard 32.7 38.7 42.7 41.2 44.1 47.2 44.1 46.1 47.5 44.4 46.5 43.4 44.9 46.2 43.9 46.4 45.3 44.4 47.1 46.7
Monte Rio 44.6 51.7 57.0 54.9 58.7 62.7 58.6 61.2 63.1 59.0 61.7 57.6 59.5 61.4 58.2 61.6 60.1 58.8 62.4 62.0Metaldom 18.7 23.0 25.5 24.7 26.5 28.3 26.5 27.7 28.6 26.7 28.0 26.1 27.0 27.9 26.4 28.0 27.3 26.8 28.4 28.2
Laesa 14.1 23.4 26.4 26.0 28.2 30.4 28.6 29.9 31.0 28.9 30.4 28.3 29.4 30.3 28.7 30.5 29.9 29.3 31.3 31.2Maxon 13.5 21.3 23.5 22.9 24.2 26.0 24.5 25.6 26.4 24.7 25.9 24.4 25.2 26.1 24.7 26.3 25.8 25.4 27.0 27.2
Falconbridge 16.0 28.1 31.8 31.4 34.1 36.9 34.6 36.3 37.6 35.1 36.9 34.4 35.7 36.8 34.9 37.0 36.2 35.6 38.0 37.9Reservoir Hydro 21.8 21.8 21.8 21.8 21.8 21.8 21.8 21.8 21.8 21.8 21.8 21.8 21.8 21.8 21.8 21.8 21.8 21.8 21.8 21.8
Non Reser Hydro 4.8 4.8 4.8 4.8 4.8 4.8 4.8 4.8 4.8 4.8 4.8 4.8 4.8 4.8 4.8 4.8 4.8 4.8 4.8 4.8
Pinalto 2.1 2.1 2.1 2.1 2.1 2.1 2.1 2.1 2.1 2.1 2.1 2.1 2.1 2.1 2.1 2.1 2.1 2.1 2.1 2.1Palomino 3.7 3.7 3.7 3.7 3.7 3.7 3.7 3.7 3.7 3.7 3.7 3.7 3.7 3.7 3.7 3.7 3.7 3.7 3.7 3.7
Hatillo et al 0.0 0.9 0.9 0.9 0.9 0.9 0.9 0.9 0.9 0.9 0.9 0.9 0.9 0.9 0.9 0.9 0.9 0.9 0.9 0.9Las Placetas 0.0 3.8 3.8 3.8 3.8 3.8 3.8 3.8 3.8 3.8 3.8 3.8 3.8 3.8 3.8 3.8 3.8 3.8 3.8 3.8
Arbonito 0.0 0.0 1.8 1.8 1.8 1.8 1.8 1.8 1.8 1.8 1.8 1.8 1.8 1.8 1.8 1.8 1.8 1.8 1.8 1.8Hondo Valle et al 0.0 0.0 0.0 2.5 2.5 2.5 2.5 2.5 2.5 2.5 2.5 2.5 2.5 2.5 2.5 2.5 2.5 2.5 2.5 2.5
300 MW CC 0.0 0.0 0.0 117.9 121.6 125.7 230.5 240.1 245.1 344.2 357.4 441.2 450.3 463.3 549.7 580.4 675.8 770.3 807.3 901.3300 MW ConvCoal 0.0 0.0 0.0 0.0 0.0 0.0 0.0 0.0 0.0 0.0 0.0 0.0 0.0 0.0 0.0 0.0 0.0 0.0 0.0 0.0
Montecristi 0.0 0.0 0.0 0.0 0.0 0.0 0.0 0.0 0.0 0.0 0.0 0.0 0.0 0.0 0.0 0.0 0.0 0.0 0.0 0.0Haltillo-Azua 0.0 0.0 0.0 0.0 0.0 0.0 0.0 0.0 0.0 0.0 0.0 0.0 0.0 0.0 0.0 0.0 0.0 0.0 0.0 0.0
50 MW GT 0.0 0.0 0.0 0.0 0.0 0.0 0.0 0.0 22.3 20.9 21.8 20.1 20.4 41.9 39.7 42.3 41.3 40.5 42.7 41.9Montafongo,Bani,El Norte 0.0 3.1 3.1 3.1 3.1 3.1 3.1 3.1 3.1 3.1 3.1 3.1 3.1 3.1 3.1 3.1 3.1 3.1 3.1 3.1
Wind 0.0 0.0 0.0 0.0 0.0 0.0 0.0 0.0 0.0 0.0 0.0 0.0 0.0 0.0 0.0 0.0 0.0 0.0 0.0 0.0Production Cost (million $) 1,149 1,458 1,588 1,637 1,729 1,834 1,827 1,907 1,983 1,972 2,061 2,034 2,092 2,176 2,175 2,304 2,361 2,424 2,561 2,647
Investment Costs (million $) 0 385 112.5 427.5 0 0 285 0 22.5 285 0 285 0 22.5 285 0 285 285 0 285
Total System Costs (million $) 1,149 1,843 1,701 2,064 1,729 1,834 2,112 1,907 2,006 2,257 2,061 2,319 2,092 2,198 2,460 2,304 2,646 2,709 2,561 2,932

Caribbean Regional Electricity Generation, Interconnection, and Fuels Supply Strategy – Final Report A-21
Table A-13 Grenada Base Case Capacity Balance
Year 2009 2010 2011 2012 2013 2014 2015 2016 2017 2018 2019 2020 2021 2022 2023 2024 2025 2026 2027 2028
Peak Load (MW) 31 33 34 36 38 40 42 45 47 50 52 55 58 61 64 68 72 75 80 84Exports(+)/Imports(-) (MW)
Existing Capacity (MW)Queens Park 17 17 17 17 17 17 17 17 17 17 17 17 17 17 17 17 17 17 17 17Queens Park 16 16 16 16 16 16 16 16 16 16 16 16 16 16 16 16 16 16 16 16Queens Park 16 16 16 16 16 16 16 16 16 16 16 16 16 16 16 16 16 16 16 16
Total Existing (MW) 49 49 49 49 49 49 49 49 49 49 49 49 49 49 49 49 49 49 49 49
Required Capacity (MW) 42 44 46 49 52 54 57 60 64 67 71 74 78 83 87 92 97 102 107 113Existing System Surplus(+)/Deficit(-) (MW) 7 4 2 0 -3 -6 -9 -12 -15 -18 -22 -26 -30 -34 -39 -43 -48 -53 -59 -65
New Capacity (MW)10 MW MSD 0 0 0 0 10 10 10 20 20 20 30 30 30 40 40 50 50 60 60 7010 MW CFB 0 0 0 0 0 0 0 0 0 0 0 0 0 0 0 0 0 0 0 0
Wind 0 0 0 0 0 0 0 0 0 0 0 0 0 0 0 0 0 0 0 0
Total Capacity (MW) 49 49 49 49 59 59 59 69 69 69 79 79 79 89 89 99 99 109 109 119
System Surplus(+)/Deficit(-) with Unit Additions (MW) 7 4 2 0 7 4 1 8 5 2 8 4 0 6 1 7 2 7 1 5
Reserve Margin (%) 57% 49% 41% 34% 53% 45.4% 37.9% 53.3% 45.5% 38.0% 50.1% 42.4% 35.2% 44.6% 37.2% 45.0% 37.6% 43.8% 36.4% 41.4%

Caribbean Regional Electricity Generation, Interconnection, and Fuels Supply Strategy – Final Report A-22
Table A-14 Grenada Base Case Energy Balance
Year 2009 2010 2011 2012 2013 2014 2015 2016 2017 2018 2019 2020 2021 2022 2023 2024 2025 2026 2027 2028
Energy (GWh) 198 209 220 232 244 257 270 285 300 316 333 350 369 389 409 431 454 478 504 530
Exports(+)/Imports(-) (GWh)
Generation (GWh)
Queens Park 67 71 75 79 66 69 73 64 67 71 64 67 70 65 68 64 67 64 67 64
Queens Park 65 69 73 76 64 67 71 62 65 68 62 65 68 63 66 62 65 62 65 62
Queens Park 65 69 73 76 64 67 71 62 65 68 62 65 68 63 66 62 65 62 65 62
10 MW MSD 0 0 0 0 51 53 56 98 103 108 146 154 162 198 209 244 257 291 307 342
10 MW CFB 0 0 0 0 0 0 0 0 0 0 0 0 0 0 0 0 0 0 0 0
Wind 0 0 0 0 0 0 0 0 0 0 0 0 0 0 0 0 0 0 0 0
Total Generation (GWh) 198 209 220 232 244 257 270 285 300 316 333 350 369 389 409 431 454 478 504 530
Table A-15 Grenada Base Case Cost Summary (Million 2009 US$)
Year 2009 2010 2011 2012 2013 2014 2015 2016 2017 2018 2019 2020 2021 2022 2023 2024 2025 2026 2027 2028Fuel and O&M Costs
Queens Park 10.9 11.8 13.3 15.2 13.1 14.4 15.6 13.8 14.5 15.3 13.9 14.7 15.6 14.5 15.2 14.4 15.3 14.6 15.6 15.3Queens Park 10.6 11.5 12.9 14.8 12.7 14.0 15.1 13.4 14.1 14.9 13.5 14.3 15.1 14.0 14.7 14.0 14.8 14.2 15.1 14.8Queens Park 10.6 11.5 12.9 14.8 12.7 14.0 15.1 13.4 14.1 14.9 13.5 14.3 15.1 14.0 14.7 14.0 14.8 14.2 15.1 14.810 MW MSD 0.0 0.0 0.0 0.0 8.4 9.2 10.0 17.7 18.7 19.7 26.8 28.3 30.0 37.2 39.0 46.2 49.1 56.4 60.1 68.710 MW CFB 0.0 0.0 0.0 0.0 0.0 0.0 0.0 0.0 0.0 0.0 0.0 0.0 0.0 0.0 0.0 0.0 0.0 0.0 0.0 0.0
Wind 0.0 0.0 0.0 0.0 0.0 0.0 0.0 0.0 0.0 0.0 0.0 0.0 0.0 0.0 0.0 0.0 0.0 0.0 0.0 0.0Production Cost (million $) 32 35 39 45 47 52 56 58 61 65 68 72 76 80 84 88 94 99 106 114
Investment Costs (million $) 0 0 0 0 4.5 0 0 4.5 0 0 4.5 0 0 4.5 0 4.5 0 4.5 0 4.5
Total System Costs (million $) 32 35 39 45 52 52 56 63 61 65 72 72 76 84 84 93 94 104 106 118

Caribbean Regional Electricity Generation, Interconnection, and Fuels Supply Strategy – Final Report A-23
Table A-16 Haiti Base Case Capacity Balance
Year 2009 2010 2011 2012 2013 2014 2015 2016 2017 2018 2019 2020 2021 2022 2023 2024 2025 2026 2027 2028
Peak Load (MW) 226 237 249 261 274 288 303 318 334 350 368 386 405 426 447 469 493 517 543 570Exports(+)/Imports(-) (MW)
Existing Capacity (MW)Varreau PAP EDH 34 34 34 34 34 34 34 34 34 34 34 34 34 34 34 34 34 34 34 34
Carrefour PAP EDH 24 24 24 24 24 24 24 24 24 24 24 24 24 24 24 24 24 24 24 24Peligre PAP EDH 27 27 27 27 27 27 27 27 27 27 27 27 27 27 27 27 27 27 27 27
Varreau PAP Sogener IPPs 20 20 20 20 20 20 20 20 20 20 20 20 20 20 20 20 20 20 20 20Carrefour PAP IPP 10 10 10 10 10 10 10 10 10 10 10 10 10 10 10 10 10 10 10 10
Thermal in Provinces 36 36 36 36 36 36 36 36 36 36 36 36 36 36 36 36 36 36 36 36Hydro in Provinces 4 4 4 4 4 4 4 4 4 4 4 4 4 4 4 4 4 4 4 4
Total Existing (MW) 155 155 155 155 155 155 155 155 155 155 155 155 155 155 155 155 155 155 155 155
Required Capacity (MW) 293 308 324 340 357 375 393 413 434 455 478 502 527 553 581 610 641 673 706 742Existing System Surplus(+)/Deficit(-) (MW) -138 -153 -169 -185 -202 -220 -238 -258 -279 -300 -323 -347 -372 -398 -426 -455 -486 -518 -551 -587
New Capacity (MW)E-Power 30 30 30 30 30 30 30 30 30 30 30 30 30 30 30 30 30 30 30 30
Gov of Brazil 30 30 30 30 30 30 30 30 30 30 30 30 30 30 30 30 30 30 30 3020 MW LSD 80 100 120 140 160 160 180 200 220 240 280 300 320 340 380 400 440 460 500 540
Wind 0 0 0 0 0 0 0 0 0 0 0 0 0 0 0 0 0 0 0 0
Total Capacity (MW) 295 315 335 355 375 375 395 415 435 455 495 515 535 555 595 615 655 675 715 755
System Surplus(+)/Deficit(-) with Unit Additions (MW) 2 7 11 15 18 0 2 2 1 0 17 13 8 2 14 5 14 2 9 13
Reserve Margin (%) 31% 33% 35% 36% 37% 30.2% 30.6% 30.6% 30.4% 29.9% 34.6% 33.4% 32.0% 30.4% 33.1% 31.0% 32.9% 30.5% 31.6% 32.3%

Caribbean Regional Electricity Generation, Interconnection, and Fuels Supply Strategy – Final Report A-24
Table A-17 Haiti Base Case Energy Balance
Year 2009 2010 2011 2012 2013 2014 2015 2016 2017 2018 2019 2020 2021 2022 2023 2024 2025 2026 2027 2028
Energy (GWh) 660 726 799 878 966 1,063 1,169 1,286 1,415 1,556 1,712 1,883 1,977 2,076 2,180 2,289 2,403 2,523 2,650 2,782
Exports(+)/Imports(-) (GWh)
Generation (GWh)
Varreau PAP EDH 67 69 71 74 76 86 89 93 97 102 102 108 108 109 106 107 105 106 105 103
Carrefour PAP EDH 48 49 50 52 54 60 63 66 69 72 72 76 76 77 75 76 74 75 74 73
Peligre PAP EDH 71 71 71 71 71 71 71 71 71 71 71 71 71 71 71 71 71 71 71 71
Varreau PAP Sogener IPPs 30 31 32 33 35 39 40 42 44 46 46 49 49 50 48 49 48 48 48 47
Carrefour PAP IPP 15 15 16 17 17 19 20 21 22 23 23 24 25 25 24 24 24 24 24 24
Thermal in Provinces 54 56 58 60 62 70 73 76 80 84 83 88 89 89 86 88 86 87 86 85
Hydro in Provinces 11 11 11 11 11 11 11 11 11 11 11 11 11 11 11 11 11 11 11 11
E-Power 75 77 79 82 85 95 99 103 108 113 113 119 120 121 117 119 116 118 116 115
Gov of Brazil 79 79 79 79 79 79 79 79 79 79 79 79 79 79 79 79 79 79 79 79
20 MW LSD 210 269 333 401 477 534 625 725 834 955 1112 1258 1350 1445 1564 1667 1792 1904 2037 2175
Wind 0 0 0 0 0 0 0 0 0 0 0 0 0 0 0 0 0 0 0 0
Total Generation (GWh) 660 726 799 878 966 1063 1169 1286 1415 1556 1712 1883 1977 2076 2180 2289 2403 2523 2650 2782
Table A-18 Haiti Base Case Cost Summary (Million 2009 US$)
Year 2009 2010 2011 2012 2013 2014 2015 2016 2017 2018 2019 2020 2021 2022 2023 2024 2025 2026 2027 2028Fuel and O&M Costs
Varreau PAP EDH 11.4 12.0 13.1 14.7 15.7 18.1 19.3 20.3 21.2 22.3 22.4 23.7 24.0 24.4 23.6 24.2 23.9 24.5 24.5 24.8Carrefour PAP EDH 8.1 8.5 9.3 10.4 11.1 12.8 13.7 14.3 15.0 15.8 15.8 16.7 16.9 17.2 16.6 17.1 16.9 17.3 17.3 17.5
Peligre PAP EDH 0.0 0.0 0.0 0.0 0.0 0.0 0.0 0.0 0.0 0.0 0.0 0.0 0.0 0.0 0.0 0.0 0.0 0.0 0.0 0.0Varreau PAP Sogener IPPs 6.6 6.9 7.6 8.5 9.0 10.4 11.1 11.7 12.2 12.9 12.9 13.6 13.8 14.0 13.6 13.9 13.8 14.1 14.1 14.3
Carrefour PAP IPP 3.3 3.5 3.8 4.2 4.5 5.2 5.6 5.9 6.1 6.4 6.5 6.8 6.9 7.0 6.8 7.0 6.9 7.1 7.1 7.1Thermal in Provinces 11.9 12.5 13.6 15.3 16.2 18.8 20.1 21.1 22.0 23.1 23.3 24.6 24.9 25.3 24.4 25.1 24.8 25.4 25.4 25.7
Hydro in Provinces 0.4 0.4 0.4 0.4 0.4 0.4 0.4 0.4 0.4 0.4 0.4 0.4 0.4 0.4 0.4 0.4 0.4 0.4 0.4 0.4E-Power 10.7 11.2 12.3 13.8 14.7 17.0 18.2 19.2 20.1 21.1 21.2 22.4 22.7 23.0 22.3 22.8 22.6 23.2 23.1 23.4
Gov of Brazil 1.2 1.2 1.2 1.2 1.2 1.2 1.2 1.2 1.2 1.2 1.2 1.2 1.2 1.2 1.2 1.2 1.2 1.2 1.2 1.220 MW LSD 28.5 37.4 49.3 64.6 78.5 90.9 109.4 127.8 147.0 168.6 197.6 223.8 241.7 261.1 282.1 304.5 331.4 355.4 385.7 421.1
Wind 0.0 0.0 0.0 0.0 0.0 0.0 0.0 0.0 0.0 0.0 0.0 0.0 0.0 0.0 0.0 0.0 0.0 0.0 0.0 0.0Production Cost (million $) 82 94 111 133 151 175 199 222 245 272 301 333 352 374 391 416 442 469 499 535
Investment Costs (million $) 38.4 9.6 9.6 9.6 9.6 0 9.6 9.6 9.6 9.6 19.2 9.6 9.6 9.6 19.2 9.6 19.2 9.6 19.2 19.2
Total System Costs (million $) 120 103 120 143 161 175 209 231 255 281 321 343 362 383 410 426 461 478 518 555

Caribbean Regional Electricity Generation, Interconnection, and Fuels Supply Strategy – Final Report A-25
Table A-19 Jamaica Base Case Capacity Balance
Year 2009 2010 2011 2012 2013 2014 2015 2016 2017 2018 2019 2020 2021 2022 2023 2024 2025 2026 2027 2028
Peak Load (MW) 680 707 736 767 799 832 867 904 943 983 1,026 1,071 1,116 1,165 1,214 1,267 1,322 1,379 1,439 1,502Exports(+)/Imports(-) (MW)
Existing Capacity (MW)Old Harbour 29 29 29 29 29 0 0 0 0 0 0 0 0 0 0 0 0 0 0 0Old Harbour 57 57 57 57 57 57 57 57 57 57 57 57 57 0 0 0 0 0 0 0Old Harbour 62 62 62 62 62 62 62 62 62 62 62 62 62 62 62 0 0 0 0 0Old Harbour 65 65 65 65 65 65 65 65 65 65 65 65 65 65 65 65 65 65 65 65
Hunts Bay 65 65 65 65 65 65 65 65 65 65 65 65 65 65 65 65 65 0 0 0Hunts Bay 21 21 21 21 21 21 21 21 21 21 21 21 21 21 21 21 21 21 21 21Hunts Bay 0 0 0 0 0 0 0 0 0 0 0 0 0 0 0 0 0 0 0 0
Rockfort 35 35 35 35 35 35 35 35 35 35 35 0 0 0 0 0 0 0 0 0Bogue 21 21 21 21 21 21 21 21 21 21 21 21 21 21 21 21 21 21 21 21Bogue 42 42 42 42 42 42 42 42 42 42 42 42 42 42 42 42 42 42 42 42Bogue 40 40 40 40 40 40 40 40 40 40 40 40 40 40 40 40 40 40 40 40Bogue 111 111 111 111 111 111 111 111 111 111 111 111 111 111 111 111 111 111 111 111
JEP Barge 1 74 74 74 74 74 74 74 74 74 74 74 74 74 74 74 74 74 74 74 74JEP Barge 2 50 50 50 50 50 50 50 50 50 50 50 50 50 50 50 50 50 50 50 50
JPPC Owned 60 60 60 60 60 60 60 60 60 60 60 60 60 60 60 60 60 60 60 60Jamalco 11 11 11 11 11 11 11 11 11 11 11 11 11 11 11 11 11 11 11 11Wigton 20 20 20 20 20 20 20 20 20 20 20 20 20 20 20 20 20 20 20 20Hydro 20 20 20 20 20 20 20 20 20 20 20 20 20 20 20 20 20 20 20 20
Total Existing (MW) 782 782 782 782 782 753 753 753 753 753 753 719 719 662 662 600 600 535 535 535
Required Capacity (MW) 850 884 921 959 998 1,039 1,083 1,130 1,179 1,229 1,282 1,338 1,396 1,456 1,518 1,583 1,652 1,724 1,799 1,877Existing System Surplus(+)/Deficit(-) (MW) -68 -103 -139 -177 -217 -286 -330 -377 -426 -476 -529 -620 -677 -795 -857 -984 -1,053 -1,190 -1,265 -1,343
New Capacity (MW)Kingston 68 68 68 68 68 68 68 68 68 68 68 68 68 68 68 68 68 68 68 68
Hunts Bay Petcoke 0 0 0 120 120 120 120 120 120 120 120 120 120 120 120 120 120 120 120 120Windalco 0 0 0 0 0 60 60 60 60 60 60 60 60 60 60 60 60 60 60 60Jamalco 0 85 85 85 85 85 85 85 85 85 85 85 85 85 85 85 85 85 85 85Wigton 0 6 12 18 18 18 18 18 18 18 18 18 18 18 18 18 18 18 18 18
50 MW GT 0 0 0 0 0 0 0 0 0 0 0 0 0 0 0 0 0 0 0 0100 MW CC 0 0 0 0 0 0 0 0 0 0 0 0 0 0 0 0 0 0 0 0
50 MW GT 0 0 0 0 0 0 0 0 0 0 0 0 0 0 0 0 0 0 0 0100 MW ConvCoal 0 0 0 0 0 0 100 200 200 300 300 400 500 600 600 800 800 1,000 1,000 1,100
Wind 0 0 0 0 0 0 0 0 0 0 0 0 0 0 0 0 0 0 0 0
Total Capacity (MW) 850 935 935 1,055 1,055 1,087 1,187 1,287 1,287 1,387 1,387 1,452 1,552 1,595 1,595 1,733 1,733 1,868 1,868 1,968
System Surplus(+)/Deficit(-) with Unit Additions (MW) 1 51 15 97 57 47 103 156 108 157 104 114 156 139 77 150 81 144 69 91
Reserve Margin (%) 25% 32% 27% 38% 32% 30.7% 36.9% 42.3% 36.4% 41.0% 35.2% 35.6% 39.0% 36.9% 31.3% 36.8% 31.1% 35.4% 29.8% 31.0%

Caribbean Regional Electricity Generation, Interconnection, and Fuels Supply Strategy – Final Report A-26
Table A-20 Jamaica Base Case Energy Balance
Year 2009 2010 2011 2012 2013 2014 2015 2016 2017 2018 2019 2020 2021 2022 2023 2024 2025 2026 2027 2028
Energy (GWh) 4,490 4,674 4,865 5,066 5,277 5,494 5,726 5,974 6,232 6,497 6,777 7,073 7,376 7,696 8,024 8,370 8,734 9,114 9,510 9,924
Exports(+)/Imports(-) (GWh)
Generation (GWh)
Old Harbour 153 123 127 128 134 0 0 0 0 0 0 0 0 0 0 0 0 0 0 0
Old Harbour 305 245 252 256 268 264 248 234 245 233 244 236 227 0 0 0 0 0 0 0
Old Harbour 331 266 274 277 291 286 269 254 266 253 264 256 247 248 259 0 0 0 0 0
Old Harbour 349 280 288 292 306 301 284 268 280 266 278 270 260 261 273 257 268 257 269 263
Hunts Bay 349 280 288 292 306 301 284 268 280 266 278 270 260 261 273 257 268 0 0 0
Hunts Bay 62 78 82 118 123 121 115 109 114 108 113 110 106 107 112 106 111 106 111 110
Hunts Bay 0 0 0 0 0 0 0 0 0 0 0 0 0 0 0 0 0 0 0 0
Rockfort 237 192 199 130 135 130 121 114 119 113 118 0 0 0 0 0 0 0 0 0
Bogue 63 80 84 116 121 119 113 107 112 106 111 108 104 105 110 104 109 104 109 108
Bogue 99 126 132 237 247 245 233 220 230 219 229 224 215 217 227 215 225 217 227 224
Bogue 127 161 169 205 214 210 199 188 196 187 195 190 183 184 193 182 190 183 191 188
Bogue 526 668 700 477 495 478 445 419 438 415 433 421 404 405 423 397 414 395 411 403
JEP Barge 1 562 458 472 270 281 269 249 234 245 232 241 234 224 225 234 219 228 217 225 220
JEP Barge 2 379 308 318 182 189 181 168 158 165 156 163 157 151 151 158 148 154 146 152 148
JPPC Owned 468 382 394 220 228 218 202 190 198 188 195 189 182 182 190 178 184 175 182 178
Jamalco 15 15 15 15 15 15 15 15 15 15 15 15 15 15 15 15 15 15 15 15
Wigton 48 48 48 48 48 48 48 48 48 48 48 48 48 48 48 48 48 48 48 48
Hydro 70 70 70 70 70 70 70 70 70 70 70 70 70 70 70 70 70 70 70 70
Kingston 348 441 462 262 272 260 240 226 236 224 233 226 216 217 226 212 220 209 217 213
Hunts Bay Petcoke 0 0 0 1021 1071 988 888 823 850 798 830 805 768 756 784 726 757 711 742 731
Windalco 0 0 0 0 0 537 492 464 487 463 485 474 456 454 474 442 462 436 456 450
Jamalco 0 436 457 399 414 404 380 358 374 355 371 361 347 349 364 343 359 343 358 352
Wigton 0 17 34 50 50 50 50 50 50 50 50 50 50 50 50 50 50 50 50 50
50 MW GT 0 0 0 0 0 0 0 0 0 0 0 0 0 0 0 0 0 0 0 0
100 MW CC 0 0 0 0 0 0 0 0 0 0 0 0 0 0 0 0 0 0 0 0
50 MW GT 0 0 0 0 0 0 0 0 0 0 0 0 0 0 0 0 0 0 0 0
100 MW ConvCoal 0 0 0 0 0 0 613 1158 1213 1731 1812 2360 2842 3391 3542 4400 4602 5429 5676 6154
Wind 0 0 0 0 0 0 0 0 0 0 0 0 0 0 0 0 0 0 0 0
Total Generation (GWh) 4490 4674 4865 5066 5277 5494 5726 5974 6232 6497 6777 7073 7376 7696 8024 8370 8734 9114 9510 9924

Caribbean Regional Electricity Generation, Interconnection, and Fuels Supply Strategy – Final Report A-27
Table A-21 Jamaica Base Case Cost Summary (Million 2009 US$)
Year 2009 2010 2011 2012 2013 2014 2015 2016 2017 2018 2019 2020 2021 2022 2023 2024 2025 2026 2027 2028Fuel and O&M Costs
Old Harbour 19.4 25.2 28.3 31.7 34.6 0.0 0.0 0.0 0.0 0.0 0.0 0.0 0.0 0.0 0.0 0.0 0.0 0.0 0.0 0.0Old Harbour 38.8 50.3 56.4 63.1 69.0 71.1 69.2 66.0 69.3 66.2 69.5 67.1 65.4 0.0 0.0 0.0 0.0 0.0 0.0 0.0Old Harbour 42.0 54.5 61.2 68.4 74.8 77.1 75.0 71.5 75.2 71.7 75.4 72.8 70.9 71.9 74.9 0.0 0.0 0.0 0.0 0.0Old Harbour 44.3 57.4 64.4 72.1 78.8 81.2 79.1 75.4 79.2 75.6 79.4 76.6 74.7 75.8 78.9 75.1 79.1 76.5 81.1 80.8
Hunts Bay 44.3 57.4 64.4 72.1 78.8 81.2 79.1 75.4 79.2 75.6 79.4 76.6 74.7 75.8 78.9 75.1 79.1 0.0 0.0 0.0Hunts Bay 15.2 19.9 22.3 35.1 37.6 38.8 38.0 36.3 38.0 36.3 38.3 37.5 36.3 36.9 38.4 36.9 39.1 38.0 40.2 40.6Hunts Bay 0.0 0.0 0.0 0.0 0.0 0.0 0.0 0.0 0.0 0.0 0.0 0.0 0.0 0.0 0.0 0.0 0.0 0.0 0.0 0.0
Rockfort 22.7 29.3 32.8 24.1 26.0 26.3 25.3 24.1 25.3 24.1 25.2 0.0 0.0 0.0 0.0 0.0 0.0 0.0 0.0 0.0Bogue 15.2 19.9 22.3 33.7 36.1 37.3 36.5 34.8 36.5 34.8 36.7 35.9 34.8 35.4 36.9 35.4 37.4 36.4 38.5 38.9Bogue 28.0 36.6 41.1 80.5 86.2 89.4 87.9 83.8 87.9 83.9 88.6 86.7 84.0 85.6 89.1 85.7 90.7 88.2 93.5 94.5Bogue 28.3 36.9 41.6 55.4 59.3 61.0 59.6 56.8 59.5 56.9 59.9 58.6 56.8 57.7 60.1 57.6 60.9 59.2 62.6 63.2Bogue 79.6 103.8 116.7 87.6 93.4 94.1 90.6 86.2 90.1 86.0 90.2 88.0 85.1 86.2 89.6 85.4 89.9 86.8 91.5 91.7
JEP Barge 1 48.2 62.2 69.7 45.2 48.8 48.9 46.9 44.6 46.7 44.6 46.5 45.0 43.7 44.1 45.8 43.4 45.5 43.7 46.0 45.6JEP Barge 2 32.5 41.9 47.0 30.5 32.9 33.0 31.6 30.1 31.5 30.0 31.4 30.3 29.5 29.7 30.9 29.3 30.6 29.5 31.0 30.7
JPPC Owned 39.3 50.7 56.9 36.0 38.8 38.9 37.2 35.4 37.1 35.4 36.9 35.7 34.7 35.0 36.3 34.4 36.0 34.6 36.4 36.1Jamalco 0.5 0.5 0.5 0.5 0.5 0.5 0.5 0.5 0.5 0.5 0.5 0.5 0.5 0.5 0.5 0.5 0.5 0.5 0.5 0.5Wigton 0.9 0.9 0.9 0.9 0.9 0.9 0.9 0.9 0.9 0.9 0.9 0.9 0.9 0.9 0.9 0.9 0.9 0.9 0.9 0.9Hydro 1.1 1.1 1.1 1.1 1.1 1.1 1.1 1.1 1.1 1.1 1.1 1.1 1.1 1.1 1.1 1.1 1.1 1.1 1.1 1.1
Kingston 46.4 60.1 67.4 42.9 45.6 45.5 43.6 41.5 43.3 41.3 43.2 42.1 40.8 41.2 42.8 40.7 42.7 41.2 43.2 43.2Hunts Bay Petcoke 0.0 0.0 0.0 42.3 44.5 41.7 38.2 36.2 37.5 35.6 36.6 35.2 33.9 33.8 35.0 32.5 33.4 31.5 32.3 31.3
Windalco 0.0 0.0 0.0 0.0 0.0 21.9 20.0 18.9 19.6 18.6 19.1 18.4 17.7 17.6 18.2 16.9 17.4 16.3 16.8 16.2Jamalco 0.0 82.1 92.2 88.5 94.5 96.3 93.6 89.2 93.3 89.1 93.7 91.6 88.7 90.0 93.6 89.6 94.5 91.6 96.7 97.4Wigton 0.0 0.2 0.4 0.6 0.6 0.6 0.6 0.6 0.6 0.6 0.6 0.6 0.6 0.6 0.6 0.6 0.6 0.6 0.6 0.6
50 MW GT 0.0 0.0 0.0 0.0 0.0 0.0 0.0 0.0 0.0 0.0 0.0 0.0 0.0 0.0 0.0 0.0 0.0 0.0 0.0 0.0100 MW CC 0.0 0.0 0.0 0.0 0.0 0.0 0.0 0.0 0.0 0.0 0.0 0.0 0.0 0.0 0.0 0.0 0.0 0.0 0.0 0.0
50 MW GT 0.0 0.0 0.0 0.0 0.0 0.0 0.0 0.0 0.0 0.0 0.0 0.0 0.0 0.0 0.0 0.0 0.0 0.0 0.0 0.0100 MW ConvCoal 0.0 0.0 0.0 0.0 0.0 0.0 32.5 61.4 63.6 90.5 92.9 119.2 143.2 171.1 176.8 219.0 225.2 265.1 271.7 289.4
Wind 0.0 0.0 0.0 0.0 0.0 0.0 0.0 0.0 0.0 0.0 0.0 0.0 0.0 0.0 0.0 0.0 0.0 0.0 0.0 0.0Production Cost (million $) 547 791 888 912 983 987 987 971 1,015 999 1,046 1,020 1,018 991 1,029 960 1,005 942 985 1,003
Investment Costs (million $) 0 96.75 7.5 271.5 0 132 220 220 0 220 0 220 220 220 0 440 0 440 0 220
Total System Costs (million $) 547 887 895 1,184 983 1,119 1,207 1,191 1,015 1,219 1,046 1,240 1,238 1,211 1,029 1,400 1,005 1,382 985 1,223

Caribbean Regional Electricity Generation, Interconnection, and Fuels Supply Strategy – Final Report A-28
Table A-22 St. Kitts Base Case Capacity Balance
Year 2009 2010 2011 2012 2013 2014 2015 2016 2017 2018 2019 2020 2021 2022 2023 2024 2025 2026 2027 2028
Peak Load (MW) 29 30 31 32 33 35 36 37 38 40 41 43 44 46 47 49 51 52 54 56Exports(+)/Imports(-) (MW)
Existing Capacity (MW)Station A 6 6 6 6 6 6 6 6 6 6 6 6 6 6 6 6 6 6 6 6Station A 8 8 8 8 8 8 8 8 8 8 8 8 8 8 8 8 8 8 8 8Station B 9 9 9 9 9 9 9 9 9 9 9 9 9 9 9 9 9 9 9 9Station C 7 7 7 7 7 7 7 7 7 7 7 7 7 7 7 7 7 7 7 7Station C 4 4 4 4 4 4 4 4 4 4 4 4 4 4 4 4 4 4 4 4
New Units 8 8 8 8 8 8 8 8 8 8 8 8 8 8 8 8 8 8 8 8
Total Existing (MW) 42 42 42 42 42 42 42 42 42 42 42 42 42 42 42 42 42 42 42 42
Required Capacity (MW) 39 41 42 43 45 47 48 50 52 54 55 57 59 62 64 66 68 71 73 76Existing System Surplus(+)/Deficit(-) (MW) 2 1 0 -2 -3 -5 -7 -8 -10 -12 -14 -16 -18 -20 -22 -24 -27 -29 -32 -34
New Capacity (MW)5 MW MSD 0 0 0 5 5 5 10 10 10 15 15 20 20 25 25 25 30 30 35 35
Wind 0 0 0 0 0 0 0 0 0 0 0 0 0 0 0 0 0 0 0 0
Total Capacity (MW) 42 42 42 47 47 47 52 52 52 57 57 62 62 67 67 67 72 72 77 77
System Surplus(+)/Deficit(-) with Unit Additions (MW) 2 1 0 3 2 0 3 2 0 3 1 4 2 5 3 1 3 1 3 1
Reserve Margin (%) 43% 38% 33% 44% 40% 34.8% 44.2% 39.2% 34.5% 42.5% 37.6% 44.7% 39.8% 46.0% 41.0% 36.2% 41.4% 36.6% 41.1% 36.3%

Caribbean Regional Electricity Generation, Interconnection, and Fuels Supply Strategy – Final Report A-29
Table A-23 St. Kitts Base Case Energy Balance
Year 2009 2010 2011 2012 2013 2014 2015 2016 2017 2018 2019 2020 2021 2022 2023 2024 2025 2026 2027 2028
Energy (GWh) 161 166 171 175 180 186 191 196 202 208 214 220 226 233 239 246 253 261 268 276
Exports(+)/Imports(-) (GWh)
Generation (GWh)
Station A 24 25 26 24 24 25 23 24 24 23 23 22 23 22 22 23 22 22 22 22
Station A 32 32 33 30 31 32 30 31 32 30 30 29 29 28 29 30 28 29 28 29
Station B 33 34 35 32 33 34 31 32 33 31 32 30 31 29 30 31 30 30 29 30
Station C 27 28 29 26 27 28 26 26 27 25 26 25 25 24 25 25 24 25 24 25
Station C 13 14 14 13 13 13 12 13 13 12 13 12 12 12 12 12 12 12 12 12
New Units 32 33 34 31 32 33 30 31 32 30 31 29 30 28 29 30 29 29 28 29
5 MW MSD 0 0 0 20 20 21 38 40 41 57 59 74 76 90 93 95 109 112 126 129
Wind 0 0 0 0 0 0 0 0 0 0 0 0 0 0 0 0 0 0 0 0
Total Generation (GWh) 161 166 171 175 180 186 191 196 202 208 214 220 226 233 239 246 253 261 268 276
Table A-24 St. Kitts Base Case Cost Summary (Million 2009 US$)
Year 2009 2010 2011 2012 2013 2014 2015 2016 2017 2018 2019 2020 2021 2022 2023 2024 2025 2026 2027 2028Fuel and O&M Costs
Station A 3.4 3.6 4.0 4.0 4.2 4.5 4.3 4.5 4.6 4.3 4.5 4.3 4.4 4.2 4.3 4.5 4.4 4.5 4.4 4.6Station A 4.4 4.7 5.2 5.2 5.4 5.8 5.6 5.8 6.0 5.6 5.8 5.5 5.7 5.5 5.6 5.8 5.6 5.9 5.7 6.0Station B 4.9 5.2 5.7 5.7 6.1 6.5 6.2 6.4 6.6 6.2 6.5 6.1 6.3 6.1 6.2 6.5 6.3 6.5 6.4 6.7Station C 4.0 4.3 4.7 4.7 5.0 5.3 5.1 5.3 5.4 5.1 5.3 5.0 5.2 5.0 5.1 5.3 5.1 5.3 5.2 5.5Station C 2.0 2.1 2.3 2.3 2.4 2.6 2.5 2.6 2.6 2.5 2.6 2.4 2.5 2.4 2.5 2.6 2.5 2.6 2.5 2.7
5 MW MSD 0.0 0.0 0.0 3.3 3.5 3.7 7.2 7.4 7.7 10.8 11.2 14.1 14.6 17.5 18.0 18.7 21.7 22.5 25.6 26.9Wind 0.0 0.0 0.0 0.0 0.0 0.0 0.0 0.0 0.0 0.0 0.0 0.0 0.0 0.0 0.0 0.0 0.0 0.0 0.0 0.0
Production Cost (million $) 23 25 27 30 32 34 37 38 39 40 42 43 45 46 47 49 51 53 56 58
Investment Costs (million $) 0 0 0 2.25 0 0 2.25 0 0 2.25 0 2.25 0 2.25 0 0 2.25 0 2.25 0
Total System Costs (million $) 23 25 27 33 32 34 39 38 39 43 42 45 45 49 47 49 54 53 58 58

Caribbean Regional Electricity Generation, Interconnection, and Fuels Supply Strategy – Final Report A-30
Table A-25 Nevis Base Case Capacity Balance
Year 2009 2010 2011 2012 2013 2014 2015 2016 2017 2018 2019 2020 2021 2022 2023 2024 2025 2026 2027 2028
Peak Load (MW) 10 10 11 11 12 13 13 14 15 16 17 18 19 20 21 23 24 25 27 29Exports(+)/Imports(-) (MW)
Existing Capacity (MW)#2 & #3 2 2 2 2 2 2 2 2 2 2 2 2 2 2 2 2 2 2 2 2
#4, #6 4 4 4 4 4 4 4 4 4 4 4 4 4 4 4 4 4 4 4 4#5, #7 5 5 5 5 5 5 5 5 5 5 5 5 5 5 5 5 5 5 5 5
#8 3 3 3 3 3 3 3 3 3 3 3 3 3 3 3 3 3 3 3 3
Total Existing (MW) 14 14 14 14 14 14 14 14 14 14 14 14 14 14 14 14 14 14 14 14
Required Capacity (MW) 13 14 14 15 16 17 18 19 20 22 23 24 26 27 29 31 32 34 36 39Existing System Surplus(+)/Deficit(-) (MW) 1 0 -1 -1 -2 -3 -4 -5 -6 -8 -9 -10 -12 -13 -15 -17 -18 -20 -22 -25
New Capacity (MW)5 MW MSD 0 0 5 5 5 5 5 5 10 10 10 10 15 15 15 20 20 20 25 25Geo 20 MW 0 0 0 0 0 0 0 0 0 0 0 0 0 0 0 0 0 0 0 0
Geo 100 MW 0 0 0 0 0 0 0 0 0 0 0 0 0 0 0 0 0 0 0 0Wind 0 0 0 0 0 0 0 0 0 0 0 0 0 0 0 0 0 0 0 0
Total Capacity (MW) 14 14 19 19 19 19 19 19 24 24 24 24 29 29 29 34 34 34 39 39
System Surplus(+)/Deficit(-) with Unit Additions (MW) 1 0 4 4 3 2 1 0 4 2 1 0 3 2 0 3 2 0 3 0
Reserve Margin (%) 46% 38% 77% 67% 58% 48.8% 40.5% 32.6% 58.2% 49.3% 40.9% 33.0% 51.8% 43.2% 35.2% 49.7% 41.3% 33.3% 44.4% 36.3%

Caribbean Regional Electricity Generation, Interconnection, and Fuels Supply Strategy – Final Report A-31
Table A-26 Nevis Base Case Energy Balance
Year 2009 2010 2011 2012 2013 2014 2015 2016 2017 2018 2019 2020 2021 2022 2023 2024 2025 2026 2027 2028
Energy (GWh) 60 67 74 82 86 90 94 99 103 107 111 115 119 124 129 134 139 145 150 156
Exports(+)/Imports(-) (GWh) 0 0 0 0 0 0 0 0 0 0 0 0 0 0 0 0 0 0
Generation (GWh)
#2 & #3 8 9 7 7 8 8 9 9 7 7 8 8 7 7 7 6 7 7 6 6
#4, #6 19 21 17 18 19 20 21 22 18 18 19 20 17 17 18 16 17 17 15 16
#5, #7 22 24 19 21 22 23 24 25 20 21 22 23 19 20 21 18 19 19 18 18
#8 12 13 10 11 12 12 13 14 11 11 12 12 10 11 11 10 10 11 9 10
5 MW MSD 0 0 22 24 25 27 28 29 47 49 50 52 66 69 72 84 87 90 102 106
Geo 20 MW 0 0 0 0 0 0 0 0 0 0 0 0 0 0 0 0 0 0 0 0
Geo 100 MW 0 0 0 0 0 0 0 0 0 0 0 0 0 0 0 0 0 0 0 0
Wind 0 0 0 0 0 0 0 0 0 0 0 0 0 0 0 0 0 0 0 0
Total Generation (GWh) 60 67 74 82 86 90 94 99 103 107 111 115 119 124 129 134 139 145 150 156
Table A-27 Nevis Base Case Cost Summary (Million 2009 US$)
Year 2009 2010 2011 2012 2013 2014 2015 2016 2017 2018 2019 2020 2021 2022 2023 2024 2025 2026 2027 2028Fuel and O&M Costs
#2 & #3 1.2 1.4 1.2 1.4 1.5 1.7 1.8 1.9 1.6 1.6 1.7 1.8 1.5 1.6 1.6 1.5 1.5 1.6 1.5 1.6#4, #6 3.0 3.4 2.9 3.4 3.7 4.0 4.3 4.5 3.7 3.8 4.0 4.2 3.6 3.7 3.9 3.5 3.6 3.8 3.5 3.7#5, #7 3.4 3.8 3.2 3.9 4.2 4.6 4.9 5.2 4.2 4.4 4.6 4.7 4.1 4.3 4.4 3.9 4.1 4.3 4.0 4.2
#8 1.8 2.1 1.8 2.1 2.3 2.5 2.6 2.8 2.3 2.4 2.5 2.6 2.2 2.3 2.4 2.1 2.2 2.3 2.1 2.35 MW MSD 0.0 0.0 3.4 4.1 4.4 4.8 5.1 5.4 8.7 9.1 9.5 9.9 12.7 13.3 13.8 16.4 17.2 18.0 20.6 21.9Geo 20 MW 0.0 0.0 0.0 0.0 0.0 0.0 0.0 0.0 0.0 0.0 0.0 0.0 0.0 0.0 0.0 0.0 0.0 0.0 0.0 0.0
Geo 100 MW 0.0 0.0 0.0 0.0 0.0 0.0 0.0 0.0 0.0 0.0 0.0 0.0 0.0 0.0 0.0 0.0 0.0 0.0 0.0 0.0Wind 0.0 0.0 0.0 0.0 0.0 0.0 0.0 0.0 0.0 0.0 0.0 0.0 0.0 0.0 0.0 0.0 0.0 0.0 0.0 0.0
Production Cost (million $) 9 11 12 15 16 17 19 20 20 21 22 23 24 25 26 27 29 30 32 34
Investment Costs (million $) 0 0 2.25 0 0 0 0 0 2.25 0 0 0 2.25 0 0 2.25 0 0 2.25 0
Total System Costs (million $) 9 11 15 15 16 17 19 20 23 21 22 23 26 25 26 30 29 30 34 34

Caribbean Regional Electricity Generation, Interconnection, and Fuels Supply Strategy – Final Report A-32
Table A-28 St. Lucia Base Case Capacity Balance
Year 2009 2010 2011 2012 2013 2014 2015 2016 2017 2018 2019 2020 2021 2022 2023 2024 2025 2026 2027 2028
Peak Load (MW) 56 58 61 63 65 68 70 73 76 79 82 85 88 91 95 98 102 106 110 114Exports(+)/Imports(-) (MW)
Existing Capacity (MW)Cul de Sac 12 12 12 12 12 12 12 12 12 12 12 12 12 12 12 12 12 12 12 12Cul de Sac 6 6 6 6 6 6 6 6 6 6 6 6 6 6 6 6 6 6 6 6Cul de Sac 37 37 37 37 37 37 37 37 37 37 37 37 37 37 37 37 37 37 37 37Cul de Sac 21 21 21 21 21 21 21 21 21 21 21 21 21 21 21 21 21 21 21 21
Rooftop solar 0.1 0.1 0.1 0.1 0.1 0.1 0.1 0.1 0.1 0.1 0.1 0.1 0.1 0.1 0.1 0.1 0.1 0.1 0.1 0.1
Total Existing (MW) 76 76 76 76 76 76 76 76 76 76 76 76 76 76 76 76 76 76 76 76
Required Capacity (MW) 76 79 82 85 88 91 95 98 102 106 110 114 119 123 128 133 138 143 148 154Existing System Surplus(+)/Deficit(-) (MW) 0 -2 -5 -9 -12 -15 -19 -22 -26 -30 -34 -38 -42 -47 -52 -56 -62 -67 -72 -78
New Capacity (MW)20 MW LSD 0 20 20 20 20 20 20 40 40 40 40 40 60 60 60 60 80 80 80 8020 MW LSD 0 0 0 0 0 0 0 0 0 0 0 0 0 0 0 0 0 0 0 0
Wind 0 0 0 0 0 0 0 0 0 0 0 0 0 0 0 0 0 0 0 0
Total Capacity (MW) 76 96 96 96 96 96 96 116 116 116 116 116 136 136 136 136 156 156 156 156
System Surplus(+)/Deficit(-) with Unit Additions (MW) 0 18 15 11 8 5 1 18 14 10 6 2 18 13 8 4 18 13 8 2
Reserve Margin (%) 35.7% 65.0% 59.0% 53.2% 47.6% 42.2% 36.9% 59.4% 53.5% 47.9% 42.5% 37.3% 55.0% 49.3% 43.9% 38.6% 53.1% 47.5% 42.1% 36.9%

Caribbean Regional Electricity Generation, Interconnection, and Fuels Supply Strategy – Final Report A-33
Table A-29 St. Lucia Base Case Energy Balance
Year 2009 2010 2011 2012 2013 2014 2015 2016 2017 2018 2019 2020 2021 2022 2023 2024 2025 2026 2027 2028
Energy (GWh) 345 356 367 378 390 402 415 428 442 455 470 484 500 515 531 548 565 583 601 620
Exports(+)/Imports(-) (GWh)
Generation (GWh)
Cul de Sac 53 42 43 45 46 47 49 41 42 43 45 46 40 41 42 44 39 40 41 43
Cul de Sac 28 22 23 23 24 25 26 21 22 23 23 24 21 22 22 23 20 21 22 22
Cul de Sac 169 133 137 142 146 151 155 129 134 138 142 146 127 131 135 139 123 127 131 135
Cul de Sac 94 74 76 78 81 83 86 72 74 76 79 81 70 72 75 77 68 71 73 75
Rooftop solar 0.1 0.1 0.1 0.1 0.1 0.1 0.1 0.1 0.1 0.1 0.1 0.1 0.1 0.1 0.1 0.1 0.1 0.1 0.1 0.1
20 MW LSD 0 85 87 90 93 96 99 165 170 175 181 186 242 249 257 265 314 324 334 344
20 MW LSD 0 0 0 0 0 0 0 0 0 0 0 0 0 0 0 0 0 0 0 0
Wind 0 0 0 0 0 0 0 0 0 0 0 0 0 0 0 0 0 0 0 0
Total Generation (GWh) 345 356 367 378 390 402 415 428 442 455 470 484 500 515 531 548 565 583 601 620
Table A-30 St. Lucia Base Case Cost Summary (Million 2009 US$)
Year 2009 2010 2011 2012 2013 2014 2015 2016 2017 2018 2019 2020 2021 2022 2023 2024 2025 2026 2027 2028Fuel and O&M Costs
Cul de Sac 8.0 6.5 7.2 8.1 8.6 9.2 9.8 8.3 8.5 8.8 9.2 9.5 8.3 8.6 8.9 9.3 8.4 8.7 9.1 9.6Cul de Sac 4.2 3.4 3.8 4.3 4.5 4.8 5.1 4.4 4.5 4.6 4.8 5.0 4.4 4.5 4.7 4.9 4.4 4.6 4.8 5.0Cul de Sac 24.7 20.3 22.3 25.1 26.6 28.5 30.3 25.7 26.5 27.4 28.4 29.4 25.8 26.8 27.5 28.7 25.9 26.9 28.1 29.6Cul de Sac 13.7 11.2 12.4 13.9 14.7 15.8 16.8 14.2 14.7 15.2 15.7 16.3 14.3 14.8 15.2 15.9 14.3 14.9 15.6 16.4
Rooftop solar 0.0 0.0 0.0 0.0 0.0 0.0 0.0 0.0 0.0 0.0 0.0 0.0 0.0 0.0 0.0 0.0 0.0 0.0 0.0 0.020 MW LSD 0.0 11.4 12.5 14.1 14.9 16.0 17.0 28.8 29.7 30.8 31.9 33.0 43.4 45.1 46.3 48.3 58.2 60.5 63.1 66.520 MW LSD 0.0 0.0 0.0 0.0 0.0 0.0 0.0 0.0 0.0 0.0 0.0 0.0 0.0 0.0 0.0 0.0 0.0 0.0 0.0 0.0
Wind 0.0 0.0 0.0 0.0 0.0 0.0 0.0 0.0 0.0 0.0 0.0 0.0 0.0 0.0 0.0 0.0 0.0 0.0 0.0 0.0Production Cost (million $) 51 53 58 65 69 74 79 81 84 87 90 93 96 100 103 107 111 116 121 127
Investment Costs (million $) 0 9.6 0 0 0 0 0 9.6 0 0 0 0 9.6 0 0 0 9.6 0 0 0
Total System Costs (million $) 51 62 58 65 69 74 79 91 84 87 90 93 106 100 103 107 121 116 121 127

Caribbean Regional Electricity Generation, Interconnection, and Fuels Supply Strategy – Final Report A-34
Table A-31 St. Vincent and Grenadines Base Case Capacity Balance
Year 2009 2010 2011 2012 2013 2014 2015 2016 2017 2018 2019 2020 2021 2022 2023 2024 2025 2026 2027 2028
Peak Load (MW) 27 28 30 32 35 37 40 42 45 48 52 55 59 63 68 72 77 83 88 94Exports(+)/Imports(-) (MW)
Existing Capacity (MW)St. Vincent 12 12 12 12 12 12 12 12 12 12 12 12 12 12 12 12 12 12 12 12St. Vincent 3 3 3 3 3 3 3 3 3 3 3 3 3 3 3 3 3 3 3 3
Lowmans Bay 35 35 35 35 35 35 35 35 35 35 35 35 35 35 35 35 35 35 35 35Bequia 3 3 3 3 3 3 3 3 3 3 3 3 3 3 3 3 3 3 3 3
Union Island 2.5 2.5 2.5 2.5 2.5 2.5 2.5 2.5 2.5 2.5 2.5 2.5 2.5 2.5 2.5 2.5 2.5 2.5 2.5 2.5Canouan 3 3 3 3 3 3 3 3 3 3 3 3 3 3 3 3 3 3 3 3Mayreay 0 0 0 0 0 0 0 0 0 0 0 0 0 0 0 0 0 0 0 0
Total Existing (MW) 58 58 58 58 58 58 58 58 58 58 58 58 58 58 58 58 58 58 58 58
Required Capacity (MW) 36 38 41 44 47 50 53 57 61 65 70 75 80 85 91 98 104 111 119 127Existing System Surplus(+)/Deficit(-) (MW) 22 20 17 14 11 8 5 1 -3 -7 -12 -17 -22 -27 -33 -39 -46 -53 -61 -69
New Capacity (MW)10 MW MSD 0 0 0 0 0 0 0 0 10 10 20 20 30 30 40 40 50 60 70 7010 MW CFB 0 0 0 0 0 0 0 0 0 0 0 0 0 0 0 0 0 0 0 0
Wind 0 0 0 0 0 0 0 0 0 0 0 0 0 0 0 0 0 0 0 0
Total Capacity (MW) 58 58 58 58 58 58 58 58 68 68 78 78 88 88 98 98 108 118 128 128
System Surplus(+)/Deficit(-) with Unit Additions (MW) 22 20 17 14 11 8 5 1 7 3 8 3 8 3 7 1 4 7 9 1
Reserve Margin (%) 118.8% 104.7% 91.5% 79.1% 67.5% 56.7% 46.6% 37.1% 50.3% 40.6% 50.9% 41.1% 48.9% 39.3% 45.1% 35.7% 39.9% 43.0% 45.1% 35.7%

Caribbean Regional Electricity Generation, Interconnection, and Fuels Supply Strategy – Final Report A-35
Table A-32 St. Vincent and Grenadines Base Case Energy Balance
Year 2009 2010 2011 2012 2013 2014 2015 2016 2017 2018 2019 2020 2021 2022 2023 2024 2025 2026 2027 2028
Energy (GWh) 156 167 178 191 204 218 233 249 266 284 304 325 348 372 397 425 454 485 519 555
Exports(+)/Imports(-) (GWh)
Generation (GWh)
St. Vincent 31 33 36 38 41 44 47 50 45 48 45 48 45 48 46 49 48 46 46 49
St. Vincent 7 7 7 7 7 7 7 7 7 7 7 7 7 7 7 7 7 7 7 7
Lowmans Bay 98 105 113 121 129 139 149 159 143 153 142 152 143 153 146 156 151 147 145 155
Bequia 7 7 8 8 9 10 10 11 10 11 10 11 10 11 10 11 11 10 10 11
Union Island 6 6 7 7 8 8 9 9 8 9 8 9 8 9 9 9 9 9 9 9
Canouan 7 8 8 9 10 10 11 12 11 12 11 11 11 11 11 12 11 11 11 12
Mayreay 0 0 0 0 0 1 1 1 1 1 1 1 1 1 1 1 1 1 1 1
10 MW MSD 0 0 0 0 0 0 0 0 41 44 82 88 124 132 168 180 218 255 292 312
10 MW CFB 0 0 0 0 0 0 0 0 0 0 0 0 0 0 0 0 0 0 0 0
Wind 0 0 0 0 0 0 0 0 0 0 0 0 0 0 0 0 0 0 0 0
Total Generation (GWh) 156 167 178 191 204 218 233 249 266 284 304 325 348 372 397 425 454 485 519 555
Table A-33 St. Vincent and Grenadines Base Case Cost Summary (Million 2009 US$)
Year 2009 2010 2011 2012 2013 2014 2015 2016 2017 2018 2019 2020 2021 2022 2023 2024 2025 2026 2027 2028Fuel and O&M Costs
St. Vincent 4.7 5.2 5.9 6.8 7.5 8.3 9.2 9.9 9.0 9.6 9.0 9.6 9.1 9.8 9.4 10.1 9.9 9.8 9.7 10.6St. Vincent 0.2 0.2 0.2 0.2 0.2 0.2 0.2 0.2 0.2 0.2 0.2 0.2 0.2 0.2 0.2 0.2 0.2 0.2 0.2 0.2
Lowmans Bay 14.1 15.4 17.6 20.4 22.3 24.8 27.3 29.4 26.7 28.6 26.7 28.6 27.2 29.3 27.9 30.2 29.5 29.1 29.0 31.7Bequia 1.1 1.2 1.4 1.6 1.8 2.0 2.2 2.3 2.1 2.3 2.1 2.3 2.1 2.3 2.2 2.4 2.3 2.3 2.3 2.5
Union Island 1.0 1.1 1.2 1.4 1.5 1.7 1.9 2.0 1.8 2.0 1.8 2.0 1.9 2.0 1.9 2.1 2.0 2.0 2.0 2.2Canouan 1.2 1.3 1.5 1.7 1.9 2.1 2.3 2.5 2.3 2.4 2.3 2.4 2.3 2.5 2.4 2.5 2.5 2.5 2.5 2.7Mayreay 0.1 0.1 0.1 0.1 0.1 0.1 0.1 0.1 0.1 0.1 0.1 0.1 0.1 0.1 0.1 0.1 0.1 0.1 0.1 0.2
10 MW MSD 0.0 0.0 0.0 0.0 0.0 0.0 0.0 0.0 7.6 8.1 15.1 16.2 23.1 24.9 31.6 34.2 41.9 49.5 57.6 62.910 MW CFB 0.0 0.0 0.0 0.0 0.0 0.0 0.0 0.0 0.0 0.0 0.0 0.0 0.0 0.0 0.0 0.0 0.0 0.0 0.0 0.0
Wind 0.0 0.0 0.0 0.0 0.0 0.0 0.0 0.0 0.0 0.0 0.0 0.0 0.0 0.0 0.0 0.0 0.0 0.0 0.0 0.0Production Cost (million $) 22 25 28 32 35 39 43 47 50 53 57 61 66 71 76 82 89 96 104 113
Investment Costs (million $) 0 0 0 0 0 0 0 0 4.5 0 4.5 0 4.5 0 4.5 0 4.5 4.5 4.5 0
Total System Costs (million $) 22 25 28 32 35 39 43 47 54 53 62 61 71 71 80 82 93 100 108 113

Caribbean Regional Electricity Generation, Interconnection, and Fuels Supply Strategy – Final Report A-36
Table A-34 Base Case Production Cost Summary (Million 2009 US$)
Year 2009 2010 2011 2012 2013 2014 2015 2016 2017 2018 2019 2020 2021 2022 2023 2024 2025 2026 2027 2028
Antigua and Barbuda 48 49 52 74 76 81 86 90 92 95 99 102 106 110 112 117 122 126 131 138
Barbados 163 188 202 223 234 252 268 279 289 299 311 319 331 343 350 364 379 392 407 429
Dominica 13 13 15 15 16 17 19 19 20 21 21 21 22 23 23 24 25 26 27 28
Dominican Republic 1,149 1,458 1,588 1,637 1,729 1,834 1,827 1,907 1,983 1,972 2,061 2,034 2,092 2,176 2,175 2,304 2,361 2,424 2,561 2,647
Grenada 32 35 39 45 47 52 56 58 61 65 68 72 76 80 84 88 94 99 106 114
Haiti 82 94 111 133 151 175 199 222 245 272 301 333 352 374 391 416 442 469 499 535
Jamaica 547 791 888 912 983 987 987 971 1,015 999 1,046 1,020 1,018 991 1,029 960 1,005 942 985 1,003
St. Kitts 23 25 27 30 32 34 37 38 39 40 42 43 45 46 47 49 51 53 56 58
Nevis 9 11 12 15 16 17 19 20 20 21 22 23 24 25 26 27 29 30 32 34
St. Lucia 51 53 58 65 69 74 79 81 84 87 90 93 96 100 103 107 111 116 121 127
St. Vincent and Grenadines 22 25 28 32 35 39 43 47 50 53 57 61 66 71 76 82 89 96 104 113
Fuel Savings (exports) 0 0 0 0 0 0 0 0 0 0 0 0 0 0 0 0 0 0 0 0
Total 2,139 2,740 3,020 3,182 3,389 3,564 3,620 3,732 3,900 3,924 4,118 4,122 4,228 4,338 4,416 4,539 4,708 4,772 5,027 5,226
Table A-35 Base Case Investment Cost Summary (Million 2009 US$)
Year 2009 2010 2011 2012 2013 2014 2015 2016 2017 2018 2019 2020 2021 2022 2023 2024 2025 2026 2027 2028 Salvage Value
Antigua and Barbuda 0 0 5 5 5 0 0 0 0 0 0 5 0 0 5 0 0 5 0 0 13
Barbados 0 0 14 14 7 0 0 0 0 0 0 7 0 7 7 7 0 10 10 0 45
Dominica 0 0 0 2 0 0 0 0 0 0 0 2 0 0 0 0 0 2 0 0 4
Dominican Republic 0 385 113 428 0 0 285 0 23 285 0 285 0 23 285 0 285 285 0 285 2,040
Grenada 0 0 0 0 5 0 0 5 0 0 5 0 0 5 0 5 0 5 0 5 21
Haiti 38 10 10 10 10 0 10 10 10 10 19 10 10 10 19 10 19 10 19 19 139
Jamaica 0 97 8 272 0 132 220 220 0 220 0 220 220 220 0 440 0 440 0 220 2,160
St. Kitts 0 0 0 2 0 0 2 0 0 2 0 2 0 2 0 0 2 0 2 0 9
Nevis 0 0 2 0 0 0 0 0 2 0 0 0 2 0 0 2 0 0 2 0 7
St. Lucia 0 10 0 0 0 0 0 10 0 0 0 0 10 0 0 0 10 0 0 0 19
St. Vincent and Grenadines 0 0 0 0 0 0 0 0 5 0 5 0 5 0 5 0 5 5 5 0 23
Interconnection Costs 0 0 0 0 0 0 0 0 0 0 0 0 0 0 0 0 0 0 0 0 0
Total 38 501 151 732 26 132 517 244 39 517 28 531 246 266 320 464 321 760 38 529 4,480

Caribbean Regional Electricity Generation, Interconnection, and Fuels Supply Strategy – Final Report A-37
A.2 FUEL SCENARIO
Tables A-36 to A-59 present system analysis results for the Fuel Scenario. As for the Base Case, for each country (or island) results are presented in three tables: capacity balance, energy balance, and cost summary tables.
Tables A-60 and A-61 present total system production and investment cost results. The Investment Cost Summary table also includes the salvage value for all investments at the end of the planning period.
A.2.1 Antigua and Barbuda
Tables A-36 to A-38 present system analysis results for Antigua and Barbuda. For the Fuel Scenario, and other development cases, assumed committed system additions are six 5 MW Casada Gardens units during 2011-2013. Those unit additions would satisfy reserve margin requirements until 2019.
During 2020-2028 the system will require additional generation units. For the Fuel Scenario, new unit additions are assumed to be 10 MW CFB units using imported coal. By 2028 the system will need another 30 MW (3 x 10 MW units) to meet the required capacity.
A.2.2 Barbados
Tables A-39 to A-41 present system analysis results for Barbados. For the Fuel Scenario, assumed system additions are the same as for the Base Case Scenario. The difference is that in this scenario most existing and all new units will be using natural gas as a fuel. Natural gas will be supplied through the gas pipeline.
A.2.3 Dominica
Dominica does not have a potentially less expensive fossil fuel option, only a renewable option which will be analyzed in another Scenario. The same results as in the Base Case Scenario apply for Dominica in the Fuel Scenario and are not duplicated here.
A.2.4 Dominican Republic
Tables A-42 to A-44 present system analysis results for Dominican Republic for the Fuel Scenario. During the first years, as in the Base Case, we assumed buildup of the already committed hydro and wind resources. Starting in 2012 Dominican Republic will require additional generating units. For the Fuel Scenario, new additions are assumed to be coal based units. The first additions are planned (Montecristi and Haltillo-Azua) units, followed by generic 300 MW conventional coal units using imported coal. This scenario again includes additions of 50 MW GT units to supply peaking generation. Results of the analysis show that by 2028 the system will need another 2,400 MW (8 x 300 MW coal units) and 100 MW of GT units.

Caribbean Regional Electricity Generation, Interconnection, and Fuels Supply Strategy – Final Report A-38
A.2.5 Grenada
Tables A-45 to A-47 present system analysis results for Grenada. For the Fuel Scenario, new unit additions are assumed to be 10 MW CFB units using imported coal. By 2028 the system will need an additional 70 MW (7 x 10 MW units) to cover projected load growth.
A.2.6 Haiti
Tables A-48 to A-50 present system analysis results for Haiti. For the Fuel Scenario, assumed system additions are the same as for the Base Case Scenario. The difference is that in this scenario all new units will be using natural gas as a fuel. The assumption is that natural gas will be supplied starting in 2014 from a new LNG terminal.
A.2.7 Jamaica
Tables A-51 to A-53 present Fuel Scenario system analysis results for Jamaica. Until 2014 we assumed the same buildup of already planned resources as in the Base Case. For the Fuel Scenario, starting in 2015 new additions are assumed to be 100 MW combined cycle units using natural gas supplied from two new LNG terminals. Natural gas will become available during 2014 and by 2014 about 450 MW in existing units are also assumed to be converted to use natural gas. Results of the analysis show that by 2028 the system will need another 1,100 MW (11 x 100 MW units) to cover projected load growth.
A.2.8 St. Kitts and Nevis
St. Kitts and Nevis does not have an alternative, potentially less expensive, fossil fuel option, only renewable option which will be analyzed in other scenario. The same results as in the Base Case Scenario apply for St. Kitts and Nevis in the Fuel Scenario and are not duplicated here.
A.2.9 St. Lucia
Tables A-54 to A-56 present system analysis results for St. Lucia. For the Fuel Scenario, assumed system additions are the same as for the Base Case Scenario. The difference is that in this scenario most existing and all new units will be using natural gas as a fuel. Natural gas will be supplied through the gas pipeline.
A.2.10 St. Vincent and Grenadines
Tables A-57 to A-59 present system analysis results for St. Vincent and Grenadines. St. Vincent and Grenadines will again require new capacity addition starting in 2017. For the Fuel Scenario, new unit additions are assumed to be 10 MW CFB units using imported coal. By 2028 the system will need another 70 MW (7 x 10 MW units) to cover projected load growth.
A.2.11 Total System Costs
Tables A-60 to A-61 present total system production and investment cost for the Fuel Scenario. The Fuel Scenario assumes no transmission interconnection among islands and thus shows no fuel savings associated for energy exports or interconnection costs.

Caribbean Regional Electricity Generation, Interconnection, and Fuels Supply Strategy – Final Report A-39
Table A-36 Antigua and Barbuda Fuel Scenario Capacity Balance
Year 2009 2010 2011 2012 2013 2014 2015 2016 2017 2018 2019 2020 2021 2022 2023 2024 2025 2026 2027 2028
Peak Load (MW) 54 57 60 63 65 67 69 71 73 75 77 80 82 85 87 90 92 95 98 101Exports(+)/Imports(-) (MW)
Existing Capacity (MW)APC (Pant) 15 15 15 15 15 15 15 15 15 15 15 15 15 15 15 15 15 15 15 15
APC Blk Pine 26 26 26 26 26 26 26 26 26 26 26 26 26 26 26 26 26 26 26 26Baker 4 4 4 4 4 4 4 4 4 4 4 4 4 4 4 4 4 4 4 4
APC Jt Vent 17 17 17 17 17 17 17 17 17 17 17 17 17 17 17 17 17 17 17 17Victor 8 8 8 8 8 8 8 8 8 8 8 8 8 8 8 8 8 8 8 8WIOC 0 0 0 0 0 0 0 0 0 0 0 0 0 0 0 0 0 0 0 0
Aggreko Rental 13 13 13 13 0 0 0 0 0 0 0 0 0 0 0 0 0 0 0 0Barbuda 7 7 7 7 7 7 7 7 7 7 7 7 7 7 7 7 7 7 7 7
Total Existing (MW) 90 90 90 90 77 77 77 77 77 77 77 77 77 77 77 77 77 77 77 77
Required Capacity (MW) 73 77 81 85 88 90 93 96 99 102 104 108 111 114 118 121 125 128 132 136Existing System Surplus(+)/Deficit(-) (MW) 17 13 9 5 -10 -13 -16 -19 -21 -24 -27 -31 -34 -37 -40 -44 -47 -51 -55 -59
New Capacity (MW)Casada Gardens 0 0 10 20 30 30 30 30 30 30 30 30 30 30 30 30 30 30 30 30
10 MW CFB 0 0 0 0 0 0 0 0 0 0 0 10 10 10 20 20 20 30 30 3010 MW MSD 0 0 0 0 0 0 0 0 0 0 0 0 0 0 0 0 0 0 0 0
Wind 0 0 0 0 0 0 0 0 0 0 0 0 0 0 0 0 0 0 0 0
Total Capacity (MW) 90 90 100 110 107 107 107 107 107 107 107 117 117 117 127 127 127 137 137 137
System Surplus(+)/Deficit(-) with Unit Additions (MW) 17 13 19 25 20 17 14 11 9 6 3 9 6 3 10 6 3 9 5 1
Reserve Margin (%) 66% 58% 67% 75% 65% 60.5% 55.8% 51.2% 46.8% 42.6% 38.5% 46.9% 42.6% 38.5% 45.9% 41.8% 37.8% 44.4% 40.3% 36.3%

Caribbean Regional Electricity Generation, Interconnection, and Fuels Supply Strategy – Final Report A-40
Table A-37 Antigua and Barbuda Fuel Scenario Energy Balance
Year 2009 2010 2011 2012 2013 2014 2015 2016 2017 2018 2019 2020 2021 2022 2023 2024 2025 2026 2027 2028
Energy (GWh) 318 315 312 410 422 434 447 461 475 489 503 519 534 550 567 583 600 618 636 654
Generation (GWh)
APC (Pant) 49 48 43 50 52 53 55 57 58 60 62 56 57 58 53 54 55 58 60 61
APC Blk Pine 101 100 88 104 107 110 114 117 121 124 128 115 118 121 109 111 113 109 111 114
Baker 13 13 11 13 14 14 15 15 16 16 16 15 15 16 14 14 15 16 16 16
APC Jt Vent 66 65 58 68 70 72 74 77 79 81 84 75 77 79 71 72 74 71 73 74
Victor 27 27 24 28 29 30 31 32 33 34 35 31 32 33 30 30 31 31 32 33
WIOC 0 0 0 0 0 0 0 0 0 0 0 0 0 0 0 0 0 0 0 0
Aggreko Rental 38 37 33 39 0 0 0 0 0 0 0 0 0 0 0 0 0 0 0 0
Barbuda 24 24 21 25 26 27 27 28 29 30 31 28 28 29 26 27 27 29 30 30
Casada Gardens 0 0 34 80 124 128 131 135 139 144 148 133 136 140 126 128 131 126 129 131
10 MW CFB 0 0 0 0 0 0 0 0 0 0 0 66 71 75 138 147 156 178 186 194
10 MW MSD 0 0 0 0 0 0 0 0 0 0 0 0 0 0 0 0 0 0 0 0
Wind 0 0 0 0 0 0 0 0 0 0 0 0 0 0 0 0 0 0 0 0
Total Generation (GWh) 318 315 312 410 422 434 447 461 475 489 503 519 534 550 567 583 600 618 636 654
Table A-38 Antigua and Barbuda Fuel Scenario Cost Summary
Year 2009 2010 2011 2012 2013 2014 2015 2016 2017 2018 2019 2020 2021 2022 2023 2024 2025 2026 2027 2028Fuel and O&M Costs
APC (Pant) 7.8 8.0 7.6 9.7 10.2 11.0 11.6 12.1 12.4 12.8 13.3 12.1 12.4 12.8 11.6 11.9 12.3 13.2 13.7 14.4APC Blk Pine 14.4 14.7 14.0 17.9 18.8 20.2 21.4 22.2 22.9 23.6 24.5 22.2 22.9 23.6 21.3 22.0 22.6 22.1 22.9 23.8
Baker 2.1 2.1 2.0 2.6 2.7 2.9 3.1 3.2 3.3 3.4 3.5 3.2 3.3 3.4 3.1 3.2 3.3 3.5 3.7 3.8APC Jt Vent 9.3 9.4 9.0 11.5 12.1 13.0 13.8 14.4 14.8 15.3 15.8 14.3 14.8 15.3 13.8 14.2 14.6 14.3 14.8 15.4
Victor 4.2 4.3 4.1 5.2 5.5 5.9 6.2 6.5 6.7 6.9 7.1 6.5 6.7 6.9 6.2 6.4 6.6 6.8 7.0 7.3WIOC 0.0 0.0 0.0 0.0 0.0 0.0 0.0 0.0 0.0 0.0 0.0 0.0 0.0 0.0 0.0 0.0 0.0 0.0 0.0 0.0
Aggreko Rental 6.8 7.0 6.6 8.5 0.0 0.0 0.0 0.0 0.0 0.0 0.0 0.0 0.0 0.0 0.0 0.0 0.0 0.0 0.0 0.0Barbuda 3.9 3.9 3.8 4.8 5.1 5.4 5.8 6.0 6.2 6.4 6.6 6.0 6.2 6.4 5.7 5.9 6.1 6.5 6.8 7.1
Casada Gardens 0.0 0.0 5.3 13.5 21.4 23.0 24.4 25.3 26.1 27.0 27.9 25.3 26.1 26.9 24.3 25.1 25.8 25.1 26.0 27.210 MW CFB 0.0 0.0 0.0 0.0 0.0 0.0 0.0 0.0 0.0 0.0 0.0 8.5 8.8 9.1 16.3 16.8 17.3 19.6 19.9 20.210 MW MSD 0.0 0.0 0.0 0.0 0.0 0.0 0.0 0.0 0.0 0.0 0.0 0.0 0.0 0.0 0.0 0.0 0.0 0.0 0.0 0.0
Wind 0.0 0.0 0.0 0.0 0.0 0.0 0.0 0.0 0.0 0.0 0.0 0.0 0.0 0.0 0.0 0.0 0.0 0.0 0.0 0.0Production Cost (million $) 48 49 52 74 76 81 86 90 92 95 99 98 101 104 102 106 109 111 115 119
Investment Costs (million $) 0 0 4.5 4.5 4.5 0 0 0 0 0 0 25.5 0 0 25.5 0 0 25.5 0 0
Total System Costs (million $) 48 49 57 78 80 81 86 90 92 95 99 124 101 104 128 106 109 137 115 119

Caribbean Regional Electricity Generation, Interconnection, and Fuels Supply Strategy – Final Report A-41
Table A-39 Barbados Fuel Scenario Capacity Balance
Year 2009 2010 2011 2012 2013 2014 2015 2016 2017 2018 2019 2020 2021 2022 2023 2024 2025 2026 2027 2028
Peak Load (MW) 170 176 182 188 195 201 208 216 223 231 239 247 256 265 274 284 294 304 314 325Exports(+)/Imports(-) (MW)
Existing Capacity (MW)Spring Garden 25 25 25 25 25 25 25 25 25 25 25 25 25 25 25 25 25 25 25 25Spring Garden 13 13 13 13 13 13 13 13 13 13 13 13 13 13 13 13 13 13 13 13Spring Garden 13 13 13 13 13 13 13 13 13 13 13 13 13 13 13 13 13 13 13 13Spring Garden 61 61 61 61 61 61 61 61 61 61 61 61 61 61 61 61 61 61 61 61Spring Garden 40 40 40 40 40 40 40 40 40 40 40 40 40 40 40 40 40 40 40 40
Sewall 86 86 86 86 86 86 86 86 86 86 86 86 86 86 86 86 86 86 86 86
Total Existing (MW) 238 238 238 238 238 238 238 238 238 238 238 238 238 238 238 238 238 238 238 238
Required Capacity (MW) 221 228 236 245 253 262 271 280 290 300 311 322 333 344 356 369 382 395 409 423Existing System Surplus(+)/Deficit(-) (MW) 18 10 2 -6 -15 -23 -33 -42 -52 -62 -72 -83 -94 -106 -118 -130 -143 -157 -170 -185
New Capacity (MW)Trent 0 0 32 64 80 80 80 80 80 80 80 96 96 112 128 144 144 144 144 144
20 MW LSD 0 0 0 0 0 0 0 0 0 0 0 0 0 0 0 0 0 20 40 400 0 0 0 0 0 0 0 0 0 0 0 0 0 0 0 0 0 0 0 0
Wind 0 0 0 0 0 0 0 0 0 0 0 0 0 0 0 0 0 0 0 0
Total Capacity (MW) 238 238 270 302 318 318 318 318 318 318 318 334 334 350 366 382 382 402 422 422
System Surplus(+)/Deficit(-) with Unit Additions (MW) 18 10 34 58 65 57 47 38 28 18 8 13 2 6 10 14 1 7 14 -1
Reserve Margin (%) 40% 36% 49% 61% 64% 58.1% 52.8% 47.6% 42.6% 37.8% 33.2% 35.2% 30.6% 32.3% 33.6% 34.8% 30.2% 32.4% 34.3% 29.8%

Caribbean Regional Electricity Generation, Interconnection, and Fuels Supply Strategy – Final Report A-42
Table A-40 Barbados Fuel Scenario Energy Balance
Year 2009 2010 2011 2012 2013 2014 2015 2016 2017 2018 2019 2020 2021 2022 2023 2024 2025 2026 2027 2028
Energy (GWh) 1,039 1,073 1,107 1,143 1,180 1,218 1,258 1,298 1,340 1,384 1,428 1,475 1,522 1,572 1,622 1,675 1,729 1,785 1,843 1,902
Exports(+)/Imports(-) (GWh)
Generation (GWh)
Spring Garden 107 120 106 96 94 100 103 106 110 114 117 114 117 114 111 109 113 109 106 109
Spring Garden 57 63 56 51 49 53 54 56 58 60 62 60 62 60 59 58 59 57 56 58
Spring Garden 57 63 56 51 49 53 54 56 58 60 62 60 62 60 59 58 59 57 56 58
Spring Garden 280 314 278 252 245 259 268 276 286 295 305 295 304 296 289 283 293 283 275 284
Spring Garden 227 162 141 126 120 48 48 50 52 54 56 53 53 51 50 51 53 52 51 52
Sewall 312 349 308 278 270 306 316 326 336 347 358 347 359 349 341 333 343 331 320 331
Trent 0 0 161 290 353 400 414 427 441 454 469 546 565 641 714 784 809 780 755 779
20 MW LSD 0 0 0 0 0 0 0 0 0 0 0 0 0 0 0 0 0 116 224 231
Wind 0 0 0 0 0 0 0 0 0 0 0 0 0 0 0 0 0 0 0 0
Total Generation (GWh) 1039 1073 1107 1143 1180 1218 1258 1298 1340 1384 1428 1475 1522 1572 1622 1675 1729 1785 1843 1902
Table A-41 Barbados Fuel Scenario Cost Summary (Million 2009 US$)
Year 2009 2010 2011 2012 2013 2014 2015 2016 2017 2018 2019 2020 2021 2022 2023 2024 2025 2026 2027 2028Fuel and O&M Costs
Spring Garden 16.4 18.9 18.0 17.8 17.8 7.8 8.1 8.4 8.7 9.1 9.4 9.0 9.0 8.8 8.7 8.8 9.2 9.1 9.1 9.5Spring Garden 8.7 10.0 9.5 9.4 9.4 4.1 4.3 4.4 4.6 4.8 5.0 4.7 4.8 4.7 4.6 4.6 4.9 4.8 4.8 5.0Spring Garden 8.7 10.0 9.5 9.4 9.4 4.1 4.3 4.4 4.6 4.8 5.0 4.7 4.8 4.7 4.6 4.6 4.9 4.8 4.8 5.0Spring Garden 40.1 46.1 43.8 43.3 43.3 19.1 19.7 20.4 21.2 22.1 22.9 21.9 22.0 21.5 21.1 21.4 22.5 22.3 22.1 23.2Spring Garden 26.3 30.2 28.7 28.4 28.4 12.5 12.9 13.4 13.9 14.5 15.1 14.4 14.4 14.1 13.8 14.0 14.8 14.6 14.5 15.2
Sewall 62.7 72.3 68.7 67.9 67.9 28.9 29.9 31.0 32.2 33.7 35.1 33.4 33.6 32.9 32.2 32.6 34.5 34.1 33.8 35.5Trent 0.0 0.0 23.6 46.7 58.4 25.9 26.7 27.6 28.7 29.9 31.1 35.6 35.8 40.9 45.8 52.1 55.0 54.4 54.0 56.5
20 MW LSD 0.0 0.0 0.0 0.0 0.0 0.0 0.0 0.0 0.0 0.0 0.0 0.0 0.0 0.0 0.0 0.0 0.0 7.8 15.6 16.3Wind 0.0 0.0 0.0 0.0 0.0 0.0 0.0 0.0 0.0 0.0 0.0 0.0 0.0 0.0 0.0 0.0 0.0 0.0 0.0 0.0
Production Cost (million $) 163 188 202 223 234 102 106 110 114 119 124 124 124 128 131 138 146 152 159 166
Investment Costs (million $) 0 0 14.4 14.4 7.2 0 0 0 0 0 0 7.2 0 7.2 7.2 7.2 0 9.6 9.6 0
Total System Costs (million $) 163 188 216 237 242 102 106 110 114 119 124 131 124 135 138 145 146 162 168 166

Caribbean Regional Electricity Generation, Interconnection, and Fuels Supply Strategy – Final Report A-43
Table A-42 Dominican Republic Fuel Scenario Capacity Balance
Year Inputs 2009 2010 2011 2012 2013 2014 2015 2016 2017 2018 2019 2020 2021 2022 2023 2024 2025 2026 2027 2028
Peak Load (MW) 2,353 2,447 2,544 2,640 2,727 2,803 2,896 2,992 3,091 3,194 3,300 3,409 3,522 3,638 3,758 3,882 4,010 4,143 4,280 4,421Exports(+)/Imports(-) (MW)
Existing Capacity (MW)Andres 290 290 290 290 290 290 290 290 290 290 290 290 290 290 290 290 290 290 290 290 290
Itabo 128 128 128 128 128 128 128 128 128 128 128 128 128 128 128 128 128 128 128 128 128Itabo 101 101 101 101 101 101 101 101 101 101 101 101 101 101 101 101 101 101 101 101 101
Los Mina 118 236 236 236 236 236 236 236 236 236 236 236 236 236 236 236 236 236 236 236 236Itabo 35 35 35 35 35 35 35 35 35 35 35 35 35 35 35 35 35 35 35 35 35
Higuamo 0 0 0 0 0 0 0 0 0 0 0 0 0 0 0 0 0 0 0 0 0Haina 50 100 100 100 100 100 100 100 100 100 100 100 100 100 100 100 100 100 100 100 100Haina 72 72 72 72 72 72 72 72 72 72 72 72 72 72 72 72 72 72 72 72 72
San Pedro 33 33 33 33 33 33 33 33 33 33 33 33 33 33 33 33 33 33 33 33 33Puerto Plata 28 28 28 28 28 28 28 28 28 28 28 28 28 28 28 28 28 28 28 28 28Puerto Plata 39 39 39 39 39 39 39 39 39 39 39 39 39 39 39 39 39 39 39 39 39
Haina 100 100 100 100 100 100 100 100 100 100 100 100 100 100 100 100 100 100 100 100 100Barahona 46 46 46 46 46 46 46 46 46 46 46 46 46 46 46 46 46 46 46 46 46
Sultana DE 11 102 102 102 102 102 102 102 102 102 102 102 102 102 102 102 102 102 102 102 102CESPM. 100 300 300 300 300 300 300 300 300 300 300 300 300 300 300 300 300 300 300 300 300
San Felipe 185 185 185 185 185 185 185 185 185 185 185 185 185 185 185 185 185 185 185 185 185Palamara 107 107 107 107 107 107 107 107 107 107 107 107 107 107 107 107 107 107 107 107 107La Vega 88 88 88 88 88 88 88 88 88 88 88 88 88 88 88 88 88 88 88 88 88
CEPP 17 17 17 17 17 17 17 17 17 17 17 17 17 17 17 17 17 17 17 17 17CEPP 50 50 50 50 50 50 50 50 50 50 50 50 50 50 50 50 50 50 50 50 50
Seaboard 43 43 43 43 43 43 43 43 43 43 43 43 43 43 43 43 43 43 43 43 43Seaboard 73 73 73 73 73 73 73 73 73 73 73 73 73 73 73 73 73 73 73 73 73
Monte Rio 100 100 100 100 100 100 100 100 100 100 100 100 100 100 100 100 100 100 100 100 100Metaldom 42 42 42 42 42 42 42 42 42 42 42 42 42 42 42 42 42 42 42 42 42
Laesa 32 32 32 32 32 32 32 32 32 32 32 32 32 32 32 32 32 32 32 32 32Maxon 30 30 30 30 30 30 30 30 30 30 30 30 30 30 30 30 30 30 30 30 30
Falconbridge 12 36 36 36 36 36 36 36 36 36 36 36 36 36 36 36 36 36 36 36 36Reservoir Hydro 387 387 387 387 387 387 387 387 387 387 387 387 387 387 387 387 387 387 387 387 387
Non Reser Hydro 85 85 85 85 85 85 85 85 85 85 85 85 85 85 85 85 85 85 85 85 85
Total Existing (MW) 2,883 2,883 2,883 2,883 2,883 2,883 2,883 2,883 2,883 2,883 2,883 2,883 2,883 2,883 2,883 2,883 2,883 2,883 2,883 2,883
Required Capacity (MW) 2,941 3,059 3,180 3,300 3,409 3,504 3,620 3,740 3,864 3,993 4,125 4,261 4,402 4,547 4,698 4,853 5,013 5,179 5,350 5,526Existing System Surplus(+)/Deficit(-) (MW) -58 -176 -297 -417 -526 -621 -737 -857 -981 -1,110 -1,242 -1,378 -1,519 -1,664 -1,815 -1,970 -2,130 -2,296 -2,467 -2,643

Caribbean Regional Electricity Generation, Interconnection, and Fuels Supply Strategy – Final Report A-44
New Capacity (MW)Pinalto 50 50 50 50 50 50 50 50 50 50 50 50 50 50 50 50 50 50 50 50 50
Palomino 100 100 100 100 100 100 100 100 100 100 100 100 100 100 100 100 100 100 100 100 100Hatillo et al 17 0 17 17 17 17 17 17 17 17 17 17 17 17 17 17 17 17 17 17 17
Las Placetas 87 0 87 87 87 87 87 87 87 87 87 87 87 87 87 87 87 87 87 87 87Arbonito 45 0 0 45 45 45 45 45 45 45 45 45 45 45 45 45 45 45 45 45 45
Hondo Valle et al 57 0 0 0 57 57 57 57 57 57 57 57 57 57 57 57 57 57 57 57 57300 MW CC 300 0 0 0 0 0 0 0 0 0 0 0 0 0 0 0 0 0 0 0 0
300 MW ConvCoal 300 0 0 0 0 0 0 0 0 0 0 0 0 0 0 300 300 600 900 900 1,200Montecristi 305 0 0 0 305 305 305 610 610 610 610 610 610 610 610 610 610 610 610 610 610
Haltillo-Azua 305 0 0 0 0 0 0 0 0 0 305 305 610 610 610 610 610 610 610 610 61050 MW GT 50 0 0 0 0 0 0 0 0 50 50 50 50 50 100 100 100 100 100 100 100
Montafongo,Bani,El Norte 50 0 100 100 100 100 100 100 100 100 100 100 100 100 100 100 100 100 100 100 100Wind 2 0 0 0 0 0 0 0 0 0 0 0 0 0 0 0 0 0 0 0 0
Total Capacity (MW) 3,033 3,137 3,182 3,544 3,544 3,544 3,849 3,849 3,899 4,204 4,204 4,509 4,509 4,559 4,859 4,859 5,159 5,459 5,459 5,759
System Surplus(+)/Deficit(-) with Unit Additions (MW) 92 78 2 244 135 40 229 109 35 211 79 248 107 12 161 6 146 280 109 233
Reserve Margin (%) 29% 28% 25% 34% 30% 26.4% 32.9% 28.6% 26.1% 31.6% 27.4% 32.3% 28.0% 25.3% 29.3% 25.2% 28.6% 31.8% 27.6% 30.3%

Caribbean Regional Electricity Generation, Interconnection, and Fuels Supply Strategy – Final Report A-45
Table A-43 Dominican Republic Fuel Scenario Energy Balance
Year Inputs 2009 2010 2011 2012 2013 2014 2015 2016 2017 2018 2019 2020 2021 2022 2023 2024 2025 2026 2027 2028
Energy (GWh) 12,638 13,142 13,663 14,179 14,646 15,054 15,554 16,070 16,601 17,154 17,724 18,309 18,914 19,539 20,184 20,851 21,539 22,251 22,986 23,745
Exports(+)/Imports(-) (GWh)
Generation (GWh)
Andres 1709 1476 1562 1220 1285 1340 1185 1236 1259 1128 1161 1071 1130 1164 1081 1098 1015 950 965 903
Itabo 1004 820 866 653 682 707 625 650 664 597 622 572 594 610 568 591 559 532 553 530
Itabo 706 583 614 465 486 504 445 463 473 426 443 407 423 434 404 421 397 378 393 376
Los Mina 865 1013 1044 864 892 915 803 836 856 775 802 736 765 786 736 759 711 672 691 654
Itabo 73 164 171 160 166 173 153 159 164 151 157 145 151 155 147 153 145 139 144 139
Higuamo 0 0 0 0 0 0 0 0 0 0 0 0 0 0 0 0 0 0 0 0
Haina 362 410 428 397 415 431 381 396 410 376 391 360 374 384 364 378 358 340 354 339
Haina 267 284 296 271 283 294 259 270 279 256 266 244 254 261 247 257 243 231 240 230
San Pedro 123 138 144 133 140 145 128 133 138 126 132 121 126 129 123 127 120 115 119 114
Puerto Plata 103 116 121 112 117 121 107 111 115 106 110 101 105 108 102 107 101 96 100 95
Puerto Plata 146 163 170 158 165 171 151 158 163 149 156 143 149 153 145 150 142 135 141 135
Haina 237 465 483 448 465 482 426 443 458 420 438 404 420 431 409 426 403 384 399 384
Barahona 302 252 265 202 211 218 193 201 205 185 192 177 183 188 175 182 172 164 170 163
Sultana DE 487 363 370 314 325 335 294 306 315 287 298 273 283 291 275 285 268 255 263 251
CESPM. 1057 1257 1283 1097 1133 1165 1024 1065 1096 1000 1038 955 990 1017 959 997 939 893 924 882
San Felipe 515 771 795 712 737 761 672 699 720 659 686 633 656 674 638 664 627 597 619 594
Palamara 523 401 410 353 366 377 331 345 355 324 337 309 321 329 311 323 304 289 299 285
La Vega 425 328 335 289 300 309 272 282 291 266 276 253 263 270 255 265 249 237 245 234
CEPP 75 62 64 56 58 60 53 55 56 52 54 49 51 53 50 52 49 46 48 46
CEPP 226 188 193 169 176 181 160 166 171 156 163 149 155 159 150 156 147 140 145 138
Seaboard 202 161 165 144 149 154 135 141 145 132 138 126 131 135 127 132 124 118 122 117
Seaboard 369 275 281 240 249 256 225 234 241 220 228 210 217 223 211 219 206 196 202 193
Monte Rio 516 377 383 326 337 347 305 317 326 298 309 284 294 302 285 295 278 264 273 260
Metaldom 202 157 161 139 144 149 131 136 140 128 133 122 127 130 123 127 120 114 118 113
Laesa 116 123 128 118 123 127 113 117 121 111 115 106 110 113 107 112 105 100 104 100
Maxon 75 118 122 110 114 118 104 108 112 102 106 98 102 105 99 103 97 93 96 92
Falconbridge 129 144 150 139 145 150 133 138 143 131 136 125 130 134 127 132 125 119 123 118
Reservoir Hydro 1255 1255 1255 1255 1255 1255 1255 1255 1255 1255 1255 1255 1255 1255 1255 1255 1255 1255 1255 1255
Non Reser Hydro 276 276 276 276 276 276 276 276 276 276 276 276 276 276 276 276 276 276 276 276

Caribbean Regional Electricity Generation, Interconnection, and Fuels Supply Strategy – Final Report A-46
Pinalto 143 143 143 143 143 143 143 143 143 143 143 143 143 143 143 143 143 143 143 143
Palomino 150 150 150 150 150 150 150 150 150 150 150 150 150 150 150 150 150 150 150 150
Hatillo et al 0 123 123 123 123 123 123 123 123 123 123 123 123 123 123 123 123 123 123 123
Las Placetas 0 331 331 331 331 331 331 331 331 331 331 331 331 331 331 331 331 331 331 331
Arbonito 0 0 125 125 125 125 125 125 125 125 125 125 125 125 125 125 125 125 125 125
Hondo Valle et al 0 0 0 219 219 219 219 219 219 219 219 219 219 219 219 219 219 219 219 219
300 MW CC 0 0 0 0 0 0 0 0 0 0 0 0 0 0 0 0 0 0 0 0
300 MW ConvCoal 0 0 0 0 0 0 0 0 0 0 0 0 0 0 1727 1799 3406 4870 5070 6491
Montecristi 0 0 0 2013 2105 2187 3870 4027 4109 3692 3850 3543 3678 3778 3511 3658 3463 3301 3437 3299
Haltillo-Azua 0 0 0 0 0 0 0 0 0 1846 1925 3543 3678 3778 3511 3658 3463 3301 3437 3299
50 MW GT 0 0 0 0 0 0 0 0 198 178 184 169 177 364 340 347 323 304 311 292
Montafongo,Bani,El Norte 0 256 256 256 256 256 256 256 256 256 256 256 256 256 256 256 256 256 256 256
Wind 0 0 0 0 0 0 0 0 0 0 0 0 0 0 0 0 0 0 0 0
Total Generation (GWh) 12638 13142 13663 14179 14646 15054 15554 16070 16601 17154 17724 18309 18914 19539 20184 20851 21539 22251 22986 23745

Caribbean Regional Electricity Generation, Interconnection, and Fuels Supply Strategy – Final Report A-47
Table A-44 Dominican Republic Fuel Scenario Cost Summary (Million 2009 US$)
Year 2009 2010 2011 2012 2013 2014 2015 2016 2017 2018 2019 2020 2021 2022 2023 2024 2025 2026 2027 2028Fuel and O&M Costs
Andres 140.2 123.0 127.0 101.1 103.7 106.7 95.3 99.1 101.4 92.7 95.7 87.5 89.6 92.3 86.5 90.3 86.1 82.8 85.6 81.9Itabo 58.8 47.3 49.4 38.5 39.9 41.4 37.1 38.6 39.4 35.9 36.9 33.8 35.0 36.0 33.7 34.8 32.8 31.3 32.0 30.3Itabo 45.0 36.8 38.3 30.1 31.2 32.3 29.0 30.2 30.8 28.1 28.8 26.5 27.4 28.2 26.4 27.2 25.7 24.5 25.1 23.8
Los Mina 114.0 133.6 134.7 112.2 113.1 114.8 101.2 105.2 108.2 99.5 103.5 93.6 94.7 97.5 91.8 97.4 93.7 90.9 95.2 91.7Itabo 16.0 36.4 40.7 41.9 44.8 48.5 44.4 46.6 48.2 44.5 46.7 43.4 45.3 47.0 44.5 47.0 45.1 43.4 45.7 45.1
Higuamo 0.0 0.0 0.0 0.0 0.0 0.0 0.0 0.0 0.0 0.0 0.0 0.0 0.0 0.0 0.0 0.0 0.0 0.0 0.0 0.0Haina 45.0 80.5 91.5 93.7 102.2 111.0 101.4 106.4 110.3 101.8 106.6 97.8 102.5 106.2 100.7 105.4 100.8 96.8 102.2 99.5Haina 32.1 53.4 60.4 61.3 66.7 72.3 66.1 69.3 71.8 66.2 69.3 63.6 66.7 69.0 65.4 68.5 65.5 62.9 66.3 64.5
San Pedro 15.2 26.9 30.6 31.4 34.2 37.2 34.0 35.6 37.0 34.1 35.7 32.8 34.4 35.6 33.7 35.3 33.8 32.4 34.2 33.3Puerto Plata 12.7 22.5 25.6 26.2 28.6 31.1 28.4 29.8 30.9 28.5 29.9 27.4 28.7 29.8 28.2 29.5 28.2 27.1 28.6 27.9Puerto Plata 17.9 31.8 36.2 37.1 40.4 43.9 40.1 42.1 43.7 40.3 42.2 38.7 40.6 42.1 39.9 41.8 39.9 38.3 40.5 39.4
Haina 47.1 94.6 105.6 107.5 114.7 124.0 113.4 119.0 123.2 113.6 119.2 110.6 115.5 119.9 113.3 119.7 114.7 110.4 116.3 114.5Barahona 20.3 16.7 17.5 13.7 14.2 14.7 13.2 13.8 14.0 12.8 13.2 12.1 12.5 12.9 12.1 12.4 11.7 11.2 11.4 10.8
Sultana DE 43.2 50.3 55.4 52.2 56.1 60.1 54.8 57.3 59.1 54.4 56.6 52.1 54.4 56.2 53.2 55.4 52.9 50.8 53.2 51.6CESPM. 145.0 175.9 192.3 181.1 191.9 205.5 187.5 196.3 202.2 186.0 194.2 180.0 187.5 194.2 183.1 192.4 183.9 177.0 185.2 181.3
San Felipe 88.6 133.4 147.2 144.8 153.8 165.5 151.4 158.7 163.7 151.0 158.0 146.8 153.0 158.5 149.9 157.8 151.1 145.6 152.8 150.1Palamara 47.7 57.9 64.1 61.3 66.0 70.9 64.7 67.7 69.9 64.3 67.1 61.7 64.5 66.7 63.1 65.8 62.8 60.4 63.3 61.4La Vega 39.0 47.6 52.8 50.5 54.4 58.4 53.3 55.8 57.6 53.1 55.3 50.9 53.2 55.0 52.0 54.3 51.8 49.8 52.2 50.7
CEPP 7.4 9.6 10.7 10.4 11.2 12.1 11.1 11.6 12.0 11.0 11.5 10.6 11.1 11.4 10.8 11.3 10.8 10.4 10.9 10.6CEPP 22.3 29.1 32.4 31.5 34.1 36.7 33.5 35.1 36.2 33.4 34.8 32.0 33.5 34.7 32.8 34.3 32.7 31.4 33.0 32.1
Seaboard 19.2 24.2 26.9 25.9 27.9 30.1 27.4 28.7 29.7 27.3 28.5 26.2 27.4 28.3 26.8 28.0 26.7 25.7 26.9 26.2Seaboard 32.7 38.7 42.7 40.6 43.6 46.9 42.7 44.7 46.1 42.5 44.3 40.7 42.5 44.0 41.6 43.4 41.4 39.8 41.7 40.5
Monte Rio 44.6 51.7 57.0 53.8 57.8 62.0 56.6 59.2 61.1 56.2 58.6 53.9 56.2 58.1 55.0 57.3 54.7 52.6 55.1 53.4Metaldom 18.7 23.0 25.5 24.5 26.4 28.4 25.9 27.1 28.0 25.7 26.8 24.7 25.8 26.7 25.2 26.3 25.2 24.2 25.3 24.6
Laesa 14.1 23.4 26.4 26.8 29.1 31.6 28.8 30.2 31.3 28.9 30.2 27.8 29.1 30.1 28.6 29.9 28.6 27.5 28.9 28.2Maxon 13.5 21.3 23.5 23.3 24.8 26.7 24.4 25.6 26.4 24.4 25.5 23.7 24.7 25.6 24.2 25.5 24.5 23.6 24.7 24.3
Falconbridge 16.0 28.1 31.8 32.5 35.4 38.4 35.1 36.8 38.1 35.2 36.8 33.8 35.5 36.7 34.8 36.4 34.8 33.5 35.3 34.4Reservoir Hydro 21.8 21.8 21.8 21.8 21.8 21.8 21.8 21.8 21.8 21.8 21.8 21.8 21.8 21.8 21.8 21.8 21.8 21.8 21.8 21.8
Non Reser Hydro 4.8 4.8 4.8 4.8 4.8 4.8 4.8 4.8 4.8 4.8 4.8 4.8 4.8 4.8 4.8 4.8 4.8 4.8 4.8 4.8
Pinalto 2.1 2.1 2.1 2.1 2.1 2.1 2.1 2.1 2.1 2.1 2.1 2.1 2.1 2.1 2.1 2.1 2.1 2.1 2.1 2.1Palomino 3.7 3.7 3.7 3.7 3.7 3.7 3.7 3.7 3.7 3.7 3.7 3.7 3.7 3.7 3.7 3.7 3.7 3.7 3.7 3.7
Hatillo et al 0.0 0.9 0.9 0.9 0.9 0.9 0.9 0.9 0.9 0.9 0.9 0.9 0.9 0.9 0.9 0.9 0.9 0.9 0.9 0.9Las Placetas 0.0 3.8 3.8 3.8 3.8 3.8 3.8 3.8 3.8 3.8 3.8 3.8 3.8 3.8 3.8 3.8 3.8 3.8 3.8 3.8
Arbonito 0.0 0.0 1.8 1.8 1.8 1.8 1.8 1.8 1.8 1.8 1.8 1.8 1.8 1.8 1.8 1.8 1.8 1.8 1.8 1.8Hondo Valle et al 0.0 0.0 0.0 2.5 2.5 2.5 2.5 2.5 2.5 2.5 2.5 2.5 2.5 2.5 2.5 2.5 2.5 2.5 2.5 2.5
300 MW CC 0.0 0.0 0.0 0.0 0.0 0.0 0.0 0.0 0.0 0.0 0.0 0.0 0.0 0.0 0.0 0.0 0.0 0.0 0.0 0.0300 MW ConvCoal 0.0 0.0 0.0 0.0 0.0 0.0 0.0 0.0 0.0 0.0 0.0 0.0 0.0 0.0 76.6 79.0 149.0 213.1 218.1 275.6
Montecristi 0.0 0.0 0.0 88.8 92.3 95.8 171.8 179.1 182.5 165.9 170.5 156.3 161.7 166.8 155.8 160.7 151.5 144.4 147.8 140.1Haltillo-Azua 0.0 0.0 0.0 0.0 0.0 0.0 0.0 0.0 0.0 82.9 85.3 156.3 161.7 166.8 155.8 160.7 151.5 144.4 147.8 140.1
50 MW GT 0.0 0.0 0.0 0.0 0.0 0.0 0.0 0.0 19.6 18.0 18.6 16.9 17.2 35.5 33.3 35.1 33.5 32.3 33.7 32.3Montafongo,Bani,El Norte 0.0 3.1 3.1 3.1 3.1 3.1 3.1 3.1 3.1 3.1 3.1 3.1 3.1 3.1 3.1 3.1 3.1 3.1 3.1 3.1
Wind 0.0 0.0 0.0 0.0 0.0 0.0 0.0 0.0 0.0 0.0 0.0 0.0 0.0 0.0 0.0 0.0 0.0 0.0 0.0 0.0Production Cost (million $) 1,149 1,458 1,588 1,587 1,683 1,791 1,717 1,794 1,867 1,803 1,875 1,807 1,876 1,956 1,923 2,008 1,990 1,983 2,064 2,065
Investment Costs (million $) 0 385 112.5 752.5 0 0 610 0 22.5 610 0 610 0 22.5 600 0 600 600 0 600
Total System Costs (million $) 1,149 1,843 1,701 2,340 1,683 1,791 2,327 1,794 1,889 2,413 1,875 2,417 1,876 1,979 2,523 2,008 2,590 2,583 2,064 2,665

Caribbean Regional Electricity Generation, Interconnection, and Fuels Supply Strategy – Final Report A-48
Table A-45 Grenada Fuel Scenario Capacity Balance
Year 2009 2010 2011 2012 2013 2014 2015 2016 2017 2018 2019 2020 2021 2022 2023 2024 2025 2026 2027 2028
Peak Load (MW) 31 33 34 36 38 40 42 45 47 50 52 55 58 61 64 68 72 75 80 84Exports(+)/Imports(-) (MW)
Existing Capacity (MW)Queens Park 17 17 17 17 17 17 17 17 17 17 17 17 17 17 17 17 17 17 17 17Queens Park 16 16 16 16 16 16 16 16 16 16 16 16 16 16 16 16 16 16 16 16Queens Park 16 16 16 16 16 16 16 16 16 16 16 16 16 16 16 16 16 16 16 16
Total Existing (MW) 49 49 49 49 49 49 49 49 49 49 49 49 49 49 49 49 49 49 49 49
Required Capacity (MW) 42 44 46 49 52 54 57 60 64 67 71 74 78 83 87 92 97 102 107 113Existing System Surplus(+)/Deficit(-) (MW) 7 4 2 0 -3 -6 -9 -12 -15 -18 -22 -26 -30 -34 -39 -43 -48 -53 -59 -65
New Capacity (MW)10 MW MSD 0 0 0 0 0 0 0 0 0 0 0 0 0 0 0 0 0 0 0 010 MW CFB 0 0 0 0 10 10 10 20 20 20 30 30 30 40 40 50 50 60 60 70
Wind 0 0 0 0 0 0 0 0 0 0 0 0 0 0 0 0 0 0 0 0
Total Capacity (MW) 49 49 49 49 59 59 59 69 69 69 79 79 79 89 89 99 99 109 109 119
System Surplus(+)/Deficit(-) with Unit Additions (MW) 7 4 2 0 7 4 1 8 5 2 8 4 0 6 1 7 2 7 1 5
Reserve Margin (%) 57% 49% 41% 34% 53% 45.4% 37.9% 53.3% 45.5% 38.0% 50.1% 42.4% 35.2% 44.6% 37.2% 45.0% 37.6% 43.8% 36.4% 41.4%

Caribbean Regional Electricity Generation, Interconnection, and Fuels Supply Strategy – Final Report A-49
Table A-46 Grenada Fuel Scenario Energy Balance
Year 2009 2010 2011 2012 2013 2014 2015 2016 2017 2018 2019 2020 2021 2022 2023 2024 2025 2026 2027 2028
Energy (GWh) 198 209 220 232 244 257 270 285 300 316 333 350 369 389 409 431 454 478 504 530
Exports(+)/Imports(-) (GWh)
Generation (GWh)
Queens Park 67 71 75 79 59 68 71 59 61 63 54 56 58 50 52 46 47 43 43 56
Queens Park 65 69 73 76 57 66 68 57 59 61 52 54 56 49 50 45 46 41 42 55
Queens Park 65 69 73 76 57 66 68 57 59 61 52 54 56 49 50 45 46 41 42 55
10 MW MSD 0 0 0 0 0 0 0 0 0 0 0 0 0 0 0 0 0 0 0 0
10 MW CFB 0 0 0 0 70 56 63 111 120 130 174 187 200 241 256 296 315 353 376 365
Wind 0 0 0 0 0 0 0 0 0 0 0 0 0 0 0 0 0 0 0 0
Total Generation (GWh) 198 209 220 232 244 257 270 285 300 316 333 350 369 389 409 431 454 478 504 530
Table A-47 Grenada Fuel Scenario Cost Summary (Million 2009 US$)
Year 2009 2010 2011 2012 2013 2014 2015 2016 2017 2018 2019 2020 2021 2022 2023 2024 2025 2026 2027 2028Fuel and O&M Costs
Queens Park 10.9 11.8 13.3 15.2 11.8 14.2 15.1 12.8 13.3 13.8 11.9 12.3 12.8 11.3 11.7 10.5 10.9 10.0 10.3 13.5Queens Park 10.6 11.5 12.9 14.8 11.5 13.8 14.7 12.4 12.9 13.4 11.6 11.9 12.4 11.0 11.3 10.2 10.6 9.7 10.0 13.1Queens Park 10.6 11.5 12.9 14.8 11.5 13.8 14.7 12.4 12.9 13.4 11.6 11.9 12.4 11.0 11.3 10.2 10.6 9.7 10.0 13.110 MW MSD 0.0 0.0 0.0 0.0 0.0 0.0 0.0 0.0 0.0 0.0 0.0 0.0 0.0 0.0 0.0 0.0 0.0 0.0 0.0 0.010 MW CFB 0.0 0.0 0.0 0.0 0.6 9.2 9.8 16.7 17.2 17.9 23.2 24.0 24.9 29.4 30.4 34.2 35.4 38.9 40.2 38.4
Wind 0.0 0.0 0.0 0.0 0.0 0.0 0.0 0.0 0.0 0.0 0.0 0.0 0.0 0.0 0.0 0.0 0.0 0.0 0.0 0.0Production Cost (million $) 32 35 39 45 35 51 54 54 56 59 58 60 62 63 65 65 67 68 70 78
Investment Costs (million $) 0 0 0 0 25.5 0 0 25.5 0 0 25.5 0 0 25.5 0 25.5 0 25.5 0 25.5
Total System Costs (million $) 32 35 39 45 61 51 54 80 56 59 84 60 62 88 65 91 67 94 70 103

Caribbean Regional Electricity Generation, Interconnection, and Fuels Supply Strategy – Final Report A-50
Table A-48 Haiti Fuel Scenario Capacity Balance
Year 2009 2010 2011 2012 2013 2014 2015 2016 2017 2018 2019 2020 2021 2022 2023 2024 2025 2026 2027 2028
Peak Load (MW) 226 237 249 261 274 288 303 318 334 350 368 386 405 426 447 469 493 517 543 570Exports(+)/Imports(-) (MW)
Existing Capacity (MW)Varreau PAP EDH 34 34 34 34 34 34 34 34 34 34 34 34 34 34 34 34 34 34 34 34
Carrefour PAP EDH 24 24 24 24 24 24 24 24 24 24 24 24 24 24 24 24 24 24 24 24Peligre PAP EDH 27 27 27 27 27 27 27 27 27 27 27 27 27 27 27 27 27 27 27 27
Varreau PAP Sogener IPPs 20 20 20 20 20 20 20 20 20 20 20 20 20 20 20 20 20 20 20 20Carrefour PAP IPP 10 10 10 10 10 10 10 10 10 10 10 10 10 10 10 10 10 10 10 10
Thermal in Provinces 36 36 36 36 36 36 36 36 36 36 36 36 36 36 36 36 36 36 36 36Hydro in Provinces 4 4 4 4 4 4 4 4 4 4 4 4 4 4 4 4 4 4 4 4
Total Existing (MW) 155 155 155 155 155 155 155 155 155 155 155 155 155 155 155 155 155 155 155 155
Required Capacity (MW) 293 308 324 340 357 375 393 413 434 455 478 502 527 553 581 610 641 673 706 742Existing System Surplus(+)/Deficit(-) (MW) -138 -153 -169 -185 -202 -220 -238 -258 -279 -300 -323 -347 -372 -398 -426 -455 -486 -518 -551 -587
New Capacity (MW)E-Power 30 30 30 30 30 30 30 30 30 30 30 30 30 30 30 30 30 30 30 30
Gov of Brazil 30 30 30 30 30 30 30 30 30 30 30 30 30 30 30 30 30 30 30 3020 MW LSD 80 100 120 140 160 160 180 200 220 240 280 300 320 340 380 400 440 460 500 540
Wind 0 0 0 0 0 0 0 0 0 0 0 0 0 0 0 0 0 0 0 0
Total Capacity (MW) 295 315 335 355 375 375 395 415 435 455 495 515 535 555 595 615 655 675 715 755
System Surplus(+)/Deficit(-) with Unit Additions (MW) 2 7 11 15 18 0 2 2 1 0 17 13 8 2 14 5 14 2 9 13
Reserve Margin (%) 31% 33% 35% 36% 37% 30.2% 30.6% 30.6% 30.4% 29.9% 34.6% 33.4% 32.0% 30.4% 33.1% 31.0% 32.9% 30.5% 31.6% 32.3%

Caribbean Regional Electricity Generation, Interconnection, and Fuels Supply Strategy – Final Report A-51
Table A-49 Haiti Fuel Scenario Energy Balance
Year 2009 2010 2011 2012 2013 2014 2015 2016 2017 2018 2019 2020 2021 2022 2023 2024 2025 2026 2027 2028
Energy (GWh) 660 726 799 878 966 1,063 1,169 1,286 1,415 1,556 1,712 1,883 1,977 2,076 2,180 2,289 2,403 2,523 2,650 2,782
Exports(+)/Imports(-) (GWh)
Generation (GWh)
Varreau PAP EDH 67 69 71 74 76 67 66 82 85 88 87 91 90 90 87 88 85 87 85 83
Carrefour PAP EDH 48 49 50 52 54 47 46 58 60 62 62 64 64 64 61 62 60 61 60 59
Peligre PAP EDH 71 71 71 71 71 71 71 71 71 71 71 71 71 71 71 71 71 71 71 71
Varreau PAP Sogener IPPs 30 31 32 33 35 30 30 47 49 51 51 53 53 53 51 52 50 51 50 49
Carrefour PAP IPP 15 15 16 17 17 15 15 24 25 26 25 27 27 27 26 26 25 26 25 25
Thermal in Provinces 54 56 58 60 62 55 54 85 88 92 91 96 95 96 92 93 91 92 91 89
Hydro in Provinces 11 11 11 11 11 11 11 11 11 11 11 11 11 11 11 11 11 11 11 11
E-Power 75 77 79 82 85 74 73 81 84 87 86 89 88 88 84 85 83 84 83 81
Gov of Brazil 79 79 79 79 79 79 79 79 79 79 79 79 79 79 79 79 79 79 79 79
20 MW LSD 210 269 333 401 477 614 725 750 864 989 1149 1303 1400 1499 1618 1722 1847 1962 2096 2235
Wind 0 0 0 0 0 0 0 0 0 0 0 0 0 0 0 0 0 0 0 0
Total Generation (GWh) 660 726 799 878 966 1063 1169 1286 1415 1556 1712 1883 1977 2076 2180 2289 2403 2523 2650 2782
Table A-50 Haiti Fuel Scenario Cost Summary (Million 2009 US$)
Year 2009 2010 2011 2012 2013 2014 2015 2016 2017 2018 2019 2020 2021 2022 2023 2024 2025 2026 2027 2028Fuel and O&M Costs
Varreau PAP EDH 11.4 12.0 13.1 14.7 15.7 14.5 14.6 18.1 18.7 19.5 19.4 20.3 20.2 20.4 19.6 20.1 19.8 20.3 20.2 20.2Carrefour PAP EDH 8.1 8.5 9.3 10.4 11.1 10.2 10.3 12.7 13.2 13.8 13.7 14.3 14.3 14.4 13.8 14.2 14.0 14.3 14.2 14.3
Peligre PAP EDH 0.0 0.0 0.0 0.0 0.0 0.0 0.0 0.0 0.0 0.0 0.0 0.0 0.0 0.0 0.0 0.0 0.0 0.0 0.0 0.0Varreau PAP Sogener IPPs 6.6 6.9 7.6 8.5 9.0 8.3 8.4 12.9 13.5 14.1 14.1 14.8 14.8 15.0 14.4 14.8 14.6 14.9 14.8 14.9
Carrefour PAP IPP 3.3 3.5 3.8 4.2 4.5 4.2 4.2 6.5 6.7 7.0 7.0 7.4 7.4 7.5 7.2 7.4 7.3 7.5 7.4 7.5Thermal in Provinces 11.9 12.5 13.6 15.3 16.2 15.0 15.2 23.3 24.2 25.4 25.3 26.6 26.7 27.0 26.0 26.6 26.2 26.8 26.7 26.9
Hydro in Provinces 0.4 0.4 0.4 0.4 0.4 0.4 0.4 0.4 0.4 0.4 0.4 0.4 0.4 0.4 0.4 0.4 0.4 0.4 0.4 0.4E-Power 10.7 11.2 12.3 13.8 14.7 13.6 13.7 15.3 15.8 16.5 16.3 17.0 16.9 17.0 16.4 16.7 16.5 16.9 16.8 16.8
Gov of Brazil 1.2 1.2 1.2 1.2 1.2 1.2 1.2 1.2 1.2 1.2 1.2 1.2 1.2 1.2 1.2 1.2 1.2 1.2 1.2 1.220 MW LSD 28.5 37.4 49.3 64.6 78.5 72.4 82.5 83.5 93.9 105.6 121.0 132.6 137.7 145.6 155.9 167.6 181.5 193.8 208.8 224.0
Wind 0.0 0.0 0.0 0.0 0.0 0.0 0.0 0.0 0.0 0.0 0.0 0.0 0.0 0.0 0.0 0.0 0.0 0.0 0.0 0.0Production Cost (million $) 82 94 111 133 151 140 151 174 188 203 219 234 240 248 255 269 281 296 311 326
Investment Costs (million $) 38.4 9.6 9.6 9.6 9.6 0 9.6 9.6 9.6 9.6 19.2 9.6 9.6 9.6 19.2 9.6 19.2 9.6 19.2 19.2
Total System Costs (million $) 120 103 120 143 161 140 160 184 197 213 238 244 249 258 274 279 301 306 330 345

Caribbean Regional Electricity Generation, Interconnection, and Fuels Supply Strategy – Final Report A-52
Table A-51 Jamaica Fuel Scenario Capacity Balance
Year 2009 2010 2011 2012 2013 2014 2015 2016 2017 2018 2019 2020 2021 2022 2023 2024 2025 2026 2027 2028
Peak Load (MW) 680 707 736 767 799 832 867 904 943 983 1,026 1,071 1,116 1,165 1,214 1,267 1,322 1,379 1,439 1,502Exports(+)/Imports(-) (MW)
Existing Capacity (MW)Old Harbour 29 29 29 29 29 0 0 0 0 0 0 0 0 0 0 0 0 0 0 0Old Harbour 57 57 57 57 57 57 57 57 57 57 57 57 57 0 0 0 0 0 0 0Old Harbour 62 62 62 62 62 62 62 62 62 62 62 62 62 62 62 0 0 0 0 0Old Harbour 65 65 65 65 65 65 65 65 65 65 65 65 65 65 65 65 65 65 65 65
Hunts Bay 65 65 65 65 65 65 65 65 65 65 65 65 65 65 65 65 65 0 0 0Hunts Bay 21 21 21 21 21 21 21 21 21 21 21 21 21 21 21 21 21 21 21 21Hunts Bay 0 0 0 0 0 0 0 0 0 0 0 0 0 0 0 0 0 0 0 0
Rockfort 35 35 35 35 35 35 35 35 35 35 35 0 0 0 0 0 0 0 0 0Bogue 21 21 21 21 21 21 21 21 21 21 21 21 21 21 21 21 21 21 21 21Bogue 42 42 42 42 42 42 42 42 42 42 42 42 42 42 42 42 42 42 42 42Bogue 40 40 40 40 40 40 40 40 40 40 40 40 40 40 40 40 40 40 40 40Bogue 111 111 111 111 111 111 111 111 111 111 111 111 111 111 111 111 111 111 111 111
JEP Barge 1 74 74 74 74 74 74 74 74 74 74 74 74 74 74 74 74 74 74 74 74JEP Barge 2 50 50 50 50 50 50 50 50 50 50 50 50 50 50 50 50 50 50 50 50
JPPC Owned 60 60 60 60 60 60 60 60 60 60 60 60 60 60 60 60 60 60 60 60Jamalco 11 11 11 11 11 11 11 11 11 11 11 11 11 11 11 11 11 11 11 11Wigton 20 20 20 20 20 20 20 20 20 20 20 20 20 20 20 20 20 20 20 20Hydro 20 20 20 20 20 20 20 20 20 20 20 20 20 20 20 20 20 20 20 20
Total Existing (MW) 782 782 782 782 782 753 753 753 753 753 753 719 719 662 662 600 600 535 535 535
Required Capacity (MW) 850 884 921 959 998 1,039 1,083 1,130 1,179 1,229 1,282 1,338 1,396 1,456 1,518 1,583 1,652 1,724 1,799 1,877Existing System Surplus(+)/Deficit(-) (MW) -68 -103 -139 -177 -217 -286 -330 -377 -426 -476 -529 -620 -677 -795 -857 -984 -1,053 -1,190 -1,265 -1,343
New Capacity (MW)Kingston 68 68 68 68 68 68 68 68 68 68 68 68 68 68 68 68 68 68 68 68
Hunts Bay Petcoke 0 0 0 120 120 120 120 120 120 120 120 120 120 120 120 120 120 120 120 120Windalco 0 0 0 0 0 60 60 60 60 60 60 60 60 60 60 60 60 60 60 60Jamalco 0 85 85 85 85 85 85 85 85 85 85 85 85 85 85 85 85 85 85 85Wigton 0 6 12 18 18 18 18 18 18 18 18 18 18 18 18 18 18 18 18 18
50 MW GT 0 0 0 0 0 0 0 0 0 0 0 0 0 0 0 0 0 0 0 0100 MW CC 0 0 0 0 0 0 100 200 200 300 300 400 500 600 600 800 800 1,000 1,000 1,100
50 MW GT 0 0 0 0 0 0 0 0 0 0 0 0 0 0 0 0 0 0 0 0100 MW ConvCoal 0 0 0 0 0 0 0 0 0 0 0 0 0 0 0 0 0 0 0 0
Wind 0 0 0 0 0 0 0 0 0 0 0 0 0 0 0 0 0 0 0 0
Total Capacity (MW) 850 935 935 1,055 1,055 1,087 1,187 1,287 1,287 1,387 1,387 1,452 1,552 1,595 1,595 1,733 1,733 1,868 1,868 1,968
System Surplus(+)/Deficit(-) with Unit Additions (MW) 1 51 15 97 57 47 103 156 108 157 104 114 156 139 77 150 81 144 69 91
Reserve Margin (%) 25% 32% 27% 38% 32% 30.7% 36.9% 42.3% 36.4% 41.0% 35.2% 35.6% 39.0% 36.9% 31.3% 36.8% 31.1% 35.4% 29.8% 31.0%
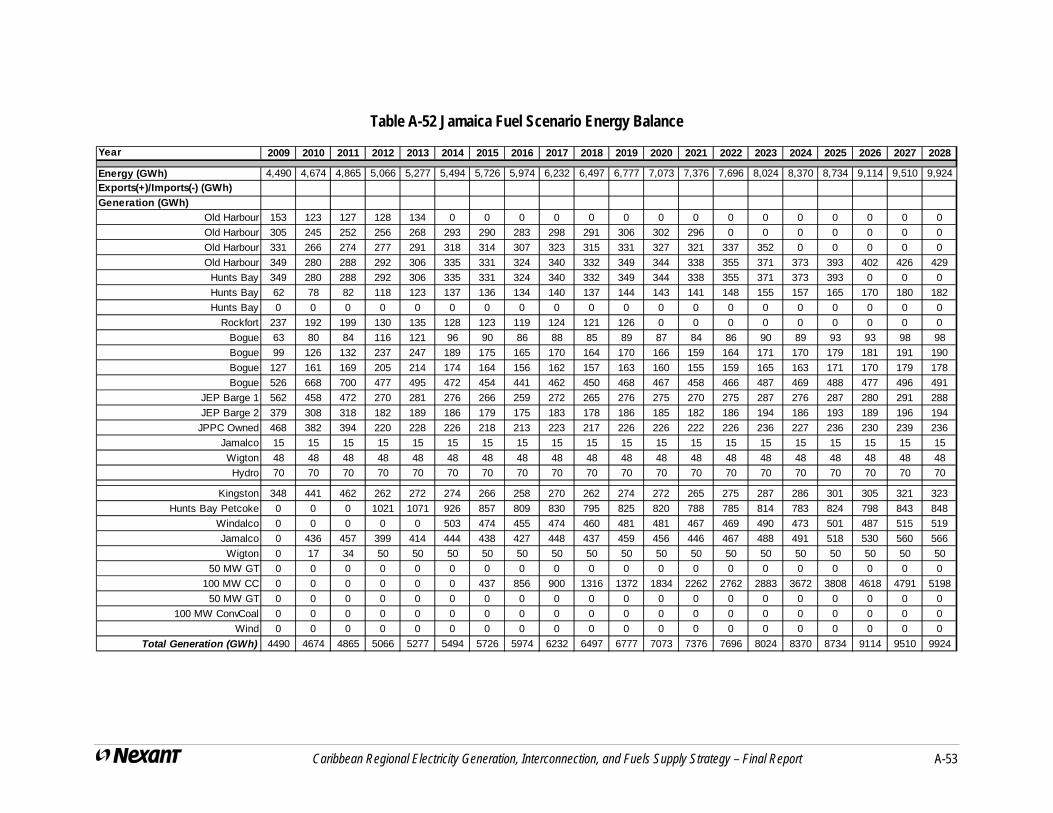
Caribbean Regional Electricity Generation, Interconnection, and Fuels Supply Strategy – Final Report A-53
Table A-52 Jamaica Fuel Scenario Energy Balance
Year 2009 2010 2011 2012 2013 2014 2015 2016 2017 2018 2019 2020 2021 2022 2023 2024 2025 2026 2027 2028
Energy (GWh) 4,490 4,674 4,865 5,066 5,277 5,494 5,726 5,974 6,232 6,497 6,777 7,073 7,376 7,696 8,024 8,370 8,734 9,114 9,510 9,924
Exports(+)/Imports(-) (GWh)
Generation (GWh)
Old Harbour 153 123 127 128 134 0 0 0 0 0 0 0 0 0 0 0 0 0 0 0
Old Harbour 305 245 252 256 268 293 290 283 298 291 306 302 296 0 0 0 0 0 0 0
Old Harbour 331 266 274 277 291 318 314 307 323 315 331 327 321 337 352 0 0 0 0 0
Old Harbour 349 280 288 292 306 335 331 324 340 332 349 344 338 355 371 373 393 402 426 429
Hunts Bay 349 280 288 292 306 335 331 324 340 332 349 344 338 355 371 373 393 0 0 0
Hunts Bay 62 78 82 118 123 137 136 134 140 137 144 143 141 148 155 157 165 170 180 182
Hunts Bay 0 0 0 0 0 0 0 0 0 0 0 0 0 0 0 0 0 0 0 0
Rockfort 237 192 199 130 135 128 123 119 124 121 126 0 0 0 0 0 0 0 0 0
Bogue 63 80 84 116 121 96 90 86 88 85 89 87 84 86 90 89 93 93 98 98
Bogue 99 126 132 237 247 189 175 165 170 164 170 166 159 164 171 170 179 181 191 190
Bogue 127 161 169 205 214 174 164 156 162 157 163 160 155 159 165 163 171 170 179 178
Bogue 526 668 700 477 495 472 454 441 462 450 468 467 458 466 487 469 488 477 496 491
JEP Barge 1 562 458 472 270 281 276 266 259 272 265 276 275 270 275 287 276 287 280 291 288
JEP Barge 2 379 308 318 182 189 186 179 175 183 178 186 185 182 186 194 186 193 189 196 194
JPPC Owned 468 382 394 220 228 226 218 213 223 217 226 226 222 226 236 227 236 230 239 236
Jamalco 15 15 15 15 15 15 15 15 15 15 15 15 15 15 15 15 15 15 15 15
Wigton 48 48 48 48 48 48 48 48 48 48 48 48 48 48 48 48 48 48 48 48
Hydro 70 70 70 70 70 70 70 70 70 70 70 70 70 70 70 70 70 70 70 70
Kingston 348 441 462 262 272 274 266 258 270 262 274 272 265 275 287 286 301 305 321 323
Hunts Bay Petcoke 0 0 0 1021 1071 926 857 809 830 795 825 820 788 785 814 783 824 798 843 848
Windalco 0 0 0 0 0 503 474 455 474 460 481 481 467 469 490 473 501 487 515 519
Jamalco 0 436 457 399 414 444 438 427 448 437 459 456 446 467 488 491 518 530 560 566
Wigton 0 17 34 50 50 50 50 50 50 50 50 50 50 50 50 50 50 50 50 50
50 MW GT 0 0 0 0 0 0 0 0 0 0 0 0 0 0 0 0 0 0 0 0
100 MW CC 0 0 0 0 0 0 437 856 900 1316 1372 1834 2262 2762 2883 3672 3808 4618 4791 5198
50 MW GT 0 0 0 0 0 0 0 0 0 0 0 0 0 0 0 0 0 0 0 0
100 MW ConvCoal 0 0 0 0 0 0 0 0 0 0 0 0 0 0 0 0 0 0 0 0
Wind 0 0 0 0 0 0 0 0 0 0 0 0 0 0 0 0 0 0 0 0
Total Generation (GWh) 4490 4674 4865 5066 5277 5494 5726 5974 6232 6497 6777 7073 7376 7696 8024 8370 8734 9114 9510 9924

Caribbean Regional Electricity Generation, Interconnection, and Fuels Supply Strategy – Final Report A-54
Table A-53 Jamaica Fuel Scenario Cost Summary (Million 2009 US$)
Year 2009 2010 2011 2012 2013 2014 2015 2016 2017 2018 2019 2020 2021 2022 2023 2024 2025 2026 2027 2028Fuel and O&M Costs
Old Harbour 19.4 25.2 28.3 31.7 34.6 0.0 0.0 0.0 0.0 0.0 0.0 0.0 0.0 0.0 0.0 0.0 0.0 0.0 0.0 0.0Old Harbour 38.8 50.3 56.4 63.1 69.0 78.9 80.5 79.4 83.8 82.0 86.8 85.3 84.6 0.0 0.0 0.0 0.0 0.0 0.0 0.0Old Harbour 42.0 54.5 61.2 68.4 74.8 85.5 87.3 86.1 90.8 89.0 94.1 92.4 91.8 97.0 101.1 0.0 0.0 0.0 0.0 0.0Old Harbour 44.3 57.4 64.4 72.1 78.8 90.1 92.0 90.7 95.7 93.7 99.1 97.4 96.7 102.1 106.5 108.1 115.0 118.6 127.5 130.4
Hunts Bay 44.3 57.4 64.4 72.1 78.8 90.1 92.0 90.7 95.7 93.7 99.1 97.4 96.7 102.1 106.5 108.1 115.0 0.0 0.0 0.0Hunts Bay 15.2 19.9 22.3 35.1 37.6 43.8 45.1 44.5 46.9 46.0 48.8 48.6 48.0 51.0 53.2 54.5 58.3 60.6 65.0 67.4Hunts Bay 0.0 0.0 0.0 0.0 0.0 0.0 0.0 0.0 0.0 0.0 0.0 0.0 0.0 0.0 0.0 0.0 0.0 0.0 0.0 0.0
Rockfort 22.7 29.3 32.8 24.1 26.0 16.9 15.2 14.1 14.2 13.6 13.9 0.0 0.0 0.0 0.0 0.0 0.0 0.0 0.0 0.0Bogue 15.2 19.9 22.3 33.7 36.1 17.5 15.2 13.7 13.8 13.1 13.3 12.7 11.8 11.9 12.4 12.5 13.3 13.6 14.5 14.6Bogue 28.0 36.6 41.1 80.5 86.2 40.2 34.7 31.3 31.2 29.6 30.2 28.5 26.3 26.8 27.7 28.2 30.2 31.0 33.1 33.5Bogue 28.3 36.9 41.6 55.4 59.3 29.4 25.7 23.4 23.4 22.3 22.8 21.7 20.2 20.5 21.2 21.3 22.7 23.1 24.6 24.8Bogue 79.6 103.8 116.7 87.6 93.4 54.9 49.3 45.7 46.4 44.4 45.5 43.9 41.5 42.0 43.4 42.8 45.2 44.9 47.4 47.5
JEP Barge 1 48.2 62.2 69.7 45.2 48.8 32.9 29.7 27.8 28.1 27.0 27.6 26.8 25.5 25.7 26.5 26.1 27.5 27.3 28.6 28.7JEP Barge 2 32.5 41.9 47.0 30.5 32.9 22.1 20.0 18.7 19.0 18.2 18.6 18.1 17.2 17.3 17.9 17.6 18.5 18.4 19.3 19.3
JPPC Owned 39.3 50.7 56.9 36.0 38.8 26.4 23.9 22.3 22.6 21.8 22.3 21.6 20.5 20.7 21.4 21.0 22.1 21.9 23.0 23.0Jamalco 0.5 0.5 0.5 0.5 0.5 0.5 0.5 0.5 0.5 0.5 0.5 0.5 0.5 0.5 0.5 0.5 0.5 0.5 0.5 0.5Wigton 0.9 0.9 0.9 0.9 0.9 0.9 0.9 0.9 0.9 0.9 0.9 0.9 0.9 0.9 0.9 0.9 0.9 0.9 0.9 0.9Hydro 1.1 1.1 1.1 1.1 1.1 1.1 1.1 1.1 1.1 1.1 1.1 1.1 1.1 1.1 1.1 1.1 1.1 1.1 1.1 1.1
Kingston 46.4 60.1 67.4 42.9 45.6 47.9 48.0 47.0 49.2 48.1 50.5 50.3 49.4 51.6 53.7 54.2 57.5 58.8 62.6 64.4Hunts Bay Petcoke 0.0 0.0 0.0 42.3 44.5 39.3 37.0 35.6 36.6 35.5 36.4 35.8 34.7 35.0 36.2 34.8 36.1 35.0 36.3 35.8
Windalco 0.0 0.0 0.0 0.0 0.0 20.6 19.4 18.6 19.1 18.5 18.9 18.6 18.0 18.1 18.7 18.0 18.7 18.1 18.7 18.5Jamalco 0.0 82.1 92.2 88.5 94.5 105.6 107.6 106.0 111.3 109.1 115.4 114.9 113.4 119.7 124.6 127.1 135.5 140.0 149.9 155.1Wigton 0.0 0.2 0.4 0.6 0.6 0.6 0.6 0.6 0.6 0.6 0.6 0.6 0.6 0.6 0.6 0.6 0.6 0.6 0.6 0.6
50 MW GT 0.0 0.0 0.0 0.0 0.0 0.0 0.0 0.0 0.0 0.0 0.0 0.0 0.0 0.0 0.0 0.0 0.0 0.0 0.0 0.0100 MW CC 0.0 0.0 0.0 0.0 0.0 0.0 42.0 78.5 79.7 114.8 117.6 152.1 181.0 219.0 226.4 295.5 310.8 383.6 403.1 443.1
50 MW GT 0.0 0.0 0.0 0.0 0.0 0.0 0.0 0.0 0.0 0.0 0.0 0.0 0.0 0.0 0.0 0.0 0.0 0.0 0.0 0.0100 MW ConvCoal 0.0 0.0 0.0 0.0 0.0 0.0 0.0 0.0 0.0 0.0 0.0 0.0 0.0 0.0 0.0 0.0 0.0 0.0 0.0 0.0
Wind 0.0 0.0 0.0 0.0 0.0 0.0 0.0 0.0 0.0 0.0 0.0 0.0 0.0 0.0 0.0 0.0 0.0 0.0 0.0 0.0Production Cost (million $) 547 791 888 912 983 845 868 877 911 923 964 969 980 964 1,000 973 1,029 998 1,057 1,109
Investment Costs (million $) 0 96.75 7.5 271.5 0 132 105 105 0 105 0 105 105 105 0 210 0 210 0 105
Total System Costs (million $) 547 887 895 1,184 983 977 973 982 911 1,028 964 1,074 1,085 1,069 1,000 1,183 1,029 1,208 1,057 1,214

Caribbean Regional Electricity Generation, Interconnection, and Fuels Supply Strategy – Final Report A-55
Table A-54 St. Lucia Fuel Scenario Capacity Balance
Year 2009 2010 2011 2012 2013 2014 2015 2016 2017 2018 2019 2020 2021 2022 2023 2024 2025 2026 2027 2028
Peak Load (MW) 56 58 61 63 65 68 70 73 76 79 82 85 88 91 95 98 102 106 110 114Exports(+)/Imports(-) (MW)
Existing Capacity (MW)Cul de Sac 12 12 12 12 12 12 12 12 12 12 12 12 12 12 12 12 12 12 12 12Cul de Sac 6 6 6 6 6 6 6 6 6 6 6 6 6 6 6 6 6 6 6 6Cul de Sac 37 37 37 37 37 37 37 37 37 37 37 37 37 37 37 37 37 37 37 37Cul de Sac 21 21 21 21 21 21 21 21 21 21 21 21 21 21 21 21 21 21 21 21
Rooftop solar 0.1 0.1 0.1 0.1 0.1 0.1 0.1 0.1 0.1 0.1 0.1 0.1 0.1 0.1 0.1 0.1 0.1 0.1 0.1 0.1
Total Existing (MW) 76 76 76 76 76 76 76 76 76 76 76 76 76 76 76 76 76 76 76 76
Required Capacity (MW) 76 79 82 85 88 91 95 98 102 106 110 114 119 123 128 133 138 143 148 154Existing System Surplus(+)/Deficit(-) (MW) 0 -2 -5 -9 -12 -15 -19 -22 -26 -30 -34 -38 -42 -47 -52 -56 -62 -67 -72 -78
New Capacity (MW)20 MW LSD 0 0 0 0 0 0 0 0 0 0 0 0 0 0 0 0 0 0 0 020 MW LSD 0 20 20 20 20 20 20 40 40 40 40 40 60 60 60 60 80 80 80 80
Wind 0 0 0 0 0 0 0 0 0 0 0 0 0 0 0 0 0 0 0 0
Total Capacity (MW) 76 96 96 96 96 96 96 116 116 116 116 116 136 136 136 136 156 156 156 156
System Surplus(+)/Deficit(-) with Unit Additions (MW) 0 18 15 11 8 5 1 18 14 10 6 2 18 13 8 4 18 13 8 2
Reserve Margin (%) 35.7% 65.0% 59.0% 53.2% 47.6% 42.2% 36.9% 59.4% 53.5% 47.9% 42.5% 37.3% 55.0% 49.3% 43.9% 38.6% 53.1% 47.5% 42.1% 36.9%

Caribbean Regional Electricity Generation, Interconnection, and Fuels Supply Strategy – Final Report A-56
Table A-55 St. Lucia Fuel Scenario Energy Balance
Year 2009 2010 2011 2012 2013 2014 2015 2016 2017 2018 2019 2020 2021 2022 2023 2024 2025 2026 2027 2028
Energy (GWh) 345 356 367 378 390 402 415 428 442 455 470 484 500 515 531 548 565 583 601 620
Exports(+)/Imports(-) (GWh)
Generation (GWh)
Cul de Sac 53 42 43 45 46 47 49 41 42 43 45 46 40 41 42 44 39 40 41 43
Cul de Sac 28 22 23 23 24 25 26 21 22 23 23 24 21 22 22 23 20 21 22 22
Cul de Sac 169 133 137 142 146 150 155 129 133 137 141 146 126 130 134 138 123 127 131 135
Cul de Sac 94 74 76 78 81 83 86 71 74 76 78 81 70 72 74 77 68 70 72 75
Rooftop solar 0.1 0.1 0.1 0.1 0.1 0.1 0.1 0.1 0.1 0.1 0.1 0.1 0.1 0.1 0.1 0.1 0.1 0.1 0.1 0.1
20 MW LSD 0 0 0 0 0 0 0 0 0 0 0 0 0 0 0 0 0 0 0 0
20 MW LSD 0 85 87 90 93 97 100 166 171 176 182 187 243 251 258 266 315 325 335 346
Wind 0 0 0 0 0 0 0 0 0 0 0 0 0 0 0 0 0 0 0 0
Total Generation (GWh) 345 356 367 378 390 402 415 428 442 455 470 484 500 515 531 548 565 583 601 620
Table A-56 St. Lucia Fuel Scenario Cost Summary (Million 2009 US$)
Year 2009 2010 2011 2012 2013 2014 2015 2016 2017 2018 2019 2020 2021 2022 2023 2024 2025 2026 2027 2028Fuel and O&M Costs
Cul de Sac 8.0 6.5 7.2 8.1 8.6 4.9 5.0 4.2 4.4 4.5 4.7 4.7 4.1 4.2 4.3 4.5 4.1 4.3 4.5 4.7Cul de Sac 4.2 3.4 3.8 4.3 4.5 2.5 2.6 2.2 2.3 2.4 2.5 2.5 2.1 2.2 2.3 2.4 2.2 2.3 2.4 2.5Cul de Sac 24.7 20.3 22.3 25.1 26.6 15.0 15.5 13.1 13.5 14.0 14.5 14.7 12.6 13.0 13.3 14.0 12.8 13.3 13.9 14.5Cul de Sac 13.7 11.2 12.4 13.9 14.7 8.3 8.6 7.3 7.5 7.8 8.0 8.1 7.0 7.2 7.4 7.8 7.1 7.4 7.7 8.0
Rooftop solar 0.0 0.0 0.0 0.0 0.0 0.0 0.0 0.0 0.0 0.0 0.0 0.0 0.0 0.0 0.0 0.0 0.0 0.0 0.0 0.020 MW LSD 0.0 0.0 0.0 0.0 0.0 0.0 0.0 0.0 0.0 0.0 0.0 0.0 0.0 0.0 0.0 0.0 0.0 0.0 0.0 0.020 MW LSD 0.0 11.4 12.5 14.1 14.9 8.4 8.7 14.7 15.2 15.7 16.2 16.5 21.2 21.8 22.4 23.6 28.7 29.9 31.2 32.5
Wind 0.0 0.0 0.0 0.0 0.0 0.0 0.0 0.0 0.0 0.0 0.0 0.0 0.0 0.0 0.0 0.0 0.0 0.0 0.0 0.0Production Cost (million $) 51 53 58 65 69 39 40 42 43 44 46 46 47 48 50 52 55 57 60 62
Investment Costs (million $) 0 9.6 0 0 0 0 0 9.6 0 0 0 0 9.6 0 0 0 9.6 0 0 0
Total System Costs (million $) 51 62 58 65 69 39 40 51 43 44 46 46 57 48 50 52 64 57 60 62

Caribbean Regional Electricity Generation, Interconnection, and Fuels Supply Strategy – Final Report A-57
Table A-57 St. Vincent and Grenadines Fuel Scenario Capacity Balance
Year 2009 2010 2011 2012 2013 2014 2015 2016 2017 2018 2019 2020 2021 2022 2023 2024 2025 2026 2027 2028
Peak Load (MW) 27 28 30 32 35 37 40 42 45 48 52 55 59 63 68 72 77 83 88 94Exports(+)/Imports(-) (MW)
Existing Capacity (MW)St. Vincent 12 12 12 12 12 12 12 12 12 12 12 12 12 12 12 12 12 12 12 12St. Vincent 3 3 3 3 3 3 3 3 3 3 3 3 3 3 3 3 3 3 3 3
Lowmans Bay 35 35 35 35 35 35 35 35 35 35 35 35 35 35 35 35 35 35 35 35Bequia 3 3 3 3 3 3 3 3 3 3 3 3 3 3 3 3 3 3 3 3
Union Island 2.5 2.5 2.5 2.5 2.5 2.5 2.5 2.5 2.5 2.5 2.5 2.5 2.5 2.5 2.5 2.5 2.5 2.5 2.5 2.5Canouan 3 3 3 3 3 3 3 3 3 3 3 3 3 3 3 3 3 3 3 3Mayreay 0 0 0 0 0 0 0 0 0 0 0 0 0 0 0 0 0 0 0 0
Total Existing (MW) 58 58 58 58 58 58 58 58 58 58 58 58 58 58 58 58 58 58 58 58
Required Capacity (MW) 36 38 41 44 47 50 53 57 61 65 70 75 80 85 91 98 104 111 119 127Existing System Surplus(+)/Deficit(-) (MW) 22 20 17 14 11 8 5 1 -3 -7 -12 -17 -22 -27 -33 -39 -46 -53 -61 -69
New Capacity (MW)10 MW MSD 0 0 0 0 0 0 0 0 0 0 0 0 0 0 0 0 0 0 0 010 MW CFB 0 0 0 0 0 0 0 0 10 10 20 20 30 30 40 40 50 60 70 70
Wind 0 0 0 0 0 0 0 0 0 0 0 0 0 0 0 0 0 0 0 0
Total Capacity (MW) 58 58 58 58 58 58 58 58 68 68 78 78 88 88 98 98 108 118 128 128
System Surplus(+)/Deficit(-) with Unit Additions (MW) 22 20 17 14 11 8 5 1 7 3 8 3 8 3 7 1 4 7 9 1
Reserve Margin (%) 118.8% 104.7% 91.5% 79.1% 67.5% 56.7% 46.6% 37.1% 50.3% 40.6% 50.9% 41.1% 48.9% 39.3% 45.1% 35.7% 39.9% 43.0% 45.1% 35.7%

Caribbean Regional Electricity Generation, Interconnection, and Fuels Supply Strategy – Final Report A-58
Table A-58 St. Vincent and Grenadines Fuel Scenario Energy Balance
Year 2009 2010 2011 2012 2013 2014 2015 2016 2017 2018 2019 2020 2021 2022 2023 2024 2025 2026 2027 2028
Energy (GWh) 156 167 178 191 204 218 233 249 266 284 304 325 348 372 397 425 454 485 519 555
Exports(+)/Imports(-) (GWh)
Generation (GWh)
St. Vincent 31 33 36 38 41 44 47 50 43 46 40 43 38 40 37 38 35 33 30 41
St. Vincent 7 7 7 7 7 7 7 7 7 7 7 7 7 7 7 7 7 7 7 7
Lowmans Bay 98 105 113 121 129 139 149 159 137 146 128 135 120 127 116 121 111 103 96 123
Bequia 7 7 8 8 9 10 10 11 10 10 9 9 8 9 8 8 8 7 7 10
Union Island 6 6 7 7 8 8 9 9 8 9 8 8 7 7 7 7 7 6 6 8
Canouan 7 8 8 9 10 10 11 12 10 11 10 10 9 10 9 9 8 8 7 10
Mayreay 0 0 0 0 0 1 1 1 1 1 0 0 0 0 0 0 0 0 0 1
10 MW MSD 0 0 0 0 0 0 0 0 0 0 0 0 0 0 0 0 0 0 0 0
10 MW CFB 0 0 0 0 0 0 0 0 51 56 103 113 158 172 215 234 279 322 366 356
Wind 0 0 0 0 0 0 0 0 0 0 0 0 0 0 0 0 0 0 0 0
Total Generation (GWh) 156 167 178 191 204 218 233 249 266 284 304 325 348 372 397 425 454 485 519 555
Table A-59 St. Vincent and Grenadines Case Cost Summary (Million 2009 US$)
Year 2009 2010 2011 2012 2013 2014 2015 2016 2017 2018 2019 2020 2021 2022 2023 2024 2025 2026 2027 2028Fuel and O&M Costs
St. Vincent 4.7 5.2 5.9 6.8 7.5 8.3 9.2 9.9 8.6 9.1 8.1 8.6 7.8 8.2 7.5 7.9 7.4 7.0 6.6 9.0St. Vincent 0.2 0.2 0.2 0.2 0.2 0.2 0.2 0.2 0.2 0.2 0.2 0.2 0.2 0.2 0.2 0.2 0.2 0.2 0.2 0.2
Lowmans Bay 14.1 15.4 17.6 20.4 22.3 24.8 27.3 29.4 25.6 27.2 24.2 25.6 23.1 24.5 22.4 23.7 22.1 20.8 19.8 25.4Bequia 1.1 1.2 1.4 1.6 1.8 2.0 2.2 2.3 2.0 2.2 1.9 2.0 1.8 1.9 1.8 1.9 1.7 1.6 1.6 2.2
Union Island 1.0 1.1 1.2 1.4 1.5 1.7 1.9 2.0 1.8 1.9 1.7 1.8 1.6 1.7 1.6 1.6 1.5 1.4 1.4 2.0Canouan 1.2 1.3 1.5 1.7 1.9 2.1 2.3 2.5 2.2 2.3 2.0 2.2 2.0 2.1 1.9 2.0 1.9 1.8 1.7 2.4Mayreay 0.1 0.1 0.1 0.1 0.1 0.1 0.1 0.1 0.1 0.1 0.1 0.1 0.1 0.1 0.1 0.1 0.1 0.1 0.1 0.2
10 MW MSD 0.0 0.0 0.0 0.0 0.0 0.0 0.0 0.0 0.0 0.0 0.0 0.0 0.0 0.0 0.0 0.0 0.0 0.0 0.0 0.010 MW CFB 0.0 0.0 0.0 0.0 0.0 0.0 0.0 0.0 7.3 7.8 13.9 14.6 19.8 21.0 25.6 27.1 31.5 35.6 39.5 37.5
Wind 0.0 0.0 0.0 0.0 0.0 0.0 0.0 0.0 0.0 0.0 0.0 0.0 0.0 0.0 0.0 0.0 0.0 0.0 0.0 0.0Production Cost (million $) 22 25 28 32 35 39 43 47 48 51 52 55 56 60 61 65 66 69 71 79
Investment Costs (million $) 0 0 0 0 0 0 0 0 25.5 0 25.5 0 25.5 0 25.5 0 25.5 25.5 25.5 0
Total System Costs (million $) 22 25 28 32 35 39 43 47 73 51 78 55 82 60 87 65 92 94 96 79

Caribbean Regional Electricity Generation, Interconnection, and Fuels Supply Strategy – Final Report A-59
Table A-60 Fuel Scenario Production Cost Summary (Million 2009 US$)
Year 2009 2010 2011 2012 2013 2014 2015 2016 2017 2018 2019 2020 2021 2022 2023 2024 2025 2026 2027 2028
Antigua and Barbuda 48 49 52 74 76 81 86 90 92 95 99 98 101 104 102 106 109 111 115 119
Barbados 163 188 202 223 234 102 106 110 114 119 124 124 124 128 131 138 146 152 159 166
Dominica 13 13 15 15 16 17 19 19 20 21 21 21 22 23 23 24 25 26 27 28
Dominican Republic 1,149 1,458 1,588 1,587 1,683 1,791 1,717 1,794 1,867 1,803 1,875 1,807 1,876 1,956 1,923 2,008 1,990 1,983 2,064 2,065
Grenada 32 35 39 45 35 51 54 54 56 59 58 60 62 63 65 65 67 68 70 78
Haiti 82 94 111 133 151 140 151 174 188 203 219 234 240 248 255 269 281 296 311 326
Jamaica 547 791 888 912 983 845 868 877 911 923 964 969 980 964 1,000 973 1,029 998 1,057 1,109
St. Kitts 23 25 27 30 32 34 37 38 39 40 42 43 45 46 47 49 51 53 56 58
Nevis 9 11 12 15 16 17 19 20 20 21 22 23 24 25 26 27 29 30 32 34
St. Lucia 51 53 58 65 69 39 40 42 43 44 46 46 47 48 50 52 55 57 60 62
St. Vincent and Grenadines 22 25 28 32 35 39 43 47 48 51 52 55 56 60 61 65 66 69 71 79
Fuel Savings (exports) 0 0 0 0 0 0 0 0 0 0 0 0 0 0 0 0 0 0 0 0
Total 2,139 2,740 3,020 3,132 3,332 3,159 3,139 3,264 3,398 3,379 3,521 3,481 3,578 3,666 3,684 3,776 3,849 3,843 4,019 4,125
Table A-61 Fuel Scenario Investment Cost Summary (Million 2009 US$)
Year 2009 2010 2011 2012 2013 2014 2015 2016 2017 2018 2019 2020 2021 2022 2023 2024 2025 2026 2027 2028 Salvage Value
Antigua and Barbuda 0 0 5 5 5 0 0 0 0 0 0 26 0 0 26 0 0 26 0 0 66
Barbados 0 0 14 14 7 0 0 0 0 0 0 7 0 7 7 7 0 10 10 0 45
Dominica 0 0 0 2 0 0 0 0 0 0 0 2 0 0 0 0 0 2 0 0 4
Dominican Republic 0 385 113 753 0 0 610 0 23 610 0 610 0 23 600 0 600 600 0 600 3,986
Grenada 0 0 0 0 26 0 0 26 0 0 26 0 0 26 0 26 0 26 0 26 138
Haiti 38 10 10 10 10 0 10 10 10 10 19 10 10 10 19 10 19 10 19 19 139
Jamaica 0 97 8 272 0 132 105 105 0 105 0 105 105 105 0 210 0 210 0 105 1,156
St. Kitts 0 0 0 2 0 0 2 0 0 2 0 2 0 2 0 0 2 0 2 0 9
Nevis 0 0 2 0 0 0 0 0 2 0 0 0 2 0 0 2 0 0 2 0 7
St. Lucia 0 10 0 0 0 0 0 10 0 0 0 0 10 0 0 0 10 0 0 0 19
St. Vincent and Grenadines 0 0 0 0 0 0 0 0 26 0 26 0 26 0 26 0 26 26 26 0 146
Interconnection Costs 0 0 0 0 0 0 0 0 0 0 0 0 0 0 0 0 0 0 0 0 0
Total 38 501 151 1,057 47 132 727 150 60 727 70 762 152 172 677 255 657 908 59 750 5,715

Caribbean Regional Electricity Generation, Interconnection, and Fuels Supply Strategy – Final Report A-60
A.3 INTERCONNECTION/RENEWABLE SCENARIO
Tables A-62 to A-103 present system analysis results for the Interconnection/Renewable Scenario. As for all scenarios, for each country (or island) results are presented in three tables: capacity balance, energy balance, and cost summary tables.
A.3.1 Antigua and Barbuda
Tables A-62 to A-64 present system analysis results for Antigua and Barbuda. Most assumed new generation units are the same as in the Base Case. The difference is that in this scenario is the addition of 14 MW of new wind units.
A.3.2 Barbados
Tables A-65 to A-67 present system analysis results for Barbados. For the Interconnection/Renewable Scenario, most assumed system additions are the same as for the Base Case Scenario. The difference in this scenario is the addition of 45 MW of new wind units.
A.3.3 Dominica
Tables A-68 to A-70 present system analysis results for Dominica. The Interconnection/Renewable Scenario assumes the addition of a 20 MW geothermal unit in 2012 to satisfy local needs, and the addition of two 92.5 MW units in 2014 for exports to Martinique and Guadalupe. The energy balance table shows corresponding exports of 1,296 GWh starting in 2014.
A.3.4 Dominican Republic
Tables A-71 to A-76 present system analysis results for Dominican Republic for the Interconnection/Renewable Scenario.
Preliminary analysis had indicated that the impacts of interconnection and renewable energy generation should be studied separately. In Tables A-71 to A-73 we refer to the “Interconnection Scenario” because interconnection is assumed without additional renewable energy generation added. The assumed system additions are the same as in the Base Case Scenario, though the timing is slightly different and the reserve margins fall. The impact is relatively small because the Dominican Republic’s system is large compared to the amounts of exports. Electricity exports to Haiti start at 108 MW (520 GWh) in 2014 and increase to 214 MW (1,029 GWh) by 2028.
Tables A-74 to A-76 present again system analysis results for Dominican Republic for what we refer to as the “Renewable Scenario” because we assume no interconnection, but the addition of 540 MW of new wind units (30 MW each year starting in 2011).. The assumed system additions are otherwise the same as in the Base Case Scenario.

Caribbean Regional Electricity Generation, Interconnection, and Fuels Supply Strategy – Final Report A-61
A.3.5 Grenada
Tables A-77 to A-79 present system analysis results for Grenada. For the Interconnection/Renewable Scenario, most assumed new generation units are the same as in the Base Case. The difference is that in this scenario is the addition of 12 MW of new wind units.
A.3.6 Haiti
Preliminary analysis had indicated that the impacts of interconnection and renewable energy generation should be studied separately. In Tables A-80 to A-82 we refer to the “Interconnection Scenario” because interconnection is assumed without additional renewable resources. For the Interconnection Scenario, assumed system unit additions are the same 20 MW low speed diesel units as for the Base Case Scenario. The difference in this case is the assumed import of electricity from Dominican Republic starting in 2014. Imports are assumed to reduce the requirement to build new diesel units in Haiti, so only 340 MW of new units will be required by 2028. Another 200 MW of new units will be replaced by imports. Energy imports reduce the need for generation in Haiti as presented in Table A-81, which also shows a reduction for transmission losses.
Tables A-83 to A-85 present system analysis results for Haiti for what we call the “Renewable Scenario”. For the Renewable Scenario, most assumed system unit additions are the same as for the Base Case Scenario. The difference in this scenario is the assumed addition of 81 MW of wind generation.
A.3.7 Jamaica
Tables A-86 to A-88 present system analysis results for Jamaica for the Interconnection/Renewable Scenario. For this Scenario, assumed system unit additions are the same as for the Base Case Scenario. The difference in this scenario is the assumed addition of 219 MW of wind generation by 2028, with the yearly schedule presented in Table A-86.
A.3.8 St. Kitts and Nevis
Tables A-89 to A-91 present system analysis results for St. Kitts for the Interconnection/Renewable Scenario. This scenario assumes that St. Kitts and Nevis will be interconnected by 2011. Two 20 MW geothermal units at Nevis will provide 30 MW of capacity for St. Kitts and most of the energy requirement. No new generation units will be built on St. Kitts.
Tables A-92 to A-94 present corresponding system analysis results for Nevis for the Interconnection/Renewable Scenario. This scenario assumes that Nevis will be interconnected with St. Kitts by 2011 and the two 20 MW geothermal units at Nevis will supply 30 MW for St. Kitts and 10 MW for Nevis. Additionally, this scenario assumes two 200 MW geothermal units will be built at Nevis in 2014 to supply Puerto Rico. A submarine cable connecting Nevis and Puerto Rico is also assumed to be completed by 2014.

Caribbean Regional Electricity Generation, Interconnection, and Fuels Supply Strategy – Final Report A-62
A.3.9 St. Lucia
Tables A-95 to A-97 present system analysis results for St. Lucia. For the Interconnection/Renewable Scenario, assumed system additions are the same as for the Base Case Scenario. The difference in this scenario is the assumed addition of 18 MW by 2028 of wind generation with the yearly schedule presented in Table A-95.
A.3.10 St. Vincent and Grenadines
Tables A-98 to A-100 present system analysis results for St. Vincent and Grenadines. For the Interconnection/Renewable Scenario, assumed system additions are the same as for the Base Case Scenario. The difference in this scenario is the assumed addition of 14 MW by 2028 of wind generation with the yearly schedule presented in Table A-98.
A.3.11 Total System Costs
Tables A-101 to A-103 present total system production, investment and interconnection cost for the Interconnection/Renewable Scenario. The Production Cost Summary table shows fuel savings associated for energy exports to Martinique, Guadeloupe, and Puerto Rico. The Investment Cost Summary and Interconnection Cost Summary tables show yearly costs associated with building assumed interconnections. “Renewable Scenario” production and investment cost results are those presented for the Dominican Republic and Haiti, and no interconnection is assumed. The interconnection costs shown for the Dominican Republic – Haiti interconnection are those used in the preliminary analysis that determined that an interconnection was not economic.

Caribbean Regional Electricity Generation, Interconnection, and Fuels Supply Strategy – Final Report A-63
Table A-62 Antigua and Barbuda Interconnection/Renewable Scenario Capacity Balance
Year 2009 2010 2011 2012 2013 2014 2015 2016 2017 2018 2019 2020 2021 2022 2023 2024 2025 2026 2027 2028
Peak Load (MW) 54 57 60 63 65 67 69 71 73 75 77 80 82 85 87 90 92 95 98 101Exports(+)/Imports(-) (MW)
Existing Capacity (MW)APC (Pant) 15 15 15 15 15 15 15 15 15 15 15 15 15 15 15 15 15 15 15 15
APC Blk Pine 26 26 26 26 26 26 26 26 26 26 26 26 26 26 26 26 26 26 26 26Baker 4 4 4 4 4 4 4 4 4 4 4 4 4 4 4 4 4 4 4 4
APC Jt Vent 17 17 17 17 17 17 17 17 17 17 17 17 17 17 17 17 17 17 17 17Victor 8 8 8 8 8 8 8 8 8 8 8 8 8 8 8 8 8 8 8 8WIOC 0 0 0 0 0 0 0 0 0 0 0 0 0 0 0 0 0 0 0 0
Aggreko Rental 13 13 13 13 0 0 0 0 0 0 0 0 0 0 0 0 0 0 0 0Barbuda 7 7 7 7 7 7 7 7 7 7 7 7 7 7 7 7 7 7 7 7
Total Existing (MW) 90 90 90 90 77 77 77 77 77 77 77 77 77 77 77 77 77 77 77 77
Required Capacity (MW) 73 77 81 85 88 90 93 96 99 102 104 108 111 114 118 121 125 128 132 136Existing System Surplus(+)/Deficit(-) (MW) 17 13 9 5 -10 -13 -16 -19 -21 -24 -27 -31 -34 -37 -40 -44 -47 -51 -55 -59
New Capacity (MW)Casada Gardens 0 0 10 20 30 30 30 30 30 30 30 30 30 30 30 30 30 30 30 30
10 MW CFB 0 0 0 0 0 0 0 0 0 0 0 0 0 0 0 0 0 0 0 010 MW MSD 0 0 0 0 0 0 0 0 0 0 0 10 10 10 20 20 20 30 30 30
Wind 0 0 0 3 6 9 9 9 9 9 11 11 11 11 12 12 12 12 14 14
Total Capacity (MW) 90 90 100 110 107 107 107 107 107 107 107 117 117 117 127 127 127 137 137 137
System Surplus(+)/Deficit(-) with Unit Additions (MW) 17 13 19 25 20 17 14 11 9 6 3 9 6 3 10 6 3 9 5 1
Reserve Margin (%) 66% 58% 67% 75% 65% 60.5% 55.8% 51.2% 46.8% 42.6% 38.5% 46.9% 42.6% 38.5% 45.9% 41.8% 37.8% 44.4% 40.3% 36.3%

Caribbean Regional Electricity Generation, Interconnection, and Fuels Supply Strategy – Final Report A-64
Table A-63 Antigua and Barbuda Interconnection/Renewable Scenario Energy Balance Year 2009 2010 2011 2012 2013 2014 2015 2016 2017 2018 2019 2020 2021 2022 2023 2024 2025 2026 2027 2028
Energy (GWh) 318 315 312 410 422 434 447 461 475 489 503 519 534 550 567 583 600 618 636 654
Generation (GWh)
APC (Pant) 49 48 43 49 50 50 52 54 55 57 58 55 56 58 55 56 58 55 56 58
APC Blk Pine 101 100 88 102 103 104 107 111 114 118 120 113 117 120 113 116 120 114 117 120
Baker 13 13 11 13 13 13 14 14 15 15 16 15 15 15 15 15 15 15 15 16
APC Jt Vent 66 65 58 67 67 68 70 72 75 77 79 74 76 79 74 76 78 75 76 79
Victor 27 27 24 28 28 28 29 30 31 32 33 31 32 33 31 32 33 31 32 33
WIOC 0 0 0 0 0 0 0 0 0 0 0 0 0 0 0 0 0 0 0 0
Aggreko Rental 38 37 33 38 0 0 0 0 0 0 0 0 0 0 0 0 0 0 0 0
Barbuda 24 24 21 25 25 25 26 27 27 28 29 27 28 29 27 28 29 27 28 29
Casada Gardens 0 0 34 79 119 120 124 128 132 136 139 131 135 139 130 134 139 132 135 139
10 MW CFB 0 0 0 0 0 0 0 0 0 0 0 0 0 0 0 0 0 0 0 0
10 MW MSD 0 0 0 0 0 0 0 0 0 0 0 45 46 48 89 92 95 135 139 143
Wind 0 0 0 8 17 25 25 25 25 25 29 29 29 29 34 34 34 34 38 38
Total Generation (GWh) 318 315 312 410 422 434 447 461 475 489 503 519 534 550 567 583 600 618 636 654
Table A-64 Antigua and Barbuda Interconnection/Renewable Scenario Cost Summary
Year 2009 2010 2011 2012 2013 2014 2015 2016 2017 2018 2019 2020 2021 2022 2023 2024 2025 2026 2027 2028Fuel and O&M Costs
APC (Pant) 7.8 8.0 7.6 9.5 9.8 10.4 11.0 11.4 11.8 12.2 12.6 11.9 12.3 12.8 12.0 12.5 13.0 12.5 13.0 13.7APC Blk Pine 14.4 14.7 14.0 17.5 18.1 19.1 20.2 21.0 21.7 22.5 23.1 21.8 22.6 23.5 22.1 23.0 24.0 23.1 23.9 25.2
Baker 2.1 2.1 2.0 2.5 2.6 2.8 2.9 3.0 3.1 3.3 3.3 3.2 3.3 3.4 3.2 3.3 3.5 3.3 3.5 3.6APC Jt Vent 9.3 9.4 9.0 11.3 11.7 12.3 13.1 13.6 14.0 14.5 14.9 14.1 14.6 15.2 14.3 14.9 15.5 14.9 15.5 16.3
Victor 4.2 4.3 4.1 5.1 5.3 5.6 5.9 6.1 6.3 6.6 6.7 6.4 6.6 6.9 6.4 6.7 7.0 6.7 7.0 7.3WIOC 0.0 0.0 0.0 0.0 0.0 0.0 0.0 0.0 0.0 0.0 0.0 0.0 0.0 0.0 0.0 0.0 0.0 0.0 0.0 0.0
Aggreko Rental 6.8 7.0 6.6 8.3 0.0 0.0 0.0 0.0 0.0 0.0 0.0 0.0 0.0 0.0 0.0 0.0 0.0 0.0 0.0 0.0Barbuda 3.9 3.9 3.8 4.7 4.9 5.1 5.5 5.7 5.9 6.1 6.2 5.9 6.1 6.3 5.9 6.2 6.5 6.2 6.4 6.8
Casada Gardens 0.0 0.0 5.3 13.3 20.6 21.7 23.0 24.0 24.8 25.6 26.3 24.9 25.8 26.8 25.2 26.2 27.3 26.3 27.3 28.710 MW CFB 0.0 0.0 0.0 0.0 0.0 0.0 0.0 0.0 0.0 0.0 0.0 0.0 0.0 0.0 0.0 0.0 0.0 0.0 0.0 0.010 MW MSD 0.0 0.0 0.0 0.0 0.0 0.0 0.0 0.0 0.0 0.0 0.0 8.3 8.6 8.9 16.7 17.5 18.2 26.3 27.2 28.7
Wind 0.0 0.0 0.0 0.1 0.2 0.3 0.3 0.3 0.3 0.3 0.3 0.3 0.3 0.3 0.4 0.4 0.4 0.4 0.4 0.4Production Cost (million $) 48 49 52 72 73 77 82 85 88 91 94 97 100 104 106 111 115 120 124 131Investment Costs (million $) 0 0 4.5 8.25 8.25 3.75 0 0 0 0 1.875 4.5 0 0 6.375 0 0 4.5 1.875 0
Total System Costs (million $) 48 49 57 81 81 81 82 85 88 91 95 101 100 104 113 111 115 124 126 131

Caribbean Regional Electricity Generation, Interconnection, and Fuels Supply Strategy – Final Report A-65
Table A-65 Barbados Interconnection/Renewable Scenario Capacity Balance
Year 2009 2010 2011 2012 2013 2014 2015 2016 2017 2018 2019 2020 2021 2022 2023 2024 2025 2026 2027 2028
Peak Load (MW) 170 176 182 188 195 201 208 216 223 231 239 247 256 265 274 284 294 304 314 325Exports(+)/Imports(-) (MW)
Existing Capacity (MW)Spring Garden 25 25 25 25 25 25 25 25 25 25 25 25 25 25 25 25 25 25 25 25Spring Garden 13 13 13 13 13 13 13 13 13 13 13 13 13 13 13 13 13 13 13 13Spring Garden 13 13 13 13 13 13 13 13 13 13 13 13 13 13 13 13 13 13 13 13Spring Garden 61 61 61 61 61 61 61 61 61 61 61 61 61 61 61 61 61 61 61 61Spring Garden 40 40 40 40 40 40 40 40 40 40 40 40 40 40 40 40 40 40 40 40
Sewall 86 86 86 86 86 86 86 86 86 86 86 86 86 86 86 86 86 86 86 86
Total Existing (MW) 238 238 238 238 238 238 238 238 238 238 238 238 238 238 238 238 238 238 238 238
Required Capacity (MW) 221 228 236 245 253 262 271 280 290 300 311 322 333 344 356 369 382 395 409 423Existing System Surplus(+)/Deficit(-) (MW) 18 10 2 -6 -15 -23 -33 -42 -52 -62 -72 -83 -94 -106 -118 -130 -143 -157 -170 -185
New Capacity (MW)Trent 0 0 32 64 80 80 80 80 80 80 80 96 96 112 128 144 144 144 144 144
20 MW LSD 0 0 0 0 0 0 0 0 0 0 0 0 0 0 0 0 0 20 40 400 0 0 0 0 0 0 0 0 0 0 0 0 0 0 0 0 0 0 0 0
Wind 0 0 0 0 0 3 6 9 12 15 18 21 24 27 30 33 36 39 42 45
Total Capacity (MW) 238 238 270 302 318 318 318 318 318 318 318 334 334 350 366 382 382 402 422 422
System Surplus(+)/Deficit(-) with Unit Additions (MW) 18 10 34 58 65 57 47 38 28 18 8 13 2 6 10 14 1 7 14 -1
Reserve Margin (%) 40% 36% 49% 61% 64% 58.1% 52.8% 47.6% 42.6% 37.8% 33.2% 35.2% 30.6% 32.3% 33.6% 34.8% 30.2% 32.4% 34.3% 29.8%

Caribbean Regional Electricity Generation, Interconnection, and Fuels Supply Strategy – Final Report A-66
Table A-66 Barbados Interconnection/Renewable Scenario Energy Balance
Year 2009 2010 2011 2012 2013 2014 2015 2016 2017 2018 2019 2020 2021 2022 2023 2024 2025 2026 2027 2028
Energy (GWh) 1,039 1,073 1,107 1,143 1,180 1,218 1,258 1,298 1,340 1,384 1,428 1,475 1,522 1,572 1,622 1,675 1,729 1,785 1,843 1,902
Exports(+)/Imports(-) (GWh)
Generation (GWh)
Spring Garden 107 120 106 96 94 96 99 101 104 107 110 106 109 106 104 102 104 101 98 101
Spring Garden 57 63 56 51 49 51 52 53 55 56 58 56 58 56 55 54 55 53 52 53
Spring Garden 57 63 56 51 49 51 52 53 55 56 58 56 58 56 55 54 55 53 52 53
Spring Garden 280 314 278 252 245 251 258 265 272 279 287 278 285 278 271 266 273 264 257 265
Spring Garden 227 162 141 126 120 123 126 130 133 136 140 137 140 137 133 131 135 131 127 131
Sewall 312 349 308 278 270 277 284 291 299 307 315 305 313 305 298 292 300 290 282 290
Trent 0 0 161 290 353 361 370 380 390 400 411 478 491 558 623 685 705 682 662 681
20 MW LSD 0 0 0 0 0 0 0 0 0 0 0 0 0 0 0 0 0 101 196 201
Wind 0 0 0 0 0 8 17 25 34 42 50 59 67 76 84 93 101 109 118 126
Total Generation (GWh) 1039 1073 1107 1143 1180 1218 1258 1298 1340 1384 1428 1475 1522 1572 1622 1675 1729 1785 1843 1902
Table A-67 Barbados Interconnection/Renewable Scenario Cost Summary (Million 2009 US$)
Year 2009 2010 2011 2012 2013 2014 2015 2016 2017 2018 2019 2020 2021 2022 2023 2024 2025 2026 2027 2028Fuel and O&M Costs
Spring Garden 16.4 18.9 18.0 17.8 17.8 19.0 20.0 20.7 21.3 22.0 22.7 22.1 22.8 22.5 21.9 21.7 22.6 22.1 21.7 22.9Spring Garden 8.7 10.0 9.5 9.4 9.4 10.0 10.6 10.9 11.3 11.6 12.0 11.7 12.1 11.9 11.5 11.5 11.9 11.6 11.5 12.1Spring Garden 8.7 10.0 9.5 9.4 9.4 10.0 10.6 10.9 11.3 11.6 12.0 11.7 12.1 11.9 11.5 11.5 11.9 11.6 11.5 12.1Spring Garden 40.1 46.1 43.8 43.3 43.3 46.3 48.9 50.6 52.0 53.6 55.4 53.9 55.7 54.8 53.4 53.0 55.1 53.8 53.0 55.8Spring Garden 26.3 30.2 28.7 28.4 28.4 30.4 32.1 33.2 34.1 35.1 36.3 35.3 36.6 35.9 35.0 34.7 36.1 35.3 34.8 36.6
Sewall 62.7 72.3 68.7 67.9 67.9 72.6 76.9 79.6 81.8 84.3 87.2 84.8 87.8 86.3 84.0 83.3 86.7 84.7 83.5 87.9Trent 0.0 0.0 23.6 46.7 58.4 62.4 65.9 68.2 70.1 72.1 74.6 87.1 90.0 103.3 115.0 128.4 133.5 130.5 128.6 135.2
20 MW LSD 0.0 0.0 0.0 0.0 0.0 0.0 0.0 0.0 0.0 0.0 0.0 0.0 0.0 0.0 0.0 0.0 0.0 18.6 36.7 38.6Wind 0.0 0.0 0.0 0.0 0.0 0.1 0.2 0.3 0.4 0.5 0.6 0.7 0.8 0.9 0.9 1.0 1.1 1.2 1.3 1.4
Production Cost (million $) 163 188 202 223 234 251 265 274 282 291 301 307 318 327 333 345 359 370 383 402
Investment Costs (million $) 0 0 14.4 14.4 7.2 3.75 3.75 3.75 3.75 3.75 3.75 10.95 3.75 10.95 10.95 10.95 3.75 13.35 13.35 3.75
Total System Costs (million $) 163 188 216 237 242 255 269 278 286 295 304 318 322 338 344 356 363 383 396 406

Caribbean Regional Electricity Generation, Interconnection, and Fuels Supply Strategy – Final Report A-67
Table A-68 Dominica Interconnection/Renewable Scenario Capacity Balance
Year 2009 2010 2011 2012 2013 2014 2015 2016 2017 2018 2019 2020 2021 2022 2023 2024 2025 2026 2027 2028
Peak Load (MW) 15 15 16 16 17 17 18 18 19 19 20 20 21 21 22 22 23 24 24 25Exports(+)/Imports(-) (MW) 185 185 185 185 185 185 185 185 185 185 185 185 185 185 185
Existing Capacity (MW)Hydro – three plants 5 5 5 5 5 5 5 5 5 5 5 5 5 5 5 5 5 5 5 5Thermal – two plants 16 16 16 16 16 16 16 16 16 16 16 16 16 16 16 16 16 16 16 16
Total Existing (MW) 21 21 21 21 21 21 21 21 21 21 21 21 21 21 21 21 21 21 21 21
Required Capacity (MW) 20 21 21 22 23 207 208 209 209 210 210 211 212 213 213 214 215 216 216 217Existing System Surplus(+)/Deficit(-) (MW) 1 0 0 -1 -2 -186 -187 -188 -188 -189 -189 -190 -191 -192 -192 -193 -194 -195 -195 -196
New Capacity (MW)5 MW MSD 0 0 0 0 0 0 0 0 0 0 0 0 0 0 0 0 0 0 0 0
Geo Non-Export 0 0 0 20 20 20 20 20 20 20 20 20 20 20 20 20 20 20 20 20Geo Export 0 0 0 0 0 185 185 185 185 185 185 185 185 185 185 185 185 185 185 185
Wind 0 0 0 0 0 0 0 0 0 0 0 0 0 0 0 0 0 0 0 0
Total Capacity (MW) 21 21 21 41 41 226 226 226 226 226 226 226 226 226 226 226 226 226 226 226
System Surplus(+)/Deficit(-) with Unit Additions (MW) 1 0 0 19 18 19 18 17 17 16 16 15 14 13 13 12 11 10 10 9
Reserve Margin (%) 40% 36% 32% 152% 145% 11.8% 11.5% 11.3% 11.0% 10.7% 10.5% 10.2% 9.9% 9.6% 9.3% 9.0% 8.7% 8.3% 8.0% 7.7%

Caribbean Regional Electricity Generation, Interconnection, and Fuels Supply Strategy – Final Report A-68
Table A-69 Dominica Interconnection/Renewable Scenario Energy Balance
Year 2009 2010 2011 2012 2013 2014 2015 2016 2017 2018 2019 2020 2021 2022 2023 2024 2025 2026 2027 2028
Energy (GWh) 87 89 91 94 96 99 101 104 106 109 112 114 117 120 123 126 129 133 136 139
Exports(+)/Imports(-) (GWh) 1,296 1,296 1,296 1,296 1,296 1,296 1,296 1,296 1,296 1,296 1,296 1,296 1,296 1,296 1,296
Generation (GWh)
Hydro – three plants 22 22 22 22 22 22 22 22 22 22 22 22 22 22 22 22 22 22 22 22
Thermal – two plants 65 67 70 2 4 7 9 12 14 17 20 22 25 28 31 34 37 41 44 47
5 MW MSD 0 0 0 0 0 0 0 0 0 0 0 0 0 0 0 0 0 0 0 0
Geo Non-Export 0 0 0 70 70 70 70 70 70 70 70 70 70 70 70 70 70 70 70 70
Geo Export 0 0 0 0 0 1296 1296 1296 1296 1296 1296 1296 1296 1296 1296 1296 1296 1296 1296 1296
Wind 0 0 0 0 0 0 0 0 0 0 0 0 0 0 0 0 0 0 0 0
Total Generation (GWh) 87 89 91 94 96 1395 1397 1400 1403 1405 1408 1411 1414 1417 1420 1423 1426 1429 1432 1436
Table A-70 Dominica Interconnection/Renewable Scenario Cost Summary (Million 2009 US$)
Year 2009 2010 2011 2012 2013 2014 2015 2016 2017 2018 2019 2020 2021 2022 2023 2024 2025 2026 2027 2028Fuel and O&M Costs
Hydro – three plants 0.6 0.6 0.6 0.6 0.6 0.6 0.6 0.6 0.6 0.6 0.6 0.6 0.6 0.6 0.6 0.6 0.6 0.6 0.6 0.6Thermal – two plants 12.1 12.8 14.1 1.0 1.5 2.1 2.7 3.4 4.0 4.6 5.3 6.0 6.7 7.5 8.2 9.1 10.0 10.9 11.9 13.0
5 MW MSD 0.0 0.0 0.0 0.0 0.0 0.0 0.0 0.0 0.0 0.0 0.0 0.0 0.0 0.0 0.0 0.0 0.0 0.0 0.0 0.0Geo Non-Export 0.0 0.0 0.0 1.6 1.6 1.6 1.6 1.6 1.6 1.6 1.6 1.6 1.6 1.6 1.6 1.6 1.6 1.6 1.6 1.6
Geo Export 0.0 0.0 0.0 0.0 0.0 20.9 20.9 20.9 20.9 20.9 20.9 20.9 20.9 20.9 20.9 20.9 20.9 20.9 20.9 20.9Wind 0.0 0.0 0.0 0.0 0.0 0.0 0.0 0.0 0.0 0.0 0.0 0.0 0.0 0.0 0.0 0.0 0.0 0.0 0.0 0.0
Production Cost (million $) 13 13 15 3 4 25 26 26 27 28 28 29 30 31 31 32 33 34 35 36
Investment Costs (million $) 0.0 0.0 0.0 56.0 0.0 643.2 0.0 0.0 0.0 0.0 0.0 0.0 0.0 0.0 0.0 0.0 0.0 0.0 0.0 0.0
Total System Costs (million $) 13 13 15 59 4 668 26 26 27 28 28 29 30 31 31 32 33 34 35 36
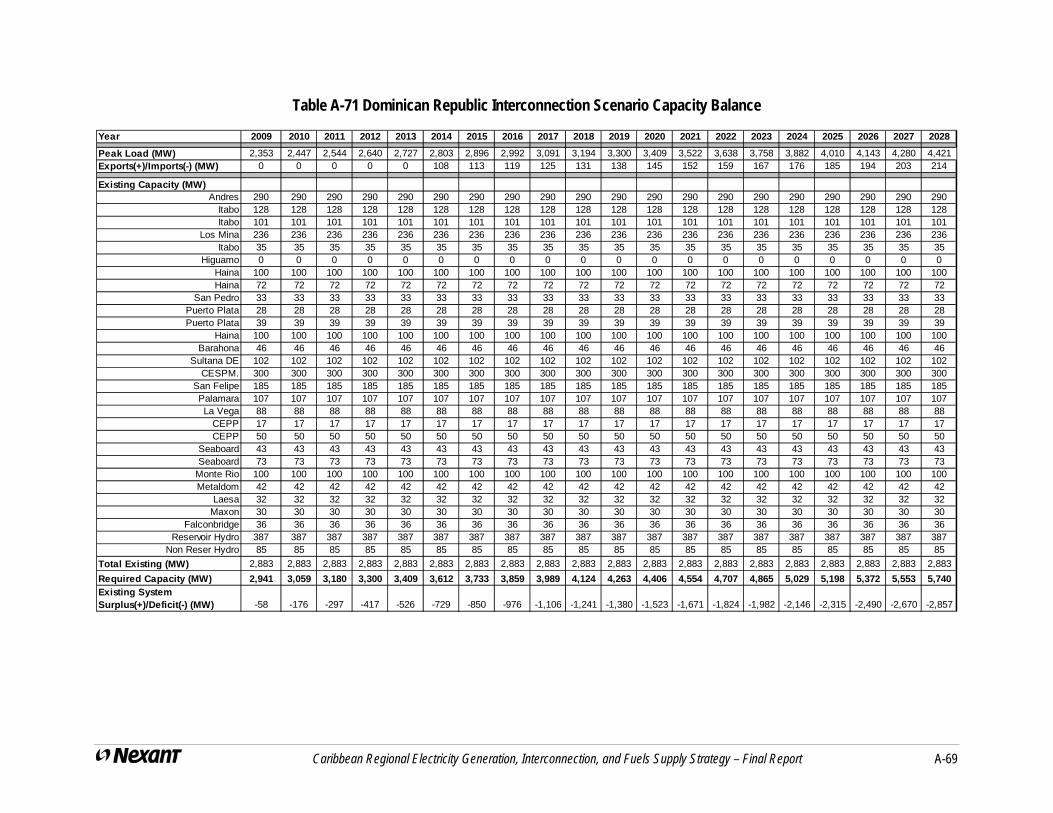
Caribbean Regional Electricity Generation, Interconnection, and Fuels Supply Strategy – Final Report A-69
Table A-71 Dominican Republic Interconnection Scenario Capacity Balance
Year 2009 2010 2011 2012 2013 2014 2015 2016 2017 2018 2019 2020 2021 2022 2023 2024 2025 2026 2027 2028
Peak Load (MW) 2,353 2,447 2,544 2,640 2,727 2,803 2,896 2,992 3,091 3,194 3,300 3,409 3,522 3,638 3,758 3,882 4,010 4,143 4,280 4,421Exports(+)/Imports(-) (MW) 0 0 0 0 0 108 113 119 125 131 138 145 152 159 167 176 185 194 203 214
Existing Capacity (MW)Andres 290 290 290 290 290 290 290 290 290 290 290 290 290 290 290 290 290 290 290 290
Itabo 128 128 128 128 128 128 128 128 128 128 128 128 128 128 128 128 128 128 128 128Itabo 101 101 101 101 101 101 101 101 101 101 101 101 101 101 101 101 101 101 101 101
Los Mina 236 236 236 236 236 236 236 236 236 236 236 236 236 236 236 236 236 236 236 236Itabo 35 35 35 35 35 35 35 35 35 35 35 35 35 35 35 35 35 35 35 35
Higuamo 0 0 0 0 0 0 0 0 0 0 0 0 0 0 0 0 0 0 0 0Haina 100 100 100 100 100 100 100 100 100 100 100 100 100 100 100 100 100 100 100 100Haina 72 72 72 72 72 72 72 72 72 72 72 72 72 72 72 72 72 72 72 72
San Pedro 33 33 33 33 33 33 33 33 33 33 33 33 33 33 33 33 33 33 33 33Puerto Plata 28 28 28 28 28 28 28 28 28 28 28 28 28 28 28 28 28 28 28 28Puerto Plata 39 39 39 39 39 39 39 39 39 39 39 39 39 39 39 39 39 39 39 39
Haina 100 100 100 100 100 100 100 100 100 100 100 100 100 100 100 100 100 100 100 100Barahona 46 46 46 46 46 46 46 46 46 46 46 46 46 46 46 46 46 46 46 46
Sultana DE 102 102 102 102 102 102 102 102 102 102 102 102 102 102 102 102 102 102 102 102CESPM. 300 300 300 300 300 300 300 300 300 300 300 300 300 300 300 300 300 300 300 300
San Felipe 185 185 185 185 185 185 185 185 185 185 185 185 185 185 185 185 185 185 185 185Palamara 107 107 107 107 107 107 107 107 107 107 107 107 107 107 107 107 107 107 107 107La Vega 88 88 88 88 88 88 88 88 88 88 88 88 88 88 88 88 88 88 88 88
CEPP 17 17 17 17 17 17 17 17 17 17 17 17 17 17 17 17 17 17 17 17CEPP 50 50 50 50 50 50 50 50 50 50 50 50 50 50 50 50 50 50 50 50
Seaboard 43 43 43 43 43 43 43 43 43 43 43 43 43 43 43 43 43 43 43 43Seaboard 73 73 73 73 73 73 73 73 73 73 73 73 73 73 73 73 73 73 73 73
Monte Rio 100 100 100 100 100 100 100 100 100 100 100 100 100 100 100 100 100 100 100 100Metaldom 42 42 42 42 42 42 42 42 42 42 42 42 42 42 42 42 42 42 42 42
Laesa 32 32 32 32 32 32 32 32 32 32 32 32 32 32 32 32 32 32 32 32Maxon 30 30 30 30 30 30 30 30 30 30 30 30 30 30 30 30 30 30 30 30
Falconbridge 36 36 36 36 36 36 36 36 36 36 36 36 36 36 36 36 36 36 36 36Reservoir Hydro 387 387 387 387 387 387 387 387 387 387 387 387 387 387 387 387 387 387 387 387
Non Reser Hydro 85 85 85 85 85 85 85 85 85 85 85 85 85 85 85 85 85 85 85 85
Total Existing (MW) 2,883 2,883 2,883 2,883 2,883 2,883 2,883 2,883 2,883 2,883 2,883 2,883 2,883 2,883 2,883 2,883 2,883 2,883 2,883 2,883
Required Capacity (MW) 2,941 3,059 3,180 3,300 3,409 3,612 3,733 3,859 3,989 4,124 4,263 4,406 4,554 4,707 4,865 5,029 5,198 5,372 5,553 5,740Existing System Surplus(+)/Deficit(-) (MW) -58 -176 -297 -417 -526 -729 -850 -976 -1,106 -1,241 -1,380 -1,523 -1,671 -1,824 -1,982 -2,146 -2,315 -2,490 -2,670 -2,857

Caribbean Regional Electricity Generation, Interconnection, and Fuels Supply Strategy – Final Report A-70
New Capacity (MW)Pinalto 50 50 50 50 50 50 50 50 50 50 50 50 50 50 50 50 50 50 50 50
Palomino 100 100 100 100 100 100 100 100 100 100 100 100 100 100 100 100 100 100 100 100Hatillo et al 0 17 17 17 17 17 17 17 17 17 17 17 17 17 17 17 17 17 17 17
Las Placetas 0 87 87 87 87 87 87 87 87 87 87 87 87 87 87 87 87 87 87 87Arbonito 0 0 45 45 45 45 45 45 45 45 45 45 45 45 45 45 45 45 45 45
Hondo Valle et al 0 0 0 57 57 57 57 57 57 57 57 57 57 57 57 57 57 57 57 57300 MW CC 0 0 0 300 300 300 600 600 900 900 1,200 1,200 1,500 1,500 1,500 1,800 1,800 2,100 2,400 2,400
300 MW ConvCoal 0 0 0 0 0 0 0 0 0 0 0 0 0 0 0 0 0 0 0 0Montecristi 0 0 0 0 0 0 0 0 0 0 0 0 0 0 0 0 0 0 0 0
Haltillo-Azua 0 0 0 0 0 0 0 0 0 0 0 0 0 0 0 0 0 0 0 050 MW GT 0 0 0 0 0 0 0 0 50 50 50 50 50 100 100 100 100 100 100 100
Montafongo,Bani,El Norte 0 100 100 100 100 100 100 100 100 100 100 100 100 100 100 100 100 100 100 100Wind 0 0 0 0 0 0 0 0 0 0 0 0 0 0 0 0 0 0 0 0
Total Capacity (MW) 3,033 3,137 3,182 3,539 3,539 3,539 3,839 3,839 4,189 4,189 4,489 4,489 4,789 4,839 4,839 5,139 5,139 5,439 5,739 5,739
System Surplus(+)/Deficit(-) with Unit Additions (MW) 92 78 2 239 130 -69 109 -16 204 70 231 88 240 137 -21 116 -53 73 192 6
Reserve Margin (%) 29% 28% 25% 34% 30% 21.7% 27.7% 23.6% 30.4% 26.1% 30.7% 26.5% 30.5% 27.6% 23.4% 26.8% 22.7% 25.6% 28.2% 24.0%

Caribbean Regional Electricity Generation, Interconnection, and Fuels Supply Strategy – Final Report A-71
Table A-72 Dominican Republic Interconnection Scenario Energy Balance
Year 2009 2010 2011 2012 2013 2014 2015 2016 2017 2018 2019 2020 2021 2022 2023 2024 2025 2026 2027 2028
Energy (GWh) 12,638 13,142 13,663 14,179 14,646 15,054 15,554 16,070 16,601 17,154 17,724 18,309 18,914 19,539 20,184 20,851 21,539 22,251 22,986 23,745
Exports(+)/Imports(-) (GWh) 0 0 0 0 0 520 546 573 602 632 664 697 732 768 807 847 889 934 980 1,029
Generation (GWh)
Andres 1709 1476 1562 1390 1468 1600 1460 1524 1378 1430 1332 1389 1324 1362 1413 1335 1375 1313 1261 1300
Itabo 1004 820 866 770 803 869 792 823 747 781 738 766 716 734 765 744 787 768 757 802
Itabo 706 583 614 546 569 616 561 584 530 553 523 542 507 520 542 526 557 543 534 566
Los Mina 865 1013 1044 914 948 1019 924 961 874 910 852 884 832 854 888 850 885 854 828 861
Itabo 73 164 171 153 158 171 155 162 148 155 146 153 142 146 152 148 156 152 150 159
Higuamo 0 0 0 0 0 0 0 0 0 0 0 0 0 0 0 0 0 0 0 0
Haina 362 410 428 383 399 430 391 407 374 390 368 381 357 366 381 369 390 379 373 393
Haina 267 284 296 263 274 295 268 279 256 267 252 261 244 250 261 253 266 259 255 268
San Pedro 123 138 144 129 134 145 132 137 126 131 124 128 120 123 128 124 131 128 126 132
Puerto Plata 103 116 121 108 112 121 110 115 105 110 104 107 100 103 107 104 110 107 105 111
Puerto Plata 146 163 170 152 159 171 156 162 149 155 146 152 142 146 152 147 155 151 148 156
Haina 237 465 483 431 446 480 437 454 417 435 411 428 400 410 427 415 438 427 419 444
Barahona 302 252 265 236 246 266 242 252 229 239 226 234 219 224 234 227 240 234 231 244
Sultana DE 487 363 370 321 330 353 318 331 302 316 297 307 286 294 306 296 311 302 295 309
CESPM. 1057 1257 1283 1116 1148 1226 1108 1151 1052 1098 1032 1070 998 1023 1065 1031 1084 1052 1029 1080
San Felipe 515 771 795 701 724 777 705 732 671 700 660 686 640 657 684 663 699 680 667 704
Palamara 523 401 410 357 368 394 356 370 338 353 332 344 321 329 343 332 349 338 331 347
La Vega 425 328 335 292 302 322 292 303 277 289 272 282 263 270 281 271 286 277 271 285
CEPP 75 62 64 56 58 62 56 58 53 56 52 54 51 52 54 52 55 53 52 55
CEPP 226 188 193 169 175 187 169 176 161 168 158 164 153 157 164 158 167 162 158 167
Seaboard 202 161 165 144 149 160 144 150 137 143 135 140 130 134 139 135 142 138 135 141
Seaboard 369 275 281 244 252 269 243 252 231 241 226 234 219 224 233 226 237 230 225 236
Monte Rio 516 377 383 333 343 366 330 343 314 327 308 318 297 305 317 307 322 313 306 320
Metaldom 202 157 161 140 145 155 140 146 133 139 131 135 126 130 135 131 137 133 130 137
Laesa 116 123 128 114 119 128 116 121 111 116 109 113 106 109 113 110 116 112 110 116
Maxon 75 118 122 108 111 120 109 113 103 108 102 106 99 101 106 102 108 105 103 109
Falconbridge 129 144 150 134 139 150 137 142 130 136 129 133 125 128 133 129 136 132 130 137
Reservoir Hydro 1255 1255 1255 1255 1255 1255 1255 1255 1255 1255 1255 1255 1255 1255 1255 1255 1255 1255 1255 1255
Non Reser Hydro 276 276 276 276 276 276 276 276 276 276 276 276 276 276 276 276 276 276 276 276

Caribbean Regional Electricity Generation, Interconnection, and Fuels Supply Strategy – Final Report A-72
Pinalto 143 143 143 143 143 143 143 143 143 143 143 143 143 143 143 143 143 143 143 143
Palomino 150 150 150 150 150 150 150 150 150 150 150 150 150 150 150 150 150 150 150 150
Hatillo et al 0 123 123 123 123 123 123 123 123 123 123 123 123 123 123 123 123 123 123 123
Las Placetas 0 331 331 331 331 331 331 331 331 331 331 331 331 331 331 331 331 331 331 331
Arbonito 0 0 125 125 125 125 125 125 125 125 125 125 125 125 125 125 125 125 125 125
Hondo Valle et al 0 0 0 219 219 219 219 219 219 219 219 219 219 219 219 219 219 219 219 219
300 MW CC 0 0 0 1597 1690 1845 3370 3518 4770 4945 6141 6406 7650 7868 8163 9231 9492 10561 11570 11912
300 MW ConvCoal 0 0 0 0 0 0 0 0 0 0 0 0 0 0 0 0 0 0 0 0
Montecristi 0 0 0 0 0 0 0 0 0 0 0 0 0 0 0 0 0 0 0 0
Haltillo-Azua 0 0 0 0 0 0 0 0 0 0 0 0 0 0 0 0 0 0 0 0
50 MW GT 0 0 0 0 0 0 0 0 209 218 203 211 200 412 428 406 421 404 389 403
Montafongo,Bani,El Norte 0 256 256 256 256 256 256 256 256 256 256 256 256 256 256 256 256 256 256 256
Wind 0 0 0 0 0 0 0 0 0 0 0 0 0 0 0 0 0 0 0 0
Total Generation (GWh) 12638 13142 13663 14179 14646 15574 16100 16643 17203 17786 18387 19006 19646 20307 20991 21698 22429 23185 23966 24775

Caribbean Regional Electricity Generation, Interconnection, and Fuels Supply Strategy – Final Report A-73
Table A-73 Dominican Republic Interconnection Scenario Cost Summary (Million 2009 US$) Year 2009 2010 2011 2012 2013 2014 2015 2016 2017 2018 2019 2020 2021 2022 2023 2024 2025 2026 2027 2028Fuel and O&M Costs
Andres 140.2 123.0 127.0 114.0 117.3 125.8 115.4 120.2 110.1 115.1 108.6 110.8 103.5 106.5 110.5 107.9 113.5 111.1 109.1 114.1Itabo 58.8 47.3 49.4 44.7 46.3 49.9 46.0 47.9 43.8 45.7 43.0 44.0 41.4 42.6 44.1 42.8 44.6 43.4 42.3 43.8Itabo 45.0 36.8 38.3 34.7 35.9 38.7 35.6 37.1 34.0 35.4 33.4 34.1 32.1 33.1 34.2 33.2 34.6 33.7 32.8 34.0
Los Mina 114.0 133.6 134.7 118.4 119.9 127.3 115.7 120.3 110.4 116.0 109.7 111.5 102.6 105.5 109.8 108.5 115.6 114.1 113.1 119.4Itabo 16.0 36.4 40.7 40.0 42.6 47.9 45.1 47.3 43.6 45.7 43.5 45.5 42.8 44.4 46.0 45.4 48.5 47.7 47.6 51.7
Higuamo 0.0 0.0 0.0 0.0 0.0 0.0 0.0 0.0 0.0 0.0 0.0 0.0 0.0 0.0 0.0 0.0 0.0 0.0 0.0 0.0Haina 45.0 80.5 91.5 90.5 98.3 110.9 104.1 109.2 100.9 105.5 100.4 103.5 98.0 101.4 105.3 103.0 109.6 107.5 107.5 115.0Haina 32.1 53.4 60.4 59.6 64.6 72.6 68.2 71.5 66.1 69.1 65.7 67.7 64.1 66.3 68.8 67.3 71.6 70.2 70.1 74.9
San Pedro 15.2 26.9 30.6 30.3 32.9 37.2 34.9 36.6 33.8 35.4 33.7 34.7 32.9 34.0 35.3 34.5 36.7 36.1 36.0 38.6Puerto Plata 12.7 22.5 25.6 25.4 27.5 31.1 29.2 30.6 28.3 29.6 28.2 29.0 27.5 28.4 29.5 28.9 30.7 30.2 30.1 32.3Puerto Plata 17.9 31.8 36.2 35.8 38.9 43.9 41.2 43.2 40.0 41.8 39.8 41.0 38.8 40.2 41.7 40.8 43.4 42.6 42.6 45.6
Haina 47.1 94.6 105.6 103.3 109.9 123.6 116.3 122.0 112.2 117.6 111.9 116.9 110.0 114.0 118.3 116.5 124.5 122.5 122.0 132.3Barahona 20.3 16.7 17.5 15.8 16.3 17.6 16.2 16.9 15.5 16.1 15.2 15.5 14.6 15.0 15.6 15.1 15.7 15.3 14.9 15.4
Sultana DE 43.2 50.3 55.4 53.2 56.9 63.1 59.0 61.7 56.9 59.4 56.4 58.0 54.9 56.7 58.7 57.4 60.6 59.4 59.0 62.6CESPM. 145.0 175.9 192.3 184.0 194.4 215.8 202.1 211.5 194.4 203.3 193.1 200.5 188.9 195.2 202.4 198.6 210.8 207.0 205.3 220.0
San Felipe 88.6 133.4 147.2 142.7 151.1 168.7 158.6 166.0 152.9 160.0 152.3 158.5 149.4 154.5 160.1 157.5 167.6 164.9 164.0 176.6Palamara 47.7 57.9 64.1 62.0 66.4 73.9 69.2 72.3 66.8 69.7 66.3 68.2 64.5 66.6 69.1 67.5 71.4 70.0 69.6 73.9La Vega 39.0 47.6 52.8 51.0 54.7 60.9 57.0 59.6 55.0 57.4 54.6 56.1 53.2 54.9 56.9 55.6 58.9 57.7 57.4 60.9
CEPP 7.4 9.6 10.7 10.4 11.2 12.5 11.7 12.2 11.3 11.8 11.2 11.5 10.9 11.3 11.7 11.4 12.1 11.9 11.8 12.6CEPP 22.3 29.1 32.4 31.5 33.9 37.8 35.4 37.1 34.2 35.8 34.0 35.0 33.1 34.2 35.5 34.7 36.8 36.0 35.9 38.2
Seaboard 19.2 24.2 26.9 26.0 27.9 31.1 29.2 30.5 28.2 29.4 28.0 28.8 27.2 28.1 29.2 28.5 30.2 29.6 29.5 31.3Seaboard 32.7 38.7 42.7 41.2 44.1 49.0 45.9 48.0 44.3 46.2 43.9 45.2 42.8 44.1 45.8 44.7 47.3 46.4 46.1 48.9
Monte Rio 44.6 51.7 57.0 54.9 58.7 65.2 61.0 63.7 58.8 61.4 58.3 60.0 56.8 58.6 60.7 59.3 62.8 61.5 61.1 64.8Metaldom 18.7 23.0 25.5 24.7 26.5 29.5 27.6 28.9 26.7 27.8 26.5 27.2 25.8 26.6 27.6 27.0 28.5 28.0 27.8 29.6
Laesa 14.1 23.4 26.4 26.0 28.2 31.7 29.8 31.2 28.8 30.1 28.7 29.5 28.0 28.9 30.0 29.4 31.2 30.6 30.6 32.7Maxon 13.5 21.3 23.5 22.9 24.2 27.1 25.5 26.7 24.6 25.7 24.5 25.5 24.0 24.8 25.8 25.3 27.0 26.5 26.4 28.5
Falconbridge 16.0 28.1 31.8 31.4 34.1 38.4 36.1 37.8 35.0 36.6 34.8 35.8 34.0 35.1 36.4 35.7 37.9 37.2 37.2 39.8Reservoir Hydro 21.8 21.8 21.8 21.8 21.8 21.8 21.8 21.8 21.8 21.8 21.8 21.8 21.8 21.8 21.8 21.8 21.8 21.8 21.8 21.8
Non Reser Hydro 4.8 4.8 4.8 4.8 4.8 4.8 4.8 4.8 4.8 4.8 4.8 4.8 4.8 4.8 4.8 4.8 4.8 4.8 4.8 4.8
Pinalto 2.1 2.1 2.1 2.1 2.1 2.1 2.1 2.1 2.1 2.1 2.1 2.1 2.1 2.1 2.1 2.1 2.1 2.1 2.1 2.1Palomino 3.7 3.7 3.7 3.7 3.7 3.7 3.7 3.7 3.7 3.7 3.7 3.7 3.7 3.7 3.7 3.7 3.7 3.7 3.7 3.7
Hatillo et al 0.0 0.9 0.9 0.9 0.9 0.9 0.9 0.9 0.9 0.9 0.9 0.9 0.9 0.9 0.9 0.9 0.9 0.9 0.9 0.9Las Placetas 0.0 3.8 3.8 3.8 3.8 3.8 3.8 3.8 3.8 3.8 3.8 3.8 3.8 3.8 3.8 3.8 3.8 3.8 3.8 3.8
Arbonito 0.0 0.0 1.8 1.8 1.8 1.8 1.8 1.8 1.8 1.8 1.8 1.8 1.8 1.8 1.8 1.8 1.8 1.8 1.8 1.8Hondo Valle et al 0.0 0.0 0.0 2.5 2.5 2.5 2.5 2.5 2.5 2.5 2.5 2.5 2.5 2.5 2.5 2.5 2.5 2.5 2.5 2.5
300 MW CC 0.0 0.0 0.0 117.9 121.6 130.8 239.8 249.9 342.8 358.5 450.2 459.8 536.7 552.8 573.6 671.3 706.0 805.0 902.6 943.0300 MW ConvCoal 0.0 0.0 0.0 0.0 0.0 0.0 0.0 0.0 0.0 0.0 0.0 0.0 0.0 0.0 0.0 0.0 0.0 0.0 0.0 0.0
Montecristi 0.0 0.0 0.0 0.0 0.0 0.0 0.0 0.0 0.0 0.0 0.0 0.0 0.0 0.0 0.0 0.0 0.0 0.0 0.0 0.0Haltillo-Azua 0.0 0.0 0.0 0.0 0.0 0.0 0.0 0.0 0.0 0.0 0.0 0.0 0.0 0.0 0.0 0.0 0.0 0.0 0.0 0.0
50 MW GT 0.0 0.0 0.0 0.0 0.0 0.0 0.0 0.0 20.8 21.8 20.5 20.9 19.4 39.9 41.5 40.7 43.2 42.4 41.8 43.9Montafongo,Bani,El Norte 0.0 3.1 3.1 3.1 3.1 3.1 3.1 3.1 3.1 3.1 3.1 3.1 3.1 3.1 3.1 3.1 3.1 3.1 3.1 3.1
Wind 0.0 0.0 0.0 0.0 0.0 0.0 0.0 0.0 0.0 0.0 0.0 0.0 0.0 0.0 0.0 0.0 0.0 0.0 0.0 0.0Production Cost (million $) 1,149 1,458 1,588 1,637 1,729 1,907 1,900 1,984 1,964 2,053 2,061 2,119 2,102 2,188 2,269 2,333 2,466 2,533 2,619 2,769
Investment Costs (million $) 0 385 112.5 427.5 0 0 285 0 307.5 0 285 0 285 22.5 0 285 0 285 285 0
Total System Costs (million $) 1,149 1,843 1,701 2,064 1,729 1,907 2,185 1,984 2,272 2,053 2,346 2,119 2,387 2,211 2,269 2,618 2,466 2,818 2,904 2,769

Caribbean Regional Electricity Generation, Interconnection, and Fuels Supply Strategy – Final Report A-74
Table A-74 Dominican Republic Renewable Scenario Capacity Balance
Year 2009 2010 2011 2012 2013 2014 2015 2016 2017 2018 2019 2020 2021 2022 2023 2024 2025 2026 2027 2028
Peak Load (MW) 2,353 2,447 2,544 2,640 2,727 2,803 2,896 2,992 3,091 3,194 3,300 3,409 3,522 3,638 3,758 3,882 4,010 4,143 4,280 4,421Exports(+)/Imports(-) (MW) 0 0 0 0 0 0 0 0 0 0 0 0 0 0 0 0 0 0 0 0
Existing Capacity (MW)Andres 290 290 290 290 290 290 290 290 290 290 290 290 290 290 290 290 290 290 290 290
Itabo 128 128 128 128 128 128 128 128 128 128 128 128 128 128 128 128 128 128 128 128Itabo 101 101 101 101 101 101 101 101 101 101 101 101 101 101 101 101 101 101 101 101
Los Mina 236 236 236 236 236 236 236 236 236 236 236 236 236 236 236 236 236 236 236 236Itabo 35 35 35 35 35 35 35 35 35 35 35 35 35 35 35 35 35 35 35 35
Higuamo 0 0 0 0 0 0 0 0 0 0 0 0 0 0 0 0 0 0 0 0Haina 100 100 100 100 100 100 100 100 100 100 100 100 100 100 100 100 100 100 100 100Haina 72 72 72 72 72 72 72 72 72 72 72 72 72 72 72 72 72 72 72 72
San Pedro 33 33 33 33 33 33 33 33 33 33 33 33 33 33 33 33 33 33 33 33Puerto Plata 28 28 28 28 28 28 28 28 28 28 28 28 28 28 28 28 28 28 28 28Puerto Plata 39 39 39 39 39 39 39 39 39 39 39 39 39 39 39 39 39 39 39 39
Haina 100 100 100 100 100 100 100 100 100 100 100 100 100 100 100 100 100 100 100 100Barahona 46 46 46 46 46 46 46 46 46 46 46 46 46 46 46 46 46 46 46 46
Sultana DE 102 102 102 102 102 102 102 102 102 102 102 102 102 102 102 102 102 102 102 102CESPM. 300 300 300 300 300 300 300 300 300 300 300 300 300 300 300 300 300 300 300 300
San Felipe 185 185 185 185 185 185 185 185 185 185 185 185 185 185 185 185 185 185 185 185Palamara 107 107 107 107 107 107 107 107 107 107 107 107 107 107 107 107 107 107 107 107La Vega 88 88 88 88 88 88 88 88 88 88 88 88 88 88 88 88 88 88 88 88
CEPP 17 17 17 17 17 17 17 17 17 17 17 17 17 17 17 17 17 17 17 17CEPP 50 50 50 50 50 50 50 50 50 50 50 50 50 50 50 50 50 50 50 50
Seaboard 43 43 43 43 43 43 43 43 43 43 43 43 43 43 43 43 43 43 43 43Seaboard 73 73 73 73 73 73 73 73 73 73 73 73 73 73 73 73 73 73 73 73
Monte Rio 100 100 100 100 100 100 100 100 100 100 100 100 100 100 100 100 100 100 100 100Metaldom 42 42 42 42 42 42 42 42 42 42 42 42 42 42 42 42 42 42 42 42
Laesa 32 32 32 32 32 32 32 32 32 32 32 32 32 32 32 32 32 32 32 32Maxon 30 30 30 30 30 30 30 30 30 30 30 30 30 30 30 30 30 30 30 30
Falconbridge 36 36 36 36 36 36 36 36 36 36 36 36 36 36 36 36 36 36 36 36Reservoir Hydro 387 387 387 387 387 387 387 387 387 387 387 387 387 387 387 387 387 387 387 387
Non Reser Hydro 85 85 85 85 85 85 85 85 85 85 85 85 85 85 85 85 85 85 85 85
Total Existing (MW) 2,883 2,883 2,883 2,883 2,883 2,883 2,883 2,883 2,883 2,883 2,883 2,883 2,883 2,883 2,883 2,883 2,883 2,883 2,883 2,883
Required Capacity (MW) 2,941 3,059 3,180 3,300 3,409 3,504 3,620 3,740 3,864 3,993 4,125 4,261 4,402 4,547 4,698 4,853 5,013 5,179 5,350 5,526Existing System Surplus(+)/Deficit(-) (MW) -58 -176 -297 -417 -526 -621 -737 -857 -981 -1,110 -1,242 -1,378 -1,519 -1,664 -1,815 -1,970 -2,130 -2,296 -2,467 -2,643

Caribbean Regional Electricity Generation, Interconnection, and Fuels Supply Strategy – Final Report A-75
New Capacity (MW)Pinalto 50 50 50 50 50 50 50 50 50 50 50 50 50 50 50 50 50 50 50 50
Palomino 100 100 100 100 100 100 100 100 100 100 100 100 100 100 100 100 100 100 100 100Hatillo et al 0 17 17 17 17 17 17 17 17 17 17 17 17 17 17 17 17 17 17 17
Las Placetas 0 87 87 87 87 87 87 87 87 87 87 87 87 87 87 87 87 87 87 87Arbonito 0 0 45 45 45 45 45 45 45 45 45 45 45 45 45 45 45 45 45 45
Hondo Valle et al 0 0 0 57 57 57 57 57 57 57 57 57 57 57 57 57 57 57 57 57300 MW CC 0 0 0 300 300 300 600 600 900 900 1,200 1,200 1,500 1,500 1,500 1,800 1,800 2,100 2,400 2,400
300 MW ConvCoal 0 0 0 0 0 0 0 0 0 0 0 0 0 0 0 0 0 0 0 0Montecristi 0 0 0 0 0 0 0 0 0 0 0 0 0 0 0 0 0 0 0 0
Haltillo-Azua 0 0 0 0 0 0 0 0 0 0 0 0 0 0 0 0 0 0 0 050 MW GT 0 0 0 0 0 0 0 0 50 50 50 50 50 100 100 100 100 100 100 100
Montafongo,Bani,El Norte 0 100 100 100 100 100 100 100 100 100 100 100 100 100 100 100 100 100 100 100Wind 0 0 30 60 90 120 150 180 210 240 270 300 330 360 390 420 450 480 510 540
Total Capacity (MW) 3,033 3,137 3,182 3,539 3,539 3,539 3,839 3,839 4,189 4,189 4,489 4,489 4,789 4,839 4,839 5,139 5,139 5,439 5,739 5,739
System Surplus(+)/Deficit(-) with Unit Additions (MW) 92 78 2 239 130 35 219 99 325 196 364 228 387 292 141 286 126 260 389 213
Reserve Margin (%) 29% 28% 25% 34% 30% 26.3% 32.6% 28.3% 35.5% 31.1% 36.0% 31.7% 36.0% 33.0% 28.8% 32.4% 28.1% 31.3% 34.1% 29.8%

Caribbean Regional Electricity Generation, Interconnection, and Fuels Supply Strategy – Final Report A-76
Table A-75 Dominican Republic Renewable Scenario Energy Balance
Year 2009 2010 2011 2012 2013 2014 2015 2016 2017 2018 2019 2020 2021 2022 2023 2024 2025 2026 2027 2028
Energy (GWh) 12,638 13,142 13,663 14,179 14,646 15,054 15,554 16,070 16,601 17,154 17,724 18,309 18,914 19,539 20,184 20,851 21,539 22,251 22,986 23,745
Exports(+)/Imports(-) (GWh) 0 0 0 0 0 0 0 0 0 0 0 0 0 0 0 0 0 0 0 0
Generation (GWh)
Andres 1709 1476 1550 1369 1437 1492 1353 1404 1264 1305 1210 1256 1194 1223 1265 1191 1224 1166 1116 1149
Itabo 1004 820 859 758 786 811 734 759 685 712 671 693 645 659 685 664 701 682 671 709
Itabo 706 583 609 538 557 574 520 538 486 505 475 490 457 467 485 470 495 482 473 500
Los Mina 865 1013 1036 900 928 950 856 886 801 830 774 800 750 767 795 758 788 758 733 761
Itabo 73 164 169 150 155 159 144 149 136 141 133 138 128 131 136 132 139 135 133 141
Higuamo 0 0 0 0 0 0 0 0 0 0 0 0 0 0 0 0 0 0 0 0
Haina 362 410 425 377 390 401 363 375 343 356 334 345 322 329 341 330 347 337 330 348
Haina 267 284 293 259 268 275 248 257 235 244 229 236 220 225 233 225 237 230 225 237
San Pedro 123 138 143 127 131 135 122 126 115 120 113 116 108 111 115 111 117 113 111 117
Puerto Plata 103 116 120 106 110 113 102 106 96 100 94 97 91 93 96 93 98 95 93 98
Puerto Plata 146 163 169 150 155 160 144 149 136 142 133 137 128 131 136 131 138 134 131 138
Haina 237 465 479 424 436 448 405 419 382 397 373 387 360 368 382 370 390 379 371 393
Barahona 302 252 263 232 241 248 224 232 210 218 205 212 197 201 209 203 214 208 204 216
Sultana DE 487 363 367 316 323 329 295 305 277 288 270 278 258 264 274 264 277 268 261 273
CESPM. 1057 1257 1274 1100 1124 1143 1027 1061 964 1002 938 968 899 919 953 920 965 934 911 955
San Felipe 515 771 789 691 708 724 653 675 615 639 600 620 577 590 612 592 622 604 591 622
Palamara 523 401 407 352 361 367 330 341 310 322 302 311 289 296 307 296 310 300 293 307
La Vega 425 328 333 288 295 301 270 279 254 264 247 255 237 242 251 242 254 246 240 252
CEPP 75 62 63 55 56 58 52 54 49 51 47 49 46 47 48 47 49 47 46 49
CEPP 226 188 191 166 171 175 157 162 148 154 144 148 138 141 146 141 148 144 140 147
Seaboard 202 161 164 142 146 149 134 138 126 131 122 126 117 120 125 120 126 122 119 125
Seaboard 369 275 279 241 246 251 225 233 211 220 206 212 197 201 209 201 211 204 200 209
Monte Rio 516 377 380 328 335 341 306 316 287 299 280 288 268 273 284 274 287 278 271 283
Metaldom 202 157 160 138 142 145 130 134 122 127 119 123 114 116 121 117 122 118 116 121
Laesa 116 123 127 112 116 119 108 111 102 106 99 102 95 98 101 98 103 100 98 103
Maxon 75 118 121 106 109 112 101 104 95 99 92 96 89 91 94 91 96 93 91 96
Falconbridge 129 144 149 132 136 140 127 131 120 124 117 120 112 115 119 115 121 118 115 121
Reservoir Hydro 1255 1255 1255 1255 1255 1255 1255 1255 1255 1255 1255 1255 1255 1255 1255 1255 1255 1255 1255 1255
Non Reser Hydro 276 276 276 276 276 276 276 276 276 276 276 276 276 276 276 276 276 276 276 276

Caribbean Regional Electricity Generation, Interconnection, and Fuels Supply Strategy – Final Report A-77
Pinalto 143 143 143 143 143 143 143 143 143 143 143 143 143 143 143 143 143 143 143 143
Palomino 150 150 150 150 150 150 150 150 150 150 150 150 150 150 150 150 150 150 150 150
Hatillo et al 0 123 123 123 123 123 123 123 123 123 123 123 123 123 123 123 123 123 123 123
Las Placetas 0 331 331 331 331 331 331 331 331 331 331 331 331 331 331 331 331 331 331 331
Arbonito 0 0 125 125 125 125 125 125 125 125 125 125 125 125 125 125 125 125 125 125
Hondo Valle et al 0 0 0 219 219 219 219 219 219 219 219 219 219 219 219 219 219 219 219 219
300 MW CC 0 0 0 1573 1654 1721 3124 3242 4374 4512 5578 5795 6895 7066 7307 8238 8448 9375 10248 10528
300 MW ConvCoal 0 0 0 0 0 0 0 0 0 0 0 0 0 0 0 0 0 0 0 0
Montecristi 0 0 0 0 0 0 0 0 0 0 0 0 0 0 0 0 0 0 0 0
Haltillo-Azua 0 0 0 0 0 0 0 0 0 0 0 0 0 0 0 0 0 0 0 0
50 MW GT 0 0 0 0 0 0 0 0 192 199 185 191 181 370 383 363 374 358 345 356
Montafongo,Bani,El Norte 0 256 256 256 256 256 256 256 256 256 256 256 256 256 256 256 256 256 256 256
Wind 0 0 84 168 252 336 420 505 589 673 757 841 925 1009 1093 1177 1261 1346 1430 1514
Total Generation (GWh) 12638 13142 13663 14179 14646 15054 15554 16070 16601 17154 17724 18309 18914 19539 20184 20851 21539 22251 22986 23745

Caribbean Regional Electricity Generation, Interconnection, and Fuels Supply Strategy – Final Report A-78
Table A-76 Dominican Republic Renewable Scenario Cost Summary (Million 2009 US$) Year 2009 2010 2011 2012 2013 2014 2015 2016 2017 2018 2019 2020 2021 2022 2023 2024 2025 2026 2027 2028Fuel and O&M Costs
Andres 140.2 123.0 126.1 112.4 114.9 117.9 107.6 111.4 101.7 105.8 99.4 101.1 94.1 96.5 99.8 97.2 102.0 99.6 97.7 101.8Itabo 58.8 47.3 49.1 44.1 45.4 46.8 42.9 44.5 40.5 42.0 39.4 40.1 37.6 38.6 39.9 38.6 40.1 38.9 37.9 39.2Itabo 45.0 36.8 38.1 34.2 35.2 36.3 33.3 34.5 31.5 32.6 30.6 31.2 29.3 30.0 31.0 30.0 31.2 30.3 29.5 30.5
Los Mina 114.0 133.6 133.7 116.7 117.4 119.0 107.6 111.3 101.6 106.3 100.1 101.3 92.9 95.3 98.8 97.4 103.4 101.8 100.7 106.1Itabo 16.0 36.4 40.4 39.4 41.7 44.7 41.9 43.7 40.0 41.7 39.6 41.2 38.6 39.9 41.2 40.5 43.2 42.4 42.2 45.7
Higuamo 0.0 0.0 0.0 0.0 0.0 0.0 0.0 0.0 0.0 0.0 0.0 0.0 0.0 0.0 0.0 0.0 0.0 0.0 0.0 0.0Haina 45.0 80.5 90.8 89.2 96.2 103.6 96.7 100.8 92.8 96.6 91.5 93.9 88.7 91.3 94.5 92.2 97.9 95.8 95.5 102.0Haina 32.1 53.4 60.0 58.8 63.2 67.9 63.4 66.1 60.8 63.2 59.9 61.5 58.1 59.8 61.9 60.4 64.0 62.6 62.4 66.5
San Pedro 15.2 26.9 30.4 29.9 32.2 34.7 32.4 33.8 31.1 32.4 30.7 31.5 29.7 30.6 31.7 30.9 32.8 32.1 32.0 34.2Puerto Plata 12.7 22.5 25.4 25.0 27.0 29.0 27.1 28.3 26.0 27.1 25.7 26.3 24.9 25.6 26.5 25.9 27.4 26.9 26.8 28.6Puerto Plata 17.9 31.8 35.9 35.3 38.1 41.0 38.3 39.9 36.7 38.3 36.3 37.2 35.1 36.2 37.4 36.5 38.8 38.0 37.9 40.4
Haina 47.1 94.6 104.8 101.8 107.6 115.3 107.8 112.5 102.9 107.4 101.8 105.8 99.2 102.4 105.9 104.1 110.9 108.8 108.2 117.0Barahona 20.3 16.7 17.3 15.6 16.0 16.5 15.1 15.7 14.3 14.8 13.9 14.2 13.3 13.7 14.1 13.6 14.2 13.8 13.4 13.8
Sultana DE 43.2 50.3 55.0 52.5 55.7 59.1 55.0 57.1 52.5 54.6 51.6 52.9 49.9 51.3 53.0 51.6 54.4 53.2 52.7 55.8CESPM. 145.0 175.9 190.9 181.4 190.4 201.9 188.0 195.6 179.0 186.3 176.3 182.2 171.1 176.3 182.1 178.2 188.6 184.8 182.8 195.5
San Felipe 88.6 133.4 146.1 140.6 148.0 157.8 147.4 153.5 140.7 146.6 138.9 144.0 135.3 139.4 144.0 141.3 149.9 147.1 146.0 156.9Palamara 47.7 57.9 63.7 61.1 65.1 69.2 64.4 67.0 61.6 64.0 60.6 62.1 58.6 60.3 62.3 60.7 64.0 62.6 62.2 65.9La Vega 39.0 47.6 52.4 50.3 53.6 57.0 53.1 55.2 50.7 52.7 49.9 51.1 48.3 49.6 51.3 50.0 52.8 51.6 51.2 54.3
CEPP 7.4 9.6 10.6 10.3 11.0 11.7 10.9 11.3 10.4 10.8 10.3 10.5 9.9 10.2 10.6 10.3 10.9 10.6 10.6 11.2CEPP 22.3 29.1 32.2 31.1 33.2 35.4 33.0 34.3 31.6 32.8 31.1 31.9 30.1 30.9 32.0 31.2 32.9 32.2 32.0 34.0
Seaboard 19.2 24.2 26.7 25.7 27.4 29.2 27.2 28.3 26.0 27.0 25.6 26.2 24.7 25.4 26.3 25.6 27.1 26.5 26.3 27.9Seaboard 32.7 38.7 42.4 40.6 43.2 45.9 42.7 44.5 40.8 42.4 40.2 41.1 38.8 39.9 41.3 40.2 42.4 41.5 41.1 43.6
Monte Rio 44.6 51.7 56.6 54.1 57.5 61.1 56.8 59.1 54.3 56.4 53.4 54.6 51.6 53.0 54.8 53.4 56.3 55.0 54.6 57.7Metaldom 18.7 23.0 25.3 24.4 25.9 27.6 25.7 26.7 24.6 25.5 24.2 24.8 23.4 24.1 24.9 24.2 25.6 25.0 24.8 26.3
Laesa 14.1 23.4 26.2 25.7 27.6 29.6 27.7 28.8 26.5 27.6 26.2 26.9 25.4 26.1 27.0 26.4 27.9 27.3 27.2 29.0Maxon 13.5 21.3 23.4 22.5 23.7 25.3 23.7 24.7 22.6 23.5 22.3 23.2 21.8 22.4 23.2 22.7 24.1 23.7 23.5 25.3
Falconbridge 16.0 28.1 31.6 31.0 33.4 35.9 33.5 34.9 32.2 33.5 31.7 32.5 30.7 31.7 32.7 32.0 33.9 33.2 33.1 35.3Reservoir Hydro 21.8 21.8 21.8 21.8 21.8 21.8 21.8 21.8 21.8 21.8 21.8 21.8 21.8 21.8 21.8 21.8 21.8 21.8 21.8 21.8
Non Reser Hydro 4.8 4.8 4.8 4.8 4.8 4.8 4.8 4.8 4.8 4.8 4.8 4.8 4.8 4.8 4.8 4.8 4.8 4.8 4.8 4.8
Pinalto 2.1 2.1 2.1 2.1 2.1 2.1 2.1 2.1 2.1 2.1 2.1 2.1 2.1 2.1 2.1 2.1 2.1 2.1 2.1 2.1Palomino 3.7 3.7 3.7 3.7 3.7 3.7 3.7 3.7 3.7 3.7 3.7 3.7 3.7 3.7 3.7 3.7 3.7 3.7 3.7 3.7
Hatillo et al 0.0 0.9 0.9 0.9 0.9 0.9 0.9 0.9 0.9 0.9 0.9 0.9 0.9 0.9 0.9 0.9 0.9 0.9 0.9 0.9Las Placetas 0.0 3.8 3.8 3.8 3.8 3.8 3.8 3.8 3.8 3.8 3.8 3.8 3.8 3.8 3.8 3.8 3.8 3.8 3.8 3.8
Arbonito 0.0 0.0 1.8 1.8 1.8 1.8 1.8 1.8 1.8 1.8 1.8 1.8 1.8 1.8 1.8 1.8 1.8 1.8 1.8 1.8Hondo Valle et al 0.0 0.0 0.0 2.5 2.5 2.5 2.5 2.5 2.5 2.5 2.5 2.5 2.5 2.5 2.5 2.5 2.5 2.5 2.5 2.5
300 MW CC 0.0 0.0 0.0 116.3 119.1 122.4 223.3 231.5 316.1 329.0 411.6 418.7 487.1 500.1 517.2 603.7 633.0 720.3 805.9 840.0300 MW ConvCoal 0.0 0.0 0.0 0.0 0.0 0.0 0.0 0.0 0.0 0.0 0.0 0.0 0.0 0.0 0.0 0.0 0.0 0.0 0.0 0.0
Montecristi 0.0 0.0 0.0 0.0 0.0 0.0 0.0 0.0 0.0 0.0 0.0 0.0 0.0 0.0 0.0 0.0 0.0 0.0 0.0 0.0Haltillo-Azua 0.0 0.0 0.0 0.0 0.0 0.0 0.0 0.0 0.0 0.0 0.0 0.0 0.0 0.0 0.0 0.0 0.0 0.0 0.0 0.0
50 MW GT 0.0 0.0 0.0 0.0 0.0 0.0 0.0 0.0 19.1 19.9 18.7 19.0 17.5 36.0 37.3 36.5 38.6 37.8 37.2 39.0Montafongo,Bani,El Norte 0.0 3.1 3.1 3.1 3.1 3.1 3.1 3.1 3.1 3.1 3.1 3.1 3.1 3.1 3.1 3.1 3.1 3.1 3.1 3.1
Wind 0.0 0.0 0.9 1.9 2.8 3.8 4.7 5.7 6.6 7.6 8.5 9.5 10.4 11.4 12.3 13.2 14.2 15.1 16.1 17.0Production Cost (million $) 1,149 1,458 1,578 1,616 1,697 1,790 1,776 1,845 1,820 1,893 1,894 1,941 1,921 1,993 2,059 2,113 2,227 2,283 2,356 2,485
Investment Costs (million $) 0 385 150 465 37.5 37.5 322.5 37.5 345 37.5 322.5 37.5 322.5 60 37.5 322.5 37.5 322.5 322.5 37.5
Total System Costs (million $) 1,149 1,843 1,728 2,081 1,735 1,828 2,098 1,883 2,165 1,931 2,217 1,979 2,243 2,053 2,097 2,436 2,264 2,606 2,678 2,522

Caribbean Regional Electricity Generation, Interconnection, and Fuels Supply Strategy – Final Report A-79
Table A-77 Grenada Interconnection/Renewable Scenario Capacity Balance
Year 2009 2010 2011 2012 2013 2014 2015 2016 2017 2018 2019 2020 2021 2022 2023 2024 2025 2026 2027 2028
Peak Load (MW) 31 33 34 36 38 40 42 45 47 50 52 55 58 61 64 68 72 75 80 84Exports(+)/Imports(-) (MW)
Existing Capacity (MW)Queens Park 17 17 17 17 17 17 17 17 17 17 17 17 17 17 17 17 17 17 17 17Queens Park 16 16 16 16 16 16 16 16 16 16 16 16 16 16 16 16 16 16 16 16Queens Park 16 16 16 16 16 16 16 16 16 16 16 16 16 16 16 16 16 16 16 16
Total Existing (MW) 49 49 49 49 49 49 49 49 49 49 49 49 49 49 49 49 49 49 49 49
Required Capacity (MW) 42 44 46 49 52 54 57 60 64 67 71 74 78 83 87 92 97 102 107 113Existing System Surplus(+)/Deficit(-) (MW) 7 4 2 0 -3 -6 -9 -12 -15 -18 -22 -26 -30 -34 -39 -43 -48 -53 -59 -65
New Capacity (MW)10 MW MSD 0 0 0 0 10 10 10 20 20 20 30 30 30 40 40 50 50 60 60 7010 MW CFB 0 0 0 0 0 0 0 0 0 0 0 0 0 0 0 0 0 0 0 0
Wind 0 0 0 3 5 5 6 6 6 8 8 9 9 9 11 11 11 12 12 12
Total Capacity (MW) 49 49 49 49 59 59 59 69 69 69 79 79 79 89 89 99 99 109 109 119
System Surplus(+)/Deficit(-) with Unit Additions (MW) 7 4 2 0 7 4 1 8 5 2 8 4 0 6 1 7 2 7 1 5
Reserve Margin (%) 57% 49% 41% 34% 53% 45.4% 37.9% 53.3% 45.5% 38.0% 50.1% 42.4% 35.2% 44.6% 37.2% 45.0% 37.6% 43.8% 36.4% 41.4%

Caribbean Regional Electricity Generation, Interconnection, and Fuels Supply Strategy – Final Report A-80
Table A-78 Grenada Interconnection/Renewable Scenario Energy Balance
Year 2009 2010 2011 2012 2013 2014 2015 2016 2017 2018 2019 2020 2021 2022 2023 2024 2025 2026 2027 2028
Energy (GWh) 198 209 220 232 244 257 270 285 300 316 333 350 369 389 409 431 454 478 504 530
Exports(+)/Imports(-) (GWh)
Generation (GWh)
Queens Park 67 71 75 76 62 66 68 60 63 66 60 62 66 61 63 59 63 59 62 60
Queens Park 65 69 73 74 60 64 66 58 61 64 58 60 64 59 61 58 61 57 61 58
Queens Park 65 69 73 74 60 64 66 58 61 64 58 60 64 59 61 58 61 57 61 58
10 MW MSD 0 0 0 0 48 51 52 92 97 101 137 143 151 185 194 227 240 271 286 320
10 MW CFB 0 0 0 0 0 0 0 0 0 0 0 0 0 0 0 0 0 0 0 0
Wind 0 0 0 8 13 13 17 17 17 21 21 25 25 25 29 29 29 34 34 34
Total Generation (GWh) 198 209 220 232 244 257 270 285 300 316 333 350 369 389 409 431 454 478 504 530
Table A-79 Grenada Interconnection/Renewable Scenario Cost Summary (Million 2009 US$)
Year 2009 2010 2011 2012 2013 2014 2015 2016 2017 2018 2019 2020 2021 2022 2023 2024 2025 2026 2027 2028Fuel and O&M Costs
Queens Park 10.9 11.8 13.3 14.7 12.5 13.7 14.7 13.0 13.7 14.4 13.1 13.7 14.5 13.6 14.1 13.4 14.3 13.6 14.6 14.3Queens Park 10.6 11.5 12.9 14.2 12.1 13.3 14.2 12.6 13.3 13.9 12.7 13.3 14.1 13.2 13.7 13.0 13.9 13.2 14.2 13.9Queens Park 10.6 11.5 12.9 14.2 12.1 13.3 14.2 12.6 13.3 13.9 12.7 13.3 14.1 13.2 13.7 13.0 13.9 13.2 14.2 13.910 MW MSD 0.0 0.0 0.0 0.0 8.0 8.8 9.4 16.7 17.6 18.4 25.2 26.3 28.0 34.8 36.2 43.1 46.0 52.6 56.2 64.410 MW CFB 0.0 0.0 0.0 0.0 0.0 0.0 0.0 0.0 0.0 0.0 0.0 0.0 0.0 0.0 0.0 0.0 0.0 0.0 0.0 0.0
Wind 0.0 0.0 0.0 0.1 0.1 0.1 0.2 0.2 0.2 0.2 0.2 0.3 0.3 0.3 0.3 0.3 0.3 0.4 0.4 0.4Production Cost (million $) 32 35 39 43 45 49 53 55 58 61 64 67 71 75 78 83 89 93 100 107
Investment Costs (million $) 0 0 0 3.75 6.375 0 1.875 4.5 0 1.875 4.5 1.875 0 4.5 1.875 4.5 0 6.375 0 4.5
Total System Costs (million $) 32 35 39 47 51 49 55 60 58 63 68 69 71 79 80 87 89 99 100 111

Caribbean Regional Electricity Generation, Interconnection, and Fuels Supply Strategy – Final Report A-81
Table A-80 Haiti Interconnection Scenario Capacity Balance
Year 2009 2010 2011 2012 2013 2014 2015 2016 2017 2018 2019 2020 2021 2022 2023 2024 2025 2026 2027 2028
Peak Load (MW) 226 237 249 261 274 288 303 318 334 350 368 386 405 426 447 469 493 517 543 570Exports(+)/Imports(-) (MW) 0 0 0 0 0 -96 -101 -106 -111 -117 -123 -129 -135 -142 -149 -156 -164 -172 -181 -190
Existing Capacity (MW)Varreau PAP EDH 34 34 34 34 34 34 34 34 34 34 34 34 34 34 34 34 34 34 34 34
Carrefour PAP EDH 24 24 24 24 24 24 24 24 24 24 24 24 24 24 24 24 24 24 24 24Peligre PAP EDH 27 27 27 27 27 27 27 27 27 27 27 27 27 27 27 27 27 27 27 27
Varreau PAP Sogener IPPs 20 20 20 20 20 20 20 20 20 20 20 20 20 20 20 20 20 20 20 20Carrefour PAP IPP 10 10 10 10 10 10 10 10 10 10 10 10 10 10 10 10 10 10 10 10
Thermal in Provinces 36 36 36 36 36 36 36 36 36 36 36 36 36 36 36 36 36 36 36 36Hydro in Provinces 4 4 4 4 4 4 4 4 4 4 4 4 4 4 4 4 4 4 4 4
Total Existing (MW) 155 155 155 155 155 155 155 155 155 155 155 155 155 155 155 155 155 155 155 155
Required Capacity (MW) 293 308 324 340 357 279 292 307 322 339 355 373 392 411 432 454 476 500 525 551Existing System Surplus(+)/Deficit(-) (MW) -138 -153 -169 -185 -202 -124 -137 -152 -167 -184 -200 -218 -237 -256 -277 -299 -321 -345 -370 -396
New Capacity (MW)E-Power 30 30 30 30 30 30 30 30 30 30 30 30 30 30 30 30 30 30 30 30
Gov of Brazil 30 30 30 30 30 30 30 30 30 30 30 30 30 30 30 30 30 30 30 3020 MW LSD 80 100 120 120 120 120 120 120 120 120 140 160 180 200 220 240 260 300 320 340
Wind 0 0 0 0 0 0 0 0 0 0 0 0 0 0 0 0 0 0 0 0
Total Capacity (MW) 295 315 335 335 335 335 335 335 335 335 355 375 395 415 435 455 475 515 535 555
System Surplus(+)/Deficit(-) with Unit Additions (MW) 2 7 11 -5 -22 56 43 28 13 -4 0 2 3 4 3 1 -1 15 10 4
Reserve Margin (%) 31% 33% 35% 28% 22% 74.4% 66.1% 58.2% 50.7% 43.5% 44.8% 45.7% 46.1% 46.2% 46.0% 45.4% 44.6% 49.3% 47.7% 45.9%

Caribbean Regional Electricity Generation, Interconnection, and Fuels Supply Strategy – Final Report A-82
Table A-81 Haiti Interconnection Scenario Energy Balance
Year 2009 2010 2011 2012 2013 2014 2015 2016 2017 2018 2019 2020 2021 2022 2023 2024 2025 2026 2027 2028
Energy (GWh) 660 726 799 878 966 1,063 1,169 1,286 1,415 1,556 1,712 1,883 1,977 2,076 2,180 2,289 2,403 2,523 2,650 2,782
Exports(+)/Imports(-) (GWh) 0 0 0 0 0 -463 -486 -510 -536 -562 -591 -620 -651 -684 -718 -754 -791 -831 -873 -916
Generation (GWh)
Varreau PAP EDH 67 69 71 80 90 49 58 68 80 93 98 105 103 102 101 101 101 96 96 97
Carrefour PAP EDH 48 49 50 56 63 35 41 48 56 65 69 74 73 72 71 71 71 68 68 69
Peligre PAP EDH 71 71 71 71 71 71 71 71 71 71 71 71 71 71 71 71 71 71 71 71
Varreau PAP Sogener IPPs 30 31 32 36 41 22 26 31 36 42 45 48 47 46 46 46 46 44 44 44
Carrefour PAP IPP 15 15 16 18 20 11 13 16 18 21 22 24 23 23 23 23 23 22 22 22
Thermal in Provinces 54 56 58 65 73 40 48 56 65 76 80 86 84 83 83 82 82 79 79 80
Hydro in Provinces 11 11 11 11 11 11 11 11 11 11 11 11 11 11 11 11 11 11 11 11
E-Power 75 77 79 89 100 54 65 76 89 103 109 116 114 113 112 112 111 106 107 108
Gov of Brazil 79 79 79 79 79 79 79 79 79 79 79 79 79 79 79 79 79 79 79 79
20 MW LSD 210 269 333 374 419 229 272 320 374 433 536 651 722 793 866 940 1018 1119 1201 1286
Wind 0 0 0 0 0 0 0 0 0 0 0 0 0 0 0 0 0 0 0 0
Total Generation (GWh) 660 726 799 878 966 600 683 776 879 994 1121 1263 1326 1392 1462 1535 1612 1692 1777 1866
Table A-82 Haiti Interconnection Scenario Cost Summary (Million 2009 US$)
Year 2009 2010 2011 2012 2013 2014 2015 2016 2017 2018 2019 2020 2021 2022 2023 2024 2025 2026 2027 2028Fuel and O&M Costs
Varreau PAP EDH 11.4 12.0 13.1 15.9 18.1 10.9 13.1 15.3 17.7 20.4 21.7 23.0 22.9 22.8 22.6 22.8 23.0 22.2 22.7 23.3Carrefour PAP EDH 8.1 8.5 9.3 11.2 12.8 7.7 9.3 10.8 12.5 14.4 15.3 16.3 16.1 16.1 16.0 16.1 16.3 15.7 16.0 16.5
Peligre PAP EDH 0.0 0.0 0.0 0.0 0.0 0.0 0.0 0.0 0.0 0.0 0.0 0.0 0.0 0.0 0.0 0.0 0.0 0.0 0.0 0.0Varreau PAP Sogener IPPs 6.6 6.9 7.6 9.2 10.5 6.3 7.6 8.8 10.2 11.7 12.5 13.3 13.2 13.1 13.0 13.1 13.3 12.8 13.0 13.4
Carrefour PAP IPP 3.3 3.5 3.8 4.6 5.2 3.2 3.8 4.4 5.1 5.9 6.2 6.6 6.6 6.6 6.5 6.6 6.6 6.4 6.5 6.7Thermal in Provinces 11.9 12.5 13.6 16.5 18.8 11.3 13.6 15.9 18.4 21.1 22.5 23.9 23.7 23.7 23.4 23.6 23.9 23.0 23.5 24.2
Hydro in Provinces 0.4 0.4 0.4 0.4 0.4 0.4 0.4 0.4 0.4 0.4 0.4 0.4 0.4 0.4 0.4 0.4 0.4 0.4 0.4 0.4E-Power 10.7 11.2 12.3 14.9 17.1 10.2 12.3 14.4 16.7 19.2 20.5 21.8 21.6 21.6 21.3 21.5 21.8 21.0 21.4 22.0
Gov of Brazil 1.2 1.2 1.2 1.2 1.2 1.2 1.2 1.2 1.2 1.2 1.2 1.2 1.2 1.2 1.2 1.2 1.2 1.2 1.2 1.220 MW LSD 28.5 37.4 49.3 59.8 68.3 40.8 49.2 57.6 66.6 76.9 95.6 116.1 129.5 143.7 156.6 172.3 188.6 209.9 228.2 249.7
Wind 0.0 0.0 0.0 0.0 0.0 0.0 0.0 0.0 0.0 0.0 0.0 0.0 0.0 0.0 0.0 0.0 0.0 0.0 0.0 0.0Production Cost (million $) 82 94 111 134 153 92 110 129 149 171 196 223 235 249 261 278 295 313 333 358
Investment Costs (million $) 38.4 9.6 9.6 0 0 0 0 0 0 0 9.6 9.6 9.6 9.6 9.6 9.6 9.6 19.2 9.6 9.6
Total System Costs (million $) 120 103 120 134 153 92 110 129 149 171 206 232 245 259 271 287 305 332 343 367

Caribbean Regional Electricity Generation, Interconnection, and Fuels Supply Strategy – Final Report A-83
Table A-83 Haiti Renewable Scenario Capacity Balance
Year 2009 2010 2011 2012 2013 2014 2015 2016 2017 2018 2019 2020 2021 2022 2023 2024 2025 2026 2027 2028
Peak Load (MW) 226 237 249 261 274 288 303 318 334 350 368 386 405 426 447 469 493 517 543 570Exports(+)/Imports(-) (MW)
Existing Capacity (MW)Varreau PAP EDH 34 34 34 34 34 34 34 34 34 34 34 34 34 34 34 34 34 34 34 34
Carrefour PAP EDH 24 24 24 24 24 24 24 24 24 24 24 24 24 24 24 24 24 24 24 24Peligre PAP EDH 27 27 27 27 27 27 27 27 27 27 27 27 27 27 27 27 27 27 27 27
Varreau PAP Sogener IPPs 20 20 20 20 20 20 20 20 20 20 20 20 20 20 20 20 20 20 20 20Carrefour PAP IPP 10 10 10 10 10 10 10 10 10 10 10 10 10 10 10 10 10 10 10 10
Thermal in Provinces 36 36 36 36 36 36 36 36 36 36 36 36 36 36 36 36 36 36 36 36Hydro in Provinces 4 4 4 4 4 4 4 4 4 4 4 4 4 4 4 4 4 4 4 4
Total Existing (MW) 155 155 155 155 155 155 155 155 155 155 155 155 155 155 155 155 155 155 155 155
Required Capacity (MW) 293 308 324 340 357 375 393 413 434 455 478 502 527 553 581 610 641 673 706 742Existing System Surplus(+)/Deficit(-) (MW) -138 -153 -169 -185 -202 -220 -238 -258 -279 -300 -323 -347 -372 -398 -426 -455 -486 -518 -551 -587
New Capacity (MW)E-Power 30 30 30 30 30 30 30 30 30 30 30 30 30 30 30 30 30 30 30 30
Gov of Brazil 30 30 30 30 30 30 30 30 30 30 30 30 30 30 30 30 30 30 30 3020 MW LSD 80 100 120 140 160 160 180 200 220 240 280 300 320 340 380 400 440 460 500 540
Wind 0 0 5 9 14 18 23 27 32 36 41 45 50 54 59 63 68 72 77 81
Total Capacity (MW) 295 315 335 355 375 375 395 415 435 455 495 515 535 555 595 615 655 675 715 755
System Surplus(+)/Deficit(-) with Unit Additions (MW) 2 7 11 15 18 0 2 2 1 0 17 13 8 2 14 5 14 2 9 13
Reserve Margin (%) 31% 33% 35% 36% 37% 30.2% 30.6% 30.6% 30.4% 29.9% 34.6% 33.4% 32.0% 30.4% 33.1% 31.0% 32.9% 30.5% 31.6% 32.3%

Caribbean Regional Electricity Generation, Interconnection, and Fuels Supply Strategy – Final Report A-84
Table A-84 Haiti Renewable Scenario Energy Balance
Year 2009 2010 2011 2012 2013 2014 2015 2016 2017 2018 2019 2020 2021 2022 2023 2024 2025 2026 2027 2028
Energy (GWh) 660 726 799 878 966 1,063 1,169 1,286 1,415 1,556 1,712 1,883 1,977 2,076 2,180 2,289 2,403 2,523 2,650 2,782
Exports(+)/Imports(-) (GWh) 0 0 0 0 0 0 0 0 0 0 0 0 0 0 0 0 0 0 0 0
Generation (GWh)
Varreau PAP EDH 67 69 70 71 73 81 84 87 91 95 94 100 100 100 97 98 96 97 96 95
Carrefour PAP EDH 48 49 49 50 51 57 59 61 64 67 67 70 71 71 69 69 68 69 68 67
Peligre PAP EDH 71 71 71 71 71 71 71 71 71 71 71 71 71 71 71 71 71 71 71 71
Varreau PAP Sogener IPPs 30 31 31 32 33 37 38 39 41 43 43 45 45 46 44 45 44 44 44 43
Carrefour PAP IPP 15 15 16 16 16 18 19 20 21 22 21 23 23 23 22 22 22 22 22 22
Thermal in Provinces 54 56 56 58 59 66 68 71 74 78 77 82 82 82 79 80 78 80 78 78
Hydro in Provinces 11 11 11 11 11 11 11 11 11 11 11 11 11 11 11 11 11 11 11 11
E-Power 75 77 77 79 81 90 93 96 100 105 105 111 111 111 108 109 106 108 106 105
Gov of Brazil 79 79 79 79 79 79 79 79 79 79 79 79 79 79 79 79 79 79 79 79
20 MW LSD 210 269 326 387 454 504 586 676 776 886 1030 1166 1246 1331 1437 1528 1640 1742 1862 1987
Wind 0 0 13 25 38 50 63 76 88 101 114 126 139 151 164 177 189 202 214 227
Total Generation (GWh) 660 726 799 878 966 1063 1169 1286 1415 1556 1712 1883 1977 2076 2180 2289 2403 2523 2650 2782
Table A-85 Haiti Renewable Scenario Cost Summary (Million 2009 US$)
Year 2009 2010 2011 2012 2013 2014 2015 2016 2017 2018 2019 2020 2021 2022 2023 2024 2025 2026 2027 2028Fuel and O&M Costs
Varreau PAP EDH 11.4 12.0 12.9 14.3 15.0 17.2 18.2 19.0 19.8 20.8 20.9 22.1 22.3 22.6 21.8 22.3 22.0 22.5 22.5 22.7Carrefour PAP EDH 8.1 8.5 9.1 10.1 10.6 12.1 12.9 13.4 14.0 14.7 14.7 15.6 15.7 15.9 15.4 15.7 15.5 15.9 15.9 16.0
Peligre PAP EDH 0.0 0.0 0.0 0.0 0.0 0.0 0.0 0.0 0.0 0.0 0.0 0.0 0.0 0.0 0.0 0.0 0.0 0.0 0.0 0.0Varreau PAP Sogener IPPs 6.6 6.9 7.4 8.2 8.6 9.9 10.5 11.0 11.4 12.0 12.0 12.7 12.8 13.0 12.5 12.8 12.7 13.0 13.0 13.1
Carrefour PAP IPP 3.3 3.5 3.7 4.1 4.3 4.9 5.3 5.5 5.7 6.0 6.0 6.4 6.4 6.5 6.3 6.4 6.3 6.5 6.5 6.5Thermal in Provinces 11.9 12.5 13.4 14.8 15.5 17.8 18.9 19.7 20.6 21.6 21.7 22.9 23.1 23.4 22.6 23.1 22.8 23.4 23.3 23.6
Hydro in Provinces 0.4 0.4 0.4 0.4 0.4 0.4 0.4 0.4 0.4 0.4 0.4 0.4 0.4 0.4 0.4 0.4 0.4 0.4 0.4 0.4E-Power 10.7 11.2 12.1 13.4 14.1 16.1 17.2 17.9 18.7 19.6 19.7 20.8 21.0 21.3 20.6 21.0 20.8 21.3 21.2 21.5
Gov of Brazil 1.2 1.2 1.2 1.2 1.2 1.2 1.2 1.2 1.2 1.2 1.2 1.2 1.2 1.2 1.2 1.2 1.2 1.2 1.2 1.220 MW LSD 28.5 37.4 48.4 62.5 75.1 86.1 103.0 119.7 137.2 157.0 183.9 208.2 224.1 241.4 260.3 280.4 304.7 326.4 354.0 386.3
Wind 0.0 0.0 0.1 0.3 0.4 0.6 0.7 0.9 1.0 1.1 1.3 1.4 1.6 1.7 1.8 2.0 2.1 2.3 2.4 2.6Production Cost (million $) 82 94 109 129 145 166 188 209 230 254 282 312 329 347 363 385 409 433 460 494
Investment Costs (million $) 38.4 9.6 15.23 15.23 15.23 5.625 15.23 15.23 15.23 15.23 24.83 15.23 15.23 15.23 24.83 15.23 24.83 15.23 24.83 24.83
Total System Costs (million $) 120 103 124 144 161 172 203 224 245 270 307 327 344 363 388 401 433 448 485 519

Caribbean Regional Electricity Generation, Interconnection, and Fuels Supply Strategy – Final Report A-85
Table A-86 Jamaica Interconnection/Renewable Scenario Capacity Balance Year 2009 2010 2011 2012 2013 2014 2015 2016 2017 2018 2019 2020 2021 2022 2023 2024 2025 2026 2027 2028
Peak Load (MW) 680 707 736 767 799 832 867 904 943 983 1,026 1,071 1,116 1,165 1,214 1,267 1,322 1,379 1,439 1,502Exports(+)/Imports(-) (MW)
Existing Capacity (MW)Old Harbour 29 29 29 29 29 0 0 0 0 0 0 0 0 0 0 0 0 0 0 0Old Harbour 57 57 57 57 57 57 57 57 57 57 57 57 57 0 0 0 0 0 0 0Old Harbour 62 62 62 62 62 62 62 62 62 62 62 62 62 62 62 0 0 0 0 0Old Harbour 65 65 65 65 65 65 65 65 65 65 65 65 65 65 65 65 65 65 65 65
Hunts Bay 65 65 65 65 65 65 65 65 65 65 65 65 65 65 65 65 65 0 0 0Hunts Bay 21 21 21 21 21 21 21 21 21 21 21 21 21 21 21 21 21 21 21 21Hunts Bay 0 0 0 0 0 0 0 0 0 0 0 0 0 0 0 0 0 0 0 0
Rockfort 35 35 35 35 35 35 35 35 35 35 35 0 0 0 0 0 0 0 0 0Bogue 21 21 21 21 21 21 21 21 21 21 21 21 21 21 21 21 21 21 21 21Bogue 42 42 42 42 42 42 42 42 42 42 42 42 42 42 42 42 42 42 42 42Bogue 40 40 40 40 40 40 40 40 40 40 40 40 40 40 40 40 40 40 40 40Bogue 111 111 111 111 111 111 111 111 111 111 111 111 111 111 111 111 111 111 111 111
JEP Barge 1 74 74 74 74 74 74 74 74 74 74 74 74 74 74 74 74 74 74 74 74JEP Barge 2 50 50 50 50 50 50 50 50 50 50 50 50 50 50 50 50 50 50 50 50
JPPC Owned 60 60 60 60 60 60 60 60 60 60 60 60 60 60 60 60 60 60 60 60Jamalco 11 11 11 11 11 11 11 11 11 11 11 11 11 11 11 11 11 11 11 11Wigton 20 20 20 20 20 20 20 20 20 20 20 20 20 20 20 20 20 20 20 20Hydro 20 20 20 20 20 20 20 20 20 20 20 20 20 20 20 20 20 20 20 20
Total Existing (MW) 782 782 782 782 782 753 753 753 753 753 753 719 719 662 662 600 600 535 535 535
Required Capacity (MW) 850 884 921 959 998 1,039 1,083 1,130 1,179 1,229 1,282 1,338 1,396 1,456 1,518 1,583 1,652 1,724 1,799 1,877Existing System Surplus(+)/Deficit(-) (MW) -68 -103 -139 -177 -217 -286 -330 -377 -426 -476 -529 -620 -677 -795 -857 -984 -1,053 -1,190 -1,265 -1,343
New Capacity (MW)Kingston 68 68 68 68 68 68 68 68 68 68 68 68 68 68 68 68 68 68 68 68
Hunts Bay Petcoke 0 0 0 120 120 120 120 120 120 120 120 120 120 120 120 120 120 120 120 120Windalco 0 0 0 0 0 60 60 60 60 60 60 60 60 60 60 60 60 60 60 60Jamalco 0 85 85 85 85 85 85 85 85 85 85 85 85 85 85 85 85 85 85 85Wigton 0 6 12 18 18 18 18 18 18 18 18 18 18 18 18 18 18 18 18 18
50 MW GT 0 0 0 0 0 0 0 0 0 0 0 0 0 0 0 0 0 0 0 0100 MW CC 0 0 0 0 0 0 0 0 0 0 0 0 0 0 0 0 0 0 0 0
50 MW GT 0 0 0 0 0 0 0 0 0 0 0 0 0 0 0 0 0 0 0 0100 MW ConvCoal 0 0 0 0 0 0 100 200 200 300 300 400 500 600 600 800 800 1,000 1,000 1,100
Wind 0 0 15 27 39 51 63 75 87 99 111 123 135 147 159 171 183 195 207 219
Total Capacity (MW) 850 935 935 1,055 1,055 1,087 1,187 1,287 1,287 1,387 1,387 1,452 1,552 1,595 1,595 1,733 1,733 1,868 1,868 1,968
System Surplus(+)/Deficit(-) with Unit Additions (MW) 1 51 15 97 57 47 103 156 108 157 104 114 156 139 77 150 81 144 69 91
Reserve Margin (%) 25% 32% 27% 38% 32% 30.7% 36.9% 42.3% 36.4% 41.0% 35.2% 35.6% 39.0% 36.9% 31.3% 36.8% 31.1% 35.4% 29.8% 31.0%

Caribbean Regional Electricity Generation, Interconnection, and Fuels Supply Strategy – Final Report A-86
Table A-87 Jamaica Interconnection/Renewable Scenario Energy Balance
Year 2009 2010 2011 2012 2013 2014 2015 2016 2017 2018 2019 2020 2021 2022 2023 2024 2025 2026 2027 2028
Energy (GWh) 4,490 4,674 4,865 5,066 5,277 5,494 5,726 5,974 6,232 6,497 6,777 7,073 7,376 7,696 8,024 8,370 8,734 9,114 9,510 9,924
Exports(+)/Imports(-) (GWh)
Generation (GWh)
Old Harbour 153 123 125 126 132 0 0 0 0 0 0 0 0 0 0 0 0 0 0 0
Old Harbour 305 245 250 252 262 256 241 226 236 223 232 224 215 0 0 0 0 0 0 0
Old Harbour 331 266 271 273 284 278 261 245 255 242 252 243 234 234 244 0 0 0 0 0
Old Harbour 349 280 286 287 300 293 275 258 269 255 265 256 246 247 257 242 252 241 252 247
Hunts Bay 349 280 286 287 300 293 275 258 269 255 265 256 246 247 257 242 252 0 0 0
Hunts Bay 62 78 81 116 120 118 111 105 109 103 108 105 101 101 105 100 104 100 104 103
Hunts Bay 0 0 0 0 0 0 0 0 0 0 0 0 0 0 0 0 0 0 0 0
Rockfort 237 192 197 128 132 127 117 110 114 108 112 0 0 0 0 0 0 0 0 0
Bogue 63 80 83 114 118 116 109 103 107 101 106 103 99 99 103 98 102 98 102 101
Bogue 99 126 131 233 241 238 226 212 221 209 219 213 204 205 214 203 212 203 213 210
Bogue 127 161 167 202 209 205 193 181 189 179 186 181 173 174 182 172 179 172 179 177
Bogue 526 668 694 470 485 465 431 404 420 397 412 400 383 383 399 374 389 371 385 377
JEP Barge 1 562 458 468 266 275 262 241 226 235 222 230 222 213 212 221 206 214 204 211 206
JEP Barge 2 379 308 316 179 185 176 162 152 158 149 155 150 143 143 149 139 144 137 142 139
JPPC Owned 468 382 390 217 223 212 195 183 190 180 186 180 172 172 179 167 173 165 171 166
Jamalco 15 15 15 15 15 15 15 15 15 15 15 15 15 15 15 15 15 15 15 15
Wigton 48 48 48 48 48 48 48 48 48 48 48 48 48 48 48 48 48 48 48 48
Hydro 70 70 70 70 70 70 70 70 70 70 70 70 70 70 70 70 70 70 70 70
Kingston 348 441 458 258 266 253 233 218 226 214 222 214 205 205 213 199 207 197 204 199
Hunts Bay Petcoke 0 0 0 1005 1048 961 859 793 816 763 791 765 728 714 739 684 711 667 695 684
Windalco 0 0 0 0 0 522 476 448 467 443 462 450 432 429 447 416 434 409 428 421
Jamalco 0 436 453 392 405 393 367 345 359 340 354 343 329 330 343 323 337 322 336 330
Wigton 0 17 34 50 50 50 50 50 50 50 50 50 50 50 50 50 50 50 50 50
50 MW GT 0 0 0 0 0 0 0 0 0 0 0 0 0 0 0 0 0 0 0 0
100 MW CC 0 0 0 0 0 0 0 0 0 0 0 0 0 0 0 0 0 0 0 0
50 MW GT 0 0 0 0 0 0 0 0 0 0 0 0 0 0 0 0 0 0 0 0
100 MW ConvCoal 0 0 0 0 0 0 594 1116 1164 1655 1727 2241 2692 3205 3341 4143 4326 5097 5323 5766
Wind 0 0 42 76 109 143 177 210 244 278 311 345 378 412 446 479 513 547 580 614
Total Generation (GWh) 4490 4674 4865 5066 5277 5494 5726 5974 6232 6497 6777 7073 7376 7696 8024 8370 8734 9114 9510 9924
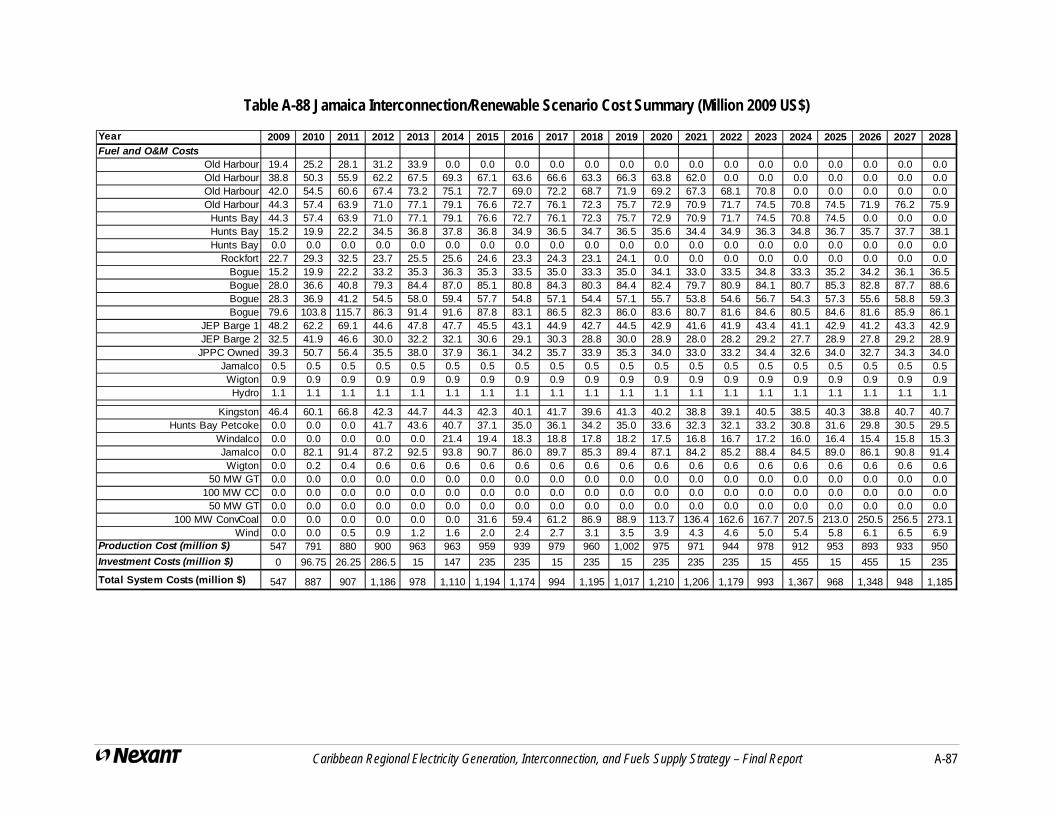
Caribbean Regional Electricity Generation, Interconnection, and Fuels Supply Strategy – Final Report A-87
Table A-88 Jamaica Interconnection/Renewable Scenario Cost Summary (Million 2009 US$)
Year 2009 2010 2011 2012 2013 2014 2015 2016 2017 2018 2019 2020 2021 2022 2023 2024 2025 2026 2027 2028Fuel and O&M Costs
Old Harbour 19.4 25.2 28.1 31.2 33.9 0.0 0.0 0.0 0.0 0.0 0.0 0.0 0.0 0.0 0.0 0.0 0.0 0.0 0.0 0.0Old Harbour 38.8 50.3 55.9 62.2 67.5 69.3 67.1 63.6 66.6 63.3 66.3 63.8 62.0 0.0 0.0 0.0 0.0 0.0 0.0 0.0Old Harbour 42.0 54.5 60.6 67.4 73.2 75.1 72.7 69.0 72.2 68.7 71.9 69.2 67.3 68.1 70.8 0.0 0.0 0.0 0.0 0.0Old Harbour 44.3 57.4 63.9 71.0 77.1 79.1 76.6 72.7 76.1 72.3 75.7 72.9 70.9 71.7 74.5 70.8 74.5 71.9 76.2 75.9
Hunts Bay 44.3 57.4 63.9 71.0 77.1 79.1 76.6 72.7 76.1 72.3 75.7 72.9 70.9 71.7 74.5 70.8 74.5 0.0 0.0 0.0Hunts Bay 15.2 19.9 22.2 34.5 36.8 37.8 36.8 34.9 36.5 34.7 36.5 35.6 34.4 34.9 36.3 34.8 36.7 35.7 37.7 38.1Hunts Bay 0.0 0.0 0.0 0.0 0.0 0.0 0.0 0.0 0.0 0.0 0.0 0.0 0.0 0.0 0.0 0.0 0.0 0.0 0.0 0.0
Rockfort 22.7 29.3 32.5 23.7 25.5 25.6 24.6 23.3 24.3 23.1 24.1 0.0 0.0 0.0 0.0 0.0 0.0 0.0 0.0 0.0Bogue 15.2 19.9 22.2 33.2 35.3 36.3 35.3 33.5 35.0 33.3 35.0 34.1 33.0 33.5 34.8 33.3 35.2 34.2 36.1 36.5Bogue 28.0 36.6 40.8 79.3 84.4 87.0 85.1 80.8 84.3 80.3 84.4 82.4 79.7 80.9 84.1 80.7 85.3 82.8 87.7 88.6Bogue 28.3 36.9 41.2 54.5 58.0 59.4 57.7 54.8 57.1 54.4 57.1 55.7 53.8 54.6 56.7 54.3 57.3 55.6 58.8 59.3Bogue 79.6 103.8 115.7 86.3 91.4 91.6 87.8 83.1 86.5 82.3 86.0 83.6 80.7 81.6 84.6 80.5 84.6 81.6 85.9 86.1
JEP Barge 1 48.2 62.2 69.1 44.6 47.8 47.7 45.5 43.1 44.9 42.7 44.5 42.9 41.6 41.9 43.4 41.1 42.9 41.2 43.3 42.9JEP Barge 2 32.5 41.9 46.6 30.0 32.2 32.1 30.6 29.1 30.3 28.8 30.0 28.9 28.0 28.2 29.2 27.7 28.9 27.8 29.2 28.9
JPPC Owned 39.3 50.7 56.4 35.5 38.0 37.9 36.1 34.2 35.7 33.9 35.3 34.0 33.0 33.2 34.4 32.6 34.0 32.7 34.3 34.0Jamalco 0.5 0.5 0.5 0.5 0.5 0.5 0.5 0.5 0.5 0.5 0.5 0.5 0.5 0.5 0.5 0.5 0.5 0.5 0.5 0.5Wigton 0.9 0.9 0.9 0.9 0.9 0.9 0.9 0.9 0.9 0.9 0.9 0.9 0.9 0.9 0.9 0.9 0.9 0.9 0.9 0.9Hydro 1.1 1.1 1.1 1.1 1.1 1.1 1.1 1.1 1.1 1.1 1.1 1.1 1.1 1.1 1.1 1.1 1.1 1.1 1.1 1.1
Kingston 46.4 60.1 66.8 42.3 44.7 44.3 42.3 40.1 41.7 39.6 41.3 40.2 38.8 39.1 40.5 38.5 40.3 38.8 40.7 40.7Hunts Bay Petcoke 0.0 0.0 0.0 41.7 43.6 40.7 37.1 35.0 36.1 34.2 35.0 33.6 32.3 32.1 33.2 30.8 31.6 29.8 30.5 29.5
Windalco 0.0 0.0 0.0 0.0 0.0 21.4 19.4 18.3 18.8 17.8 18.2 17.5 16.8 16.7 17.2 16.0 16.4 15.4 15.8 15.3Jamalco 0.0 82.1 91.4 87.2 92.5 93.8 90.7 86.0 89.7 85.3 89.4 87.1 84.2 85.2 88.4 84.5 89.0 86.1 90.8 91.4Wigton 0.0 0.2 0.4 0.6 0.6 0.6 0.6 0.6 0.6 0.6 0.6 0.6 0.6 0.6 0.6 0.6 0.6 0.6 0.6 0.6
50 MW GT 0.0 0.0 0.0 0.0 0.0 0.0 0.0 0.0 0.0 0.0 0.0 0.0 0.0 0.0 0.0 0.0 0.0 0.0 0.0 0.0100 MW CC 0.0 0.0 0.0 0.0 0.0 0.0 0.0 0.0 0.0 0.0 0.0 0.0 0.0 0.0 0.0 0.0 0.0 0.0 0.0 0.0
50 MW GT 0.0 0.0 0.0 0.0 0.0 0.0 0.0 0.0 0.0 0.0 0.0 0.0 0.0 0.0 0.0 0.0 0.0 0.0 0.0 0.0100 MW ConvCoal 0.0 0.0 0.0 0.0 0.0 0.0 31.6 59.4 61.2 86.9 88.9 113.7 136.4 162.6 167.7 207.5 213.0 250.5 256.5 273.1
Wind 0.0 0.0 0.5 0.9 1.2 1.6 2.0 2.4 2.7 3.1 3.5 3.9 4.3 4.6 5.0 5.4 5.8 6.1 6.5 6.9Production Cost (million $) 547 791 880 900 963 963 959 939 979 960 1,002 975 971 944 978 912 953 893 933 950
Investment Costs (million $) 0 96.75 26.25 286.5 15 147 235 235 15 235 15 235 235 235 15 455 15 455 15 235
Total System Costs (million $) 547 887 907 1,186 978 1,110 1,194 1,174 994 1,195 1,017 1,210 1,206 1,179 993 1,367 968 1,348 948 1,185

Caribbean Regional Electricity Generation, Interconnection, and Fuels Supply Strategy – Final Report A-88
Table A-89 St. Kitts Interconnection/Renewable Scenario Capacity Balance
Year 2009 2010 2011 2012 2013 2014 2015 2016 2017 2018 2019 2020 2021 2022 2023 2024 2025 2026 2027 2028
Peak Load (MW) 29 30 31 32 33 35 36 37 38 40 41 43 44 46 47 49 51 52 54 56Exports(+)/Imports(-) (MW) -10 -10 -10 -10 -10 -10 -10 -29 -29 -29 -29 -29 -29 -29 -29 -29 -29 -29
Existing Capacity (MW)Station A 6 6 6 6 6 6 6 6 6 6 6 6 6 6 6 6 6 6 6 6Station A 8 8 8 8 8 8 8 8 8 8 8 8 8 8 8 8 8 8 8 8Station B 9 9 9 9 9 9 9 9 9 9 9 9 9 9 9 9 9 9 9 9Station C 7 7 7 7 7 7 7 7 7 7 7 7 7 7 7 7 7 7 7 7Station C 4 4 4 4 4 4 4 4 4 4 4 4 4 4 4 4 4 4 4 4
New Units 8 8 8 8 8 8 8 8 8 8 8 8 8 8 8 8 8 8 8 8
Total Existing (MW) 42 42 42 42 42 42 42 42 42 42 42 42 42 42 42 42 42 42 42 42
Required Capacity (MW) 39 41 32 34 35 37 39 40 42 25 26 28 30 33 35 37 39 42 44 47Existing System Surplus(+)/Deficit(-) (MW) 2 1 9 8 6 5 3 1 -1 17 15 13 11 9 7 5 2 0 -3 -5
New Capacity (MW)5 MW MSD 0 0 0 0 0 0 0 0 0 0 0 0 0 0 0 0 0 0 5 5
Wind 0 0 0 0 0 0 0 0 0 0 0 0 0 0 0 0 0 0 0 0
Total Capacity (MW) 42 42 42 42 42 42 42 42 42 42 42 42 42 42 42 42 42 42 47 47
System Surplus(+)/Deficit(-) with Unit Additions (MW) 2 1 9 8 6 5 3 1 -1 17 15 13 11 9 7 5 2 0 2 0
Reserve Margin (%) 43% 38% 94% 84% 75% 67.0% 59.2% 51.8% 44.9% 288.0% 243.0% 206.3% 175.7% 149.9% 127.8% 108.7% 92.0% 77.3% 84.1% 71.2%

Caribbean Regional Electricity Generation, Interconnection, and Fuels Supply Strategy – Final Report A-89
Table A-90 St. Kitts Interconnection/Renewable Scenario Energy Balance
Year 2009 2010 2011 2012 2013 2014 2015 2016 2017 2018 2019 2020 2021 2022 2023 2024 2025 2026 2027 2028
Energy (GWh) 161 166 171 175 180 186 191 196 202 208 214 220 226 233 239 246 253 261 268 276
Exports(+)/Imports(-) (GWh) -68 -68 -68 -68 -68 -68 -68 -203 -203 -203 -203 -203 -203 -203 -203 -203 -203 -203
Generation (GWh)
Station A 24 25 16 16 17 18 19 19 20 1 2 3 4 5 6 7 8 9 9 10
Station A 32 32 20 21 22 23 24 25 26 1 2 3 5 6 7 9 10 11 11 13
Station B 33 34 21 22 23 24 25 26 28 1 2 4 5 6 8 9 10 12 12 13
Station C 27 28 17 18 19 20 21 22 23 1 2 3 4 5 6 7 8 10 10 11
Station C 13 14 8 9 9 10 10 11 11 0 1 1 2 2 3 4 4 5 5 5
New Units 32 33 20 21 22 23 24 26 27 1 2 3 5 6 7 9 10 11 11 13
5 MW MSD 0 0 0 0 0 0 0 0 0 0 0 0 0 0 0 0 0 0 7 8
Wind 0 0 0 0 0 0 0 0 0 0 0 0 0 0 0 0 0 0 0 0
Total Generation (GWh) 161 166 103 108 113 118 123 129 134 5 11 17 23 30 37 43 51 58 65 73
Table A-91 St. Kitts Interconnection/Renewable Scenario Cost Summary (Million 2009 US$)
Year 2009 2010 2011 2012 2013 2014 2015 2016 2017 2018 2019 2020 2021 2022 2023 2024 2025 2026 2027 2028Fuel and O&M Costs
Station A 3.4 3.6 2.5 2.8 3.0 3.3 3.5 3.7 3.9 0.4 0.5 0.7 0.9 1.1 1.2 1.4 1.7 1.9 1.9 2.2Station A 4.4 4.7 3.2 3.7 3.9 4.3 4.6 4.8 5.0 0.5 0.7 0.9 1.1 1.4 1.6 1.9 2.2 2.4 2.5 2.8Station B 4.9 5.2 3.6 4.1 4.4 4.7 5.1 5.4 5.6 0.5 0.7 1.0 1.2 1.5 1.8 2.1 2.4 2.7 2.8 3.1Station C 4.0 4.3 2.9 3.3 3.6 3.9 4.2 4.4 4.6 0.4 0.6 0.8 1.0 1.2 1.5 1.7 2.0 2.2 2.3 2.6Station C 2.0 2.1 1.4 1.6 1.7 1.9 2.0 2.1 2.2 0.2 0.3 0.4 0.5 0.6 0.7 0.8 1.0 1.1 1.1 1.2
5 MW MSD 0.0 0.0 0.0 0.0 0.0 0.0 0.0 0.0 0.0 0.0 0.0 0.0 0.0 0.0 0.0 0.0 0.0 0.0 1.6 1.8Wind 0.0 0.0 0.0 0.0 0.0 0.0 0.0 0.0 0.0 0.0 0.0 0.0 0.0 0.0 0.0 0.0 0.0 0.0 0.0 0.0
Production Cost (million $) 23 25 17 19 21 22 24 25 26 2 4 5 6 7 8 10 11 13 15 16
Investment Costs (million $) 0 0 0 0 0 0 0 0 0 0 0 0 0 0 0 0 0 0 2.25 0
Total System Costs (million $) 23 25 17 19 21 22 24 25 26 2 4 5 6 7 8 10 11 13 17 16

Caribbean Regional Electricity Generation, Interconnection, and Fuels Supply Strategy – Final Report A-90
Table A-92 Nevis Interconnection/Renewable Scenario Capacity Balance
Year 2009 2010 2011 2012 2013 2014 2015 2016 2017 2018 2019 2020 2021 2022 2023 2024 2025 2026 2027 2028
Peak Load (MW) 10 10 11 11 12 13 13 14 15 16 17 18 19 20 21 23 24 25 27 29Exports(+)/Imports(-) (MW) 10 10 10 410 410 410 410 430 430 430 430 430 430 430 430 430 430 430
Existing Capacity (MW)#2 & #3 2 2 2 2 2 2 2 2 2 2 2 2 2 2 2 2 2 2 2 2
#4, #6 4 4 4 4 4 4 4 4 4 4 4 4 4 4 4 4 4 4 4 4#5, #7 5 5 5 5 5 5 5 5 5 5 5 5 5 5 5 5 5 5 5 5
#8 3 3 3 3 3 3 3 3 3 3 3 3 3 3 3 3 3 3 3 3
Total Existing (MW) 14 14 14 14 14 14 14 14 14 14 14 14 14 14 14 14 14 14 14 14
Required Capacity (MW) 13 14 24 25 26 427 428 429 430 451 452 453 455 456 458 459 461 463 465 467Existing System Surplus(+)/Deficit(-) (MW) 1 0 -11 -11 -12 -413 -414 -415 -416 -437 -438 -439 -441 -442 -444 -446 -447 -449 -451 -453
New Capacity (MW)5 MW MSD 0 0 0 0 0 0 0 0 0 0 0 0 5 5 5 10 10 10 15 15Geo 20 MW 0 0 20 20 20 20 20 20 20 40 40 40 40 40 40 40 40 40 40 40
Geo 100 MW 0 0 0 0 0 400 400 400 400 400 400 400 400 400 400 400 400 400 400 400Wind 0 0 0 0 0 0 0 0 0 0 0 0 0 0 0 0 0 0 0 0
Total Capacity (MW) 14 14 34 34 34 434 434 434 434 454 454 454 459 459 459 464 464 464 469 469
System Surplus(+)/Deficit(-) with Unit Additions (MW) 1 0 9 9 8 7 6 5 4 3 2 1 4 3 1 4 3 1 4 2
Reserve Margin (%) 46% 38% 64% 59% 54% 2.7% 2.5% 2.3% 2.1% 1.8% 1.6% 1.3% 2.2% 1.9% 1.7% 2.5% 2.2% 1.9% 2.6% 2.3%

Caribbean Regional Electricity Generation, Interconnection, and Fuels Supply Strategy – Final Report A-91
Table A-93 Nevis Interconnection/Renewable Scenario Energy Balance
Year 2009 2010 2011 2012 2013 2014 2015 2016 2017 2018 2019 2020 2021 2022 2023 2024 2025 2026 2027 2028
Energy (GWh) 60 67 74 82 86 90 94 99 103 107 111 115 119 124 129 134 139 145 150 156
Exports(+)/Imports(-) (GWh) 70 70 70 2,873 2,873 2,873 2,873 3,013 3,013 3,013 3,013 3,013 3,013 3,013 3,013 3,013 3,013 3,013
Generation (GWh)
#2 & #3 8 9 1 2 2 3 3 4 4 5 5 6 4 5 5 4 5 5 5 5
#4, #6 19 21 1 4 5 6 8 9 10 12 13 14 11 12 13 11 12 13 11 12
#5, #7 22 24 1 4 6 7 9 10 12 13 15 16 13 14 15 13 14 15 13 14
#8 12 13 1 2 3 4 5 6 6 7 8 9 7 7 8 7 7 8 7 7
5 MW MSD 0 0 0 0 0 0 0 0 0 0 0 0 15 16 17 29 31 34 45 48
Geo 20 MW 0 0 140 140 140 140 140 140 140 280 280 280 280 280 280 280 280 280 280 280
Geo 100 MW 0 0 0 0 0 2803 2803 2803 2803 2803 2803 2803 2803 2803 2803 2803 2803 2803 2803 2803
Wind 0 0 0 0 0 0 0 0 0 0 0 0 0 0 0 0 0 0 0 0
Total Generation (GWh) 60 67 144 153 156 2963 2968 2972 2976 3120 3124 3128 3133 3138 3142 3147 3153 3158 3164 3170
Table A-94 Nevis Interconnection/Renewable Scenario Cost Summary (Million 2009 US$)
Year 2009 2010 2011 2012 2013 2014 2015 2016 2017 2018 2019 2020 2021 2022 2023 2024 2025 2026 2027 2028Fuel and O&M Costs
#2 & #3 1.2 1.4 0.2 0.4 0.5 0.6 0.7 0.8 0.9 1.0 1.2 1.3 1.0 1.1 1.2 1.0 1.1 1.2 1.1 1.2#4, #6 3.0 3.4 0.4 0.9 1.1 1.4 1.7 2.0 2.2 2.5 2.8 3.0 2.4 2.6 2.9 2.5 2.7 2.9 2.6 2.8#5, #7 3.4 3.8 0.4 1.0 1.3 1.6 1.9 2.2 2.5 2.8 3.1 3.5 2.7 3.0 3.3 2.8 3.0 3.3 2.9 3.2
#8 1.8 2.1 0.2 0.5 0.7 0.9 1.0 1.2 1.4 1.5 1.7 1.9 1.5 1.6 1.8 1.5 1.6 1.8 1.6 1.75 MW MSD 0.0 0.0 0.0 0.0 0.0 0.0 0.0 0.0 0.0 0.0 0.0 0.0 2.8 3.1 3.4 5.8 6.3 6.8 9.2 10.0Geo 20 MW 0.0 0.0 1.8 1.8 1.8 1.8 1.8 1.8 1.8 3.6 3.6 3.6 3.6 3.6 3.6 3.6 3.6 3.6 3.6 3.6
Geo 100 MW 0.0 0.0 0.0 0.0 0.0 34.4 34.4 34.4 34.4 34.4 34.4 34.4 34.4 34.4 34.4 34.4 34.4 34.4 34.4 34.4Wind 0.0 0.0 0.0 0.0 0.0 0.0 0.0 0.0 0.0 0.0 0.0 0.0 0.0 0.0 0.0 0.0 0.0 0.0 0.0 0.0
Production Cost (million $) 9 11 3 5 5 41 42 42 43 46 47 48 49 50 50 52 53 54 55 57
Investment Costs (million $) 0 0 56 0 0 1042 0 0 0 56 0 0 2.25 0 0 2.25 0 0 2.25 0
Total System Costs (million $) 9 11 59 5 5 1,082 42 42 43 102 47 48 51 50 50 54 53 54 58 57

Caribbean Regional Electricity Generation, Interconnection, and Fuels Supply Strategy – Final Report A-92
Table A-95 St. Lucia Interconnection/Renewable Scenario Capacity Balance
Year 2009 2010 2011 2012 2013 2014 2015 2016 2017 2018 2019 2020 2021 2022 2023 2024 2025 2026 2027 2028
Peak Load (MW) 56 58 61 63 65 68 70 73 76 79 82 85 88 91 95 98 102 106 110 114Exports(+)/Imports(-) (MW)
Existing Capacity (MW)Cul de Sac 12 12 12 12 12 12 12 12 12 12 12 12 12 12 12 12 12 12 12 12Cul de Sac 6 6 6 6 6 6 6 6 6 6 6 6 6 6 6 6 6 6 6 6Cul de Sac 37 37 37 37 37 37 37 37 37 37 37 37 37 37 37 37 37 37 37 37Cul de Sac 21 21 21 21 21 21 21 21 21 21 21 21 21 21 21 21 21 21 21 21
Rooftop solar 0.1 0.1 0.1 0.1 0.1 0.1 0.1 0.1 0.1 0.1 0.1 0.1 0.1 0.1 0.1 0.1 0.1 0.1 0.1 0.1
Total Existing (MW) 76 76 76 76 76 76 76 76 76 76 76 76 76 76 76 76 76 76 76 76
Required Capacity (MW) 76 79 82 85 88 91 95 98 102 106 110 114 119 123 128 133 138 143 148 154Existing System Surplus(+)/Deficit(-) (MW) 0 -2 -5 -9 -12 -15 -19 -22 -26 -30 -34 -38 -42 -47 -52 -56 -62 -67 -72 -78
New Capacity (MW)20 MW LSD 0 20 20 20 20 20 20 40 40 40 40 40 60 60 60 60 80 80 80 8020 MW LSD 0 0 0 0 0 0 0 0 0 0 0 0 0 0 0 0 0 0 0 0
Wind 0 0 0 2 3 5 6 8 9 9 11 12 12 14 14 15 15 17 17 18
Total Capacity (MW) 76 96 96 96 96 96 96 116 116 116 116 116 136 136 136 136 156 156 156 156
System Surplus(+)/Deficit(-) with Unit Additions (MW) 0 18 15 11 8 5 1 18 14 10 6 2 18 13 8 4 18 13 8 2
Reserve Margin (%) 35.7% 65.0% 59.0% 53.2% 47.6% 42.2% 36.9% 59.4% 53.5% 47.9% 42.5% 37.3% 55.0% 49.3% 43.9% 38.6% 53.1% 47.5% 42.1% 36.9%

Caribbean Regional Electricity Generation, Interconnection, and Fuels Supply Strategy – Final Report A-93
Table A-96 St. Lucia Interconnection/Renewable Scenario Energy Balance
Year 2009 2010 2011 2012 2013 2014 2015 2016 2017 2018 2019 2020 2021 2022 2023 2024 2025 2026 2027 2028
Energy (GWh) 345 356 367 378 390 402 415 428 442 455 470 484 500 515 531 548 565 583 601 620
Exports(+)/Imports(-) (GWh)
Generation (GWh)
Cul de Sac 53 42 43 44 45 46 47 39 40 41 42 43 37 38 39 40 36 37 38 39
Cul de Sac 28 22 23 23 24 24 25 20 21 22 22 23 20 20 21 21 19 19 20 21
Cul de Sac 169 133 137 140 143 146 149 123 126 130 133 136 118 121 125 128 114 117 121 124
Cul de Sac 94 74 76 78 79 81 83 68 70 72 74 75 65 67 69 71 63 65 67 69
Rooftop solar 0.1 0.1 0.1 0.1 0.1 0.1 0.1 0.1 0.1 0.1 0.1 0.1 0.1 0.1 0.1 0.1 0.1 0.1 0.1 0.1
20 MW LSD 0 85 87 89 91 93 95 157 160 165 169 173 225 231 239 245 291 298 308 316
20 MW LSD 0 0 0 0 0 0 0 0 0 0 0 0 0 0 0 0 0 0 0 0
Wind 0 0 0 4 8 13 17 21 25 25 29 34 34 38 38 42 42 46 46 50
Total Generation (GWh) 345 356 367 378 390 402 415 428 442 455 470 484 500 515 531 548 565 583 601 620
Table A-97 St. Lucia Interconnection/Renewable Scenario Cost Summary (Million 2009 US$)
Year 2009 2010 2011 2012 2013 2014 2015 2016 2017 2018 2019 2020 2021 2022 2023 2024 2025 2026 2027 2028Fuel and O&M Costs
Cul de Sac 8.0 6.5 7.2 8.0 8.4 8.9 9.4 7.9 8.1 8.4 8.6 8.8 7.8 8.0 8.3 8.6 7.8 8.0 8.4 8.8Cul de Sac 4.2 3.4 3.8 4.2 4.4 4.7 4.9 4.1 4.2 4.4 4.5 4.6 4.1 4.2 4.3 4.5 4.1 4.2 4.4 4.6Cul de Sac 24.7 20.3 22.3 24.8 26.0 27.7 29.1 24.5 25.1 26.0 26.7 27.4 24.1 24.9 25.6 26.6 24.1 24.9 26.1 27.3Cul de Sac 13.7 11.2 12.4 13.8 14.4 15.3 16.1 13.6 13.9 14.4 14.8 15.2 13.4 13.8 14.2 14.7 13.3 13.8 14.4 15.1
Rooftop solar 0.0 0.0 0.0 0.0 0.0 0.0 0.0 0.0 0.0 0.0 0.0 0.0 0.0 0.0 0.0 0.0 0.0 0.0 0.0 0.020 MW LSD 0.0 11.4 12.5 13.9 14.6 15.5 16.3 27.5 28.1 29.1 30.0 30.8 40.6 41.9 43.1 44.8 54.0 55.9 58.5 61.320 MW LSD 0.0 0.0 0.0 0.0 0.0 0.0 0.0 0.0 0.0 0.0 0.0 0.0 0.0 0.0 0.0 0.0 0.0 0.0 0.0 0.0
Wind 0.0 0.0 0.0 0.0 0.1 0.1 0.2 0.2 0.3 0.3 0.3 0.4 0.4 0.4 0.4 0.5 0.5 0.5 0.5 0.6Production Cost (million $) 51 53 58 65 68 72 76 78 80 83 85 87 90 93 96 100 104 107 112 118
Investment Costs (million $) 0 9.6 0 1.875 1.875 1.875 1.875 11.48 1.875 0 1.875 1.875 9.6 1.875 0 1.875 9.6 1.875 0 1.875
Total System Costs (million $) 51 62 58 67 70 74 78 89 82 83 87 89 100 95 96 101 113 109 112 120

Caribbean Regional Electricity Generation, Interconnection, and Fuels Supply Strategy – Final Report A-94
Table A-98 St. Vincent and Grenadines Interconnection/Renewable Scenario Capacity Balance
Year 2009 2010 2011 2012 2013 2014 2015 2016 2017 2018 2019 2020 2021 2022 2023 2024 2025 2026 2027 2028
Peak Load (MW) 27 28 30 32 35 37 40 42 45 48 52 55 59 63 68 72 77 83 88 94Exports(+)/Imports(-) (MW)
Existing Capacity (MW)St. Vincent 12 12 12 12 12 12 12 12 12 12 12 12 12 12 12 12 12 12 12 12St. Vincent 3 3 3 3 3 3 3 3 3 3 3 3 3 3 3 3 3 3 3 3
Lowmans Bay 35 35 35 35 35 35 35 35 35 35 35 35 35 35 35 35 35 35 35 35Bequia 3 3 3 3 3 3 3 3 3 3 3 3 3 3 3 3 3 3 3 3
Union Island 2.5 2.5 2.5 2.5 2.5 2.5 2.5 2.5 2.5 2.5 2.5 2.5 2.5 2.5 2.5 2.5 2.5 2.5 2.5 2.5Canouan 3 3 3 3 3 3 3 3 3 3 3 3 3 3 3 3 3 3 3 3Mayreay 0 0 0 0 0 0 0 0 0 0 0 0 0 0 0 0 0 0 0 0
Total Existing (MW) 58 58 58 58 58 58 58 58 58 58 58 58 58 58 58 58 58 58 58 58
Required Capacity (MW) 36 38 41 44 47 50 53 57 61 65 70 75 80 85 91 98 104 111 119 127Existing System Surplus(+)/Deficit(-) (MW) 22 20 17 14 11 8 5 1 -3 -7 -12 -17 -22 -27 -33 -39 -46 -53 -61 -69
New Capacity (MW)10 MW MSD 0 0 0 0 0 0 0 0 10 10 20 20 30 30 40 40 50 60 70 7010 MW CFB 0 0 0 0 0 0 0 0 0 0 0 0 0 0 0 0 0 0 0 0
Wind 0 0 2 2 3 3 5 5 6 6 8 8 9 9 11 11 12 12 14 14
Total Capacity (MW) 58 58 58 58 58 58 58 58 68 68 78 78 88 88 98 98 108 118 128 128
System Surplus(+)/Deficit(-) with Unit Additions (MW) 22 20 17 14 11 8 5 1 7 3 8 3 8 3 7 1 4 7 9 1
Reserve Margin (%) 118.8% 104.7% 91.5% 79.1% 67.5% 56.7% 46.6% 37.1% 50.3% 40.6% 50.9% 41.1% 48.9% 39.3% 45.1% 35.7% 39.9% 43.0% 45.1% 35.7%

Caribbean Regional Electricity Generation, Interconnection, and Fuels Supply Strategy – Final Report A-95
Table A-99 St. Vincent and Grenadines Interconnection/Renewable Scenario Energy Balance
Year 2009 2010 2011 2012 2013 2014 2015 2016 2017 2018 2019 2020 2021 2022 2023 2024 2025 2026 2027 2028
Energy (GWh) 156 167 178 191 204 218 233 249 266 284 304 325 348 372 397 425 454 485 519 555
Exports(+)/Imports(-) (GWh)
Generation (GWh)
St. Vincent 31 33 35 37 39 42 44 48 42 46 42 45 42 45 43 46 44 43 42 46
St. Vincent 7 7 7 7 7 7 7 7 7 7 7 7 7 7 7 7 7 7 7 7
Lowmans Bay 98 105 110 118 124 133 140 151 134 144 132 142 132 142 135 145 140 137 134 144
Bequia 7 7 8 8 9 9 10 11 9 10 9 10 9 10 9 10 10 10 9 10
Union Island 6 6 6 7 7 8 8 9 8 8 8 8 8 8 8 9 8 8 8 8
Canouan 7 8 8 9 9 10 11 11 10 11 10 11 10 11 10 11 10 10 10 11
Mayreay 0 0 0 0 0 0 1 1 0 1 0 1 0 1 0 1 1 1 0 1
10 MW MSD 0 0 0 0 0 0 0 0 39 42 76 82 114 123 156 168 201 237 270 291
10 MW CFB 0 0 0 0 0 0 0 0 0 0 0 0 0 0 0 0 0 0 0 0
Wind 0 0 4 4 8 8 13 13 17 17 21 21 25 25 29 29 34 34 38 38
Total Generation (GWh) 156 167 178 191 204 218 233 249 266 284 304 325 348 372 397 425 454 485 519 555
Table A-100 St. Vincent and Grenadines Interconnection/Renewable Scenario Cost Summary (Million 2009 US$)
Year 2009 2010 2011 2012 2013 2014 2015 2016 2017 2018 2019 2020 2021 2022 2023 2024 2025 2026 2027 2028Fuel and O&M Costs
St. Vincent 4.7 5.2 5.7 6.7 7.2 8.0 8.7 9.4 8.4 9.0 8.4 9.0 8.5 9.2 8.7 9.5 9.2 9.1 9.1 9.9St. Vincent 0.2 0.2 0.2 0.2 0.2 0.2 0.2 0.2 0.2 0.2 0.2 0.2 0.2 0.2 0.2 0.2 0.2 0.2 0.2 0.2
Lowmans Bay 14.1 15.4 17.2 20.0 21.4 23.9 25.9 28.0 25.1 27.0 24.9 26.8 25.3 27.3 25.9 28.2 27.4 27.2 27.0 29.6Bequia 1.1 1.2 1.4 1.6 1.7 1.9 2.0 2.2 2.0 2.1 2.0 2.1 2.0 2.2 2.1 2.2 2.2 2.1 2.1 2.3
Union Island 1.0 1.1 1.2 1.4 1.5 1.7 1.8 1.9 1.7 1.9 1.7 1.9 1.7 1.9 1.8 1.9 1.9 1.9 1.9 2.0Canouan 1.2 1.3 1.5 1.7 1.8 2.0 2.2 2.4 2.1 2.3 2.1 2.3 2.1 2.3 2.2 2.4 2.3 2.3 2.3 2.5Mayreay 0.1 0.1 0.1 0.1 0.1 0.1 0.1 0.1 0.1 0.1 0.1 0.1 0.1 0.1 0.1 0.1 0.1 0.1 0.1 0.1
10 MW MSD 0.0 0.0 0.0 0.0 0.0 0.0 0.0 0.0 7.1 7.6 14.1 15.2 21.4 23.2 29.3 31.9 38.8 46.1 53.5 58.710 MW CFB 0.0 0.0 0.0 0.0 0.0 0.0 0.0 0.0 0.0 0.0 0.0 0.0 0.0 0.0 0.0 0.0 0.0 0.0 0.0 0.0
Wind 0.0 0.0 0.0 0.0 0.1 0.1 0.1 0.1 0.2 0.2 0.2 0.2 0.3 0.3 0.3 0.3 0.4 0.4 0.4 0.4Production Cost (million $) 22 25 27 32 34 38 41 44 47 50 54 58 62 67 71 77 83 90 97 106
Investment Costs (million $) 0 0 1.875 0 1.875 0 1.875 0 6.375 0 6.375 0 6.375 0 6.375 0 6.375 4.5 6.375 0
Total System Costs (million $) 22 25 29 32 36 38 43 44 53 50 60 58 68 67 77 77 89 94 103 106
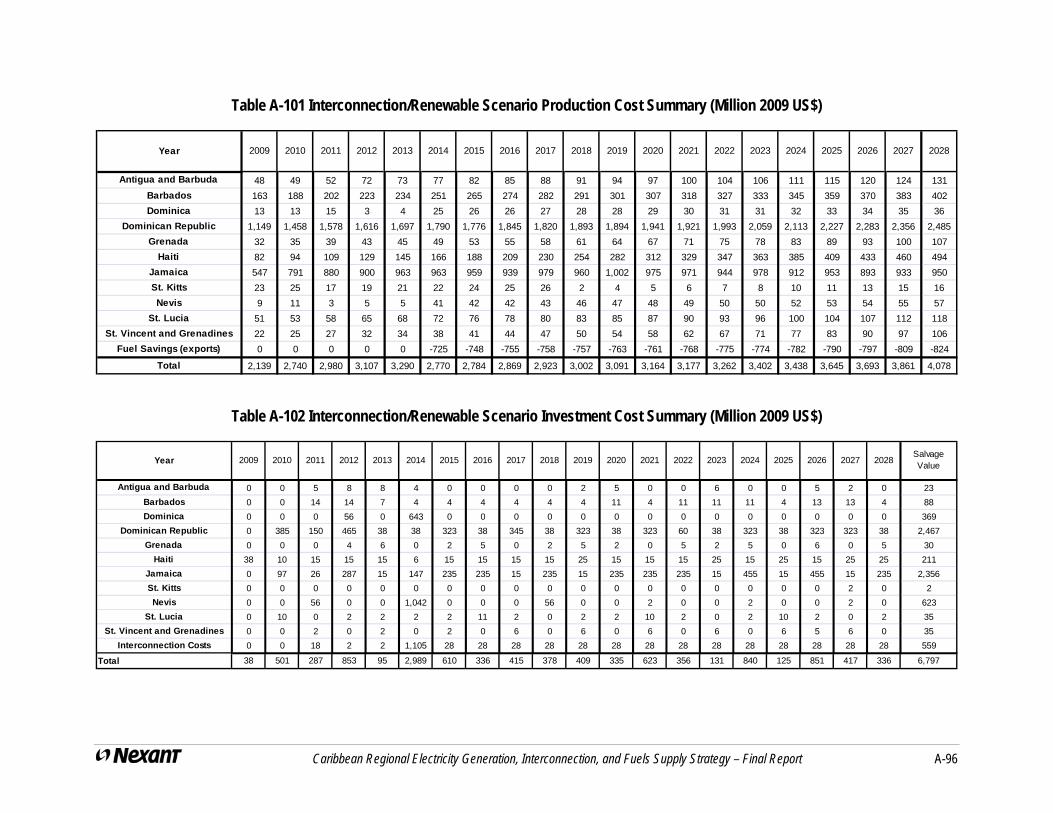
Caribbean Regional Electricity Generation, Interconnection, and Fuels Supply Strategy – Final Report A-96
Table A-101 Interconnection/Renewable Scenario Production Cost Summary (Million 2009 US$)
Year 2009 2010 2011 2012 2013 2014 2015 2016 2017 2018 2019 2020 2021 2022 2023 2024 2025 2026 2027 2028
Antigua and Barbuda 48 49 52 72 73 77 82 85 88 91 94 97 100 104 106 111 115 120 124 131
Barbados 163 188 202 223 234 251 265 274 282 291 301 307 318 327 333 345 359 370 383 402
Dominica 13 13 15 3 4 25 26 26 27 28 28 29 30 31 31 32 33 34 35 36
Dominican Republic 1,149 1,458 1,578 1,616 1,697 1,790 1,776 1,845 1,820 1,893 1,894 1,941 1,921 1,993 2,059 2,113 2,227 2,283 2,356 2,485
Grenada 32 35 39 43 45 49 53 55 58 61 64 67 71 75 78 83 89 93 100 107
Haiti 82 94 109 129 145 166 188 209 230 254 282 312 329 347 363 385 409 433 460 494
Jamaica 547 791 880 900 963 963 959 939 979 960 1,002 975 971 944 978 912 953 893 933 950
St. Kitts 23 25 17 19 21 22 24 25 26 2 4 5 6 7 8 10 11 13 15 16
Nevis 9 11 3 5 5 41 42 42 43 46 47 48 49 50 50 52 53 54 55 57
St. Lucia 51 53 58 65 68 72 76 78 80 83 85 87 90 93 96 100 104 107 112 118
St. Vincent and Grenadines 22 25 27 32 34 38 41 44 47 50 54 58 62 67 71 77 83 90 97 106
Fuel Savings (exports) 0 0 0 0 0 -725 -748 -755 -758 -757 -763 -761 -768 -775 -774 -782 -790 -797 -809 -824
Total 2,139 2,740 2,980 3,107 3,290 2,770 2,784 2,869 2,923 3,002 3,091 3,164 3,177 3,262 3,402 3,438 3,645 3,693 3,861 4,078
Table A-102 Interconnection/Renewable Scenario Investment Cost Summary (Million 2009 US$)
Year 2009 2010 2011 2012 2013 2014 2015 2016 2017 2018 2019 2020 2021 2022 2023 2024 2025 2026 2027 2028Salvage Value
Antigua and Barbuda 0 0 5 8 8 4 0 0 0 0 2 5 0 0 6 0 0 5 2 0 23
Barbados 0 0 14 14 7 4 4 4 4 4 4 11 4 11 11 11 4 13 13 4 88
Dominica 0 0 0 56 0 643 0 0 0 0 0 0 0 0 0 0 0 0 0 0 369
Dominican Republic 0 385 150 465 38 38 323 38 345 38 323 38 323 60 38 323 38 323 323 38 2,467
Grenada 0 0 0 4 6 0 2 5 0 2 5 2 0 5 2 5 0 6 0 5 30
Haiti 38 10 15 15 15 6 15 15 15 15 25 15 15 15 25 15 25 15 25 25 211
Jamaica 0 97 26 287 15 147 235 235 15 235 15 235 235 235 15 455 15 455 15 235 2,356
St. Kitts 0 0 0 0 0 0 0 0 0 0 0 0 0 0 0 0 0 0 2 0 2
Nevis 0 0 56 0 0 1,042 0 0 0 56 0 0 2 0 0 2 0 0 2 0 623
St. Lucia 0 10 0 2 2 2 2 11 2 0 2 2 10 2 0 2 10 2 0 2 35
St. Vincent and Grenadines 0 0 2 0 2 0 2 0 6 0 6 0 6 0 6 0 6 5 6 0 35
Interconnection Costs 0 0 18 2 2 1,105 28 28 28 28 28 28 28 28 28 28 28 28 28 28 559
Total 38 501 287 853 95 2,989 610 336 415 378 409 335 623 356 131 840 125 851 417 336 6,797

Caribbean Regional Electricity Generation, Interconnection, and Fuels Supply Strategy – Final Report A-97
Table A-103 Interconnection/Renewable Scenario Interconnection Cost Summary (Million 2009 US$)
Year 2009 2010 2011 2012 2013 2014 2015 2016 2017 2018 2019 2020 2021 2022 2023 2024 2025 2026 2027 2028Salvage Value
Dominica - Martinique & Dominica - Guadeloupe 119 4 4 4 4 4 4 4 4 4 4 4 4 4 4 59
Dominican Republic - Haiti 250 5 5 5 5 5 5 5 5 5 5 5 5 5 5 125
Nevis - Puerto Rico 734 17 17 17 17 17 17 17 17 17 17 17 17 17 17 367
Nevis - St. Kitts 18 2 2 2 2 2 2 2 2 2 2 2 2 2 2 2 2 2 7
Total 0 0 18 2 2 1,105 28 28 28 28 28 28 28 28 28 28 28 28 28 28 559

Caribbean Regional Electricity Generation, Interconnection, and Fuels Supply Strategy – Final Report A-98
A.4 INTEGRATED SCENARIO
Tables A-104 to A-139 present system analysis results for the Integrated Scenario. As for all Scenarios, for each country (or island) results are presented in three tables: capacity balance, energy balance, and cost summary tables. Scenario summary tables are presented at the end.
A.4.1 Antigua and Barbuda
Tables A-104 to A-106 present system analysis results for Antigua and Barbuda. Assumed new generation units are 10 MW CFB units, as in the Fuel Scenario, and the addition of 14 MW of new wind units, as in the Interconnection/Renewable Scenario. The results show combined system and cost impacts (i.e., savings) of fuel and renewable options.
A.4.2 Barbados
Tables A-107 to A-109 present system analysis results for Barbados. For the Integrated Scenario, the availability of natural gas is assumed, as in the Fuel Scenario, combined with the addition of 45 MW of new wind units, as in the Interconnection/Renewable Scenario. The results show combined system and cost impacts (i.e., savings) of fuel and renewable options.
A.4.3 Dominica
Tables A-110 to A-112 present Integrated Scenario system analysis results for Dominica. This Scenario assumes the same geothermal additions as in the Interconnection/Renewable Scenario. The key difference from the Interconnection/Renewable Scenario is the assumed fuel saving of energy exports to Martinique and Guadalupe. The Integrated Scenario assumes construction of a natural gas pipeline serving those two countries, so fuel savings on Martinique and Guadalupe are reduced because they are replacing natural gas based generation.
A.4.4 Dominican Republic
Tables A-113 to A-115 present system analysis results for Dominican Republic for the Integrated Scenario. Assumed system additions are the same as in the Fuel Scenario with the addition of new wind units as in the Interconnection/Renewable Scenario. This Scenario does not assume interconnection with Haiti’s system. The results show combined system and cost impacts (i.e., savings) of fuel and renewable options.
A.4.5 Grenada
Tables A-116 to A-118 present system analysis results for Grenada for the Integrated Scenario. Assumed system additions are the same as in the Fuel Scenario with the addition of new wind units as in the Interconnection/Renewable Scenario. Results show combined system and cost impacts (i.e., savings) of fuel and renewable options.
A.4.6 Haiti
Tables A-119 to A-121 present system analysis results for Haiti for the Integrated Scenario. Assumed system additions are the same as in the Fuel Scenario with the addition of new wind

Caribbean Regional Electricity Generation, Interconnection, and Fuels Supply Strategy – Final Report A-99
units as in the Interconnection/Renewable Scenario. Interconnection with the Dominican Republic is assumed not to occur. The results show combined system and cost impacts (i.e., savings) of fuel and renewable options.
A.4.7 Jamaica
Tables A-122 to A-124 present system analysis results for Jamaica for the Integrated Scenario. Assumed system additions are the same as in the Fuel Scenario with the addition of new wind units as in the Interconnection/Renewable Scenario. The results show combined system and cost impacts (i.e., savings) of fuel and renewable options.
A.4.8 St. Kitts and Nevis
Tables A-125 to A-127 present system analysis results for St. Kitts for the Integrated Scenario. This Scenario assumes the same interconnection with Nevis by 2011 and no new generation units built on St. Kitts, as in the Interconnection/Renewable Scenario. The results are the same as in the Interconnection/Renewable Scenario.
Tables A-128 to A-130 present corresponding system analysis results for Nevis for the Integrated Scenario. Again this scenario assumes that Nevis will be interconnected with St. Kitts by 2011 and the two 20 MW geothermal units at Nevis will supply St. Kitts and Nevis. Additionally, two 200 MW geothermal units will be built at Nevis in 2014 to supply Puerto Rico. The results are the same as in the Interconnection/Renewable Scenario.
A.4.9 St. Lucia
Tables A-131 to A-133 present system analysis results for St. Lucia for the Integrated Scenario. Assumed system additions are the same as in the Fuel Scenario with the addition of new wind units as in the Interconnection/Renewable Scenario. The results show combined system and cost impacts (i.e., savings) of fuel and renewable options.
A.4.10 St. Vincent and Grenadines
Tables A-134 to A-136 present system analysis results for St. Vincent and Grenadines for the Integrated Scenario. Assumed system additions are the same as in the Fuel Scenario with the addition of new wind units as in the Interconnection/Renewable Scenario. The results show combined system and cost impacts (i.e., savings) of fuel and renewable options.
A.4.11 Total System Costs
Tables A-137 to A-139 present total system production, investment and interconnection cost for the Integrated Scenario. Production Cost Summary table shows fuel savings associated for energy exports to Martinique, Guadeloupe and Puerto Rico. Investment Cost Summary and Interconnection Cost Summary tables include yearly costs associated with building assumed interconnections.

Caribbean Regional Electricity Generation, Interconnection, and Fuels Supply Strategy – Final Report A-100
Table A-104 Antigua and Barbuda Integrated Scenario Capacity Balance
Year 2009 2010 2011 2012 2013 2014 2015 2016 2017 2018 2019 2020 2021 2022 2023 2024 2025 2026 2027 2028
Peak Load (MW) 54 57 60 63 65 67 69 71 73 75 77 80 82 85 87 90 92 95 98 101Exports(+)/Imports(-) (MW)
Existing Capacity (MW)APC (Pant) 15 15 15 15 15 15 15 15 15 15 15 15 15 15 15 15 15 15 15 15
APC Blk Pine 26 26 26 26 26 26 26 26 26 26 26 26 26 26 26 26 26 26 26 26Baker 4 4 4 4 4 4 4 4 4 4 4 4 4 4 4 4 4 4 4 4
APC Jt Vent 17 17 17 17 17 17 17 17 17 17 17 17 17 17 17 17 17 17 17 17Victor 8 8 8 8 8 8 8 8 8 8 8 8 8 8 8 8 8 8 8 8WIOC 0 0 0 0 0 0 0 0 0 0 0 0 0 0 0 0 0 0 0 0
Aggreko Rental 13 13 13 13 0 0 0 0 0 0 0 0 0 0 0 0 0 0 0 0Barbuda 7 7 7 7 7 7 7 7 7 7 7 7 7 7 7 7 7 7 7 7
Total Existing (MW) 90 90 90 90 77 77 77 77 77 77 77 77 77 77 77 77 77 77 77 77
Required Capacity (MW) 73 77 81 85 88 90 93 96 99 102 104 108 111 114 118 121 125 128 132 136Existing System Surplus(+)/Deficit(-) (MW) 17 13 9 5 -10 -13 -16 -19 -21 -24 -27 -31 -34 -37 -40 -44 -47 -51 -55 -59
New Capacity (MW)Casada Gardens 0 0 10 20 30 30 30 30 30 30 30 30 30 30 30 30 30 30 30 30
10 MW CFB 0 0 0 0 0 0 0 0 0 0 0 10 10 10 20 20 20 30 30 3010 MW MSD 0 0 0 0 0 0 0 0 0 0 0 0 0 0 0 0 0 0 0 0
Wind 0 0 0 3 6 9 9 9 9 9 11 11 11 11 12 12 12 12 14 14
Total Capacity (MW) 90 90 100 110 107 107 107 107 107 107 107 117 117 117 127 127 127 137 137 137
System Surplus(+)/Deficit(-) with Unit Additions (MW) 17 13 19 25 20 17 14 11 9 6 3 9 6 3 10 6 3 9 5 1
Reserve Margin (%) 66% 58% 67% 75% 65% 60.5% 55.8% 51.2% 46.8% 42.6% 38.5% 46.9% 42.6% 38.5% 45.9% 41.8% 37.8% 44.4% 40.3% 36.3%

Caribbean Regional Electricity Generation, Interconnection, and Fuels Supply Strategy – Final Report A-101
Table A-105 Antigua and Barbuda Integrated Scenario Energy Balance
Year 2009 2010 2011 2012 2013 2014 2015 2016 2017 2018 2019 2020 2021 2022 2023 2024 2025 2026 2027 2028
Energy (GWh) 318 315 312 410 422 434 447 461 475 489 503 519 534 550 567 583 600 618 636 654
Generation (GWh)
APC (Pant) 49 48 43 49 50 50 52 54 55 57 58 52 54 55 49 51 52 55 56 58
APC Blk Pine 101 100 88 102 103 104 107 111 114 118 120 108 111 114 102 104 107 103 105 107
Baker 13 13 11 13 13 13 14 14 15 15 16 14 14 15 13 13 14 15 15 15
APC Jt Vent 66 65 58 67 67 68 70 72 75 77 79 71 73 75 67 68 70 67 68 70
Victor 27 27 24 28 28 28 29 30 31 32 33 30 30 31 28 28 29 30 30 31
WIOC 0 0 0 0 0 0 0 0 0 0 0 0 0 0 0 0 0 0 0 0
Aggreko Rental 38 37 33 38 0 0 0 0 0 0 0 0 0 0 0 0 0 0 0 0
Barbuda 24 24 21 25 25 25 26 27 27 28 29 26 27 27 25 25 26 27 28 29
Casada Gardens 0 0 34 79 119 120 124 128 132 136 139 125 129 132 118 121 123 119 121 124
10 MW CFB 0 0 0 0 0 0 0 0 0 0 0 63 67 71 130 139 147 168 175 183
10 MW MSD 0 0 0 0 0 0 0 0 0 0 0 0 0 0 0 0 0 0 0 0
Wind 0 0 0 8 17 25 25 25 25 25 29 29 29 29 34 34 34 34 38 38
Total Generation (GWh) 318 315 312 410 422 434 447 461 475 489 503 519 534 550 567 583 600 618 636 654
Table A-106 Antigua and Barbuda Integrated Scenario Cost Summary
Year 2009 2010 2011 2012 2013 2014 2015 2016 2017 2018 2019 2020 2021 2022 2023 2024 2025 2026 2027 2028Fuel and O&M Costs
APC (Pant) 7.8 8.0 7.6 9.5 9.8 10.4 11.0 11.4 11.8 12.2 12.6 11.4 11.8 12.2 10.9 11.3 11.6 12.5 12.9 13.6APC Blk Pine 14.4 14.7 14.0 17.5 18.1 19.1 20.2 21.0 21.7 22.5 23.1 21.0 21.7 22.4 20.1 20.8 21.4 20.9 21.6 22.5
Baker 2.1 2.1 2.0 2.5 2.6 2.8 2.9 3.0 3.1 3.3 3.3 3.0 3.1 3.2 2.9 3.0 3.1 3.3 3.4 3.6APC Jt Vent 9.3 9.4 9.0 11.3 11.7 12.3 13.1 13.6 14.0 14.5 14.9 13.6 14.0 14.5 13.0 13.4 13.8 13.5 13.9 14.6
Victor 4.2 4.3 4.1 5.1 5.3 5.6 5.9 6.1 6.3 6.6 6.7 6.1 6.3 6.5 5.9 6.1 6.2 6.4 6.6 6.9WIOC 0.0 0.0 0.0 0.0 0.0 0.0 0.0 0.0 0.0 0.0 0.0 0.0 0.0 0.0 0.0 0.0 0.0 0.0 0.0 0.0
Aggreko Rental 6.8 7.0 6.6 8.3 0.0 0.0 0.0 0.0 0.0 0.0 0.0 0.0 0.0 0.0 0.0 0.0 0.0 0.0 0.0 0.0Barbuda 3.9 3.9 3.8 4.7 4.9 5.1 5.5 5.7 5.9 6.1 6.2 5.7 5.8 6.0 5.4 5.6 5.8 6.2 6.4 6.7
Casada Gardens 0.0 0.0 5.3 13.3 20.6 21.7 23.0 24.0 24.8 25.6 26.3 23.9 24.7 25.6 22.9 23.7 24.4 23.8 24.5 25.610 MW CFB 0.0 0.0 0.0 0.0 0.0 0.0 0.0 0.0 0.0 0.0 0.0 8.0 8.3 8.6 15.4 15.9 16.4 18.6 18.8 19.110 MW MSD 0.0 0.0 0.0 0.0 0.0 0.0 0.0 0.0 0.0 0.0 0.0 0.0 0.0 0.0 0.0 0.0 0.0 0.0 0.0 0.0
Wind 0.0 0.0 0.0 0.1 0.2 0.3 0.3 0.3 0.3 0.3 0.3 0.3 0.3 0.3 0.4 0.4 0.4 0.4 0.4 0.4Production Cost (million $) 48 49 52 72 73 77 82 85 88 91 94 93 96 99 97 100 103 106 109 113
Investment Costs (million $) 0 0 4.5 8.25 8.25 3.75 0 0 0 0 1.875 25.5 0 0 27.38 0 0 25.5 1.875 0
Total System Costs (million $) 48 49 57 81 81 81 82 85 88 91 95 119 96 99 124 100 103 131 110 113

Caribbean Regional Electricity Generation, Interconnection, and Fuels Supply Strategy – Final Report A-102
Table A-107 Barbados Integrated Scenario Capacity Balance
Year 2009 2010 2011 2012 2013 2014 2015 2016 2017 2018 2019 2020 2021 2022 2023 2024 2025 2026 2027 2028
Peak Load (MW) 170 176 182 188 195 201 208 216 223 231 239 247 256 265 274 284 294 304 314 325Exports(+)/Imports(-) (MW)
Existing Capacity (MW)Spring Garden 25 25 25 25 25 25 25 25 25 25 25 25 25 25 25 25 25 25 25 25Spring Garden 13 13 13 13 13 13 13 13 13 13 13 13 13 13 13 13 13 13 13 13Spring Garden 13 13 13 13 13 13 13 13 13 13 13 13 13 13 13 13 13 13 13 13Spring Garden 61 61 61 61 61 61 61 61 61 61 61 61 61 61 61 61 61 61 61 61Spring Garden 40 40 40 40 40 40 40 40 40 40 40 40 40 40 40 40 40 40 40 40
Sewall 86 86 86 86 86 86 86 86 86 86 86 86 86 86 86 86 86 86 86 86
Total Existing (MW) 238 238 238 238 238 238 238 238 238 238 238 238 238 238 238 238 238 238 238 238
Required Capacity (MW) 221 228 236 245 253 262 271 280 290 300 311 322 333 344 356 369 382 395 409 423Existing System Surplus(+)/Deficit(-) (MW) 18 10 2 -6 -15 -23 -33 -42 -52 -62 -72 -83 -94 -106 -118 -130 -143 -157 -170 -185
New Capacity (MW)Trent 0 0 32 64 80 80 80 80 80 80 80 96 96 112 128 144 144 144 144 144
20 MW LSD 0 0 0 0 0 0 0 0 0 0 0 0 0 0 0 0 0 20 40 40Wind 0 0 0 0 0 3 6 9 12 15 18 21 24 27 30 33 36 39 42 45
Total Capacity (MW) 238 238 270 302 318 318 318 318 318 318 318 334 334 350 366 382 382 402 422 422
System Surplus(+)/Deficit(-) with Unit Additions (MW) 18 10 34 58 65 57 47 38 28 18 8 13 2 6 10 14 1 7 14 -1
Reserve Margin (%) 40% 36% 49% 61% 64% 58.1% 52.8% 47.6% 42.6% 37.8% 33.2% 35.2% 30.6% 32.3% 33.6% 34.8% 30.2% 32.4% 34.3% 29.8%

Caribbean Regional Electricity Generation, Interconnection, and Fuels Supply Strategy – Final Report A-103
Table A-108 Barbados Integrated Scenario Energy Balance
Year 2009 2010 2011 2012 2013 2014 2015 2016 2017 2018 2019 2020 2021 2022 2023 2024 2025 2026 2027 2028
Energy (GWh) 1,039 1,073 1,107 1,143 1,180 1,218 1,258 1,298 1,340 1,384 1,428 1,475 1,522 1,572 1,622 1,675 1,729 1,785 1,843 1,902
Exports(+)/Imports(-) (GWh)
Generation (GWh)
Spring Garden 107 120 106 96 94 99 102 104 107 110 113 109 112 108 105 103 106 102 99 102
Spring Garden 57 63 56 51 49 52 54 55 57 58 60 58 59 57 56 54 56 54 52 54
Spring Garden 57 63 56 51 49 52 54 55 57 58 60 58 59 57 56 54 56 54 52 54
Spring Garden 280 314 278 252 245 257 264 271 278 286 294 283 291 282 274 267 276 266 257 265
Spring Garden 227 162 141 126 120 48 48 49 50 52 54 51 51 49 48 48 50 49 47 49
Sewall 312 349 308 278 270 304 312 320 328 336 345 333 343 333 323 314 323 311 300 309
Trent 0 0 161 290 353 398 408 419 430 441 452 524 540 610 677 741 762 732 707 728
20 MW LSD 0 0 0 0 0 0 0 0 0 0 0 0 0 0 0 0 0 109 210 216
Wind 0 0 0 0 0 8 17 25 34 42 50 59 67 76 84 93 101 109 118 126
Total Generation (GWh) 1039 1073 1107 1143 1180 1218 1258 1298 1340 1384 1428 1475 1522 1572 1622 1675 1729 1785 1843 1902
Table A-109 Barbados Integrated Scenario Cost Summary (Million 2009 US$)
Year 2009 2010 2011 2012 2013 2014 2015 2016 2017 2018 2019 2020 2021 2022 2023 2024 2025 2026 2027 2028Fuel and O&M Costs
Spring Garden 16.4 18.9 18.0 17.8 17.8 7.8 8.0 8.2 8.5 8.8 9.1 8.6 8.6 8.4 8.2 8.3 8.7 8.6 8.5 8.9Spring Garden 8.7 10.0 9.5 9.4 9.4 4.1 4.2 4.3 4.5 4.6 4.8 4.6 4.6 4.5 4.3 4.4 4.6 4.6 4.5 4.7Spring Garden 8.7 10.0 9.5 9.4 9.4 4.1 4.2 4.3 4.5 4.6 4.8 4.6 4.6 4.5 4.3 4.4 4.6 4.6 4.5 4.7Spring Garden 40.1 46.1 43.8 43.3 43.3 18.9 19.5 20.0 20.7 21.5 22.2 21.1 21.1 20.6 20.1 20.3 21.3 21.0 20.8 21.8Spring Garden 26.3 30.2 28.7 28.4 28.4 12.4 12.8 13.1 13.6 14.1 14.6 13.8 13.8 13.5 13.2 13.3 14.0 13.8 13.7 14.3
Sewall 62.7 72.3 68.7 67.9 67.9 28.7 29.5 30.4 31.5 32.7 33.9 32.1 32.2 31.3 30.5 30.8 32.5 32.0 31.7 33.2Trent 0.0 0.0 23.6 46.7 58.4 25.7 26.4 27.2 28.0 29.1 30.1 34.3 34.3 39.1 43.6 49.5 52.0 51.3 50.8 53.1
20 MW LSD 0.0 0.0 0.0 0.0 0.0 0.0 0.0 0.0 0.0 0.0 0.0 0.0 0.0 0.0 0.0 0.0 0.0 7.4 14.7 15.3Wind 0.0 0.0 0.0 0.0 0.0 0.1 0.2 0.3 0.4 0.5 0.6 0.7 0.8 0.9 0.9 1.0 1.1 1.2 1.3 1.4
Production Cost (million $) 163 188 202 223 234 102 105 108 112 116 120 120 120 123 125 132 139 145 150 157
Investment Costs (million $) 0 0 14.4 14.4 7.2 3.75 3.75 3.75 3.75 3.75 3.75 10.95 3.75 10.95 10.95 10.95 3.75 13.35 13.35 3.75
Total System Costs (million $) 163 188 216 237 242 106 108 112 115 120 124 131 124 134 136 143 143 158 164 161

Caribbean Regional Electricity Generation, Interconnection, and Fuels Supply Strategy – Final Report A-104
Table A-110 Dominica Integrated Scenario Capacity Balance
Year 2009 2010 2011 2012 2013 2014 2015 2016 2017 2018 2019 2020 2021 2022 2023 2024 2025 2026 2027 2028
Peak Load (MW) 15 15 16 16 17 17 18 18 19 19 20 20 21 21 22 22 23 24 24 25Exports(+)/Imports(-) (MW) 185 185 185 185 185 185 185 185 185 185 185 185 185 185 185
Existing Capacity (MW)Hydro – three plants 5 5 5 5 5 5 5 5 5 5 5 5 5 5 5 5 5 5 5 5Thermal – two plants 16 16 16 16 16 16 16 16 16 16 16 16 16 16 16 16 16 16 16 16
Total Existing (MW) 21 21 21 21 21 21 21 21 21 21 21 21 21 21 21 21 21 21 21 21
Required Capacity (MW) 20 21 21 22 23 207 208 209 209 210 210 211 212 213 213 214 215 216 216 217Existing System Surplus(+)/Deficit(-) (MW) 1 0 0 -1 -2 -186 -187 -188 -188 -189 -189 -190 -191 -192 -192 -193 -194 -195 -195 -196
New Capacity (MW)5 MW MSD 0 0 0 0 0 0 0 0 0 0 0 0 0 0 0 0 0 0 0 0
Geo Non-Export 0 0 0 20 20 20 20 20 20 20 20 20 20 20 20 20 20 20 20 20Geo Export 0 0 0 0 0 185 185 185 185 185 185 185 185 185 185 185 185 185 185 185
Wind 0 0 0 0 0 0 0 0 0 0 0 0 0 0 0 0 0 0 0 0
Total Capacity (MW) 21 21 21 41 41 226 226 226 226 226 226 226 226 226 226 226 226 226 226 226
System Surplus(+)/Deficit(-) with Unit Additions (MW) 1 0 0 19 18 19 18 17 17 16 16 15 14 13 13 12 11 10 10 9
Reserve Margin (%) 40% 36% 32% 152% 145% 11.8% 11.5% 11.3% 11.0% 10.7% 10.5% 10.2% 9.9% 9.6% 9.3% 9.0% 8.7% 8.3% 8.0% 7.7%

Caribbean Regional Electricity Generation, Interconnection, and Fuels Supply Strategy – Final Report A-105
Table A-111 Dominica Integrated Scenario Energy Balance
Year 2009 2010 2011 2012 2013 2014 2015 2016 2017 2018 2019 2020 2021 2022 2023 2024 2025 2026 2027 2028
Energy (GWh) 87 89 91 94 96 99 101 104 106 109 112 114 117 120 123 126 129 133 136 139
Exports(+)/Imports(-) (GWh) 1,296 1,296 1,296 1,296 1,296 1,296 1,296 1,296 1,296 1,296 1,296 1,296 1,296 1,296 1,296
Generation (GWh)
Hydro – three plants 22 22 22 22 22 22 22 22 22 22 22 22 22 22 22 22 22 22 22 22
Thermal – two plants 65 67 70 2 4 7 9 12 14 17 20 22 25 28 31 34 37 41 44 47
5 MW MSD 0 0 0 0 0 0 0 0 0 0 0 0 0 0 0 0 0 0 0 0
Geo Non-Export 0 0 0 70 70 70 70 70 70 70 70 70 70 70 70 70 70 70 70 70
Geo Export 0 0 0 0 0 1296 1296 1296 1296 1296 1296 1296 1296 1296 1296 1296 1296 1296 1296 1296
Wind 0 0 0 0 0 0 0 0 0 0 0 0 0 0 0 0 0 0 0 0
Total Generation (GWh) 87 89 91 94 96 1395 1397 1400 1403 1405 1408 1411 1414 1417 1420 1423 1426 1429 1432 1436
Table A-112 Dominica Integrated Scenario Cost Summary (Million 2009 US$)
Year 2009 2010 2011 2012 2013 2014 2015 2016 2017 2018 2019 2020 2021 2022 2023 2024 2025 2026 2027 2028Fuel and O&M Costs
Hydro – three plants 0.6 0.6 0.6 0.6 0.6 0.6 0.6 0.6 0.6 0.6 0.6 0.6 0.6 0.6 0.6 0.6 0.6 0.6 0.6 0.6Thermal – two plants 12.1 12.8 14.1 1.0 1.5 2.1 2.7 3.4 4.0 4.6 5.3 6.0 6.7 7.5 8.2 9.1 10.0 10.9 11.9 13.0
5 MW MSD 0.0 0.0 0.0 0.0 0.0 0.0 0.0 0.0 0.0 0.0 0.0 0.0 0.0 0.0 0.0 0.0 0.0 0.0 0.0 0.0Geo Non-Export 0.0 0.0 0.0 1.6 1.6 1.6 1.6 1.6 1.6 1.6 1.6 1.6 1.6 1.6 1.6 1.6 1.6 1.6 1.6 1.6
Geo Export 0.0 0.0 0.0 0.0 0.0 20.9 20.9 20.9 20.9 20.9 20.9 20.9 20.9 20.9 20.9 20.9 20.9 20.9 20.9 20.9Wind 0.0 0.0 0.0 0.0 0.0 0.0 0.0 0.0 0.0 0.0 0.0 0.0 0.0 0.0 0.0 0.0 0.0 0.0 0.0 0.0
Production Cost (million $) 13 13 15 3 4 25 26 26 27 28 28 29 30 31 31 32 33 34 35 36
Investment Costs (million $) 0.0 0.0 0.0 56.0 0.0 643.2 0.0 0.0 0.0 0.0 0.0 0.0 0.0 0.0 0.0 0.0 0.0 0.0 0.0 0.0
Total System Costs (million $) 13 13 15 59 4 668 26 26 27 28 28 29 30 31 31 32 33 34 35 36

Caribbean Regional Electricity Generation, Interconnection, and Fuels Supply Strategy – Final Report A-106
Table A-11313 Dominican Republic Integrated Scenario Capacity Balance
Year 2009 2010 2011 2012 2013 2014 2015 2016 2017 2018 2019 2020 2021 2022 2023 2024 2025 2026 2027 2028
Peak Load (MW) 2,353 2,447 2,544 2,640 2,727 2,803 2,896 2,992 3,091 3,194 3,300 3,409 3,522 3,638 3,758 3,882 4,010 4,143 4,280 4,421Exports(+)/Imports(-) (MW) 0 0 0 0 0 0 0 0 0 0 0 0 0 0 0 0 0 0 0 0
Existing Capacity (MW)Andres 290 290 290 290 290 290 290 290 290 290 290 290 290 290 290 290 290 290 290 290
Itabo 128 128 128 128 128 128 128 128 128 128 128 128 128 128 128 128 128 128 128 128Itabo 101 101 101 101 101 101 101 101 101 101 101 101 101 101 101 101 101 101 101 101
Los Mina 236 236 236 236 236 236 236 236 236 236 236 236 236 236 236 236 236 236 236 236Itabo 35 35 35 35 35 35 35 35 35 35 35 35 35 35 35 35 35 35 35 35
Higuamo 0 0 0 0 0 0 0 0 0 0 0 0 0 0 0 0 0 0 0 0Haina 100 100 100 100 100 100 100 100 100 100 100 100 100 100 100 100 100 100 100 100Haina 72 72 72 72 72 72 72 72 72 72 72 72 72 72 72 72 72 72 72 72
San Pedro 33 33 33 33 33 33 33 33 33 33 33 33 33 33 33 33 33 33 33 33Puerto Plata 28 28 28 28 28 28 28 28 28 28 28 28 28 28 28 28 28 28 28 28Puerto Plata 39 39 39 39 39 39 39 39 39 39 39 39 39 39 39 39 39 39 39 39
Haina 100 100 100 100 100 100 100 100 100 100 100 100 100 100 100 100 100 100 100 100Barahona 46 46 46 46 46 46 46 46 46 46 46 46 46 46 46 46 46 46 46 46
Sultana DE 102 102 102 102 102 102 102 102 102 102 102 102 102 102 102 102 102 102 102 102CESPM. 300 300 300 300 300 300 300 300 300 300 300 300 300 300 300 300 300 300 300 300
San Felipe 185 185 185 185 185 185 185 185 185 185 185 185 185 185 185 185 185 185 185 185Palamara 107 107 107 107 107 107 107 107 107 107 107 107 107 107 107 107 107 107 107 107La Vega 88 88 88 88 88 88 88 88 88 88 88 88 88 88 88 88 88 88 88 88
CEPP 17 17 17 17 17 17 17 17 17 17 17 17 17 17 17 17 17 17 17 17CEPP 50 50 50 50 50 50 50 50 50 50 50 50 50 50 50 50 50 50 50 50
Seaboard 43 43 43 43 43 43 43 43 43 43 43 43 43 43 43 43 43 43 43 43Seaboard 73 73 73 73 73 73 73 73 73 73 73 73 73 73 73 73 73 73 73 73
Monte Rio 100 100 100 100 100 100 100 100 100 100 100 100 100 100 100 100 100 100 100 100Metaldom 42 42 42 42 42 42 42 42 42 42 42 42 42 42 42 42 42 42 42 42
Laesa 32 32 32 32 32 32 32 32 32 32 32 32 32 32 32 32 32 32 32 32Maxon 30 30 30 30 30 30 30 30 30 30 30 30 30 30 30 30 30 30 30 30
Falconbridge 36 36 36 36 36 36 36 36 36 36 36 36 36 36 36 36 36 36 36 36Reservoir Hydro 387 387 387 387 387 387 387 387 387 387 387 387 387 387 387 387 387 387 387 387
Non Reser Hydro 85 85 85 85 85 85 85 85 85 85 85 85 85 85 85 85 85 85 85 85
Total Existing (MW) 2,883 2,883 2,883 2,883 2,883 2,883 2,883 2,883 2,883 2,883 2,883 2,883 2,883 2,883 2,883 2,883 2,883 2,883 2,883 2,883
Required Capacity (MW) 2,941 3,059 3,180 3,300 3,409 3,504 3,620 3,740 3,864 3,993 4,125 4,261 4,402 4,547 4,698 4,853 5,013 5,179 5,350 5,526Existing System Surplus(+)/Deficit(-) (MW) -58 -176 -297 -417 -526 -621 -737 -857 -981 -1,110 -1,242 -1,378 -1,519 -1,664 -1,815 -1,970 -2,130 -2,296 -2,467 -2,643

Caribbean Regional Electricity Generation, Interconnection, and Fuels Supply Strategy – Final Report A-107
New Capacity (MW)Pinalto 50 50 50 50 50 50 50 50 50 50 50 50 50 50 50 50 50 50 50 50
Palomino 100 100 100 100 100 100 100 100 100 100 100 100 100 100 100 100 100 100 100 100Hatillo et al 0 17 17 17 17 17 17 17 17 17 17 17 17 17 17 17 17 17 17 17
Las Placetas 0 87 87 87 87 87 87 87 87 87 87 87 87 87 87 87 87 87 87 87Arbonito 0 0 45 45 45 45 45 45 45 45 45 45 45 45 45 45 45 45 45 45
Hondo Valle et al 0 0 0 57 57 57 57 57 57 57 57 57 57 57 57 57 57 57 57 57300 MW CC 0 0 0 0 0 0 0 0 0 0 0 0 0 0 0 0 0 0 0 0
300 MW ConvCoal 0 0 0 0 0 0 0 0 0 0 0 0 0 300 300 600 600 900 900 1,200Montecristi 0 0 0 305 305 305 610 610 610 610 610 610 610 610 610 610 610 610 610 610
Haltillo-Azua 0 0 0 0 0 0 0 0 305 305 610 610 610 610 610 610 610 610 610 61050 MW GT 0 0 0 0 0 0 0 0 50 50 50 50 50 100 100 100 100 100 100 100
Montafongo,Bani,El Norte 0 100 100 100 100 100 100 100 100 100 100 100 100 100 100 100 100 100 100 100Wind 0 0 30 60 90 120 150 180 210 240 270 300 330 360 390 420 450 480 510 540
Total Capacity (MW) 3,033 3,137 3,182 3,544 3,544 3,544 3,849 3,849 4,204 4,204 4,509 4,509 4,509 4,859 4,859 5,159 5,159 5,459 5,459 5,759
System Surplus(+)/Deficit(-) with Unit Additions (MW) 92 78 2 244 135 40 229 109 340 211 384 248 107 312 161 306 146 280 109 233
Reserve Margin (%) 29% 28% 25% 34% 30% 26.4% 32.9% 28.6% 36.0% 31.6% 36.6% 32.3% 28.0% 33.6% 29.3% 32.9% 28.6% 31.8% 27.6% 30.3%

Caribbean Regional Electricity Generation, Interconnection, and Fuels Supply Strategy – Final Report A-108
Table A-114 Dominican Republic Integrated Scenario Energy Balance
Year 2009 2010 2011 2012 2013 2014 2015 2016 2017 2018 2019 2020 2021 2022 2023 2024 2025 2026 2027 2028
Energy (GWh) 12,638 13,142 13,663 14,179 14,646 15,054 15,554 16,070 16,601 17,154 17,724 18,309 18,914 19,539 20,184 20,851 21,539 22,251 22,986 23,745
Exports(+)/Imports(-) (GWh) 0 0 0 0 0 0 0 0 0 0 0 0 0 0 0 0 0 0 0 0
Generation (GWh)
Andres 1709 1476 1550 1202 1257 1303 1145 1189 1044 1075 975 1013 1065 981 1013 933 946 884 897 838
Itabo 1004 820 859 643 667 688 604 626 549 569 523 541 560 513 532 502 521 495 514 492
Itabo 706 583 609 459 475 490 430 446 391 406 372 385 398 365 379 357 371 352 365 349
Los Mina 865 1013 1036 851 873 890 777 804 714 739 673 696 721 666 690 645 663 626 642 606
Itabo 73 164 169 158 163 168 148 153 139 144 132 137 142 133 138 130 135 129 134 129
Higuamo 0 0 0 0 0 0 0 0 0 0 0 0 0 0 0 0 0 0 0 0
Haina 362 410 425 391 406 419 368 381 345 358 329 340 352 329 341 321 333 317 329 314
Haina 267 284 293 267 277 286 251 260 235 244 224 231 239 224 232 218 226 215 223 213
San Pedro 123 138 143 132 137 141 124 128 116 120 111 114 119 111 115 108 112 107 111 106
Puerto Plata 103 116 120 110 114 118 104 107 97 101 92 96 99 93 96 90 94 89 93 88
Puerto Plata 146 163 169 155 162 167 146 152 137 142 131 135 140 131 136 128 133 126 131 125
Haina 237 465 479 442 455 468 412 426 386 400 368 382 395 370 383 362 376 358 371 356
Barahona 302 252 263 199 206 212 187 193 170 176 161 167 173 158 164 155 161 153 158 151
Sultana DE 487 363 367 310 318 325 284 294 264 273 250 258 267 248 257 242 250 237 245 233
CESPM. 1057 1257 1274 1081 1109 1133 990 1024 919 953 872 903 933 868 899 847 876 831 858 818
San Felipe 515 771 789 702 722 740 649 672 606 628 576 598 618 577 598 564 585 556 575 551
Palamara 523 401 407 348 358 367 320 332 298 309 283 292 302 281 291 274 283 269 278 264
La Vega 425 328 333 285 293 300 263 272 244 253 232 240 248 231 239 225 232 220 228 217
CEPP 75 62 63 55 57 58 51 53 47 49 45 47 48 45 46 44 45 43 44 42
CEPP 226 188 191 166 172 176 154 160 144 149 137 141 146 136 141 133 137 130 135 128
Seaboard 202 161 164 141 146 149 131 135 122 126 116 119 124 115 119 112 116 110 114 108
Seaboard 369 275 279 237 243 249 218 225 202 209 192 198 205 190 197 186 192 182 188 179
Monte Rio 516 377 380 321 330 337 295 305 274 284 260 268 277 258 267 251 259 246 254 241
Metaldom 202 157 160 137 141 145 126 131 118 122 112 115 119 111 115 108 112 106 110 104
Laesa 116 123 127 116 120 124 109 113 102 106 97 100 104 97 101 95 98 93 97 92
Maxon 75 118 121 108 112 115 101 104 94 97 89 93 96 90 93 88 91 86 89 86
Falconbridge 129 144 149 136 142 146 128 133 120 125 115 119 123 115 119 112 116 110 115 109
Reservoir Hydro 1255 1255 1255 1255 1255 1255 1255 1255 1255 1255 1255 1255 1255 1255 1255 1255 1255 1255 1255 1255
Non Reser Hydro 276 276 276 276 276 276 276 276 276 276 276 276 276 276 276 276 276 276 276 276

Caribbean Regional Electricity Generation, Interconnection, and Fuels Supply Strategy – Final Report A-109
Pinalto 143 143 143 143 143 143 143 143 143 143 143 143 143 143 143 143 143 143 143 143
Palomino 150 150 150 150 150 150 150 150 150 150 150 150 150 150 150 150 150 150 150 150
Hatillo et al 0 123 123 123 123 123 123 123 123 123 123 123 123 123 123 123 123 123 123 123
Las Placetas 0 331 331 331 331 331 331 331 331 331 331 331 331 331 331 331 331 331 331 331
Arbonito 0 0 125 125 125 125 125 125 125 125 125 125 125 125 125 125 125 125 125 125
Hondo Valle et al 0 0 0 219 219 219 219 219 219 219 219 219 219 219 219 219 219 219 219 219
300 MW CC 0 0 0 0 0 0 0 0 0 0 0 0 0 0 0 0 0 0 0 0
300 MW ConvCoal 0 0 0 0 0 0 0 0 0 0 0 0 0 1561 1618 3056 3176 4532 4710 6020
Montecristi 0 0 0 1983 2060 2127 3742 3873 3394 3518 3235 3350 3466 3174 3289 3107 3229 3072 3192 3060
Haltillo-Azua 0 0 0 0 0 0 0 0 1697 1759 3235 3350 3466 3174 3289 3107 3229 3072 3192 3060
50 MW GT 0 0 0 0 0 0 0 0 164 170 154 160 167 308 318 295 301 283 289 271
Montafongo,Bani,El Norte 0 256 256 256 256 256 256 256 256 256 256 256 256 256 256 256 256 256 256 256
Wind 0 0 84 168 252 336 420 505 589 673 757 841 925 1009 1093 1177 1261 1346 1430 1514
Total Generation (GWh) 12638 13142 13663 14179 14646 15054 15554 16070 16601 17154 17724 18309 18914 19539 20184 20851 21539 22251 22986 23745

Caribbean Regional Electricity Generation, Interconnection, and Fuels Supply Strategy – Final Report A-110
Table A-115 Dominican Republic Integrated Scenario Cost Summary (Million 2009 US$) Year 2009 2010 2011 2012 2013 2014 2015 2016 2017 2018 2019 2020 2021 2022 2023 2024 2025 2026 2027 2028Fuel and O&M Costs
Andres 140.2 123.0 126.1 99.7 101.7 104.0 92.4 95.7 85.5 88.7 81.8 83.2 84.9 79.1 81.6 78.0 80.8 77.6 80.1 76.6Itabo 58.8 47.3 49.1 38.0 39.1 40.3 36.0 37.3 33.2 34.4 31.6 32.2 33.2 30.9 31.8 30.1 30.8 29.4 30.0 28.4Itabo 45.0 36.8 38.1 29.7 30.6 31.5 28.2 29.2 26.1 26.9 24.8 25.2 26.0 24.3 25.0 23.7 24.2 23.1 23.5 22.3
Los Mina 114.0 133.6 133.7 110.6 110.8 111.8 98.0 101.3 91.0 95.1 87.7 88.8 89.5 83.3 86.3 83.5 87.7 84.9 88.7 85.4Itabo 16.0 36.4 40.4 41.3 43.8 47.2 42.9 44.8 40.8 42.4 39.3 41.0 42.7 40.4 41.7 40.0 42.0 40.4 42.5 41.8
Higuamo 0.0 0.0 0.0 0.0 0.0 0.0 0.0 0.0 0.0 0.0 0.0 0.0 0.0 0.0 0.0 0.0 0.0 0.0 0.0 0.0Haina 45.0 80.5 90.8 92.4 100.1 108.0 98.1 102.4 93.5 97.1 90.0 92.6 96.8 91.5 94.5 90.0 94.2 90.3 95.1 92.5Haina 32.1 53.4 60.0 60.4 65.3 70.4 64.0 66.7 60.9 63.2 58.6 60.3 63.0 59.5 61.5 58.5 61.2 58.7 61.8 60.0
San Pedro 15.2 26.9 30.4 30.9 33.5 36.2 32.9 34.3 31.3 32.5 30.2 31.0 32.4 30.7 31.7 30.2 31.6 30.3 31.9 31.0Puerto Plata 12.7 22.5 25.4 25.9 28.0 30.3 27.5 28.7 26.2 27.2 25.2 25.9 27.1 25.6 26.5 25.2 26.4 25.3 26.7 25.9Puerto Plata 17.9 31.8 35.9 36.5 39.6 42.8 38.9 40.6 37.0 38.4 35.6 36.7 38.3 36.2 37.4 35.6 37.3 35.8 37.7 36.6
Haina 47.1 94.6 104.8 105.9 112.2 120.6 109.6 114.5 104.0 108.2 100.3 104.6 108.9 102.9 106.2 101.8 107.0 102.8 108.1 106.3Barahona 20.3 16.7 17.3 13.6 14.0 14.4 12.8 13.3 11.9 12.3 11.3 11.5 11.9 11.1 11.4 10.8 11.0 10.5 10.7 10.2
Sultana DE 43.2 50.3 55.0 51.5 55.0 58.5 53.1 55.2 50.2 52.0 48.2 49.5 51.5 48.6 50.1 47.7 49.6 47.6 49.7 48.2CESPM. 145.0 175.9 190.9 178.5 188.0 200.1 181.6 189.2 171.1 177.6 164.6 170.7 177.2 167.0 172.1 164.8 172.1 165.3 172.7 168.8
San Felipe 88.6 133.4 146.1 142.7 150.7 161.1 146.6 152.8 138.8 144.2 133.8 139.1 144.5 136.6 140.8 135.0 141.3 135.9 142.4 139.7Palamara 47.7 57.9 63.7 60.4 64.7 69.1 62.7 65.3 59.3 61.5 57.0 58.6 61.0 57.5 59.3 56.5 58.9 56.5 59.1 57.3La Vega 39.0 47.6 52.4 49.8 53.3 56.9 51.7 53.8 48.9 50.7 47.0 48.3 50.3 47.4 48.9 46.6 48.6 46.6 48.7 47.3
CEPP 7.4 9.6 10.6 10.3 11.0 11.8 10.7 11.2 10.2 10.5 9.8 10.0 10.5 9.9 10.2 9.7 10.1 9.7 10.2 9.9CEPP 22.3 29.1 32.2 31.1 33.4 35.7 32.4 33.8 30.8 31.9 29.6 30.4 31.7 29.9 30.9 29.4 30.6 29.4 30.8 29.9
Seaboard 19.2 24.2 26.7 25.5 27.4 29.3 26.6 27.7 25.2 26.1 24.2 24.9 25.9 24.4 25.2 24.0 25.0 24.0 25.2 24.4Seaboard 32.7 38.7 42.4 40.0 42.8 45.6 41.4 43.1 39.2 40.6 37.7 38.7 40.2 37.9 39.1 37.3 38.8 37.2 38.9 37.7
Monte Rio 44.6 51.7 56.6 53.1 56.7 60.4 54.8 57.1 51.9 53.7 49.8 51.1 53.2 50.2 51.8 49.3 51.3 49.2 51.4 49.8Metaldom 18.7 23.0 25.3 24.1 25.8 27.6 25.1 26.1 23.7 24.6 22.8 23.4 24.4 23.0 23.7 22.6 23.6 22.6 23.7 22.9
Laesa 14.1 23.4 26.2 26.4 28.5 30.7 27.9 29.1 26.6 27.6 25.6 26.3 27.5 26.0 26.8 25.6 26.7 25.6 27.0 26.2Maxon 13.5 21.3 23.4 23.0 24.3 26.0 23.7 24.7 22.4 23.3 21.6 22.5 23.4 22.1 22.8 21.8 22.9 22.0 23.1 22.6
Falconbridge 16.0 28.1 31.6 32.0 34.7 37.4 34.0 35.4 32.4 33.6 31.2 32.0 33.5 31.6 32.7 31.1 32.6 31.2 32.9 32.0Reservoir Hydro 21.8 21.8 21.8 21.8 21.8 21.8 21.8 21.8 21.8 21.8 21.8 21.8 21.8 21.8 21.8 21.8 21.8 21.8 21.8 21.8
Non Reser Hydro 4.8 4.8 4.8 4.8 4.8 4.8 4.8 4.8 4.8 4.8 4.8 4.8 4.8 4.8 4.8 4.8 4.8 4.8 4.8 4.8
Pinalto 2.1 2.1 2.1 2.1 2.1 2.1 2.1 2.1 2.1 2.1 2.1 2.1 2.1 2.1 2.1 2.1 2.1 2.1 2.1 2.1Palomino 3.7 3.7 3.7 3.7 3.7 3.7 3.7 3.7 3.7 3.7 3.7 3.7 3.7 3.7 3.7 3.7 3.7 3.7 3.7 3.7
Hatillo et al 0.0 0.9 0.9 0.9 0.9 0.9 0.9 0.9 0.9 0.9 0.9 0.9 0.9 0.9 0.9 0.9 0.9 0.9 0.9 0.9Las Placetas 0.0 3.8 3.8 3.8 3.8 3.8 3.8 3.8 3.8 3.8 3.8 3.8 3.8 3.8 3.8 3.8 3.8 3.8 3.8 3.8
Arbonito 0.0 0.0 1.8 1.8 1.8 1.8 1.8 1.8 1.8 1.8 1.8 1.8 1.8 1.8 1.8 1.8 1.8 1.8 1.8 1.8Hondo Valle et al 0.0 0.0 0.0 2.5 2.5 2.5 2.5 2.5 2.5 2.5 2.5 2.5 2.5 2.5 2.5 2.5 2.5 2.5 2.5 2.5
300 MW CC 0.0 0.0 0.0 0.0 0.0 0.0 0.0 0.0 0.0 0.0 0.0 0.0 0.0 0.0 0.0 0.0 0.0 0.0 0.0 0.0300 MW ConvCoal 0.0 0.0 0.0 0.0 0.0 0.0 0.0 0.0 0.0 0.0 0.0 0.0 0.0 70.1 72.2 136.6 140.0 199.9 204.2 257.8
Montecristi 0.0 0.0 0.0 87.6 90.4 93.4 166.6 172.8 153.5 158.8 145.7 148.6 153.3 142.6 146.9 138.8 142.3 135.5 138.4 131.1Haltillo-Azua 0.0 0.0 0.0 0.0 0.0 0.0 0.0 0.0 76.7 79.4 145.7 148.6 153.3 142.6 146.9 138.8 142.3 135.5 138.4 131.1
50 MW GT 0.0 0.0 0.0 0.0 0.0 0.0 0.0 0.0 16.5 17.2 15.8 16.0 16.3 30.2 31.3 30.0 31.3 30.2 31.4 30.0Montafongo,Bani,El Norte 0.0 3.1 3.1 3.1 3.1 3.1 3.1 3.1 3.1 3.1 3.1 3.1 3.1 3.1 3.1 3.1 3.1 3.1 3.1 3.1
Wind 0.0 0.0 0.9 1.9 2.8 3.8 4.7 5.7 6.6 7.6 8.5 9.5 10.4 11.4 12.3 13.2 14.2 15.1 16.1 17.0Production Cost (million $) 1,149 1,458 1,578 1,567 1,653 1,749 1,669 1,736 1,670 1,732 1,680 1,726 1,787 1,769 1,824 1,811 1,881 1,873 1,945 1,945
Investment Costs (million $) 0 385 150 790 37.5 37.5 647.5 37.5 670 37.5 647.5 37.5 37.5 660 37.5 637.5 37.5 637.5 37.5 637.5
Total System Costs (million $) 1,149 1,843 1,728 2,357 1,690 1,787 2,317 1,774 2,340 1,770 2,327 1,763 1,825 2,429 1,862 2,449 1,919 2,510 1,983 2,583

Caribbean Regional Electricity Generation, Interconnection, and Fuels Supply Strategy – Final Report A-111
Table A-116 Grenada Integrated Scenario Capacity Balance
Year 2009 2010 2011 2012 2013 2014 2015 2016 2017 2018 2019 2020 2021 2022 2023 2024 2025 2026 2027 2028
Peak Load (MW) 31 33 34 36 38 40 42 45 47 50 52 55 58 61 64 68 72 75 80 84Exports(+)/Imports(-) (MW)
Existing Capacity (MW)Queens Park 17 17 17 17 17 17 17 17 17 17 17 17 17 17 17 17 17 17 17 17Queens Park 16 16 16 16 16 16 16 16 16 16 16 16 16 16 16 16 16 16 16 16Queens Park 16 16 16 16 16 16 16 16 16 16 16 16 16 16 16 16 16 16 16 16
Total Existing (MW) 49 49 49 49 49 49 49 49 49 49 49 49 49 49 49 49 49 49 49 49
Required Capacity (MW) 42 44 46 49 52 54 57 60 64 67 71 74 78 83 87 92 97 102 107 113Existing System Surplus(+)/Deficit(-) (MW) 7 4 2 0 -3 -6 -9 -12 -15 -18 -22 -26 -30 -34 -39 -43 -48 -53 -59 -65
New Capacity (MW)10 MW MSD 0 0 0 0 0 0 0 0 0 0 0 0 0 0 0 0 0 0 0 010 MW CFB 0 0 0 0 10 10 10 20 20 20 30 30 30 40 40 50 50 60 60 70
Wind 0 0 0 3 5 5 6 6 6 8 8 9 9 9 11 11 11 12 12 12
Total Capacity (MW) 49 49 49 49 59 59 59 69 69 69 79 79 79 89 89 99 99 109 109 119
System Surplus(+)/Deficit(-) with Unit Additions (MW) 7 4 2 0 7 4 1 8 5 2 8 4 0 6 1 7 2 7 1 5
Reserve Margin (%) 57% 49% 41% 34% 53% 45.4% 37.9% 53.3% 45.5% 38.0% 50.1% 42.4% 35.2% 44.6% 37.2% 45.0% 37.6% 43.8% 36.4% 41.4%
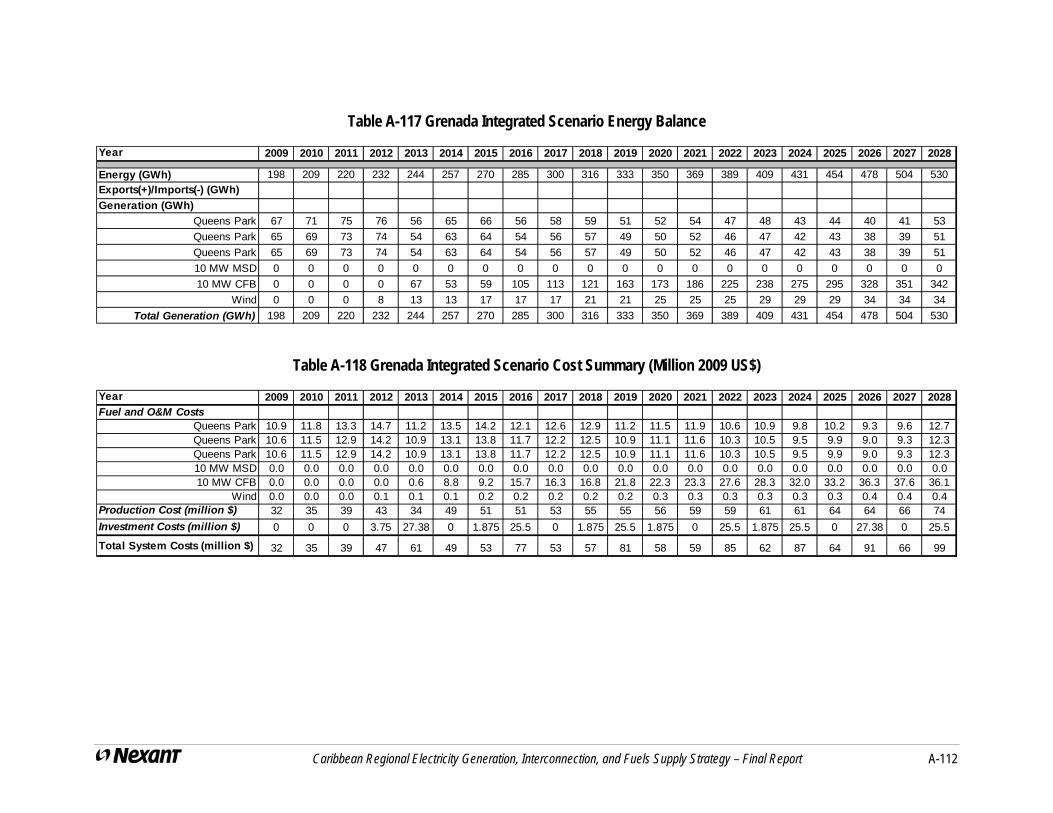
Caribbean Regional Electricity Generation, Interconnection, and Fuels Supply Strategy – Final Report A-112
Table A-117 Grenada Integrated Scenario Energy Balance
Year 2009 2010 2011 2012 2013 2014 2015 2016 2017 2018 2019 2020 2021 2022 2023 2024 2025 2026 2027 2028
Energy (GWh) 198 209 220 232 244 257 270 285 300 316 333 350 369 389 409 431 454 478 504 530
Exports(+)/Imports(-) (GWh)
Generation (GWh)
Queens Park 67 71 75 76 56 65 66 56 58 59 51 52 54 47 48 43 44 40 41 53
Queens Park 65 69 73 74 54 63 64 54 56 57 49 50 52 46 47 42 43 38 39 51
Queens Park 65 69 73 74 54 63 64 54 56 57 49 50 52 46 47 42 43 38 39 51
10 MW MSD 0 0 0 0 0 0 0 0 0 0 0 0 0 0 0 0 0 0 0 0
10 MW CFB 0 0 0 0 67 53 59 105 113 121 163 173 186 225 238 275 295 328 351 342
Wind 0 0 0 8 13 13 17 17 17 21 21 25 25 25 29 29 29 34 34 34
Total Generation (GWh) 198 209 220 232 244 257 270 285 300 316 333 350 369 389 409 431 454 478 504 530
Table A-118 Grenada Integrated Scenario Cost Summary (Million 2009 US$)
Year 2009 2010 2011 2012 2013 2014 2015 2016 2017 2018 2019 2020 2021 2022 2023 2024 2025 2026 2027 2028Fuel and O&M Costs
Queens Park 10.9 11.8 13.3 14.7 11.2 13.5 14.2 12.1 12.6 12.9 11.2 11.5 11.9 10.6 10.9 9.8 10.2 9.3 9.6 12.7Queens Park 10.6 11.5 12.9 14.2 10.9 13.1 13.8 11.7 12.2 12.5 10.9 11.1 11.6 10.3 10.5 9.5 9.9 9.0 9.3 12.3Queens Park 10.6 11.5 12.9 14.2 10.9 13.1 13.8 11.7 12.2 12.5 10.9 11.1 11.6 10.3 10.5 9.5 9.9 9.0 9.3 12.310 MW MSD 0.0 0.0 0.0 0.0 0.0 0.0 0.0 0.0 0.0 0.0 0.0 0.0 0.0 0.0 0.0 0.0 0.0 0.0 0.0 0.010 MW CFB 0.0 0.0 0.0 0.0 0.6 8.8 9.2 15.7 16.3 16.8 21.8 22.3 23.3 27.6 28.3 32.0 33.2 36.3 37.6 36.1
Wind 0.0 0.0 0.0 0.1 0.1 0.1 0.2 0.2 0.2 0.2 0.2 0.3 0.3 0.3 0.3 0.3 0.3 0.4 0.4 0.4Production Cost (million $) 32 35 39 43 34 49 51 51 53 55 55 56 59 59 61 61 64 64 66 74
Investment Costs (million $) 0 0 0 3.75 27.38 0 1.875 25.5 0 1.875 25.5 1.875 0 25.5 1.875 25.5 0 27.38 0 25.5
Total System Costs (million $) 32 35 39 47 61 49 53 77 53 57 81 58 59 85 62 87 64 91 66 99

Caribbean Regional Electricity Generation, Interconnection, and Fuels Supply Strategy – Final Report A-113
Table A-119 Haiti Integrated Scenario Capacity Balance
Year 2009 2010 2011 2012 2013 2014 2015 2016 2017 2018 2019 2020 2021 2022 2023 2024 2025 2026 2027 2028
Peak Load (MW) 226 237 249 261 274 288 303 318 334 350 368 386 405 426 447 469 493 517 543 570Exports(+)/Imports(-) (MW)
Existing Capacity (MW)Varreau PAP EDH 34 34 34 34 34 34 34 34 34 34 34 34 34 34 34 34 34 34 34 34
Carrefour PAP EDH 24 24 24 24 24 24 24 24 24 24 24 24 24 24 24 24 24 24 24 24Peligre PAP EDH 27 27 27 27 27 27 27 27 27 27 27 27 27 27 27 27 27 27 27 27
Varreau PAP Sogener IPPs 20 20 20 20 20 20 20 20 20 20 20 20 20 20 20 20 20 20 20 20Carrefour PAP IPP 10 10 10 10 10 10 10 10 10 10 10 10 10 10 10 10 10 10 10 10
Thermal in Provinces 36 36 36 36 36 36 36 36 36 36 36 36 36 36 36 36 36 36 36 36Hydro in Provinces 4 4 4 4 4 4 4 4 4 4 4 4 4 4 4 4 4 4 4 4
Total Existing (MW) 155 155 155 155 155 155 155 155 155 155 155 155 155 155 155 155 155 155 155 155
Required Capacity (MW) 293 308 324 340 357 375 393 413 434 455 478 502 527 553 581 610 641 673 706 742Existing System Surplus(+)/Deficit(-) (MW) -138 -153 -169 -185 -202 -220 -238 -258 -279 -300 -323 -347 -372 -398 -426 -455 -486 -518 -551 -587
New Capacity (MW)E-Power 30 30 30 30 30 30 30 30 30 30 30 30 30 30 30 30 30 30 30 30
Gov of Brazil 30 30 30 30 30 30 30 30 30 30 30 30 30 30 30 30 30 30 30 3020 MW LSD 80 100 120 140 160 160 180 200 220 240 280 300 320 340 380 400 440 460 500 540
Wind 0 0 5 9 14 18 23 27 32 36 41 45 50 54 59 63 68 72 77 81
Total Capacity (MW) 295 315 335 355 375 375 395 415 435 455 495 515 535 555 595 615 655 675 715 755
System Surplus(+)/Deficit(-) with Unit Additions (MW) 2 7 11 15 18 0 2 2 1 0 17 13 8 2 14 5 14 2 9 13
Reserve Margin (%) 31% 33% 35% 36% 37% 30.2% 30.6% 30.6% 30.4% 29.9% 34.6% 33.4% 32.0% 30.4% 33.1% 31.0% 32.9% 30.5% 31.6% 32.3%

Caribbean Regional Electricity Generation, Interconnection, and Fuels Supply Strategy – Final Report A-114
Table A-120 Haiti Integrated Scenario Energy Balance
Year 2009 2010 2011 2012 2013 2014 2015 2016 2017 2018 2019 2020 2021 2022 2023 2024 2025 2026 2027 2028
Energy (GWh) 660 726 799 878 966 1,063 1,169 1,286 1,415 1,556 1,712 1,883 1,977 2,076 2,180 2,289 2,403 2,523 2,650 2,782
Exports(+)/Imports(-) (GWh) 0 0 0 0 0 0 0 0 0 0 0 0 0 0 0 0 0 0 0 0
Generation (GWh)
Varreau PAP EDH 67 69 70 71 73 63 62 76 79 82 81 84 83 83 80 80 78 79 78 76
Carrefour PAP EDH 48 49 49 50 51 45 44 54 56 58 57 60 59 59 56 57 55 56 55 54
Peligre PAP EDH 71 71 71 71 71 71 71 71 71 71 71 71 71 71 71 71 71 71 71 71
Varreau PAP Sogener IPPs 30 31 31 32 33 29 28 44 46 47 47 49 49 49 47 48 46 47 46 45
Carrefour PAP IPP 15 15 16 16 16 14 14 22 23 24 23 25 24 24 24 24 23 23 23 23
Thermal in Provinces 54 56 56 58 59 52 50 79 82 85 85 89 88 88 85 86 83 84 83 81
Hydro in Provinces 11 11 11 11 11 11 11 11 11 11 11 11 11 11 11 11 11 11 11 11
E-Power 75 77 77 79 81 70 68 76 78 81 80 83 81 81 78 78 76 77 75 74
Gov of Brazil 79 79 79 79 79 79 79 79 79 79 79 79 79 79 79 79 79 79 79 79
20 MW LSD 210 269 326 387 454 580 680 699 803 917 1065 1207 1293 1380 1486 1580 1692 1794 1915 2042
Wind 0 0 13 25 38 50 63 76 88 101 114 126 139 151 164 177 189 202 214 227
Total Generation (GWh) 660 726 799 878 966 1063 1169 1286 1415 1556 1712 1883 1977 2076 2180 2289 2403 2523 2650 2782
Table A-121 Haiti Integrated Scenario Cost Summary (Million 2009 US$)
Year 2009 2010 2011 2012 2013 2014 2015 2016 2017 2018 2019 2020 2021 2022 2023 2024 2025 2026 2027 2028Fuel and O&M Costs
Varreau PAP EDH 11.4 12.0 12.9 14.3 15.0 13.7 13.8 16.9 17.5 18.2 18.1 18.9 18.8 18.9 18.1 18.5 18.2 18.6 18.5 18.6Carrefour PAP EDH 8.1 8.5 9.1 10.1 10.6 9.7 9.7 12.0 12.4 12.8 12.8 13.3 13.3 13.3 12.8 13.1 12.9 13.2 13.1 13.1
Peligre PAP EDH 0.0 0.0 0.0 0.0 0.0 0.0 0.0 0.0 0.0 0.0 0.0 0.0 0.0 0.0 0.0 0.0 0.0 0.0 0.0 0.0Varreau PAP Sogener IPPs 6.6 6.9 7.4 8.2 8.6 7.9 8.0 12.1 12.6 13.1 13.1 13.7 13.7 13.9 13.3 13.6 13.4 13.7 13.6 13.7
Carrefour PAP IPP 3.3 3.5 3.7 4.1 4.3 4.0 4.0 6.1 6.3 6.6 6.5 6.9 6.9 6.9 6.7 6.8 6.7 6.9 6.8 6.8Thermal in Provinces 11.9 12.5 13.4 14.8 15.5 14.2 14.3 21.8 22.6 23.6 23.6 24.7 24.7 25.0 24.0 24.5 24.1 24.7 24.5 24.7
Hydro in Provinces 0.4 0.4 0.4 0.4 0.4 0.4 0.4 0.4 0.4 0.4 0.4 0.4 0.4 0.4 0.4 0.4 0.4 0.4 0.4 0.4E-Power 10.7 11.2 12.1 13.4 14.1 12.9 13.0 14.3 14.8 15.4 15.2 15.8 15.7 15.7 15.1 15.4 15.2 15.5 15.4 15.5
Gov of Brazil 1.2 1.2 1.2 1.2 1.2 1.2 1.2 1.2 1.2 1.2 1.2 1.2 1.2 1.2 1.2 1.2 1.2 1.2 1.2 1.220 MW LSD 28.5 37.4 48.4 62.5 75.1 68.6 77.7 78.3 87.8 98.6 112.9 123.6 128.1 135.1 144.4 154.9 167.5 178.7 192.3 206.3
Wind 0.0 0.0 0.1 0.3 0.4 0.6 0.7 0.9 1.0 1.1 1.3 1.4 1.6 1.7 1.8 2.0 2.1 2.3 2.4 2.6Production Cost (million $) 82 94 109 129 145 133 143 164 177 191 205 220 224 232 238 250 262 275 288 303
Investment Costs (million $) 38.4 9.6 15.23 15.23 15.23 5.625 15.23 15.23 15.23 15.23 24.83 15.23 15.23 15.23 24.83 15.23 24.83 15.23 24.83 24.83
Total System Costs (million $) 120 103 124 144 161 139 158 179 192 206 230 235 240 247 263 266 287 290 313 328

Caribbean Regional Electricity Generation, Interconnection, and Fuels Supply Strategy – Final Report A-115
Table A-122 Jamaica Integrated Scenario Capacity Balance
Year 2009 2010 2011 2012 2013 2014 2015 2016 2017 2018 2019 2020 2021 2022 2023 2024 2025 2026 2027 2028
Peak Load (MW) 680 707 736 767 799 832 867 904 943 983 1,026 1,071 1,116 1,165 1,214 1,267 1,322 1,379 1,439 1,502Exports(+)/Imports(-) (MW)
Existing Capacity (MW)Old Harbour 29 29 29 29 29 0 0 0 0 0 0 0 0 0 0 0 0 0 0 0Old Harbour 57 57 57 57 57 57 57 57 57 57 57 57 57 0 0 0 0 0 0 0Old Harbour 62 62 62 62 62 62 62 62 62 62 62 62 62 62 62 0 0 0 0 0Old Harbour 65 65 65 65 65 65 65 65 65 65 65 65 65 65 65 65 65 65 65 65
Hunts Bay 65 65 65 65 65 65 65 65 65 65 65 65 65 65 65 65 65 0 0 0Hunts Bay 21 21 21 21 21 21 21 21 21 21 21 21 21 21 21 21 21 21 21 21Hunts Bay 0 0 0 0 0 0 0 0 0 0 0 0 0 0 0 0 0 0 0 0
Rockfort 35 35 35 35 35 35 35 35 35 35 35 0 0 0 0 0 0 0 0 0Bogue 21 21 21 21 21 21 21 21 21 21 21 21 21 21 21 21 21 21 21 21Bogue 42 42 42 42 42 42 42 42 42 42 42 42 42 42 42 42 42 42 42 42Bogue 40 40 40 40 40 40 40 40 40 40 40 40 40 40 40 40 40 40 40 40Bogue 111 111 111 111 111 111 111 111 111 111 111 111 111 111 111 111 111 111 111 111
JEP Barge 1 74 74 74 74 74 74 74 74 74 74 74 74 74 74 74 74 74 74 74 74JEP Barge 2 50 50 50 50 50 50 50 50 50 50 50 50 50 50 50 50 50 50 50 50
JPPC Owned 60 60 60 60 60 60 60 60 60 60 60 60 60 60 60 60 60 60 60 60Jamalco 11 11 11 11 11 11 11 11 11 11 11 11 11 11 11 11 11 11 11 11Wigton 20 20 20 20 20 20 20 20 20 20 20 20 20 20 20 20 20 20 20 20Hydro 20 20 20 20 20 20 20 20 20 20 20 20 20 20 20 20 20 20 20 20
Total Existing (MW) 782 782 782 782 782 753 753 753 753 753 753 719 719 662 662 600 600 535 535 535
Required Capacity (MW) 850 884 921 959 998 1,039 1,083 1,130 1,179 1,229 1,282 1,338 1,396 1,456 1,518 1,583 1,652 1,724 1,799 1,877Existing System Surplus(+)/Deficit(-) (MW) -68 -103 -139 -177 -217 -286 -330 -377 -426 -476 -529 -620 -677 -795 -857 -984 -1,053 -1,190 -1,265 -1,343
New Capacity (MW)Kingston 68 68 68 68 68 68 68 68 68 68 68 68 68 68 68 68 68 68 68 68
Hunts Bay Petcoke 0 0 0 120 120 120 120 120 120 120 120 120 120 120 120 120 120 120 120 120Windalco 0 0 0 0 0 60 60 60 60 60 60 60 60 60 60 60 60 60 60 60Jamalco 0 85 85 85 85 85 85 85 85 85 85 85 85 85 85 85 85 85 85 85Wigton 0 6 12 18 18 18 18 18 18 18 18 18 18 18 18 18 18 18 18 18
50 MW GT 0 0 0 0 0 0 0 0 0 0 0 0 0 0 0 0 0 0 0 0100 MW CC 0 0 0 0 0 0 100 200 200 300 300 400 500 600 600 800 800 1,000 1,000 1,100
50 MW GT 0 0 0 0 0 0 0 0 0 0 0 0 0 0 0 0 0 0 0 0100 MW ConvCoal 0 0 0 0 0 0 0 0 0 0 0 0 0 0 0 0 0 0 0 0
Wind 0 0 15 27 39 51 63 75 87 99 111 123 135 147 159 171 183 195 207 219
Total Capacity (MW) 850 935 935 1,055 1,055 1,087 1,187 1,287 1,287 1,387 1,387 1,452 1,552 1,595 1,595 1,733 1,733 1,868 1,868 1,968
System Surplus(+)/Deficit(-) with Unit Additions (MW) 1 51 15 97 57 47 103 156 108 157 104 114 156 139 77 150 81 144 69 91
Reserve Margin (%) 25% 32% 27% 38% 32% 30.7% 36.9% 42.3% 36.4% 41.0% 35.2% 35.6% 39.0% 36.9% 31.3% 36.8% 31.1% 35.4% 29.8% 31.0%
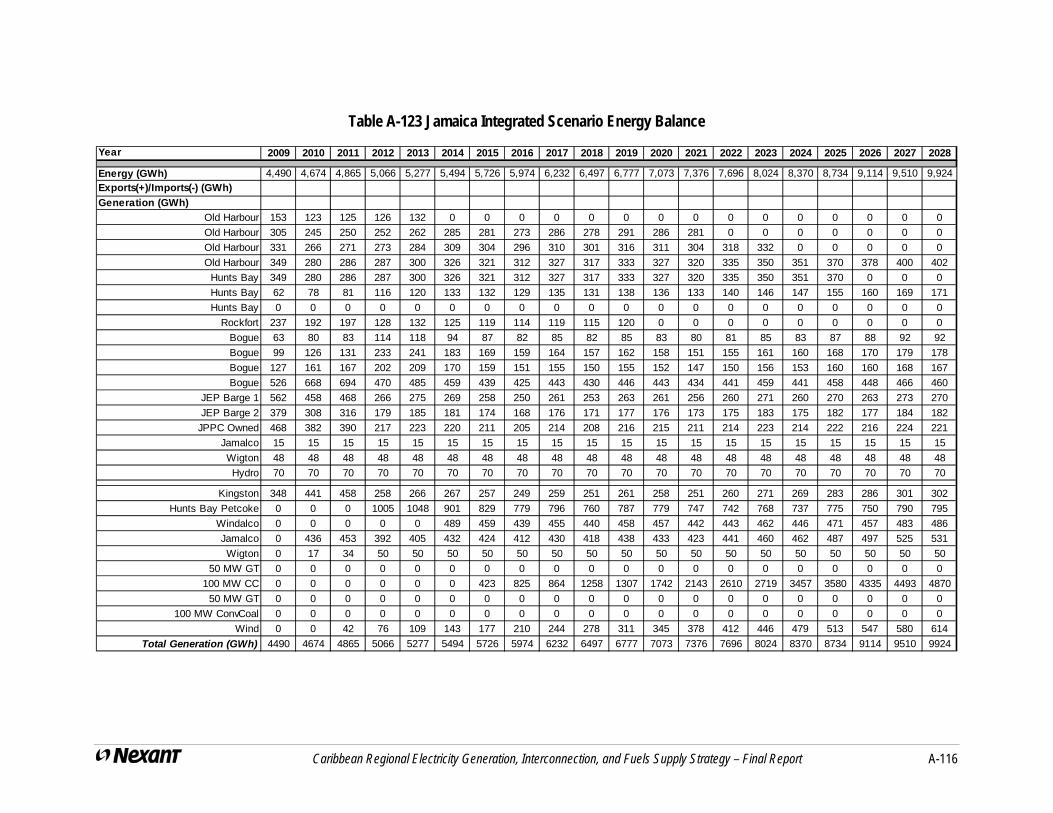
Caribbean Regional Electricity Generation, Interconnection, and Fuels Supply Strategy – Final Report A-116
Table A-123 Jamaica Integrated Scenario Energy Balance
Year 2009 2010 2011 2012 2013 2014 2015 2016 2017 2018 2019 2020 2021 2022 2023 2024 2025 2026 2027 2028
Energy (GWh) 4,490 4,674 4,865 5,066 5,277 5,494 5,726 5,974 6,232 6,497 6,777 7,073 7,376 7,696 8,024 8,370 8,734 9,114 9,510 9,924
Exports(+)/Imports(-) (GWh)
Generation (GWh)
Old Harbour 153 123 125 126 132 0 0 0 0 0 0 0 0 0 0 0 0 0 0 0
Old Harbour 305 245 250 252 262 285 281 273 286 278 291 286 281 0 0 0 0 0 0 0
Old Harbour 331 266 271 273 284 309 304 296 310 301 316 311 304 318 332 0 0 0 0 0
Old Harbour 349 280 286 287 300 326 321 312 327 317 333 327 320 335 350 351 370 378 400 402
Hunts Bay 349 280 286 287 300 326 321 312 327 317 333 327 320 335 350 351 370 0 0 0
Hunts Bay 62 78 81 116 120 133 132 129 135 131 138 136 133 140 146 147 155 160 169 171
Hunts Bay 0 0 0 0 0 0 0 0 0 0 0 0 0 0 0 0 0 0 0 0
Rockfort 237 192 197 128 132 125 119 114 119 115 120 0 0 0 0 0 0 0 0 0
Bogue 63 80 83 114 118 94 87 82 85 82 85 83 80 81 85 83 87 88 92 92
Bogue 99 126 131 233 241 183 169 159 164 157 162 158 151 155 161 160 168 170 179 178
Bogue 127 161 167 202 209 170 159 151 155 150 155 152 147 150 156 153 160 160 168 167
Bogue 526 668 694 470 485 459 439 425 443 430 446 443 434 441 459 441 458 448 466 460
JEP Barge 1 562 458 468 266 275 269 258 250 261 253 263 261 256 260 271 260 270 263 273 270
JEP Barge 2 379 308 316 179 185 181 174 168 176 171 177 176 173 175 183 175 182 177 184 182
JPPC Owned 468 382 390 217 223 220 211 205 214 208 216 215 211 214 223 214 222 216 224 221
Jamalco 15 15 15 15 15 15 15 15 15 15 15 15 15 15 15 15 15 15 15 15
Wigton 48 48 48 48 48 48 48 48 48 48 48 48 48 48 48 48 48 48 48 48
Hydro 70 70 70 70 70 70 70 70 70 70 70 70 70 70 70 70 70 70 70 70
Kingston 348 441 458 258 266 267 257 249 259 251 261 258 251 260 271 269 283 286 301 302
Hunts Bay Petcoke 0 0 0 1005 1048 901 829 779 796 760 787 779 747 742 768 737 775 750 790 795
Windalco 0 0 0 0 0 489 459 439 455 440 458 457 442 443 462 446 471 457 483 486
Jamalco 0 436 453 392 405 432 424 412 430 418 438 433 423 441 460 462 487 497 525 531
Wigton 0 17 34 50 50 50 50 50 50 50 50 50 50 50 50 50 50 50 50 50
50 MW GT 0 0 0 0 0 0 0 0 0 0 0 0 0 0 0 0 0 0 0 0
100 MW CC 0 0 0 0 0 0 423 825 864 1258 1307 1742 2143 2610 2719 3457 3580 4335 4493 4870
50 MW GT 0 0 0 0 0 0 0 0 0 0 0 0 0 0 0 0 0 0 0 0
100 MW ConvCoal 0 0 0 0 0 0 0 0 0 0 0 0 0 0 0 0 0 0 0 0
Wind 0 0 42 76 109 143 177 210 244 278 311 345 378 412 446 479 513 547 580 614
Total Generation (GWh) 4490 4674 4865 5066 5277 5494 5726 5974 6232 6497 6777 7073 7376 7696 8024 8370 8734 9114 9510 9924

Caribbean Regional Electricity Generation, Interconnection, and Fuels Supply Strategy – Final Report A-117
Table A-124 Jamaica Integrated Scenario Cost Summary (Million 2009 US$)
Year 2009 2010 2011 2012 2013 2014 2015 2016 2017 2018 2019 2020 2021 2022 2023 2024 2025 2026 2027 2028Fuel and O&M Costs
Old Harbour 19.4 25.2 28.1 31.2 33.9 0.0 0.0 0.0 0.0 0.0 0.0 0.0 0.0 0.0 0.0 0.0 0.0 0.0 0.0 0.0Old Harbour 38.8 50.3 55.9 62.2 67.5 76.8 78.0 76.6 80.5 78.5 82.8 81.1 80.3 0.0 0.0 0.0 0.0 0.0 0.0 0.0Old Harbour 42.0 54.5 60.6 67.4 73.2 83.3 84.6 83.1 87.3 85.1 89.7 87.9 87.0 91.7 95.5 0.0 0.0 0.0 0.0 0.0Old Harbour 44.3 57.4 63.9 71.0 77.1 87.7 89.1 87.5 91.9 89.7 94.5 92.6 91.7 96.6 100.6 101.8 108.2 111.5 119.7 122.3
Hunts Bay 44.3 57.4 63.9 71.0 77.1 87.7 89.1 87.5 91.9 89.7 94.5 92.6 91.7 96.6 100.6 101.8 108.2 0.0 0.0 0.0Hunts Bay 15.2 19.9 22.2 34.5 36.8 42.6 43.6 42.9 45.0 44.0 46.5 46.2 45.5 48.2 50.1 51.4 54.8 56.9 61.0 63.2Hunts Bay 0.0 0.0 0.0 0.0 0.0 0.0 0.0 0.0 0.0 0.0 0.0 0.0 0.0 0.0 0.0 0.0 0.0 0.0 0.0 0.0
Rockfort 22.7 29.3 32.5 23.7 25.5 16.5 14.7 13.6 13.7 13.1 13.4 0.0 0.0 0.0 0.0 0.0 0.0 0.0 0.0 0.0Bogue 15.2 19.9 22.2 33.2 35.3 17.0 14.7 13.3 13.2 12.5 12.7 12.0 11.1 11.3 11.7 11.8 12.5 12.8 13.6 13.7Bogue 28.0 36.6 40.8 79.3 84.4 39.1 33.6 30.2 29.9 28.3 28.8 27.1 25.0 25.4 26.2 26.6 28.4 29.1 31.1 31.5Bogue 28.3 36.9 41.2 54.5 58.0 28.6 24.9 22.5 22.5 21.3 21.7 20.6 19.1 19.4 20.0 20.1 21.4 21.7 23.1 23.2Bogue 79.6 103.8 115.7 86.3 91.4 53.5 47.8 44.1 44.6 42.5 43.4 41.8 39.5 39.8 41.1 40.4 42.6 42.3 44.5 44.6
JEP Barge 1 48.2 62.2 69.1 44.6 47.8 32.1 28.9 26.9 27.1 26.0 26.5 25.6 24.3 24.5 25.2 24.8 26.0 25.8 27.0 27.0JEP Barge 2 32.5 41.9 46.6 30.0 32.2 21.6 19.5 18.1 18.3 17.5 17.8 17.2 16.4 16.5 17.0 16.7 17.5 17.4 18.2 18.2
JPPC Owned 39.3 50.7 56.4 35.5 38.0 25.7 23.2 21.6 21.8 20.9 21.3 20.6 19.6 19.7 20.3 19.9 20.9 20.7 21.7 21.7Jamalco 0.5 0.5 0.5 0.5 0.5 0.5 0.5 0.5 0.5 0.5 0.5 0.5 0.5 0.5 0.5 0.5 0.5 0.5 0.5 0.5Wigton 0.9 0.9 0.9 0.9 0.9 0.9 0.9 0.9 0.9 0.9 0.9 0.9 0.9 0.9 0.9 0.9 0.9 0.9 0.9 0.9Hydro 1.1 1.1 1.1 1.1 1.1 1.1 1.1 1.1 1.1 1.1 1.1 1.1 1.1 1.1 1.1 1.1 1.1 1.1 1.1 1.1
Kingston 46.4 60.1 66.8 42.3 44.7 46.7 46.5 45.4 47.3 46.1 48.3 47.9 46.9 48.9 50.8 51.1 54.2 55.3 58.9 60.5Hunts Bay Petcoke 0.0 0.0 0.0 41.7 43.6 38.4 35.9 34.4 35.3 34.1 34.9 34.2 33.1 33.2 34.3 32.9 34.2 33.0 34.2 33.8
Windalco 0.0 0.0 0.0 0.0 0.0 20.1 18.8 17.9 18.4 17.7 18.1 17.8 17.2 17.2 17.8 17.0 17.7 17.0 17.7 17.4Jamalco 0.0 82.1 91.4 87.2 92.5 102.8 104.3 102.3 106.9 104.4 110.1 109.3 107.5 113.2 117.6 119.8 127.5 131.6 140.7 145.5Wigton 0.0 0.2 0.4 0.6 0.6 0.6 0.6 0.6 0.6 0.6 0.6 0.6 0.6 0.6 0.6 0.6 0.6 0.6 0.6 0.6
50 MW GT 0.0 0.0 0.0 0.0 0.0 0.0 0.0 0.0 0.0 0.0 0.0 0.0 0.0 0.0 0.0 0.0 0.0 0.0 0.0 0.0100 MW CC 0.0 0.0 0.0 0.0 0.0 0.0 40.7 75.9 76.8 110.2 112.4 145.0 172.2 207.9 214.4 279.5 293.4 361.8 379.8 417.1
50 MW GT 0.0 0.0 0.0 0.0 0.0 0.0 0.0 0.0 0.0 0.0 0.0 0.0 0.0 0.0 0.0 0.0 0.0 0.0 0.0 0.0100 MW ConvCoal 0.0 0.0 0.0 0.0 0.0 0.0 0.0 0.0 0.0 0.0 0.0 0.0 0.0 0.0 0.0 0.0 0.0 0.0 0.0 0.0
Wind 0.0 0.0 0.5 0.9 1.2 1.6 2.0 2.4 2.7 3.1 3.5 3.9 4.3 4.6 5.0 5.4 5.8 6.1 6.5 6.9Production Cost (million $) 547 791 880 900 963 825 843 849 878 888 924 926 935 918 951 924 976 946 1,001 1,050
Investment Costs (million $) 0 96.75 26.25 286.5 15 147 120 120 15 120 15 120 120 120 15 225 15 225 15 120
Total System Costs (million $) 547 887 907 1,186 978 972 963 969 893 1,008 939 1,046 1,055 1,038 966 1,149 991 1,171 1,016 1,170

Caribbean Regional Electricity Generation, Interconnection, and Fuels Supply Strategy – Final Report A-118
Table A-125 St. Kitts Integrated Scenario Capacity Balance
Year 2009 2010 2011 2012 2013 2014 2015 2016 2017 2018 2019 2020 2021 2022 2023 2024 2025 2026 2027 2028
Peak Load (MW) 29 30 31 32 33 35 36 37 38 40 41 43 44 46 47 49 51 52 54 56Exports(+)/Imports(-) (MW) -10 -10 -10 -10 -10 -10 -10 -29 -29 -29 -29 -29 -29 -29 -29 -29 -29 -29
Existing Capacity (MW)Station A 6 6 6 6 6 6 6 6 6 6 6 6 6 6 6 6 6 6 6 6Station A 8 8 8 8 8 8 8 8 8 8 8 8 8 8 8 8 8 8 8 8Station B 9 9 9 9 9 9 9 9 9 9 9 9 9 9 9 9 9 9 9 9Station C 7 7 7 7 7 7 7 7 7 7 7 7 7 7 7 7 7 7 7 7Station C 4 4 4 4 4 4 4 4 4 4 4 4 4 4 4 4 4 4 4 4
New Units 8 8 8 8 8 8 8 8 8 8 8 8 8 8 8 8 8 8 8 8
Total Existing (MW) 42 42 42 42 42 42 42 42 42 42 42 42 42 42 42 42 42 42 42 42
Required Capacity (MW) 39 41 32 34 35 37 39 40 42 25 26 28 30 33 35 37 39 42 44 47Existing System Surplus(+)/Deficit(-) (MW) 2 1 9 8 6 5 3 1 -1 17 15 13 11 9 7 5 2 0 -3 -5
New Capacity (MW)5 MW MSD 0 0 0 0 0 0 0 0 0 0 0 0 0 0 0 0 0 0 5 5
Wind 0 0 0 0 0 0 0 0 0 0 0 0 0 0 0 0 0 0 0 0
Total Capacity (MW) 42 42 42 42 42 42 42 42 42 42 42 42 42 42 42 42 42 42 47 47
System Surplus(+)/Deficit(-) with Unit Additions (MW) 2 1 9 8 6 5 3 1 -1 17 15 13 11 9 7 5 2 0 2 0
Reserve Margin (%) 43% 38% 94% 84% 75% 67.0% 59.2% 51.8% 44.9% 288.0% 243.0% 206.3% 175.7% 149.9% 127.8% 108.7% 92.0% 77.3% 84.1% 71.2%

Caribbean Regional Electricity Generation, Interconnection, and Fuels Supply Strategy – Final Report A-119
Table A-126 St. Kitts Integrated Scenario Energy Balance
Year 2009 2010 2011 2012 2013 2014 2015 2016 2017 2018 2019 2020 2021 2022 2023 2024 2025 2026 2027 2028
Energy (GWh) 161 166 171 175 180 186 191 196 202 208 214 220 226 233 239 246 253 261 268 276
Exports(+)/Imports(-) (GWh) -68 -68 -68 -68 -68 -68 -68 -203 -203 -203 -203 -203 -203 -203 -203 -203 -203 -203
Generation (GWh)
Station A 24 25 16 16 17 18 19 19 20 1 2 3 4 5 6 7 8 9 9 10
Station A 32 32 20 21 22 23 24 25 26 1 2 3 5 6 7 9 10 11 11 13
Station B 33 34 21 22 23 24 25 26 28 1 2 4 5 6 8 9 10 12 12 13
Station C 27 28 17 18 19 20 21 22 23 1 2 3 4 5 6 7 8 10 10 11
Station C 13 14 8 9 9 10 10 11 11 0 1 1 2 2 3 4 4 5 5 5
New Units 32 33 20 21 22 23 24 26 27 1 2 3 5 6 7 9 10 11 11 13
5 MW MSD 0 0 0 0 0 0 0 0 0 0 0 0 0 0 0 0 0 0 7 8
Wind 0 0 0 0 0 0 0 0 0 0 0 0 0 0 0 0 0 0 0 0
Total Generation (GWh) 161 166 103 108 113 118 123 129 134 5 11 17 23 30 37 43 51 58 65 73
Table A-127 St. Kitts Integrated Scenario Cost Summary (Million 2009 US$)
Year 2009 2010 2011 2012 2013 2014 2015 2016 2017 2018 2019 2020 2021 2022 2023 2024 2025 2026 2027 2028Fuel and O&M Costs
Station A 3.4 3.6 2.5 2.8 3.0 3.3 3.5 3.7 3.9 0.4 0.5 0.7 0.9 1.1 1.2 1.4 1.7 1.9 1.9 2.2Station A 4.4 4.7 3.2 3.7 3.9 4.3 4.6 4.8 5.0 0.5 0.7 0.9 1.1 1.4 1.6 1.9 2.2 2.4 2.5 2.8Station B 4.9 5.2 3.6 4.1 4.4 4.7 5.1 5.4 5.6 0.5 0.7 1.0 1.2 1.5 1.8 2.1 2.4 2.7 2.8 3.1Station C 4.0 4.3 2.9 3.3 3.6 3.9 4.2 4.4 4.6 0.4 0.6 0.8 1.0 1.2 1.5 1.7 2.0 2.2 2.3 2.6Station C 2.0 2.1 1.4 1.6 1.7 1.9 2.0 2.1 2.2 0.2 0.3 0.4 0.5 0.6 0.7 0.8 1.0 1.1 1.1 1.2
5 MW MSD 0.0 0.0 0.0 0.0 0.0 0.0 0.0 0.0 0.0 0.0 0.0 0.0 0.0 0.0 0.0 0.0 0.0 0.0 1.6 1.8Wind 0.0 0.0 0.0 0.0 0.0 0.0 0.0 0.0 0.0 0.0 0.0 0.0 0.0 0.0 0.0 0.0 0.0 0.0 0.0 0.0
Production Cost (million $) 23 25 17 19 21 22 24 25 26 2 4 5 6 7 8 10 11 13 15 16
Investment Costs (million $) 0 0 0 0 0 0 0 0 0 0 0 0 0 0 0 0 0 0 2.25 0
Total System Costs (million $) 23 25 17 19 21 22 24 25 26 2 4 5 6 7 8 10 11 13 17 16

Caribbean Regional Electricity Generation, Interconnection, and Fuels Supply Strategy – Final Report A-120
Table A-128 Nevis Integrated Scenario Capacity Balance
Year 2009 2010 2011 2012 2013 2014 2015 2016 2017 2018 2019 2020 2021 2022 2023 2024 2025 2026 2027 2028
Peak Load (MW) 10 10 11 11 12 13 13 14 15 16 17 18 19 20 21 23 24 25 27 29Exports(+)/Imports(-) (MW) 10 10 10 410 410 410 410 430 430 430 430 430 430 430 430 430 430 430
Existing Capacity (MW)#2 & #3 2 2 2 2 2 2 2 2 2 2 2 2 2 2 2 2 2 2 2 2
#4, #6 4 4 4 4 4 4 4 4 4 4 4 4 4 4 4 4 4 4 4 4#5, #7 5 5 5 5 5 5 5 5 5 5 5 5 5 5 5 5 5 5 5 5
#8 3 3 3 3 3 3 3 3 3 3 3 3 3 3 3 3 3 3 3 3
Total Existing (MW) 14 14 14 14 14 14 14 14 14 14 14 14 14 14 14 14 14 14 14 14
Required Capacity (MW) 13 14 24 25 26 427 428 429 430 451 452 453 455 456 458 459 461 463 465 467Existing System Surplus(+)/Deficit(-) (MW) 1 0 -11 -11 -12 -413 -414 -415 -416 -437 -438 -439 -441 -442 -444 -446 -447 -449 -451 -453
New Capacity (MW)5 MW MSD 0 0 0 0 0 0 0 0 0 0 0 0 5 5 5 10 10 10 15 15Geo 20 MW 0 0 20 20 20 20 20 20 20 40 40 40 40 40 40 40 40 40 40 40
Geo 100 MW 0 0 0 0 0 400 400 400 400 400 400 400 400 400 400 400 400 400 400 400Wind 0 0 0 0 0 0 0 0 0 0 0 0 0 0 0 0 0 0 0 0
Total Capacity (MW) 14 14 34 34 34 434 434 434 434 454 454 454 459 459 459 464 464 464 469 469
System Surplus(+)/Deficit(-) with Unit Additions (MW) 1 0 9 9 8 7 6 5 4 3 2 1 4 3 1 4 3 1 4 2
Reserve Margin (%) 46% 38% 64% 59% 54% 2.7% 2.5% 2.3% 2.1% 1.8% 1.6% 1.3% 2.2% 1.9% 1.7% 2.5% 2.2% 1.9% 2.6% 2.3%
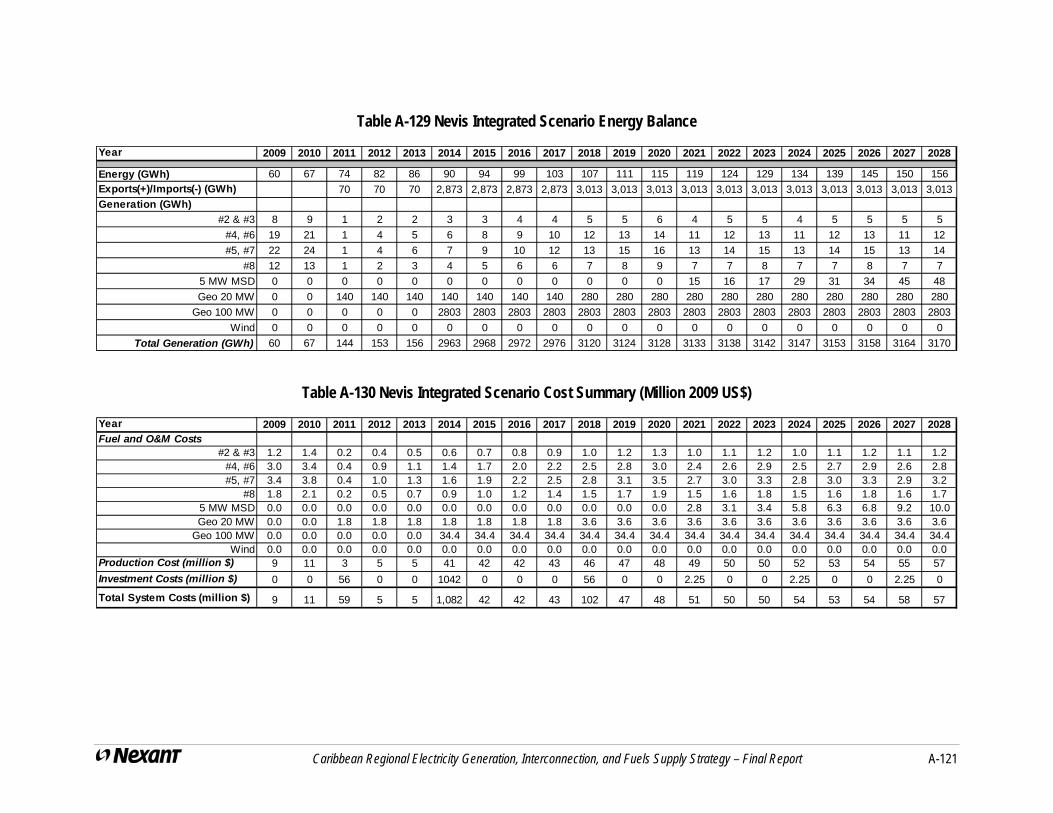
Caribbean Regional Electricity Generation, Interconnection, and Fuels Supply Strategy – Final Report A-121
Table A-129 Nevis Integrated Scenario Energy Balance
Year 2009 2010 2011 2012 2013 2014 2015 2016 2017 2018 2019 2020 2021 2022 2023 2024 2025 2026 2027 2028
Energy (GWh) 60 67 74 82 86 90 94 99 103 107 111 115 119 124 129 134 139 145 150 156
Exports(+)/Imports(-) (GWh) 70 70 70 2,873 2,873 2,873 2,873 3,013 3,013 3,013 3,013 3,013 3,013 3,013 3,013 3,013 3,013 3,013
Generation (GWh)
#2 & #3 8 9 1 2 2 3 3 4 4 5 5 6 4 5 5 4 5 5 5 5
#4, #6 19 21 1 4 5 6 8 9 10 12 13 14 11 12 13 11 12 13 11 12
#5, #7 22 24 1 4 6 7 9 10 12 13 15 16 13 14 15 13 14 15 13 14
#8 12 13 1 2 3 4 5 6 6 7 8 9 7 7 8 7 7 8 7 7
5 MW MSD 0 0 0 0 0 0 0 0 0 0 0 0 15 16 17 29 31 34 45 48
Geo 20 MW 0 0 140 140 140 140 140 140 140 280 280 280 280 280 280 280 280 280 280 280
Geo 100 MW 0 0 0 0 0 2803 2803 2803 2803 2803 2803 2803 2803 2803 2803 2803 2803 2803 2803 2803
Wind 0 0 0 0 0 0 0 0 0 0 0 0 0 0 0 0 0 0 0 0
Total Generation (GWh) 60 67 144 153 156 2963 2968 2972 2976 3120 3124 3128 3133 3138 3142 3147 3153 3158 3164 3170
Table A-130 Nevis Integrated Scenario Cost Summary (Million 2009 US$)
Year 2009 2010 2011 2012 2013 2014 2015 2016 2017 2018 2019 2020 2021 2022 2023 2024 2025 2026 2027 2028Fuel and O&M Costs
#2 & #3 1.2 1.4 0.2 0.4 0.5 0.6 0.7 0.8 0.9 1.0 1.2 1.3 1.0 1.1 1.2 1.0 1.1 1.2 1.1 1.2#4, #6 3.0 3.4 0.4 0.9 1.1 1.4 1.7 2.0 2.2 2.5 2.8 3.0 2.4 2.6 2.9 2.5 2.7 2.9 2.6 2.8#5, #7 3.4 3.8 0.4 1.0 1.3 1.6 1.9 2.2 2.5 2.8 3.1 3.5 2.7 3.0 3.3 2.8 3.0 3.3 2.9 3.2
#8 1.8 2.1 0.2 0.5 0.7 0.9 1.0 1.2 1.4 1.5 1.7 1.9 1.5 1.6 1.8 1.5 1.6 1.8 1.6 1.75 MW MSD 0.0 0.0 0.0 0.0 0.0 0.0 0.0 0.0 0.0 0.0 0.0 0.0 2.8 3.1 3.4 5.8 6.3 6.8 9.2 10.0Geo 20 MW 0.0 0.0 1.8 1.8 1.8 1.8 1.8 1.8 1.8 3.6 3.6 3.6 3.6 3.6 3.6 3.6 3.6 3.6 3.6 3.6
Geo 100 MW 0.0 0.0 0.0 0.0 0.0 34.4 34.4 34.4 34.4 34.4 34.4 34.4 34.4 34.4 34.4 34.4 34.4 34.4 34.4 34.4Wind 0.0 0.0 0.0 0.0 0.0 0.0 0.0 0.0 0.0 0.0 0.0 0.0 0.0 0.0 0.0 0.0 0.0 0.0 0.0 0.0
Production Cost (million $) 9 11 3 5 5 41 42 42 43 46 47 48 49 50 50 52 53 54 55 57
Investment Costs (million $) 0 0 56 0 0 1042 0 0 0 56 0 0 2.25 0 0 2.25 0 0 2.25 0
Total System Costs (million $) 9 11 59 5 5 1,082 42 42 43 102 47 48 51 50 50 54 53 54 58 57

Caribbean Regional Electricity Generation, Interconnection, and Fuels Supply Strategy – Final Report A-122
Table A-131 St. Lucia Integrated Scenario Capacity Balance
Year 2009 2010 2011 2012 2013 2014 2015 2016 2017 2018 2019 2020 2021 2022 2023 2024 2025 2026 2027 2028
Peak Load (MW) 56 58 61 63 65 68 70 73 76 79 82 85 88 91 95 98 102 106 110 114Exports(+)/Imports(-) (MW)
Existing Capacity (MW)Cul de Sac 12 12 12 12 12 12 12 12 12 12 12 12 12 12 12 12 12 12 12 12Cul de Sac 6 6 6 6 6 6 6 6 6 6 6 6 6 6 6 6 6 6 6 6Cul de Sac 37 37 37 37 37 37 37 37 37 37 37 37 37 37 37 37 37 37 37 37Cul de Sac 21 21 21 21 21 21 21 21 21 21 21 21 21 21 21 21 21 21 21 21
Rooftop solar 0.1 0.1 0.1 0.1 0.1 0.1 0.1 0.1 0.1 0.1 0.1 0.1 0.1 0.1 0.1 0.1 0.1 0.1 0.1 0.1
Total Existing (MW) 76 76 76 76 76 76 76 76 76 76 76 76 76 76 76 76 76 76 76 76
Required Capacity (MW) 76 79 82 85 88 91 95 98 102 106 110 114 119 123 128 133 138 143 148 154Existing System Surplus(+)/Deficit(-) (MW) 0 -2 -5 -9 -12 -15 -19 -22 -26 -30 -34 -38 -42 -47 -52 -56 -62 -67 -72 -78
New Capacity (MW)20 MW LSD 0 0 0 0 0 0 0 0 0 0 0 0 0 0 0 0 0 0 0 020 MW LSD 0 20 20 20 20 20 20 40 40 40 40 40 60 60 60 60 80 80 80 80
Wind 0 0 0 2 3 5 6 8 9 9 11 12 12 14 14 15 15 17 17 18
Total Capacity (MW) 76 96 96 96 96 96 96 116 116 116 116 116 136 136 136 136 156 156 156 156
System Surplus(+)/Deficit(-) with Unit Additions (MW) 0 18 15 11 8 5 1 18 14 10 6 2 18 13 8 4 18 13 8 2
Reserve Margin (%) 35.7% 65.0% 59.0% 53.2% 47.6% 42.2% 36.9% 59.4% 53.5% 47.9% 42.5% 37.3% 55.0% 49.3% 43.9% 38.6% 53.1% 47.5% 42.1% 36.9%

Caribbean Regional Electricity Generation, Interconnection, and Fuels Supply Strategy – Final Report A-123
Table A-132 St. Lucia Integrated Scenario Energy Balance
Year 2009 2010 2011 2012 2013 2014 2015 2016 2017 2018 2019 2020 2021 2022 2023 2024 2025 2026 2027 2028
Energy (GWh) 345 356 367 378 390 402 415 428 442 455 470 484 500 515 531 548 565 583 601 620
Exports(+)/Imports(-) (GWh)
Generation (GWh)
Cul de Sac 53 42 43 44 45 46 47 39 40 41 42 43 37 38 39 40 36 37 38 39
Cul de Sac 28 22 23 23 24 24 25 20 21 21 22 22 19 20 21 21 19 19 20 20
Cul de Sac 169 133 137 140 143 146 149 123 125 130 133 136 118 120 125 128 114 117 121 124
Cul de Sac 94 74 76 78 79 81 82 68 69 72 73 75 65 67 69 71 63 65 67 69
Rooftop solar 0.1 0.1 0.1 0.1 0.1 0.1 0.1 0.1 0.1 0.1 0.1 0.1 0.1 0.1 0.1 0.1 0.1 0.1 0.1 0.1
20 MW LSD 0 0 0 0 0 0 0 0 0 0 0 0 0 0 0 0 0 0 0 0
20 MW LSD 0 85 87 89 91 93 95 157 161 166 170 174 227 232 240 246 292 299 309 318
Wind 0 0 0 4 8 13 17 21 25 25 29 34 34 38 38 42 42 46 46 50
Total Generation (GWh) 345 356 367 378 390 402 415 428 442 455 470 484 500 515 531 548 565 583 601 620
Table A-133 St. Lucia Integrated Scenario Cost Summary (Million 2009 US$)
Year 2009 2010 2011 2012 2013 2014 2015 2016 2017 2018 2019 2020 2021 2022 2023 2024 2025 2026 2027 2028Fuel and O&M Costs
Cul de Sac 8.0 6.5 7.2 8.0 8.4 4.7 4.8 4.0 4.1 4.3 4.4 4.4 3.8 3.9 4.0 4.2 3.8 4.0 4.2 4.3Cul de Sac 4.2 3.4 3.8 4.2 4.4 2.5 2.5 2.1 2.2 2.3 2.3 2.3 2.0 2.1 2.1 2.2 2.0 2.1 2.2 2.3Cul de Sac 24.7 20.3 22.3 24.8 26.0 14.6 14.9 12.5 12.8 13.3 13.7 13.7 11.8 12.1 12.5 13.0 11.9 12.4 12.9 13.4Cul de Sac 13.7 11.2 12.4 13.8 14.4 8.1 8.3 6.9 7.1 7.4 7.6 7.6 6.6 6.7 6.9 7.2 6.6 6.9 7.2 7.4
Rooftop solar 0.0 0.0 0.0 0.0 0.0 0.0 0.0 0.0 0.0 0.0 0.0 0.0 0.0 0.0 0.0 0.0 0.0 0.0 0.0 0.020 MW LSD 0.0 0.0 0.0 0.0 0.0 0.0 0.0 0.0 0.0 0.0 0.0 0.0 0.0 0.0 0.0 0.0 0.0 0.0 0.0 0.020 MW LSD 0.0 11.4 12.5 13.9 14.6 8.2 8.4 14.0 14.4 14.9 15.3 15.4 19.9 20.4 21.0 21.9 26.8 27.8 29.0 30.0
Wind 0.0 0.0 0.0 0.0 0.1 0.1 0.2 0.2 0.3 0.3 0.3 0.4 0.4 0.4 0.4 0.5 0.5 0.5 0.5 0.6Production Cost (million $) 51 53 58 65 68 38 39 40 41 42 44 44 45 46 47 49 52 54 56 58
Investment Costs (million $) 0.0 9.6 0.0 1.9 1.9 1.9 1.9 11.5 1.9 0.0 1.9 1.9 9.6 1.9 0.0 1.9 9.6 1.9 0.0 1.9
Total System Costs (million $) 51 62 58 67 70 40 41 51 43 42 45 46 54 47 47 51 61 56 56 60

Caribbean Regional Electricity Generation, Interconnection, and Fuels Supply Strategy – Final Report A-124
Table A-134 St. Vincent and Grenadines Integrated Scenario Capacity Balance
Year 2009 2010 2011 2012 2013 2014 2015 2016 2017 2018 2019 2020 2021 2022 2023 2024 2025 2026 2027 2028
Peak Load (MW) 27 28 30 32 35 37 40 42 45 48 52 55 59 63 68 72 77 83 88 94Exports(+)/Imports(-) (MW)
Existing Capacity (MW)St. Vincent 12 12 12 12 12 12 12 12 12 12 12 12 12 12 12 12 12 12 12 12St. Vincent 3 3 3 3 3 3 3 3 3 3 3 3 3 3 3 3 3 3 3 3
Lowmans Bay 35 35 35 35 35 35 35 35 35 35 35 35 35 35 35 35 35 35 35 35Bequia 3 3 3 3 3 3 3 3 3 3 3 3 3 3 3 3 3 3 3 3
Union Island 2.5 2.5 2.5 2.5 2.5 2.5 2.5 2.5 2.5 2.5 2.5 2.5 2.5 2.5 2.5 2.5 2.5 2.5 2.5 2.5Canouan 3 3 3 3 3 3 3 3 3 3 3 3 3 3 3 3 3 3 3 3Mayreay 0 0 0 0 0 0 0 0 0 0 0 0 0 0 0 0 0 0 0 0
Total Existing (MW) 58 58 58 58 58 58 58 58 58 58 58 58 58 58 58 58 58 58 58 58
Required Capacity (MW) 36 38 41 44 47 50 53 57 61 65 70 75 80 85 91 98 104 111 119 127Existing System Surplus(+)/Deficit(-) (MW) 22 20 17 14 11 8 5 1 -3 -7 -12 -17 -22 -27 -33 -39 -46 -53 -61 -69
New Capacity (MW)10 MW MSD 0 0 0 0 0 0 0 0 0 0 0 0 0 0 0 0 0 0 0 010 MW CFB 0 0 0 0 0 0 0 0 10 10 20 20 30 30 40 40 50 60 70 70
Wind 0 0 2 2 3 3 5 5 6 6 8 8 9 9 11 11 12 12 14 14
Total Capacity (MW) 58 58 58 58 58 58 58 58 68 68 78 78 88 88 98 98 108 118 128 128
System Surplus(+)/Deficit(-) with Unit Additions (MW) 22 20 17 14 11 8 5 1 7 3 8 3 8 3 7 1 4 7 9 1
Reserve Margin (%) 118.8% 104.7% 91.5% 79.1% 67.5% 56.7% 46.6% 37.1% 50.3% 40.6% 50.9% 41.1% 48.9% 39.3% 45.1% 35.7% 39.9% 43.0% 45.1% 35.7%

Caribbean Regional Electricity Generation, Interconnection, and Fuels Supply Strategy – Final Report A-125
Table A-135 St. Vincent and Grenadines Integrated Scenario Energy Balance
Year 2009 2010 2011 2012 2013 2014 2015 2016 2017 2018 2019 2020 2021 2022 2023 2024 2025 2026 2027 2028
Energy (GWh) 156 167 178 191 204 218 233 249 266 284 304 325 348 372 397 425 454 485 519 555
Exports(+)/Imports(-) (GWh)
Generation (GWh)
St. Vincent 31 33 35 37 39 42 44 48 40 43 37 40 35 37 34 36 32 30 28 38
St. Vincent 7 7 7 7 7 7 7 7 7 7 7 7 7 7 7 7 7 7 7 7
Lowmans Bay 98 105 110 118 124 133 140 151 128 137 119 126 111 118 107 112 102 96 89 114
Bequia 7 7 8 8 9 9 10 11 9 10 8 9 8 8 8 8 7 7 6 9
Union Island 6 6 6 7 7 8 8 9 8 8 7 7 7 7 6 7 6 6 5 8
Canouan 7 8 8 9 9 10 11 11 10 10 9 9 8 9 8 8 8 7 7 9
Mayreay 0 0 0 0 0 0 1 1 0 1 0 0 0 0 0 0 0 0 0 1
10 MW MSD 0 0 0 0 0 0 0 0 0 0 0 0 0 0 0 0 0 0 0 0
10 MW CFB 0 0 0 0 0 0 0 0 47 53 96 106 146 160 198 217 258 299 339 332
Wind 0 0 4 4 8 8 13 13 17 17 21 21 25 25 29 29 34 34 38 38
Total Generation (GWh) 156 167 178 191 204 218 233 249 266 284 304 325 348 372 397 425 454 485 519 555
Table A-136 St. Vincent and Grenadines Integrated Scenario Cost Summary (Million 2009 US$)
Year 2009 2010 2011 2012 2013 2014 2015 2016 2017 2018 2019 2020 2021 2022 2023 2024 2025 2026 2027 2028Fuel and O&M Costs
St. Vincent 4.7 5.2 5.7 6.7 7.2 8.0 8.7 9.4 8.1 8.6 7.6 8.0 7.2 7.7 7.0 7.4 6.9 6.5 6.2 8.4St. Vincent 0.2 0.2 0.2 0.2 0.2 0.2 0.2 0.2 0.2 0.2 0.2 0.2 0.2 0.2 0.2 0.2 0.2 0.2 0.2 0.2
Lowmans Bay 14.1 15.4 17.2 20.0 21.4 23.9 25.9 28.0 24.1 25.7 22.6 24.0 21.5 22.9 20.8 22.1 20.5 19.4 18.4 23.7Bequia 1.1 1.2 1.4 1.6 1.7 1.9 2.0 2.2 1.9 2.0 1.8 1.9 1.7 1.8 1.6 1.7 1.6 1.5 1.5 2.1
Union Island 1.0 1.1 1.2 1.4 1.5 1.7 1.8 1.9 1.7 1.8 1.6 1.7 1.5 1.6 1.4 1.5 1.4 1.3 1.3 1.9Canouan 1.2 1.3 1.5 1.7 1.8 2.0 2.2 2.4 2.0 2.2 1.9 2.0 1.8 1.9 1.8 1.9 1.7 1.6 1.6 2.2Mayreay 0.1 0.1 0.1 0.1 0.1 0.1 0.1 0.1 0.1 0.1 0.1 0.1 0.1 0.1 0.1 0.1 0.1 0.1 0.1 0.2
10 MW MSD 0.0 0.0 0.0 0.0 0.0 0.0 0.0 0.0 0.0 0.0 0.0 0.0 0.0 0.0 0.0 0.0 0.0 0.0 0.0 0.010 MW CFB 0.0 0.0 0.0 0.0 0.0 0.0 0.0 0.0 6.9 7.3 12.9 13.7 18.5 19.7 23.8 25.3 29.3 33.3 36.8 35.1
Wind 0.0 0.0 0.0 0.0 0.1 0.1 0.1 0.1 0.2 0.2 0.2 0.2 0.3 0.3 0.3 0.3 0.4 0.4 0.4 0.4Production Cost (million $) 22 25 27 32 34 38 41 44 45 48 49 52 53 56 57 61 62 64 66 74
Investment Costs (million $) 0 0 1.875 0 1.875 0 1.875 0 27.38 0 27.38 0 27.38 0 27.38 0 27.38 25.5 27.38 0
Total System Costs (million $) 22 25 29 32 36 38 43 44 73 48 76 52 80 56 85 61 90 90 94 74

Caribbean Regional Electricity Generation, Interconnection, and Fuels Supply Strategy – Final Report A-126
Table A-137 Integrated Scenario Production Cost Summary (Million 2009 US$)
Year 2009 2010 2011 2012 2013 2014 2015 2016 2017 2018 2019 2020 2021 2022 2023 2024 2025 2026 2027 2028
Antigua and Barbuda 48 49 52 72 73 77 82 85 88 91 94 93 96 99 97 100 103 106 109 113
Barbados 163 188 202 223 234 102 105 108 112 116 120 120 120 123 125 132 139 145 150 157
Dominica 13 13 15 3 4 25 26 26 27 28 28 29 30 31 31 32 33 34 35 36
Dominican Republic 1,149 1,458 1,578 1,567 1,653 1,749 1,669 1,736 1,670 1,732 1,680 1,726 1,787 1,769 1,824 1,811 1,881 1,873 1,945 1,945
Grenada 32 35 39 43 34 49 51 51 53 55 55 56 59 59 61 61 64 64 66 74
Haiti 82 94 109 129 145 133 143 164 177 191 205 220 224 232 238 250 262 275 288 303
Jamaica 547 791 880 900 963 825 843 849 878 888 924 926 935 918 951 924 976 946 1,001 1,050
St. Kitts 23 25 17 19 21 22 24 25 26 2 4 5 6 7 8 10 11 13 15 16
Nevis 9 11 3 5 5 41 42 42 43 46 47 48 49 50 50 52 53 54 55 57
St. Lucia 51 53 58 65 68 38 39 40 41 42 44 44 45 46 47 49 52 54 56 58
St. Vincent and Grenadines 22 25 27 32 34 38 41 44 45 48 49 52 53 56 57 61 62 64 66 74
Fuel Savings (exports) 0 0 0 0 0 -611 -627 -632 -635 -634 -638 -634 -637 -642 -641 -649 -656 -663 -673 -684
Total 2,139 2,740 2,980 3,058 3,234 2,488 2,437 2,541 2,525 2,605 2,610 2,685 2,766 2,747 2,849 2,834 2,980 2,965 3,114 3,200
Table A-138 Integrated Scenario Investment Cost Summary (Million 2009 US$)
Year 2009 2010 2011 2012 2013 2014 2015 2016 2017 2018 2019 2020 2021 2022 2023 2024 2025 2026 2027 2028 Salvage Value
Antigua and Barbuda 0 0 5 8 8 4 0 0 0 0 2 26 0 0 27 0 0 26 2 0 77
Barbados 0 0 14 14 7 4 4 4 4 4 4 11 4 11 11 11 4 13 13 4 88
Dominica 0 0 0 56 0 643 0 0 0 0 0 0 0 0 0 0 0 0 0 0 369
Dominican Republic 0 385 150 790 38 38 648 38 670 38 648 38 38 660 38 638 38 638 38 638 4,389
Grenada 0 0 0 4 27 0 2 26 0 2 26 2 0 26 2 26 0 27 0 26 147
Haiti 38 10 15 15 15 6 15 15 15 15 25 15 15 15 25 15 25 15 25 25 211
Jamaica 0 97 26 287 15 147 120 120 15 120 15 120 120 120 15 225 15 225 15 120 1,351
St. Kitts 0 0 0 0 0 0 0 0 0 0 0 0 0 0 0 0 0 0 2 0 2
Nevis 0 0 56 0 0 1,042 0 0 0 56 0 0 2 0 0 2 0 0 2 0 623
St. Lucia 0 10 0 2 2 2 2 11 2 0 2 2 10 2 0 2 10 2 0 2 35
St. Vincent and Grenadines 0 0 2 0 2 0 2 0 27 0 27 0 27 0 27 0 27 26 27 0 158
Interconnection Costs 0 0 18 2 2 1,105 28 28 28 28 28 28 28 28 28 28 28 28 28 28 559
Total 38 501 287 1,178 116 2,989 820 242 761 263 776 241 244 862 173 946 146 999 153 842 8,009

Caribbean Regional Electricity Generation, Interconnection, and Fuels Supply Strategy – Final Report A-127
Table A-139 Integrated Scenario Interconnection Cost Summary (Million 2009 US$)
Year 2009 2010 2011 2012 2013 2014 2015 2016 2017 2018 2019 2020 2021 2022 2023 2024 2025 2026 2027 2028 Salvage Value
Dominica - Martinique & Dominica - Guadeloupe 119 4 4 4 4 4 4 4 4 4 4 4 4 4 4 59
Nevis - Puerto Rico 734 17 17 17 17 17 17 17 17 17 17 17 17 17 17 367
Nevis - St. Kitts 18 2 2 2 2 2 2 2 2 2 2 2 2 2 2 2 2 2 7
Total 0 0 18 2 2 854 23 23 23 23 23 23 23 23 23 23 23 23 23 23 434

Caribbean Regional Electricity Generation, Interconnection, and Fuels Supply Strategy – Final Report B-1
Attachment B Submarine Power Cable Reliability
B.1 INTRODUCTION
For many years submarine cables were simply laid unprotected on the seabed and the geotechnical aspects of their installation were largely limited to identifying potential hazards such as:
Areas subject to submarine landslides.
Freespans between rocky outcrops in combination with strong sea bottom currents, which could cause metal (sheath and armor) fatigue due to vortex shedding.
Areas of seismic activity.
As the fishing industry moved into deeper and deeper waters the incidence of cable failures increased significantly as evidenced by a survey of submarine cable failures carried out by CIGRE and published in 1986. The results of this survey can be summarized as follows:
All submarine cable types > 18 kV were included in the survey
Global failure rate was 0.32 failures/ year / 100 km cable
Failure rate due to cable defects was ~ 0.05 failures / year / 100 km cable
Failure rate due to third party mechanical damage was ~ 0.27 failures / year / 100 km cable
This high incidence of cable failures due to third party marine activities led to widespread use of cable burial in the seabed as a means of providing the necessary protection against such activities. The effectiveness of cable burial in significantly reducing failures due to third party damage is well proven by experience though the absence of global failure statistics makes it difficult to quantify the benefit as far as power cables are concerned. In this context published failure data for submarine telecommunication cables is relevant. Shapiro states that failure rates of telecommunication rates fell from 0.37 failures / year / 100 km (1959 -1979) to 0.04 failures / year / 100 km after 1985 due to burial of existing and new cable systems. It is interesting to note the close correspondence of these failure data with the 1986 CIGRE survey results for power cables.1
B.2 SELECTION OF BURIAL DEPTH
The major threat to submarine cables is generally that of fishing activities although in certain areas and in particular in shallow water, anchoring may also pose a potential hazard. Fishing activities, which pose a threat, include trawling by either beam or otter boards. These types of fishing gear do not penetrate the seabed to any great extent and fairly shallow burial (~ 2 feet) will generally provide adequate protection. A more aggressive type of fishing gear is used in shellfish dredging. Fishing gear designed for this type of fishing either engages the seabed or 1 CIGRE Technical Brochure No. 379 which is an update of the 1986 report has just been published. A copy has
been ordered.

Caribbean Regional Electricity Generation, Interconnection, and Fuels Supply Strategy – Final Report B-2
disturbs it with water jetting to chase the fish into the nets. In general 3 feet burial depth should be necessary to protect against this type of fishing.
Much more dangerous is stow net fishing, which is found in shallow waters with high currents. The fishing vessel anchors and the fish are carried into the nets by the current. The anchors required are, therefore, much larger than normal for the vessel size necessitating deeper cable burial. In one reported case 4m (13 feet) burial was required.
Indicative burial depths for protection against anchoring are as follows:
Anchor Mass 0.2 tons: 0.50 m (1.6 feet)
Anchor Mass 0.5 tons: 0.75 m (2.5 feet)
Anchor Mass 1.0 tons: 1.20 m (4.0 feet)
Anchor Mass 15.0 tons: 4.00 m (13.1 feet)
Anchor Mass 30.0 tons: 5.00 m (16.4 feet)
It is, however, clear that the nature of the seabed sediment plays an important part in deciding the level of protection afforded by a given burial depth. Figure B-1 provides an indication of the resistance of various soil types to penetration of anchors and fishing gear. The data, which are based on submarine telecommunication cable experience with typical seabed sediment types are presented in terms of a Burial Protection Index (BPI). A BPI of unity corresponds to good protection against beam and otter trawls.
Figure B-1 The Relative Protection Against Third Party Marine Activities Afforded by Several Typical Seabed Sediment Types
A BPI higher than unity is obviously justified where there is a significant risk due to anchoring or aggressive types of fishing activities.

Caribbean Regional Electricity Generation, Interconnection, and Fuels Supply Strategy – Final Report B-3
Typical power cable burial depths are 3 - 6 feet in sandy soils and deeper in soft soils. Burial is typically carried out at the shore ends and down to water depths of ~300 – 400 feet.
Table B-1 provides some examples of submarine cable projects where cable protection has been provided by burial in the seabed.
Table B-1 Burial Depths and Burial Equipment Used in Some Important Submarine Cable Projects
Project Details
Date
Max. Water Depth (feet)
Burial Depth (feet) and Burial Equipment Used
Langkawi Island, Malaysia 132 kV SCFF Cable
1986
65
5
Water-jetting South Padre Island, USA 138 kV XLPE Cable
1991
5
4
Water- jetting NYPA Long Island USA 345 kV SCFF Cable
1991
130
5 – 11
Water-jetting Skagerrak 3 (N to DK) 350 kVDC MI Cable
1992
1640
2 – 5
Water-jetting Penang Island, Malaysia 275 kV SCFF Cable
1996
50
8 – 12
hydroplow Spain – Morocco 400 kV SCFF Cable
1997
2020
3 – 11
Water-jetting Shikoku Island (J) 500 kVDC SCFF Cable
1999
250
11
Hydroplow Moyle - Scotland to N. Ireland 250 kVDC MI Cable
2001
N/A
3
Water-jetting Italy – Greece 400 kVDC MI Cable
2002
3300
3
(to 500 feet water depth at both shore ends)
Water-jetting
Telecommunication cables are now being routinely buried in the seabed at depths in the range of 3 to 10 feet and it is common practice to bury cables down to 3000 feet water depth.
B.3 BURIAL EQUIPMENT
Several types of burial equipment are available including the following:

Caribbean Regional Electricity Generation, Interconnection, and Fuels Supply Strategy – Final Report B-4
Static plow
Static plow with water jets (jet-plow)
Water-jetting machine
Suction pumps (vacuum, air- and water-lift pumps)
Cutting chain machine
Cutting wheel machine
Mechanical disintegrators
The jet plow and the water-jetting machine are now the preferred types of equipment for power cable burial in relatively soft seabed sediment e.g. sand and soft to medium hard clay.
B.3.1 The Jet Plow
The working principle for the Hydroplow (Figure B-2) is to fluidize the seabed materials in a narrow path and to a predetermined depth without displacing the majority of the material or causing turbidity in the surrounding waters beyond 5m (16.4 ft). The method has been positively proven to place fiber optic cables and power cables at a consistent required burial depth in sand and clay bottom conditions. The HydroPlow is towed by a support vessel with dynamic positioning or on a barge using mooring anchors. The fluidizing effect provides relatively low and controlled towing forces. The burial depth is typically around 8 ft.
Figure B-2 Prysmian’s Hydroplow III
B.3.2 The Water-Jetting ROV
The water-jetting ROV (Figure B-3) combines the effect of fluidizing the seabed and hydrodynamic transport of the fluidized material. In the front, low-pressure water jets are used to fluidize the seabed. The fluidized material is transported backwards utilizing other jetting nozzles. The cable or pipeline sinks by its own weight into the trench before the fluidized material is allowed to settle and start the back-filling process.

Caribbean Regional Electricity Generation, Interconnection, and Fuels Supply Strategy – Final Report B-5
Nexans Capjet systems have been in operation since 1978 and have been used to install many hundreds of km of telecommunication and power cables. Different versions are available for fiber optic cables, power cables and pipeline burial. There are various ejector modules to handle the different seabed sediment types encountered and high pressure or rock cutting systems.
Figure B-3 Nexans Capjet 650 ROV B.4 CABLE BURIAL ASSESSMENT
B.4.1 Simultaneous Lay and Burial
Simultaneous lay and burial using the static plow is the preferred option for (telecommunications) cable burial since it combines the advantages of immediate protection with reliability and minimum seabed sediment disturbance. The prediction of plow performance depends on a knowledge of the geotechnical characteristics of the seabed concerned. In the first place it is necessary to know whether the sediment is cohesive or non-cohesive. If the sediment is cohesive reasonable estimates of plow performance can be made based on the undrained shear strength. Non cohesive sediments e.g. fine silty sands can be surprisingly difficult to plow due a high effective shear strength caused by the development of pore “suctions” as the sand dilates. The problem of pore suction has been largely solved by the introduction of the jet-plow.
Until recently the main burial assessment tool (BAS) was a scaled down version of the static plow, the data from which could be correlated directly with the full sized plow performance.

Caribbean Regional Electricity Generation, Interconnection, and Fuels Supply Strategy – Final Report B-6
The disadvantage of the technique is that it requires to be operated from a relatively large cable laying vessel with a large A frame and high pull capability which are not compatible with the normal survey vessel type.
In consequence there has been a trend away from BAS tools to the use of the mini cone penetration tester (MCPT). MCPT devices have been developed to provide high quality in-situ geo-technical data in real time to depths of up to 6m below the seafloor. MCPT testing involves the insertion of a metal rod with a conical end piece into the seabed at a fixed rate. The equipment monitors the resistance of the sediment to the passage of the cone tip and the frictional force on the sleeve of the rod. The MCPT provides useful data on the friction ratio and on the un-drained shear strength of clays and on the density of sands and is now widely used in burial assessments.
As indicated above the first step in the interpretation of MCPT data is to determine the soil type. Some progress has been made in this context by Robertson and Campanella, who have shown that the soil type is a function of the cone resistance and the friction ratio. Clays can be distinguished from sands and various sand types can also be recognized. In the case of clays good empirical correlation can be established in terms of depth, speed and tow tension between the MCPT results and the plow performance. Correlation with sand types is more difficult as detailed above. However, as a rule of thumb it can be said that the jet-plow can be expected to operate successfully in sediments with un-drained shear strengths up to ~ 100 kPa.
The disadvantage of the MCPT in common with all sampling processes is that the entire cable route cannot be covered. For this reason Cable and Wireless Global Marine have developed “C-Bass”. This is a towed sledge device incorporating a CPT and geotechnical equipment designed to permit extrapolation of data between CPT locations. At this stage data correlation with plow performance is still largely empirical but progress is being made in the direction of a more direct correlation.
B.4.2 Post Lay Burial
In order to match the performance of the static and jet-plows, post lay water jetting has also been developed over the last few years. The main development trend has been the introduction of more powerful ROVs (neutral buoyancy or tracked vehicles) with burial capability up to 3m (13 feet). The increase in power has permitted faster and deeper burial and also burial in harder sediments. Until a few years ago jetting to a depth of 1m (3 feet) was limited to sediments having an un-drained shear strength of ~ 40 kPa. Greater power now available permits burial in sediments with un-drained shear strengths up to ~ 100 kPa equaling the performance of the jet-plow.
B.5 NOTE ON SEABED DISTURBANCE
Prysmian’s experience using the Hydroplow burial equipment can be summarized as follows:
Monitoring of the seabed disturbance has never been requested or carried out.
The disturbance to be expected is (of course) related to the nature of the seabed sediment, but in general one can expect the removal of ~30% of the section of the trench created by the stinger. The trench is normally in the range 1-2 ft. wide and up

Caribbean Regional Electricity Generation, Interconnection, and Fuels Supply Strategy – Final Report B-7
to 10 ft deep. Taking the 2 ft. width trench, the quantity of sediment removed from the trench would be as follows:
2.4 cubic feet per linear foot of trench for 4 ft. cover
3.6 cubic feet per linear foot of trench for 6 ft. cover
4.8 cubic feet per linear foot of trench for 8 ft. cover
During the passage of the plow the trench will collapse or not depending on the nature of the seabed sediment. In the case of clay there is no immediate collapse. Sand and silt will collapse almost immediately.
Most of the displaced (or side-cast) material forms along both sides of the trench and gradually disappears over a period of time which depends on the nature of the material and the seabed currents. A depression in the center of the trench can persist for a long period of time.
Nexans experience with their Capjet 50 ROV is that the water-jetting method gives a narrow partly back-filled trench. The percentage of backfill will normally vary from 30 to 90 %, dependant on the current and the sediment type. Natural action by sea current will complete the back-filling over a period of time.
The conclusion from the above experience summaries is that disturbance of the seabed is identical for the two burial techniques. The essential difference between the two techniques is that one is post-lay burial (water-jetting machine)2 and the other permits simultaneous lay and burial (Hydroplow).
B.6 ALTERNATIVE METHODS OF PROTECTION
Alternative protection methods such as covering the submarine cables with concrete mattresses or rock dumping can also be considered, but these are generally only used in special circumstances where burial is difficult such as inadequate soft sediment depth, a rocky seabed or at pipeline or cable-crossing locations.
B.6.1 Concrete Mattresses
2 This refers to the normal mode of operation. Water-jetting ROV’s can also be configured for simultaneous lay and
burial operation.

Caribbean Regional Electricity Generation, Interconnection, and Fuels Supply Strategy – Final Report B-8
Figure B-4 Flexible Concrete Mattresses
Flexible concrete mattresses were introduced in the early 1990s and have been used to provide protection for numerous pipeline, cable and umbilicals. They consist of high strength concrete segments which are linked together with a network of high-strength polypropylene rope. This structure gives a high degree of flexibility. Installation is relatively simple when carried out with the quick release frame shown in Figure B-4. They are considered suitable for HV submarine cable protection by the industry and the writer is not aware of any drawbacks associated with their use.
B.6.2 Rock Dumping
Rock dumping has been used extensively for protection of pipelines and cables. Relatively large volumes of selected rocks are placed over exposed subsea cables by a specially constructed vessel which is equipped with a flexible and retractable fallpipe which can be deployed in water depths in the order of 800 -1000 m (2500 – 3300 ft). At the end of the fallpipe is a heavy dury ROV which is suspended above the cable (see Figure 5). Horizontal thrusters on the ROV are used to control the placement of the rocks.

Caribbean Regional Electricity Generation, Interconnection, and Fuels Supply Strategy – Final Report B-9
Figure B-5 Rock Dumping in Progress
B.6.3 Split Cast Iron Pipes
Split cast-iron pipes have been placed around the cable by divers (see Figure B-6) to provide protection in relatively shallow waters and generally near landfall in areas which are either rocky or otherwise unsuitable for water-jetting or jet-plowing.
Figure B-6 Split Cast-Iron Pipes

Caribbean Regional Electricity Generation, Interconnection, and Fuels Supply Strategy – Final Report B-10
B.6.4 Uraduct
Uraduct is another industry accepted protection system for submarine power cables. It consists of cylindrical half shells of a tough polyurethane which overlap and interlock around the cable. The half shells are secured using corrosion resistant banding located in recessed grooves to provide a smooth external profile (see Figure B-7).
Although Uraduct can be used instead of cast-iron shells, it is frequently used at cable or pipeline crossings to provide separation and thermal insulation.
Figure B-7 Uraduct Protected Cable Being Installed
B.7 CONCLUSIONS
A well planned and executed submarine power cable project which takes full account of the route conditions and provides appropriate cable protection against third party damages can provide a high availability during the design life which is generally accepted to be a minimum of 40 years.

Caribbean Regional Electricity Generation, Interconnection, and Fuels Supply Strategy – Final Report C-1
Attachment C Submarine Power Cable Repair Procedures
C.1 GENERAL
It is recommended that the Owner together with the O&M Contractor, which can also be the submarine cable supplier, develop a repair strategy based on local repair facilities to ensure that any in-service failure of the submarine cable can be located and repaired within an agreed target repair time. In this Report target repair times have been worked out on the assumption that the Contractor is alerted and the fault pre-located by in-station equipment on Day 1, that a suitable repair vessel is available, and that spare cable and repair splices are stored by the Owner and available for use. The impact of unfavorable weather conditions on the target repair schedule has not been taken into account.
The repair procedures described in the remaining sections of this Report are intended to provide the Owner with guidelines which will be helpful in the development of a Failure Response Plan.
C.2 REPAIR ACTIVITIES
A typical submarine cable repair operation will normally involve the following sequence of activities:
Verify that a fault actually exists on the cable. Review relay targets, Megger, etc.
Owner alerts the O&M Contractor and all relevant third parties and authorities as detailed in the Failure Response Plan to assure that all necessary permits are in place and all notifications to third parties are issued prior to initiating the repair works.
Final precise fault location is carried out using Electroding equipment. This equipment applies a low frequency tone to the cable and a small surface vessel equipped with a magnetic field detector is used to pinpoint the fault. The vessel spread is provided locally and the Electroding equipment is part of the stand-by repair equipment. Final fault location can also be carried out from the repair vessel when it arrives on site but this is not the preferred approach.
The repair vessel is selected from among those pre-approved and listed in the Failure Response Plan and rigged with all necessary cable handling equipment at its home port.
Mobilization of the support spread including diver support vessel and mooring anchor placement tugboats and crew boat.
The repair spread proceeds to the warehouse location where loading out of spare cable and spare splices and all necessary repair tools is carried out and then continues on to the failure location.
On arrival at the failure location the cable de-buried (if necessary), cut, recovered and tested.
Cable splicing (two splices per repair). Also, optical fiber cable splicing (if required).
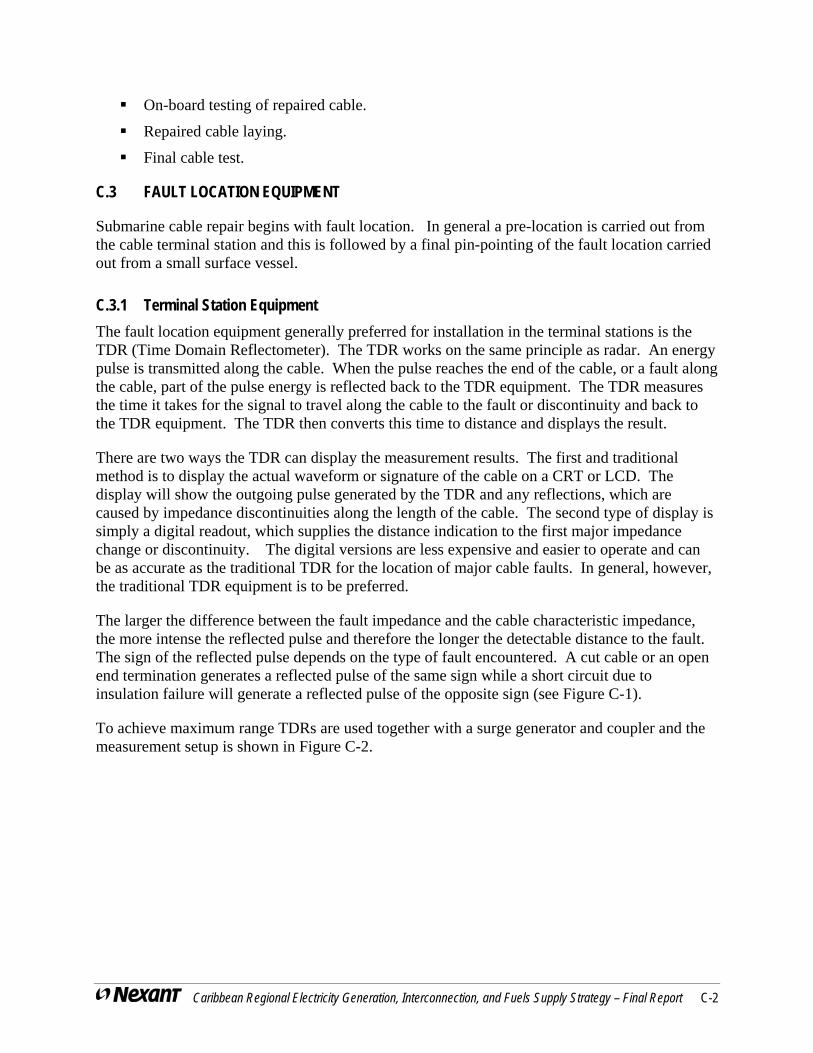
Caribbean Regional Electricity Generation, Interconnection, and Fuels Supply Strategy – Final Report C-2
On-board testing of repaired cable.
Repaired cable laying.
Final cable test.
C.3 FAULT LOCATION EQUIPMENT
Submarine cable repair begins with fault location. In general a pre-location is carried out from the cable terminal station and this is followed by a final pin-pointing of the fault location carried out from a small surface vessel.
C.3.1 Terminal Station Equipment
The fault location equipment generally preferred for installation in the terminal stations is the TDR (Time Domain Reflectometer). The TDR works on the same principle as radar. An energy pulse is transmitted along the cable. When the pulse reaches the end of the cable, or a fault along the cable, part of the pulse energy is reflected back to the TDR equipment. The TDR measures the time it takes for the signal to travel along the cable to the fault or discontinuity and back to the TDR equipment. The TDR then converts this time to distance and displays the result.
There are two ways the TDR can display the measurement results. The first and traditional method is to display the actual waveform or signature of the cable on a CRT or LCD. The display will show the outgoing pulse generated by the TDR and any reflections, which are caused by impedance discontinuities along the length of the cable. The second type of display is simply a digital readout, which supplies the distance indication to the first major impedance change or discontinuity. The digital versions are less expensive and easier to operate and can be as accurate as the traditional TDR for the location of major cable faults. In general, however, the traditional TDR equipment is to be preferred.
The larger the difference between the fault impedance and the cable characteristic impedance, the more intense the reflected pulse and therefore the longer the detectable distance to the fault. The sign of the reflected pulse depends on the type of fault encountered. A cut cable or an open end termination generates a reflected pulse of the same sign while a short circuit due to insulation failure will generate a reflected pulse of the opposite sign (see Figure C-1).
To achieve maximum range TDRs are used together with a surge generator and coupler and the measurement setup is shown in Figure C-2.

Caribbean Regional Electricity Generation, Interconnection, and Fuels Supply Strategy – Final Report C-3
Figure C-1 CRT Trace Showing Two Types of Reflected Pulse
Figure C-2 TDR Measuring Setup Diagram
“Thumping” (applying high energy pulses using the equipment shown in Figure C-2) the cable may be necessary to achieve a sufficiently low fault impedance for TDR fault location to work well. The presence of salt water will probably reduce the need for thumping compared with a cable installed underground.
The precision of the TDR fault location measurement can be in the order of plus/minus 1% of the measured distance which for a 30 mile long cable link would be in the order of plus/minus 1,500 ft.
Cable Dynamics TDR 1170 manufactured by Hipotronics is considered to have suitable characteristics for long distance submarine cable fault location. This instrument requires a high

Caribbean Regional Electricity Generation, Interconnection, and Fuels Supply Strategy – Final Report C-4
voltage coupler to interface with a cable fault locator (thumper) and has a specified maximum range of ~ 30 miles.
OTDR (optical time domain reflectometry) which uses high intensity laser light instead of electrical energy is similar to TDR and can be also be used in the event that the optical fibers (integral or bundled with the power cable) are also damaged as a result of cable failure. In theory, the accuracy should be better than that achievable with TDR provided that the refractive index of the fiber is known accurately. In practice, however, the expected accuracy is generally little better than plus/minus 1%.
Despite the (probable) limited accuracy of these techniques it is recommended that both TDR and OTDR equipment are included in the stand-by equipment available at the terminal stations.
The latest innovation in the field of TDR fault location in power lines is the “Faulsat” TDR system developed by the Viscas Corporation (Fujikura Ltd.). This is an online fault detection system, which is claimed to give highly accurate fault location in real time. Sensors placed at both end of the cable line detect the pulses generated by the failure itself. The high accuracy is achieved by using nanosecond timing pulses from GPS satellites to synchronize crystal oscillator clocks at the cable terminations Figure C-3). Claimed accuracy in tests carried out on the Tachibana Bay 500 kV DC submarine cable (50 km in length) was 15 m (~50 feet).
The Faulsat can be used for both underground and overhead transmission lines and to date 60 units have already been sold to Japanese Utilities. A quotation, if required, can be obtained from Yoshiaki Sato ([email protected]).
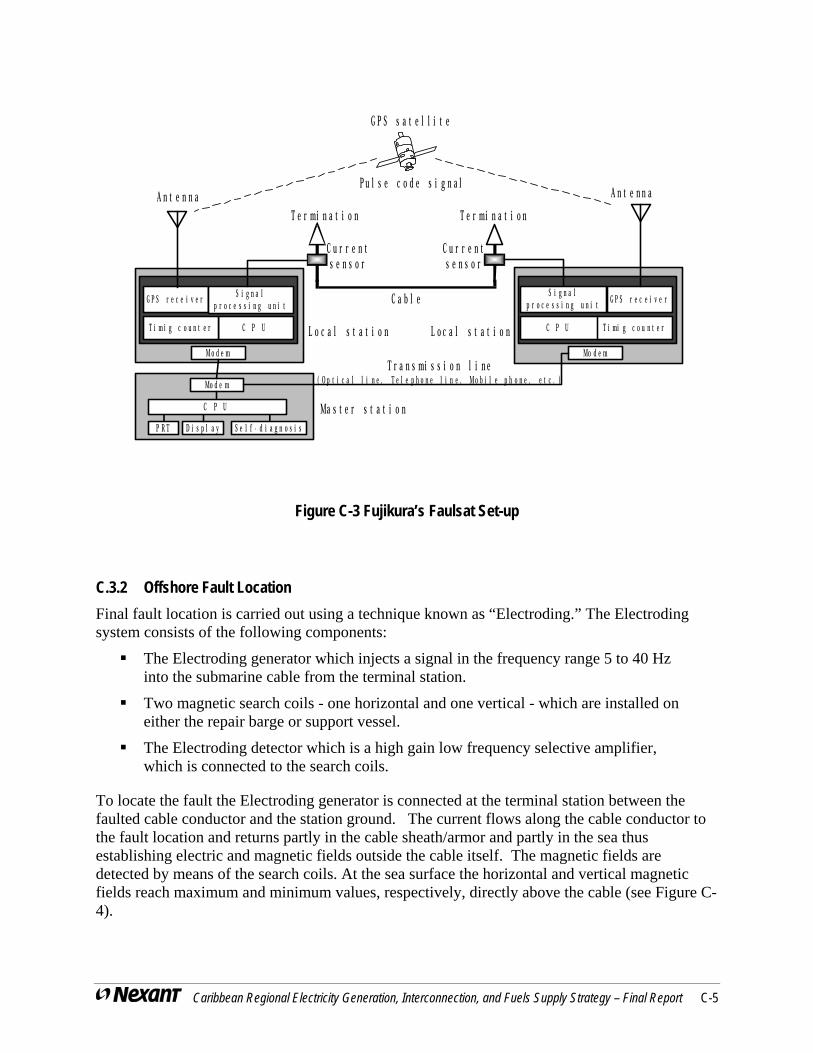
Caribbean Regional Electricity Generation, Interconnection, and Fuels Supply Strategy – Final Report C-5
P R T D i s p l a y
G P S s a t e l l i t e
P u l s e c o d e s i g n a l
C u r r e n ts e n s o r
T e r mi n a t i o n
C a b l e
T e r mi n a t i o n
T r a n s mi s s i o n l i n e( O p t i c a l l i n e , T e l e p h o n e l i n e , M o b i l e p h o n e , e t c . )
Ma s t e r s t a t i o n
G P S r e c e i v e r S i g n a lp r o c e s s i n g u n i t
C P U
Mo d e m
A n t e n n a
Mo d e m
A n t e n n a
Mo d e m
S e l f - d i a g n o s i s
L o c a l s t a t i o n L o c a l s t a t i o n
C P U
C u r r e n ts e n s o r
T i m i g c o u n t e r
G P S r e c e i v e rS i g n a lp r o c e s s i n g u n i t
C P U T i mi g c o u n t e r
Figure C-3 Fujikura’s Faulsat Set-up
C.3.2 Offshore Fault Location
Final fault location is carried out using a technique known as “Electroding.” The Electroding system consists of the following components:
The Electroding generator which injects a signal in the frequency range 5 to 40 Hz into the submarine cable from the terminal station.
Two magnetic search coils - one horizontal and one vertical - which are installed on either the repair barge or support vessel.
The Electroding detector which is a high gain low frequency selective amplifier, which is connected to the search coils.
To locate the fault the Electroding generator is connected at the terminal station between the faulted cable conductor and the station ground. The current flows along the cable conductor to the fault location and returns partly in the cable sheath/armor and partly in the sea thus establishing electric and magnetic fields outside the cable itself. The magnetic fields are detected by means of the search coils. At the sea surface the horizontal and vertical magnetic fields reach maximum and minimum values, respectively, directly above the cable (see Figure C-4).

Caribbean Regional Electricity Generation, Interconnection, and Fuels Supply Strategy – Final Report C-6
Figure C-4 Variation of the H and V Magnetic Fields with Distance from a Faulted Submarine Cable
Determination of these maximum and minimum fields enables the position of the cable to be located. Once the cable signal has been detected the surface vessel follows the cable on a zig-zag course until the signal disappears. When this happens the fault or break has been located. Additional runs are performed to obtain a more precise fix on the failure location.
The accuracy of this technique depends on the specifics and the nature of the failure itself as well as the environment at the failure location. However, for relatively shallow water (50-60 feet) fault location the accuracy should be in the order of plus/minus 10 feet.
Suppliers of suitable equipment include Innovatum Inc. “Ultra Models 44” and TSS “TSS 350”. The equipment is expensive but can also be rented for use during repair operations.
C.3.3 Proposed Fault Location Equipment for System Maintenance
It is proposed that the following fault location equipment be made available for the submarine cable system O&M :
Two TDRs with associated “thumpers” and HV couplers (one set at each terminal station).
Two OTDRs (one set at each terminal station).
One Electroding System with AC generator or arrangements made for the rental of such.

Caribbean Regional Electricity Generation, Interconnection, and Fuels Supply Strategy – Final Report C-7
One TDR and one OTDR should also be provided as spares.
It is also recommended that TDR and OTDR “footprints” of the as-built cable system be made during system commissioning. A knowledge of the precise location of features such as factory splices and optical fiber splices could be of significant important for improving the precision of the fault location measurements.
C.4 REPAIR SPREAD AND EQUIPMENT
It is recommended that the repair spread be based on a shallow draft barge having a deck area in the order of 200 ft. x 60 ft. A list of local marine construction companies owning suitable barges should be included in the O&M Manual. Support vessels will necessarily include the following:
An auxiliary barge for mooring anchor handling and placement (if necessary).
A diver vessel used for diver support and mooring anchor positioning.
Two tugboats for assisting the barges and supporting anchoring and moving operations.
A crew boat for transport of crew members and cable repair staff.
The repair barge will be the rigged with the following equipment:
DGPS equipment.
Cable handling/coiling equipment
Cable laying equipment (incl. 2 linear tensioning machines, 2 roller ways, 2 laying sheaves).
Crane or A frame for laying of the final cable bight.
Four winches for the mooring anchor system.
Spare cable in a cable basket - around 200 ft, of spare cable will be needed for a limited cable damage repair. Alternatively, two motorized cable reels, one for the spare cable and one for the scrap cable can be used.
Repair equipment (incl. splicing tent, splicing tools HV test set).
C.5 TYPICAL REPSIR PROCEDURE
The first operation is location of the position of the fault using the TDR/OTDR and Electroding techniques described in Section 3.0 of the present Report. At the same time the repair barge is selected.
The repair barge is rigged with cable handling equipment at its home port, proceeds to the spare cable storage facility for loading of the required spare cable and splices.
The repair spread will then sail towards the fault location where the repair barge will be moored.

Caribbean Regional Electricity Generation, Interconnection, and Fuels Supply Strategy – Final Report C-8
The cable will then be unburied (by divers or ROVs depending on the water depth) using water-jetting equipment, suction hoses or air-lift pumps. Note that it is normally necessary to expose and remove a length of at least 100 to 150 ft. The divers will then clamp each end of the exposed cable length and proceed to cut the cable. The cut cable length will be saved for failure analysis.
The first cable end will then be recovered and an additional length cut away and the cable core and optical fibers subjected to HV and OTDR tests, respectively, to assure that the remaining cable length is damage free. The cable end is then capped and re-laid on the seabed with a buoy attached to facilitate the subsequent cable recovery operation.
The repair barge will then move towards the second cable end, which will be recovered, cut back and tested in exactly the same way as the first end to assure freedom from damage.
The cable end will then be spliced to the length of spare cable.
Following completion of the first splice, the repair barge will move to recover the remaining cable end paying out spare cable on the way.
The buoyed cable end is then recovered and the second splicing and final HV and OTDR testing operations will proceed. Once completed the repair barge will move in a direction perpendicular to the cable route in order to lay the cable bight. When the apex of the bight clears the linear tensioning engines the cable is installed on a 180o roller sector, lifted over the barge and lowered to the seabed as the repair barge continues to move in a direction perpendicular to the cable route.
Once the roller sector has been recovered the cable bight can be re-buried using water jetting or other agreed means such as concrete mattresses or rock dumping and the cable subjected to final HV and OTDR testing.
Finally, it should be noted that at the end of the repair operations an extra cable length of approximately twice the water depth has been added to the cable.
C.6 TYPICAL SUBMARINE CABLE REPAIR PROGRAM
The following schedule of repair activities assumes that the cable repair contractor has been alerted and the pre-location of the fault carried out by the terminal station personnel. In addition it is assumed that the barge suppliers have been identified and that they are familiar with the cable repair equipment and requirements.

Caribbean Regional Electricity Generation, Interconnection, and Fuels Supply Strategy – Final Report C-9
Table C-1 Schedule for Submarine Cable Repair Program
Repair Activity Number of Days per
Activity Cumulative Days
Mobilization of the repair spread. 14 14
Loading of spare cable and transfer to fault location.
3 17
Final fault location check and repair barge mooring.
0.5 17.5
Cable de-burial. 2 17.5
Cable cutting and first end recovery. 0.5 18
Fault clearance, testing and re-laying of first end.
3 21
Second end recovery. 0.5 21.5
Fault clearance, testing. 2.5 24
First splicing operation and testing. 3 27
Spare cable lay and recovery of first cable end.
1 28
Second Splicing operation and testing. 3 31
Lay of final bight and final test. 1 32
Cable re-burial. 2 34
Final testing. 1 35
TOTAL ESTIMATED REPAIR TIME 35 days
It should be noted that the repair time is critically dependent on the availability of a suitable repair barge, which cannot, of course, be guaranteed. In addition, no account has been taken of the possibility that difficult weather conditions might cause delays. Availability of good weather forecasting before and during the repair operations is vital to avoid, as far as possible, difficulties due to adverse weather conditions.
C.7 COST OF SUBMARINE CABLE REPAIRS
From the foregoing descriptions of all of the activities required to locate the failure, recover the cable and carry out the repairs, it is clear that the costs involved are substantial and that site conditions such as water depth and depth of burial in the seabed will also have cost impacts. In 2005 the cost of repairing a failure in an HV submarine cable installed in a water depth of 1,000 m (3,300 ft) was stated to be Euro 6 million ($US 7.4 million at the July 2005 exchange rate). For more moderate installation conditions (less that 100 m water depth and with the cable lai unburied on the seabed) a figure of $US 4 to 5 million can be assumed.

Caribbean Regional Electricity Generation, Interconnection, and Fuels Supply Strategy – Final Report C-10
The number of failures during the nominal 40 year lifetime of submarine power cable systems can be estimated from the failure rate of 0.32 failures/100 km/year (see companion report on submarine cable reliability). For a 50 km single cable link ~ 6 failures can be expected with repair costs totaling $US 24 – 30 million. According to available statistics, the failure rate can be reduced to 1 failure in 40 years provided that failures due to third party causes are eliminated by protecting the cable by burial in the seabed or other appropriate means such as the use of concrete mattresses or rock dumping.
Outage times tend to be much longer that the actual time needed to carry out the repair itself due to lack of availability of appropriate marine spreads, lengthy mobilization times, weather related problems particularly if repairs need to be carried out in winter, etc. A minimum outage time of ~ 3 months can be assumed, which is another reason for the provision of adequate mechanical protection.


![Interconnection Works Agreement...Interconnection Works Agreement [Customer] 2 CONTENTS 1. Interpretation 8 1.1 Definitions 8 1.2 Interpretation 15 1.3 No right to transfer electricity](https://img.dokumen.tips/doc/110x75/60ce2eafef59f47e2638e569/interconnection-works-agreement-interconnection-works-agreement-customer-2.jpg)