Embed Size (px)
Citation preview
Cargill Salt Pond Waterbird Surveys Report, October 2008 - September 2009
Prepared by:
Caitlin Robinson-Nilsen, Waterbird Program Supervisor Jill Demers, Executive Director
Josh Scullen, Biologist San Francisco Bay Bird Observatory
524 Valley Way Milpitas, California 95035
Prepared for:
U.S. Fish and Wildlife Service,
Don Edwards San Francisco Bay National Wildlife Refuge 9500 Thornton Avenue
Newark, CA 94560
December 2009
Garrett Lau
2
SFBBO Salt Pond Survey Report 2009
TABLE OF CONTENTS EXECUTIVE SUMMARY .................................................................................................................................................. 5 INTRODUCTION ............................................................................................................................................................. 5 METHODS ...................................................................................................................................................................... 6
Study Area ................................................................................................................................................................. 6 Data Collection .......................................................................................................................................................... 6 Data Analysis ............................................................................................................................................................. 7
RESULTS ........................................................................................................................................................................ 7 Coyote Hills ............................................................................................................................................................... 7
Species Richness and Abundance.--- .................................................................................................................... 7 Guild Analyses.--- .................................................................................................................................................. 7 Behavior.--- ........................................................................................................................................................... 8 Water Quality.--- ................................................................................................................................................... 8
Dumbarton ................................................................................................................................................................ 8 Species Richness and Abundance.--- .................................................................................................................... 8 Guild Analyses.--- .................................................................................................................................................. 8 Behavior.--- ........................................................................................................................................................... 8 Water Quality.--- ................................................................................................................................................... 8
Mowry ....................................................................................................................................................................... 9 Species Richness and Abundance.--- .................................................................................................................... 9 Guild Analyses.--- .................................................................................................................................................. 9 Behavior.--- ........................................................................................................................................................... 9 Water Quality.--- ................................................................................................................................................... 9
CCA Results ............................................................................................................................................................... 9 DISCUSSION .................................................................................................................................................................. 9
Coyote Hills ............................................................................................................................................................. 10 Dumbarton .............................................................................................................................................................. 10 Mowry ..................................................................................................................................................................... 10 Guilds ...................................................................................................................................................................... 10
Dabblers.--- ......................................................................................................................................................... 10 Divers.---.............................................................................................................................................................. 11 Gulls. --- ............................................................................................................................................................... 11 Eared Grebes and Phalaropes.--- ........................................................................................................................ 12 Medium and Small Shorebirds.--- ....................................................................................................................... 12
MANAGEMENT RECOMMENDATIONS ....................................................................................................................... 12 ACKNOWLEDGMENTS ................................................................................................................................................. 13 LITERATURE CITED ...................................................................................................................................................... 13
3
SFBBO Salt Pond Survey Report 2009
List of Tables
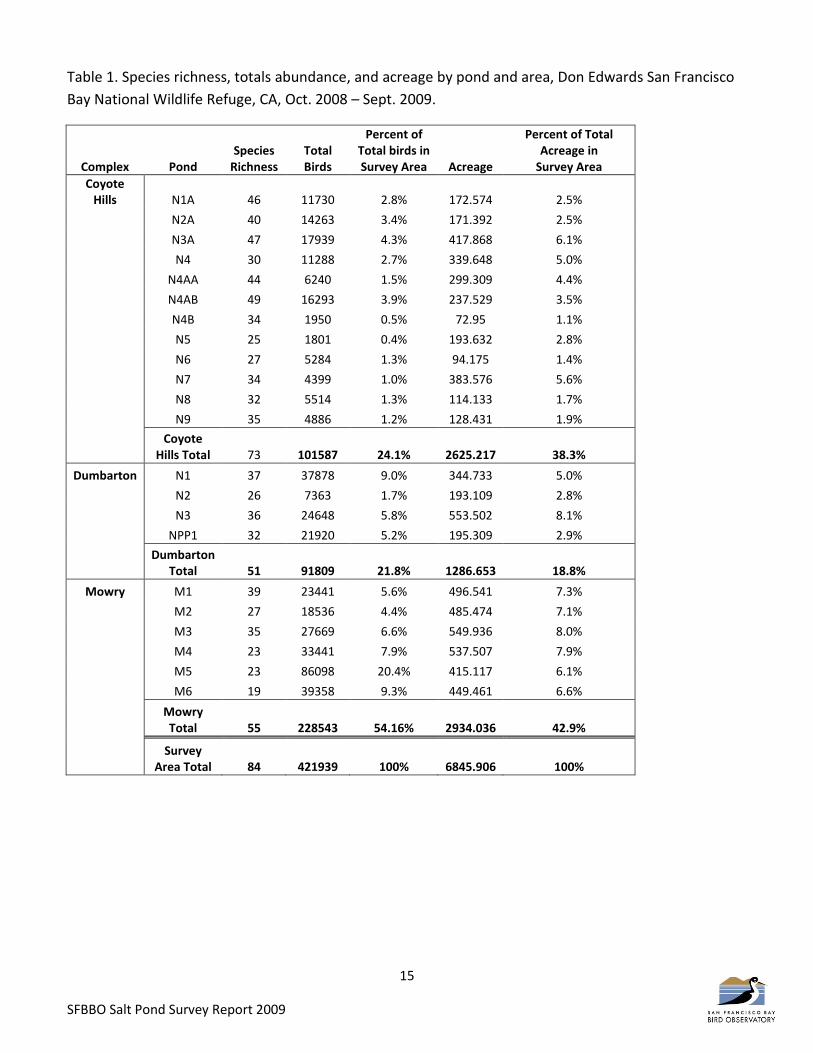
Table 1. Species richness, totals abundance, and acreage by pond and area, Don Edwards San Francisco Bay National Wildlife Refuge, CA, Oct. 2008 – Sept. 2009. ............................................................................................... 15
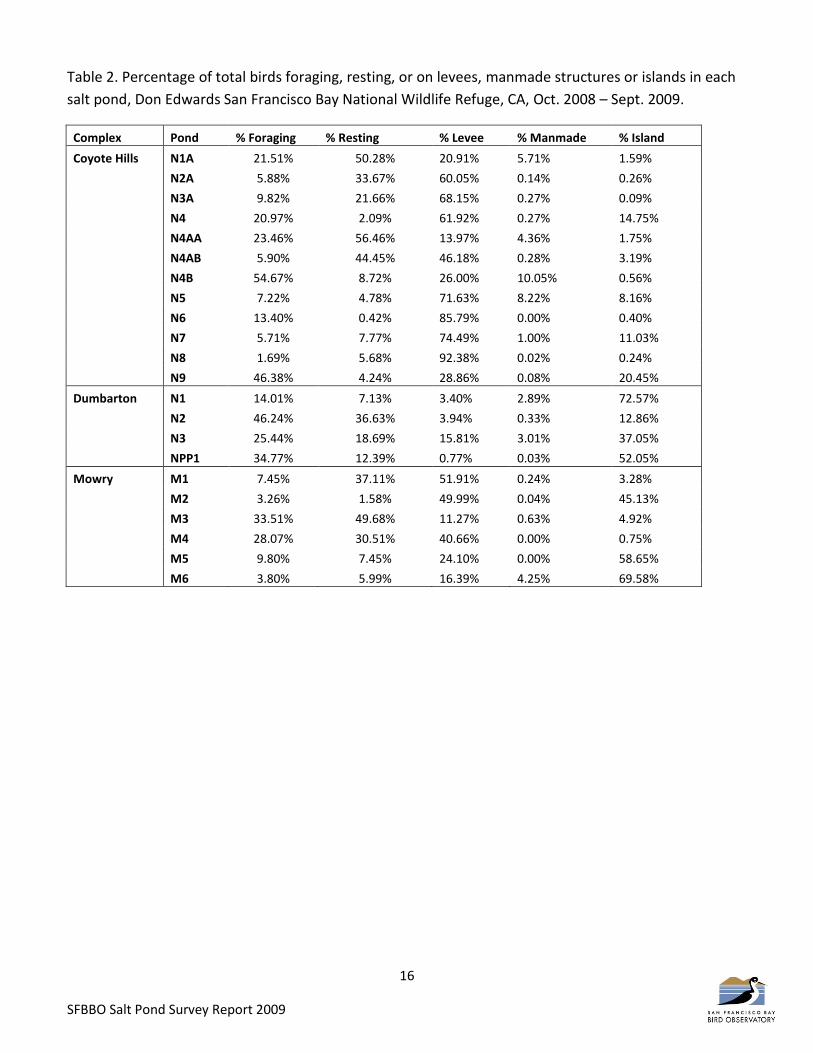
Table 2. Percentage of total birds foraging, resting, or on levees, manmade structures or islands in each salt pond, Don Edwards San Francisco Bay National Wildlife Refuge, CA, Oct. 2008 – Sept. 2009. ........................................... 16
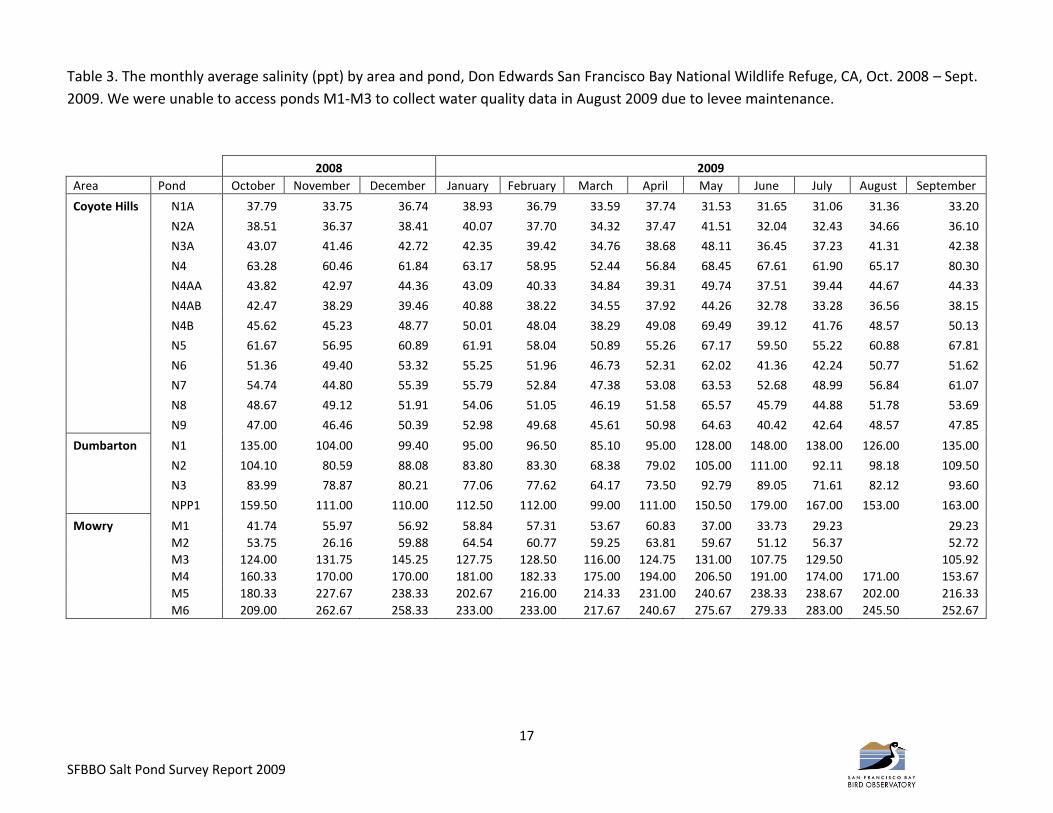
Table 3. The monthly average salinity (ppt) by area and pond, Don Edwards San Francisco Bay National Wildlife Refuge, CA, Oct. 2008 – Sept. 2009. ........................................................................................................................... 17
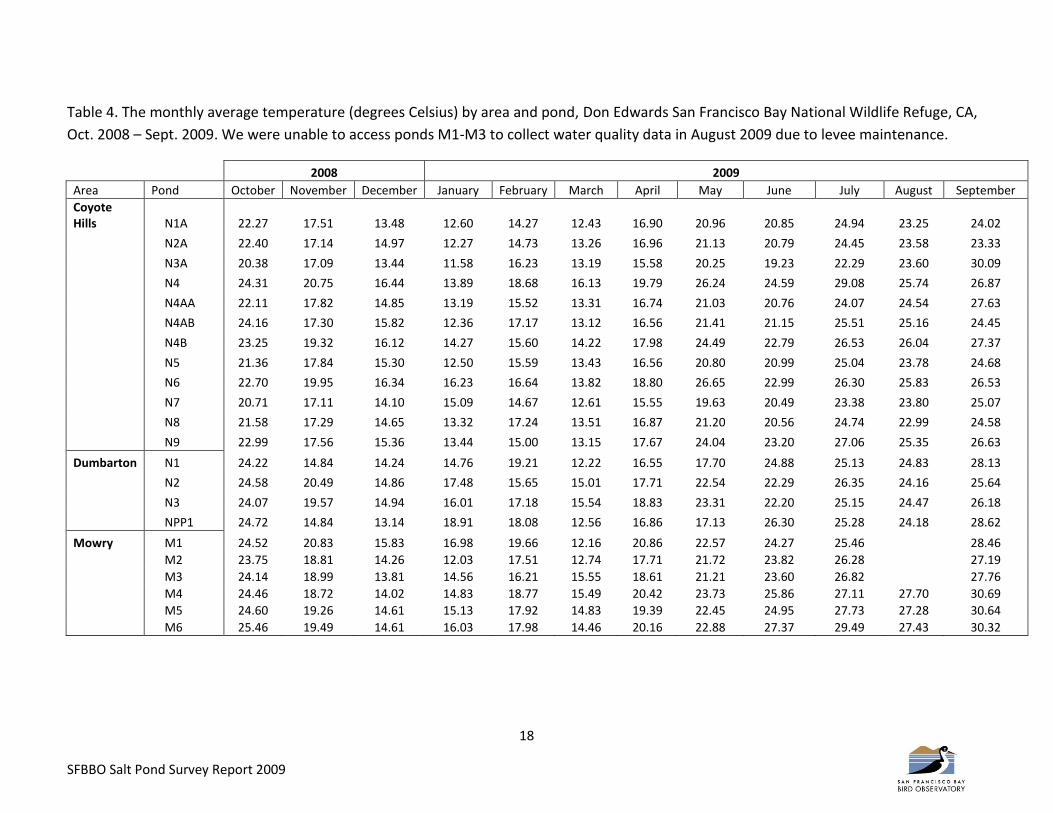
Table 4. The monthly average temperature (degrees Celsius) by area and pond, Don Edwards San Francisco Bay National Wildlife Refuge, CA, Oct. 2008 – Sept. 2009. ............................................................................................... 18
Table 5. The monthly average dissolved oxygen (mg/l) by area and pond, Don Edwards San Francisco Bay National Wildlife Refuge, CA, Oct. 2008 – Sept. 2009. .............................................................................................................. 19
Table 6. The monthly average pH by area and pond, Don Edwards San Francisco Bay National Wildlife Refuge, CA, Oct. 2008 – Sept. 2009. ............................................................................................................................................... 20
Table 7. Correlation and Standardized Canonical Coefficients between Water Quality and Guild Variables. .......... 21
List of Figures
Figure 1. The Coyote Hills, Dumbarton, and Mowry salt pond complexes, Don Edwards San Francisco Bay National Wildlife Refuge, South San Francisco Bay, CA. ........................................................................................................... 22
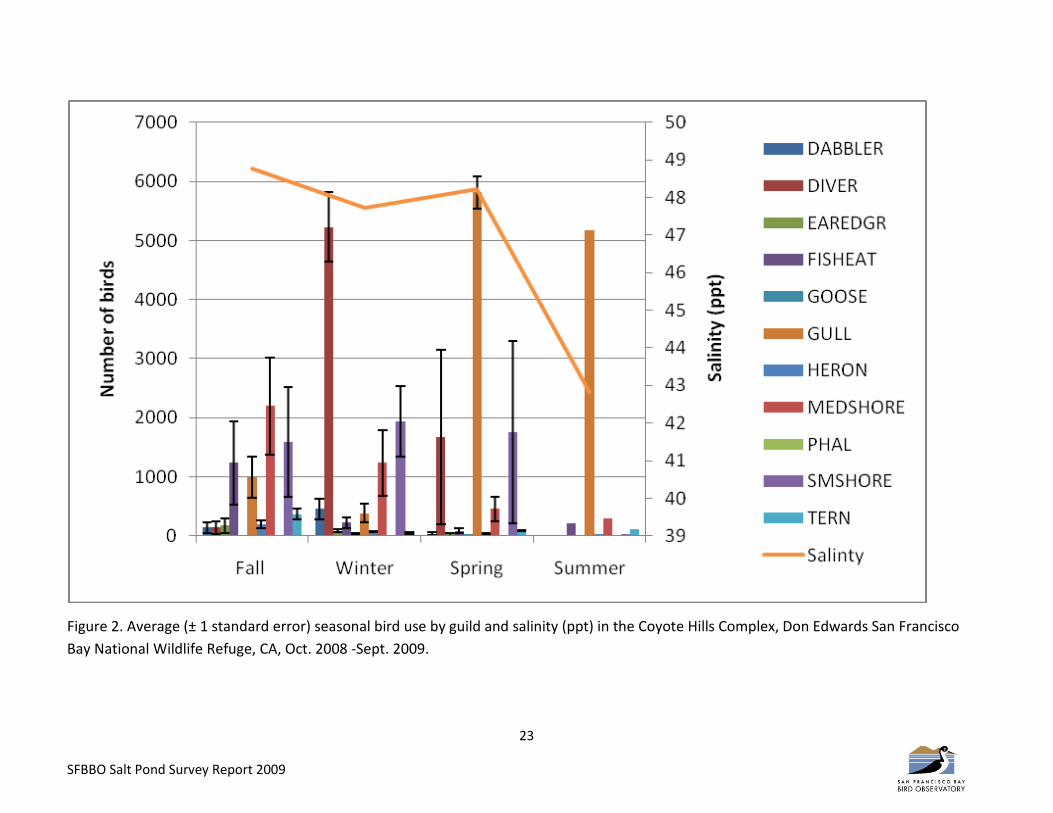
Figure 2. Average (± 1 standard error) seasonal bird use by guild and salinity (ppt) in the Coyote Hills Complex, Don Edwards San Francisco Bay National Wildlife Refuge, CA, Oct. 2008 ‐Sept. 2009. ............................................. 23
Figure 3. Average (± 1 standard error) seasonal bird use by guild and salinity (ppt) in the Dumbarton Complex, Don Edwards San Francisco Bay National Wildlife Refuge, CA, Oct. 2008 ‐Sept. 2009. .................................................... 24
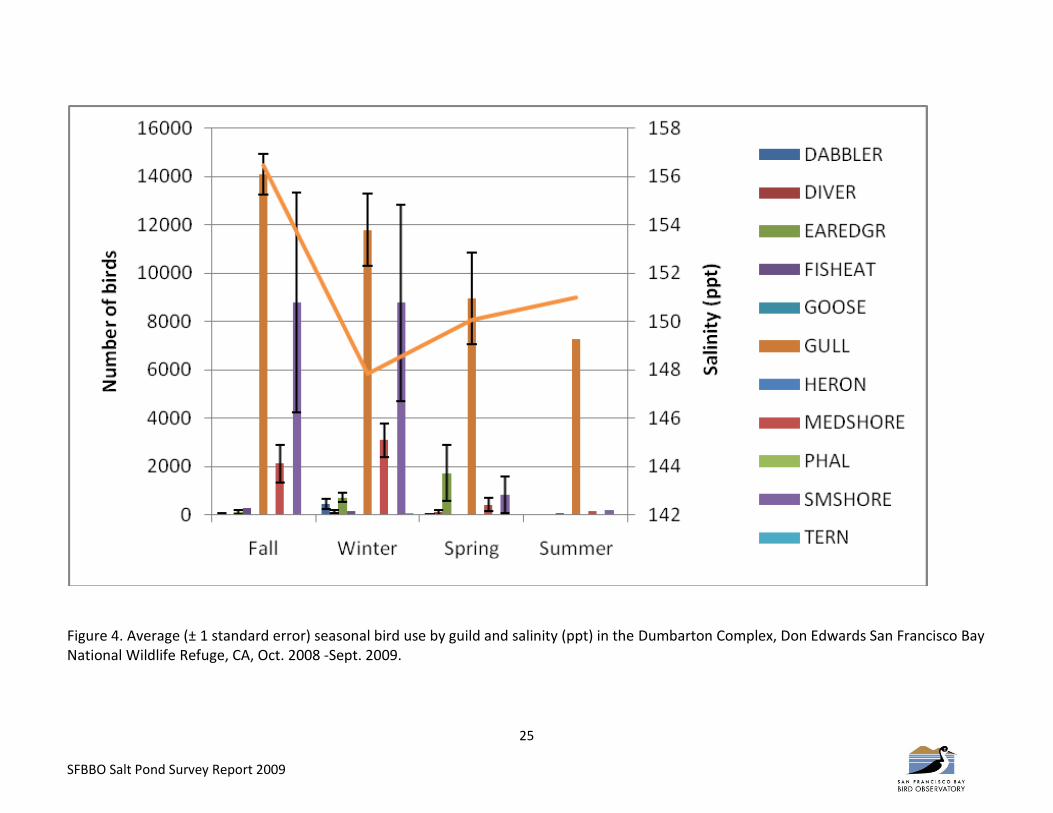
Figure 4. Average (± 1 standard error) seasonal bird use by guild and salinity (ppt) in the Dumbarton Complex, Don Edwards San Francisco Bay National Wildlife Refuge, CA, Oct. 2008 ‐Sept. 2009. .................................................... 25
Figure 5. Total abundance in each 250 m2 salt pond grid in Coyote Hills, Dumbarton, and Mowry salt pond complexes, Don .......................................................................................................................................................... 26
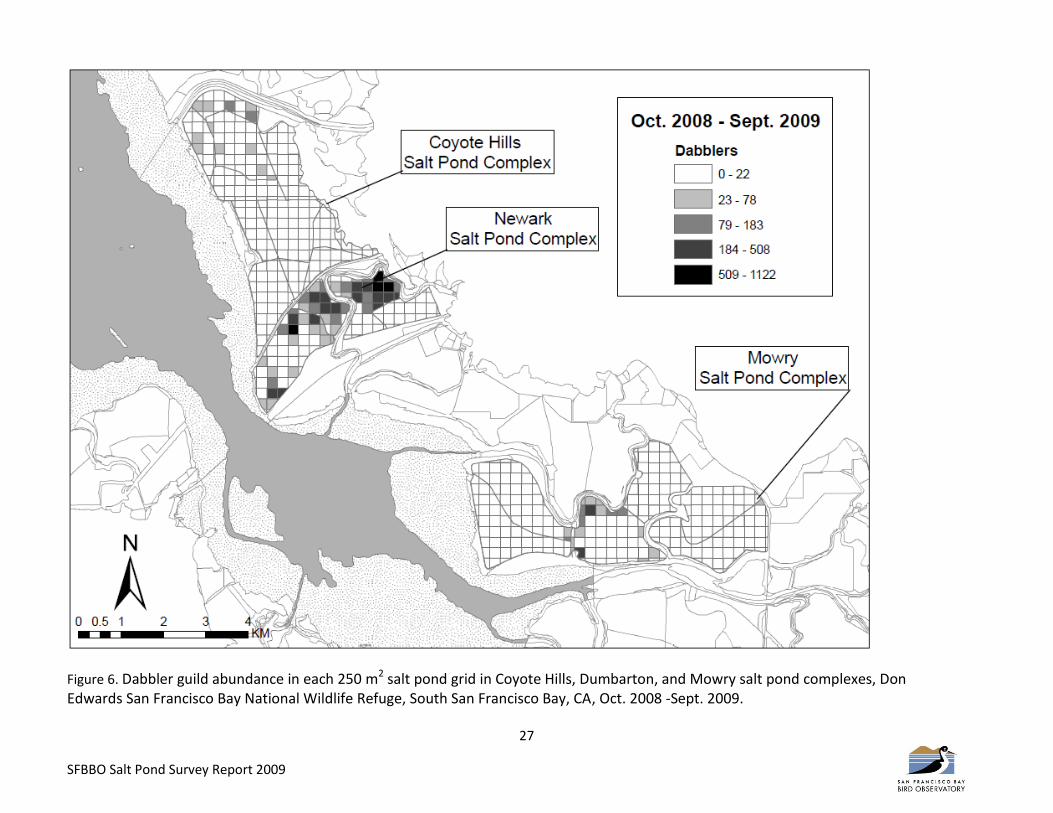
Figure 6. Dabbler guild abundance in each 250 m2 salt pond grid in Coyote Hills, Dumbarton, and Mowry salt pond complexes, Don .......................................................................................................................................................... 27
Figure 7. Diver guild abundance in each 250 m2 salt pond grid in Coyote Hills, Dumbarton, and Mowry salt pond complexes, Don .......................................................................................................................................................... 28
Figure 8. Eared Grebe guild abundance in each 250 m2 salt pond grid in Coyote Hills, Dumbarton, and Mowry salt pond complexes, Don ................................................................................................................................................. 29
Figure 9. Fish eater guild abundance in each 250 m2 salt pond grid in Coyote Hills, Dumbarton, and Mowry salt pond complexes, Don ................................................................................................................................................. 30
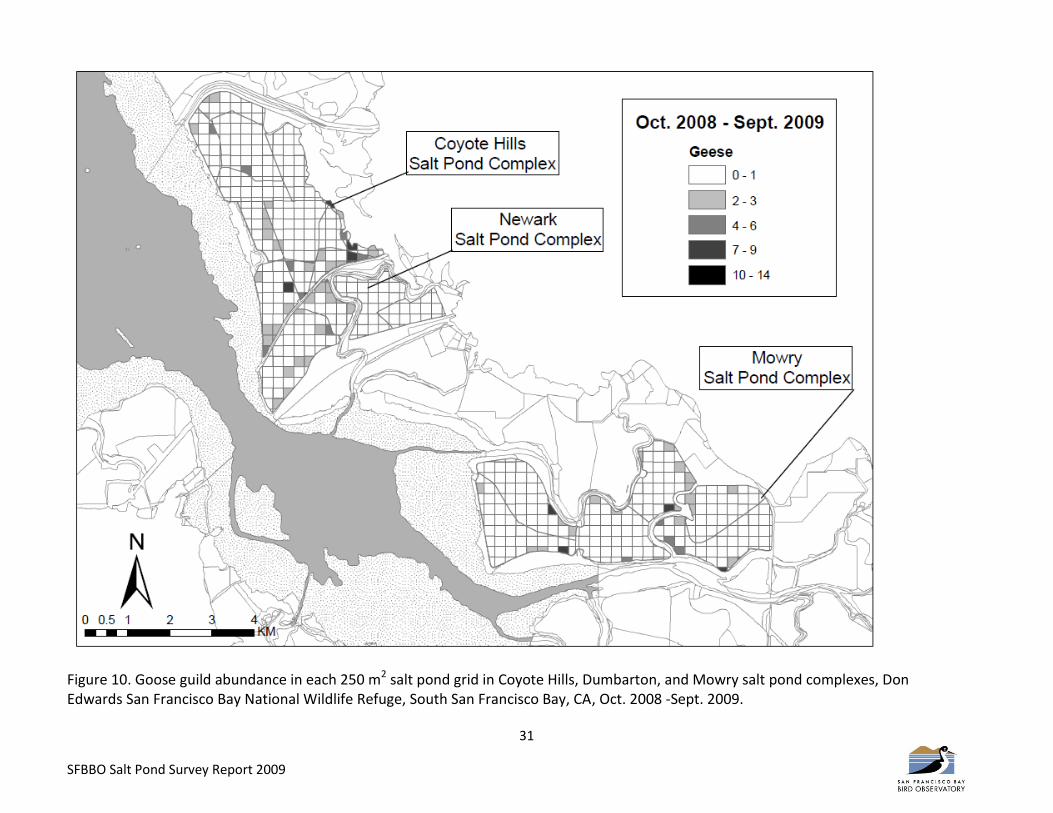
Figure 10. Goose guild abundance in each 250 m2 salt pond grid in Coyote Hills, Dumbarton, and Mowry salt pond complexes, Don .......................................................................................................................................................... 31
4
SFBBO Salt Pond Survey Report 2009
Figure 11. Gull guild abundance in each 250 m2 salt pond grid in Coyote Hills, Dumbarton, and Mowry salt pond complexes, Don .......................................................................................................................................................... 32
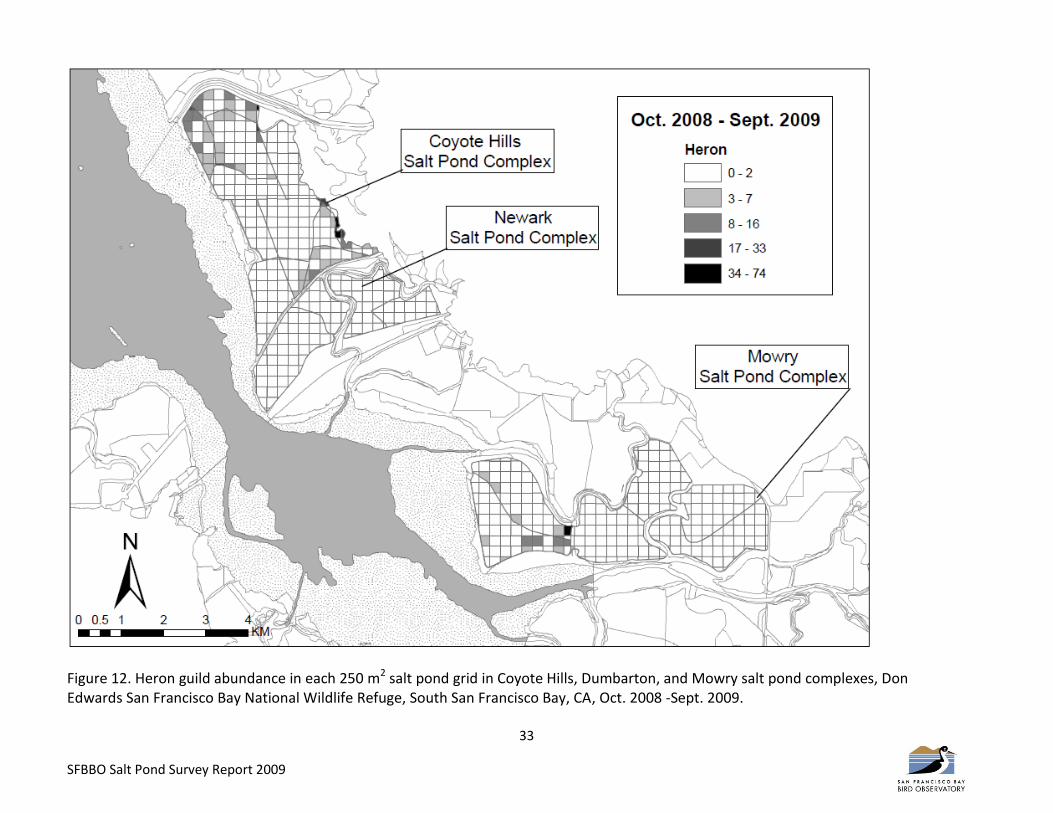
Figure 12. Heron guild abundance in each 250 m2 salt pond grid in Coyote Hills, Dumbarton, and Mowry salt pond complexes, Don .......................................................................................................................................................... 33
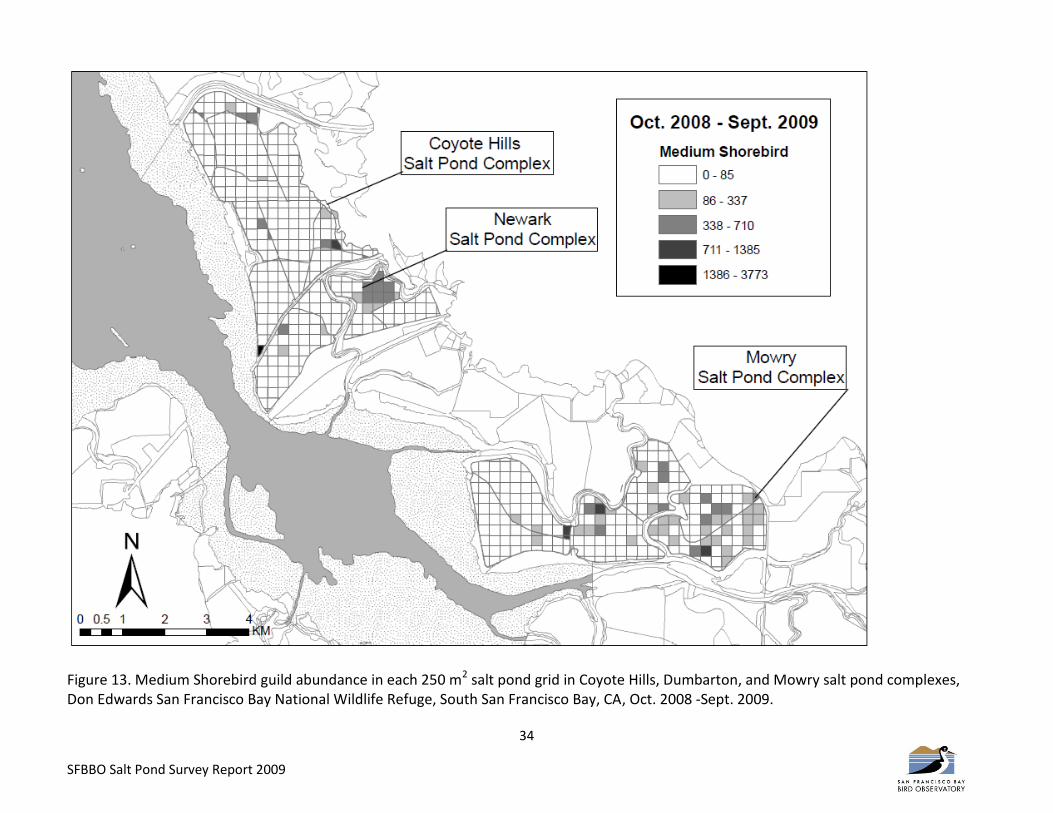
Figure 13. Medium Shorebird guild abundance in each 250 m2 salt pond grid in Coyote Hills, Dumbarton, and Mowry salt pond complexes, Don Edwards San Francisco Bay National Wildlife Refuge, South San Francisco Bay, CA, Oct. 2008 ‐Sept. 2009. .......................................................................................................................................... 34
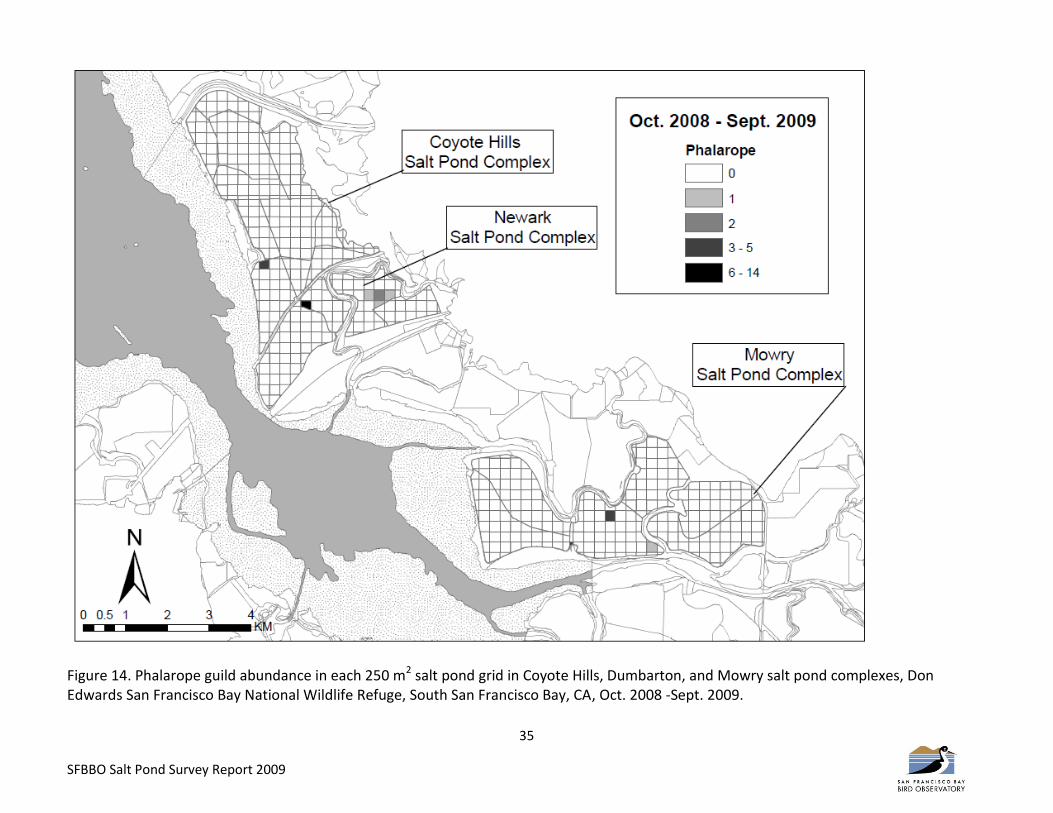
Figure 14. Phalarope guild abundance in each 250 m2 salt pond grid in Coyote Hills, Dumbarton, and Mowry salt pond complexes, Don ................................................................................................................................................. 35
Figure 15. Small Shorebird guild abundance in each 250 m2 salt pond grid in Coyote Hills, Dumbarton, and Mowry salt pond complexes, Don ........................................................................................................................................... 36
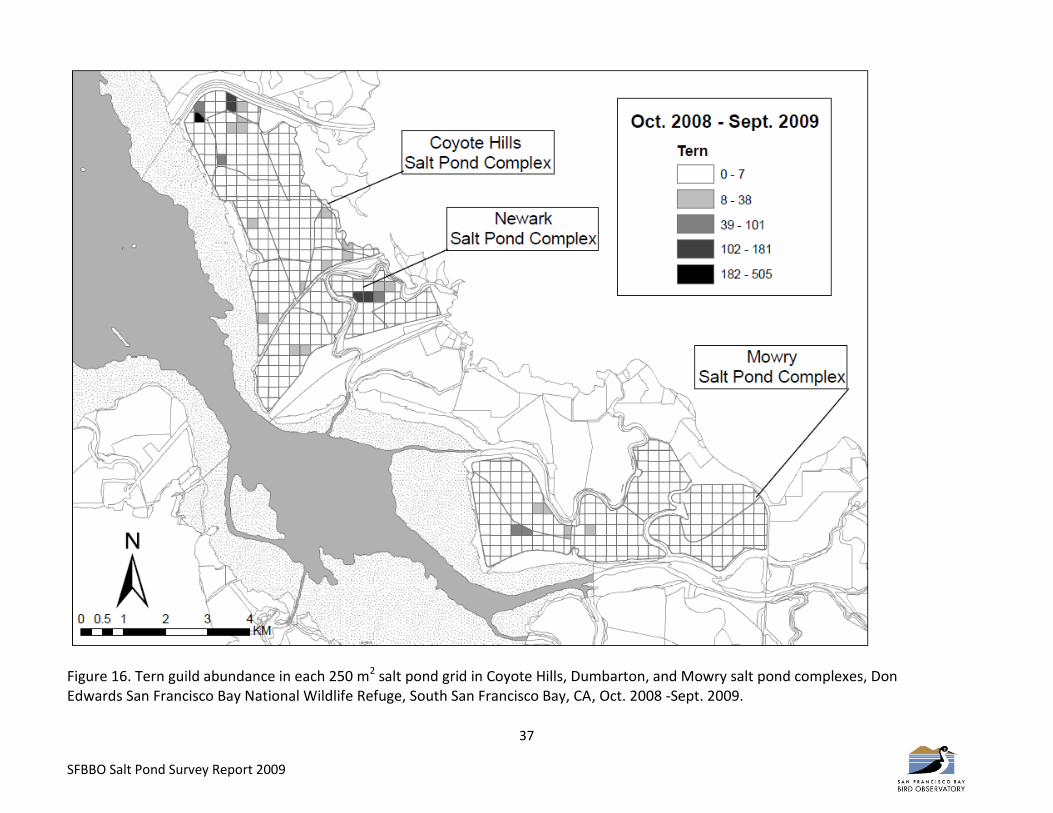
Figure 16. Tern guild abundance in each 250 m2 salt pond grid in Coyote Hills, Dumbarton, and Mowry salt pond complexes, Don .......................................................................................................................................................... 37
5
SFBBO Salt Pond Survey Report 2009
EXECUTIVE SUMMARY
The San Francisco Bay Bird Observatory surveyed 22 salt evaporation ponds for waterbirds and sampled
water quality from October 2008 through September 2009. The salt ponds surveyed are owned by the
Don Edwards San Francisco Bay National Wildlife Refuge and managed for salt production by Cargill Salt.
We examined species richness, total abundance within and between complexes. We also examined the
difference in abundance of foraging guilds within each complex.
We observed 421,939 birds during our monthly surveys between October 2008 and September 2009.
Species richness was greatest in Coyote Hills and Mowry complexes and lowest in the Dumbarton
complex. Total abundance was highest in the Mowry complex, followed by Coyote Hills, then
Dumbarton. The proportion of birds foraging was greatest in Coyote Hills and Dumbarton complexes,
whereas birds mostly roosted in the Mowry complex.
We found that guilds were most abundant in specific ponds and water quality parameters often dictated
guild-specific distributions. These distributions were likely driven by the prey distribution and the
conditions needed for their survival. For example, we rarely found fish eaters in high salinity ponds
because fish species cannot tolerate those salinities. Likewise, we often observed Eared Grebes,
phalaropes, and shorebirds in high salinity ponds where brine shrimp and flies are likely abundant.
Shorebird abundance is also dependent upon appropriate water depth for foraging and islands for
roosting.
As the South Bay Salt Pond Restoration Project progresses, we recommend management of salt pond
habitats to retain bird populations by maintaining a variety of water salinities for the guilds. Special
consideration should be given to birds that prefer medium to high salinity ponds such as phalaropes and
Eared Grebes. We also suggest providing lower water levels in some ponds for small and medium
shorebirds during migration, and creating or maintaining islands or undisturbed levees for shorebird
roosting habitat. Finally, as the restoration progresses, continuing to monitor avian use of these ponds
will allow for managers to assess the success of the restoration in maintaining current bird populations.
INTRODUCTION
In 2002, the U.S. Fish and Wildlife Service and California’s Department of Fish and Game entered a
historic agreement with Cargill Salt to purchase 15,100 acres of salt evaporator ponds in the South San
Francisco Bay. The South Bay Salt Pond Restoration Project (SBSPRP) has begun to restore the area to a
mix of tidal and ponded habitats and provide flood protection and public access to the South Bay (South
Bay Salt Pond Restoration Project).
Salt ponds have been present in the San Francisco for 150 years (Ver Planck 1958) and have significant
wildlife value as ponds (Anderson 1970; Accurso 1992; Takekawa et al. 2001; Warnock et al. 2002). As a
major migratory and wintering location along the Pacific Flyway, the San Francisco Bay supports a more
than a million birds throughout the year and provides important foraging and roosting sites (Page et al.
1999, Warnock et al. 2002). The SBSPRP has committed to retain some salt pond habitat (as managed
6
SFBBO Salt Pond Survey Report 2009
ponds) to maintain existing ecological value for waterbirds, but information is needed to ensure that
habitat requirements of large numbers of waterbirds can be met with reduced pond acreage. The U.S.
Geological Survey (USGS) conducts monthly monitoring of waterbird use and water quality of the salt
ponds located within the SBSPRP area and San Francisco Bay Bird Observatory (SFBBO) monitors the
ponds owned by the Don Edwards San Francisco Bay National Wildlife Refuge (the Refuge) and operated
by Cargill Salt and not slated to be restored to tidal action.
This report presents the results of SFBBO’s surveys in the Coyote Hills, Dumbarton and Mowry salt pond
complexes, from October 2008 through September 2009.
METHODS
Study Area
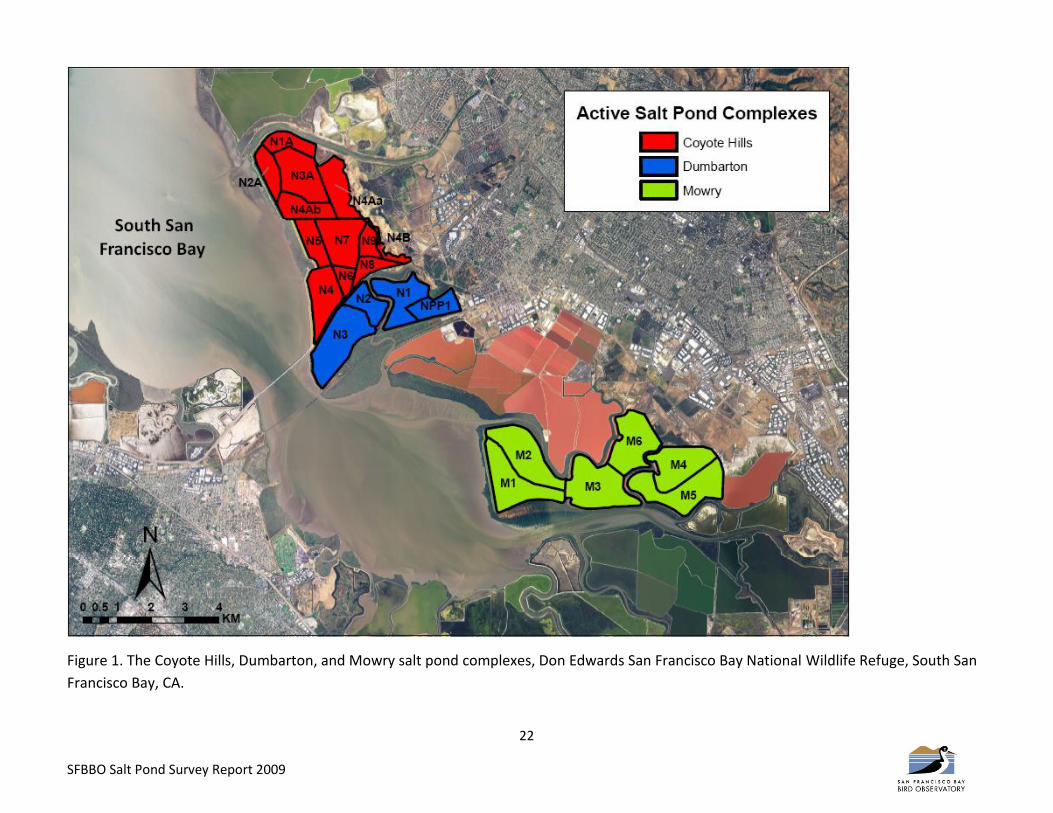
We conducted bird surveys at 22 salt ponds in the cities of Newark and Fremont, Alameda County,
California. Although the ponds are owned by the Refuge, Cargill Salt retains mineral rights and regulates
water flow for salt production. The ponds monitored by SFBBO include Coyote Hills ponds (N1A - N9),
Dumbarton ponds (NPP1, N1 - N3) and Mowry ponds (M1 - M6; Figure 1). The salinity and depth of
these ponds varies over the course of the year and according to Cargill management activities.
Data Collection
During each calendar month, we conducted one bird survey at each of the 22 ponds in the Coyote Hills,
Dumbarton, and Mowry salt pond complexes. During each survey, we observed birds from the nearest
drivable levee, using spotting scopes and binoculars. We counted bird species present on the pond, and
recorded their location in the pond using aerial maps of each pond superimposed with 250 m2
individually labeled grids. For each individual bird, we recorded foraging behaviors, and, for roosting or
resting birds on an island, levee, or manmade structure, we recorded their location on any of these
structures. We did not record bird use of these structures if the bird was foraging.
We identified birds at the species level whenever possible, with the exception of Long-Billed and Short-
Billed Dowitchers, which we identified as dowitchers, and Greater and Lesser Scaup, which we identified
as scaup.
When species identification was not possible, we identified birds to genus or foraging guild (e.g. gulls,
small shorebirds, medium shorebirds, or phalaropes). We also categorized each species into a foraging
guild for analyses and presentation, based on their foraging methods and prey requirements.
We conducted our surveys exclusively during high tide, defined as a tide of 4.0 feet or greater at the
Alameda Creek Tide Sub-Station (37° 35.7' 122°). During each survey, we recorded the pond name, the
date and the observer, and the start and end time. In addition, during each bird survey we collected a
water sample and determined salinity by measuring specific gravity using hydrometers (Ertco, West
Paterson, NJ) and recording the temperature of the pond. We collected this sample at the same grid at

7
SFBBO Salt Pond Survey Report 2009
each pond every month. We also recorded a water depth reading using a staff gauge, present in all but
a few ponds.
SFBBO sampled water quality at all 22 salt ponds each month, collecting dissolved oxygen, salinity, pH
and temperature at each pre-determined sample site. We also recorded barometric pressure the
beginning of each day that water quality samples were taken. We used several water quality
instruments to obtain our measurements, including Hach HQ10 Luminescent Dissolved Oxygen (LDO)
Meter (Hydrolab-Hach Company, Loveland, CO), Hydrolab Minisonde (Hydrolab-Hach Company,
Loveland, CO), and YSI 63 pH/Conductivity meter (YSI Incorporated, Yellow Springs, OH) meters. We also
determined specific gravity using hydrometers (Ertco, West Paterson, NJ).
Data Analysis
To compare the abundance of each guild between ponds and seasons in each complex, we conducted
separate analyses among each guild using ANOVA (Systat 2004). Our models included pond number and
season, and we did not test interaction terms. Prior to analysis, we standardized abundance by acre,
and we made pairwise comparisons using Tukey-Kramer Multiple Comparison Tests. For this analysis,
we used abundance per acre of the guilds in each salt pond per month as our unit of replication.
We analyzed patterns of foraging guild composition in salt ponds using Canonical Correlation Analysis
(CCA) in SPSS (2006). We included water quality variables (salinity, pH, dissolved oxygen, and
temperature) and pond area (acres) in the CCA analysis.
RESULTS
Coyote Hills
Species Richness and Abundance.--- In the Coyote Hills complex, species richness was highest in pond
N4AB with 49 species recorded, followed by N3A (37; Table 1). Total abundance was highest in ponds
N3A, with 17,939 birds recorded, followed by N4AB with 16,293 birds recorded (Table 1). Abundance
was highest for all ponds during the winter months (Figure 2), though numbers remained high
throughout the survey period on ponds N2A, N3A and N4AB, due to the nesting California Gulls on that
pond. The small island in the south east corner of N4 hosted large numbers of roosting medium
shorebirds.
Guild Analyses.--- The number of diving ducks differed significantly between ponds (F11,132 = 4.099, P <
0.001). We found significantly more diving ducks per acre in ponds in pond N1A than ponds N4, N4B, N5,
N6, N7, N8 and N9 (P < 0.010). The number of gulls differed significantly between ponds (F11,132 = 6.292,
P < 0.001). There were significantly more gulls per acre in ponds N2A and N6 this past year compared to
ponds N4, N4AA, N4B, N5, N7, N8 and N9 (P < 0.025). The number of terns differed significantly between
ponds (F11,132 = 2.470, P < 0.001). Pond N2A had a higher number of terns per acre than ponds N3A and
N5 (P < 0.050). There were no other significant relationships between guilds and ponds (F11,132 <1.854, P
> 0.051).
8
SFBBO Salt Pond Survey Report 2009
Behavior.--- The division of birds by behavior varied greatly between ponds. The majority of the birds
observed on ponds N4B and N9 were seen foraging (54.67% and 46.39%, respectively; Table 2). The
majority of birds on ponds N4AA, N1A, and N4AB were seen roosting. The most common observed
behavior in ponds N8, N7, N6, N3A, N4 and N4A was roosting on a levee (Table 2).
Water Quality.--- Pond N1A had the lowest salinity of all the Coyote Hills complex ponds with an average
salinity of 34.51 ppt (Table 3). Pond N4 had the highest salinity with an average of 63.37 ppt. Average
temperatures in the Coyote Hills ponds ranged from a low of 18.62°C in pond N1A to a high of 21.88°C in
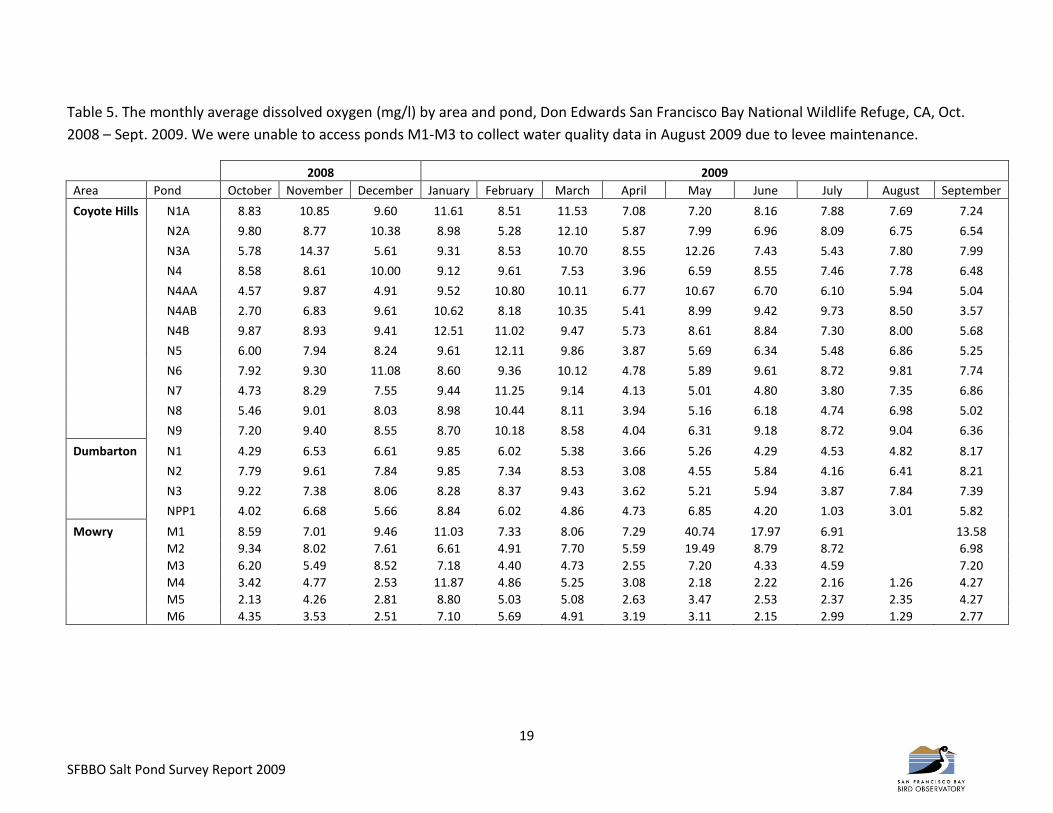
pond N4 (Table 4). The dissolved oxygen ranged from a low of 6.84 mg/l in N8 to a high of 8.85 mg/l in
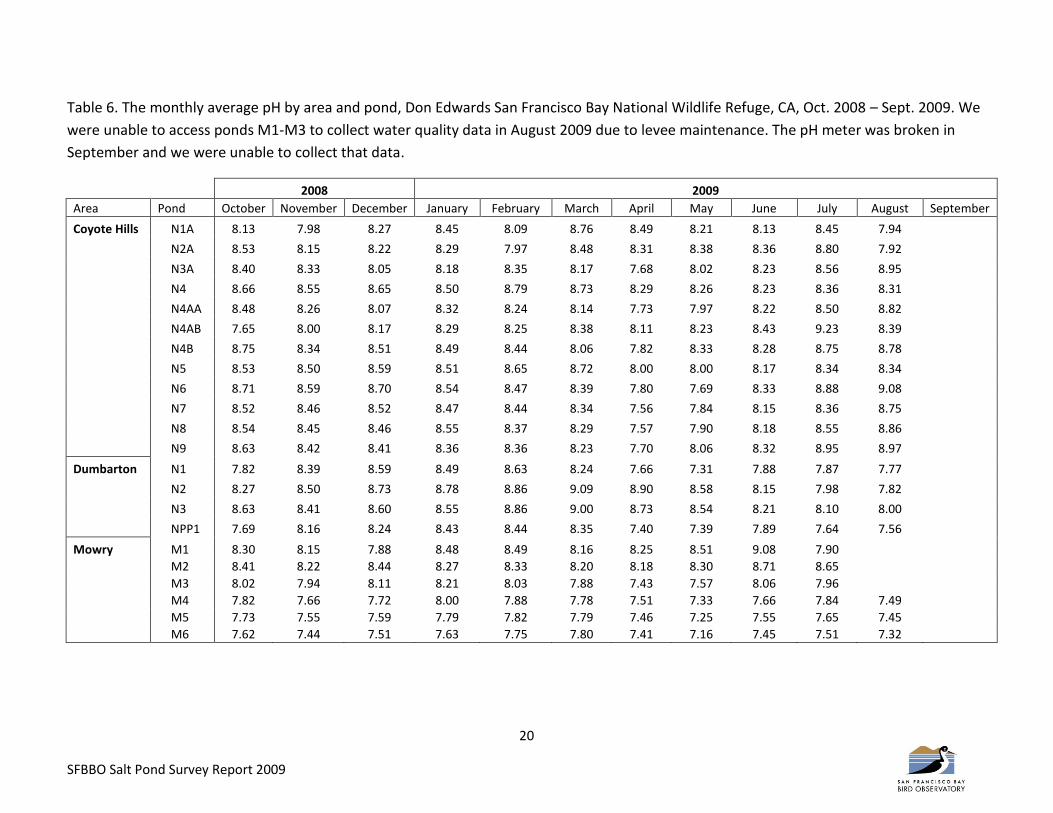
N1A (Table 5). The pH in the Coyote Hills ponds ranged from a low of 8.26 in pond N1A to a high of 8.48
in pond N4 (Table 6).
Dumbarton
Species Richness and Abundance.--- Pond N1 had the highest species richness with 37 species recorded,
followed by pond N3 with 36 species recorded (Table 1). Total abundance was highest in pond N1 with
37,878 birds observed followed by pond N3 with 24,648 birds observed (Table 1). Abundance was
highest in the winter months when the Dumbarton ponds hosted high numbers of small shorebirds
(Figure 3).
Guild Analyses.--- The number of fish eaters differed significantly between ponds (F3,44 = 7.837, P <
0.001). Pond N1 had a significantly higher number of fish eaters per acre than all the other Dumbarton
ponds (P < 0.002). The number of geese differed significantly between ponds (F3,44 = 3.469, P =0.024).
Pond N2 had a significantly higher number of geese per acre than N1 and NPP1. (F3,44 = 3.469, P < 0.039).
The number of medium shorebirds also differed between ponds (F3,44 = 5.154, P= 0.004). We found
significantly higher numbers of medium shorebirds per acre on pond N1 than compared to N2 and N3 (P
< 0.017). The number of small shorebirds differed between ponds (F3,44 = 3.662, P = 0.019); pond NPP1
had a higher number of small shorebirds per acre compared to all other Dumbarton ponds (P < 0.033).
The number of terns differed between ponds (F3,44 = 4.972, P = 0.005). We found significantly higher
numbers of terns on pond N1 compared to all other ponds (P < 0.025). There were no other significant
relationships between guilds and ponds (F3,44 < 1.823, P > 0.157).
Behavior.--- Ponds N2 and NPP1 supported the highest percentage of foraging birds in the Dumbarton
complex (46.24% and 34.77%, respectively; Table 2). Islands in pond N1 hosted almost 73% of all the
birds recorded in that pond (Table 2).
Water Quality.--- Pond N3 had the lowest salinity in the Dumbarton complex with an average salinity of
80.38 ppt (Table 3). Pond NPP1 had the highest salinity with an average of 135.63 ppt (Table 3). Average
temperature in the Dumbarton ponds ranged from 19.73°C in pond N1 to 20.62°C in pond N3 (Table 4).
The dissolved oxygen ranged from an average low of 5.14 mg/l in NPP1 to a high 7.05 mg/l in N3 (Table
5). The pH in the Coyote Hills ponds ranged from 7.92 in NPP1 to 8.51 in N2 and N3 (Table 6).
9
SFBBO Salt Pond Survey Report 2009
Mowry
Species Richness and Abundance.--- Pond M1 had the highest species richness with 39 species recorded
while M6 had the lowest species richness with 19 species recorded (Table 1). Total abundance was
highest in pond M5 with 86,098 birds recorded. The pond with the lowest total abundance was M2 with
18,536 birds recorded (Table 1). The Mowry ponds hosted large numbers of gulls throughout the year as
well as large numbers of small shorebirds in the fall and winter (Figure 4).
Guild Analyses.--- The number of Eared Grebes differed significantly between ponds (F5,66 = 3.344, P =
0.009). We found significantly more Eared Grebes per acre on pond M3 compared to M1, M2, M4 and
M5 (P < 0.039). The number of gulls differed significantly between ponds (F3,44 = 10.804, P < 0.001). Pond
M5 had significantly more gulls per acre than ponds M1, M2, M3 and M5 (P < 0.002). Pond M6 had
significantly more gulls per acre than pond M3 (P < 0.030). There were no other significant relationships
between guilds and ponds (F3,44 < 2.126, P > 0.073).
Behavior.--- Ponds M3 and M4 supported the highest percentage of foraging birds in the Mowry
complex (33.51% and 28.07%, respectively; Table 2). A large percentage of birds observed on M5
(58.65%) and M6 (69.58%) were roosting on islands. Pond M1, M2 and M4 had a large percentage of
birds roosting on levees (Table 2).
Water Quality.--- The average salinity in the Mowry complex ranged from a low of 46.77 ppt in M1 to a
high of 249.21 ppt in M6 (Table 3). The temperature ranged from 18.62 °C in pond M2 to 22.14°C in
pond M6 (Table 4). The average dissolved oxygen ranged from 3.63 mg/l in M6 to 12.54 mg/l in M1
(Table 5). The pH ranged from an average of 7.51 in M6 to 8.37 in M2 (Table 6).
CCA Results
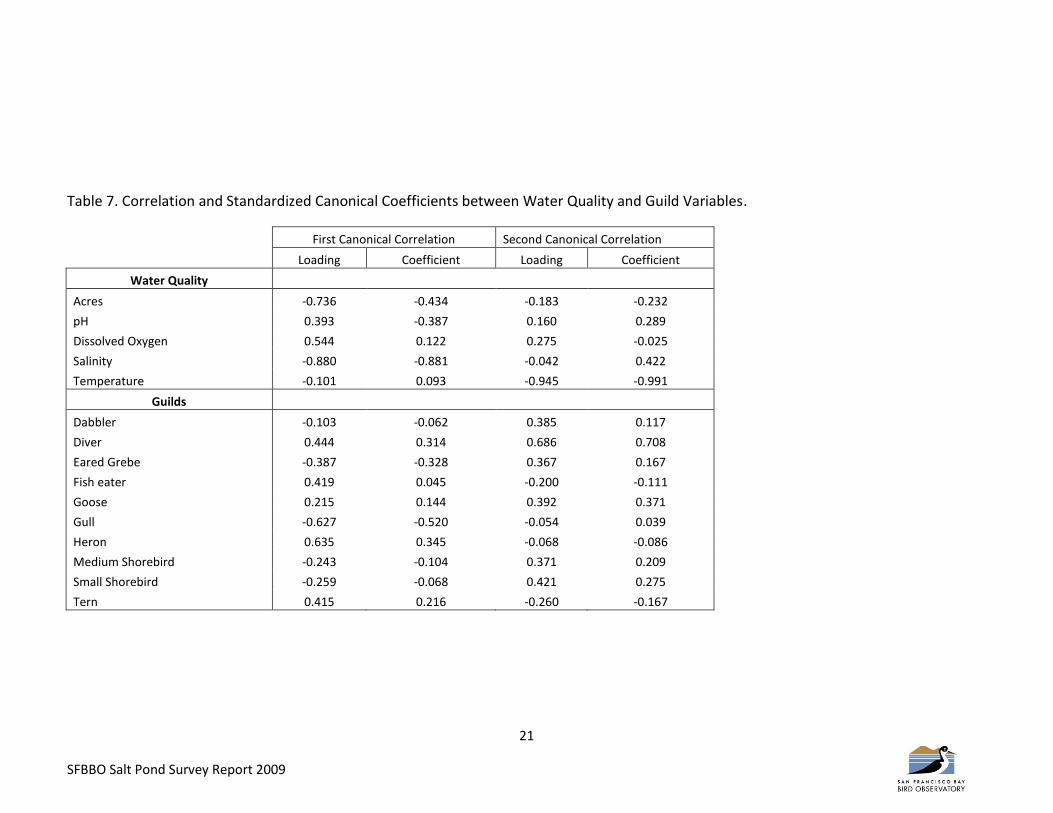
The canonical correlation analysis showed that the correlations for variates 1 and 2 were significant (χ2 =
0.357, df=50.0, P < 0.001 and χ2 = 132.538, df = 36.0, P < 0.001; Table 7). Dabbling ducks were found in
ponds with lower temperatures while diving ducks were found in smaller ponds with lower salinity and
temperature and high dissolved oxygen. Eared grebes preferred ponds larger ponds with higher salinity.
Fish eaters were found in ponds that were smaller and had lower salinity and high dissolved oxygen.
Geese preferred areas with lower temperatures. Gulls preferred larger ponds with higher salinity and
lower dissolved oxygen. Herons preferred smaller ponds with low salinity and high dissolved oxygen.
Medium and small shorebirds were found in ponds with lower temperatures and terns were found in
smaller ponds with low salinity and high dissolved oxygen.
DISCUSSION
The salt ponds of the South San Francisco Bay have been long recognized as an important waterbird migration and wintering site (Takekawa et al. 2001; Warnock et al. 2002). The ponds surveyed in the study are managed for salt production and have widely ranging salinities which influences the bird use of ponds.

10
SFBBO Salt Pond Survey Report 2009
Coyote Hills
The northern Coyote Hills ponds (N1A, N2A, N3A, and N4AB) provided important habitat for dabblers,
divers, fish eaters, medium shorebirds and terns. These ponds had the highest richness and species
abundance in the complex. The salinity in these ponds is typically the lowest in the complex; due to the
water control structure in N1A that intakes brackish water from the Alameda County Flood Control
Channel into the pond system. As the water moves south through the complex, the salinity general
increases and we find lower richness and species abundance in these ponds. This year we also observed
high numbers of small shorebirds in ponds N8 and N9. The majority of these birds were roosting and on
the levee between the two ponds and foraging along the eastern side of N9. The salinity in pond N9 was
higher this year than previous years and may have increased the amount of prey available to small
shorebirds.
Dumbarton
In previous years, the Dumbarton complex has hosted the highest species abundance (Robinson et al.
2009), however, this year the Dumbarton complex had the lowest species abundance and lowest
richness. This may be due to changes in water management as the salinity was much lower than in the
previous three years (Robinson et al. 2009) and the water levels were higher than the past two years.
This may have changed the prey composition in the ponds. Even with these changes, the Dumbarton
ponds hosted large numbers of small shorebirds as well as dabbling ducks. The small shorebirds roosted
in high numbers along the levee separating N1 and NPP1.
Mowry The Mowry complex includes the highest salinity ponds that SFBBO surveys. However, the average
salinity for the ponds from Oct 2008 – Sept 2009 was lower than the past three years (Robinson et al.
2009). Herons, terns and fish eaters were seen using M1 and M2; these ponds have lower salinity than
the rest of the complex and may support more fish and invertebrates to support foraging for these
guilds. The salinity of ponds M3 through M6 was higher and we observed large numbers of eared grebes
using the more saline ponds, who feed on invertebrates such as brine shrimp (Cullen et al. 1999). The
complex hosted large numbers of small and medium shorebirds, many on roosting on islands in pond
M5, which had an average salinity of over 200 ppt.
Guilds Dabblers.--- Dabbling ducks were associated with low to medium salinity ponds. We observed most of
the dabbling ducks using the Dumbarton ponds, but also saw high densities on Mowry pond M3. The
affinity of dabblers to these ponds may be related to food abundance. Takekawa et al. (2006) found that
the abundance of chlorophyll a and macro-invertebrates was highest in low salinity ponds (<80 ppt).
Likewise, low salinity ponds are used generalists like Mallard and Gadwall (Leschack et al. 1997; Drilling
et al. 2002) that eat plant mater and invertebrates, and vegetarians such as the American Widgeon
(Mowbray 1999) that opportunistically eat aquatic vegetation. As salinity rises in salt ponds, the biomass
of macro invertebrate copepods decreases, but bring shrimp (Artemia spp) biomass increases in ponds

11
SFBBO Salt Pond Survey Report 2009
with salinities of 60 – 200 ppt (Carpelan 1957; Takekawa et al. 2006). Dabblers such as Northern
Shovelers, which eat small swimming invertebrates but less commonly picks invertebrates off plant
matter (Dubowy 1996), may depend on Artemia in the medium salinity salt ponds, driving their use of
ponds such as M3.
Divers.--- Diving ducks were associated with low to medium salinity ponds. The majority of the diving
ducks we observed were seen in the northern Coyote Hills ponds, were the salinity is typically low.
Because most of these species forage on macroinvertebrates and plant matter, these lower salinity
ponds likely provide the variety of invertebrates and plants these species eat (Takekawa et al. 2006).
Fish eaters and Terns.--- We observed highest numbers of fish eaters, such as cormorants and grebes,
and terns in the northern Coyote Hills complex ponds and ponds M1 and M2, which have low salinity.
Fish in the South Bay salt ponds cannot survive in salinities greater than 80 ppt (Carpelan 1957), which
limits the salinity range where we would expect to observe fish‐eating birds foraging. Fish also need
moderate amounts of dissolved oxygen in the water column to survive, and sharp drops in dissolved
oxygen in the salt ponds, leading to anaerobic conditions, often causes fish to rise to the water surface
to obtain oxygen, making them more available for fish‐eating birds (K. Henderson, pers. comm.; J.
Demers, pers. obs.).
Gulls. --- The California Gull population in the South Bay is growing exponentially (Strong et al. 2004;
Robinson-Nilsen et al. 2009a). There are concerns that this expanding population may negatively impact
the breeding waterbirds of the South Bay by encroaching on nesting habitat (Strong et al. 2004) or
depredating eggs and chicks which has been documented in American Avocets and Black-necked Stilts
(Ackerman et al. 2006) and the threatened Western Snowy Plover (Robinson-Nilsen et al. 2009b). This
year was the first year since 2004 that the numbers of nesting gulls in the South Bay decreased
(Robinson-Nilsen et al. 2009a).
Gulls use of ponds may be more influenced by pond location, rather than water quality parameters.
Gulls nested in ponds with a wide range of salinities. For example, the colony in the Coyote Hills complex
nests on levees surrounding ponds with an average salinity of just under 40 ppt while the colony on the
levees between ponds M4 and M5, whose average salinity was just under 200 ppt.
While almost 5000 California Gulls nested at the Coyote Hills colony, their use of other ponds in the
complex was low, suggesting they forage elsewhere. The Coyote Hills colony is less than 2 km south of
the California Department of Fish and Game’s Eden Landing Ecological Reserve in Hayward, which is the
most important Western Snowy Plover breeding habitat in the South Bay (Robinson-Nilsen et al. 2009b).
During the 2009 Snowy Plover breeding season, SFBBO captured footage of California Gulls depredating
a Snowy Plover nest and newly hatched chicks (Robinson-Nilsen et al. 2009b). This was the first
documented evidence that California Gulls are impacting Snowy Plovers. If this colony continues to
grow, the potential impact the gulls could have on nesting Snowy Plovers may increase.
12
SFBBO Salt Pond Survey Report 2009
The California Gull colony at the Mowry complex continues to grow and gulls were the most abundant
guild at Mowry in all seasons (Robinson-Nilsen et al. 2009a). The gulls used the levees for nesting but we
also observed large numbers of gulls foraging on M3 and M4. The average salinity in both these ponds
was less than 180 ppt and the birds may have been feeding on the brine shrimp and brine flies these
ponds supported. The Mowry ponds are also located close to two active landfills, the Tri-Cities Landfill in
Fremont and the Newby Island Landfill in Milpitas. The Tri-Cities Landfill is scheduled to close in the next
few years, which may reduce the number of gulls nesting and roosting in the Mowry Complex. In
addition, the Newby Island Landfill started a gull abatement project in 2008 which has significantly
reduced the number of California Gulls feeding at the landfill during the breeding season (Robinson et al.
2009). We may see a reduction of the numbers of gulls nesting in the Mowry ponds if Newby Island
continues the abatement program into the future.
Eared Grebes and Phalaropes.--- As the SBSPRP continues, land managers are concerned that the loss of
medium and high salinity ponds may impact species that depend on saline habitats such as Eared Grebes
and Phalaropes. These species rely on saline bodies of water that host brine flies and brine shrimp
(Cullen et al. 1999). We typically recorded Eared Grebes and Phalaropes in ponds with average salinities
ranging from 63 ppt to 180 ppt. During this reporting period, we only observed 59 phalaropes during
our surveys. Phalaropes migrate through the Bay during a relatively short time period (J. Demers, pers.
obs.), and, therefore, by surveying the ponds once a month, we may might miss sampling ponds during
peak phalarope migration.
Medium and Small Shorebirds.--- Medium and small shorebirds were most abundant in areas with
moderate to high salinity. Additionally, the ponds were we observed the most shorebirds had islands or
levees that were suitable for roosting or water depth suitable for foraging. Again, brine shrimp and brine
flies are both important food sources for these species, but the ability of shorebirds (other than
phalaropes) to forage on these prey items is limited by their leg length, and therefore, water depth.
Furthermore, shorebird use of salt ponds is highly tide dependant (Warnock et al. 2001), and most
shorebird species in the San Francisco Bay use salt ponds as high‐tide refugia for roosting or foraging.
Therefore, the presence of roosting islands is integral for shorebirds in salt ponds.
MANAGEMENT RECOMMENDATIONS
1. Maintain the pond system to have a variety of water salinities for the various guilds. Special
consideration should be given to birds that prefer medium to high salinity ponds such as
phalaropes and Eared Grebes.
2. Provide lower water levels in some ponds for small and medium shorebirds during migration.
3. Provide islands or undisturbed levees for shorebird roosting habitat. This is especially important
during high tides.
4. Survey ponds every 2-3 days during phalarope migration. This will be necessary to accurately
monitor migrating phalaropes use of salt ponds.

13
SFBBO Salt Pond Survey Report 2009
5. Continue monitoring the avian use of these ponds as the South Bay Salt Pond Restoration Project
starts its restoration activities.
ACKNOWLEDGMENTS
This project was supported by a grant from the San Francisco Foundation Bay Fund. SFBBO would like to
thank Cheryl Strong, and Eric Mruz at the Don Edwards San Francisco Bay National Wildlife Refuge and
Pat Mapelli at Cargill Salt. We would also like to acknowledge Kathleen Henderson, Stacy Moskal and
Nicole Athearn at USGS for providing us technical support and for the use of their water quality testing
equipment. Thanks to our salt pond field crew: Mike Mammoser, Sam Scott and Josh Scullen.
LITERATURE CITED
Accurso, L. M. 1992. Distribution and abundance of wintering waterfowl on San Francisco Bay 1988–1990. Master’s Thesis. Humboldt State Univ., Arcata, CA, 252 pp.
Anderson, W. 1970. A preliminary study of the relationship of salt ponds and wildlife – South San
Francisco Bay. California Fish and Game 56: 240–252. Brua, Robert B. 2002. Ruddy Duck (Oxyura jamaicensis), In The Birds of North America, No. 696 (A.
Poole, Ed.). The Birds of North America, Inc., Philadelphia, PA. Carpelan, L.H. 1957. Hydrobiology of the Alviso Salt Ponds. Ecology: Vol. 38, No. 3, pp. 375-390. Cullen, S. A., J. R. Jehl Jr., and G. L. Nuechterlein. 1999. Eared Grebe (Podiceps nigricollis). In Birds of
North America, No. 433 (A. Poole and F. Gill, Eds.). The Birds of North America, Inc., Philadephia, PA.
Drilling, Nancy, Rodger Titman and Frank Mckinney. 2002. Mallard (Anas platyrhynchos), In The Birds of
North America , No. 658 (A. Poole and F. Gill, Eds.). The Birds of North America, Inc., Philadephia, PA.
Dubowy, Paul J. 1996. Northern Shoveler (Anas clypeata), In The Birds of North America, No. 217 (A. Poole, Ed.). The Birds of North America, Inc., Philadephia, PA.
Leschack, C. R., S. K. Mckinght and G. R. Hepp. 1997. Gadwall (Anas strepera), The Birds of North America No. 283 (A. Poole and F. Gill, Eds.). The Birds of North America, Inc., Philadephia, PA.
Mowbray, Thomas. 1999. American Wigeon (Anas americana), In The Birds of North America, No. 410 (A. Poole and F. Gill, Eds.). The Birds of North America, Inc., Philadephia, PA.
Page, G. W., L. E. Stenzel, and C. M. Wolfe. 1999. Aspects of the occurrence of shorebirds on a central
California estuary. Studies in Avian Biology 2: 15–32. Robinson, C., J. Demers, C. Schacter. 2009. Gull Abatement Surveys at Newby Island Landfill, 2007‐2008.
Unpublished Report. San Francisco Bay Bird Observatory, Milpitas, CA.

14
SFBBO Salt Pond Survey Report 2009
Robinson-Nilsen, C., C. Schacter and J. Demers. 2009a. Colonial Waterbird Nesting Summary for the South San Francisco Bay, 2009. Unpublished Report. San Francisco Bay Bird Observatory, Milpitas, CA.
Robinson-Nilsen, C., J. Demers, and C. Strong. 2009b. Western Snowy Plover Numbers, Nesting Success,
Fledging Success and Avian Predator Surveys in the San Francisco Bay, 2009. Unpublished Report. San Francisco Bay Bird Observatory, Milpitas, CA.
Takekawa, J. Y., C. T. Lu, and R. T. Pratt. 2001. Bird communities in salt evaporation ponds and baylands
of the northern San Francisco Bay estuary. Hydrobiologia 466: 317–328. Ver Planck, W. E. 1958. Salt in California. Calif. Div. of Mines Bull. No. 175. Warnock, N., G. W. Page, T. D. Ruhlen, N. Nur, J. Y. Takekawa, and J. T. Hanson. 2002. Management and
conservation of San Francisco Bay salt ponds: effects of pond salinity, area, tide and season on Pacific Flyway waterbirds. Waterbirds 25: 79–92.
15
SFBBO Salt Pond Survey Report 2009
Table 1. Species richness, totals abundance, and acreage by pond and area, Don Edwards San Francisco
Bay National Wildlife Refuge, CA, Oct. 2008 – Sept. 2009.
Complex Pond Species
Richness Total Birds
Percent of Total birds in Survey Area Acreage
Percent of Total Acreage in
Survey Area
Coyote Hills N1A 46 11730 2.8% 172.574 2.5%
N2A 40 14263 3.4% 171.392 2.5%
N3A 47 17939 4.3% 417.868 6.1%
N4 30 11288 2.7% 339.648 5.0%
N4AA 44 6240 1.5% 299.309 4.4%
N4AB 49 16293 3.9% 237.529 3.5%
N4B 34 1950 0.5% 72.95 1.1%
N5 25 1801 0.4% 193.632 2.8%
N6 27 5284 1.3% 94.175 1.4%
N7 34 4399 1.0% 383.576 5.6%
N8 32 5514 1.3% 114.133 1.7%
N9 35 4886 1.2% 128.431 1.9%
Coyote Hills Total 73 101587 24.1% 2625.217 38.3%
Dumbarton N1 37 37878 9.0% 344.733 5.0%
N2 26 7363 1.7% 193.109 2.8%
N3 36 24648 5.8% 553.502 8.1%
NPP1 32 21920 5.2% 195.309 2.9%
Dumbarton
Total 51 91809 21.8% 1286.653 18.8%
Mowry M1 39 23441 5.6% 496.541 7.3%
M2 27 18536 4.4% 485.474 7.1%
M3 35 27669 6.6% 549.936 8.0%
M4 23 33441 7.9% 537.507 7.9%
M5 23 86098 20.4% 415.117 6.1%
M6 19 39358 9.3% 449.461 6.6%
Mowry Total 55 228543 54.16% 2934.036 42.9%
Survey Area Total 84 421939 100% 6845.906 100%
16
SFBBO Salt Pond Survey Report 2009
Table 2. Percentage of total birds foraging, resting, or on levees, manmade structures or islands in each
salt pond, Don Edwards San Francisco Bay National Wildlife Refuge, CA, Oct. 2008 – Sept. 2009.
Complex Pond % Foraging % Resting % Levee % Manmade % Island
Coyote Hills N1A 21.51% 50.28% 20.91% 5.71% 1.59%
N2A 5.88% 33.67% 60.05% 0.14% 0.26%
N3A 9.82% 21.66% 68.15% 0.27% 0.09%
N4 20.97% 2.09% 61.92% 0.27% 14.75%
N4AA 23.46% 56.46% 13.97% 4.36% 1.75%
N4AB 5.90% 44.45% 46.18% 0.28% 3.19%
N4B 54.67% 8.72% 26.00% 10.05% 0.56%
N5 7.22% 4.78% 71.63% 8.22% 8.16%
N6 13.40% 0.42% 85.79% 0.00% 0.40%
N7 5.71% 7.77% 74.49% 1.00% 11.03%
N8 1.69% 5.68% 92.38% 0.02% 0.24%
N9 46.38% 4.24% 28.86% 0.08% 20.45%
Dumbarton N1 14.01% 7.13% 3.40% 2.89% 72.57%
N2 46.24% 36.63% 3.94% 0.33% 12.86%
N3 25.44% 18.69% 15.81% 3.01% 37.05%
NPP1 34.77% 12.39% 0.77% 0.03% 52.05%
Mowry M1 7.45% 37.11% 51.91% 0.24% 3.28%
M2 3.26% 1.58% 49.99% 0.04% 45.13%
M3 33.51% 49.68% 11.27% 0.63% 4.92%
M4 28.07% 30.51% 40.66% 0.00% 0.75%
M5 9.80% 7.45% 24.10% 0.00% 58.65%
M6 3.80% 5.99% 16.39% 4.25% 69.58%
17
SFBBO Salt Pond Survey Report 2009
Table 3. The monthly average salinity (ppt) by area and pond, Don Edwards San Francisco Bay National Wildlife Refuge, CA, Oct. 2008 – Sept.
2009. We were unable to access ponds M1-M3 to collect water quality data in August 2009 due to levee maintenance.
2008 2009
Area Pond October November December January February March April May June July August September
Coyote Hills N1A 37.79 33.75 36.74 38.93 36.79 33.59 37.74 31.53 31.65 31.06 31.36 33.20
N2A 38.51 36.37 38.41 40.07 37.70 34.32 37.47 41.51 32.04 32.43 34.66 36.10
N3A 43.07 41.46 42.72 42.35 39.42 34.76 38.68 48.11 36.45 37.23 41.31 42.38
N4 63.28 60.46 61.84 63.17 58.95 52.44 56.84 68.45 67.61 61.90 65.17 80.30
N4AA 43.82 42.97 44.36 43.09 40.33 34.84 39.31 49.74 37.51 39.44 44.67 44.33
N4AB 42.47 38.29 39.46 40.88 38.22 34.55 37.92 44.26 32.78 33.28 36.56 38.15
N4B 45.62 45.23 48.77 50.01 48.04 38.29 49.08 69.49 39.12 41.76 48.57 50.13
N5 61.67 56.95 60.89 61.91 58.04 50.89 55.26 67.17 59.50 55.22 60.88 67.81
N6 51.36 49.40 53.32 55.25 51.96 46.73 52.31 62.02 41.36 42.24 50.77 51.62
N7 54.74 44.80 55.39 55.79 52.84 47.38 53.08 63.53 52.68 48.99 56.84 61.07
N8 48.67 49.12 51.91 54.06 51.05 46.19 51.58 65.57 45.79 44.88 51.78 53.69
N9 47.00 46.46 50.39 52.98 49.68 45.61 50.98 64.63 40.42 42.64 48.57 47.85
Dumbarton N1 135.00 104.00 99.40 95.00 96.50 85.10 95.00 128.00 148.00 138.00 126.00 135.00
N2 104.10 80.59 88.08 83.80 83.30 68.38 79.02 105.00 111.00 92.11 98.18 109.50
N3 83.99 78.87 80.21 77.06 77.62 64.17 73.50 92.79 89.05 71.61 82.12 93.60
NPP1 159.50 111.00 110.00 112.50 112.00 99.00 111.00 150.50 179.00 167.00 153.00 163.00
Mowry M1 41.74 55.97 56.92 58.84 57.31 53.67 60.83 37.00 33.73 29.23 29.23
M2 53.75 26.16 59.88 64.54 60.77 59.25 63.81 59.67 51.12 56.37 52.72
M3 124.00 131.75 145.25 127.75 128.50 116.00 124.75 131.00 107.75 129.50 105.92
M4 160.33 170.00 170.00 181.00 182.33 175.00 194.00 206.50 191.00 174.00 171.00 153.67
M5 180.33 227.67 238.33 202.67 216.00 214.33 231.00 240.67 238.33 238.67 202.00 216.33
M6 209.00 262.67 258.33 233.00 233.00 217.67 240.67 275.67 279.33 283.00 245.50 252.67
18
SFBBO Salt Pond Survey Report 2009
Table 4. The monthly average temperature (degrees Celsius) by area and pond, Don Edwards San Francisco Bay National Wildlife Refuge, CA,
Oct. 2008 – Sept. 2009. We were unable to access ponds M1-M3 to collect water quality data in August 2009 due to levee maintenance.
2008 2009
Area Pond October November December January February March April May June July August September
Coyote Hills N1A 22.27 17.51 13.48 12.60 14.27 12.43 16.90 20.96 20.85 24.94 23.25 24.02
N2A 22.40 17.14 14.97 12.27 14.73 13.26 16.96 21.13 20.79 24.45 23.58 23.33
N3A 20.38 17.09 13.44 11.58 16.23 13.19 15.58 20.25 19.23 22.29 23.60 30.09
N4 24.31 20.75 16.44 13.89 18.68 16.13 19.79 26.24 24.59 29.08 25.74 26.87
N4AA 22.11 17.82 14.85 13.19 15.52 13.31 16.74 21.03 20.76 24.07 24.54 27.63
N4AB 24.16 17.30 15.82 12.36 17.17 13.12 16.56 21.41 21.15 25.51 25.16 24.45
N4B 23.25 19.32 16.12 14.27 15.60 14.22 17.98 24.49 22.79 26.53 26.04 27.37
N5 21.36 17.84 15.30 12.50 15.59 13.43 16.56 20.80 20.99 25.04 23.78 24.68
N6 22.70 19.95 16.34 16.23 16.64 13.82 18.80 26.65 22.99 26.30 25.83 26.53
N7 20.71 17.11 14.10 15.09 14.67 12.61 15.55 19.63 20.49 23.38 23.80 25.07
N8 21.58 17.29 14.65 13.32 17.24 13.51 16.87 21.20 20.56 24.74 22.99 24.58
N9 22.99 17.56 15.36 13.44 15.00 13.15 17.67 24.04 23.20 27.06 25.35 26.63
Dumbarton N1 24.22 14.84 14.24 14.76 19.21 12.22 16.55 17.70 24.88 25.13 24.83 28.13
N2 24.58 20.49 14.86 17.48 15.65 15.01 17.71 22.54 22.29 26.35 24.16 25.64
N3 24.07 19.57 14.94 16.01 17.18 15.54 18.83 23.31 22.20 25.15 24.47 26.18
NPP1 24.72 14.84 13.14 18.91 18.08 12.56 16.86 17.13 26.30 25.28 24.18 28.62
Mowry M1 24.52 20.83 15.83 16.98 19.66 12.16 20.86 22.57 24.27 25.46 28.46
M2 23.75 18.81 14.26 12.03 17.51 12.74 17.71 21.72 23.82 26.28 27.19
M3 24.14 18.99 13.81 14.56 16.21 15.55 18.61 21.21 23.60 26.82 27.76
M4 24.46 18.72 14.02 14.83 18.77 15.49 20.42 23.73 25.86 27.11 27.70 30.69
M5 24.60 19.26 14.61 15.13 17.92 14.83 19.39 22.45 24.95 27.73 27.28 30.64
M6 25.46 19.49 14.61 16.03 17.98 14.46 20.16 22.88 27.37 29.49 27.43 30.32
19
SFBBO Salt Pond Survey Report 2009
Table 5. The monthly average dissolved oxygen (mg/l) by area and pond, Don Edwards San Francisco Bay National Wildlife Refuge, CA, Oct.
2008 – Sept. 2009. We were unable to access ponds M1-M3 to collect water quality data in August 2009 due to levee maintenance.
2008 2009
Area Pond October November December January February March April May June July August September
Coyote Hills N1A 8.83 10.85 9.60 11.61 8.51 11.53 7.08 7.20 8.16 7.88 7.69 7.24
N2A 9.80 8.77 10.38 8.98 5.28 12.10 5.87 7.99 6.96 8.09 6.75 6.54
N3A 5.78 14.37 5.61 9.31 8.53 10.70 8.55 12.26 7.43 5.43 7.80 7.99
N4 8.58 8.61 10.00 9.12 9.61 7.53 3.96 6.59 8.55 7.46 7.78 6.48
N4AA 4.57 9.87 4.91 9.52 10.80 10.11 6.77 10.67 6.70 6.10 5.94 5.04
N4AB 2.70 6.83 9.61 10.62 8.18 10.35 5.41 8.99 9.42 9.73 8.50 3.57
N4B 9.87 8.93 9.41 12.51 11.02 9.47 5.73 8.61 8.84 7.30 8.00 5.68
N5 6.00 7.94 8.24 9.61 12.11 9.86 3.87 5.69 6.34 5.48 6.86 5.25
N6 7.92 9.30 11.08 8.60 9.36 10.12 4.78 5.89 9.61 8.72 9.81 7.74
N7 4.73 8.29 7.55 9.44 11.25 9.14 4.13 5.01 4.80 3.80 7.35 6.86
N8 5.46 9.01 8.03 8.98 10.44 8.11 3.94 5.16 6.18 4.74 6.98 5.02
N9 7.20 9.40 8.55 8.70 10.18 8.58 4.04 6.31 9.18 8.72 9.04 6.36
Dumbarton N1 4.29 6.53 6.61 9.85 6.02 5.38 3.66 5.26 4.29 4.53 4.82 8.17
N2 7.79 9.61 7.84 9.85 7.34 8.53 3.08 4.55 5.84 4.16 6.41 8.21
N3 9.22 7.38 8.06 8.28 8.37 9.43 3.62 5.21 5.94 3.87 7.84 7.39
NPP1 4.02 6.68 5.66 8.84 6.02 4.86 4.73 6.85 4.20 1.03 3.01 5.82
Mowry M1 8.59 7.01 9.46 11.03 7.33 8.06 7.29 40.74 17.97 6.91 13.58
M2 9.34 8.02 7.61 6.61 4.91 7.70 5.59 19.49 8.79 8.72 6.98
M3 6.20 5.49 8.52 7.18 4.40 4.73 2.55 7.20 4.33 4.59 7.20
M4 3.42 4.77 2.53 11.87 4.86 5.25 3.08 2.18 2.22 2.16 1.26 4.27
M5 2.13 4.26 2.81 8.80 5.03 5.08 2.63 3.47 2.53 2.37 2.35 4.27
M6 4.35 3.53 2.51 7.10 5.69 4.91 3.19 3.11 2.15 2.99 1.29 2.77
20
SFBBO Salt Pond Survey Report 2009
Table 6. The monthly average pH by area and pond, Don Edwards San Francisco Bay National Wildlife Refuge, CA, Oct. 2008 – Sept. 2009. We
were unable to access ponds M1-M3 to collect water quality data in August 2009 due to levee maintenance. The pH meter was broken in
September and we were unable to collect that data.
2008 2009
Area Pond October November December January February March April May June July August September
Coyote Hills N1A 8.13 7.98 8.27 8.45 8.09 8.76 8.49 8.21 8.13 8.45 7.94
N2A 8.53 8.15 8.22 8.29 7.97 8.48 8.31 8.38 8.36 8.80 7.92
N3A 8.40 8.33 8.05 8.18 8.35 8.17 7.68 8.02 8.23 8.56 8.95
N4 8.66 8.55 8.65 8.50 8.79 8.73 8.29 8.26 8.23 8.36 8.31
N4AA 8.48 8.26 8.07 8.32 8.24 8.14 7.73 7.97 8.22 8.50 8.82
N4AB 7.65 8.00 8.17 8.29 8.25 8.38 8.11 8.23 8.43 9.23 8.39
N4B 8.75 8.34 8.51 8.49 8.44 8.06 7.82 8.33 8.28 8.75 8.78
N5 8.53 8.50 8.59 8.51 8.65 8.72 8.00 8.00 8.17 8.34 8.34
N6 8.71 8.59 8.70 8.54 8.47 8.39 7.80 7.69 8.33 8.88 9.08
N7 8.52 8.46 8.52 8.47 8.44 8.34 7.56 7.84 8.15 8.36 8.75
N8 8.54 8.45 8.46 8.55 8.37 8.29 7.57 7.90 8.18 8.55 8.86
N9 8.63 8.42 8.41 8.36 8.36 8.23 7.70 8.06 8.32 8.95 8.97
Dumbarton N1 7.82 8.39 8.59 8.49 8.63 8.24 7.66 7.31 7.88 7.87 7.77
N2 8.27 8.50 8.73 8.78 8.86 9.09 8.90 8.58 8.15 7.98 7.82
N3 8.63 8.41 8.60 8.55 8.86 9.00 8.73 8.54 8.21 8.10 8.00
NPP1 7.69 8.16 8.24 8.43 8.44 8.35 7.40 7.39 7.89 7.64 7.56
Mowry M1 8.30 8.15 7.88 8.48 8.49 8.16 8.25 8.51 9.08 7.90
M2 8.41 8.22 8.44 8.27 8.33 8.20 8.18 8.30 8.71 8.65
M3 8.02 7.94 8.11 8.21 8.03 7.88 7.43 7.57 8.06 7.96
M4 7.82 7.66 7.72 8.00 7.88 7.78 7.51 7.33 7.66 7.84 7.49
M5 7.73 7.55 7.59 7.79 7.82 7.79 7.46 7.25 7.55 7.65 7.45
M6 7.62 7.44 7.51 7.63 7.75 7.80 7.41 7.16 7.45 7.51 7.32
21
SFBBO Salt Pond Survey Report 2009
Table 7. Correlation and Standardized Canonical Coefficients between Water Quality and Guild Variables.
First Canonical Correlation Second Canonical Correlation
Loading Coefficient Loading Coefficient
Water Quality
Acres -0.736 -0.434 -0.183 -0.232
pH 0.393 -0.387 0.160 0.289
Dissolved Oxygen 0.544 0.122 0.275 -0.025
Salinity -0.880 -0.881 -0.042 0.422
Temperature -0.101 0.093 -0.945 -0.991
Guilds
Dabbler -0.103 -0.062 0.385 0.117
Diver 0.444 0.314 0.686 0.708
Eared Grebe -0.387 -0.328 0.367 0.167
Fish eater 0.419 0.045 -0.200 -0.111
Goose 0.215 0.144 0.392 0.371
Gull -0.627 -0.520 -0.054 0.039
Heron 0.635 0.345 -0.068 -0.086
Medium Shorebird -0.243 -0.104 0.371 0.209
Small Shorebird -0.259 -0.068 0.421 0.275
Tern 0.415 0.216 -0.260 -0.167
22
SFBBO Salt Pond Survey Report 2009
Figure 1. The Coyote Hills, Dumbarton, and Mowry salt pond complexes, Don Edwards San Francisco Bay National Wildlife Refuge, South San
Francisco Bay, CA.
23
SFBBO Salt Pond Survey Report 2009
Figure 2. Average (± 1 standard error) seasonal bird use by guild and salinity (ppt) in the Coyote Hills Complex, Don Edwards San Francisco
Bay National Wildlife Refuge, CA, Oct. 2008 ‐Sept. 2009.

24
SFBBO Salt Pond Survey Report 2009
Figure 3. Average (± 1 standard error) seasonal bird use by guild and salinity (ppt) in the Dumbarton Complex, Don Edwards San Francisco Bay
National Wildlife Refuge, CA, Oct. 2008 ‐Sept. 2009.
25
SFBBO Salt Pond Survey Report 2009
Figure 4. Average (± 1 standard error) seasonal bird use by guild and salinity (ppt) in the Dumbarton Complex, Don Edwards San Francisco Bay National Wildlife Refuge, CA, Oct. 2008 ‐Sept. 2009.

26
SFBBO Salt Pond Survey Report 2009
Figure 5. Total abundance in each 250 m2 salt pond grid in Coyote Hills, Dumbarton, and Mowry salt pond complexes, Don Edwards San Francisco Bay National Wildlife Refuge, South San Francisco Bay, CA, Oct. 2008 ‐Sept. 2009.
27
SFBBO Salt Pond Survey Report 2009
Figure 6. Dabbler guild abundance in each 250 m2 salt pond grid in Coyote Hills, Dumbarton, and Mowry salt pond complexes, Don Edwards San Francisco Bay National Wildlife Refuge, South San Francisco Bay, CA, Oct. 2008 ‐Sept. 2009.

28
SFBBO Salt Pond Survey Report 2009
Figure 7. Diver guild abundance in each 250 m2 salt pond grid in Coyote Hills, Dumbarton, and Mowry salt pond complexes, Don Edwards San Francisco Bay National Wildlife Refuge, South San Francisco Bay, CA, Oct. 2008 ‐Sept. 2009.

29
SFBBO Salt Pond Survey Report 2009
Figure 8. Eared Grebe guild abundance in each 250 m2 salt pond grid in Coyote Hills, Dumbarton, and Mowry salt pond complexes, Don Edwards San Francisco Bay National Wildlife Refuge, South San Francisco Bay, CA, Oct. 2008 ‐Sept. 2009.

30
SFBBO Salt Pond Survey Report 2009
Figure 9. Fish eater guild abundance in each 250 m2 salt pond grid in Coyote Hills, Dumbarton, and Mowry salt pond complexes, Don Edwards San Francisco Bay National Wildlife Refuge, South San Francisco Bay, CA, Oct. 2008 ‐Sept. 2009.
31
SFBBO Salt Pond Survey Report 2009
Figure 10. Goose guild abundance in each 250 m2 salt pond grid in Coyote Hills, Dumbarton, and Mowry salt pond complexes, Don Edwards San Francisco Bay National Wildlife Refuge, South San Francisco Bay, CA, Oct. 2008 ‐Sept. 2009.

32
SFBBO Salt Pond Survey Report 2009
Figure 11. Gull guild abundance in each 250 m2 salt pond grid in Coyote Hills, Dumbarton, and Mowry salt pond complexes, Don Edwards San Francisco Bay National Wildlife Refuge, South San Francisco Bay, CA, Oct. 2008 ‐Sept. 2009.
33
SFBBO Salt Pond Survey Report 2009
Figure 12. Heron guild abundance in each 250 m2 salt pond grid in Coyote Hills, Dumbarton, and Mowry salt pond complexes, Don Edwards San Francisco Bay National Wildlife Refuge, South San Francisco Bay, CA, Oct. 2008 ‐Sept. 2009.
34
SFBBO Salt Pond Survey Report 2009
Figure 13. Medium Shorebird guild abundance in each 250 m2 salt pond grid in Coyote Hills, Dumbarton, and Mowry salt pond complexes, Don Edwards San Francisco Bay National Wildlife Refuge, South San Francisco Bay, CA, Oct. 2008 ‐Sept. 2009.
35
SFBBO Salt Pond Survey Report 2009
Figure 14. Phalarope guild abundance in each 250 m2 salt pond grid in Coyote Hills, Dumbarton, and Mowry salt pond complexes, Don Edwards San Francisco Bay National Wildlife Refuge, South San Francisco Bay, CA, Oct. 2008 ‐Sept. 2009.

36
SFBBO Salt Pond Survey Report 2009
Figure 15. Small Shorebird guild abundance in each 250 m2 salt pond grid in Coyote Hills, Dumbarton, and Mowry salt pond complexes, Don Edwards San Francisco Bay National Wildlife Refuge, South San Francisco Bay, CA, Oct. 2008 ‐Sept. 2009.
37
SFBBO Salt Pond Survey Report 2009
Figure 16. Tern guild abundance in each 250 m2 salt pond grid in Coyote Hills, Dumbarton, and Mowry salt pond complexes, Don Edwards San Francisco Bay National Wildlife Refuge, South San Francisco Bay, CA, Oct. 2008 ‐Sept. 2009.