Embed Size (px)
Citation preview

NCES 2018-028 U.S. DEPARTMENT OF EDUCATION
Career and Technical Education Programs in Public School Districts: 2016–17

Career and Technical Education Programs in Public School Districts: 2016–17 First Look
April 2018
Lucinda Gray Laurie Lewis Westat
John Ralph Project Officer National Center for Education Statistics
NCES 2018-028 U.S. DEPARTMENT OF EDUCATION

U.S. Department of Education Betsy DeVos Secretary
Institute of Education Sciences Thomas Brock Commissioner for Education Research Delegated the Duties of the Director
National Center for Education Statistics James L. Woodworth Commissioner
The National Center for Education Statistics (NCES) is the primary federal entity for collecting, analyzing, and reporting data related to education in the United States and other nations. It fulfills a congressional mandate to collect, collate, analyze, and report full and complete statistics on the condition of education in the United States; conduct and publish reports and specialized analyses of the meaning and significance of such statistics; assist state and local education agencies in improving their statistical systems; and review and report on education activities in foreign countries.
NCES activities are designed to address high-priority education data needs; provide consistent, reliable, complete, and accurate indicators of education status and trends; and report timely, useful, and high-quality data to the U.S. Department of Education, the Congress, the states, other education policymakers, practitioners, data users, and the general public. Unless specifically noted, all information contained herein is in the public domain.
We strive to make our products available in a variety of formats and in language that is appropriate to a variety of audiences. You, as our customer, are the best judge of our success in communicating information effectively. If you have any comments or suggestions about this or any other NCES product or report, we would like to hear from you. Please direct your comments to
NCES, IES, U.S. Department of Education Potomac Center Plaza (PCP) 550 12th Street SW Washington, DC 20202
April 2018
The NCES Home Page address is http://nces.ed.gov. The NCES Publications and Products address is http://nces.ed.gov/pubsearch.
This publication is only available online. To download, view, and print the report as a PDF file, go to the NCES Publications and Products address shown above.
This report was prepared for the National Center for Education Statistics under Contract No. ED-04-C0-0059/0025 with Westat. Mention of trade names, commercial products, or organizations does not imply endorsement by the U.S. Government.
Suggested Citation Gray, L., and Lewis, L. (2018). Career and Technical Education Programs in Public School Districts: 2016–17: First Look (NCES 2018-028). U.S. Department of Education. Washington, DC: National Center for Education Statistics. Retrieved [date] from http://nces.ed.gov/pubsearch.
Content Contact John Ralph (202) 245-6152 [email protected]

iii
Acknowledgments
The authors would like to recognize the respondents from public school districts who provided data on career and technical education programs upon which the report is based.

iv
Contents
Page
Acknowledgments ................................................................................................................................... iii
List of Tables ............................................................................................................................................ v
Introduction .............................................................................................................................................. 1
Selected Findings ..................................................................................................................................... 2
Tables ....................................................................................................................................................... 4
References .............................................................................................................................................. 21
Appendix A: Standard Error Tables ..................................................................................................... A-1
Appendix B: Technical Notes .............................................................................................................. B-1
Appendix C: Questionnaire .................................................................................................................. C-1

v
List of Tables
Table Page
1. Percent of public school districts reporting that they offer career and technical education (CTE) programs to students at the high school level, that students in their enrollment area have the option of enrolling in a CTE district, and the percent reporting the entities that provide CTE programs and the locations where the district offers CTE programs, by district characteristics: 2016–17 ...................... 5
2. Percentage distribution of public school districts reporting on how many of the career and technical education (CTE) programs offered to high school students are structured as career pathways that align with related postsecondary programs, and the percent of districts that offer various types of CTE courses, by district characteristics: 2016–17 ...................................................................................... 6
3. Percent of public school districts reporting that various work-based learning activities are included in the career and technical education (CTE) programs offered to high school students, and the percentage distribution of districts reporting on how many of their CTE programs require work-based learning, by district characteristics: 2016–17 ........................................................................................... 7
4. Percentage distributions of public school districts reporting the extent to which employers are involved in various ways with the career and technical education (CTE) programs offered by the district to high school students, by district characteristics: 2016–17 ....................................................................................................... 8
5. Percentage distributions of public school districts reporting on how much of a barrier various items are to the district in offering career and technical education (CTE) programs to high school students, by district characteristics: 2016–17 .................. 12
6. Percentage distributions of public school districts reporting on how much of a barrier various items are to student participation in the career and technical education (CTE) programs offered by the district to high school students, by district characteristics: 2016–17 .................................................................................... 14
7. Percent of public school districts with a decision-making role in adding or phasing out career and technical education (CTE) programs for high school students, and the percentage distributions of those districts reporting the extent to which various factors influence those decisions, by district characteristics: 2016–17 .............................................................................................................................. 16

vi
Appendix A Table Page
A-1. Standard errors for table 1: Percent of public school districts reporting that they offer career and technical education (CTE) programs to students at the high school level, that students in their enrollment area have the option of enrolling in a CTE district, and the percent reporting the entities that provide CTE programs and the locations where the district offers CTE programs, by district characteristics: 2016–17 .................................................................................................. A-2
A-2. Standard errors for table 2: Percentage distribution of public school districts reporting on how many of the career and technical education (CTE) programs offered to high school students are structured as career pathways that align with related postsecondary programs, and the percent of districts that offer various types of CTE courses, by district characteristics: 2016–17 ............................................. A-3
A-3. Standard errors for table 3: Percent of public school districts reporting that various work-based learning activities are included in the career and technical education (CTE) programs offered to high school students, and the percentage distribution of districts reporting on how many of their CTE programs require work-based learning, by district characteristics: 2016–17 .............................................. A-4
A-4. Standard errors for table 4: Percentage distributions of public school districts reporting the extent to which employers are involved in various ways with the career and technical education (CTE) programs offered by the district to high school students, by district characteristics: 2016–17 ....................................................... A-5
A-5. Standard errors for table 5: Percentage distributions of public school districts reporting on how much of a barrier various items are to the district in offering career and technical education (CTE) programs to high school students, by district characteristics: 2016–17 ................................................................................. A-9
A-6. Standard errors for table 6: Percentage distributions of public school districts reporting on how much of a barrier various items are to student participation in the career and technical education (CTE) programs offered by the district to high school students, by district characteristics: 2016–17 ............................................. A-11
A-7. Standard errors for table 7: Percent of public school districts with a decision-making role in adding or phasing out career and technical education (CTE) programs for high school students, and the percentage distributions of those districts reporting the extent to which various factors influence those decisions, by district characteristics: 2016–17 ............................................................................... A-13
Appendix B Table Page
B-1. Number and percentage of responding public school districts in the study sample, and estimated number and percentage of public school districts the sample represents, by district characteristics: School year 2016–17 ................................ B-4
1
Introduction
This report is based on the 2016–17 survey “Career and Technical Education Programs in Public School Districts” and provides nationally representative data on career and technical education (CTE) programs. The survey defines a CTE program as a sequence of courses at the high school level that provides students with the academic and technical knowledge and skills needed to prepare for further education and careers in current or emerging professions. For this survey, districts were instructed to include all CTE programs that the district offers to high school students, including programs provided by the district or by other entities (such as an area/regional CTE center, a consortium of districts, or a community or technical college). The report provides information about the entities that provide the CTE programs and the locations at which the CTE programs are offered to high school students. It also presents data about work-based learning activities and employer involvement in CTE programs, as well as barriers to the district offering CTE programs and barriers to student participation in CTE programs. Data are also presented about the extent to which various factors influence the district’s decisions on whether to add or phase out CTE programs.
The National Center for Education Statistics (NCES), in the Institute of Education Sciences, conducted this survey in spring 2017 using the Fast Response Survey System (FRSS). FRSS is a survey system designed to collect small amounts of issue-oriented data from a nationally representative sample of districts, schools, or teachers with minimal burden on respondents and within a relatively short period of time. The survey was mailed to approximately 1,800 public school districts with high school grades in the United Stated (50 states and the District of Columbia). The cover letter and questionnaire indicated that the survey was designed to be completed by the person in the district most knowledgeable about career and technical education programs for high school students. Respondents were asked to provide information for the 2016–17 school year and the summer of 2016, and were offered options of completing the survey on paper or online.
The unweighted survey response rate was 87 percent and the weighted response rate using the initial base weights was 86 percent. The survey weights were adjusted for questionnaire nonresponse and the data were then weighted to yield national estimates that represent all eligible public school districts with high schools in the United States (50 states and the District of Columbia). Tables of standard error estimates are provided in appendix A. See the technical notes (appendix B) for detailed information about the survey methodology. Appendix B also includes definitions of the analysis variables (i.e., district characteristics) used in the report. The questionnaire is located in appendix C.
Because the purpose of this report is to introduce new NCES data from the survey through tables containing descriptive information, only selected national findings are presented. These findings have been chosen to demonstrate the range of information available from the FRSS study rather than to discuss all of the data collected; they are not meant to emphasize any particular issue. Readers are cautioned not to make causal inferences about the data presented here. The findings are based on self-reported data from public school districts. Many of the variables examined are related to one another, and complex interactions and relationships have not been explored.

2
Selected Findings
This section presents selected findings based on survey responses about career and technical education (CTE) programs in public school districts with high school grades in the 2016–17 school year.
• During the 2016–17 school year, 98 percent of public school districts offered CTE programs to students at the high school level (table 1).
• Nationwide, 10 percent of districts reported that students in their enrollment area have the option of enrolling in a CTE district that provides only CTE programs instead of enrolling in their home district (table 1).
The findings below are based on the 98 percent of public school districts that offered CTE programs to students at the high school level in the 2016–17 school year.
• Districts reported that the following entities provided the CTE programs that the district offered: the district individually (77 percent of districts), area/regional CTE centers or a group/consortium of school districts (54 percent of districts), 2-year community or technical colleges (46 percent of districts), and 4-year colleges or universities (11 percent of districts; table 1).
• Districts reported offering CTE programs at the following locations: 83 percent at the district’s regular (comprehensive) high schools, 43 percent at CTE centers attended part-time, 35 percent at 2-year community or technical colleges or 4-year colleges/universities, 12 percent at CTE-focused high schools attended full time, and 11 percent at another district’s regular (comprehensive) high school (table 1).
• About one-third (32 percent) of districts reported that all of their CTE programs were structured as career pathways that align with related postsecondary programs, and an additional one-third (33 percent) reported that most of their programs were structured this way (table 2).
• Seventy-three percent of districts offered CTE courses for which students could earn both high school and postsecondary credit; 61 percent offered CTE courses in which students could earn high school credits in math, science, English/language arts, or social studies; and 30 percent offered online CTE courses, including blended/hybrid courses (table 2).
• Districts reported that the following work-based learning activities were included in one or more of the CTE programs they offered: on-the-job training, internships, practicums, clinical experiences, or cooperative education (77 percent of districts); mentoring by local employers (65 percent of districts); student-run enterprises or services (55 percent of districts); apprenticeships or pre-apprenticeship programs (31 percent of districts); other work-based learning (16 percent of districts; table 3).1
• One-fourth (25 percent) of districts reported that none of the CTE programs they offered required work-based learning, 31 percent of districts reported few of the programs had this requirement, and 24 percent reported that some of the programs had this requirement (table 3).
• A larger percentage of city districts than rural districts offered CTE programs with work-based learning activities, including student-run enterprises or services (72 percent compared to 43 percent); mentoring by local employers (87 percent compared to 55 percent); on-the-job training, internships, practicums, clinical experiences, or cooperative education (95 percent compared to 68 percent); and apprenticeships or pre-apprenticeship programs (35 percent compared to 26 percent; table 3).
• A larger percentage of districts in the Northeast compared to districts in the West offered CTE programs with work-based learning activities, including student-run enterprises or services (75 percent compared to 42 percent); mentoring by local employers (75 percent compared to 55 percent); on-the-job training, internships, practicums, clinical experiences, or cooperative education (92 percent compared to
1 Examples of other work-based learning include job shadowing, tours and field trips, and guest speakers.

3
66 percent); and apprenticeships or pre-apprenticeship programs (33 percent compared to 17 percent; table 3).
• Districts reported that employers were involved in the following ways to a large or very large extent with the CTE programs offered by the district: serve on the district’s CTE advisory council (43 percent of districts), advise about which occupations are in demand (33 percent of districts), provide guidance on industry standards (32 percent of districts), provide guidance on equipment or facilities (31 percent of districts), and serve as guest speakers to CTE students (31 percent of districts; table 4).
• Districts reported that the following were large or very large barriers to the district in offering CTE programs to high school students: lack of funding or high cost of programs (50 percent of districts), finding or keeping teachers for in-demand industries and occupations (44 percent of districts), and facilities or space limitations (43 percent of districts; table 5).
• Districts reported that the following were large or very large barriers to student participation in CTE programs offered by the district: lack of time in students’ schedules (25 percent of districts), students’ difficulty finding work-based learning (23 percent of districts), and transportation for work-based learning (20 percent of districts; table 6). Districts also reported that the following were not barriers to student participation in CTE programs: teachers’ or guidance counselors’ negative perceptions of CTE (58 percent of districts), transportation to CTE programs (44 percent of districts), and lack of student support services for special populations (42 percent).
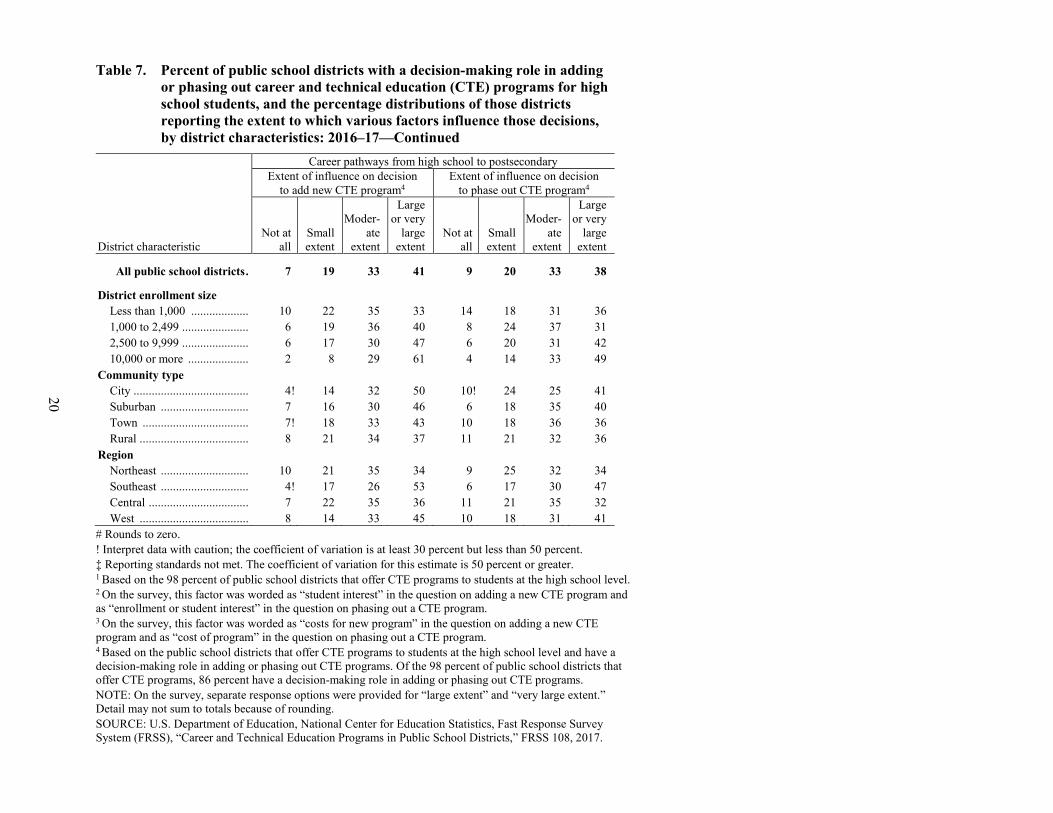
• Of the districts that offered CTE programs to students at the high school level, 86 percent had a decisionmaking role in adding or phasing out these programs (table 7). Districts with a decisionmaking role reported that the cost of the program had a large or very large influence on their decision to add a program (74 percent of districts) or phase out a program (57 percent of districts). Districts also reported that the following factors had a large or very large influence on their decision to add or phase out a program: enrollment or student interest (69 percent and 80 percent of districts, respectively), facilities/space considerations (64 percent and 47 percent of districts, respectively), and availability of qualified teachers (64 percent and 60 percent of districts, respectively).

4
Tables

5
Table 1. Percent of public school districts reporting that they offer career and technical education (CTE) programs to students at the high school level, that students in their enrollment area have the option of enrolling in a CTE district, and the percent reporting the entities that provide CTE programs and the locations where the district offers CTE programs, by district characteristics: 2016–17
District characteristic
Among all public school districts
Among districts that offer CTE programs to high school students1
Entities that provide CTE programs Locations where the district offers CTE programs
Offer CTE
programs to high school
students2
Students have
option of enrolling
in CTE district3
Area/ regional
CTE center or
group/ consor-tium of school
districts
District indivi-dually
2-year commu-
nity or technical
college(s)
4-year college(s) or univer-
sities
District’s regular
(compre-hensive)
high school(s)
Another district’s
regular (compre-hensive)
high school(s)
CTE-focused
high school
attended full time
CTE center
attended part time
2-year commu-
nity or technical
college, or a 4-year
college or university
All public school districts. 98 10 54 77 46 11 83 11 12 43 35
District enrollment size Less than 1,000 ................... 98 6 54 75 41 8 82 12 8 35 31 1,000 to 2,499 ...................... 98 13 61 72 44 11 80 11 14 48 31 2,500 to 9,999 ...................... 99 13 53 79 50 12 85 10 13 48 40 10,000 or more .................... 100 8 38 95 61 17 96 8 19 48 49 Community type City ...................................... 99 11 35 92 55 17 93 7 ! 14 42 49 Suburban ............................. 97 19 66 69 44 13 75 12 21 56 34 Town ................................... 100 7 52 80 49 13 87 10 7 39 38 Rural .................................... 98 7 53 78 43 8 84 11 9 39 32 Region Northeast ............................. 97 24 78 50 24 8 50 11 27 70 17 Southeast ............................. 100 1 ! 34 94 63 14 92 4 6 43 50 Central ................................. 98 10 62 76 49 12 87 15 11 42 41 West .................................... 99 4 37 89 46 8 96 8 5 25 31 ! Interpret data with caution; the coefficient of variation is at least 30 percent but less than 50 percent. 1 Based on the 98 percent of public school districts that offer CTE programs to students at the high school level. 2 Respondents were asked to include all CTE programs that the district offered to high school students, including programs provided by the district or by other entities (such as an area/regional CTE center, a consortium of districts, or a community or technical college). 3 This question was worded, “Some states have CTE school districts that provide only CTE programs. Students have the option of enrolling in the CTE district instead of enrolling in their home district. Do high school students within your district’s enrollment area have the option of enrolling in a separate CTE district instead of enrolling in your district?” Response options were yes; no; and not applicable, this is a CTE district. Estimates in this column are for districts that responded “yes” to this question. SOURCE: U.S. Department of Education, National Center for Education Statistics, Fast Response Survey System (FRSS), “Career and Technical Education Programs in Public School Districts,” FRSS 108, 2017.

6
Table 2. Percentage distribution of public school districts reporting on how many of the career and technical education (CTE) programs offered to high school students are structured as career pathways that align with related postsecondary programs, and the percent of districts that offer various types of CTE courses, by district characteristics: 2016–17
District characteristic
How many CTE programs are structured as career pathways1 Types of CTE courses district offers
None Few Some Most All
CTE courses that earn high school credits in
math, science, English/language arts,
or social studies
CTE courses that earn both high school and
postsecondary credits
CTE courses offered online (including
blended/hybrid courses)
All public school districts ....... 2 14 19 33 32 61 73 30
District enrollment size Less than 1,000 ......................... 3 ! 20 20 29 27 56 63 34 1,000 to 2,499 ............................ 4 12 19 33 33 62 74 24 2,500 to 9,999 ............................ 1 ! 8 17 36 37 64 81 27 10,000 or more .......................... ‡ 5 16 44 35 70 90 44 Community type City ............................................ ‡ 6 ! 16 36 42 68 91 37 Suburban ................................... 3 ! 11 16 37 33 62 77 24 Town ......................................... ‡ 14 17 35 33 60 76 24 Rural .......................................... 3 ! 16 21 30 30 59 67 35 Region Northeast ................................... 2 ! 13 20 36 29 61 68 15 Southeast ................................... ‡ 9 ! 14 34 43 60 76 46 Central ....................................... 3 ! 14 20 30 33 55 76 30 West .......................................... 3 ! 16 19 35 26 69 69 33 ! Interpret data with caution; the coefficient of variation is at least 30 percent but less than 50 percent. ‡ Reporting standards not met. The coefficient of variation for this estimate is 50 percent or greater. 1Detail may not sum to totals because of rounding. NOTE: Based on the 98 percent of public school districts that offer CTE programs to students at the high school level. SOURCE: U.S. Department of Education, National Center for Education Statistics, Fast Response Survey System (FRSS), “Career and Technical Education Programs in Public School Districts,” FRSS 108, 2017.

7
Table 3. Percent of public school districts reporting that various work-based learning activities are included in the career and technical education (CTE) programs offered to high school students, and the percentage distribution of districts reporting on how many of their CTE programs require work-based learning, by district characteristics: 2016–17
District characteristic
Offer CTE programs that include: How many CTE programs require
work-based learning1
Student-run enterprises or
services
Mentoring by local
employers
On-the-job training, internships, practicums,
clinical experiences, or
cooperative education
(co-op)
Apprenticeships or pre-
apprenticeship programs
Other work-based
learning2 None Few Some Most All
All public school districts. 55 65 77 31 16 25 31 24 12 8
District enrollment size Less than 1,000 ................... 38 52 61 23 15 33 33 18 8 7 1,000 to 2,499 ...................... 57 64 83 32 12 21 32 24 15 8 2,500 to 9,999 ...................... 70 78 89 39 19 19 28 30 15 8 10,000 or more .................... 86 86 96 42 24 14 27 34 14 10 Community type City ...................................... 72 87 95 35 20 14 27 29 17 13 Suburban ............................. 74 77 90 38 17 18 27 27 17 11 Town ................................... 59 67 79 33 16 22 35 24 13 5 Rural .................................... 43 55 68 26 14 30 31 22 10 7 Region Northeast ............................. 75 75 92 33 20 14 22 25 19 20 Southeast ............................. 50 66 84 39 15 30 32 26 10 3 ! Central ................................. 56 66 75 36 13 22 35 25 15 5 West .................................... 42 55 66 17 17 33 32 22 7 6 ! Interpret data with caution; the coefficient of variation is at least 30 percent but less than 50 percent. 1Detail may not sum to totals because of rounding. 2Examples of other work-based learning include job shadowing, tours and field trips, and guest speakers. NOTE: Based on the 98 percent of public school districts that offer CTE programs to students at the high school level. SOURCE: U.S. Department of Education, National Center for Education Statistics, Fast Response Survey System (FRSS), “Career and Technical Education Programs in Public School Districts,” FRSS 108, 2017.

8
Table 4. Percentage distributions of public school districts reporting the extent to which employers are involved in various ways with the career and technical education (CTE) programs offered by the district to high school students, by district characteristics: 2016–17
District characteristic
Provide work-based learning opportunities
Serve on district’s CTE advisory council
Advise about which occupations are in demand
Provide advice on CTE programs to add or eliminate
Not at all
Small extent
Moder-ate
extent
Large or very
large extent
Not at all
Small extent
Moder-ate
extent
Large or very
large extent
Not at all
Small extent
Moder-ate
extent
Large or very
large extent
Not at all
Small extent
Moder-
ate extent
Large or very
large extent
All public school districts . 13 32 30 25 19 18 20 43 11 25 31 33 21 29 28 22
District enrollment size Less than 1,000 ................... 23 36 24 16 31 21 17 31 20 31 29 20 29 32 23 16 1,000 to 2,499 ...................... 9 31 37 24 14 21 22 44 7 25 35 33 20 28 31 21 2,500 to 9,999 ...................... 5 31 30 34 11 12 22 54 4 19 32 45 13 25 32 30 10,000 or more .................... 1 ! 22 35 42 3 8 24 65 2 ! 14 28 57 6 24 34 36 Community type City ...................................... ‡ 22 35 41 8 ! 6 23 63 ‡ 12 35 50 12 22 30 36 Suburban ............................. 6 31 31 31 16 16 23 45 8 22 29 41 17 27 32 25 Town ................................... 11 30 32 27 12 18 21 49 7 25 33 35 17 29 30 25 Rural .................................... 18 35 28 19 25 19 19 37 15 28 31 26 25 30 26 19 Region Northeast ............................. 5 25 37 33 21 16 19 44 9 21 28 42 18 25 31 25 Southeast ............................. 9 ! 30 28 33 6 ! 13 22 60 ‡ 16 32 47 12 25 32 31 Central ................................. 12 35 29 24 22 20 19 39 10 29 33 28 24 32 24 20 West .................................... 22 34 27 16 22 17 22 40 17 27 31 26 23 28 30 19 See notes at end of table.

9
Table 4. Percentage distributions of public school districts reporting the extent to which employers are involved in various ways with the career and technical education (CTE) programs offered by the district to high school students, by district characteristics: 2016–17—Continued
District characteristic
Review CTE program curriculum Provide guidance on industry standards
Provide guidance on equipment or facilities Donate equipment
Not at all
Small extent
Moder-ate
extent
Large or very
large extent
Not at all
Small extent
Moder-ate
extent
Large or very
large extent
Not at all
Small extent
Moder-ate
extent
Large or very
large extent
Not at all
Small extent
Moder-
ate extent
Large or very
large extent
All public school districts . 24 28 24 23 13 26 28 32 15 27 26 31 20 43 25 12
District enrollment size Less than 1,000 ................... 36 28 18 18 22 33 23 22 24 33 20 23 27 44 20 9 1,000 to 2,499 ...................... 22 32 26 20 10 27 30 33 13 26 31 30 18 44 26 12 2,500 to 9,999 ...................... 14 26 30 30 8 19 33 40 10 22 30 38 17 40 26 17 10,000 or more .................... 6 26 32 35 2 13 28 56 2 17 29 52 8 45 34 13 Community type City ...................................... 10 ! 21 32 37 7 ! 15 28 50 ‡ 18 33 44 14 36 33 16 Suburban ............................. 17 30 26 27 8 22 32 37 12 25 28 35 20 39 27 14 Town ................................... 19 31 25 26 8 27 26 40 11 24 26 38 15 47 23 15 Rural .................................... 31 28 22 18 19 29 27 25 20 31 25 24 24 44 23 10 Region Northeast ............................. 20 23 23 35 9 22 26 43 13 25 21 40 16 44 25 15 Southeast ............................. 15 36 27 22 7 ! 24 34 34 9 ! 29 32 30 16 48 25 11 Central ................................. 25 29 25 21 14 30 25 31 17 29 26 29 19 44 27 10 West .................................... 31 28 23 17 19 24 30 27 19 25 28 27 28 39 20 13 See notes at end of table.

10
Table 4. Percentage distributions of public school districts reporting the extent to which employers are involved in various ways with the career and technical education (CTE) programs offered by the district to high school students, by district characteristics: 2016–17—Continued
District characteristic
Host student field trips Serve as guest speakers
to CTE students Provide guidance for student CTE projects Judge student CTE competitions
Not at all
Small extent
Moder-ate
extent
Large or very
large extent
Not at all
Small extent
Moder-ate
extent
Large or very
large extent
Not at all
Small extent
Moder-ate
extent
Large or very
large extent
Not at all
Small extent
Moder-
ate extent
Large or very
large extent
All public school districts . 13 27 33 27 7 26 36 31 16 37 32 15 23 33 27 17
District enrollment size Less than 1,000 ................... 22 30 26 22 13 34 35 18 23 39 28 10 33 31 25 11 1,000 to 2,499 ...................... 10 29 37 24 4 24 39 33 16 35 35 13 19 37 28 16 2,500 to 9,999 ...................... 5 23 38 34 2 ! 20 34 44 10 37 31 22 16 34 27 23 10,000 or more .................... 3 16 39 42 ‡ 11 36 52 4 32 40 24 8 25 38 29 Community type City ...................................... ‡ 15 41 41 2 ! 18 34 46 8 ! 37 32 23 12 29 30 28 Suburban ............................. 7 25 37 31 2 ! 20 38 40 12 33 34 21 17 32 28 23 Town ................................... 10 24 35 30 4 ! 22 36 38 13 35 35 17 19 34 26 21 Rural .................................... 18 30 30 22 10 31 36 23 20 40 29 11 29 34 27 11 Region Northeast ............................. 5 28 39 28 3 ! 21 40 36 12 31 36 21 16 32 29 23 Southeast ............................. 10 21 40 29 3 ! 19 36 41 12 40 29 19 15 38 29 19 Central ................................. 11 28 32 30 6 26 38 31 16 40 31 13 27 32 25 16 West .................................... 23 28 28 21 11 33 32 24 22 35 31 12 27 33 28 13 See notes at end of table.

11
Table 4. Percentage distributions of public school districts reporting the extent to which employers are involved in various ways with the career and technical education (CTE) programs offered by the district to high school students, by district characteristics: 2016–17—Continued
District characteristic
Provide training opportunities for CTE teachers
Not at all
Small extent
Moder-ate
extent
Large or very large
extent
All public school districts ...... 33 36 23 8
District enrollment size Less than 1,000 ........................ 43 28 22 7 1,000 to 2,499 ........................... 32 43 20 5 2,500 to 9,999 ........................... 24 39 26 11 10,000 or more ......................... 12 45 31 12 Community type City ........................................... 16 36 33 16 Suburban .................................. 22 40 28 10 Town ........................................ 36 36 22 6 Rural ......................................... 38 35 20 7 Region Northeast .................................. 23 36 31 10 Southeast .................................. 27 42 22 9 Central ...................................... 35 35 22 8 West ......................................... 38 35 20 6 ! Interpret data with caution; the coefficient of variation is at least 30 percent but less than 50 percent. ‡ Reporting standards not met. The coefficient of variation for this estimate is 50 percent or greater. NOTE: Based on the 98 percent of public school districts that offer CTE programs to students at the high school level. On the survey, separate response options were provided for “large extent” and “very large extent.” Detail may not sum to totals because of rounding. SOURCE: U.S. Department of Education, National Center for Education Statistics, Fast Response Survey System (FRSS), “Career and Technical Education Programs in Public School Districts,” FRSS 108, 2017.

12
Table 5. Percentage distributions of public school districts reporting on how much of a barrier various items are to the district in offering career and technical education (CTE) programs to high school students, by district characteristics: 2016–17
District characteristic
Lack of funding or high cost of programs Facilities or space limitations
Finding or keeping teachers for in-demand industries and occupations
Limited availability of professional development in technical fields
Not a barrier
Small barrier
Moder-ate
barrier
Large or very
large barrier
Not a barrier
Small barrier
Moder-ate
barrier
Large or very
large barrier
Not a barrier
Small barrier
Moder-ate
barrier
Large or very
large barrier
Not a barrier
Small barrier
Moder-ate
barrier
Large or very
large barrier
All public school districts . 10 14 26 50 12 17 28 43 11 17 28 44 19 31 33 17
District enrollment size Less than 1,000 ................... 10 12 25 53 14 16 27 43 12 16 29 43 19 28 35 18 1,000 to 2,499 ...................... 9 13 26 52 11 18 28 43 12 18 31 39 21 35 30 14 2,500 to 9,999 ...................... 10 16 27 46 11 18 28 44 8 21 26 44 20 33 31 16 10,000 or more .................... 8 21 33 37 3 20 32 46 3 12 25 60 11 33 33 22 Community type City ...................................... 9 21 34 37 7 19 35 39 4 15 26 55 17 31 34 18 Suburban ............................. 11 18 29 42 11 18 27 44 11 19 29 40 21 32 32 16 Town ................................... 8 14 29 49 11 17 30 41 10 18 31 41 20 34 31 16 Rural .................................... 10 12 23 55 13 17 26 44 11 17 27 45 19 30 33 18 Region Northeast ............................. 14 17 27 42 19 16 23 42 21 19 31 29 23 29 34 14 Southeast ............................. 8 14 29 50 7 18 29 46 8 20 25 46 24 29 32 16 Central ................................. 8 12 30 51 10 18 32 40 8 18 29 44 16 32 35 16 West .................................... 10 16 21 54 11 18 24 47 8 13 27 51 19 33 28 20 See notes at end of table.

13
Table 5. Percentage distributions of public school districts reporting on how much of a barrier various items are to the district in offering career and technical education (CTE) programs to high school students, by district characteristics: 2016–17—Continued
District characteristic
Difficulty keeping CTE teachers’ technical skills up to date
CTE teachers have difficulty obtaining regular state teaching
certificate1
Difficulty developing partnerships with employers for work-based
learning
Not a barrier
Small barrier
Moder-ate
barrier
Large or very
large barrier
Not a barrier
Small barrier
Moder-ate
barrier
Large or very
large barrier
Not a barrier
Small barrier
Moder-ate
barrier
Large or very
large barrier
All public school districts . 26 34 28 12 27 29 23 21 20 34 28 18
District enrollment size Less than 1,000 ................... 28 29 29 14 31 26 21 22 20 32 26 23 1,000 to 2,499 ...................... 29 35 27 8 26 31 25 18 22 35 28 15 2,500 to 9,999 ...................... 23 38 27 12 25 32 23 19 21 36 28 15 10,000 or more .................... 13 36 36 15 16 30 29 26 16 32 37 14 Community type City ...................................... 20 34 33 13 18 28 30 24 17 34 31 18 Suburban ............................. 26 34 28 12 23 33 23 20 20 34 33 14 Town ................................... 24 38 28 10 28 28 24 21 25 33 26 16 Rural .................................... 28 31 28 12 29 28 22 20 19 34 26 21 Region Northeast ............................. 35 30 25 10 29 30 22 19 26 36 27 12 Southeast ............................. 31 32 24 14 28 34 19 19 17 41 25 17 Central ................................. 22 35 32 11 26 29 25 20 19 35 28 17 West .................................... 24 35 28 13 27 26 24 23 20 26 30 24 1On the survey, this item was worded as: “CTE teachers who move into teaching from other occupations have difficulty obtaining a regular or standard state teaching certificate.” NOTE: Based on the 98 percent of public school districts that offer CTE programs to students at the high school level. On the survey, separate response options were provided for “large barrier” and “very large barrier.” Detail may not sum to totals because of rounding. SOURCE: U.S. Department of Education, National Center for Education Statistics, Fast Response Survey System (FRSS), “Career and Technical Education Programs in Public School Districts,” FRSS 108, 2017.

14
Table 6. Percentage distributions of public school districts reporting on how much of a barrier various items are to student participation in the career and technical education (CTE) programs offered by the district to high school students, by district characteristics: 2016–17
District characteristic
Lack of time in students’ schedules Students’ or parents’ negative
perceptions of CTE Teachers’ or guidance counselors’
negative perceptions of CTE Transportation to CTE programs
Not a barrier
Small barrier
Moder-ate
barrier
Large or very
large barrier
Not a barrier
Small barrier
Moder-ate
barrier
Large or very
large barrier
Not a barrier
Small barrier
Moder-ate
barrier
Large or very
large barrier
Not a barrier
Small barrier
Moder-ate
barrier
Large or very
large barrier
All public school districts . 16 25 34 25 35 31 22 12 58 24 11 7 44 24 15 17
District enrollment size Less than 1,000 ................... 17 26 34 23 48 32 16 4 76 19 3 ! 2 ! 44 22 15 19 1,000 to 2,499 ...................... 18 24 35 22 34 33 22 11 58 27 9 6 44 25 16 15 2,500 to 9,999 ...................... 13 24 33 29 24 28 27 21 43 26 19 12 45 27 14 15 10,000 or more .................... 8 24 39 29 12 30 32 26 13 33 32 22 34 25 21 20 Community type City ...................................... 14 17 37 31 21 27 29 22 30 22 28 20 36 28 19 17 Suburban ............................. 16 21 35 28 24 30 27 19 46 26 18 10 46 25 14 15 Town ................................... 14 30 33 23 32 33 23 12 55 26 12 8 46 27 15 13 Rural .................................... 17 26 35 23 43 31 18 8 68 23 6 4 43 23 15 20 Region Northeast ............................. 25 20 28 27 28 25 29 18 57 22 13 8 48 27 14 11 Southeast ............................. 15 32 34 20 32 27 23 17 47 24 15 13 41 20 16 23 Central ................................. 12 26 37 25 32 33 24 11 60 26 9 5 44 26 15 14 West .................................... 16 23 36 25 46 35 12 7 61 23 10 6 41 22 15 23 See notes at end of table.

15
Table 6. Percentage distributions of public school districts reporting on how much of a barrier various items are to student participation in the career and technical education (CTE) programs offered by the district to high school students, by district characteristics: 2016–17—Continued
District characteristic
Transportation for work-based learning
Students’ costs for supplies, uniforms, or materials
Students’ difficulty finding work-based learning
Lack of student support services for special populations
Not a barrier
Small barrier
Moder-ate
barrier
Large or very
large barrier
Not a barrier
Small barrier
Moder-ate
barrier
Large or very
large barrier
Not a barrier
Small barrier
Moder-ate
barrier
Large or very
large barrier
Not a barrier
Small barrier
Moder-ate
barrier
Large or very
large barrier
All public school districts . 29 30 20 20 32 33 20 15 21 32 25 23 42 33 17 8
District enrollment size Less than 1,000 ................... 33 27 19 21 32 33 16 18 21 25 24 30 41 34 15 10 1,000 to 2,499 ...................... 31 33 18 17 34 29 25 11 22 37 23 18 48 29 18 4 2,500 to 9,999 ...................... 25 35 23 17 33 36 18 13 21 38 25 17 40 34 16 10 10,000 or more .................... 17 26 27 30 24 39 26 12 14 30 37 19 30 38 21 11 Community type City ...................................... 17 30 24 29 28 34 26 12 21 32 26 21 32 37 23 8 Suburban ............................. 25 33 22 20 36 36 18 10 21 38 26 15 41 29 20 10 Town ................................... 31 33 22 15 35 31 23 12 22 35 24 19 44 34 16 7 Rural .................................... 32 29 19 21 30 33 19 18 20 27 25 28 43 34 14 9 Region Northeast ............................. 25 32 26 17 39 33 19 10 27 38 25 11 48 26 19 7 Southeast ............................. 23 28 23 26 32 30 21 16 15 30 29 27 46 31 14 9 Central ................................. 33 33 18 16 32 38 18 13 21 35 23 21 39 34 19 8 West .................................... 29 27 19 25 28 29 23 20 19 24 26 31 39 38 13 10 ! Interpret data with caution; the coefficient of variation is at least 30 percent but less than 50 percent. NOTE: Based on the 98 percent of public school districts that offer CTE programs to students at the high school level. On the survey, separate response options were provided for “large barrier” and “very large barrier.” Detail may not sum to totals because of rounding. SOURCE: U.S. Department of Education, National Center for Education Statistics, Fast Response Survey System (FRSS), “Career and Technical Education Programs in Public School Districts,” FRSS 108, 2017.

16
Table 7. Percent of public school districts with a decision-making role in adding or phasing out career and technical education (CTE) programs for high school students, and the percentage distributions of those districts reporting the extent to which various factors influence those decisions, by district characteristics: 2016–17
District characteristic
Districts with
decision-making
role1
Enrollment or student interest2 Facilities/space considerations
Extent of influence on decision
to add new CTE program4 Extent of influence on decision
to phase out CTE program4 Extent of influence on decision
to add new CTE program4 Extent of influence on decision
to phase out CTE program4
Not at
all Small extent
Moder-ate
extent
Large or very
large extent
Not at all
Small extent
Moder-ate
extent
Large or very
large extent
Not at all
Small extent
Moder-
ate extent
Large or very
large extent
Not at all
Small extent
Moder-ate
extent
Large or very
large extent
All public school districts. 86 2 6 22 69 2 4 13 80 3 9 24 64 8 19 27 47
District enrollment size Less than 1,000 ................... 83 3 ! 9 23 65 5 6 16 73 5 ! 9 27 59 10 18 25 46 1,000 to 2,499 ...................... 84 3 ! 4 ! 24 69 ‡ 3 ! 13 84 3 ! 10 23 64 7 18 27 48 2,500 to 9,999 ...................... 89 ‡ 4 20 75 ‡ 3 14 82 1 ! 9 22 68 6 19 28 47 10,000 or more .................... 98 ‡ 6 20 74 ‡ 2 8 90 ‡ 5 19 75 6 21 30 44 Community type City ...................................... 96 ‡ 8 ! 20 66 ‡ 7 ! 7 82 ‡ 9 21 69 9 ! 24 33 34 Suburban ............................. 81 ‡ 5 20 74 # 2 ! 14 84 1 ! 7 22 70 6 18 24 52 Town ................................... 89 ‡ 6 24 67 ‡ 1 ! 16 82 ‡ 9 30 60 7 17 30 46 Rural .................................... 86 2 ! 6 23 69 3 6 13 77 5 9 23 64 8 19 26 47 Region Northeast ............................. 70 ‡ 7 29 62 ‡ 5 ! 11 83 3 ! 14 25 57 10 21 27 42 Southeast ............................. 97 ‡ 7 ! 22 69 ‡ 5 ! 13 82 4 ! 8 18 71 6 22 25 47 Central ................................. 85 2 ! 5 20 73 2 ! 4 ! 13 81 2 ! 10 26 62 7 18 28 48 West .................................... 94 3 ! 7 ! 22 69 3 ! 4 ! 15 77 4 ! 4 24 68 8 17 26 49 See notes at end of table.

17
Table 7. Percent of public school districts with a decision-making role in adding or phasing out career and technical education (CTE) programs for high school students, and the percentage distributions of those districts reporting the extent to which various factors influence those decisions, by district characteristics: 2016–17—Continued
District characteristic
Cost of program3 Availability of qualified teachers Extent of influence on decision
to add new CTE program4 Extent of influence on decision
to phase out CTE program4 Extent of influence on decision
to add new CTE program4 Extent of influence on decision
to phase out CTE program4
Not at all
Small extent
Moder-ate
extent
Large or very
large extent
Not at all
Small extent
Moder-ate
extent
Large or very
large extent
Not at all
Small extent
Moder-ate
extent
Large or very
large extent
Not at all
Small extent
Moder-
ate extent
Large or very
large extent
All public school districts . 1 ! 6 19 74 3 13 27 57 2 9 24 64 4 13 24 60
District enrollment size Less than 1,000 ................... ‡ 6 20 73 4 11 24 61 3 ! 9 24 64 3 ! 11 23 63 1,000 to 2,499 ...................... ‡ 6 18 76 3 ! 14 29 55 ‡ 10 24 65 3 ! 14 26 57 2,500 to 9,999 ...................... ‡ 5 19 76 3 13 27 56 3 8 26 63 5 13 23 58 10,000 or more .................... 1 ! 7 21 71 5 21 32 42 1 ! 7 23 69 4 13 26 58 Community type City ...................................... ‡ 7 23 69 4 26 33 37 2 ! 8 23 67 4 ! 20 21 54 Suburban ............................. 1 ! 6 22 71 4 15 29 52 3 ! 8 25 64 5 13 28 55 Town ................................... ‡ 4 ! 19 77 3 ! 12 23 62 4 ! 8 22 66 5 ! 12 21 63 Rural .................................... ‡ 6 18 75 4 11 26 59 ‡ 10 25 63 3 ! 12 25 61 Region Northeast ............................. ‡ 8 22 69 5 ! 16 27 53 6 ! 15 33 47 8 18 29 45 Southeast ............................. ‡ 8 17 73 4 16 29 51 3 ! 10 26 60 4 ! 12 27 57 Central ................................. ‡ 5 20 74 3 ! 10 27 60 2 ! 6 22 70 3 12 23 63 West .................................... 1 ! 4 18 78 3 14 26 57 ‡ 9 22 69 2 ! 11 22 65 See notes at end of table.

18
Table 7. Percent of public school districts with a decision-making role in adding or phasing out career and technical education (CTE) programs for high school students, and the percentage distributions of those districts reporting the extent to which various factors influence those decisions, by district characteristics: 2016–17—Continued
District characteristic
Information on which industries and occupations are in demand Employer recommendations Extent of influence on decision
to add new CTE program4 Extent of influence on decision
to phase out CTE program4 Extent of influence on decision
to add new CTE program4 Extent of influence on decision
to phase out CTE program4
Not at all
Small extent
Moder-ate
extent
Large or very
large extent
Not at all
Small extent
Moder-ate
extent
Large or very
large extent
Not at all
Small extent
Moder-ate
extent
Large or very
large extent
Not at all
Small extent
Moder-
ate extent
Large or very
large extent
All public school districts . 9 18 26 46 10 20 31 39 10 25 32 33 13 27 31 30
District enrollment size Less than 1,000 ................... 13 21 29 37 14 24 30 32 15 27 33 26 19 28 28 26 1,000 to 2,499 ...................... 7 21 30 42 8 21 34 37 9 30 32 29 13 30 33 25 2,500 to 9,999 ...................... 7 16 23 54 7 17 33 43 7 22 31 40 8 24 34 34 10,000 or more .................... 4 8 14 74 4 12 24 60 3 13 29 54 5 20 28 47 Community type City ...................................... 10 13 13 65 5 21 25 49 7 22 24 47 7 27 29 37 Suburban ............................. 9 16 22 53 6 16 34 44 8 25 28 38 9 26 31 34 Town ................................... 6 ! 15 33 46 10 19 33 38 8 22 35 35 15 22 33 30 Rural .................................... 10 22 27 41 12 23 30 35 12 27 33 28 15 29 30 27 Region Northeast ............................. 12 16 24 47 8 19 30 42 12 24 28 36 11 27 28 35 Southeast ............................. 6 12 18 65 5 13 24 57 5 ! 18 28 49 6 19 30 45 Central ................................. 8 22 30 39 12 23 33 32 10 30 32 28 17 31 29 23 West .................................... 10 18 27 44 9 21 34 36 12 23 36 29 12 26 35 27 See notes at end of table.

19
Table 7. Percent of public school districts with a decision-making role in adding or phasing out career and technical education (CTE) programs for high school students, and the percentage distributions of those districts reporting the extent to which various factors influence those decisions, by district characteristics: 2016–17—Continued
District characteristic
Postsecondary institution recommendations Recommendations from state department of education Extent of influence on decision
to add new CTE program4 Extent of influence on decision
to phase out CTE program4 Extent of influence on decision
to add new CTE program4 Extent of influence on decision
to phase out CTE program4
Not at all
Small extent
Moder-ate
extent
Large or very
large extent
Not at all
Small extent
Moder-ate
extent
Large or very
large extent
Not at all
Small extent
Moder-ate
extent
Large or very
large extent
Not at all
Small extent
Moder-
ate extent
Large or very
large extent
All public school districts . 11 25 36 27 13 29 34 24 11 26 34 29 12 26 31 31
District enrollment size Less than 1,000 ................... 13 24 37 25 17 28 32 23 13 28 32 27 14 26 32 28 1,000 to 2,499 ...................... 11 30 35 23 15 30 35 20 12 27 33 29 13 29 29 30 2,500 to 9,999 ...................... 9 24 38 30 10 30 35 25 10 23 37 30 11 25 30 34 10,000 or more .................... 4 22 34 40 6 25 36 33 7 21 36 37 8 20 33 39 Community type City ...................................... 9 29 30 32 11 28 30 30 15 20 37 28 16 22 33 29 Suburban ............................. 9 25 35 31 9 30 36 25 11 22 39 28 10 26 35 30 Town ................................... 10 25 40 24 16 28 34 22 11 25 38 26 13 23 33 32 Rural .................................... 12 25 37 27 15 29 33 23 11 28 29 32 12 28 28 32 Region Northeast ............................. 12 22 37 28 11 29 35 24 14 22 38 25 11 28 34 26 Southeast ............................. 5 ! 27 32 36 10 27 31 32 4 ! 21 29 47 5 17 26 52 Central ................................. 12 28 36 24 15 32 32 21 10 30 36 24 15 30 32 24 West .................................... 12 23 38 27 14 25 38 23 15 25 31 29 14 25 30 31 See notes at end of table.
20
Table 7. Percent of public school districts with a decision-making role in adding or phasing out career and technical education (CTE) programs for high school students, and the percentage distributions of those districts reporting the extent to which various factors influence those decisions, by district characteristics: 2016–17—Continued
District characteristic
Career pathways from high school to postsecondary Extent of influence on decision
to add new CTE program4 Extent of influence on decision
to phase out CTE program4
Not at all
Small extent
Moder-ate
extent
Large or very
large extent
Not at all
Small extent
Moder-ate
extent
Large or very
large extent
All public school districts . 7 19 33 41 9 20 33 38
District enrollment size Less than 1,000 ................... 10 22 35 33 14 18 31 36 1,000 to 2,499 ...................... 6 19 36 40 8 24 37 31 2,500 to 9,999 ...................... 6 17 30 47 6 20 31 42 10,000 or more .................... 2 8 29 61 4 14 33 49 Community type City ...................................... 4 ! 14 32 50 10 ! 24 25 41 Suburban ............................. 7 16 30 46 6 18 35 40 Town ................................... 7 ! 18 33 43 10 18 36 36 Rural .................................... 8 21 34 37 11 21 32 36 Region Northeast ............................. 10 21 35 34 9 25 32 34 Southeast ............................. 4 ! 17 26 53 6 17 30 47 Central ................................. 7 22 35 36 11 21 35 32 West .................................... 8 14 33 45 10 18 31 41 # Rounds to zero. ! Interpret data with caution; the coefficient of variation is at least 30 percent but less than 50 percent. ‡ Reporting standards not met. The coefficient of variation for this estimate is 50 percent or greater. 1 Based on the 98 percent of public school districts that offer CTE programs to students at the high school level. 2 On the survey, this factor was worded as “student interest” in the question on adding a new CTE program and as “enrollment or student interest” in the question on phasing out a CTE program. 3 On the survey, this factor was worded as “costs for new program” in the question on adding a new CTE program and as “cost of program” in the question on phasing out a CTE program. 4 Based on the public school districts that offer CTE programs to students at the high school level and have a decision-making role in adding or phasing out CTE programs. Of the 98 percent of public school districts that offer CTE programs, 86 percent have a decision-making role in adding or phasing out CTE programs. NOTE: On the survey, separate response options were provided for “large extent” and “very large extent.” Detail may not sum to totals because of rounding. SOURCE: U.S. Department of Education, National Center for Education Statistics, Fast Response Survey System (FRSS), “Career and Technical Education Programs in Public School Districts,” FRSS 108, 2017.

21
References
Kalton, G. (1983). Compensating for Missing Survey Data. Survey Research Center, Institute for Social Research: University of Michigan.
Levy, P., and Lemeshow, S. (1991). Sampling of Populations. New York: J. Wiley & Sons.
Rust, K. (1986). Efficient Replicated Variance Estimation. Proceedings of the Section on Survey Research Methods, American Statistical Association, 81–87.
Wolter, K. (1985). Introduction to Variance Estimation, New York: Springer-Verlag, 183.

A-1
Appendix A
Standard Error Tables

A-2
Table A-1. Standard errors for table 1: Percent of public school districts reporting that they offer career and technical education (CTE) programs to students at the high school level, that students in their enrollment area have the option of enrolling in a CTE district, and the percent reporting the entities that provide CTE programs and the locations where the district offers CTE programs, by district characteristics: 2016–17
District characteristic
Among all public school districts
Among districts that offer CTE programs to high school students
Entities that provide CTE programs Locations where the district offers CTE programs
Offer CTE
programs to high school
students
Students have
option of enrolling
in CTE district
Area/ regional
CTE center or
group/ consor-tium of school
districts
District indivi-dually
2-year commu-
nity or technical
college(s)
4-year college(s) or univer-
sities
District’s regular
(compre-hensive)
high school(s)
Another district’s
regular (compre-hensive)
high school(s)
CTE-focused
high school
attended full time
CTE center
attended part time
2-year commu-
nity or technical
college, or a 4-year
college or university
All public school districts . 0.4 0.8 1.4 1.6 1.4 0.8 1.1 0.9 1.0 1.6 1.3
District enrollment size Less than 1,000 ................... 0.9 1.4 2.9 3.3 2.8 1.6 2.2 1.7 1.8 3.5 2.4 1,000 to 2,499 ...................... 0.7 1.3 2.4 2.9 2.7 1.4 1.8 1.7 2.2 2.5 2.7 2,500 to 9,999 ...................... 0.4 1.4 1.7 1.5 1.5 1.3 1.5 1.0 1.4 2.0 1.4 10,000 or more .................... # 1.2 1.7 1.0 2.0 1.3 0.8 1.4 1.1 2.0 2.1 Community type City ...................................... 1.3 2.9 3.3 2.2 3.5 2.9 2.3 2.7 1.9 3.4 3.1 Suburban ............................. 0.7 1.8 2.1 2.3 2.2 1.8 2.4 1.6 2.1 2.4 2.1 Town ................................... 0.4 1.6 2.8 2.4 2.8 2.1 2.2 1.7 1.7 2.4 2.9 Rural .................................... 0.7 1.2 2.3 2.6 2.1 1.1 1.7 1.5 1.2 2.6 1.9 Region Northeast ............................. 0.9 2.2 2.6 2.8 2.7 1.7 2.9 1.9 3.1 3.0 2.4 Southeast ............................. # 0.4 3.4 1.8 3.0 2.2 2.1 1.1 1.0 3.6 2.9 Central ................................. 1.0 1.5 2.3 2.6 2.5 1.6 1.6 1.8 1.6 2.7 2.2 West .................................... 0.3 1.2 2.7 2.0 2.7 1.3 1.5 1.4 1.1 2.6 2.5 # Rounds to zero. SOURCE: U.S. Department of Education, National Center for Education Statistics, Fast Response Survey System (FRSS), “Career and Technical Education Programs in Public School Districts,” FRSS 108, 2017.

A-3
Table A-2. Standard errors for table 2: Percentage distribution of public school districts reporting on how many of the career and technical education (CTE) programs offered to high school students are structured as career pathways that align with related postsecondary programs, and the percent of districts that offer various types of CTE courses, by district characteristics: 2016–17
District characteristic
How many CTE programs are structured as career pathways Types of CTE courses district offers
None Few Some Most All
CTE courses that earn high school credits in
math, science, English/language arts,
or social studies
CTE courses that earn both high school and
postsecondary credits
CTE courses offered online (including
blended/ hybrid courses)
All public school districts ..... 0.6 1.2 1.1 1.5 1.5 1.5 1.6 1.4
District enrollment size Less than 1,000 ....................... 1.2 2.6 2.1 3.3 3.2 3.3 3.5 3.0 1,000 to 2,499 .......................... 0.9 2.0 2.0 2.0 2.2 2.4 2.8 1.7 2,500 to 9,999 .......................... 0.5 1.3 1.5 2.0 1.9 2.0 1.5 1.7 10,000 or more ........................ † 1.1 1.4 2.0 1.8 1.7 1.1 1.8 Community type City .......................................... † 2.7 2.6 3.3 3.9 3.3 2.9 3.3 Suburban ................................. 0.9 1.7 1.7 2.5 2.4 2.2 1.9 1.8 Town ....................................... † 2.3 2.3 2.4 2.4 2.7 3.0 2.5 Rural ........................................ 1.0 2.0 1.8 2.4 2.4 2.5 2.5 2.1 Region Northeast ................................. 0.8 2.1 2.5 3.1 2.9 3.0 3.2 2.0 Southeast ................................. † 2.8 2.4 3.0 3.4 3.3 3.1 3.0 Central ..................................... 0.9 2.4 1.8 2.5 2.7 2.4 2.1 2.8 West ........................................ 1.1 2.2 2.4 2.1 2.4 3.5 2.6 3.1 † Not applicable. SOURCE: U.S. Department of Education, National Center for Education Statistics, Fast Response Survey System (FRSS), “Career and Technical Education Programs in Public School Districts,” FRSS 108, 2017.

A-4
Table A-3. Standard errors for table 3: Percent of public school districts reporting that various work-based learning activities are included in the career and technical education (CTE) programs offered to high school students, and the percentage distribution of districts reporting on how many of their CTE programs require work-based learning, by district characteristics: 2016–17
District characteristic
Offer CTE programs that include: How many CTE programs require
work-based learning
Student-run enterprises or
services
Mentoring by local
employers
On-the-job training, internships, practicums,
clinical experiences, or
cooperative education
(co-op)
Apprenticeships or pre-
apprenticeship programs
Other work-based
learning None Few Some Most All
All public school districts. 1.8 1.4 1.3 1.4 1.0 1.5 1.4 1.4 1.0 0.8
District enrollment size Less than 1,000 ................... 4.1 2.9 3.1 2.7 2.0 3.3 3.1 2.8 1.8 1.8 1,000 to 2,499 ...................... 2.1 2.1 1.9 2.6 1.6 2.4 2.3 2.4 1.9 1.1 2,500 to 9,999 ...................... 2.1 2.2 1.4 2.4 1.7 1.3 1.6 1.9 1.7 1.1 10,000 or more .................... 1.6 1.5 0.9 2.2 1.7 1.1 1.8 1.3 1.0 1.2 Community type City ...................................... 3.8 2.4 1.5 2.9 2.7 2.9 2.8 2.9 2.6 2.9 Suburban ............................. 2.2 2.2 1.6 2.8 1.9 2.1 2.3 2.4 2.0 1.5 Town ................................... 2.8 2.8 2.8 2.8 2.2 2.5 2.8 2.4 2.1 1.4 Rural .................................... 3.0 2.2 2.4 1.8 1.6 2.6 2.4 2.3 1.6 1.5 Region Northeast ............................. 2.5 2.9 1.8 3.2 2.7 2.7 2.7 2.6 2.3 2.8 Southeast ............................. 3.2 3.3 3.5 3.3 2.2 3.4 3.1 2.9 1.6 0.9 Central ................................. 3.1 2.9 2.5 2.3 2.0 2.8 3.0 2.0 2.1 1.0 West .................................... 2.5 2.7 2.5 1.9 2.2 2.7 2.2 2.1 1.1 1.6 SOURCE: U.S. Department of Education, National Center for Education Statistics, Fast Response Survey System (FRSS), “Career and Technical Education Programs in Public School Districts,” FRSS 108, 2017.

A-5
Table A-4. Standard errors for table 4: Percentage distributions of public school districts reporting the extent to which employers are involved in various ways with the career and technical education (CTE) programs offered by the district to high school students, by district characteristics: 2016–17
District characteristic
Provide work-based learning opportunities
Serve on district’s CTE advisory council
Advise about which occupations are in demand
Provide advice on CTE programs to add or eliminate
Not at all
Small extent
Moder-ate
extent
Large or very
large extent
Not at all
Small extent
Moder-ate
extent
Large or very
large extent
Not at all
Small extent
Moder-ate
extent
Large or very
large extent
Not at all
Small extent
Mode-
rate extent
Large or very
large extent
All public school districts . 1.0 1.5 1.5 1.2 1.2 1.1 1.1 1.3 1.0 1.5 1.5 1.3 1.1 1.3 1.4 1.0
District enrollment size Less than 1,000 ................... 2.2 3.4 3.0 2.3 2.7 2.1 2.3 2.2 2.2 3.1 3.0 2.2 2.4 2.7 3.1 1.4 1,000 to 2,499 ...................... 1.6 2.1 2.5 2.3 1.7 2.4 1.6 3.0 1.3 2.9 2.6 3.0 1.7 2.1 2.5 2.4 2,500 to 9,999 ...................... 1.0 1.7 2.1 2.2 1.5 1.4 1.8 1.8 1.0 1.2 2.2 2.0 1.5 2.0 1.3 1.8 10,000 or more .................... 0.4 1.4 1.8 1.6 0.8 1.2 1.7 1.9 0.8 1.5 1.9 2.0 0.9 1.7 1.3 2.0 Community type City ...................................... † 2.7 3.6 3.6 3.0 1.9 2.8 3.6 † 2.1 3.3 3.5 3.1 3.3 2.6 3.3 Suburban ............................. 1.2 2.2 2.2 2.3 2.0 1.9 2.1 2.4 1.6 1.7 2.4 2.4 2.0 2.0 2.1 2.1 Town ................................... 2.1 2.7 2.8 2.5 2.3 2.5 2.4 3.1 1.8 3.3 2.6 2.7 2.5 3.1 2.7 2.4 Rural .................................... 1.6 2.3 2.3 1.9 1.8 1.8 1.8 2.1 1.4 2.5 2.3 1.9 1.8 1.8 2.2 1.6 Region Northeast ............................. 1.4 2.7 3.1 3.0 2.9 2.4 2.4 3.5 2.3 2.6 3.2 3.3 2.6 2.9 2.8 2.7 Southeast ............................. 2.7 3.2 3.5 3.0 2.1 2.5 2.3 2.9 † 2.6 2.7 3.3 2.5 2.9 2.6 3.0 Central ................................. 2.2 2.6 2.2 2.2 2.6 1.7 2.0 2.5 2.1 2.9 2.4 2.6 2.3 2.3 2.8 1.8 West .................................... 2.6 2.7 2.6 1.8 2.4 2.1 2.0 3.1 2.3 3.1 3.5 1.8 2.5 2.2 2.5 1.9 See notes at end of table.

A-6
Table A-4. Standard errors for table 4: Percentage distributions of public school districts reporting the extent to which employers are involved in various ways with the career and technical education (CTE) programs offered by the district to high school students, by district characteristics: 2016–17—Continued
District characteristic
Review CTE program curriculum Provide guidance on industry standards
Provide guidance on equipment or facilities Donate equipment
Not at all
Small extent
Moder-ate
extent
Large or very
large extent
Not at all
Small extent
Moder-ate
extent
Large or very
large extent
Not at all
Small extent
Moder-ate
extent
Large or very
large extent
Not at all
Small extent
Mode-
rate extent
Large or very
large extent
All public school districts . 1.2 1.4 1.4 1.1 0.9 1.3 1.2 1.2 1.0 1.4 1.2 1.2 1.3 1.6 1.2 0.8
District enrollment size Less than 1,000 ................... 2.6 3.0 3.0 1.9 2.0 2.8 2.1 2.3 2.2 3.0 2.3 2.3 3.0 3.3 2.4 1.3 1,000 to 2,499 ...................... 1.7 2.3 2.3 2.4 1.5 2.3 2.4 2.4 1.4 2.5 2.2 2.6 1.9 2.6 2.0 1.8 2,500 to 9,999 ...................... 1.4 1.9 1.9 1.7 1.0 1.4 1.8 1.9 1.3 1.9 1.9 1.8 1.3 1.8 1.6 1.2 10,000 or more .................... 0.7 1.4 1.5 1.6 0.5 1.6 1.7 1.8 0.5 1.6 1.6 2.1 0.8 2.3 1.9 1.5 Community type City ...................................... 3.1 2.6 3.5 3.3 2.8 2.5 2.8 3.4 † 2.6 3.3 3.2 3.3 3.1 3.2 2.3 Suburban ............................. 1.7 2.1 1.9 2.1 1.4 1.9 2.0 2.3 1.6 2.2 2.1 2.4 1.9 2.4 2.0 1.7 Town ................................... 2.5 3.5 2.5 2.7 1.7 3.2 2.3 2.9 2.0 2.7 2.2 2.8 2.5 3.1 2.1 1.9 Rural .................................... 1.9 2.0 2.1 1.9 1.6 1.7 1.9 1.9 1.7 2.2 2.1 2.0 2.4 2.5 2.0 1.1 Region Northeast ............................. 2.5 2.5 2.3 2.6 1.7 2.8 2.6 3.0 2.0 3.3 2.6 3.2 2.1 3.1 2.6 2.1 Southeast ............................. 3.1 3.6 2.7 2.7 2.6 3.1 2.7 2.7 2.7 3.3 2.8 2.4 3.0 3.5 2.4 1.8 Central ................................. 2.6 2.3 2.9 2.1 2.1 1.9 1.7 2.6 2.4 2.6 2.5 2.6 2.2 2.4 2.4 1.2 West .................................... 2.5 2.1 2.5 1.7 2.2 2.9 2.7 1.9 2.3 2.7 2.5 2.0 3.2 3.7 2.3 1.9 See notes at end of table.

A-7
Table A-4. Standard errors for table 4: Percentage distributions of public school districts reporting the extent to which employers are involved in various ways with the career and technical education (CTE) programs offered by the district to high school students, by district characteristics: 2016–17—Continued
District characteristic
Host student field trips Serve as guest speakers
to CTE students Provide guidance for student CTE projects Judge student CTE competitions
Not at all
Small extent
Moder-ate
extent
Large or very
large extent
Not at all
Small extent
Moder-ate
extent
Large or very
large extent
Not at all
Small extent
Moder-ate
extent
Large or very
large extent
Not at all
Small extent
Moder-
ate extent
Large or very
large extent
All public school districts . 1.1 1.5 1.5 1.3 0.7 1.5 1.6 1.1 1.0 1.4 1.3 0.8 1.3 1.5 1.3 1.0
District enrollment size Less than 1,000 ................... 2.5 2.8 3.4 2.9 1.7 3.3 3.7 1.6 2.2 2.7 2.7 1.2 3.0 2.7 2.5 2.1 1,000 to 2,499 ...................... 1.7 3.2 2.2 1.9 0.9 2.2 2.1 2.6 1.8 2.7 2.5 2.2 1.8 3.3 2.8 1.5 2,500 to 9,999 ...................... 0.8 1.8 1.9 1.8 0.6 1.7 1.6 1.9 1.2 2.0 1.8 1.4 1.4 1.7 1.5 1.2 10,000 or more .................... 0.8 1.6 1.6 1.7 † 1.1 2.0 1.8 0.7 1.5 1.4 1.1 1.0 1.8 1.8 1.4 Community type City ...................................... † 2.4 3.3 3.2 1.1 3.3 3.5 3.1 2.8 3.5 3.1 2.7 3.0 3.2 3.0 3.4 Suburban ............................. 1.3 2.2 2.3 2.2 0.7 1.9 2.2 2.3 1.7 2.4 2.3 2.0 1.6 2.1 1.8 1.9 Town ................................... 2.0 2.8 2.8 2.4 1.4 2.3 3.0 2.6 1.9 3.1 2.6 2.0 2.2 2.9 2.8 2.2 Rural .................................... 2.1 2.3 2.6 2.2 1.3 2.4 2.7 1.6 2.0 2.2 2.1 1.4 2.1 2.2 2.1 1.8 Region Northeast ............................. 1.3 3.6 3.3 2.7 1.1 2.5 3.3 3.0 2.1 3.1 3.2 2.4 2.1 3.4 2.9 2.4 Southeast ............................. 2.8 2.7 3.0 2.6 1.6 3.0 3.2 3.1 2.9 3.4 2.9 2.6 2.5 3.4 2.9 1.8 Central ................................. 2.1 2.3 2.4 2.5 1.5 2.3 3.0 2.0 2.1 2.1 2.5 1.6 2.8 2.5 2.3 2.2 West .................................... 2.9 2.6 2.3 2.7 2.4 2.7 2.5 1.9 2.7 3.0 2.3 1.6 2.7 2.8 2.1 1.6 See notes at end of table.

A-8
Table A-4. Standard errors for table 4: Percentage distributions of public school districts reporting the extent to which employers are involved in various ways with the career and technical education (CTE) programs offered by the district to high school students, by district characteristics: 2016–17—Continued
District characteristic
Provide training opportunities for CTE teachers
Not at all
Small extent
Moder-ate
extent
Large or very large
extent
All public school districts ...... 1.2 1.3 1.1 0.8
District enrollment size Less than 1,000 ........................ 2.5 2.4 2.1 1.6 1,000 to 2,499 ........................... 2.3 2.9 2.3 1.1 2,500 to 9,999 ........................... 1.9 2.2 1.7 1.1 10,000 or more ......................... 1.3 1.6 1.1 1.2 Community type City ........................................... 3.2 3.5 3.1 2.5 Suburban .................................. 2.1 2.5 2.2 1.4 Town ........................................ 2.6 2.2 2.7 1.1 Rural ......................................... 1.8 2.1 1.7 1.3 Region Northeast .................................. 2.6 3.1 3.4 1.7 Southeast .................................. 3.4 3.6 2.6 1.5 Central ...................................... 3.0 2.5 2.0 1.3 West ......................................... 2.2 2.2 1.9 1.6 † Not applicable. SOURCE: U.S. Department of Education, National Center for Education Statistics, Fast Response Survey System (FRSS), “Career and Technical Education Programs in Public School Districts,” FRSS 108, 2017.

A-9
Table A-5. Standard errors for table 5: Percentage distributions of public school districts reporting on how much of a barrier various items are to the district in offering career and technical education (CTE) programs to high school students, by district characteristics: 2016–17
District characteristic
Lack of funding or high cost of programs Facilities or space limitations
Finding or keeping teachers for in-demand industries and occupations
Limited availability of professional development in technical fields
Not a barrier
Small barrier
Moder-ate
barrier
Large or very
large barrier
Not a barrier
Small barrier
Moder-ate
barrier
Large or very
large barrier
Not a barrier
Small barrier
Moder-ate
barrier
Large or very
large barrier
Not a barrier
Small barrier
Moder-ate
barrier
Large or very
large barrier
All public school districts . 0.8 1.1 1.3 1.5 0.9 1.2 1.3 1.6 0.9 1.2 1.4 1.4 1.1 1.4 1.6 1.1
District enrollment size Less than 1,000 ................... 1.9 2.1 2.8 3.1 2.2 2.2 2.9 3.2 2.0 2.4 2.9 2.6 2.2 2.5 3.3 2.2 1,000 to 2,499 ...................... 1.0 1.9 1.6 1.9 1.2 2.1 2.0 2.7 1.4 2.1 1.9 2.7 1.9 3.1 3.0 1.7 2,500 to 9,999 ...................... 1.1 1.6 1.7 2.3 1.0 2.0 1.5 2.3 1.2 1.6 1.9 1.8 1.6 1.8 1.5 1.6 10,000 or more .................... 0.9 1.5 2.0 1.8 0.5 1.3 2.2 1.8 0.6 1.0 1.5 1.6 1.3 1.5 2.3 1.3 Community type City ...................................... 1.7 2.7 3.4 3.2 2.0 2.7 3.5 3.6 1.3 2.7 2.7 3.3 2.7 2.7 3.5 3.2 Suburban ............................. 1.4 1.9 2.3 2.1 1.7 1.9 2.0 2.4 1.9 1.9 2.1 2.1 2.0 2.2 2.4 1.7 Town ................................... 1.5 2.1 2.7 2.6 1.7 2.7 2.7 2.9 1.8 2.3 3.0 3.1 2.6 3.3 2.9 2.3 Rural .................................... 1.4 1.4 1.8 2.4 1.8 1.7 2.0 2.5 1.6 2.0 2.4 2.4 1.8 2.3 2.5 1.9 Region Northeast ............................. 2.2 2.7 3.1 3.1 2.3 2.2 2.6 3.3 2.9 2.4 3.3 2.8 2.6 2.3 3.2 2.0 Southeast ............................. 1.9 1.8 2.8 3.0 1.9 2.7 2.8 3.0 2.0 2.9 2.5 2.9 3.1 3.0 3.0 2.3 Central ................................. 1.6 1.4 2.5 2.6 1.5 1.8 2.7 3.0 1.6 2.1 2.5 2.6 1.9 2.4 2.6 1.7 West .................................... 1.7 1.8 2.8 3.4 1.9 2.3 2.6 2.5 1.8 1.8 2.6 3.3 2.7 2.3 3.1 2.9 See notes at end of table.

A-10
Table A-5. Standard errors for table 5: Percentage distributions of public school districts reporting on how much of a barrier various items are to the district in offering career and technical education (CTE) programs to high school students, by district characteristics: 2016–17—Continued
District characteristic
Difficulty keeping CTE teachers’ technical skills up to date
CTE teachers have difficulty obtaining regular state teaching
certificate
Difficulty developing partnerships with employers for work-based
learning
Not a barrier
Small barrier
Moder-ate
barrier
Large or very
large barrier
Not a barrier
Small barrier
Moder-ate
barrier
Large or very
large barrier
Not a barrier
Small barrier
Moder-ate
barrier
Large or very
large barrier
All public school districts . 1.3 1.6 1.5 0.9 1.4 1.4 1.5 1.2 1.2 1.6 1.6 1.3
District enrollment size Less than 1,000 ................... 2.8 3.1 3.1 1.8 3.1 2.6 3.6 2.6 2.3 3.3 3.6 2.9 1,000 to 2,499 ...................... 1.9 3.1 2.9 1.5 1.7 2.8 1.5 1.9 2.0 2.7 2.3 1.6 2,500 to 9,999 ...................... 1.8 1.8 1.8 1.1 2.0 1.9 1.4 1.2 1.8 1.6 1.3 1.3 10,000 or more .................... 2.0 1.6 2.0 1.4 1.8 1.7 1.7 0.8 1.8 1.9 2.0 1.4 Community type City ...................................... 2.8 2.8 3.7 2.4 2.7 2.9 3.2 3.2 2.7 3.2 2.9 3.2 Suburban ............................. 2.3 2.2 2.3 1.7 1.9 2.4 1.7 1.9 1.9 2.4 2.3 1.5 Town ................................... 2.6 3.5 3.2 1.8 3.0 3.0 2.3 2.5 2.7 2.9 2.5 2.2 Rural .................................... 2.2 2.5 2.3 1.4 2.5 2.3 2.8 1.9 1.9 2.5 2.7 2.2 Region Northeast ............................. 3.2 2.8 3.2 1.9 3.0 3.0 2.7 2.8 2.9 3.6 2.8 2.0 Southeast ............................. 3.8 3.1 2.6 2.2 2.8 3.1 2.2 2.2 2.3 3.8 2.6 3.1 Central ................................. 2.2 2.2 2.5 1.5 2.5 2.2 2.3 1.7 2.1 2.2 2.9 2.2 West .................................... 2.9 2.8 2.9 2.5 3.1 2.2 2.5 3.0 2.1 2.7 2.5 3.0 SOURCE: U.S. Department of Education, National Center for Education Statistics, Fast Response Survey System (FRSS), “Career and Technical Education Programs in Public School Districts,” FRSS 108, 2017.

A-11
Table A-6. Standard errors for table 6: Percentage distributions of public school districts reporting on how much of a barrier various items are to student participation in the career and technical education (CTE) programs offered by the district to high school students, by district characteristics: 2016–17
District characteristic
Lack of time in students’ schedules Students’ or parents’ negative
perceptions of CTE Teachers’ or guidance counselors’
negative perceptions of CTE Transportation to CTE programs
Not a barrier
Small barrier
Moder-ate
barrier
Large or very
large barrier
Not a barrier
Small barrier
Moder-ate
barrier
Large or very
large barrier
Not a barrier
Small barrier
Moder-ate
barrier
Large or very
large barrier
Not a barrier
Small barrier
Moder-ate
barrier
Large or very
large barrier
All public school districts . 0.8 1.6 1.5 1.2 1.5 1.6 1.4 0.8 1.4 1.3 0.7 0.6 1.2 1.3 1.1 1.1
District enrollment size Less than 1,000 ................... 1.3 3.3 2.7 2.2 3.0 3.4 2.8 1.2 2.6 2.5 1.3 1.0 2.1 2.8 2.2 2.4 1,000 to 2,499 ...................... 2.0 3.0 3.1 2.1 2.5 2.5 2.1 1.8 3.1 2.4 1.4 1.5 2.8 2.1 2.0 1.5 2,500 to 9,999 ...................... 1.3 1.4 2.0 2.0 1.6 1.8 1.7 1.6 1.8 1.7 1.4 1.3 2.1 1.7 1.1 1.7 10,000 or more .................... 1.1 1.7 2.4 2.1 1.0 1.7 2.0 1.0 1.1 1.9 1.8 1.0 1.9 1.9 1.8 1.9 Community type City ...................................... 3.5 2.4 3.4 2.9 3.8 3.0 2.7 2.3 3.9 2.5 3.3 2.1 3.7 3.5 3.0 2.2 Suburban ............................. 2.0 2.0 2.5 2.2 2.1 2.2 2.3 1.9 2.2 1.7 1.5 1.3 2.8 2.2 1.8 1.9 Town ................................... 2.4 3.2 3.1 2.8 2.8 2.9 2.6 1.7 2.9 2.5 1.6 1.4 2.7 2.3 2.0 2.1 Rural .................................... 1.1 2.5 2.5 2.0 2.5 2.3 2.4 1.0 2.2 2.0 1.1 0.7 1.9 2.2 1.7 1.9 Region Northeast ............................. 2.7 3.0 2.9 2.6 2.8 2.5 2.9 2.7 3.2 2.4 2.0 2.1 2.8 2.9 2.4 1.6 Southeast ............................. 2.4 2.9 3.0 2.5 3.6 2.6 2.5 1.8 2.8 2.3 1.7 1.7 3.4 3.0 1.9 3.2 Central ................................. 1.5 2.4 2.2 2.3 3.0 3.0 2.2 1.4 2.4 2.2 1.1 0.9 1.8 1.7 1.9 1.9 West .................................... 1.9 2.7 3.1 2.1 3.1 3.1 1.8 1.2 2.7 2.6 1.3 1.1 3.3 2.5 2.3 3.2 See notes at end of table.

A-12
Table A-6. Standard errors for table 6: Percentage distributions of public school districts reporting on how much of a barrier various items are to student participation in the career and technical education (CTE) programs offered by the district to high school students, by district characteristics: 2016–17—Continued
District characteristic
Transportation for work-based learning
Students’ costs for supplies, uniforms, or materials
Students’ difficulty finding work-based learning
Lack of student support services for special populations
Not a barrier
Small barrier
Moder-ate
barrier
Large or very
large barrier
Not a barrier
Small barrier
Moder-ate
barrier
Large or very
large barrier
Not a barrier
Small barrier
Moder-ate
barrier
Large or very
large barrier
Not a barrier
Small barrier
Moder-ate
barrier
Large or very
large barrier
All public school districts . 1.3 1.5 1.1 1.4 1.5 1.5 1.2 1.0 1.4 1.4 1.3 1.1 1.3 1.2 0.9 0.7
District enrollment size Less than 1,000 ................... 2.9 3.1 2.1 3.2 3.3 3.0 2.7 1.8 3.1 3.1 2.5 2.0 2.4 2.3 1.6 1.5 1,000 to 2,499 ...................... 2.3 2.8 1.9 2.0 2.0 2.7 1.8 1.8 1.8 2.0 2.5 2.0 2.4 2.0 1.8 1.1 2,500 to 9,999 ...................... 1.6 1.6 1.8 1.5 2.2 1.7 1.3 1.4 2.0 2.2 1.5 1.8 2.2 2.1 1.7 1.2 10,000 or more .................... 1.3 1.6 2.0 1.8 2.1 2.9 1.7 1.4 1.2 1.6 1.9 1.1 1.4 1.4 1.4 0.9 Community type City ...................................... 2.4 3.8 2.6 3.4 2.8 3.6 3.2 2.1 3.3 3.3 2.6 3.2 3.3 3.2 3.5 1.6 Suburban ............................. 2.4 2.2 2.2 2.0 2.6 2.7 1.7 1.6 2.1 2.3 1.9 1.7 2.6 2.3 2.1 1.4 Town ................................... 3.0 3.1 2.8 2.2 2.9 3.0 2.5 2.1 2.6 3.0 2.9 2.7 2.9 3.0 2.2 1.6 Rural .................................... 2.0 2.6 1.8 2.3 2.6 2.2 2.2 1.7 2.3 2.3 1.8 1.6 2.4 1.9 1.4 1.1 Region Northeast ............................. 2.9 2.9 2.6 2.4 3.0 2.8 2.4 1.8 3.0 2.8 3.1 1.8 3.5 2.9 2.3 1.7 Southeast ............................. 2.8 2.9 2.5 3.2 3.2 3.4 2.5 2.7 2.4 2.8 3.0 3.2 3.4 3.3 2.1 2.0 Central ................................. 2.3 2.4 1.8 2.6 2.0 2.5 2.2 1.7 2.1 3.2 2.7 2.6 2.2 2.7 1.9 1.4 West .................................... 2.4 2.6 2.0 2.8 2.9 2.9 2.6 2.0 2.3 2.1 2.9 3.1 2.8 2.2 1.9 1.8 SOURCE: U.S. Department of Education, National Center for Education Statistics, Fast Response Survey System (FRSS), “Career and Technical Education Programs in Public School Districts,” FRSS 108, 2017.

A-13
Table A-7. Standard errors for table 7: Percent of public school districts with a decision-making role in adding or phasing out career and technical education (CTE) programs for high school students, and the percentage distributions of those districts reporting the extent to which various factors influence those decisions, by district characteristics: 2016–17
District characteristic
Districts with
decision-making
role
Enrollment or student interest Facilities/space considerations
Extent of influence on decision
to add new CTE program Extent of influence on decision
to phase out CTE program Extent of influence on decision
to add new CTE program Extent of influence on decision
to phase out CTE program
Not at
all Small extent
Moder-ate
extent
Large or very
large extent
Not at all
Small extent
Moder-ate
extent
Large or very
large extent
Not at all
Small extent
Moder-
ate extent
Large or very
large extent
Not at all
Small extent
Moder-ate
extent
Large or very
large extent
All public school districts 0.9 0.6 1.0 1.3 1.4 0.5 0.7 1.2 1.4 0.7 1.0 1.2 1.6 0.8 1.4 1.2 1.8
District enrollment size Less than 1,000 ................. 1.6 1.3 2.3 3.0 3.2 1.3 1.6 2.6 2.9 1.7 2.1 2.5 3.6 1.8 3.3 2.3 3.9 1,000 to 2,499 .................... 1.7 1.0 1.5 2.2 2.4 † 1.0 2.1 2.5 1.0 1.6 2.0 2.7 1.4 1.9 2.4 3.3 2,500 to 9,999 .................... 1.5 † 0.7 1.5 1.5 † 0.9 1.4 1.6 0.4 1.2 1.4 1.7 1.1 1.4 1.9 2.1 10,000 or more .................. 0.6 † 1.0 1.6 1.5 † 0.5 1.0 1.1 † 0.9 1.6 1.8 0.8 1.4 1.5 1.9 Community type City .................................... 1.7 † 2.8 2.5 3.8 † 2.9 1.6 3.7 † 2.2 3.3 3.7 3.0 3.1 3.5 2.8 Suburban ........................... 2.2 † 1.4 1.9 2.3 † 0.6 1.9 2.1 0.4 1.4 2.3 2.5 1.6 1.7 1.9 2.6 Town ................................. 1.9 † 1.8 3.1 3.2 † 0.6 2.2 2.4 † 1.7 2.8 3.0 1.7 2.3 3.0 3.2 Rural .................................. 1.4 0.7 1.6 1.9 2.2 0.8 1.2 2.1 2.5 1.3 1.7 1.8 2.3 1.2 2.6 1.9 3.1 Region Northeast ........................... 2.8 † 1.9 3.5 3.7 † 1.6 2.1 2.7 1.4 2.5 3.2 4.1 2.5 3.1 3.1 4.0 Southeast ........................... 1.4 † 2.3 2.7 3.3 † 1.8 2.5 2.8 1.7 2.3 2.4 3.0 1.8 2.8 2.7 2.7 Central ............................... 1.7 0.8 1.4 2.3 2.5 0.9 1.3 1.9 2.5 0.9 1.8 2.5 3.2 1.4 2.1 2.8 2.8 West .................................. 1.9 1.2 2.2 2.7 3.0 1.6 1.3 2.8 3.2 1.3 1.1 2.4 3.3 1.8 2.9 2.5 3.5 See notes at end of table.

A-14
Table A-7. Standard errors for table 7: Percent of public school districts with a decision-making role in adding or phasing out career and technical education (CTE) programs for high school students, and the percentage distributions of those districts reporting the extent to which various factors influence those decisions, by district characteristics: 2016–17—Continued
District characteristic
Cost of program Availability of qualified teachers Extent of influence on decision
to add new CTE program Extent of influence on decision
to phase out CTE program Extent of influence on decision
to add new CTE program Extent of influence on decision
to phase out CTE program
Not at all
Small extent
Moder-ate
extent
Large or very
large extent
Not at all
Small extent
Moder-ate
extent
Large or very
large extent
Not at all
Small extent
Moder-ate
extent
Large or very
large extent
Not at all
Small extent
Moder-
ate extent
Large or very
large extent
All public school districts . 0.3 0.7 1.4 1.4 0.5 1.0 1.2 1.5 0.6 1.2 1.4 1.7 0.7 1.2 1.5 1.6
District enrollment size Less than 1,000 ................... † 1.6 2.7 2.5 1.0 2.2 1.8 3.0 1.4 2.7 2.8 3.3 1.3 2.6 3.3 3.6 1,000 to 2,499 ...................... † 1.2 3.0 3.2 1.0 1.6 3.3 3.2 † 1.6 3.1 3.5 1.4 1.5 2.3 2.5 2,500 to 9,999 ...................... † 1.0 1.7 2.0 0.9 1.1 1.6 1.7 0.8 1.1 1.9 2.3 1.0 1.5 1.9 2.1 10,000 or more .................... 0.4 0.7 1.7 1.6 0.8 1.5 1.5 1.8 0.3 1.0 1.3 1.6 0.8 1.0 1.5 2.0 Community type City ...................................... † 1.6 3.4 3.7 1.2 3.4 3.2 3.3 1.0 2.0 2.5 3.2 1.3 3.4 2.5 3.7 Suburban ............................. 0.4 1.0 2.3 2.4 1.0 1.7 2.5 2.8 1.0 1.5 2.4 2.5 1.2 2.0 2.4 2.6 Town ................................... † 1.2 2.5 2.6 0.9 1.8 2.6 2.8 1.5 1.6 2.8 3.0 1.5 2.4 2.6 3.2 Rural .................................... † 1.3 1.8 1.9 0.9 1.7 1.7 2.5 † 2.0 2.4 2.4 0.9 1.7 2.6 2.8 Region Northeast ............................. † 1.7 3.5 3.8 2.0 2.9 3.5 3.7 1.8 2.9 3.7 3.9 2.2 2.8 3.2 3.4 Southeast ............................. † 2.3 2.5 3.2 1.1 2.2 3.0 3.3 1.7 2.3 3.1 3.5 1.5 2.2 3.1 3.4 Central ................................. † 1.2 2.0 2.1 0.9 1.8 2.0 2.4 0.8 1.3 2.3 2.8 0.8 1.8 2.5 2.5 West .................................... 0.2 1.1 2.1 2.0 1.0 1.6 2.1 2.4 † 2.0 2.1 2.2 1.0 1.6 2.4 2.9 See notes at end of table.

A-15
Table A-7. Standard errors for table 7: Percent of public school districts with a decision-making role in adding or phasing out career and technical education (CTE) programs for high school students, and the percentage distributions of those districts reporting the extent to which various factors influence those decisions, by district characteristics: 2016–17—Continued
District characteristic
Information on which industries and occupations are in demand Employer recommendations Extent of influence on decision
to add new CTE program Extent of influence on decision
to phase out CTE program Extent of influence on decision
to add new CTE program Extent of influence on decision
to phase out CTE program
Not at all
Small extent
Moder-ate
extent
Large or very
large extent
Not at all
Small extent
Moder-ate
extent
Large or very
large extent
Not at all
Small extent
Moder-ate
extent
Large or very
large extent
Not at all
Small extent
Moder-
ate extent
Large or very
large extent
All public school districts . 1.0 1.2 1.4 1.5 0.8 1.2 1.3 1.7 1.1 1.4 1.4 1.2 1.2 1.1 1.3 1.6
District enrollment size Less than 1,000 ................... 2.2 2.5 2.9 3.0 1.7 2.7 2.5 3.8 2.5 3.0 2.9 2.4 2.7 2.4 2.5 3.8 1,000 to 2,499 ...................... 1.2 1.8 2.6 3.0 1.4 2.2 2.4 2.1 1.5 2.3 2.1 2.3 2.1 2.1 2.8 2.0 2,500 to 9,999 ...................... 1.1 1.5 1.6 1.6 1.1 1.4 1.9 2.3 1.0 1.8 2.2 1.8 1.0 1.5 1.8 1.5 10,000 or more .................... 0.8 0.8 1.4 1.6 0.6 1.3 1.5 1.7 0.7 1.0 1.3 1.6 0.7 1.5 2.2 1.6 Community type City ...................................... 2.2 3.1 2.3 3.9 1.3 3.5 3.6 3.7 1.9 3.8 2.7 3.6 1.7 3.7 3.8 3.4 Suburban ............................. 1.6 2.0 2.1 2.7 1.4 2.0 2.2 2.8 1.9 2.3 2.3 2.7 1.5 2.2 2.5 2.4 Town ................................... 2.2 2.0 3.1 2.9 2.1 2.4 2.9 2.7 2.1 2.6 3.0 2.6 2.8 2.4 2.8 2.7 Rural .................................... 1.5 1.9 2.6 2.6 1.4 2.1 2.2 2.9 1.9 2.5 2.3 2.1 2.2 1.9 2.1 2.7 Region Northeast ............................. 2.3 3.1 3.2 3.4 2.1 3.1 3.2 3.8 2.5 3.5 3.6 3.5 2.5 3.0 3.6 3.7 Southeast ............................. 1.6 2.4 2.9 3.0 1.6 2.4 3.1 3.4 1.8 2.9 2.7 3.2 1.8 2.8 3.0 3.2 Central ................................. 1.9 2.7 2.8 2.4 1.9 2.2 2.0 2.4 1.8 2.4 2.2 2.2 2.3 2.2 2.0 2.4 West .................................... 2.0 2.5 3.2 3.4 1.5 2.3 2.8 3.6 1.9 2.3 2.6 2.5 1.6 2.3 2.4 3.0 See notes at end of table.

A-16
Table A-7. Standard errors for table 7: Percent of public school districts with a decision-making role in adding or phasing out career and technical education (CTE) programs for high school students, and the percentage distributions of those districts reporting the extent to which various factors influence those decisions, by district characteristics: 2016–17—Continued
District characteristic
Postsecondary institution recommendations Recommendations from state department of education Extent of influence on decision
to add new CTE program Extent of influence on decision
to phase out CTE program Extent of influence on decision
to add new CTE program Extent of influence on decision
to phase out CTE program
Not at all
Small extent
Moder-ate
extent
Large or very
large extent
Not at all
Small extent
Moder-ate
extent
Large or very
large extent
Not at all
Small extent
Moder-ate
extent
Large or very
large extent
Not at all
Small extent
Moder-
ate extent
Large or very
large extent
All public school districts . 1.1 1.5 1.2 1.2 1.1 1.8 1.5 1.4 1.2 1.6 1.6 1.4 1.1 1.4 1.3 1.6
District enrollment size Less than 1,000 ................... 2.5 3.3 2.3 2.8 2.5 4.0 3.5 3.1 2.8 3.7 3.7 3.0 2.3 2.9 2.6 3.8 1,000 to 2,499 ...................... 1.7 2.3 2.3 1.8 2.0 2.5 1.8 2.0 1.5 2.1 2.4 2.3 2.2 2.7 2.5 2.2 2,500 to 9,999 ...................... 1.1 1.9 2.2 1.7 1.3 2.1 2.1 1.7 1.0 2.2 2.1 1.8 1.1 2.1 2.0 2.0 10,000 or more .................... 1.0 1.3 2.0 1.4 0.9 1.4 2.2 1.2 0.8 1.5 1.6 1.4 0.8 1.3 1.3 1.7 Community type City ...................................... 2.3 3.9 3.2 2.9 3.0 3.6 3.6 3.4 2.7 3.2 3.5 2.7 3.1 2.8 3.4 3.1 Suburban ............................. 1.7 2.5 2.4 2.5 1.5 2.4 2.5 2.4 1.7 2.3 2.6 2.3 1.3 2.4 2.7 2.5 Town ................................... 2.3 3.2 3.5 2.5 2.8 3.0 2.7 2.6 2.4 2.9 3.1 2.5 2.7 3.0 2.9 2.7 Rural .................................... 1.8 2.7 1.9 2.3 2.0 3.2 2.6 2.5 1.8 2.7 2.6 2.2 1.7 2.2 2.2 2.6 Region Northeast ............................. 2.5 3.6 4.1 3.5 2.5 3.2 3.8 3.1 3.0 3.2 3.4 3.2 2.3 3.7 3.2 2.9 Southeast ............................. 1.5 3.0 2.9 3.0 2.0 3.1 3.0 3.5 1.5 2.9 2.9 3.3 1.2 2.5 2.8 3.4 Central ................................. 1.8 2.7 2.3 1.9 1.8 2.8 2.6 2.0 1.5 2.2 2.7 2.5 2.0 2.2 2.4 2.5 West .................................... 1.5 2.3 2.3 2.0 2.0 2.2 2.7 2.2 2.1 2.4 2.3 2.9 2.7 2.3 3.2 2.9 See notes at end of table.

A-17
Table A-7. Standard errors for table 7: Percent of public school districts with a decision-making role in adding or phasing out career and technical education (CTE) programs for high school students, and the percentage distributions of those districts reporting the extent to which various factors influence those decisions, by district characteristics: 2016–17—Continued
District characteristic
Career pathways from high school to postsecondary Extent of influence on decision
to add new CTE program Extent of influence on decision
to phase out CTE program
Not at all
Small extent
Moder-ate
extent
Large or very
large extent
Not at all
Small extent
Moder-ate
extent
Large or very
large extent
All public school districts . 1.1 1.6 1.4 1.4 1.0 1.5 1.5 1.6
District enrollment size Less than 1,000 ................... 2.6 3.8 3.1 3.0 2.3 3.7 3.2 3.4 1,000 to 2,499 ...................... 1.2 2.1 1.9 2.4 1.7 2.0 2.3 2.6 2,500 to 9,999 ...................... 0.8 1.6 2.0 1.8 0.9 1.5 2.0 2.1 10,000 or more .................... 0.7 1.0 1.7 1.5 0.9 1.0 1.6 1.4 Community type City ...................................... 1.4 3.2 3.8 3.6 3.1 3.7 2.9 3.6 Suburban ............................. 1.5 2.1 2.4 2.4 1.2 2.0 2.7 2.7 Town ................................... 2.1 2.3 3.1 3.6 2.1 2.3 3.1 3.3 Rural .................................... 1.8 2.8 2.7 2.7 1.7 2.9 2.5 2.6 Region Northeast ............................. 2.3 3.1 3.1 3.3 2.2 3.3 3.6 3.7 Southeast ............................. 1.5 2.7 3.0 3.5 1.6 2.5 3.1 3.6 Central ................................. 1.6 2.6 2.6 2.5 1.6 2.3 2.3 2.2 West .................................... 1.9 2.4 2.8 3.0 2.2 2.7 2.8 3.2 † Not applicable. SOURCE: U.S. Department of Education, National Center for Education Statistics, Fast Response Survey System (FRSS), “Career and Technical Education Programs in Public School Districts,” FRSS 108, 2017.

B-1
Appendix B
Technical Notes

B-2
Technical Notes
Fast Response Survey System
The Fast Response Survey System (FRSS) was established in 1975 by the National Center for Education Statistics (NCES), U.S. Department of Education. FRSS is designed to collect issue-oriented data within a relatively short time frame. FRSS collects data from state education agencies, local education agencies, public and private elementary and secondary schools, public school teachers, and public libraries. To ensure minimal burden on respondents, the surveys are generally limited to three pages of questions, with a response burden of about 30 minutes per respondent. Sample sizes are relatively small (usually about 1,200 to 1,800 respondents per survey) so that data collection can be completed quickly. Data are weighted to produce national estimates of the sampled education sector. The sample size permits limited breakouts by analysis variables. However, as the number of categories within any single analysis variable increases, the sample size within categories decreases, which results in larger sampling errors for the breakouts by analysis variables.
Sample Design
The sample for the FRSS survey “Career and Technical Education Programs in Public School Districts” consisted of approximately 1,800 eligible public school districts with high school grades in the 50 states and the District of Columbia. The nationally representative sample was selected from the 2013–14 NCES Common Core of Data (CCD) Local Education Agency (LEA) Universe file, which was the most current file available at the time of selection. The sampling frame for this survey included 11,394 eligible public schools districts that were coded with a highest grade of instruction of 11 or 12 in the CCD LEA Universe file. For purposes of this study, an eligible public district was either (1) a regular school district, or (2) a nonregular district that was not federally operated and had at least one operating vocational education school that did not have shared instruction. Regular school districts are generally administered by local education agencies and are responsible for providing instruction. Nonregular school districts include supervisory unions that provide administrative services to multiple districts, regional education service agencies, state-operated school districts, federally operated school districts (excluded from this study), charter school districts, and other nonregular school districts.1 Excluded from the sampling frame were districts with a highest grade of instruction below grade 11, districts with enrollment coded as zero, missing, “not applicable,” or “does not meet NCES quality standards,” federally operated districts, and districts outside the 50 states and the District of Columbia. Of the 11,394 eligible districts on the sampling frame, 11,340 were regular districts.
The district sampling frame was stratified by district enrollment size (less than 1,000; 1,000 to 2,499; 2,500 to 9,999; 10,000 to 24,999; 25,000 to 99,999; 100,000 or more) and community type (city, suburban, town, and rural) to create 21 primary strata. Within stratum, districts were sorted by region (Northeast, Southeast, Central, and West) and poverty status2 (poverty equal to less than 10 percent; 10 to 19.99 percent; 20 to 29.99 percent; and 30 percent or more) prior to selection to induce additional implicit stratification. The variables for district enrollment size, community type, and region are from the CCD LEA universe file, and are defined in 1 For purposes of this study, “regular” school districts were those with TYPE equal to 1 or 2 on the CCD file (a local school district that is not a
component of a supervisory union, or a local school district component of a supervisory union sharing a superintendent and administrative services). “Nonregular” school districts for this study included those with TYPE equal to 3 (supervisory union administrative center, or a county superintendent serving the same purpose), 4 (regional education services agency, or a county superintendent serving the same purpose), 5 (state-operated institution charged, at least in part, with providing elementary and/or secondary instruction or services to a special-needs population), 7 (agencies for which all associated schools are charter schools), and 8 (other education agencies that do not fit into the other categories). Districts with TYPE equal to 6 (federally operated institution charged, at least in part, with providing elementary and/or secondary instruction or services to a special-needs population) were not eligible districts for this study.
2 Poverty status is from the Small Area Income and Poverty Estimates (SAIPE) for school districts, created by the U.S. Census Bureau and available at www.census.gov/programs-surveys/saipe.html.

B-3
more detail in the “Definitions of Analysis Variables” section of these technical notes. Within each primary stratum, districts were selected systematically using sampling rates that depended on the size classification of the district.
Data Collection and Response Rates
Questionnaires and cover letters were mailed to the superintendent of each sampled district in January 2017. The letter stated the purpose of the study and requested that the questionnaire be completed by the person in the district most knowledgeable about career and technical education (CTE) programs for high school students. Respondents were asked to respond for the current 2016–17 school year and the summer of 2016. Respondents were offered options of completing the survey on paper or online. Telephone follow-up for survey nonresponse and data clarification was initiated in February 2017 and completed in June 2017.
Of the approximately 1,800 school districts in the sample, approximately 40 were found to be ineligible because the district was closed or did not meet some other criterion for inclusion in the sample (e.g., did not have at least one school with high school grades). For the eligible districts, an unweighted response rate of 87 percent was obtained for this survey (about 1,530 responding districts divided by the approximately 1,760 eligible districts in the sample). The corresponding weighted response rate using the initial base weights was 86 percent. Among the respondents who completed the survey, 76 percent completed it via the Web, 24 percent completed it by paper (sent by mail, fax, or e-mail), and less than 1 percent completed it by telephone. The final weighted count of responding districts in the survey after nonresponse adjustment represents the estimated universe of eligible school districts in the 50 states and the District of Columbia—approximately 10,800 districts (table B-1).3
Imputation for Item Nonresponse
Cases with missing data were contacted by telephone to collect the missing information. However, for cases in which this data retrieval was unsuccessful, missing data were imputed. Although item nonresponse was very low (less than 1 percent for any item), missing data were imputed for the 73 items with a response rate of less than 100 percent. The missing items were all categorical data, such as whether the district offered CTE programs to high school students at various locations. The missing data were imputed using a “hot-deck” approach to obtain a “donor” district from which the imputed values were derived. Under the hot-deck approach, a donor district that matched selected characteristics of the district with missing data (the recipient district) was identified (Kalton 1983, pp. 65–104). The matching characteristics included district enrollment size, community type, region, and poverty status. In addition, relevant questionnaire items were used to form appropriate imputation groupings. Once a donor was found, the imputed value was simply the corresponding value from the donor district.
Data Reliability
Although the survey on CTE programs in public school districts was designed to account for sampling error and to minimize nonsampling error, estimates produced from the data collected are subject to both types of error. Sampling error occurs because the data are collected from a sample rather than a census of the population, and nonsampling errors are errors made during the collection and processing of the data.
3 For more details about the development of survey weights, see the section of this report on page B-4 on weighting and sampling errors.

B-4
Table B-1. Number and percentage of responding public school districts in the study sample, and estimated number and percentage of public school districts the sample represents, by district characteristics: School year 2016–17
District characteristic
Respondent sample (unweighted)
National estimate (weighted)1
Number Percent Number Percent
All public school districts ....................................... 1,530 100 10,800 100
District enrollment size Less than 1,000 ........................................................... 250 17 4,300 40 1,000 to 2,499 ............................................................. 350 23 2,900 27 2,500 to 9,999 ............................................................. 530 34 2,800 25 10,000 or more ............................................................ 400 26 800 8
Community type City ............................................................................. 230 15 700 6 Suburban ..................................................................... 500 33 2,400 22 Town ........................................................................... 310 20 2,200 21 Rural ........................................................................... 490 32 5,500 51
Region Northeast ..................................................................... 280 18 2,100 20 Southeast ..................................................................... 320 21 1,500 14 Central ........................................................................ 470 31 4,200 39 West ............................................................................ 460 30 2,900 27
1 Weighted count of responding districts using the final nonresponse-adjusted weights. The weighted count is an estimate of the number of eligible districts in the study universe (see text for definition of the types of districts included in the study). NOTE: Based on public school districts with high school grades. Detail may not sum to totals because of rounding. SOURCE: U.S. Department of Education, National Center for Education Statistics, Fast Response Survey System (FRSS), “Career and Technical Education Programs in Public School Districts,” FRSS 108, 2017.
Weighting and Sampling Errors
The responses were weighted to produce national estimates (table B-1). The weights were designed to reflect the probabilities of selection of the sampled districts and were adjusted for differential unit (questionnaire) nonresponse. The nonresponse weighting adjustments were made within classes defined by district enrollment size and community type. Within the final weighting classes, the base weights (i.e., the reciprocal of districts’ probabilities of selection) of the responding districts were inflated by the inverse of the weighted response rate for the class. Such weights are appropriate for analysis of the types of data collected in the survey.
The findings in this report are estimates based on the sample selected and, consequently, are subject to sampling variability. Because the survey data were collected using a complex sampling design, the variances of the estimates from the survey (e.g., estimates of proportions) are typically different from what would be expected from data collected with a simple random sample. Not taking the complex sample design into account can lead to an under- or overestimation of the standard errors associated with such estimates. To generate accurate standard errors for the estimates in this report, standard errors were computed using a technique known as jackknife replication (Levy and Lemeshow 1991). As with any replication method, jackknife replication involves constructing a number of subsamples (replicates) from the full sample and computing the statistic of interest for each replicate. A form of jackknife replication referred to as the JKN method was used to construct the replicates. Under the JKN method, the replicates were formed within groups of districts (called “variance strata”) within which districts were sampled at approximately the same rate. By creating the jackknife replicates within the variance strata, finite population correction factors can be introduced in the variance estimator to account for the fact that districts in some variance strata were sampled at relatively high rates (Rust 1986, Wolter 1985). The mean square error of the replicate estimates around the full sample

B-5
estimate provides an estimate of the variance of the statistic. To construct the replications, 100 stratified subsamples of the full sample were created and then dropped one at a time to define 100 jackknife replicates. Estimates of standard errors can be computed using statistical packages such as SAS or WesVar.
The standard error is a measure of the variability of an estimate due to sampling. It indicates the variability of a sample estimate that would be obtained from all possible samples of a given design and size. Standard errors are used as a measure of the precision expected from a particular sample. If all possible samples were surveyed under similar conditions, intervals of 1.96 standard errors below to 1.96 standard errors above a particular statistic would include the true population parameter being estimated in about 95 percent of the samples. This is a 95 percent confidence interval. For example, the estimated percent of public school districts that offer any CTE courses for which students can earn both high school and postsecondary credit for the same course is 73 percent, and the standard error is 1.6 percent (tables 2 and A-2). The 95 percent confidence interval for the statistic extends from [73 – (1.6 x 1.96)] to [73 + (1.6 x 1.96)], or from 70 to 76 percent. The 1.96 is the appropriate percentile from a standard normal distribution corresponding to a two-sided statistical test at the p < .05 significance level (where .05 indicates the 5 percent of all possible samples that would be outside the range of the confidence interval).
Comparisons can be tested for statistical significance at the p < .05 level using Student’s t-statistic to ensure that the differences are larger than those that might be expected due to sampling variation. Student’s t values are computed to test the difference between estimates with the following formula:
22
21
21
sese
EEt+
−=
where E1 and E2 are the estimates to be compared and se1 and se2 are their corresponding standard errors.
Nonsampling Errors
Nonsampling error is the term used to describe variations in the estimates that may be caused by population coverage limitations and data collection, processing, and reporting procedures. The sources of nonsampling errors are typically problems such as unit and item nonresponse, differences in respondents’ interpretations of the meaning of questions, response differences related to the particular time the survey was conducted, and mistakes made during data preparation. It is difficult to identify and estimate either the amount of nonsampling error or the bias caused by this error. To minimize the potential for nonsampling error, this study used a variety of procedures, including a pretest of the questionnaire with district-level personnel considered to be the most knowledgeable about CTE programs. The pretest provided the opportunity to check for consistency of interpretation of questions and definitions and to eliminate ambiguous items. The questionnaire and instructions were also extensively reviewed by NCES. In addition, extensive editing of the questionnaire responses was conducted to check the data for accuracy and consistency. Cases with missing, inconsistent, or out-of-range items were contacted by telephone to resolve problems. Survey responses received by mail, fax, or telephone were entered into the web survey application. Responses were entered a second time to ensure accuracy of entry.
Definitions of Analysis Variables
Many of the district characteristics described below may be related to each other. For example, district enrollment size and community type are related, with districts located in cities typically being larger than districts located in rural areas. Other relationships between these analysis variables may exist. However, this First Look report focuses on national estimates and bivariate relationships between the analysis variables and questionnaire variables rather than more complex analyses.

B-6
District enrollment size—This variable indicates the total number of students enrolled in the district based on data from the 2013–14 CCD LEA Universe file. The variable used six categories for sampling, but was collapsed into the following four categories for analysis:
Less than 1,000 students 1,000 to 2,499 students 2,500 to 9,999 students 10,000 or more students
Community type—This is a created variable collapsed from the 12-category urban-centric locale variable, as defined in the 2013–14 CCD LEA Universe file. The urban-centric locale code is an indicator of a district’s location relative to a populous area. It is based upon the location of the school buildings in the district and in some cases may not reflect the entire attendance area or residences of enrolled students. This classification system has four major locale categories—city, suburban, town, and rural—each of which is subdivided into three subcategories. Community type was based on the 12-category urban-centric locale variable from CCD collapsed into the four categories below.
City—Territory inside an urbanized area and inside a principal city Suburban—Territory outside a principal city and inside an urbanized area Town—Territory inside an urban cluster
Rural—Territory outside an urbanized area and outside an urban cluster
Region—This variable classifies districts into one of the four geographic regions used by the Bureau of Economic Analysis of the U.S. Department of Commerce. Data were obtained from the 2013–14 CCD LEA Universe file. The geographic regions are as follows:
Northeast—Connecticut, Delaware, District of Columbia, Maine, Maryland, Massachusetts, New Hampshire, New Jersey, New York, Pennsylvania, Rhode Island, and Vermont Southeast—Alabama, Arkansas, Florida, Georgia, Kentucky, Louisiana, Mississippi, North Carolina, South Carolina, Tennessee, Virginia, and West Virginia Central—Illinois, Indiana, Iowa, Kansas, Michigan, Minnesota, Missouri, Nebraska, North Dakota, Ohio, South Dakota, and Wisconsin West—Alaska, Arizona, California, Colorado, Hawaii, Idaho, Montana, Nevada, New Mexico, Oklahoma, Oregon, Texas, Utah, Washington, and Wyoming
Definition and Instructions Provided in This Survey
The following definition and instructions were provided to respondents in the questionnaire.
Career and technical education (CTE) program: a sequence of courses at the high school level that provides students with the academic and technical knowledge and skills needed to prepare for further education and careers in current or emerging professions.
For this survey, include all CTE programs that your district offers to high school students, including programs provided by your district or other entities (such as an area/regional CTE center, a consortium of districts, or a community or technical college).

B-7
Contact Information
For more information about the survey, contact John Ralph, National Center for Education Statistics, Institute of Education Sciences, U.S. Department of Education, Potomac Center Plaza, 550 12th Street SW, Washington, DC 20202; e-mail: [email protected]; telephone: (202) 245-6152.

C-1
Appendix C
Questionnaire

Information Copy – Please do not complete. C-2
U.S. DEPARTMENT OF EDUCATION NATIONAL CENTER FOR EDUCATION STATISTICS (NCES)
WASHINGTON, D.C. 20202
CAREER AND TECHNICAL EDUCATION PROGRAMS IN PUBLIC SCHOOL DISTRICTS
FAST RESPONSE SURVEY SYSTEM
O.M.B. No.: 1850–0733 EXPIRATION DATE: 02/2018
NCES is authorized to conduct this survey by the Education Sciences Reform Act of 2002 (20 U.S.C. § 9543). While participation in this survey is voluntary, your cooperation is critical to make the results of this survey comprehensive, accurate, and timely. Your answers may be used only for statistical purposes and may not be disclosed, or used, in identifiable form for any other purpose except as required by law (20 U.S.C. § 9573).
This survey is designed to be completed by the person in the district most knowledgeable about career and technical education (CTE) programs for high school students.
Name of person completing this form: ___________________________________________________________________
Title/position: ______________________________________________________________________________________
Telephone number: ___________________________________ E-mail: ______________________________________
Best days and times to reach you (in case of questions): ___________________________________________________
THANK YOU. PLEASE KEEP A COPY OF THIS SURVEY FOR YOUR RECORDS.
PLEASE RETURN COMPLETED FORM TO: Mail: Cindy Gray (6197.03.01.02) Westat 1600 Research Boulevard Rockville, Maryland 20850-3129 Fax: 800-254-0984
IF YOU HAVE ANY QUESTIONS OR COMMENTS, CONTACT: Cindy Gray at Westat 800-937-8281, ext. 4336 or 301-251-4336 E-mail: [email protected]
According to the Paperwork Reduction Act of 1995, no persons are required to respond to a collection of information unless it displays a valid OMB control number. The valid OMB control number for this information collection is 1850–0733. The time required to complete this information collection is estimated to average 20 minutes per response, including the time to review instructions, search existing data resources, gather the data needed, and complete and review the information collection. If you have any comments concerning the accuracy of the time estimate, suggestions for improving this form, or any comments or concerns regarding the status of your individual submission of this form, please write directly to: Quick Response Information System (QRIS), National Center for Education Statistics (NCES), PCP, 550 12th Street, SW, 4th floor, Washington, DC 20202. FRSS Form No. 108, 01/2017

Information Copy – Please do not complete. C-3
Instructions and Definitions
1. Please use the following definition for completing this survey:
Career and technical education (CTE) program: a sequence of courses at the high school level that provides students with the academic and technical knowledge and skills needed to prepare for further education and careers in current or emerging professions.
2. For this survey, include all CTE programs that your district offers to high school students, including programs provided by your district or by other entities (such as an area/regional CTE center, a consortium of districts, or a community or technical college).
3. Please report only for CTE programs offered to high school students.
4. Please report for the 2016–17 school year and the summer of 2016.
5. This survey is designed to be completed by the person in the district most knowledgeable about career and technical education (CTE) programs for high school students. Please consult with others who can help provide the requested information.

Information Copy – Please do not complete. C-4
For this survey, include all CTE programs that your district offers to high school students, including programs provided by your district or by other entities (such as an area/regional CTE center, a consortium of districts, or a community or technical college).
1. Does your district offer CTE programs to students at the high school level? (See instruction box above.)
Yes... (Continue with question 2.) No... (Skip to question 15.)
2. Which of the following entities provide the CTE programs that your district offers to your high school students? (Indicate yes or no for each item.) Yes No a. An area/regional CTE center or a group/consortium of school districts ............................................ b. Your district individually (not as part of a consortium) ....................................................................... c. 2-year community or technical college(s) ......................................................................................... d. 4-year college(s) or universities ......................................................................................................... e. Other (specify) __________________________________________________________________
3. At which of the following locations does your district offer CTE programs to high school students? (Indicate yes or no for each item.) Yes No a. At some or all of your district’s regular (comprehensive) high schools .............................................. b. At another district’s regular (comprehensive) high school .............................................................. c. At a CTE-focused high school that students attend full time ............................................................ d. At a CTE center that students attend part time (for example, students spend half the day at
the CTE center and half at the regular high school) .......................................................................... e. At a 2-year community or technical college, or a 4-year college or university ................................... f. Other (specify) __________________________________________________________________
4. About how many of the CTE programs offered by your district to high school students are structured as career pathways that align with related postsecondary programs? (Check one box.)
None…….. Few……. Some……. Most……. All…….
5. Does your district offer any CTE courses in which students may earn high school credits in math, science, English/language arts, or social studies?
Yes .............. No ................
6. Does your district offer any CTE courses for which students can earn both high school and postsecondary credits for the same course?
Yes .............. No ................
7. Does your district offer any CTE courses online (include courses in a blended/hybrid format)?
Yes .............. No ................
8. Which of the following are included in any of the CTE programs offered by your district to high school students? (Indicate yes or no for each item.) Yes No a. Student-run enterprises or services (for example, school store or restaurant, cosmetology
services, automotive or construction services, child development facility) ....................................... b. Mentoring by local employers ........................................................................................................... c. On-the-job training, internships, practicums, clinical experiences, or cooperative education
(co-op) .............................................................................................................................................. d. Apprenticeships or pre-apprenticeship programs (such as youth apprenticeships) ......................... e. Other work-based learning (specify) ________________________________________________
9. About how many of the CTE programs offered by your district to high school students require work-based learning activities (such as those listed in Question 8) for completion of the program? (Check one box.)
None…….. Few……. Some……. Most……. All…….

Information Copy – Please do not complete. C-5
10. To what extent are employers involved in the following ways with the CTE programs offered by your district to high school students? (Check one box on each line.)
Type of involvement Not at all
Small extent
Moderate extent
Large extent
Very large
extent a. Provide work-based learning opportunities .......................................
b. Serve on your district’s CTE advisory council ...................................
c. Advise about which occupations are in demand ...............................
d. Provide advice on CTE programs to add or eliminate .......................
e. Review CTE program curriculum.......................................................
f. Provide guidance on industry standards ...........................................
g. Provide guidance about equipment or facilities .................................
h. Donate equipment .............................................................................
i. Host student field trips ....................................................................... j. Serve as guest speakers to CTE students ........................................
k. Provide guidance for student CTE projects .......................................
l. Judge student CTE competitions ......................................................
m. Provide training opportunities for CTE teachers ................................
n. Other (specify) ________________________________________
11. How much of a barrier to your district is each of the following in offering CTE programs to high school students? (Check one box on each line.)
Barrier to district in offering CTE Not
a barrier
Small barrier
Moderate barrier
Large barrier
Very large
barrier a. Lack of funding or high cost of programs (for example, cost of
infrastructure or equipment) .........................................................................
b. Facilities or space limitations ........................................................................
c. Finding or keeping teachers for in-demand industries and occupations ......
d. Limited availability of professional development in technical fields ..............
e. Difficulty keeping CTE teachers’ technical skills up to date .........................
f. CTE teachers who move into teaching from other occupations have difficulty obtaining a regular or standard state teaching certificate ..............
g. Difficulty developing partnerships with employers for work-based learning .
h. Other (specify) ______________________________________________
12. How much of a barrier is each of the following to student participation in the CTE programs offered by your district to high school students? (Check one box on each line.)
Barrier to student participation in CTE Not
a barrier
Small barrier
Moderate barrier
Large barrier
Very large
barrier a. Lack of time in students’ schedules for CTE courses ..................................
b. Students’ or parents’ negative perceptions of CTE ......................................
c. Teachers’ or guidance counselors’ negative perceptions of CTE ................
d. Transportation to CTE programs outside of the high school campus ..........
e. Transportation for work-based learning ........................................................
f. Students’ costs for supplies, uniforms, or materials .....................................
g. Students’ difficulty finding work-based learning opportunities ......................
h. Lack of student support services for special populations .............................
i. Other (specify) ______________________________________________

Information Copy – Please do not complete. C-6
Questions 13 and 14 ask about adding or phasing out CTE programs. Please answer these questions about CTE programs for which your district has a role in making these decisions.
Check here and skip to question 15 if your district does not have a decision-making role in adding or phasing out CTE programs.
13. To what extent does each of the following factors influence your district’s decision on whether to add a new CTE program for high school students? (Check one box on each line.)
Factor Not at all
Small extent
Moderate extent
Large extent
Very large extent
a. Student interest ............................................................................................
b. Facilities/space considerations (for example, whether appropriate space is available) ...................................................................................................
c. Costs for new program .................................................................................
d. Availability of qualified teachers ...................................................................
e. Information on which industries and occupations are in demand ................
f. Employer (business/industry) recommendations .........................................
g. Postsecondary institution recommendations ................................................
h. Recommendations from your state department of education ......................
i. Career pathways from the high school to the postsecondary level (for example, to structure new pathways or better align existing pathways) ......
j. Other (specify) ______________________________________________
14. To what extent does each of the following factors influence your district’s decision on whether to phase out a CTE program for high school students? (Check one box on each line.)
Factor Not at all
Small extent
Moderate extent
Large extent
Very large extent
a. Enrollment or student interest .......................................................................
b. Facilities/space considerations (for example, facilities are outdated, space is needed for other purposes) .......................................................................
c. Cost of program ............................................................................................
d. Availability of qualified teachers (for example, a teacher leaves and is difficult to replace) ........................................................................................
e. Information on which industries and occupations are in demand ................
f. Employer (business/industry) recommendations ........................................
g. Postsecondary institution recommendations
h. Recommendations from your state department of education .....................
i. Career pathways from the high school to the postsecondary level (for example, if a program does not align with a career pathway) ......................
j. Other (specify) ______________________________________________
15. Some states have CTE school districts that provide only CTE programs. Students have the option of enrolling in the CTE district instead of enrolling in their home district. Do high school students within your district’s enrollment area have the option of enrolling in a separate CTE district instead of enrolling in your district?
Yes…….. No……. Not applicable, this district is a CTE district…….
Thank you. Please keep a copy for your records.