Embed Size (px)
Citation preview

RESEARCH
Average weekly fees rise by 2.1% in 2013/14, but lag RPI inflation for a fourth consecutive year.
Occupancy rates increase marginally, although rising costs are putting margins under pressure.
Trading performance remains strongest in Greater London and the South East region.
2014
CARE HOMES TRADING PERFORMANCE REVIEW
HIGHLIGHTS

2
FOREWORD
2013/14 RESULTS AT A GLANCEAll care LFL annual
changePersonal
careLFL annual
changeCare with nursing
LFL annual change
Occupancy 87.6% 91.2% 86.6%
Average Weekly Fees £660 £566 £688
Staff Costs (% of income) 56.9% 55.1% 57.3%
EBITDARM (% income) 27.5% 29.2% 27.1%
Source: Knight Frank
FIGURE 1Regional share of the sample% of total care beds
12-MONTH CURRENT SHARE CHANGE IN OF BEDS BED NO.S
EAST 13% 33% EAST MIDLANDS 6% 61% GREATER LONDON 7% 35% NORTH EAST 8% 6% NORTH WEST 12% 22% NORTHERN IRELAND 5% 28% SCOTLAND 10% 17% SOUTH EAST 14% 49% SOUTH WEST 5% 21% WALES 3% 65% WEST MIDLANDS 8% 50% YORKS & HUMBER 9% 30%
Source: Knight Frank
On behalf of Knight Frank’s Healthcare team I am delighted to welcome you to our third annual update of the Care Homes Trading Performance Review.
This year’s update welcomes a number of additional leading care providers to the Care Homes Trading Performance Index (CH‑TPI), making the research the most definitive evaluation of trading performance for the UK elderly care home sector. The index now comprises the majority of the UK’s care providers, with a distinct bias towards corporately operated over independently run facilities.
The expansion of the CH‑TPI has further enhanced the reliability of our geographical analysis down to the county level, as well as providing much greater scope to assess key performance indicators (KPIs) according to care home age and size. That said, the significant change to the index’s composition brings added complexity, with trends over time requiring comparisons on a like‑for‑like (LFL) basis in order to be meaningful.
We would like to thank the growing number of leading care providers for contributing to the index. We hope that the findings provide a basis for the benchmarking of care home trading performance; informing care providers, public bodies and investors of latest trends in the sector with regard to occupancy, fee rates, costs and profitability.
OLIVER DU SAUTOYHead of Regional Research

3
CARE HOMES TRADING PERFORMANCE REVIEW RESEARCH
Occupancy The overall care home occupancy rate increased marginally during FY 2013/14, rising from 87.2% to 87.6%. While the rise was not quite sufficient to reverse the fall seen during 2012, occupancy has been broadly stable since 2010, having fallen relatively sharply during the preceding years corresponding to the height of the recession (Figure 2).
Personal care homes continue to demonstrate stronger occupancy than nursing homes, with occupancy rates of 91.2% and 86.5% respectively in FY 2013/14. The difference is linked to a number of factors, principally; the strengthening of demand for dementia care at homes without nursing, the growing demand for privately funded care in personal care facilities, and the higher levels of dependency associated with nursing registered homes.
Occupancy rates vary markedly between the UK regions, although the overall pattern remains broadly similar to previous years (Figure 3). Wales shows the highest occupancy this year, standing at 92% overall and considerably above the overall UK rate. London, East and South East all show occupancy rates above the all UK level, which is unsurprising given the pressure on bed supply from alternative uses is typically greater here than elsewhere.
As last year, the North East and South West regions continue to show the weakest occupancy levels, at 85% and 82% respectively, which acted as a drag on the overall Index occupancy rate. While there is no clear explanation for the South West, low occupancy in the North East stems from a systemic over-supply of beds in the region, a consequence of a glut of care home development during the last decade.
OCCUPANCY AND INCOMEOccupancy rates see marginal increase, although the rise in fees lags inflation.
2006
/ 07
2007
/ 08
2008
/ 09
2009
/ 10
2010
/ 11
2011
/ 12
2012
/ 13
2013
/ 14
KF Turquoise S4
84%
85%
86%
87%
88%
89%
90%
FIGURE 2Occupancy rates%
Source: Knight Frank
75%
77%
79%
81%
83%
85%
87%
89%
91%
93%
95%
Wal
esEa
stG
reat
er L
ondo
nYo
rks
& H
umbe
rW
est M
idla
nds
Sout
h Ea
stEa
st M
idla
nds
Nor
th W
est
Nor
ther
n Ire
land
Scot
land
Sout
h W
est
Nor
th E
ast
All UK
FIGURE 3Occupancy rates by region (FY 2013/14)%
Source: Knight Frank
ELDERLY CARE PROVISION
This report assesses care facilities with a bias towards nursing homes in our sample. Note that many facilities provide both nursing care and personal care on‑site, and these
fall under Nursing in our analysis.
ELDERLY CARE
CARE FACILITY
AT HOME
Nursing
Personal care
Extra care
Domiciliary
iNursing care – Care home with professionally qualified nursing staff.
Personal care – Residential care home with non‑professionally qualified care staff.
Extra care – Retirement housing, where residents live independently with care services attached as required.
Domiciliary care – Care provided at the resident’s own home.

4
IncomeFor the UK as a whole, the CH-TPI reveals average weekly fee levels of £660 in FY 2013/14. While this is markedly higher than last year’s equivalent figure (£622 per week), this largely reflects the changing composition of the index. A truer, LFL comparison reveals that overall fee rates increased by 2.1% during FY 2012/13. This is clear improvement on the 1.1% uplift seen during 2012, but nevertheless equates to a fourth consecutive year of below inflation fee growth (Figure 4).
There was a notable difference between the extent of fee increases between the two types of care; Personal care saw above inflation LFL growth of 2.9% in average fees while nursing homes saw fee growth of 1.8%. This divergence reflects the bias towards self-funded care that is evident in personal care homes, where fee rises have reflected individuals’ ability to pay, rather than being dictated by local authority budgetary constraints.
From the regional perspective, the UK’s southern regions continue to command the highest average fee levels (Figure 5). For nursing homes, the South East has the highest average fee levels, at £850 per week, followed by Greater London,
at £816 per week. This reflects the greater prevalence of private paying residents, which supports the fee levels required to cover the higher staff costs and land values associated with these regions.
Average fee levels for nursing care are correspondingly lower in the northern regions of England, at £554 per week. With the private pay market being less prevalent here, local authority fees typically account for the majority of a care home’s revenues. The North East continues to have the lowest average fees of any region, at £486 per week, with ongoing fee pressures exacerbated by over-supply.
Turning to personal care, the regional ordering of fee rates is broadly in line with that of nursing homes. While England’s southern regions again show the highest fees, the regional differential is far less significant than it is for nursing care. Nursing care’s ‘premium’ over personal care fees is also more pronounced in the South compared with elsewhere – in Greater London average nursing fees are 32% higher than personal care fees, compared with a difference of c.15% for the majority of UK regions.
2006
/ 07
2007
/ 08
2008
/ 09
2009
/ 10
2010
/ 11
2011
/ 12
2012
/ 13
2013
/ 14£400
£450
£500
£550
£600
£650
£700
FIGURE 4Average weekly fees£ per week
Source: Knight Frank
ACTUAL
REAL TERMS (2006 PRICES)
LIKE FOR LIKE CHANGE
£400
£450
£500
£550
£600
£650
£700
£750
£800
£850
£900
Sout
h Ea
stG
reat
er L
ondo
nSo
uth
Wes
tEa
stW
est M
idla
nds
Scot
land
Wal
esEa
st M
idla
nds
York
s &
Hum
ber
Nor
th W
est
Nor
ther
n Ire
land
Nor
th E
ast
FIGURE 5Average weekly fees by region (FY 2013/14)£ per week
Source: Knight Frank
CARE WITH NURSING
PERSONAL CARE
AVERAGE WEEKLY FEES
AVERAGE ANNUAL WEEKLY FEE CHANGE (LFL)
Personal Care £566 2.9%
Care with Nursing £688 1.8%
All Care Homes £660 2.1%
RPI Inflation (FY 2013/14) 2.5%

5
CARE HOMES TRADING PERFORMANCE REVIEW RESEARCH
5
AVERAGE WEEKLY FEES AT THE COUNTY LEVEL
LOTHIAN
With Edinburgh as its urban heart, Lothian has
Scotland’s highest average fee rate of £780 per week.
CHESHIRE
Of England’s northern regions, Cheshire has the highest average fee rate of £725 per week.
KEY
£800+
£750 TO £799
£700 TO £749
£650 TO £699
£600 TO £649
£550 TO £599
<£550
INSUFFICIENT DATA
Five highest average fee rates
1. Gloucestershire £890 2. Buckinghamshire £8843. West Sussex £8554. Oxfordshire £8465. Berkshire £843
Five lowest average fee rates
A. South Yorkshire £497 B. County Durham £505C. Greater Manchester £513D. Merseyside £514E. Northumberland £530
DEVON
Devon’s fees are closest to the mean average of £660 per week.
7 of the ten counties with the highest fee rates are in the South East Region and Greater London.

6
COSTSCare home costs continue to increase, impacting on operators’ profitability.
TABLE 1 Staff Costs FY 2013/14
Region Per resident p.a. As a proportion of revenue
South East £22,548 53.4%Greater London £22,159 54.0%South West £21,854 56.4%Scotland £20,554 59.3%West Midlands £20,099 59.1%East £20,097 57.1%Wales £18,379 55.4%Northern Ireland £18,034 61.0%Yorks & Humber £17,828 58.7%North West £17,077 58.0%East Midlands £17,041 56.0%North East £16,158 58.3%All UK £19,531 56.9%
Source: Knight Frank
2006
/ 07
2007
/ 08
2008
/ 09
2009
/ 10
2010
/ 11
2011
/ 12
2012
/ 13
2013
/ 14£14,000
£15,000
£16,000
£17,000
£18,000
£19,000
£20,000
52
53
54
55
56
57
58
59
60
FIGURE 6Staff costsAs £ per resident (LHS) vs % of income (RHS)
Source: Knight Frank
£ PER RESIDENT 2013/14
AS % OF INCOME
LFL CHANGE
£10,000
£12,000
£14,000
£16,000
£18,000
£20,000
£22,000
£24,000
£26,000
All UK
All UK
Sout
h Ea
stG
reat
er L
ondo
nSo
uth
Wes
tW
est M
idla
nds
East
Scot
land
Wal
esYo
rks
& H
umbe
rEa
st M
idla
nds
Nor
ther
n Ire
land
Nor
th W
est
Nor
th E
ast
FIGURE 7Staff cost per resident£ per resident
Source: Knight Frank
CARE WITH NURSING
PERSONAL CARE
The South East has the highest staff costs for nursing care
Staff costs Average staff costs amounted to £19,531 per resident for the FY 2013/14, a LFL increase of 2.9% from last year. Meanwhile, as a percentage of income, staff costs stood at 56.9%, although a LFL comparison reveals that costs increased from 57.2% to 57.6% of total income during FY 2013/14 (Figure 6).
Care home staff costs remain, predictably, much higher in the UK’s southern regions. By a clear margin, the South East has the highest staff costs for nursing care, averaging c. £24,000 per resident in FY 2013/14. However, Greater London has the highest staff costs in the personal care sector, at an average of just over £20,000 per resident (Figure 7).
There is of course a marked difference in staff costs between nursing and personal care, reflecting the higher pay qualified nurses receive compared with care staff at personal care homes. However, this differential varies markedly between UK regions, and is the lowest in Greater London, with staff costs per resident at nursing homes standing only 12% above those for personal care homes.
While staff costs in the relatively affluent regions of Greater London and the South East are highest on
a per resident basis, they equate to the lowest when considered as a proportion of total revenue (Table 2). Staff costs as a percentage of income are correspondingly higher elsewhere in the UK and it is these regions which are more exposed to upward pressures in staff costs, for example through labour shortages or increases to the minimum wage.
To this regard, Northern Ireland provides the most fitting example. While Northern Ireland’s staff costs are some way below the UK average, they translate to the highest costs of any region as a proportion of revenue, standing at 60.9%, and considerably higher than the South East, at 53.4%.
Agency staff costs as a proportion of total staff costs also increased from 4.1% last year to 4.8% for the FY 2013/14, a trend which likely reflects the growing difficulties with staff resourcing and retention. There is a significant degree of regional variation, however, with agency staff costs making up the highest share of overall staff costs in the South East region, at 6.3%, and the lowest share in Wales, at only 1.7%. The evidence suggests that care homes in areas of the UK with lower unemployment are likely to have a greater reliance on agency staff.

7
CARE HOMES TRADING PERFORMANCE REVIEW RESEARCH
Property costsCare home property costs have increased sharply over the past few years, moving significantly ahead of inflation (Figure 8). On a per bed basis, overall property costs increased by a substantial 24% during FY 2013/4 (or LFL 18%) to stand at £2,179 per bed. Property costs now equate to 7.2% of total income, having stood relatively stable at c. 5% during the years prior to 2010 (Figure 8).
While energy and water prices have moved ahead of inflation in recent years, the sharp rise in property costs during FY 2013/14 is more closely associated with insurance costs and, particularly, increased repair and maintenance costs.
With further regard to the property aspects, it is also encouraging that operators, post financial restructuring, are now deploying increased capital expenditure on their portfolios which is enhancing the quality of accommodation to prospective residents.
Property costsThese are the costs which relate to the day-to-day running and servicing of the property. They include utilities, council tax, insurance and repairs & maintenance, but exclude any rental obligations in the case of leased care homes.
i
2006
/ 07
2007
/ 08
2008
/ 09
2009
/ 10
2010
/ 11
2011
/ 12
2012
/ 13
2013
/ 14£1,000
£1,200
£1,400
£1,600
£1,800
£2,000
£2,200
£2,400
£2,600
FIGURE 8Property cost per bed £ per bed
Source: Knight Frank
ACTUAL
REAL TERMS (2006 PRICES)
Food costsAverage food costs per resident in FY 2013/14 were 8.6% above the previous year, although the LFL rise was only 3.5%, which is much more closely in line with food UK food inflation. Evidently, different operators are able to source food at different costs to one another – the operator with the highest food costs was expending 53% more per resident than the operator with the lowest food costs.
Understandably, food costs differ between the regions, but the extent of variation is far less pronounced compared with other outgoings, such as staff costs. As with last year, food costs per resident were highest in the South East during 2013, at 11.0% above the overall UK average, and lowest in Northern Ireland, at 11.0% below the average. However, food costs in the majority of UK regions showed less than 5% variance from the overall UK average (Figure 9).
-15
-10
-5
0
5
10
15
Sout
h Ea
stSo
uth
Wes
tG
reat
er L
ondo
nEa
stW
est M
idla
nds
Wal
esEa
st M
idla
nds
York
s &
Hum
ber
Scot
land
Nor
th W
est
Nor
th E
ast
Nor
ther
n Ire
land
FIGURE 9Food cost index (FY 2013/14)% difference from all UK
Source: Knight Frank
Phoenix Parkway, Scunthorpe (PrimeLife)
Bucklesham Grange, Ipswich (Hallmark Care Homes)
8
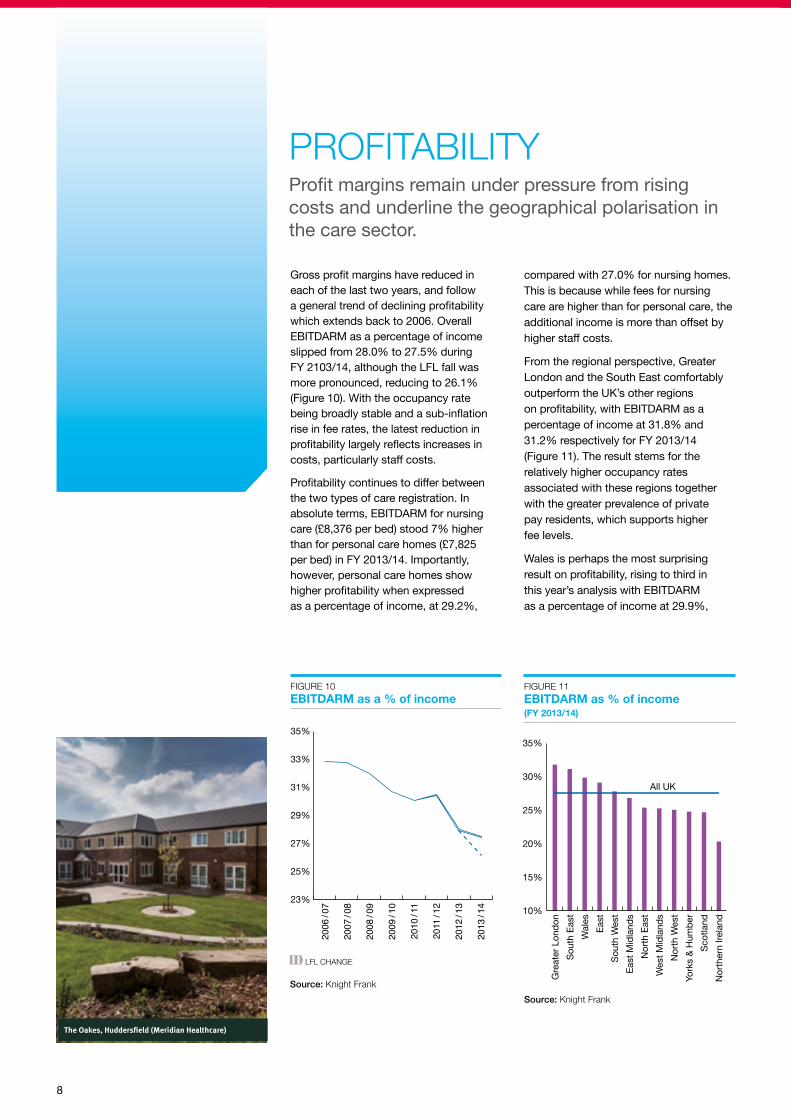
Gross profit margins have reduced in each of the last two years, and follow a general trend of declining profitability which extends back to 2006. Overall EBITDARM as a percentage of income slipped from 28.0% to 27.5% during FY 2103/14, although the LFL fall was more pronounced, reducing to 26.1% (Figure 10). With the occupancy rate being broadly stable and a sub-inflation rise in fee rates, the latest reduction in profitability largely reflects increases in costs, particularly staff costs.
Profitability continues to differ between the two types of care registration. In absolute terms, EBITDARM for nursing care (£8,376 per bed) stood 7% higher than for personal care homes (£7,825 per bed) in FY 2013/14. Importantly, however, personal care homes show higher profitability when expressed as a percentage of income, at 29.2%,
compared with 27.0% for nursing homes. This is because while fees for nursing care are higher than for personal care, the additional income is more than offset by higher staff costs.
From the regional perspective, Greater London and the South East comfortably outperform the UK’s other regions on profitability, with EBITDARM as a percentage of income at 31.8% and 31.2% respectively for FY 2013/14 (Figure 11). The result stems for the relatively higher occupancy rates associated with these regions together with the greater prevalence of private pay residents, which supports higher fee levels.
Wales is perhaps the most surprising result on profitability, rising to third in this year’s analysis with EBITDARM as a percentage of income at 29.9%,
PROFITABILITYProfit margins remain under pressure from rising costs and underline the geographical polarisation in the care sector.
2006
/ 07
2007
/ 08
2008
/ 09
2009
/ 10
2010
/ 11
2011
/ 12
2012
/ 13
2013
/ 1423%
25%
27%
29%
31%
33%
35%
FIGURE 10EBITDARM as a % of income
LFL CHANGE
Source: Knight Frank
10%
15%
20%
25%
30%
35%
Gre
ater
Lon
don
Sout
h Ea
stW
ales
East
Sout
h W
est
East
Mid
land
sN
orth
Eas
tW
est M
idla
nds
Nor
th W
est
York
s &
Hum
ber
Scot
land
Nor
ther
n Ire
land
All UK
FIGURE 11EBITDARM as % of income (FY 2013/14)
Source: Knight Frank
Greater London and the South East comfortably outperform the UK’s other regions on profitability
The Oakes, Huddersfield (Meridian Healthcare)

9
CARE HOMES TRADING PERFORMANCE REVIEW RESEARCH
EBITDARM
Earnings before
Interest, Tax, Depreciation,
Amortisation, Rent and Management.
This is a particular measure of profitability which allows for direct like-for-like comparison between individual care homes, before costs of rent and management charges are accounted for.
i
Maycroft Manor, Brighton (Hallmark Care Homes)
£2,000
£4,000
£6,000
£8,000
£10,000
£12,000
£14,000
All UK
All UK
Gre
ater
Lon
don
Sout
h Ea
stW
ales
Sout
h W
est
East
Wes
t Mid
land
sSc
otla
ndEa
st M
idla
nds
York
s &
Hum
ber
Nor
th W
est
Nor
th E
ast
Nor
ther
n Ire
land
FIGURE 12EBITDARM per bed (FY 2013/14)£ per bed
Source: Knight Frank
CARE WITH NURSING
PERSONAL CARE
having been the lowest last year. This is a clear consequence of the change to composition of the index, with Wales’ high occupancy rate being the main determinant of its strong performance.
Profitability also varies significantly between the UK regions according to the type of care registration (Figure 12). On a per bed basis, nursing homes in Greater London and the South East are more profitable than personal care homes, contributing to the overall UK trend. However, the opposite is true in less affluent regions such as the North East and Northern Ireland, largely because these areas are more exposed to nursing staff costs amid tight budgetary controls on local authority care funding.
10
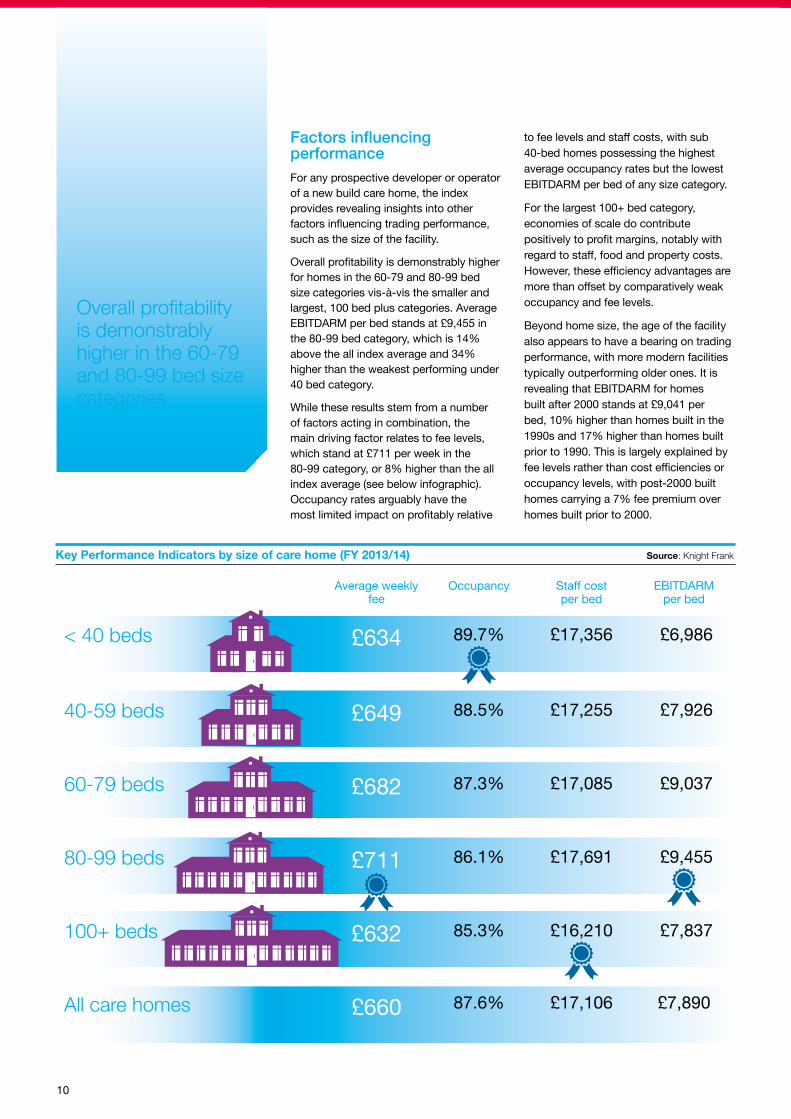
Factors influencing performanceFor any prospective developer or operator of a new build care home, the index provides revealing insights into other factors influencing trading performance, such as the size of the facility.
Overall profitability is demonstrably higher for homes in the 60-79 and 80-99 bed size categories vis-à-vis the smaller and largest, 100 bed plus categories. Average EBITDARM per bed stands at £9,455 in the 80-99 bed category, which is 14% above the all index average and 34% higher than the weakest performing under 40 bed category.
While these results stem from a number of factors acting in combination, the main driving factor relates to fee levels, which stand at £711 per week in the 80-99 category, or 8% higher than the all index average (see below infographic).Occupancy rates arguably have the most limited impact on profitably relative
to fee levels and staff costs, with sub 40-bed homes possessing the highest average occupancy rates but the lowest EBITDARM per bed of any size category.
For the largest 100+ bed category, economies of scale do contribute positively to profit margins, notably with regard to staff, food and property costs. However, these efficiency advantages are more than offset by comparatively weak occupancy and fee levels.
Beyond home size, the age of the facility also appears to have a bearing on trading performance, with more modern facilities typically outperforming older ones. It is revealing that EBITDARM for homes built after 2000 stands at £9,041 per bed, 10% higher than homes built in the 1990s and 17% higher than homes built prior to 1990. This is largely explained by fee levels rather than cost efficiencies or occupancy levels, with post-2000 built homes carrying a 7% fee premium over homes built prior to 2000.
Overall profitability is demonstrably higher in the 60‑79 and 80‑99 bed size categories
Key Performance Indicators by size of care home (FY 2013/14) Source: Knight Frank
Average weekly fee
Occupancy Staff cost per bed
EBITDARM per bed
< 40 beds £634 89.7% £17,356 £6,986
40‑59 beds £649 88.5% £17,255 £7,926
60‑79 beds £682 87.3% £17,085 £9,037
80‑99 beds £711 86.1% £17,691 £9,455
100+ beds £632 85.3% £16,210 £7,837
All care homes £660 87.6% £17,106 £7,890

11
CARE HOMES TRADING PERFORMANCE REVIEW RESEARCH
TRADING PERFORMANCE OUTLOOK
The results from our 2014 update were closely in line with expectations, with increasing costs and sub-inflation fee rises prompting another edging down of profit margins in the elderly care sector. While the near-term outlook remains one of margins coming under further pressure, operators are in the main continuing to trade with robust EBITDA.
The economy is now expanding at an encouraging rate, but austerity in the public sector will continue to impact on local authority budgets, restricting fee rises for some years to come. However, many sub-standard care facilities are now closing, and the best operators should start to benefit from increasing occupancy levels.
Arguably the most pressing challenge that operators face is rising staff costs. There is a growing shortage of qualified UK nurses, and operators are increasingly having to turn to agency staff or recruit foreign labour to plug the gap. Indeed, an emerging trend is that many providers are now repositioning their existing care facilities toward personal rather than nursing care, as is the case for new build care homes.
The 2.1% like-for-like increase in fees was ahead of Laing & Buisson’s 1.7% baseline survey rise last year, with the difference likely to be explained by the ‘cross-subsidisation’ of the private pay market, which continues to expand gradually. Evidence of this is also provided by the relative outperformance of the personal care sector, which saw an above-inflation fee rise of 2.9%.
Geographical polarisation remains an enduring theme in the market, and a major long term challenge is replacing poor quality stock to meet care demand in less affluent areas outside the South East. Encouragingly, however, investors and operators alike are now recognising that a robust return on capital can be achieved elsewhere in the UK, where land is cheaper while still offering sound demographic fundamentals.
Fundamentally, there is a structural undersupply of care beds, one of the reasons for the huge amount of inward investment into the UK from overseas capital. The demographic change is compelling for long term growth in the sector, but this is at odds with the uncertainty surrounding the long term funding of care.
There remain areas of uncertainty surrounding UK Healthcare, including the outcome of the 2015 general election which could well include topics such as the ‘living wage’ and constitutional reforms post the Scotland referendum. Dilnot’s reforms are expected to be implemented in 2016 and it is projected that an extra 35,000 care home residents will qualify for funding assistance under the new
proposals. While welcome, there remains uncertainty as to how this will be funded, and whether the newly enfranchised residents will do part funded top-ups or be entirely funded by their local authority.
Encouragingly, the last 18 months have seen the refinancing of some of the major care providers, and the entry of new investors to UK Healthcare sector from all corners of the globe. Notwithstanding the political uncertainty, this demonstrates just how UK Healthcare is widely seen as a defensive, growing and sustainable asset class.
JULIAN EVANSHead of Healthcare
0%
1%
2%
3%
4%
5%
6%
East
Ea
st M
idla
nds
Inne
r Lon
don
Nor
th E
ast
Nor
th W
est
Nor
ther
n Ire
land
Out
er L
ondo
nSc
otla
ndSo
uth
East
Sout
h W
est
Wal
esW
est M
idla
nds
York
s &
Hum
ber
All UK
FIGURE 13Regional baseline fee increases (2014/15)% change
Source: Laing & Buisson

Knight Frank Research provides strategic advice, consultancy services and forecasting to a wide range of clients worldwide including developers, investors, funding organisations, corporate institutions and the public sector. All our clients recognise the need for expert independent advice customised to their specific needs.
© Knight Frank LLP 2014This report is published for general information only. Although high standards have been used in the preparation of the information, analysis, views and projections presented in this report, no legal responsibility can be accepted by Knight Frank Research or Knight Frank LLP for any loss or damage resultant from the contents of this document. As a general report, this material does not necessarily represent the view of Knight Frank LLP in relation to particular properties or projects. Reproduction of this report in whole or in part is allowed with proper reference to Knight Frank Research.Knight Frank LLP is a limited liability partnership registered in England with registered number OC305934. Our registered office is 55 Baker Street, London, W1U 8AN, where you may look at a list of members’ names.
NewmarkKnight FrankGlobal Knight Frank Reports are also available at www.knightfrank.com
UK Healthcare Property – Summer 2014
European Healthcare – Care Homes 2014
Healthcare – Investment 2014
UK Healthcare – Development Opportunities 2013
RECENT HEALTHCARE RESEARCH PUBLICATIONS
Market Overview
Notwithstanding NHP and BMI Healthcare, most major healthcare operators have now refinanced but there is still significant Southern Cross legacy real estate that needs restructuring. Finance is no longer the domain of traditional lenders and investors. In 2013 Knight Frank advised on £1.5 billion of sale & leaseback, the lion’s share being sold to international capital, although we expect that trend of dominance to soften as healthcare platforms become scarce. In order to diversify their portfolios UK institutions are acquiring fixed income healthcare property and are debt lending (e.g. Legal & General to LNT Group). High street clearing banks are de-risking from sectors such as retail and increasing market share into defensive sectors, including healthcare. Another trend we expect to continue is successful IPOs, such as Cambian Group.
Knight Frank’s Healthcare team is currently live on c. £4 billion of valuations and our agents are advising on £500 million of sales, either going concerns or sale & leaseback. Although there has been media sensationalism surrounding whistleblowing within care facilities, the reality is that demand outstrips supply for both self and local authority funded beds; investors are now educated enough to ignore the media circus and healthcare is widely considered to be a core sector to invest in. Interestingly we are finally starting to see new types of care models and the not-for-profit providers are taking first-mover advantage.
Prime: Hardening Secondary: Stable
UK Healthcare propertySummer 2014
Germany: Potential for consolidation and significant growth
Spain: Economic revitalisation has brought greater investor interest
Italy: Considerable market fragmentation leaves room for new entrants
France: Top operators begin exploring options further afield
RESEARCH
EUROPEAN HEALTHCARECARE HOMES REPORT 2014
HEALTHCARE INVESTMENT 2014
HIGHLIGHTSUK Healthcare is now widely considered a core property asset class, as the market continues to mature and attract a broad variety of investors, both domestic and overseas
Appetite for care homes in largely local authority funded areas is improving, with investors and funds increasingly considering UK regional cities
The sector is benefitting from improving availability of debt, with UK clearing banks increasing their lending exposure to Healthcare fixed income and established businesses
RESEARCH
Research
Highlights• Carehomedevelopmentactivityisexpectedtoincreaseoverthemediumterm,
stimulatedbytherecentinfluxofoverseascapitaltotheUKcaresectorandan
improvementtothelendingenvironment.
• However,untilpoliticaluncertaintyoverpubliclyfundedcareisproperly
addressed,developmentwillremainweightedtowardsthoseareasthatare
characterisedbyahighexposuretotheself-paymarket.
• Thisisechoedbyourcarehomedevelopmenthotspotsanalysis,which
revealsthat11ofthetop12countiesinEnglandandWalesarelocatedinthe
UK’ssouthernregions.ThisyearseesBedfordshirereplaceBerkshireasthe
top-rankedcounty.
• TheScotlandhotspotsassessmentrevealstheBordersas2013’stop-ranked
areaforcarehomedevelopment,apositionunchangedfromlastyear.
2013
UK HEALTHCAREDevelopmentopportunities
RESEARCH
Oliver du SautoyAssociate, Commercial Research +44 (0)20 7861 1592 [email protected]
HEALTHCARE
Julian EvansPartner, Head of Healthcare +44 (0)20 7861 1147 [email protected]
Front cover image: The Shelbourne Care Home in Sway, Hampshire (Gracewell Healthcare)