Embed Size (px)
Citation preview
CARDIOVASCULAR RISK FACTORS AMONG STAFF IN PETALING HEALTH
OFFICE WORKPLACE, 2011
T Harishah1
,AS Ismail 1, Noriklil Bukhary IB
2,
Nazarudin Safian3,
1NCD Unit, Petaling District Health Office Selangor 1Ministry of
Health, Malaysia3Department of Community Health, UKM Medical Centre

Overview
1)Introduction
2)Methodology
3)Results
4)Discussion
5)Study Limitation
6)Conclusion
OVERVIEW
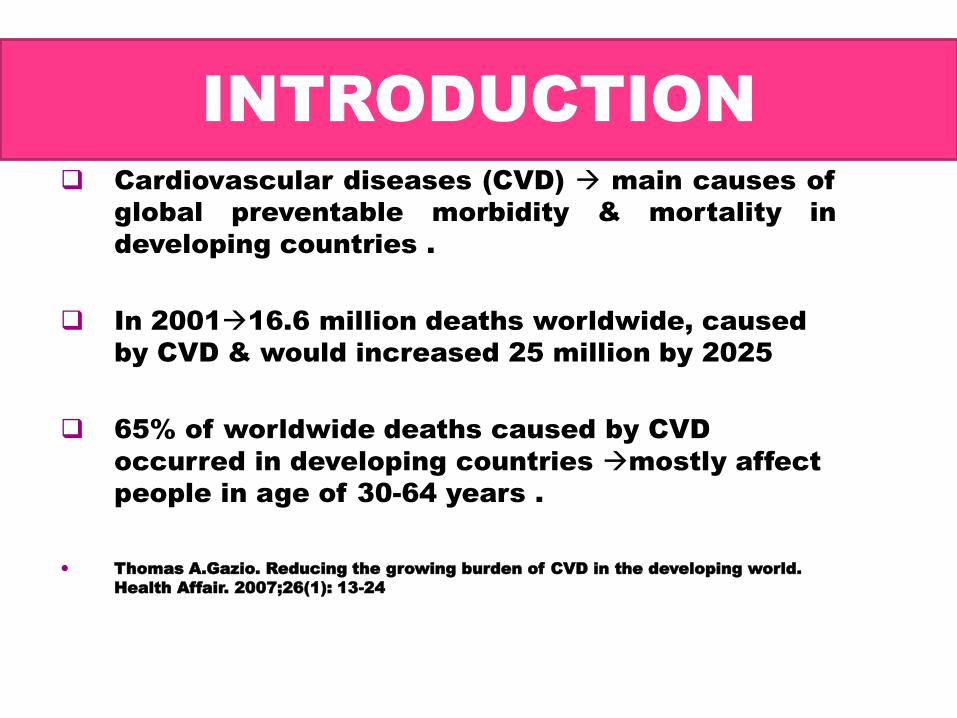
Cardiovascular diseases (CVD) main causes of
global preventable morbidity & mortality in
developing countries .
In 200116.6 million deaths worldwide, caused
by CVD & would increased 25 million by 2025
65% of worldwide deaths caused by CVD
occurred in developing countries mostly affect
people in age of 30-64 years .
Thomas A.Gazio. Reducing the growing burden of CVD in the developing world.
Health Affair. 2007;26(1): 13-24
INTRODUCTION
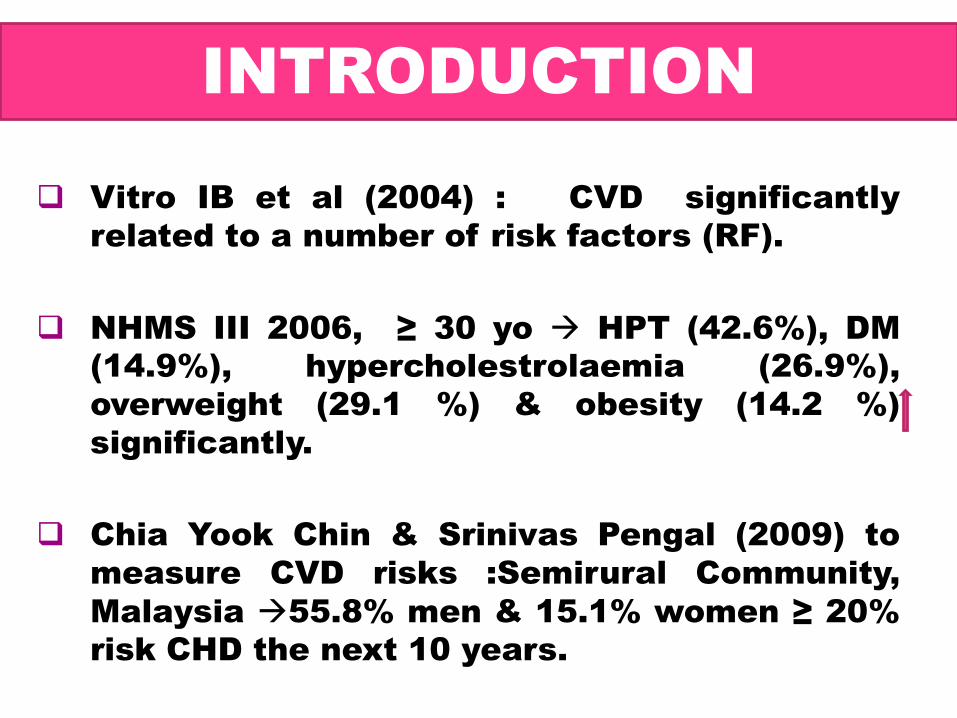
Vitro IB et al (2004) : CVD significantly
related to a number of risk factors (RF).
NHMS III 2006, ≥ 30 yo HPT (42.6%), DM
(14.9%), hypercholestrolaemia (26.9%),
overweight (29.1 %) & obesity (14.2 %)
significantly.
Chia Yook Chin & Srinivas Pengal (2009) to
measure CVD risks :Semirural Community,
Malaysia 55.8% men & 15.1% women ≥ 20%
risk CHD the next 10 years.
INTRODUCTION

Intermediate
Risk Factors
RISK FACTORS & DISEASES
Non-modifiable risk factors:
•Age
•Sex
•Ethnicity
•Genes
Modifiable risk factors:
•Diet - unhealthy
•Physical inactivity
•Tobacco use
•Alcohol
•Stress
Socioeconomic, cultural &
environmental determinants:
•Globalization
•Urbanization
Obesity/Overweight
Raised blood pressure
Raised blood glucose
Abnormal blood lipidsDiabetes
Cancers
Lung Disease
ED (Erectile
Dysfunction)
stroke
Heart Disease
END POINT

RATIONALE AND OBJECTIVE
One of the 7 strategies in National
Strategic Plan for NCD1M (2010-2014)
awareness of Malaysians on total CVD
risks.
A few published studies in Malaysia on CVD
risk among health care workers
The objectives:
to determine the prevalence of
CVD risk factors among
respondents.
to measure CVD risk using the
Framingham Coronary Disease
Risk Prediction score (FRS)
among respondents
STUDY BACKGROUND
Conducted among staff in PKD Petaling
with sample population 626 staff from 17
Dec-15 Jan 2011
STUDY DESIGN: Cross sectional study
SAMPLING METHOD:Universal sampling.
METHODOLOGY
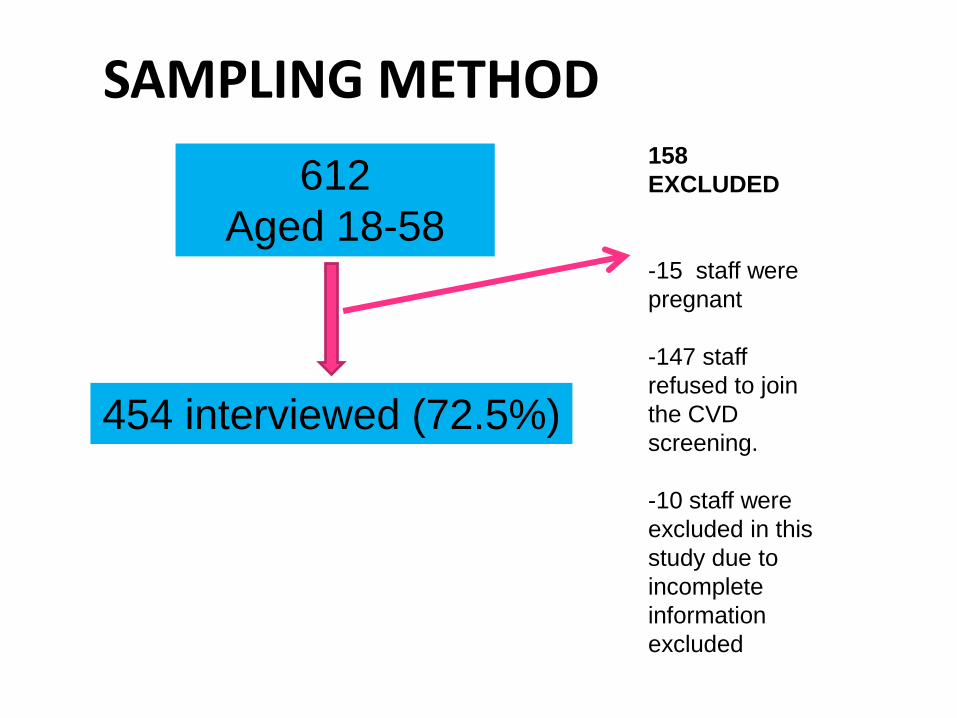
SAMPLING METHOD
612
Aged 18-58
454 interviewed (72.5%)
158
EXCLUDED
-15 staff were
pregnant
-147 staff
refused to join
the CVD
screening.
-10 staff were
excluded in this
study due to
incomplete
information
excluded
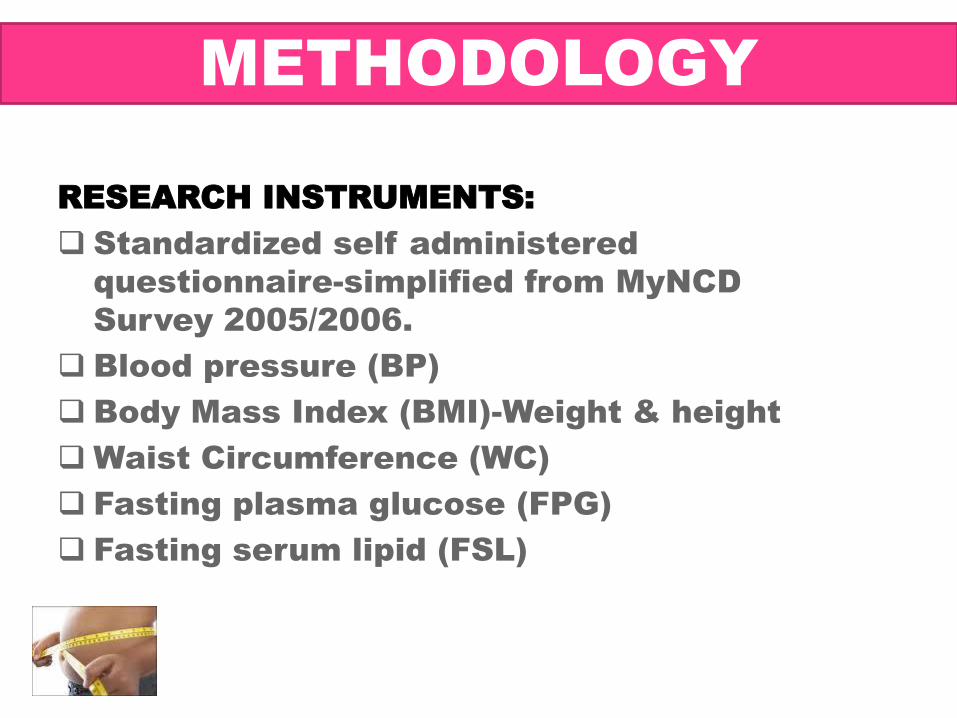
RESEARCH INSTRUMENTS:
Standardized self administered
questionnaire-simplified from MyNCD
Survey 2005/2006.
Blood pressure (BP)
Body Mass Index (BMI)-Weight & height
Waist Circumference (WC)
Fasting plasma glucose (FPG)
Fasting serum lipid (FSL)
METHODOLOGY
DEFINITION:
All the variables follow the MyNCD 2005/2006
STATISTICAL ANALYSIS:
SPSS version 15
Univariate analysis: Frequency Distribution
METHODOLOGY

RESULTS &
DISCUSSIONS
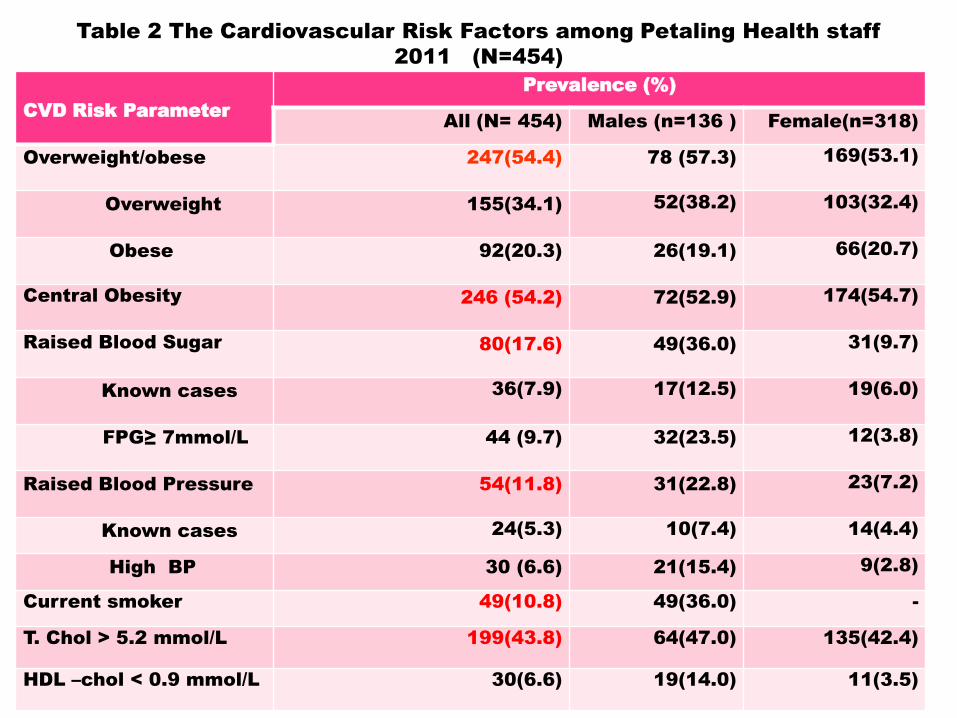
Table 2 The Cardiovascular Risk Factors among Petaling Health staff
2011 (N=454)
CVD Risk Parameter
Prevalence (%)
All (N= 454) Males (n=136 ) Female(n=318)
Overweight/obese 247(54.4) 78 (57.3) 169(53.1)
Overweight 155(34.1) 52(38.2) 103(32.4)
Obese 92(20.3) 26(19.1) 66(20.7)
Central Obesity 246 (54.2) 72(52.9) 174(54.7)
Raised Blood Sugar 80(17.6) 49(36.0) 31(9.7)
Known cases 36(7.9) 17(12.5) 19(6.0)
FPG≥ 7mmol/L 44 (9.7) 32(23.5) 12(3.8)
Raised Blood Pressure 54(11.8) 31(22.8) 23(7.2)
Known cases 24(5.3) 10(7.4) 14(4.4)
High BP 30 (6.6) 21(15.4) 9(2.8)
Current smoker 49(10.8) 49(36.0) -
T. Chol > 5.2 mmol/L 199(43.8) 64(47.0) 135(42.4)
HDL –chol < 0.9 mmol/L 30(6.6) 19(14.0) 11(3.5)
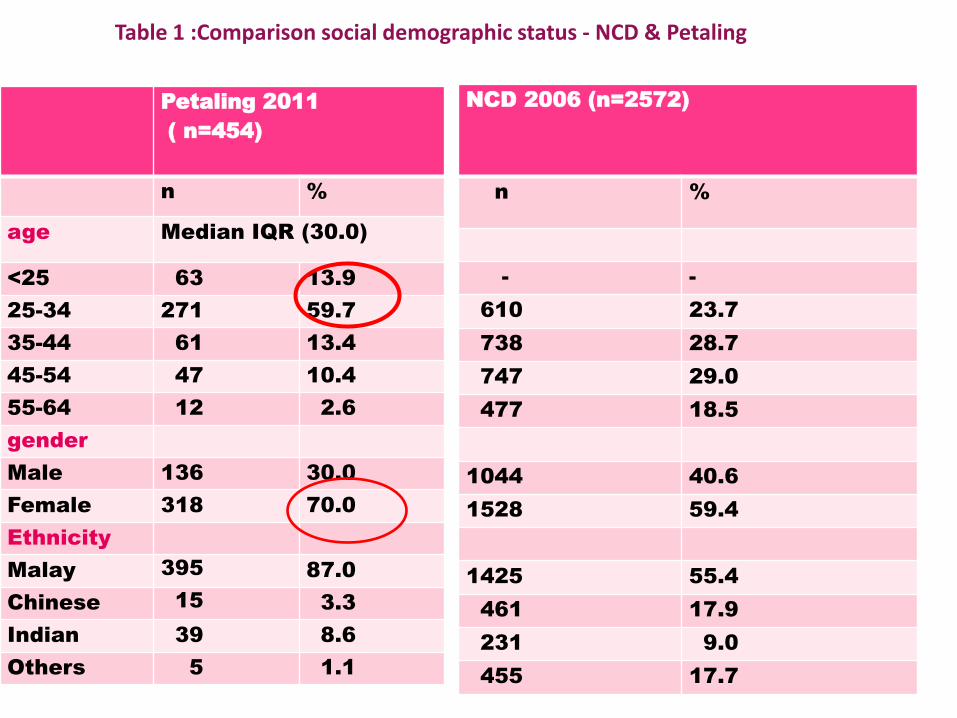
Table 1 :Comparison social demographic status - NCD & Petaling
Petaling 2011
( n=454)
n %
age Median IQR (30.0)
<25 63 13.9
25-34 271 59.7
35-44 61 13.4
45-54 47 10.4
55-64 12 2.6
gender
Male 136 30.0
Female 318 70.0
Ethnicity
Malay 395 87.0
Chinese 15 3.3
Indian 39 8.6
Others 5 1.1
NCD 2006 (n=2572)
n %
- -
610 23.7
738 28.7
747 29.0
477 18.5
1044 40.6
1528 59.4
1425 55.4
461 17.9
231 9.0
455 17.7
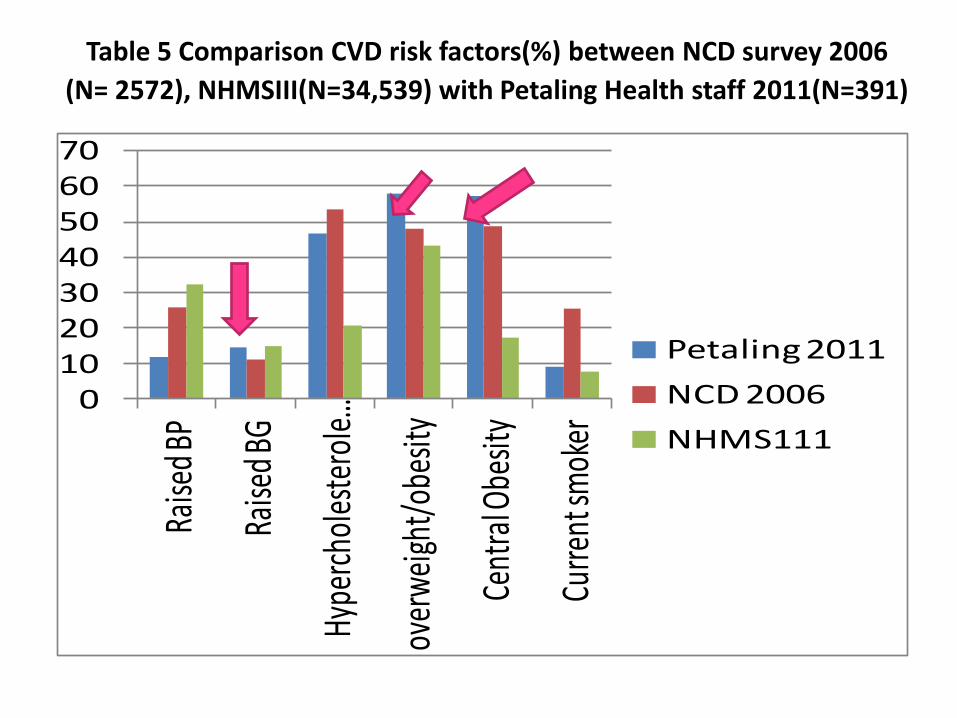
Table 5 Comparison CVD risk factors(%) between NCD survey 2006
(N= 2572), NHMSIII(N=34,539) with Petaling Health staff 2011(N=391)
010203040506070
Raise
d BP
Raise
d BG
Hype
rcho
lest
erol
e…
over
wei
ght/
obes
ity
Cent
ral O
besit
y
Curre
nt sm
oker
Petaling 2011
NCD 2006
NHMS111
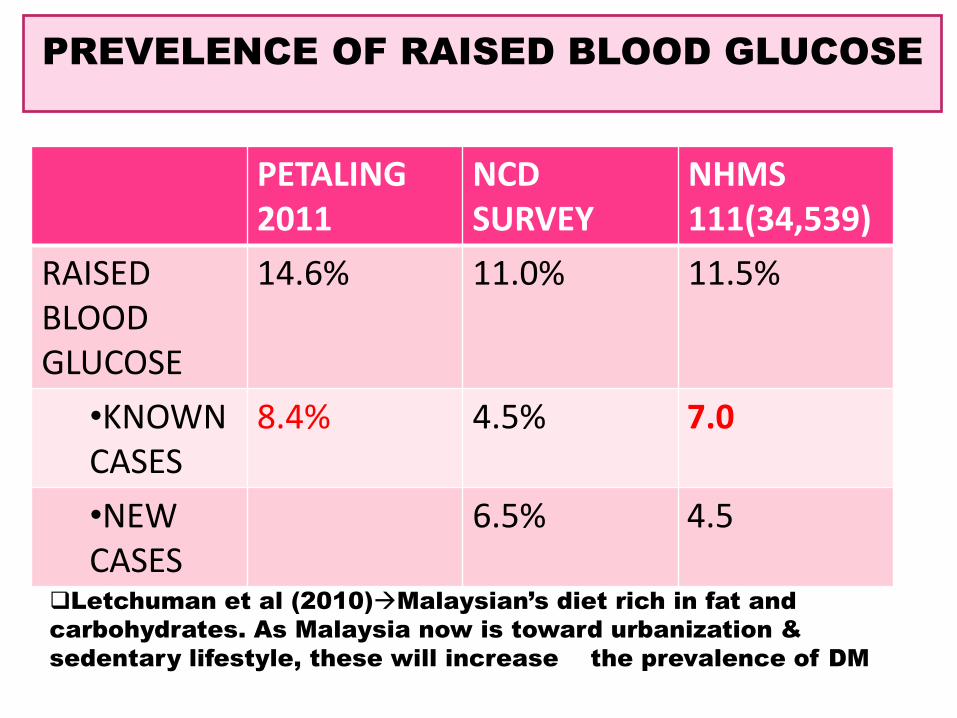
PREVELENCE OF RAISED BLOOD GLUCOSE
PETALING 2011
NCD SURVEY
NHMS 111(34,539)
RAISED BLOOD GLUCOSE
14.6% 11.0% 11.5%
•KNOWN CASES
8.4% 4.5% 7.0
•NEW CASES
6.5% 4.5
Letchuman et al (2010)Malaysian’s diet rich in fat and
carbohydrates. As Malaysia now is toward urbanization &
sedentary lifestyle, these will increase the prevalence of DM
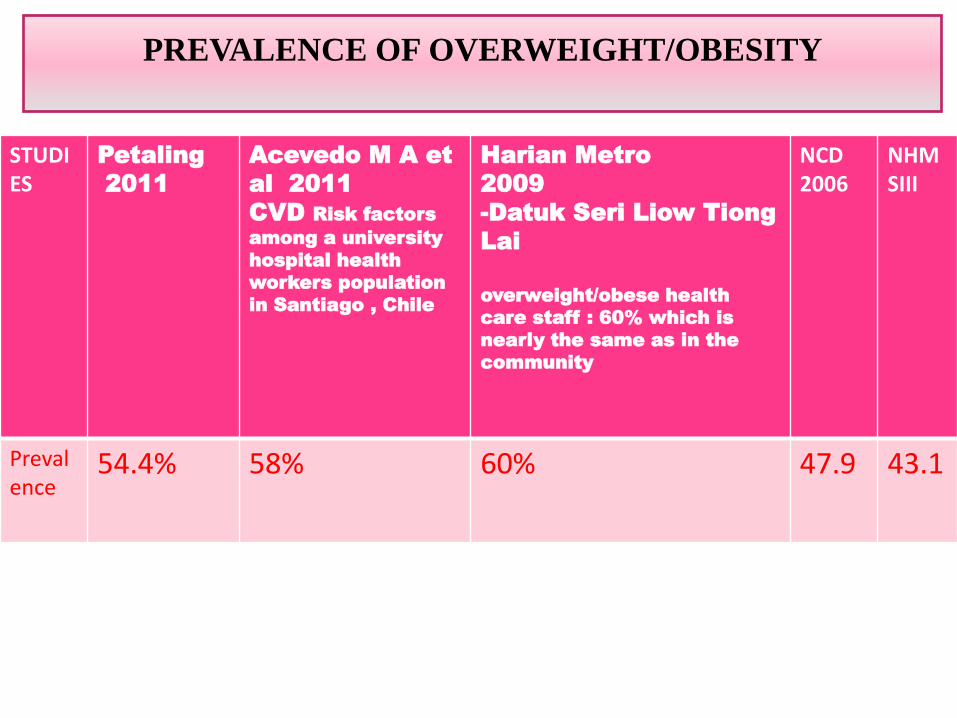
PREVALENCE OF OVERWEIGHT/OBESITY
STUDIES
Petaling
2011
Acevedo M A et
al 2011
CVD Risk factors
among a university
hospital health
workers population
in Santiago , Chile
Harian Metro
2009
-Datuk Seri Liow Tiong
Lai
overweight/obese health
care staff : 60% which is
nearly the same as in the
community
NCD2006
NHMSIII
Prevalence
54.4% 58% 60% 47.9 43.1
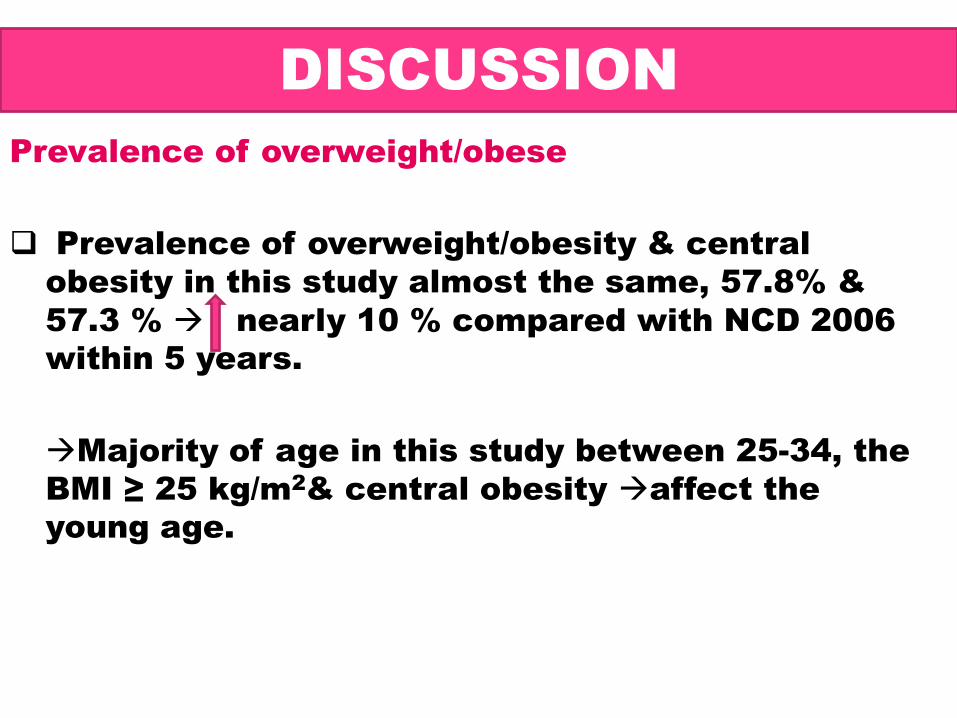
DISCUSSION
Prevalence of overweight/obese
Prevalence of overweight/obesity & central
obesity in this study almost the same, 57.8% &
57.3 % nearly 10 % compared with NCD 2006
within 5 years.
Majority of age in this study between 25-34, the
BMI ≥ 25 kg/m2& central obesity affect the
young age.
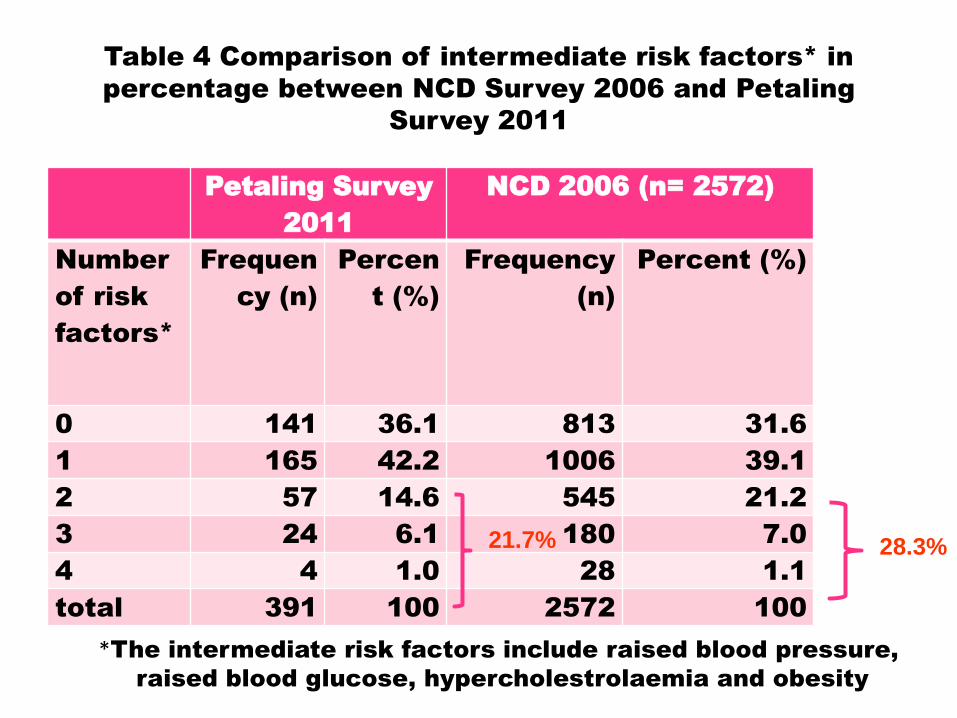
Table 4 Comparison of intermediate risk factors* in
percentage between NCD Survey 2006 and Petaling
Survey 2011
Petaling Survey
2011
NCD 2006 (n= 2572)
Number
of risk
factors*
Frequen
cy (n)
Percen
t (%)
Frequency
(n)
Percent (%)
0 141 36.1 813 31.6
1 165 42.2 1006 39.1
2 57 14.6 545 21.2
3 24 6.1 180 7.0
4 4 1.0 28 1.1
total 391 100 2572 100
*The intermediate risk factors include raised blood pressure,
raised blood glucose, hypercholestrolaemia and obesity
21.7% 28.3%

Table 3 Distribution of CVD risk for age ≥30 years
old using Framingham Risk score among Petaling
Health Staff (N=242)
CVD Risk Male Female All
n (%) n (%) n (%)
Low 48(21.5). 175(78.5) 223 (96.2%)
Intermediate 7(63.6) 4(36.4) 11(4.5%)
High 7(87.5) 1(12.5) 8(3.3%)
Total 62(25.6) 180(74.4) 242(100)
Wan Rosealaiza WAG et al.
Kajian Prevalen Dan Faktor Risiko Kardiovaskular Di Kalangan
Kakitangan Kesihatan Di Daerah Bera, Pahang 2009 (281 responden
(83.9%), median age 30.0
2.1% High risk,
5.7 % intermediate risk 10-20%
92.2% low risk.
High risk ≥ 20%, intermediate risk 10-20% and low risk < 10%

Overview
Petaling
2011
-low CHD risk (92.2%),Intermediate (4.5%) ,High
(3.3%).
-Among the high CHD risk (≥ 20%), 87.5% were
men
Chia
Yook
Chin
(2009)
55.8% of the men had ≥20 % risk
women’s risk was lower, with 15.1 % having a risk
of ≥ 20%.
(Mean age: 65.4 years (±8))
DISCUSSION
Using the Framingham 10 year CHD risk
prediction score
DISCUSSION
Hypercholestrolaemia
higher in NCD (53.5 %) compared to Petaling
survey (46.5 %)
Gostynski M et al (2004):
Analysis of relationship between cholestrol and
age Hypercholestrolaemia increased with age

DISCUSSION
Smoking
Petaling survey. Among 391 respondents with
age ≥ 25, 9.2% were smoker. This figure was
lower than NCD survey with was 25.5%.
This might be due to the male ratio were 1:3 in
Petaling survey, meanwhile in NCD survey the
male ratio were 2:3. Under reported or their work
place discourage them to smoke.
Rampal et al (2006) smoking was associated
with race, age, sex, educational level and peer &
family influence.
LIMITATIONS
Temporal relationship could not be assessed in cross
sectional study.
High BP at the first time should be repeated with other
period of time & high glucose should be confirmed
with 2 hours post-prandial glucose.
Respondents work in health department difference
type of working categories (medical and non-medical)
& difference level of education that should be
addressed.
Those refused to participate should also be analysed
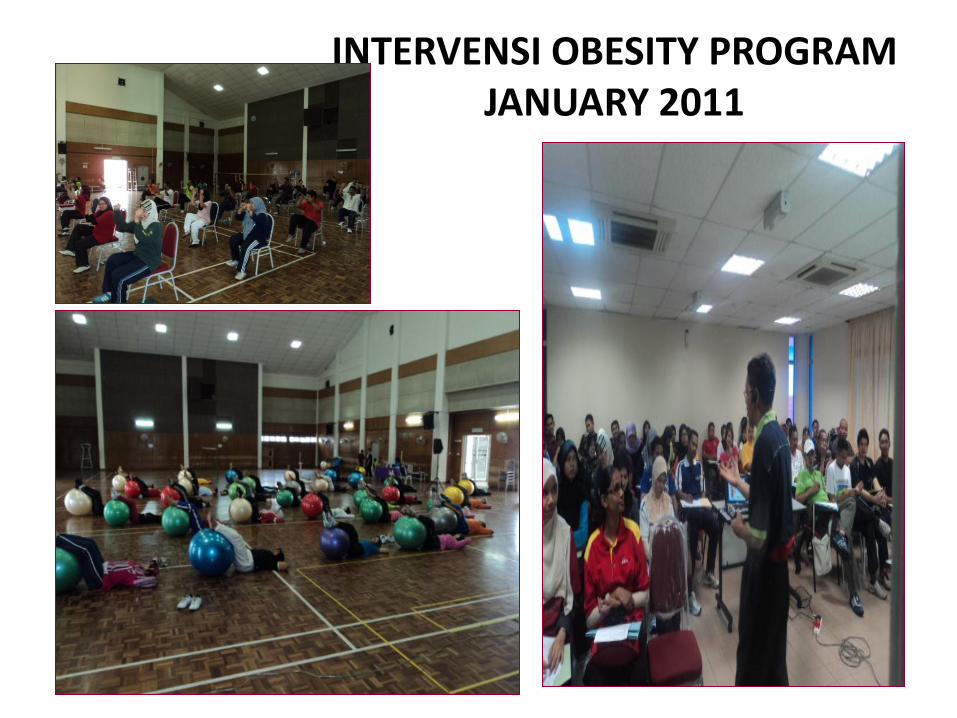
INTERVENSI OBESITY PROGRAMJANUARY 2011
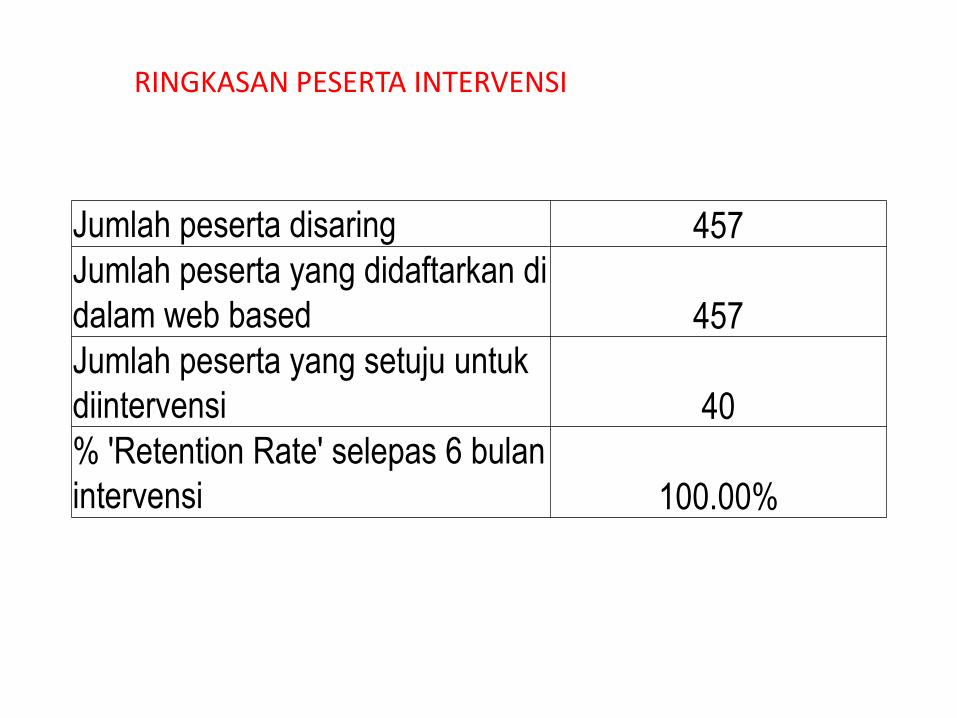
Jumlah peserta disaring 457
Jumlah peserta yang didaftarkan di
dalam web based 457
Jumlah peserta yang setuju untuk
diintervensi 40
% 'Retention Rate' selepas 6 bulan
intervensi 100.00%
RINGKASAN PESERTA INTERVENSI
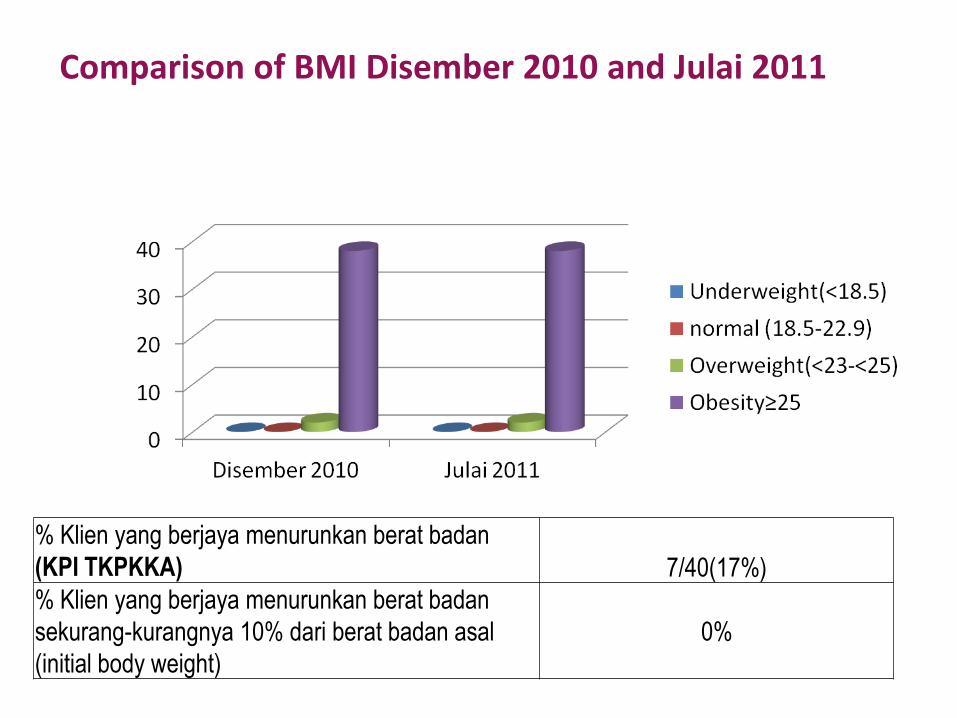
Comparison of BMI Disember 2010 and Julai 2011
% Klien yang berjaya menurunkan berat badan
(KPI TKPKKA) 7/40(17%)
% Klien yang berjaya menurunkan berat badan
sekurang-kurangnya 10% dari berat badan asal
(initial body weight)
0%
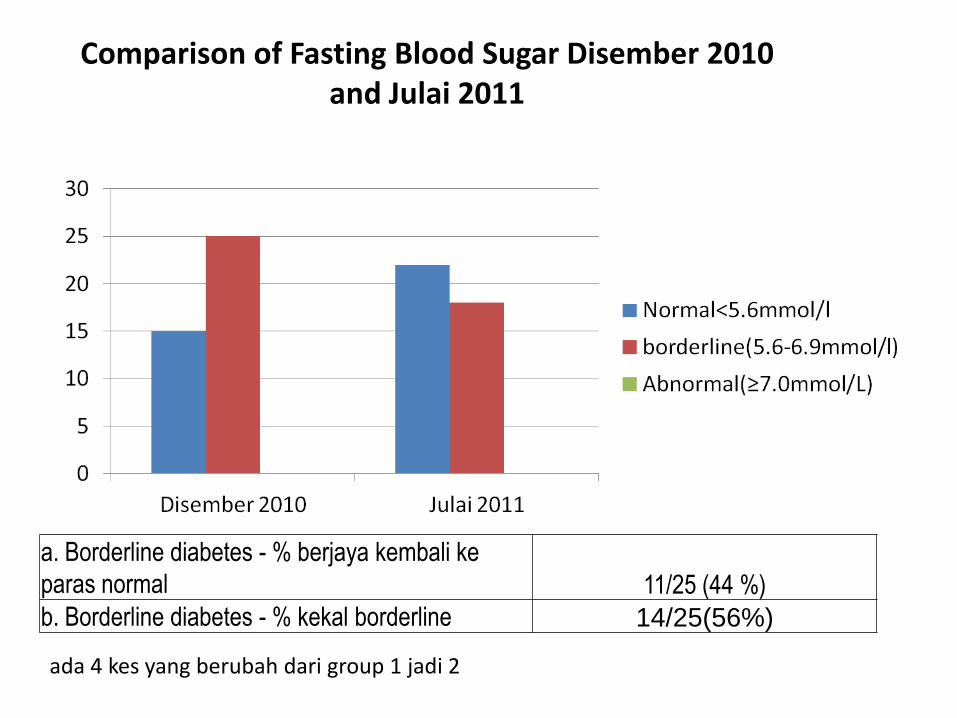
Comparison of Fasting Blood Sugar Disember 2010 and Julai 2011
a. Borderline diabetes - % berjaya kembali ke
paras normal 11/25 (44 %)
b. Borderline diabetes - % kekal borderline 14/25(56%)
ada 4 kes yang berubah dari group 1 jadi 2
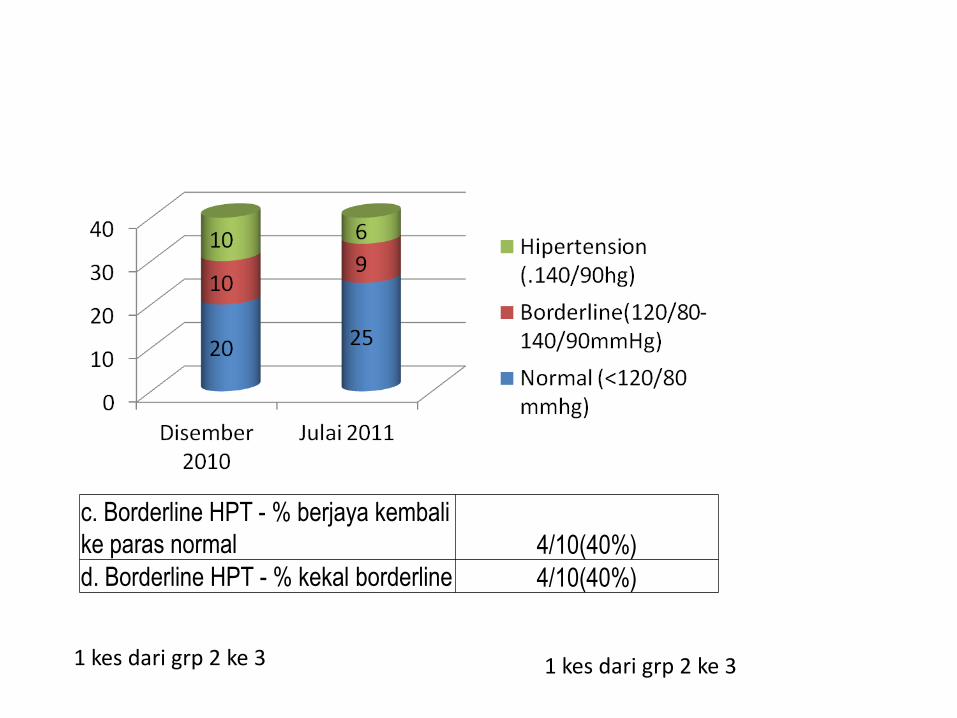
c. Borderline HPT - % berjaya kembali
ke paras normal 4/10(40%)
d. Borderline HPT - % kekal borderline 4/10(40%)
1 kes dari grp 2 ke 3 1 kes dari grp 2 ke 3
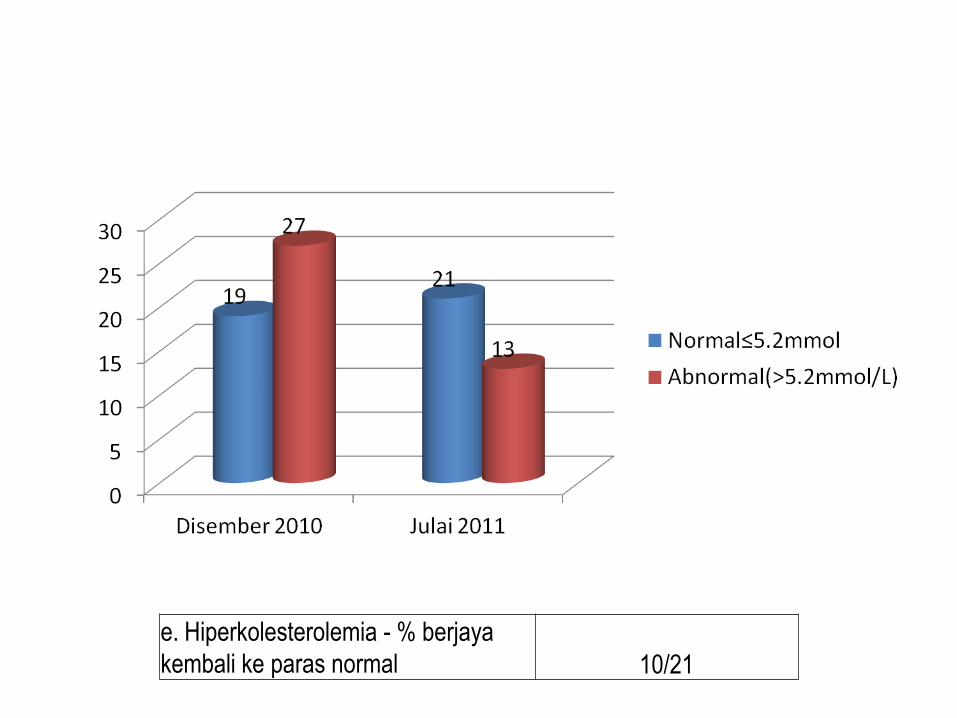
e. Hiperkolesterolemia - % berjaya
kembali ke paras normal 10/21
CONCLUSION
The prevalence of raised blood glucose,
overweight, obesity and central obesity were
higher compared to NCDS 2006 & the trend
currently shifting to youngsters.
All health care workers need to be screen for
CVD risks urgently.
Well structured and monitored NCD risk
factors intervention program is needed in
order to control and prevent NCD morbidity
and mortality among health staff.

THANK YOU
REFERENCES
• IC-Health. Public Health at Glance-Cardiovascular health at glance. 2003. [cited 2011 March12] Available from: http://www.ichealth.org.
• Thomas A, Gazio. Reducing the growing burden of cardiovascular disease in the developingworld. Health Affair. 2007; 26(1):13-24
• Khoo KL, Tan H, Liew YM. Serum lipids and their relationship with other coronary risk factorsin health subjects in a city clinic. Medical Journal of Malaysia. 1997; 52: 38-52.
• Mohd Yunus, Sherina MS, Nor Afiah MZ, Rampal L, Tiew KH. Prevalence of cardiovascular riskfactors in a rural community in Mukim Dengkil, Selangor. Malaysia Journal Nutrition.2004; 10(1): 5-11.
• Robaayah Zambahari. Trends in cardiovascular diseases and risk factors in Malaysia, NationalHeart Institute. Kuala Lumpur .2004
• Vitro IB. Control and prevention of cardiovascular disease around the world. Res Esp Cardiol.2004; 57(6):487-94.
• D’Agostino RB, Vasan RS, Pencina MJ, Wolf PA, Cobain M, Massaro JM. et al. Generalcardiovascular risk profile for use in primary care:The Framingham Heart Study. Journal ofAmerican Heart Association. 2008; 117:743-753.
• Lindholm LH, Ekbom T, Dash C, Eriksson M, Tibblin G, Schersten B. The impact of health careadvice given in primary care on cardiovascular risk. British Medical Journal. 1995; 310:1105-9.
• Wilson PW, D’Agostino RB, Levy Daniel, Belanger AM, Halit Silbershatz, Kannel WB. Predictionof coronary heart disease using risk factor categories. Circulation.1998; 97:1837-47.
• Abdesslam Boutayeb, Saber Boutayeb. The burden of non communicable diseases indeveloping countries. International Journal for Equity in Health.2005; 4(2):1-8.

REFERENCES
• Chia Yook Chin, Srinivas Pengal. Cardiovascular Diseases Risk in a Semirural Community in Malaysia. Asia Pacific Journal of public Health. 2009 ; 21 (4):410-19.
• Ministry of Health. Malaysia Non-Communicable Disease Survey (MyNCDS-1) 2005-2006: NCD Risk Factors in Malaysia. Noncommunicable Disease Section, Disease Control Division. 2006.
• Zalilah, Khor GL, Mirnalimi K, Norimah AK, Ang M. Dietary intake, physical activity and energy expenditure of Malaysian adolescents. Singapore Medical Journal. 2006; 47(6):491.
• Institute for Public Health. The Third National Health and Morbidity Survey 2006 (NHMS III): Executive summary: Institute for Public Health, National Institutes of Health, Ministry of Health. 2008.
• World Health Organization. Obesity: Preventing and managing the global epidemic. Report on a WHO Consultation. Geneva; 2000.
• WHO. Obesity and Overweight.World Health Report. 2011.[cited 2011 March15]. Available from:http://www.who.int/media.centre/factsheets/fs311/en/
• WHO Expert Consultation. Appropriate body-mass index for Asian populations and its implications for policy and intervention strategies. Lancet 2004; 363:157-63.
• Bell AC, Swinburn BA, Amosa H, Scragg RK. A nutrition and exercise intervention program for controlling weight in Samoan communities in New Zealand. International journal of Obesity;2001.25:920-27.
• Ministry of Health, Academy of Medicine of Malaysia & Malaysian Society of Hypertension Clinical Practice Guidelines Management of Hypertension .3rd edition. 2008.
Surprisingly, BP that high during screening were
almost the same amount of % for the known
case in both group studies.
Due to white coat hypertension phenomena &
it needs to be clarify with further follow-up.

Table I: Status of Diabetes Mellitus and Impaired Glucose Tolerance (IGT) / Fasting Glucose (IFG) (%) in Malaysia in the past 20 years
1996 2006
Age groups >=35 >= 30 > 18 >= 18-< 30 >= 30
Diabetes Prevalence (%)
6.3 8.3 11.6 2.4 14.9
Known diabetes (%)
4.5 6.5 7.0 0.4 9.5
Newly diagnosed (%)
1.8 1.8 4.5 2.0 5.4
IGT / IFG (%) *4.8 *4.3 #4.2 #3.1 #
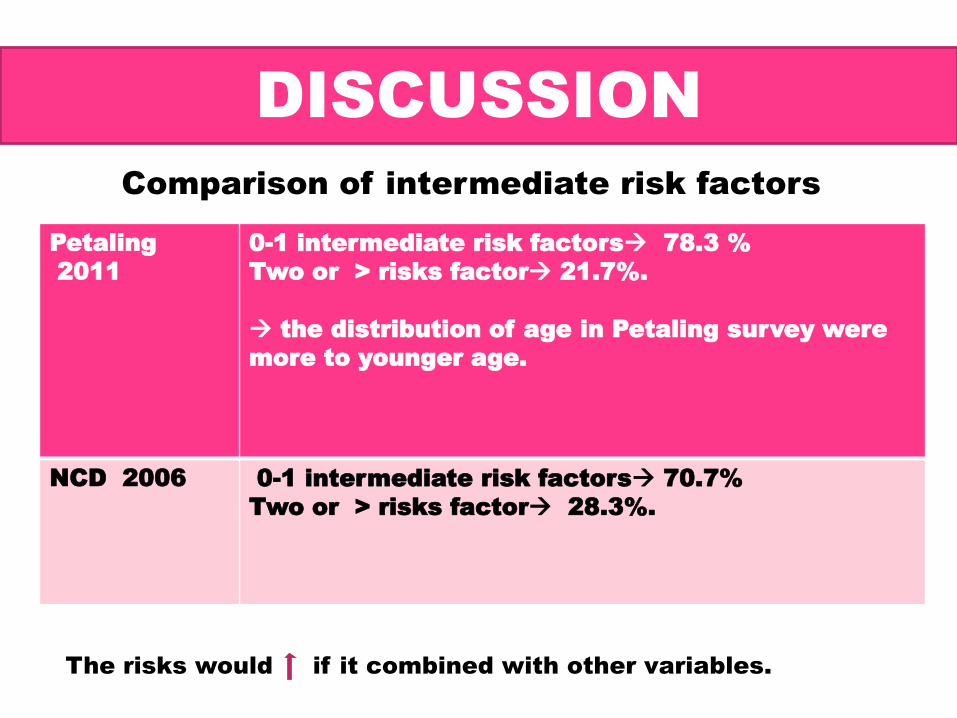
Overview
Petaling
2011
0-1 intermediate risk factors 78.3 %
Two or > risks factor 21.7%.
the distribution of age in Petaling survey were
more to younger age.
NCD 2006 0-1 intermediate risk factors 70.7%
Two or > risks factor 28.3%.
DISCUSSION
Comparison of intermediate risk factors
The risks would if it combined with other variables.
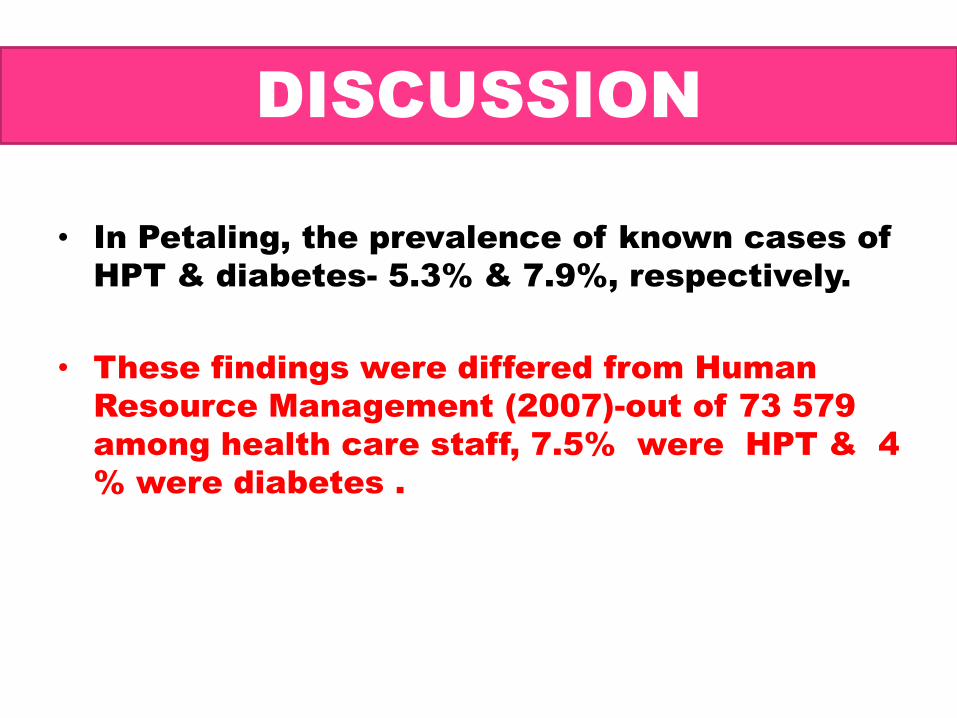
Overview
• In Petaling, the prevalence of known cases of
HPT & diabetes- 5.3% & 7.9%, respectively.
• These findings were differed from Human
Resource Management (2007)-out of 73 579
among health care staff, 7.5% were HPT & 4
% were diabetes .
DISCUSSION